characterising the distribution of dissolved and residual … · · 2015-12-03characterising the...
TRANSCRIPT

AGSO lournal of Australian Geology & Geophysics, 14 (2/3), 243- 248 © Commonwealth of Australia 1993
Characterising the distribution of dissolved and residual NAPL petroleum hydrocarbons in unconfined aquifers to effect remediation G.B. Davisl, C.D. Johnstonl, J, Thierrin2, T.R. Powerl & B.M. Pattersonl
In this paper, petroleum hydrocarbon contamination at two field sites is characterised extensively to provide data for risk assess•ment, and remediation design and monitoring.
A dissolved hydrocarbon plume in groundwater, emanating from a leaking underground storage tank, has been characterised in detail. The spatial and temporal variations of dissolved BTEX (benzene, toluene, ethylbenzene, xylene) compounds and naphtha•lene within the plume have been mapped. The plume extends greater than 420 m down hydraulic gradient from the site , is less than 3 m thick , and less than 40 m wide. Seasonal inundation of the residual non-aqueous phase liquid (NAPL) gasoline in the soil profile near the point of leakage, apparently provides an ongoing source for dissolved BTEX compounds in groundwater. Remedia-
Introduction Spillages and leakages of petroleum products cause near-surface soil and water contamination, and have the potential to contaminate potable water resources and the environment. Unconfined aquifer systems are particularly at risk.
Both dissolved (Kennedy, 1992) and residual non-aqueous phase liquid (NAPL) petroleum compounds (Hess & others, 1992) pose such a threat. Hydrocarbon species, such as benzene, are recognised carcinogens which are mobile when dissolved in groundwater, while residual NAPL potentially provides a long-term source for these dissolved compounds. It is important, therefore, to characterise reliably the distribution of petroleum hydrocarbons in the subsurface, especially in the vicinity of water-supply boreholes, to effect appropriate control and/or remediation of such contamination. Such data also allow calibration and verification of models for prediction of the long-term fate of hydrocarbons in the subsurface.
Often only coarse characterisation of the distribution of dissolved and NAPL hydrocarbons is undertaken prior to an assessment of risk or implementation of a remediation strategy. However, there is an increasing awareness of the need to monitor and characterise soil and groundwater contamination in greater detail (Langley & El Saadi, 1991; Bjerg & Christensen, 1992) to identify appropriate reme•diation and/or risk abatement strategies. Also, assessment of the effectiveness of a remediation strategy is dependent on prior collection of detailed characterisation data and its interpretation. To illustrate these issues, hydrocarbon contamination at two field sites is described, where natural and enhanced remediation is occurring.
The first site is a leaking underground storage tank, which has given rise to a dissolved plume of BTEX (benzene, toluene, ethylbenzene and xylene) compounds in ground•water. Both the spatial and temporal variations of the dissolved plume have been mapped, and their importance in assessing risk and effecting appropriate clean-up is discussed.
CSIRO Division of Water Resources, Private Bag, PO Wembley, W.A. 6014.
2 University of Neuchatel, Neuchatel, Switzerland.
tion would need to target the residual NAPL. Residual NAPL contents in the near-water table zone of a
diesel/kerosene fuel spill also have been quantified . The NAPL contents of recovered cores have been correlated with soil particle size distributions, water table fluctuations and saturation-pressure (S-P) relations of soil cores. Cored profiles typically show residual NAPL contents over 0.5 to 1 m depth intervals with peak NAPL contents up to 26 % by weight, at or immediately above the water table . The mobility of the NAPL in these soil materials has been investigated. Such data have been essential for the planning, implementation and effective monitoring of a remediation strategy that targets this thin NAPL zone.
The second site is contaminated by spillage and leakage of diesel and kerosene from above-ground storage tanks. At this site, near-water table contamination of the soil profile by NAPL is of principle concern. The distribution of NAPL contamination within the soil profile has been extensively characterised to design an appropriate remediation strategy for such contamination, and to enable installation of monitoring instrumentation to determine if effective reme•diation does occur.
Site descriptions and methodologies Site 1: Dissolved BTEX Plume Site 1 is located on the eastern fringe of the Bassendean Sands of the Swan Coastal Plain, Western Australia, north of Perth (see Fig. 1). At the site, 7 to 12 m of Quaternary medium to fine dune sand overlies a thick clay aquitard of the Guildford Formation. A variable layer of dark-brown iron hydroxide precipitate is found in the zone of water table fluctuation . Local groundwater flow is toward the southeast with a gradient of 0.003 to 0.005. The seasonal fluctuation of the water table is up to 1 m, and the saturated thickness of the aquifer is approximately 6 m.
A preliminary survey of 40 (gasoline) fuel stations in the Perth Metropolitan area using soil gas vapour sampling and testing, showed evidence of leakage in 8 of the 40 (Barber & others, 1991). Site 1, described in more detail here, showed the highest levels of contamination. Further soil•gas sampling, and drilling of scouting bores, assisted with siting of multiport boreholes for long-term monitoring.
Of concern when sampling volatile organics (VOCs) such as BTEX compounds, is minimising sorptive and/or volatile losses from samples (Davis & others, 1992; Patterson & others, 1993). To achieve minimal losses, groundwater sampling was carried out using glass syringes that recovered groundwater samples via suction directly from the access lines of stainless steel multi port boreholes, following purging of stagnant water within the access lines. For shallow-water table aquifers (i .e. less than -6 m depth to water table) it is possible to use suction to recover groundwater samples. This ensured little or no sample contact with air or sorptive polymer materials which are often used for groundwater sampling pump lines .

244 G.B. DAVIS & 01HERS
19.00
Benzene values for July 1991
_ > 10000119 L-'
1;]1\ -11000-10000IlgL-'
D 10- 1000 Il9L-'
• Slotted Borehole
/' Water table 21.8_91
C Tracer test site
_ Open drain
+ NORTH
I 50
17_50
17_00
16_50
Figure 1. Location of the site of the dissolved BTEX plume (Site 1) and the site of NAPL (diesel/kerosene) contamination (Site 2) . The surficial geology is also shown.
A total of 11 stainless steel multi port boreholes were installed, 10 in or on the perimeter of the BTEX plume and one upgradient to serve as a background borehole. The locations of the multiport boreholes are shown in Figure 2. Note that multiport borehole MPI0 is located immediately adjacent to the source of the leak at the fuel station (see Fig . 2). Each multi port borehole consisted of a bundle of 12 stainless steel tubes with an internal diameter of 2.5 mm and slotted over the bottom 0.2 m length. The slotted intervals were spaced 0.5 m apart in the vertical, except MPI0 and MPl1 which had vertical spacings of 0.25 m.
To investigate the spatial and temporal (seasonal and shorter-term) variations of dissolved organic and inorganic concentrations, groundwater was sampled from each of the multiport boreholes every 1 to 2 months in 1991 and less frequently in 1992, except in June and July 1992 when weekly sampling of selected multiport boreholes occurred. The organic compounds were concentrated from ground•water samples using purge and trap or micro-solvent extraction techniques, and analysed by GC/MSD (Patterson & others, 1993).
Site 2: Residual NAPL contamination Research at Site 2, contaminated by diesel and kerosene, aims to develop an appropriate design, and to effectively implement and evaluate an in situ bioremediation trial. Of particular interest is the effect of hetero geneous subsurface conditions on the movement and degradation of residual NAPL during in situ bioremediation.
Contamination at the site has resulted from spills of diesel and kerosene from large above-ground storage tanks onto the ground and subsequent infiltration over a period of
years. Weathering and "water washing" has depleted the diesel/kerosene NAPL of readily soluble and volatile compounds, and groundwater contamination by organic compounds is limited to low concentrations of naphthalene and methylnaphthalenes. Of principal importance, there•fore, is the distribution of residual NAPL contaminating the soil profile, and its remediation .
Site 2 is located on the western margins of the Swan Coastal Plain, south of Perth, in a sensitive near-shore environment (see Fig. 1). At the site, unconsolidated creamy-tan Safety Bay (dune) Sands overlie the calcareous grey Becher Sands, which also overlie Tamala Limestone. The contact between the Safety Bay Sands and the Becher Sands is typically in, or immediately above, the zone of annual water table fluctuation. Groundwater is approxi•mately 4 m below ground surface, and flows to the ocean towards the west northwest with a hydraulic gradient in the range 0.0047 to 0.008.
To characterise the distribution of NAPL extensive coring was carried out. Cores were recovered using a hollow stem auger drilling rig, by pushing a thin-walled 50 mm diameter aluminium tube (fitted with a piston to retain the saturated unconsolidated sands) ahead of the augers. The total NAPL content of subsamples (every 5 to 10 cm) of the cores was measured by dichloromethane-acetone extrac•tion, and analysis by GC-FID.
Particle size distributions were determined on selected cores to parallel NAPL content analyses. Soil moisture contents and water-air saturation-pressure (S-P) relation•ships were also determined on undisturbed core samples.
Pleistocene D ~~~ea~e~~~ ~:~t ~ J:I~:;:n~;:;:~~o~:~d D Bassendean Sand:
grey eolian sand
E3 Guildford Formation: t.:.:.:.:J clay and some sand
Cretaceous El Laterite
Archaean o Crystaliine basement
~ PERTH
Indian Ocean
o 10
Figure 2. Contoured plume of peak concentrations of dissolved benzene for July 1991. Water table contours are also shown for 21 August 1991.
CHARACTERISING THE DISTRIBUTION OF NAPL 245
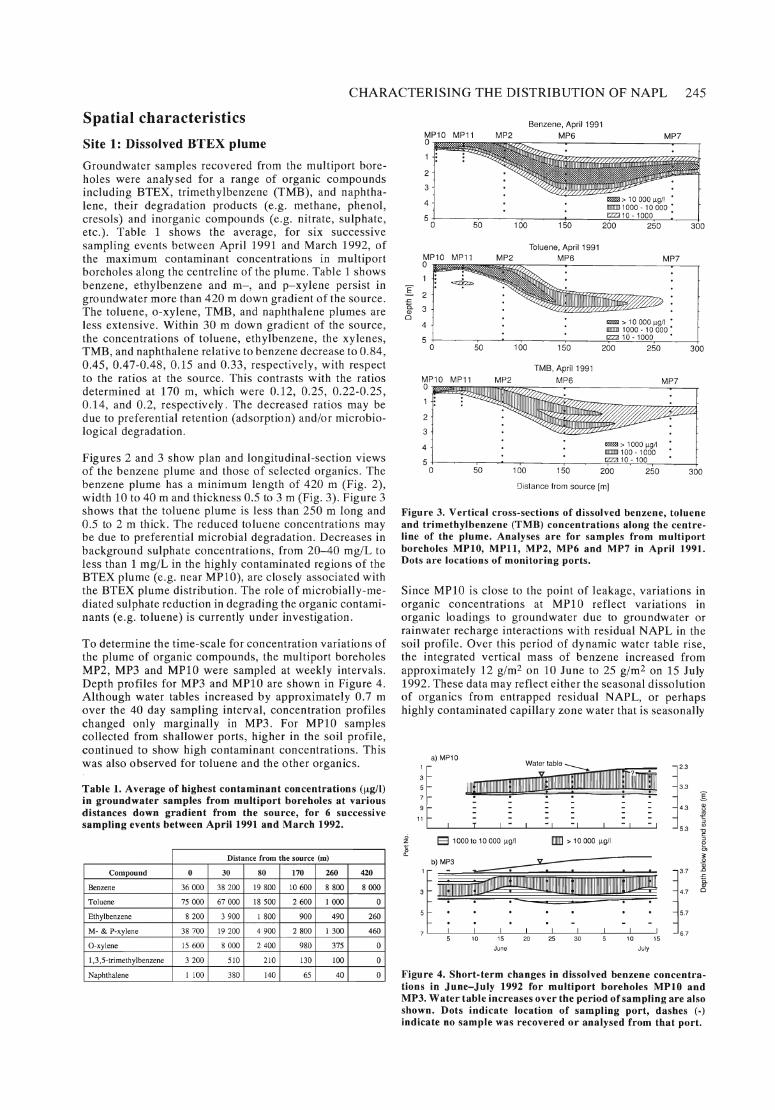
Spatial characteristics Site 1: Dissolved BTEX plume Groundwater samples recovered from the multi port bore•holes were analysed for a range of organic compounds including BTEX, trimethylbenzene (TMB), and naphtha•lene, their degradation products (e.g. methane, phenol, cresols) and inorganic compounds (e.g. nitrate, sulphate, etc.). Table 1 shows the average, for six successive sampling events between April 1991 and March 1992, of the maximum contaminant concentrations in multiport boreholes along the centreline of the plume. Table 1 shows benzene, ethylbenzene and m-, and p-xylene persist in groundwater more than 420 m down gradient of the source. The toluene, o-xylene, TMB, and naphthalene plumes are less extensive. Within 30 m down gradient of the source, the concentrations of toluene, ethylbenzene, the xylenes, TMB, and naphthalene relative to benzene decrease to 0.84, 0.45 , 0.47-0.48 , 0.15 and 0.33, respectively, with respect to the ratios at the source. This contrasts with the ratios determined at 170 m, which were 0.12, 0.25, 0.22-0.25 , 0.14, and 0.2, respectively . The decreased ratios may be due to preferential retention (adsorption) and/or microbio•logical degradation .
Figures 2 and 3 show plan and longitudinal-section views of the benzene plume and those of selected organics. The benzene plume has a minimum length of 420 m (Fig. 2), width 10 to 40 m and thickness 0.5 to 3 m (Fig. 3). Figure 3 shows that the toluene plume is less than 250 m long and 0.5 to 2 m thick . The reduced toluene concentrations may be due to preferential microbial degradation. Decreases in background sulphate concentrations, from 20-40 mg/L to less than 1 mglL in the highly contaminated regions of the BTEX plume (e.g. near MP10), are closely associated with the BTEX plume distribution. The role of microbially-me•diated sulphate reduction in degrading the organic contami•nants (e .g. toluene) is currently under investigation.
To determine the time-scale for concentration variations of the plume of organic compounds, the multiport boreholes MP2, MP3 and MP10 were sampled at weekly intervals . Depth profiles for MP3 and MP10 are shown in Figure 4. Although water tables increased by approximately 0.7 m over the 40 day sampling interval , concentration profiles changed only marginally in MP3. For MPlO samples collected from shallower ports, higher in the soil profile, continued to show high contaminant concentrations. This was also observed for toluene and the other organics.
Table 1. Average of highest contaminant concentrations (fig/I) in groundwater samples from multiport boreholes at various distances down gradient from the source, for 6 successive sampling events between April 1991 and March 1992.
Distance from the source (rn)
Compound 0 30 80 170 260 420
Benzene 36000 38200 19800 10600 8800 8000
Toluene 75000 67000 18500 2600 1000 0
Ethylbenzene 8200 3900 1800 900 490 260
M- & P-xylene 38700 19200 4900 2800 1300 460
O-xylene 15600 8000 2400 980 375 0
1,3,5-trimethylbenzene 3200 510 210 l30 100 0
Naphthalene I 100 380 140 65 40 0
MP10 0
2
3
4
5 0 50 100
Toluene, April 1991 MP10 MP11 MP2 MP6 MP7
~r:: I :~ 2 .c a 3 Q) 0 .,,,,,,, 1 0 000 119/1 • 4
IIllmlIll ~~OO.~!~ 000: 5
0 50 100 150
TMB, April 1991 MP10 MP11 MP2 0
MP6 MP7
2
3
:1 """ > 1000 119/1 1IIIIlIIIllI100 - 1000 'jZ2' 10 - 100 ,
0 50 100 150 200 250 300
Distance from source 1m]
Figure 3. Vertical cross-sections of dissolved benzene, toluene and trimethylbenzene (TMB) concentrations along the centre•line of the plume. Analyses are for samples from multi port boreholes MPI0, MPH, MP2, MP6 and MP7 in April 1991. Dots are locations of monitoring ports.
Since MP10 is close to the point of leakage, variations in organic concentrations at MP10 reflect variations in organic loadings to groundwater due to groundwater or rainwater recharge interactions with residual NAPL in the soil profile. Over this period of dynamic water table rise, the integrated vertical mass of benzene increased from approximately 12 g/m2 on 10 June to 25 g/m2 on 15 July 1992. These data may reflect either the seasonal dissolution of organics from entrapped residual NAPL, or perhaps highly contaminated capillary zone water that is seasonally
ci z " if.
"
a) MP10
E3 1000 to 10 000 11g/1 • >10000 11g!l
3.3 12.3
43 i 5.3 "0
§ e C)
~ b) MP3 Y ~
~ f ""'i""""""",~I-!-iII.IIIIIII IIII II~1 11 1 1111 1 11 1 11II II IIIIIIIII I IIII~II~ 1:: i 5 • • • •• •• 5.7 . . . . - --
r I I I I I I I I 10 15 20 25 30 10 15 ';:;.'7
June July
Figure 4. Short-term changes in dissolved benzene concentra•tions in June-July 1992 for multiport boreholes MPI0 and MP3. Water table increases over the period of sampling are also shown. Dots indicate location of sampling port, dashes (-) indicate no sample was recovered or analysed from that port.

246 G.B. DAVIS & 011IERS inundated by the water table.
Seasonal dissolution from the NAPL is further supported by the longer-term trends in the vertical benzene profiles at MP10, MP2 and MP6 (Fig. 5). The plume thickness at these locations varies markedly through the year. This is likely to be due to changes in upstream concentrations of BTEX compounds, and is also influenced by changes in water flow patterns and groundwater flows through the year (Thierrin & others, 1992). Careful interpretation of these field data is, therefore , required since it may be wrongly inferred that benzene is significantly attenuated (degraded, sorbed, volatilised, etc.) in the region of MP2 (for example by comparing MP2 data for April-May 1991 to March 1992 data). It is more likely, however, that changing hydro•geological conditions have redirected the benzene plume around this location in March 1992. Again, integration of the benzene concentrations over the vertical profile in MP10 gave mass loadings to groundwater, which varied through the period of monitoring from a low of 9 g/m2 in September 1991 to a high of 35 g/m2 in April 1992.
Although leakage of fuel had ceased in 1990, significant reductions in BTEX and other organic compound concen•trations near the point of leakage and the integrated mass loadings to groundwater have not occurred. It appears, therefore, that residual NAPL (gasoline) in the near-water table zone is acting as a long-term source of BTEX and other compounds dissolved in groundwater.
Site 2: Residual NAPL contamination Coring of the soil profile was carried out at 25 sites within a 0.7 ha area adjacent to the source of diesel/kerosene contamination (Fig. 6). NAPL has migrated approximately 40 m west of the source of contamination. The northerly component of groundwater flow is not evident in the NAPL distribution , and may be due to extensive cementation of the Becher Sands in the near-water table zone, thus redirecting NAPL movement. A 0.2 to 0.3 m thick cemented layer within the Becher Sands is found generally over the site, but is more vertically extensive in the soil profile in the northwest portion of the site. It is possible that the cemented sands act as a capillary barrier to NAPL movement, but the effect of the cementation on NAPL
!i ~ c) MP6
April
~ 1000 10 10 000 ).lgl1
J"~ '991
October
? ~ ...... ?
1lIP! > 10000 ).lgl1
table
January April 1992
23
3.3
4.3
2.65
3.65
I 4.65
~ 5.65 " ~
~ 3.1 ~
] 4.1 ~
li 5.1 ~
6.1
7.1 L.....J July
Figure 5. Long-term changes in dissolved benzene concentra•tions from April 1991 to June 1992 for multiport boreholes MPI0, MP2 and MP6. Water table depths below ground surface are also shown for a piezometer near MP2. Dots indicate location of sampling port, dashes (-) indicate no sample was recovered or analysed from that port.
1
I 11// "' / ": / o / cos
C11/ / 013 ' 00 /
,,-, 0
c21~11/ 0 066 07 :J
C26 C29 / ig
0~~7~;;/:~:l /.~ -36
/ C28 C30
!~=-
..
..... , ' ... :,' ... '. '. ... . ' .' . Spillage of ...
. diesel and . kerosene.' .'
. . ...
j .. ' .~~: .. ..
-CO-;f---00 I
Extent of NAPL contamination
o 10 20 30 40 !
metres 00
C29 Core sampling site with total 027 amount of NAPL (kg m -2) in profile
./' 0 .&0"- Water table contour (m AHD)
Extent of NAPL contamination
Figure 6. Location of core sampling sites showing total amount of NAPL in cored profiles.
movement requires further investigation.
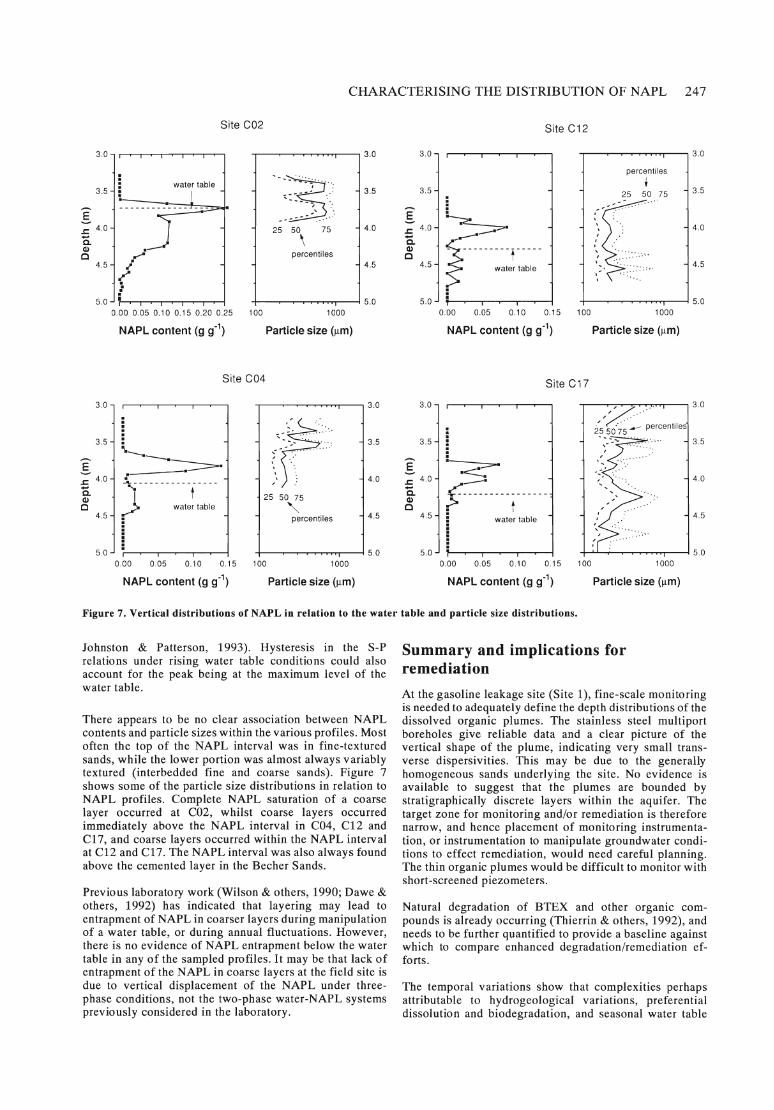
Outside the area of spillage (Fig. 6), NAPL was found over intervals 0.1 m to 1.3 m thick (median value of 0.6 m). Most NAPL profiles have a well defined peak within the top 0.1-0.2 m of the contaminated interval (Fig. 7). Maximum NAPL contents were mostly in the range 0.9-0.12 gig (i.e. g NAPL/g dry soil), with three sites (C02, C26 and C27) in the range 0.23-0.26 gig. Below the peak, NAPL contents were generally in the range 0.01-0.05 gig. The only site outside of the spillage area with measurable free NAPL in the borehole was C02.
The interval of NAPL contamination coincides with the interval of annual water table fluctuation (amplitude -0.5 m). The NAPL content peaks were at or immediately above the water table at the time of coring. The distance of the peak above the water table is consistent with the Sop relationships, i.e. the relationships between liquid satura•tion in porespace and capillary pressure (scaled for interfacial tensions between NAPL, water and air-see
CHARACTERISING THE DISTRIBUTION OF NAPL 247
Site C02
3.0
3.5 -I watej ta~
i 40] -------l---~;~" ~ "_ .. C 4.5 /
(
'I 13.0
"""3·····~······· , . ,.......... : " ........ i, ':.
................. , .. ,' 25 50 75
\ percentiles
3.5
4.0
4.5
5.0 J ;/-" .,.-,~,.......-,-.,.....,.....-i 0.00 0.05 0.10 0.15 0.20 0.25
+--~~~~'"'T"--II 5.0 100 1000
NAPL content (g g-1) Particle size (lLm)
Site C04
3.0
3.5
~ .s oJ: 4.0 Q. CI) c
4.5
5.0
Site C12
· · · :~ . .-" ,c;- ----T----
_~- - - - water table
( 0.00 0.05 0.10 0.15
NAPL content (g g-1)
'---~~~~'"'T"-"'" 3.0
percentiles
• 25 50 75 3.5
4.0
4.5
+--~~~~rr_--II 5.0 100 1000
Particle size (lLm)
Site C17
3.0., 3.0 3.0] j" ./ '.0 : .,;' ...... ..... ... 25 50· 75 --- percentiles
3.5 : -" "." . .... .... 3.5 3.5".~····'· -I 3.5 : r' .. : ,'/.... . . ~ •• ' ....... c ------. ' " E --========-' .. E ~ - . \ . _.
oJ: 4. 0 !..________________ ,'.: 4.0 oJ: 4 .0 -",5 -I -I ;',.. -14 .0 ~ ~ ~ ~ ~ I 25 50 75 ~ -y- - - - - - - - - - - - - - - - - -
c .--> water table " C f> 4.5 : percentiles 4.5 4.5: water table -I -I f -I 4.5 · . · . · . · . · . 5.0.J : 5.0 5 .0 ' I I I , , , , "I I 5.0
0.00 0.05 0.10 0.15 100 1000 0.00 0.05 0.10 0.15 100 1000
NAPL content (g g-1) Particle size (lLm) NAPL content (g g-1) Particle size (lLm)
Figure 7. Vertical distributions of NAPL in relation to the water table and particle size distributions.
Johnston & Patterson, 1993). Hysteresis in the S·P relations under rising water table conditions could also account for the peak being at the maximum level of the water table.
There appears to be no clear association between NAPL contents and particle sizes within the various profiles. Most often the top of the NAPL interval was in fine-textured sands, while the lower portion was almost always variably textured (interbedded fine and coarse sands). Figure 7 shows some of the particle size distributions in relation to NAPL profiles. Complete NAPL saturation of a coarse layer occurred at C02, whilst coarse layers occurred immediately above the NAPL interval in C04, C12 and C17, and coarse layers occurred within the NAPL interval at C12 and C17, The NAPL interval was also always found above the cemented layer in the Becher Sands.
Previous laboratory work (Wilson & others, 1990; Dawe & others, 1992) has indicated that layering may lead to entrapment of NAPL in coarser layers during manipulation of a water table, or during annual fluctuations. However, there is no evidence of NAPL entrapment below the water table in any of the sampled profiles. It may be that lack of entrapment of the NAPL in coarse layers at the field site is due to vertical displacement of the NAPL under three•phase conditions, not the two-phase water-NAPL systems previously considered in the laboratory.
Summary and implications for remediation At the gasoline leakage site (Site 1), fine-scale monitoring is needed to adequately define the depth distributions of the dissolved organic plumes. The stainless steel multi port boreholes give reliable data and a clear picture of the vertical shape of the plume, indicating very small trans•verse dispersivities. This may be due to the generally homogeneous sands underlying the site. No evidence is available to suggest that the plumes are bounded by stratigraphically discrete layers within the aquifer. The target zone for monitoring and/or remediation is therefore narrow, and hence placement of monitoring instrumenta•tion, or instrumentation to manipulate groundwater condi•tions to effect remediation, would need careful planning. The thin organic plumes would be difficult to monitor with short -screened piezometers.
Natural degradation of BTEX and other organic com•pounds is already occurring (Thierrin & others, 1992), and needs to be further quantified to provide a baseline against which to compare enhanced degradation/remediation ef•forts.
The temporal variations show that complexities perhaps attributable to hydrogeological variations, preferential dissolution and biodegradation, and seasonal water table
248 G.B. DAVIS & OTIIERS
rises, are apparent in the dissolved plume dynamics. These data show clearly the need to consider the longevity and composition of the source of dissolved contaminants (i.e. the residual NAPL).
Remediation of Site 1 is not planned at present. Further modelling of the field data and data collected from a small-scale tracer test using deuterated hydrocarbons is being carried out. Coring is also planned close to the leakage point and at various locations down gradient to determine gasoline NAPL contents and to quantify micro•biological populations. These data and analyses will provide firmer estimates of the natural degradation of the dissolved organics and their long-term fate, and also provide a foundation for further assessment of risk and for design of remediation strategies.
Priorities for remediation need to consider public health criteria and environmental risk. Remediation of the dis•solved BTEX plume may be achievable by simple pump•and-treat techniques, since sorption of the organic compounds onto the aquifer sands is apparently small (Thierrin & others, 1992). However, Mackay & Cherry (1989) warn of the inefficiencies of such techniques. Residual NAPL present at the point of leakage remains the principal target for remediation since it continues to act as a long-term source of BTEX and other organic contami•nants in groundwater.
At the diesel/kerosene spill site (Site 2), NAPL contamina•tion of the soil profile in the zone of water table fluctuation is thin (mostly less than 1 m thick) . As for the dissolved BTEX plume, monitoring installations and instrumentation will need to be placed carefully to effect remediation of this 1 m target zone.
NAPL contents range up to 26% by weight. At several of the sites the location and the magnitude of the peak suggests NAPL may be locally mobile. Vertical mobility and probable entrapment of NAPL in coarser-textured layers is of concern where in situ remediation involves manipulation of the water table. However, no positive evidence of NAPL entrapment in coarser zones has been observed at the field site. Further work on the entrapment of NAPL under water-NAPL and water-NAPL-air condi•tions for the soil profile is required to understand whether horizontal or vertical movement of NAPL is likely to occur during in situ remediation.
Monitoring and evaluation of in situ bioremediation of the diesel/kerosene contaminated site is currently proceeding. Extensive microbiological analyses, hydraulic modelling, and hydrogeological and geochemical research has pre•ceded the current implementation. A program of monitor•ing of a suite of organics and inorganics in groundwater and gases in the soil profile, and other parameters at least weekly is being carried out. These data, and those obtained during characterisation of the site are required to ade•quately evaluate the effectiveness of in situ bioremediation in remediating a portion of the site.
Acknowledegments This work was partly funded by a cooperative research agreement with Broken Hill Pty Co. Ltd, and also by the Water Authority of Western Australia and the Australian Institute of Petroleum. Comments on an earlier version of
the paper by Drs S. Appleyard (Geological Survey of WA) and A. Shugg (Victorian Department of Conservation and Natural Resources) are appreciated. Dr. C. Barber (CSIRO) contributed substantially to the work. Drs M. Bennett (BHP Research), M. Dunbavan (BHP Engineering) and A. Sheehy (Microbiological Research Unit, Canberra University) are also acknowledged. David Briegel, Mi•chael Lambert, Tracy MacLachlan and Alison Wells as•sisted with field and laboratory work.
References Barber, C., Bates, L.E., Taylor, K.J. & Patterson, B.M.,
1991 - Organic contamination of groundwater in an unconfined sand aquifer beneath an urban area: control or clean-up? International Hydrology & Water Re•sources Symposium, Perth 2-4 Oct 1991, 311-316.
Bjerg, P.L. & Christensen, T.H., 1992 - Spatial and temporal small-scale variation in groundwater quality of a shallow sandy aquifer. Journal of Hydrology, 131, 133-149.
Davis, G.B., Barber, C., Briegel, D., Power, T.R. & Patterson, B.M., 1992 - Sampling groundwater quality for inorganics and organics: some old and new ideas. Proc. International Drilling 1992 Conference, Perth Oct 1992,7.
Dawe, R.A., Wheat, M.R. & Bidner, M.S., 1992 -Experimental investigation of capillary pressure effects on immiscible displacement in lensed and layered porous media. Transport in Porous Media, 7, 83-101.
Hess, K.M., Herkelrath, W.N. & Essaid, H.I., 1992 -Determination of subsurface fluid contents at a crude•oil spill site. Journal of Contaminant Hydrology, 10, 75-96.
Johnston, C.D. & Patterson, B.M., 1993 - Distribution of non-aqueous phase liquid in a layered sandy aquifer. Proceedings In Situ and On-Site Bioreclamation. The Second International Symposium, San Diego Califor•nia, April 1993 (in press) .
Kennedy, L., 1992 - Site characterisation at pipeline spill at Park City, Kansas: estimating hydraulic and geo•chemical constraints on bioremediation.In Bioremedia•tion of Hazardous Wastes, US-EPA Document EPA/600/R-92/126, 7-9.
Langley, A. & EI Saadi, O. (editors), 1991 - Protocol for the health risk assessment and management of contami•nated sites. South Australian Health Commission.
Mackay, D.M. & Cherry, J.A., 1989 - Groundwater contamination limitations of pump-and-treat remedia•tion. Environmental Science and Technology, 23(6), 630-637.
Patterson, B.M., Power, T.R. & Barber, c., 1993 -Comparison of two integrated methods for the collec•tion and analysis of volatile organic compounds in groundwater. Ground Water Monitoring and Remedia•tion, Summer 1993, 118-123.
Thierrin, J., Davis, G.B., Barber, c., Patterson, B.M., Pribac, F., Power, P.R. & Lambert, M., 1992 - Natural degradation rates of BTEX compounds and naphthalene in a sulphate reducing groundwater environment. In•Situ Bioremediation Symposium, 1992, Niagara-On•The-Lake Ontario, 20-24 September 12.
Wilson, J.L., Conrad, S.H., Masom, W.R., Peplinski, W. & Hagan, E., 1990 - Laboratory investigation of residual liquid organics from spills, leaks and disposal of hazardous wastes in groundwater. US-EPA Report Number EPA/600/6-90/004.