characteristics and classification of the soils of …
TRANSCRIPT
SINET: Ethiop. J. Sci., 31(2):89–102, 2008 © Faculty of Science, Addis Ababa University, 2008 ISSN: 0379–2897
CHARACTERISTICS AND CLASSIFICATION OF THE SOILS OF THE PLATEAU OF SIMEN MOUNTAINS NATIONAL PARK (SMNP), ETHIOPIA
Mohammed Assen 1 and Belay Tegene 2
1 Department of Plant Sciences, Wollo University, PO Box 1271, Desse, Ethiopia
E-mail: [email protected] 2 Department of Geography and Environmental Studies, Addis Ababa University, PO Box 150085,
Addis Ababa, Ethiopia
ABSTRACT: The Simen Mountains National Park (SMNP) is found in the Simen Mountains (North Gonder). Detailed soil survey (scale 1:25 000) was conducted to classify, characterise and determine status of the soils of the plateau of SMNP. Umbric Andosols, Luvic Andosols and Mollic-Lithic Leptosols were found to be the major soil types. Land use and topographic attributes affected many of the characteristics of the soils. Thickness of total and topsoil depth decreased with increase in slope gradient and altitude. Whereas the whole of the study area was once covered by dark topsoil, this characteristic was lost in many of the cultivated soils. Under natural conditions, the soils had high levels of andic properties (which fixed P availability) and high contents of surface organic carbon (commonly over 6%), and total nitrogen (>0.4%), available water holding capacity (over 30%) and CEC (>30 Cmolc kg-1 soil). Contents of organic carbon, total nitrogen, available phosphorus, water holding capacity, levels of pH and topsoil depth were most sensitive to degradation and lowered in quality under cultivation, suggesting the need having awareness in their management under cultivated soils. Crop and animal production expanded to higher altitudes and steeper slopes (>80%) where the rare wild animals existed, which would cause their displacement and extinction. Therefore, coexistence of farming population and wild animals could not become sustainable in the SMNP. This calls for a development of sound land use plan in order to preserve (and conserve) natural resources in general and the soil resources in particular.
Key words/phrases: Andosols, Leptosols, Luvic, Mollic, wild animals
INTRODUCTION The Simen Mountains National Park (SMNP) is home for most of the North Central Ethiopian Highlands endemic wild animals. It was officially established in 1969 and UNESCO registered it as one of the heritage centres of the world in 1978 (Nievergelt et al., 1998). The presence of rapidly growing subsistence agricultural population in the park puts pressure on available agricultural soil resources. As a result, the fragile high altitude soil resources were rapidly degrading (Hurni and Messerli; 1981; Hurni, 1982, Nievergelt et al., 1998). It is true that the inherent characteristics of the soil greatly affect agricultural productivity. In increasing agricultural yield, it becomes essential to understand the properties of soils. It is only when we have adequate knowledge on soils that we can manage according to their potentials and limits and thereby maximize agricultural (crop) production to the allowable potential limits and conserve soils for future generation. Yet, knowledge of the soil resources of the SMNP is rather scanty. Information on soil erosion forms
(Hurni, 1978), insufficient data on uncultivated soils (Frei, 1978; Weigel, 1988) and the existing land use patterns (Amare Bantider, 1996) of the plateau of SMNP area have been available. Nevertheless, detailed information on the characteristics of the soils in general and cultivated soils in particular is lacking. Investigations of morphological and physicochemical properties of the soils of both cultivated and uncultivated lands are paramount in order to have reliable development plans of the park (Nievergelt et al., 1998). It will also be equally important to classify the soils in facilitating technology transfer and information exchange among soil scientists, planners and agricultural extension advisors. The objectives of the present study were, therefore, to classify and provide detailed information on the morphological, physical and chemical characteristics of both cultivated and uncultivated soils of the plateau of SMNP. It is hoped that the study will provide invaluable and baseline information on the soils and other land resources of the study area in developing a sound management plan for the park.

Mohammed Assen and Belay Tegene 90
MATERIALS AND METHODS The study area The SMNP is found in the Simen Mountains, North Central Ethiopian Highlands (EMA, 1979). The plateau is located between 13°12’N -13°14’N and 38°09’E–38°12’E, north east of Debark town (North Gonder region) (Fig. 1). The plateau of the park has a wide range of topographic, climatic, soil, flora and fauna and geological resources (Nievergelt et al., 1998). The topography consists of undulating plateau and incised valleys mainly due to the recent past denudation and fluvial geomorphic processes (Mohr, 1971). Altitude ranges from 3000 meters above sea level (m.a.s.l) to over 4400 m.a.s.l. The geological formation consists of about 3000m thick flood basalt overlying Mesozoic sediments. The surface basalt is mantled by wind blown sediments and volcanic ash materials (Frei, 1978). Mainly determined by altitude, the area has a mean total annual rainfall of 1515 mm and mean annual temperature of 7.7°C at 3600 m.a.s.l (Hurni, 1986). The rainfall regime is dominated by a single long rainy season that extends from March to October. Soil moisture is available at least for 90 days, which allow us to approximate it as udic moisture regime (Soil Survey Staff, 1999). Temperature progressively decreases with increase in altitude and for most of the year freezing temperature is common at above 3500 m.a.s.l. The soil temperature regime of the park is approxi-mated as cryic (Soil Survey Staff, 1999). The climatic regime can be categorised under alpine (“wurch”) group (Daniel Gamachu, 1977). As for the other high mountains of Ethiopia, such as the Bale Mountains National Park (EWCO, 1986), the vertical succession of climate resulted in the vertical grading of natural vegetation. At altitudes of below 3500 m.a.s.l, high altitude forests such as Erica arborea interspersed with Hypericum revoltum form the main trees. Above this forest belt, the very low temperatures restrict the growth of trees, as a result of which long grasses (e.g., Festuca, Koeleri) and short grasses (e.g., Danthonia) with scattered Lobelia rhynchopetlum form the main vegetation types. The plateau of SMNP was the home of several unique wild animals. The major wild animals of the park were Walia Ibexes that occupied parts of steeper slopes and cliffs; Gelada (Theropithecus gelada), Klipspringers and the rare Ethiopian wolfs (Simen Fox (Cani simensis)), which inhabited the summit. The Simen Mountains formed one of the oldest settlement centres among the North Central
Highlands of the country (Daniel Gamachu, 1988). Traditional subsistence grain farming was the sole form of activity. The main crop grown was barley (Horderum vulgare). The very low temperature conditions associated with severe soil erosion resulted in lowering of agricultural yields (Amare Bantider, 1996). As a consequence, in compensa-tion for low production, crop cultivation inside the park extended as high as 3620 m.a.s.l and to over 85% slope gradients. This extension pushed the rare wild animals out of and displaced them from their original habitats. Field survey, site selection and soil sampling Much of the required information was gathered in 1998 but this was complemented with additional information gathering and updating in 2005. A combination of systematic and free soil survey (Dent and Young, 1981) was conducted on a 1: 25 000 field topomap. Representative observation sites were chosen on the basis of landforms and land use/ vegetation patterns. Soils were studied at auger hole points, pit sites and valley/ gully cuts. About 250 auger holes on cultivated lands and over 200 on uncultivated lands were studied. Also, 21 soil pits on cultivated and 11 on uncultivated lands were opened along transects and at randomly selected points. But for convenience, samples collected only from 17 soil pits (12 on cultivated and 5 on uncultivated) were reported in this study. Soil samples taken from genetic horizons of each soil pit were described according to FAO (1990) guidelines and collected for further laboratory analysis. The horizon symbols and employed soil classification were mainly those of the FAO-WRB (1998) soil classification schemes. The diagnostic horizons, materials and properties as defined and used in the FAO-WRB (1998) were employed in the recognition and mapping of soil units. The soils were classified and mapped at reference, units and phase categories. In the soil mapping, boundaries were determined in the field by auguring and careful eye observations and on the basis of land use/vegetation and landform patterns. The field base (soil) map was digitised with the help of ArcView GIS 3.2 software in the preparation of the final map and produced at 1:50 000. Soil laboratory analysis procedures Samples were air-dried, ground and passed through a 2-mm sieve and analysed for selected attributes in the Ethiopia National Soil Service Laboratory, Addis Ababa (Ethiopia). The particle size analysis was carried out by hydrometer
SINET: Ethiop. J. Sci., 31(2), 2008 91
method (Van Reeuwijk, 1992). The international system of particle size classification was followed to determine the percentage distribution of sand (2.0–0.02 mm), silt (0.02–0.002 mm) and clay (< 0.002 mm). Soil moisture contents (w/w, %) were determined by means of pressure membrane apparatus by applying different pressure forces to crushed samples (Baruah and Barthakur, 1997). The field capacity (FC) was determined at -1/3 bar, permanent wilting point (PWP) at -15 bars and available water holding capacity (AWC) was obtained from the FC and PWP differences. The bulk density (Mg m-3) was determined by undisturbed (core) soil samples collected with the help of ring samples. The percent total pore volume was determined from the bulk density and particle density using the formula (1-bd/pd) 100, where, bd = bulk density pd (particle density) = 2.65 (g cm-3) The pH of the soil was determined in 1:2.5 soil-water suspensions (w/v) with a standard glass electrode. The Walkley-Black method was emplo-yed to determine percent organic carbon (Jackson, 1970) and converted to percent organic matter by multiplying organic carbon percentage by 1.724. The micro-Kjeldhal method was used to determine percent total nitrogen (Jackson, 1970). In the determination of available phosphorus (Mg kg-1 soil) sodium bicarbonate method was followed (Olsen and Dean, 1965). The cation exchange capacity (CEC) and exchangeable cations (Ca, Mg, K and Na) were determined by ammonium acetate method at pH 7.00 (Jackson, 1970). The CEC/clay ratio was obtained by dividing CEC of the soil by percent clay. The base saturation was obtained by dividing sum of exchangeable bases by CEC soil expressed as percentages. The Blakemore proce-dure was used in determining phosphate retention capacity, whereas extractable aluminium and iron were determined by acid oxalate procedure at pH 3.00 following a four-hour shaking of acid solution in dark room as described in Jackson (1970).
RESULTS AND DISCUSSION Soil mapping units The environmental, morphological and physico-chemical characteristics were used in the charac-terisation, classification and mapping of the soils. In the study area, Umbric Andosols, Luvic An-dosols and Mollic-Lithic Leptosols association and their phases were identified and mapped (Fig. 1).
Umbric Andosols Site, morphological and physical characteristics The Umbric Andosols were situated at an altitude of over 3450 m.a.s.l and largely found under alpine grasslands. These soils covered slope gradients that reached as high as 49% (Table 1) and were located on all types of slope forms. These soils had dark topsoil horizons whose morphology was marked by isotropic black colour (10YR 2/1, moist); silt loam to loam texture, moderate medium crumb structure, slightly to non-plastic and slightly sticky wet, firm moist, and soft dry consistency. It was also described as well drained. The thickness of Umbric Andosols varied in response to steepness, form and position of slope. The dark (topsoil) horizon varied from 50 cm to 82 cm, whereas total soil depth reached to 120 cm. The thickness of the B horizon showed a relative decrease with increase in altitude, indicating an existence of pedogenetic differences in the study area. The dark A horizons had many very fine to fine pores and high total pore volume, ranging from 68% to 72%. Roots were largely concentrated in this horizon, which generally decreased in size and quantity with depth of profiles. The presence of such characteristics is an indication of existence of well structure conditioned by high contents of organic matter. The boundary separating the A horizon from underlying B/C horizon was in most cases clear and smooth, whereas in a few cases it was clear and wavy. The particle size distribution of the dark A horizon was dominated by silt size particles. The clay content ranged from 13% to 27% (Table 2). High silt/ clay ratios were typical of A horizon, which ranged from 2 to 4. This suggests that further weathering of minerals is limited in the present environment of the study area (Dutta et al., 2001) and can be described as very young soils. The dark A horizon in some cases graded to a dark brown (7.5YR 3/2, moist) subsoil (B horizon) and in the others to a hard rock, a lithic or paralithic contact depending on degree of weathering of underlying material. This dark brown B horizon, where it existed, had a sandy loam texture, fine to coarse rounded weakly to strongly weathered gravel, strong coarse to medium subangular blocky structure, and was slightly sticky and plastic when wet, very firm when moist, hard when dry and described as well drained. The dark topsoil horizons had available water holding capacity of 16% to 38% (Table 2). The high

Mohammed Assen and Belay Tegene 92
#*#*
#*#*
#*
#*
#*
#*#*
#*#*
#*
#*
#*
#*#*
#*
#*
#*
#* #*
#*
#*
#*#*
#* #*#*
#*
P25P26P27
P23
P24
P22
P20
P28P21
P29
T3P3
T6P1
T6P2
T5P1
T5P2
T5P4
T1P5
T4P2
T4P3
T1P5
T2P4T1P3
T1P3
T3P2
T3P1
T1P2T1P1
T2P2
T2P1
397000.000000
397000.000000
398000.000000
398000.000000
399000.000000
399000.000000
400000.000000
400000.000000
401000.000000
401000.000000
402000.000000
402000.000000
403000.000000
403000.000000
404000.000000
404000.000000
405000.000000
405000.000000
406000.000000
406000.000000
1465
000.0
0000
0
1465
000.0
0000
0
1466
000.0
0000
0
1466
000.0
0000
0
1467
000.0
0000
0
1467
000.0
0000
0
1468
000.0
0000
0
1468
000.0
0000
0
1469
000.0
0000
0
1469
000.0
0000
0
1470
000.0
0000
0
1470
000.0
0000
0
1471
000.0
0000
0
1471
000.0
0000
0
1472
000.0
0000
0
1472
000.0
0000
0
1473
000.0
0000
0
1473
000.0
0000
0
1474
000.0
0000
0
1474
000.0
0000
0
1475
000.0
0000
0
1475
000.0
0000
0
1476
000.0
0000
0
1476
000.0
0000
0
1477
000.0
0000
0
1477
000.0
0000
0
1478
000.0
0000
0
1478
000.0
0000
0
Legend#* Soil profiles
Soil_unitsLuvic Andosols, moderately eroded phase(ANlv, m)
Luvic Andosols, severly eroded phase(ANlv,s)
Luvic Andosols, slightly eroded phase(ANlv,s)
Mollic-Lithic Leptosols(LPmo-li)
Umberic Andosols, deep phase(ANum,d)
Umberic Andosols, moderately deep phase(ANum,m)
1 0 10.5 KilometerFig 1. Soil map of the study area
The study area
Addis Ababa ¹
values were mainly attributed to the well expressed structure, abundant pores and high organic matter contents of the surface horizons (discussed below). Wada (1985) has indicated that 20% to 70% of -1/3 b (of FC) water in Andosols is available. This revealed that nearly 60% of the field capacity (FC) of Umbric Andosols was available to
be taken up by plants. Hence, crops grown in these soils are unlikely to be affected by moisture deficiency. The water retention capacity of Umbric Andosols decreased with depth and this was strongly related to a change in structure, an increase in bulk densities and a decrease in total pore volume and organic matter content.
Fig. 1. Soil map of the study area.

SINET: Ethiop. J. Sci., 31(2), 2008 93
Table 1. Selected site and morphological characteristics of Umbric Andosols. Depth (cm)
horizon Colour (moist)
Structure a
(Grade/size/type) Consistence b dry/moist/wet
Boundary c
distinctness/topography Profile d: T2P2; altitude: 3450 m.a.s.l.; slope: 19%; land use: Cultivated
0–23 Ap 10YR 2/1 mo/me/cr so/fr/sst/spl g/s 23–71 A2 10YR 2/1 mo/me/cr so/fr/sst/spl g/w >71 C - - - -
Profile: T3P2; altitude: 3725 m.a.s.l.; slope: 29%; land use: alpine grass land with scattered Lobelia 0–37 Ah 10YR 2/1 mo/me/cr so/fr/sst/spl g/s 37–82 A2 10YR 2/1 mo/me/cr so/fr/sst/spl g/w >82 C - - - -
Profile: T6P1; altitude: 3720 m.a.s.l.; slope: 4%; land use: alpine grass land with Lobelia 0–51 Ah 10YR 2/1 mo/me/cr so/fr/sst/spl g/s 51–94 Bw 7.5YR 4/4 St-mo/co.sb ha/vfi/sst/npl d/w >94 C - - - -
Profile: T1P1; altitude: 3600 m.a.s.l.; Slope: 12%; land use: cultivated 0–17 Ap 10YR 2/1 mo/me/cr so/fr/sst/spl a/s 17–50 17–50 10YR 2/1 mo/me/cr so/fr/sst/spl a/w >50 R - - - -
Profile: T3P3; Altitude: 3500 m.a.s.l.; Slope: 42%; Land Use: Forest 0–39 Ah 10YR 2/1 mo/me/cr so/fr/sst/spl g/s 39–70 Bw 7.5YR 3/2 mo/co-me/sb sha/fi/sst/spl g/s
>70 R - - - - a: mo, moderate; me, medium; cr, crumb; st, strong, co, coarse, sb, subangular blocky, ab, angular blocky b: fr, friable, so, soft, st, sticky, sst, slightly sticky, pl, plastic, spl, slightly plastic, fi, firm; vfi, very firm; ha, hard, sha, slightly
hard; vha, very hard C: d, diffuse, g, gradual; s, smooth, a, abrupt, w, wavy; I, irregular d= Profile codes, T = Transect, P = profile (the same is used in the soil map) Table 2. Selected physical characteristics of Umbric Andosols.
Particle size analysis (%) Moisture content (%) Depth (cm) Sand Silt Clay Si/C Class a FC PWP AWC
Profile: T2P2 0–23 19 56 25 2.2 Sil 63 24 38 23–71 19 54 27 2.0 Sil 60 24 36
Profile: T3P2 0–37 29 58 13 4.5 Sil 67 38 29 37–82 51 50 19 2.3 Sil 56 39 17
Profile: T6P1 0–51 35 48 17 1.0 C 58 26 32 51–94 53 30 17 1.4 Cl 39 23 16
Profile: T1P1 0–17 17 66 17 4.0 Sil 63 34 38 17–50 21 62 17 3.6 Sil 60 24 36
Profile: T3P3 0–39 31 56 13 4.3 Sil 70 32 38 39–70 35 48 17 2.9 L 47 27 20
a: c, clayey; Cl, clay loam; L, loamy; Si, silty; Sil, silt loam Chemical characteristics The pH values of Umbric Andosols varied from slightly acid to moderately acid, (5.11–6.09) (Table 3). A slight increase in pH values with depth was noticed, which was consistent with Andosols described elsewhere (Speck, 1982; Wielmaker and Wakatsuki, 1982; Belay Tegene, 1995). There was a
slight variation in pH values between cultivated and uncultivated lands. The pH value of the uncultivated soils was slightly higher than the pH value of the cultivated soils. This could be attributed to the cultivation effects that lowered pH value and possibly increased exchangeable acidity.
Mohammed Assen and Belay Tegene 94
Table 3. Selected chemical composition data of Umbric Andosols.
Exchangeable bases and CEC (Cmolc kg-1) Depth (cm)
pH (H2O)
P Mg kg-1 Ca Mg K Na CEC
CEC/Clay
BS (%)
OC (%)
TN (%)
C/N
Profile: T2P2 0–23 5.11 12.87 19.7 2.2 1.2 0.6 51.6 1.9 46 10.16 0.80 13 23–71 5.74 5.98 20.6 3.2 0.8 0.5 59.4 2.2 42 8.21 0.59 14
Profile: T3P2 0–37 5.24 4.77 22.4 2.6 1.1 0.6 63.7 4.9 42 15.95 1.27 13 37–82 5.60 1.81 17.6 2.6 0.5 0.5 71.3 3.8 30 13.88 0.94 15
Profile: T6P1 0–51 5.58 6.84 9.1 1.3 1.0 0.4 35.4 2.1 33 7.06 0.61 12 51–94 6.09 24.94 30.2 6.9 0.7 0.3 49.9 2.9 76 0.48 0.05 10
Profile: T1P1 0–17 5.24 3.17 14.1 2.3 0.8 0.6 44.5 1.0 40 8.92 0.78 11 17–50 5.76 2.52 14.2 2.3 0.8 0.6 39.9 2.3 45 7.17 0.66 11
Profile: T3P3 0–39 5.19 3.35 15.0 3.0 0.5 0.4 49.0 3.8 37 13.9 1.08 13 39–70 5.52 2.42 18.4 3.6 0.6 0.3 54.5 3.2 42 5.39 0.45 12 According to the ratings given in Landon (1991), the topsoil horizon of Umbric Andosols had high organic carbon (OC) and high to very high total nitrogen (N) contents (Table 3). Indeed, such high carbon contents are not uncommon in the Andosols derived from volcanic ash, which is attributed to Al- humus complexes that resist against microbial attack (Wada, 1985; Mizota and Chapelle, 1988). An increase in organic carbon and total nitrogen contents was detected with a rise in altitude, suggesting the low humification processes with progressive cooler temperature conditions. Both organic carbon and nitrogen contents also decreased with depth of profiles. These two soil characteristics were low for cultivated fields from uncultivated soils indicating the degradation effects of cultivation. As a result, mechanical destruction of the dark topsoil horizon of these soils could result in lowering the quality of certain soil characteristics. The surface horizons of these soils had carbon /nitrogen ratios that ranged from 10.2 to 15.2, suggesting an optimum degree of mineralization. The available phosphorus of the surface horizons of the Umbric Andosols was generally low and ranged from 3.16 Mg kg-1 soil to 13.80 Mg kg-1 soil (Table 3) reflecting its low availability. This could be related to the high P fixation power of Andosols in general (Table 4), which is ascribed to the abundance of active Al in the form of Al-humus complexes, allophane and imogolite (Wada, 1985; Mizota and Chapelle, 1988). The content of available P did not show any significant observable variation among land use patterns, indicating its availability being determined by the general phosphate retention capacity of these soils (Table 4). The exchange base complex of Umbric Andosols was dominated by calcium (Ca) followed by
magnesium (Mg), potassium (K) and sodium (Na) in that order (Table 3). Calcium accounted for 75% to 85% and magnesium 10% to 16 % of the exchange site. The predominance of divalent cations in the exchange site reconfirms that these soils are young and are found in their early stages of development. The proportion of monovalent cations in the exchange site of the soils was insignificant to be mentioned. An imbalance of cations, however, was a typical property of Umbric Andosols. The Ca/Mg ratios, which in most cases were above 6 throughout the profiles, may reduce the uptake of Mg and phosphates by crop roots (Landon, 1991). The cation exchange capacity (CEC) of the surface horizons was generally very high to high. This is a common feature of Andosols (Wielmaker and Wakastuki, 1982; Wada, 1985). The high CEC values of the horizon could be attributed to the high organic matter (OM) content and to the allophane - clay minerals of the soils. Although it can be rated as high, CEC values of subsoil dark brown horizons were relatively low from their counter dark topsoil horizons. This was in accord with an absence of allophane-clay mineral complexes in subsoil horizons as well as its low contents of organic matter. The CEC values of dark topsoil horizon Umbric Andosols also showed a slight increase with altitude, indicating the increase in contents of organic matter and probably also allophane - clay complexes. The CEC/clay ratios were found to be high for subsoil horizons, suggesting the high contribution of clay for CEC in subsoil horizons. The percentage base saturation (PBS) of the dark surface horizons was low, which was less than 50%. The low PBS was partly attributed to the cation exchange sites, which show a very high selectivity for H+ (Wada, 1985).
SINET: Ethiop. J. Sci., 31(2), 2008 95
Classification FAO-WRB (1998) defines Andosols as soils showing vitric or andic properties starting within 25 cm from the soil surface. The soils discussed hitherto have andic properties for which the major requirements include: a bulk density of less than or equal to 0.9 Mg m-3, over 70% of the phosphate retention capacity, a minimum value of 2.0% of acid-oxalate extractable Al plus half acid oxalate extractable Fe and a thickness of at least 30 cm. Measurements and laboratory analyses of the dark topsoil horizon for representative profiles indicate that these soils met the requirements for andic properties (Table 4), and classified as Andosols at reference group level. These soils have umbric A horizon with or without cambic B horizon and are classified as Umbric Andosols at the second level (FAO-WRB, 1998). Table 4 also made clear that exposed B horizons did not meet the criteria for andic properties. Table 4. Bulk densities, Acid oxalate extractable Al +
1/2 Fe and phosphate retention capacity of representative Umbric and Luvic Andosols Profiles of SMNP to a Depth of 30 cm.
Profile No
Bulk Density Mg m-3
Acid oxalate extractable Al+1/2 Fe (%)
Phosphate Retention capacity (%)
T2 P2 0.72 3.88 94 T4 P2 0.73 4.20 94 T6P1 0.76 3.56 92 P21 0.76 3.65 93 P22 0.76 4.06 93 P29 0.82 2.46 62 T5P2 1.09 - -
In order to increase the value of available information, thickness of topsoil depth criterion was introduced to further subdivide Umbric Andosols and map them separately. For convenience of the study, an average (65 cm) topsoil depth of uncultivated land was considered as the depth of the original A horizon. Accordingly, Umbric Andosols retaining more than 75% of the original A horizon were identified as deep phase and mapped as ANum, d, whereas those which retained 25% to 75% of the topsoil were identified as moderately deep phase and mapped as ANum, m (Fig. 1). In the study area, there were no identified Umbric Andosols with less than 25% of the original thickness of topsoil horizon. Luvic Andosols Site, morphological and physical characteristics Most profiles of Luvic Andosols were located between 3340 m.a.s.l and 3630 m.a.s.l. They occupied variable slope gradients (1% to 29%) and forms. Most of the Luvic Andosols formed cultivated lands (Table 5). The moist colour of the topsoil horizon of Luvic Andosols varied from black (10YR 2/1) to brown (7.5YR 3/4). The existence of surface dark brown colour in some of Luvic Andosols profiles indicates exposure of subsoil horizon to the surface due to long time cultivation and erosion. The dark topsoil horizon of Luvic Andosols had very similar characteristics to the topsoil horizon of Umbric Andosols. It had moderate medium to fine crumb structure, slightly sticky and slightly plastic when wet, friable when moist and soft when dry. Its drainage was described as well drained.
Table 5. Selected site and morphological characteristics of Luvic Andosols a. Depth (cm)
horizon Colour (moist) Structure Grade/size/type
Consistence dry/moist/wet
Boundary distinctness/topography
Profile: T6P2; altitude: 3630 m.a.s.l.; Slope: 3%; land use: Alpine grassland with scattered Lobelia 0–40 Ah 10YR 2/1 mo/me-fi/cr so/fr/sst,spl g/s 40–91 A2 10YR 2/1 mo/me-fi/cr so/fr/sst,spl g/s 91–112 AB 10YR 2/1 mo/me-fi/cr so/fr/sst,spl g/s 112–119 Bt 10YR 2/1 mo/co/gr sha/fr/sst,spl g/s >119 C - - - -
Profile: T1P2; Altitude: 3570 m.a.s.l.; slope: 13%; Land use: cultivated 0–17 Ap 10YR 2/1 mo/me-fi/cr so/fr/sst.spl a/s 17–55 A2 10YR 2/1 mo/me-fi/cr so/fr/sst.spl a/s 55–102 Bt 7.5YR 3/4 st/co-me/sb vha/fi/st, spl a/s >102 C - - - -
Profile: T1P4; Altitude: 3390 m.a.s.l.; slope: 27%; Land use: cultivated 0–20 Ap 10YR 2/1 mo/me-fi/.cr so/fr/sst, spl a/s 20–40 A2 10YR 2/1 mo-we/me-fi/cr so/fr/sst, spl g/s 40–74 Bt 7.5YR 3/4 St/co-me/sb ha/fi/vst, pl h/s >74 C - - - -
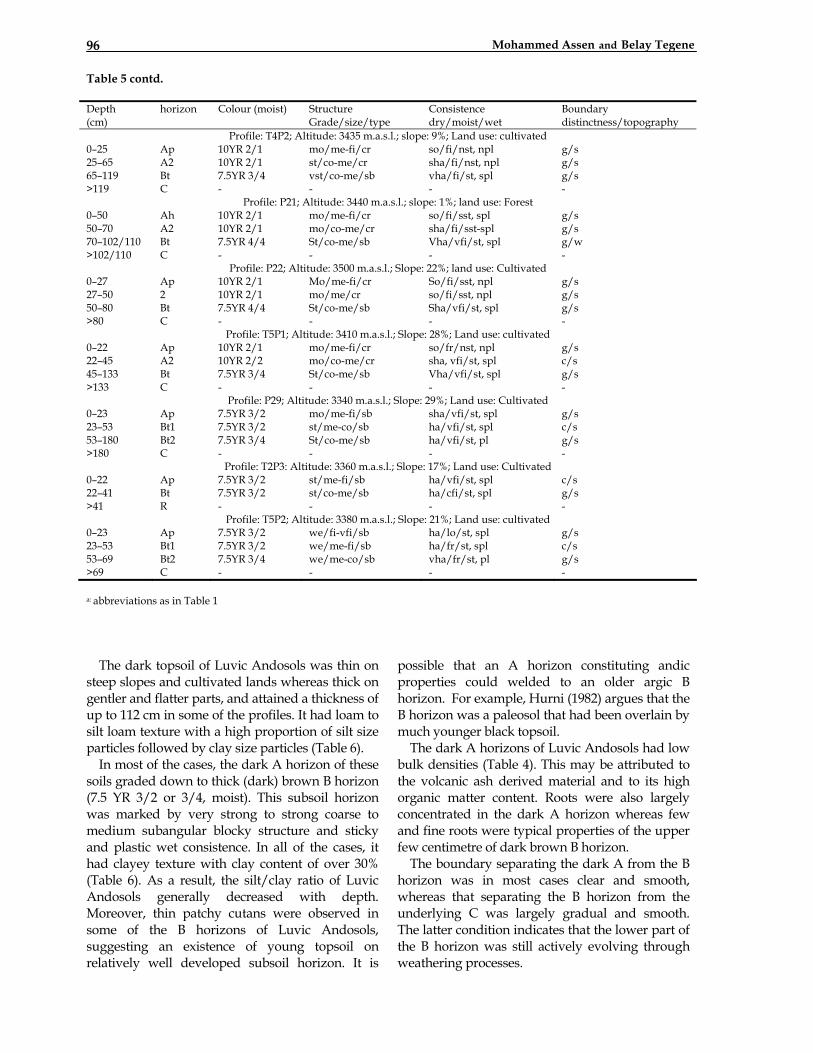
Mohammed Assen and Belay Tegene 96
Table 5 contd. Depth (cm)
horizon Colour (moist) Structure Grade/size/type
Consistence dry/moist/wet
Boundary distinctness/topography
Profile: T4P2; Altitude: 3435 m.a.s.l.; slope: 9%; Land use: cultivated 0–25 Ap 10YR 2/1 mo/me-fi/cr so/fi/nst, npl g/s 25–65 A2 10YR 2/1 st/co-me/cr sha/fi/nst, npl g/s 65–119 Bt 7.5YR 3/4 vst/co-me/sb vha/fi/st, spl g/s >119 C - - - -
Profile: P21; Altitude: 3440 m.a.s.l.; slope: 1%; land use: Forest 0–50 Ah 10YR 2/1 mo/me-fi/cr so/fi/sst, spl g/s 50–70 A2 10YR 2/1 mo/co-me/cr sha/fi/sst-spl g/s 70–102/110 Bt 7.5YR 4/4 St/co-me/sb Vha/vfi/st, spl g/w >102/110 C - - - -
Profile: P22; Altitude: 3500 m.a.s.l.; Slope: 22%; land use: Cultivated 0–27 Ap 10YR 2/1 Mo/me-fi/cr So/fi/sst, npl g/s 27–50 2 10YR 2/1 mo/me/cr so/fi/sst, npl g/s 50–80 Bt 7.5YR 4/4 St/co-me/sb Sha/vfi/st, spl g/s >80 C - - - -
Profile: T5P1; Altitude: 3410 m.a.s.l.; Slope: 28%; Land use: cultivated 0–22 Ap 10YR 2/1 mo/me-fi/cr so/fr/nst, npl g/s 22–45 A2 10YR 2/2 mo/co-me/cr sha, vfi/st, spl c/s 45–133 Bt 7.5YR 3/4 St/co-me/sb Vha/vfi/st, spl g/s >133 C - - - -
Profile: P29; Altitude: 3340 m.a.s.l.; Slope: 29%; Land use: Cultivated 0–23 Ap 7.5YR 3/2 mo/me-fi/sb sha/vfi/st, spl g/s 23–53 Bt1 7.5YR 3/2 st/me-co/sb ha/vfi/st, spl c/s 53–180 Bt2 7.5YR 3/4 St/co-me/sb ha/vfi/st, pl g/s >180 C - - - -
Profile: T2P3: Altitude: 3360 m.a.s.l.; Slope: 17%; Land use: Cultivated 0–22 Ap 7.5YR 3/2 st/me-fi/sb ha/vfi/st, spl c/s 22–41 Bt 7.5YR 3/2 st/co-me/sb ha/cfi/st, spl g/s >41 R - - - -
Profile: T5P2; Altitude: 3380 m.a.s.l.; Slope: 21%; Land use: cultivated 0–23 Ap 7.5YR 3/2 we/fi-vfi/sb ha/lo/st, spl g/s 23–53 Bt1 7.5YR 3/2 we/me-fi/sb ha/fr/st, spl c/s 53–69 Bt2 7.5YR 3/4 we/me-co/sb vha/fr/st, pl g/s >69 C - - - -
a: abbreviations as in Table 1 The dark topsoil of Luvic Andosols was thin on steep slopes and cultivated lands whereas thick on gentler and flatter parts, and attained a thickness of up to 112 cm in some of the profiles. It had loam to silt loam texture with a high proportion of silt size particles followed by clay size particles (Table 6). In most of the cases, the dark A horizon of these soils graded down to thick (dark) brown B horizon (7.5 YR 3/2 or 3/4, moist). This subsoil horizon was marked by very strong to strong coarse to medium subangular blocky structure and sticky and plastic wet consistence. In all of the cases, it had clayey texture with clay content of over 30% (Table 6). As a result, the silt/clay ratio of Luvic Andosols generally decreased with depth. Moreover, thin patchy cutans were observed in some of the B horizons of Luvic Andosols, suggesting an existence of young topsoil on relatively well developed subsoil horizon. It is
possible that an A horizon constituting andic properties could welded to an older argic B horizon. For example, Hurni (1982) argues that the B horizon was a paleosol that had been overlain by much younger black topsoil. The dark A horizons of Luvic Andosols had low bulk densities (Table 4). This may be attributed to the volcanic ash derived material and to its high organic matter content. Roots were also largely concentrated in the dark A horizon whereas few and fine roots were typical properties of the upper few centimetre of dark brown B horizon. The boundary separating the dark A from the B horizon was in most cases clear and smooth, whereas that separating the B horizon from the underlying C was largely gradual and smooth. The latter condition indicates that the lower part of the B horizon was still actively evolving through weathering processes.
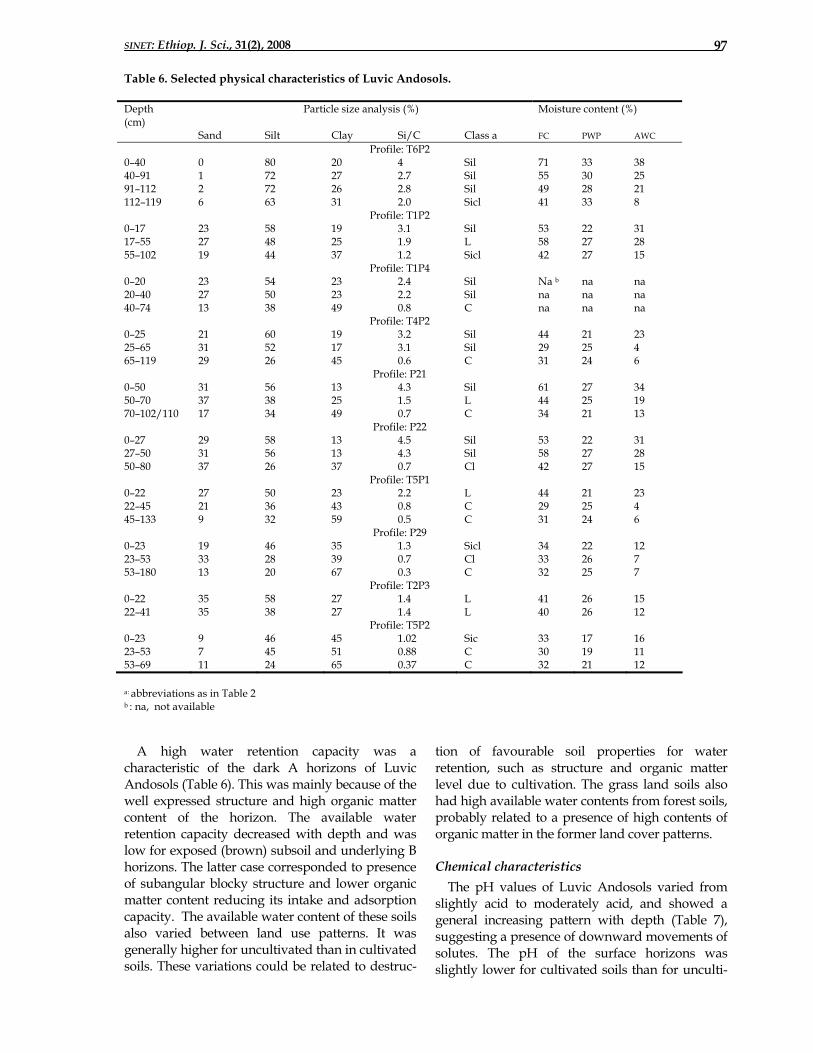
SINET: Ethiop. J. Sci., 31(2), 2008 97
Table 6. Selected physical characteristics of Luvic Andosols. Depth (cm)
Particle size analysis (%) Moisture content (%)
Sand Silt Clay Si/C Class a FC PWP AWC Profile: T6P2
0–40 0 80 20 4 Sil 71 33 38 40–91 1 72 27 2.7 Sil 55 30 25 91–112 2 72 26 2.8 Sil 49 28 21 112–119 6 63 31 2.0 Sicl 41 33 8
Profile: T1P2 0–17 23 58 19 3.1 Sil 53 22 31 17–55 27 48 25 1.9 L 58 27 28 55–102 19 44 37 1.2 Sicl 42 27 15
Profile: T1P4 0–20 23 54 23 2.4 Sil Na b na na 20–40 27 50 23 2.2 Sil na na na 40–74 13 38 49 0.8 C na na na
Profile: T4P2 0–25 21 60 19 3.2 Sil 44 21 23 25–65 31 52 17 3.1 Sil 29 25 4 65–119 29 26 45 0.6 C 31 24 6
Profile: P21 0–50 31 56 13 4.3 Sil 61 27 34 50–70 37 38 25 1.5 L 44 25 19 70–102/110 17 34 49 0.7 C 34 21 13
Profile: P22 0–27 29 58 13 4.5 Sil 53 22 31 27–50 31 56 13 4.3 Sil 58 27 28 50–80 37 26 37 0.7 Cl 42 27 15
Profile: T5P1 0–22 27 50 23 2.2 L 44 21 23 22–45 21 36 43 0.8 C 29 25 4 45–133 9 32 59 0.5 C 31 24 6
Profile: P29 0–23 19 46 35 1.3 Sicl 34 22 12 23–53 33 28 39 0.7 Cl 33 26 7 53–180 13 20 67 0.3 C 32 25 7
Profile: T2P3 0–22 35 58 27 1.4 L 41 26 15 22–41 35 38 27 1.4 L 40 26 12
Profile: T5P2 0–23 9 46 45 1.02 Sic 33 17 16 23–53 7 45 51 0.88 C 30 19 11 53–69 11 24 65 0.37 C 32 21 12
a: abbreviations as in Table 2
b : na, not available
A high water retention capacity was a characteristic of the dark A horizons of Luvic Andosols (Table 6). This was mainly because of the well expressed structure and high organic matter content of the horizon. The available water retention capacity decreased with depth and was low for exposed (brown) subsoil and underlying B horizons. The latter case corresponded to presence of subangular blocky structure and lower organic matter content reducing its intake and adsorption capacity. The available water content of these soils also varied between land use patterns. It was generally higher for uncultivated than in cultivated soils. These variations could be related to destruc-
tion of favourable soil properties for water retention, such as structure and organic matter level due to cultivation. The grass land soils also had high available water contents from forest soils, probably related to a presence of high contents of organic matter in the former land cover patterns. Chemical characteristics The pH values of Luvic Andosols varied from slightly acid to moderately acid, and showed a general increasing pattern with depth (Table 7), suggesting a presence of downward movements of solutes. The pH of the surface horizons was slightly lower for cultivated soils than for unculti-
Mohammed Assen and Belay Tegene 98
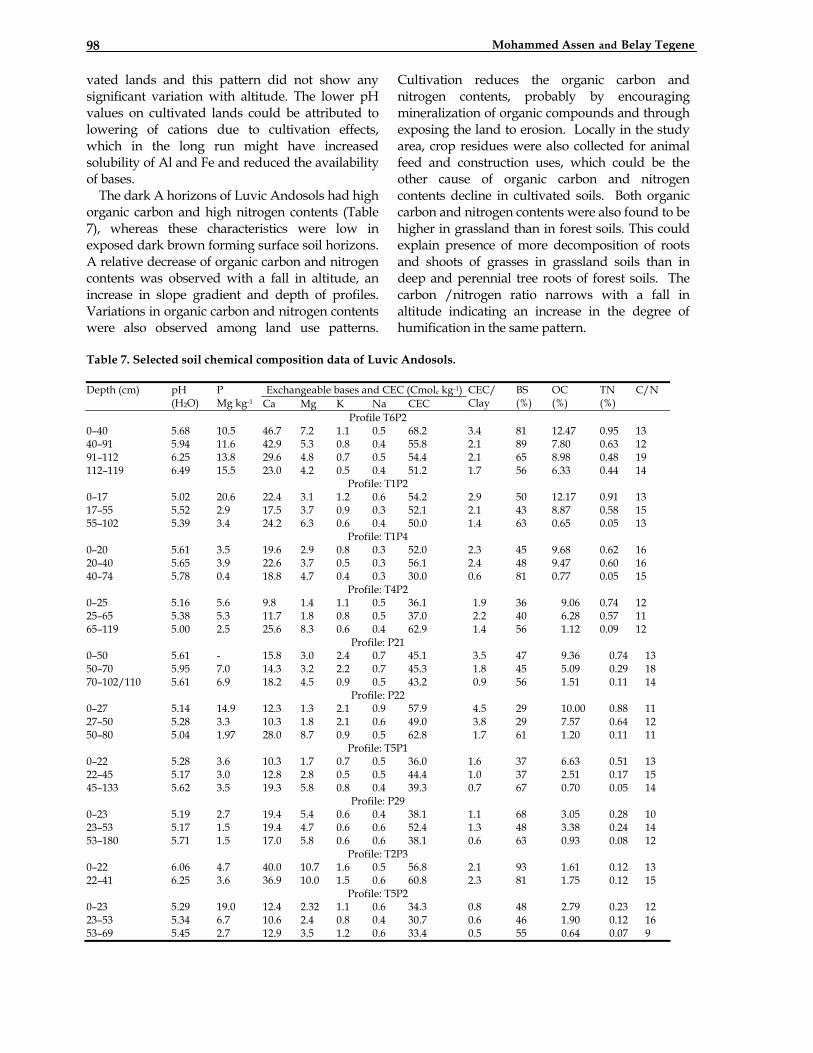
vated lands and this pattern did not show any significant variation with altitude. The lower pH values on cultivated lands could be attributed to lowering of cations due to cultivation effects, which in the long run might have increased solubility of Al and Fe and reduced the availability of bases. The dark A horizons of Luvic Andosols had high organic carbon and high nitrogen contents (Table 7), whereas these characteristics were low in exposed dark brown forming surface soil horizons. A relative decrease of organic carbon and nitrogen contents was observed with a fall in altitude, an increase in slope gradient and depth of profiles. Variations in organic carbon and nitrogen contents were also observed among land use patterns.
Cultivation reduces the organic carbon and nitrogen contents, probably by encouraging mineralization of organic compounds and through exposing the land to erosion. Locally in the study area, crop residues were also collected for animal feed and construction uses, which could be the other cause of organic carbon and nitrogen contents decline in cultivated soils. Both organic carbon and nitrogen contents were also found to be higher in grassland than in forest soils. This could explain presence of more decomposition of roots and shoots of grasses in grassland soils than in deep and perennial tree roots of forest soils. The carbon /nitrogen ratio narrows with a fall in altitude indicating an increase in the degree of humification in the same pattern.
Table 7. Selected soil chemical composition data of Luvic Andosols.
Exchangeable bases and CEC (Cmolc kg-1) Depth (cm) pH (H2O)
P Mg kg-1 Ca Mg K Na CEC
CEC/ Clay
BS (%)
OC (%)
TN (%)
C/N
Profile T6P2 0–40 5.68 10.5 46.7 7.2 1.1 0.5 68.2 3.4 81 12.47 0.95 13 40–91 5.94 11.6 42.9 5.3 0.8 0.4 55.8 2.1 89 7.80 0.63 12 91–112 6.25 13.8 29.6 4.8 0.7 0.5 54.4 2.1 65 8.98 0.48 19 112–119 6.49 15.5 23.0 4.2 0.5 0.4 51.2 1.7 56 6.33 0.44 14
Profile: T1P2 0–17 5.02 20.6 22.4 3.1 1.2 0.6 54.2 2.9 50 12.17 0.91 13 17–55 5.52 2.9 17.5 3.7 0.9 0.3 52.1 2.1 43 8.87 0.58 15 55–102 5.39 3.4 24.2 6.3 0.6 0.4 50.0 1.4 63 0.65 0.05 13
Profile: T1P4 0–20 5.61 3.5 19.6 2.9 0.8 0.3 52.0 2.3 45 9.68 0.62 16 20–40 5.65 3.9 22.6 3.7 0.5 0.3 56.1 2.4 48 9.47 0.60 16 40–74 5.78 0.4 18.8 4.7 0.4 0.3 30.0 0.6 81 0.77 0.05 15
Profile: T4P2 0–25 5.16 5.6 9.8 1.4 1.1 0.5 36.1 1.9 36 9.06 0.74 12 25–65 5.38 5.3 11.7 1.8 0.8 0.5 37.0 2.2 40 6.28 0.57 11 65–119 5.00 2.5 25.6 8.3 0.6 0.4 62.9 1.4 56 1.12 0.09 12
Profile: P21 0–50 5.61 - 15.8 3.0 2.4 0.7 45.1 3.5 47 9.36 0.74 13 50–70 5.95 7.0 14.3 3.2 2.2 0.7 45.3 1.8 45 5.09 0.29 18 70–102/110 5.61 6.9 18.2 4.5 0.9 0.5 43.2 0.9 56 1.51 0.11 14
Profile: P22 0–27 5.14 14.9 12.3 1.3 2.1 0.9 57.9 4.5 29 10.00 0.88 11 27–50 5.28 3.3 10.3 1.8 2.1 0.6 49.0 3.8 29 7.57 0.64 12 50–80 5.04 1.97 28.0 8.7 0.9 0.5 62.8 1.7 61 1.20 0.11 11
Profile: T5P1 0–22 5.28 3.6 10.3 1.7 0.7 0.5 36.0 1.6 37 6.63 0.51 13 22–45 5.17 3.0 12.8 2.8 0.5 0.5 44.4 1.0 37 2.51 0.17 15 45–133 5.62 3.5 19.3 5.8 0.8 0.4 39.3 0.7 67 0.70 0.05 14
Profile: P29 0–23 5.19 2.7 19.4 5.4 0.6 0.4 38.1 1.1 68 3.05 0.28 10 23–53 5.17 1.5 19.4 4.7 0.6 0.6 52.4 1.3 48 3.38 0.24 14 53–180 5.71 1.5 17.0 5.8 0.6 0.6 38.1 0.6 63 0.93 0.08 12
Profile: T2P3 0–22 6.06 4.7 40.0 10.7 1.6 0.5 56.8 2.1 93 1.61 0.12 13 22–41 6.25 3.6 36.9 10.0 1.5 0.6 60.8 2.3 81 1.75 0.12 15
Profile: T5P2 0–23 5.29 19.0 12.4 2.32 1.1 0.6 34.3 0.8 48 2.79 0.23 12 23–53 5.34 6.7 10.6 2.4 0.8 0.4 30.7 0.6 46 1.90 0.12 16 53–69 5.45 2.7 12.9 3.5 1.2 0.6 33.4 0.5 55 0.64 0.07 9
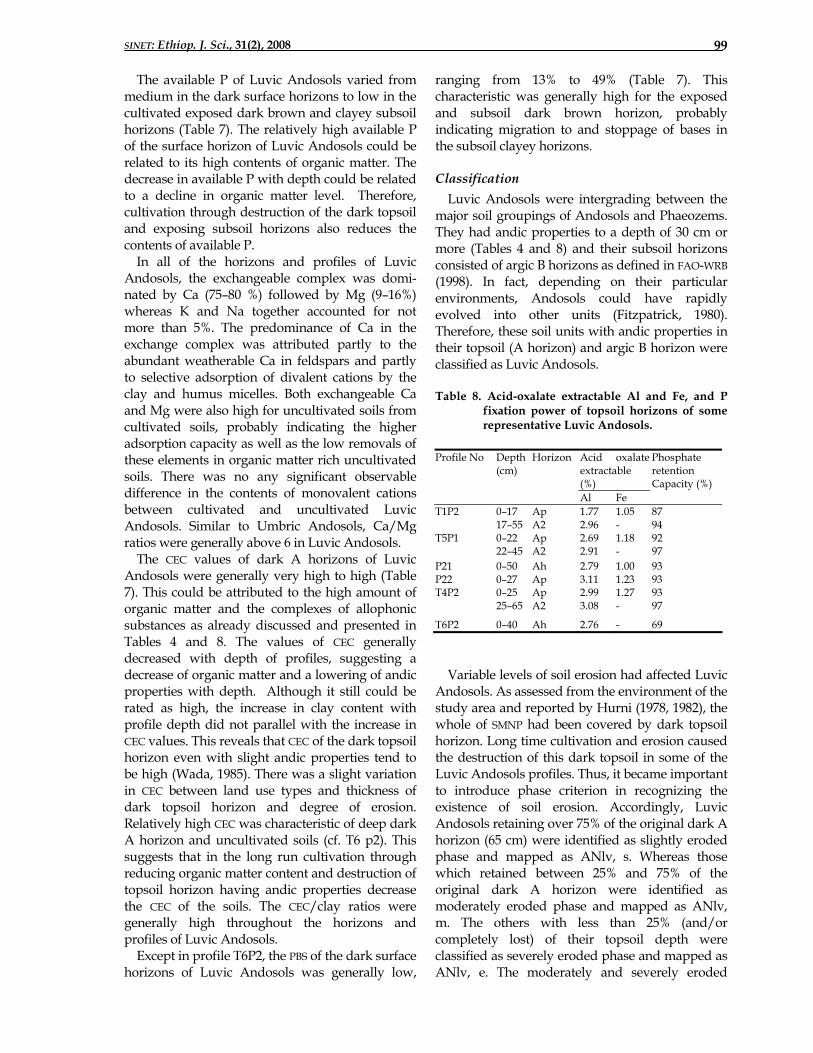
SINET: Ethiop. J. Sci., 31(2), 2008 99
The available P of Luvic Andosols varied from medium in the dark surface horizons to low in the cultivated exposed dark brown and clayey subsoil horizons (Table 7). The relatively high available P of the surface horizon of Luvic Andosols could be related to its high contents of organic matter. The decrease in available P with depth could be related to a decline in organic matter level. Therefore, cultivation through destruction of the dark topsoil and exposing subsoil horizons also reduces the contents of available P. In all of the horizons and profiles of Luvic Andosols, the exchangeable complex was domi-nated by Ca (75–80 %) followed by Mg (9–16%) whereas K and Na together accounted for not more than 5%. The predominance of Ca in the exchange complex was attributed partly to the abundant weatherable Ca in feldspars and partly to selective adsorption of divalent cations by the clay and humus micelles. Both exchangeable Ca and Mg were also high for uncultivated soils from cultivated soils, probably indicating the higher adsorption capacity as well as the low removals of these elements in organic matter rich uncultivated soils. There was no any significant observable difference in the contents of monovalent cations between cultivated and uncultivated Luvic Andosols. Similar to Umbric Andosols, Ca/Mg ratios were generally above 6 in Luvic Andosols. The CEC values of dark A horizons of Luvic Andosols were generally very high to high (Table 7). This could be attributed to the high amount of organic matter and the complexes of allophonic substances as already discussed and presented in Tables 4 and 8. The values of CEC generally decreased with depth of profiles, suggesting a decrease of organic matter and a lowering of andic properties with depth. Although it still could be rated as high, the increase in clay content with profile depth did not parallel with the increase in CEC values. This reveals that CEC of the dark topsoil horizon even with slight andic properties tend to be high (Wada, 1985). There was a slight variation in CEC between land use types and thickness of dark topsoil horizon and degree of erosion. Relatively high CEC was characteristic of deep dark A horizon and uncultivated soils (cf. T6 p2). This suggests that in the long run cultivation through reducing organic matter content and destruction of topsoil horizon having andic properties decrease the CEC of the soils. The CEC/clay ratios were generally high throughout the horizons and profiles of Luvic Andosols. Except in profile T6P2, the PBS of the dark surface horizons of Luvic Andosols was generally low,
ranging from 13% to 49% (Table 7). This characteristic was generally high for the exposed and subsoil dark brown horizon, probably indicating migration to and stoppage of bases in the subsoil clayey horizons. Classification Luvic Andosols were intergrading between the major soil groupings of Andosols and Phaeozems. They had andic properties to a depth of 30 cm or more (Tables 4 and 8) and their subsoil horizons consisted of argic B horizons as defined in FAO-WRB (1998). In fact, depending on their particular environments, Andosols could have rapidly evolved into other units (Fitzpatrick, 1980). Therefore, these soil units with andic properties in their topsoil (A horizon) and argic B horizon were classified as Luvic Andosols. Table 8. Acid-oxalate extractable Al and Fe, and P
fixation power of topsoil horizons of some representative Luvic Andosols.
Acid oxalate extractable (%)
Profile No Depth (cm)
Horizon
Al Fe
Phosphate retention Capacity (%)
T1P2 0–17 Ap 1.77 1.05 87 17–55 A2 2.96 - 94 T5P1 0–22 Ap 2.69 1.18 92 22–45 A2 2.91 - 97 P21 0–50 Ah 2.79 1.00 93 P22 0–27 Ap 3.11 1.23 93 T4P2 0–25 Ap 2.99 1.27 93 25–65 A2 3.08 - 97
T6P2 0–40 Ah 2.76 - 69 Variable levels of soil erosion had affected Luvic Andosols. As assessed from the environment of the study area and reported by Hurni (1978, 1982), the whole of SMNP had been covered by dark topsoil horizon. Long time cultivation and erosion caused the destruction of this dark topsoil in some of the Luvic Andosols profiles. Thus, it became important to introduce phase criterion in recognizing the existence of soil erosion. Accordingly, Luvic Andosols retaining over 75% of the original dark A horizon (65 cm) were identified as slightly eroded phase and mapped as ANlv, s. Whereas those which retained between 25% and 75% of the original dark A horizon were identified as moderately eroded phase and mapped as ANlv, m. The others with less than 25% (and/or completely lost) of their topsoil depth were classified as severely eroded phase and mapped as ANlv, e. The moderately and severely eroded
Mohammed Assen and Belay Tegene 100
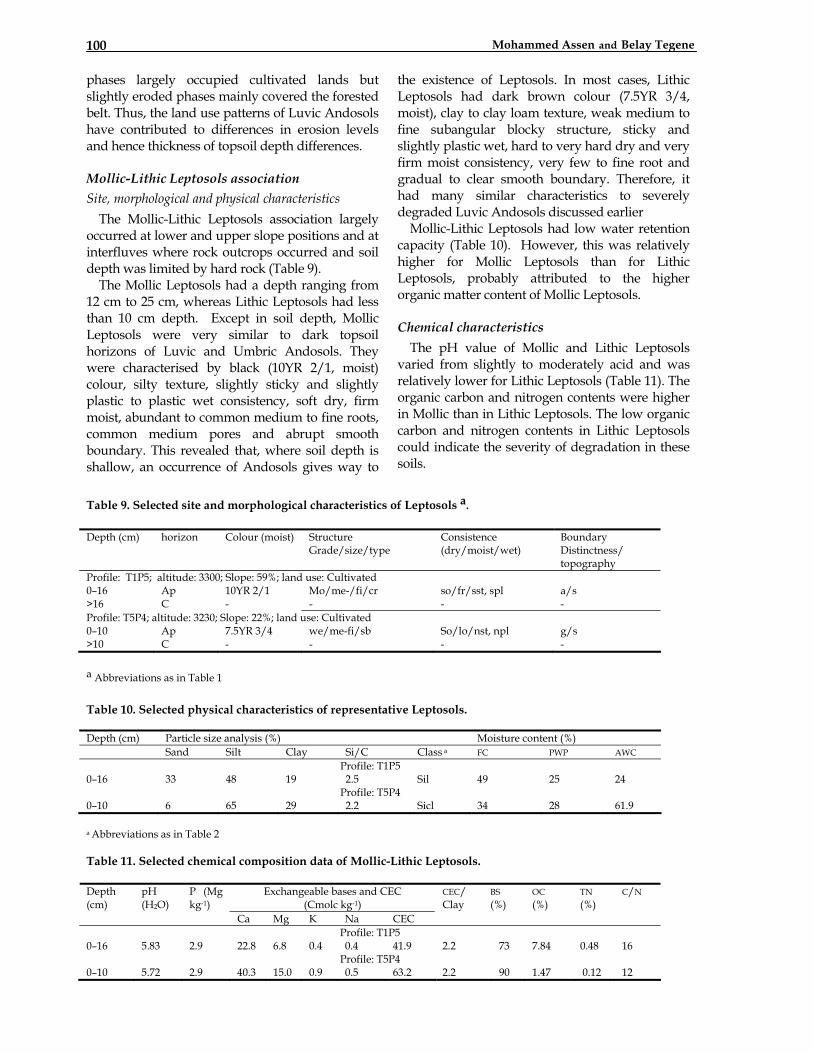
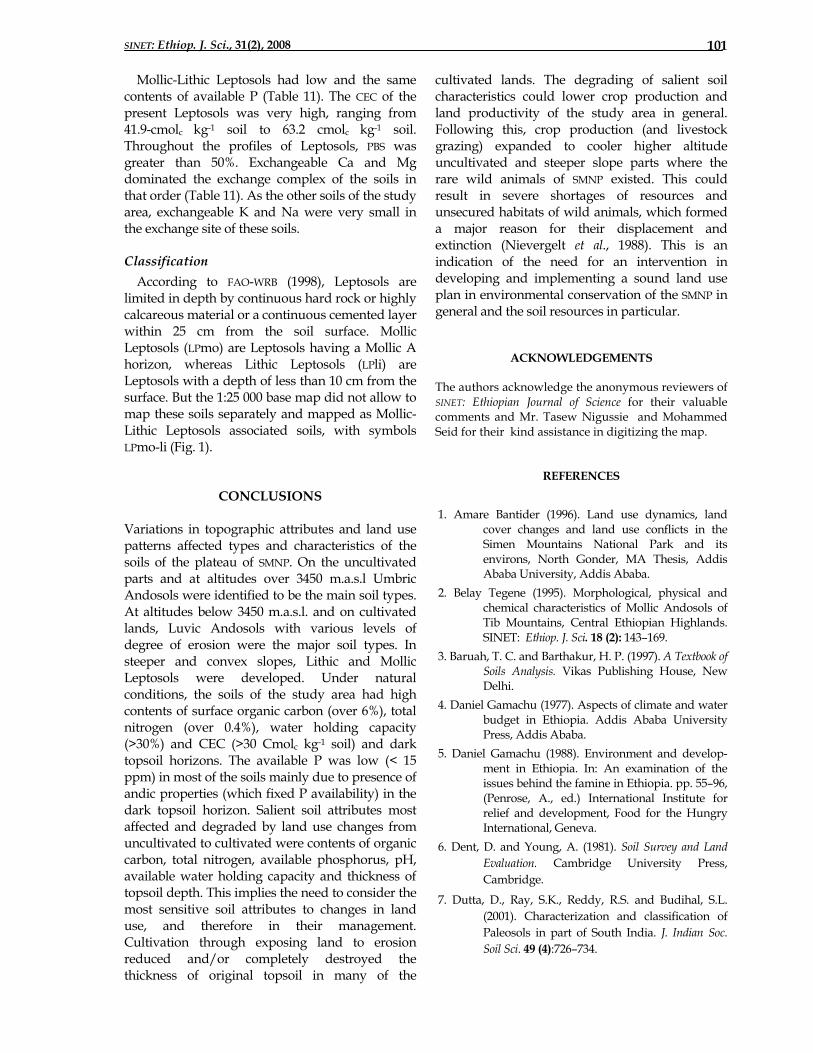
phases largely occupied cultivated lands but slightly eroded phases mainly covered the forested belt. Thus, the land use patterns of Luvic Andosols have contributed to differences in erosion levels and hence thickness of topsoil depth differences. Mollic-Lithic Leptosols association Site, morphological and physical characteristics The Mollic-Lithic Leptosols association largely occurred at lower and upper slope positions and at interfluves where rock outcrops occurred and soil depth was limited by hard rock (Table 9). The Mollic Leptosols had a depth ranging from 12 cm to 25 cm, whereas Lithic Leptosols had less than 10 cm depth. Except in soil depth, Mollic Leptosols were very similar to dark topsoil horizons of Luvic and Umbric Andosols. They were characterised by black (10YR 2/1, moist) colour, silty texture, slightly sticky and slightly plastic to plastic wet consistency, soft dry, firm moist, abundant to common medium to fine roots, common medium pores and abrupt smooth boundary. This revealed that, where soil depth is shallow, an occurrence of Andosols gives way to
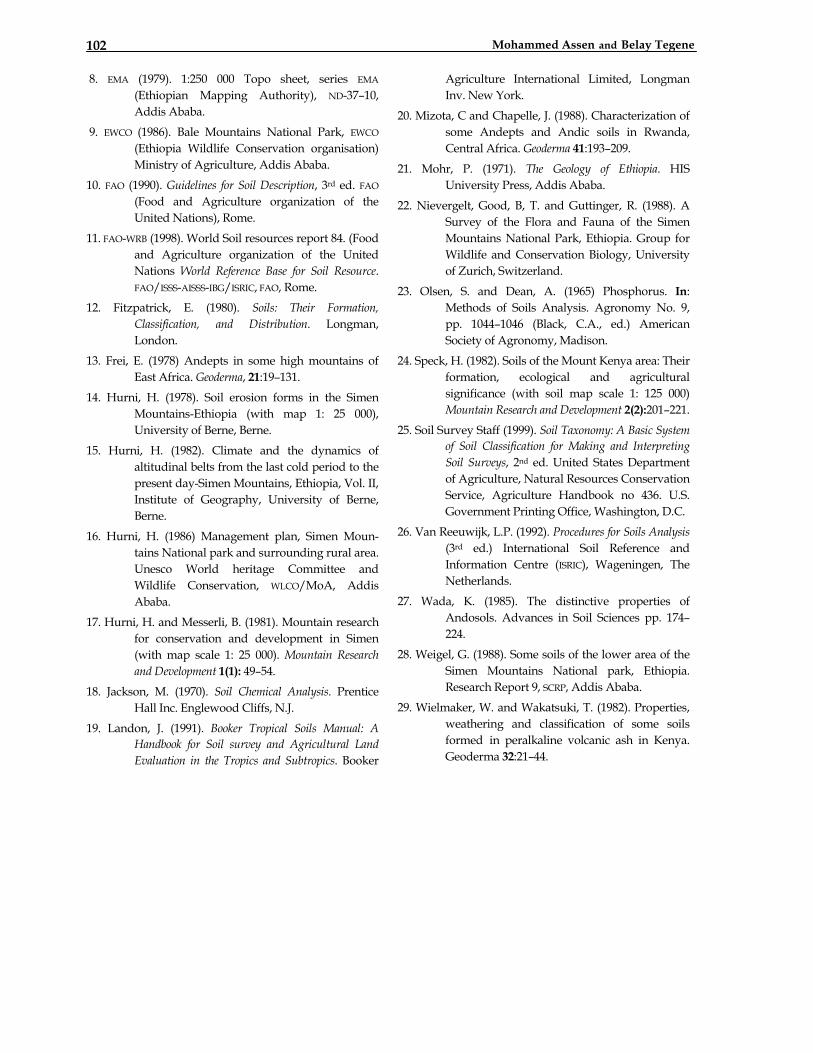
the existence of Leptosols. In most cases, Lithic Leptosols had dark brown colour (7.5YR 3/4, moist), clay to clay loam texture, weak medium to fine subangular blocky structure, sticky and slightly plastic wet, hard to very hard dry and very firm moist consistency, very few to fine root and gradual to clear smooth boundary. Therefore, it had many similar characteristics to severely degraded Luvic Andosols discussed earlier Mollic-Lithic Leptosols had low water retention capacity (Table 10). However, this was relatively higher for Mollic Leptosols than for Lithic Leptosols, probably attributed to the higher organic matter content of Mollic Leptosols. Chemical characteristics The pH value of Mollic and Lithic Leptosols varied from slightly to moderately acid and was relatively lower for Lithic Leptosols (Table 11). The organic carbon and nitrogen contents were higher in Mollic than in Lithic Leptosols. The low organic carbon and nitrogen contents in Lithic Leptosols could indicate the severity of degradation in these soils.
Table 9. Selected site and morphological characteristics of Leptosols a. Depth (cm) horizon Colour (moist) Structure
Grade/size/type Consistence (dry/moist/wet)
Boundary Distinctness/ topography
Profile: T1P5; altitude: 3300; Slope: 59%; land use: Cultivated 0–16 Ap 10YR 2/1 Mo/me-/fi/cr so/fr/sst, spl a/s >16 C - - - - Profile: T5P4; altitude: 3230; Slope: 22%; land use: Cultivated 0–10 Ap 7.5YR 3/4 we/me-fi/sb So/lo/nst, npl g/s >10 C - - - -
a Abbreviations as in Table 1 Table 10. Selected physical characteristics of representative Leptosols. Depth (cm) Particle size analysis (%) Moisture content (%) Sand Silt Clay Si/C Class a FC PWP AWC
Profile: T1P5 0–16 33 48 19 2.5 Sil 49 25 24
Profile: T5P4 0–10 6 65 29 2.2 Sicl 34 28 61.9
a Abbreviations as in Table 2 Table 11. Selected chemical composition data of Mollic-Lithic Leptosols.
Exchangeable bases and CEC (Cmolc kg-1)
Depth (cm)
pH (H2O)
P (Mg kg-1)
Ca Mg K Na CEC
CEC/ Clay
BS (%)
OC (%)
TN (%)
C/N
Profile: T1P5 0–16 5.83 2.9 22.8 6.8 0.4 0.4 41.9 2.2 73 7.84 0.48 16
Profile: T5P4 0–10 5.72 2.9 40.3 15.0 0.9 0.5 63.2 2.2 90 1.47 0.12 12
SINET: Ethiop. J. Sci., 31(2), 2008 101
Mollic-Lithic Leptosols had low and the same contents of available P (Table 11). The CEC of the present Leptosols was very high, ranging from 41.9-cmolc kg-1 soil to 63.2 cmolc kg-1 soil. Throughout the profiles of Leptosols, PBS was greater than 50%. Exchangeable Ca and Mg dominated the exchange complex of the soils in that order (Table 11). As the other soils of the study area, exchangeable K and Na were very small in the exchange site of these soils. Classification According to FAO-WRB (1998), Leptosols are limited in depth by continuous hard rock or highly calcareous material or a continuous cemented layer within 25 cm from the soil surface. Mollic Leptosols (LPmo) are Leptosols having a Mollic A horizon, whereas Lithic Leptosols (LPli) are Leptosols with a depth of less than 10 cm from the surface. But the 1:25 000 base map did not allow to map these soils separately and mapped as Mollic-Lithic Leptosols associated soils, with symbols LPmo-li (Fig. 1).
CONCLUSIONS Variations in topographic attributes and land use patterns affected types and characteristics of the soils of the plateau of SMNP. On the uncultivated parts and at altitudes over 3450 m.a.s.l Umbric Andosols were identified to be the main soil types. At altitudes below 3450 m.a.s.l. and on cultivated lands, Luvic Andosols with various levels of degree of erosion were the major soil types. In steeper and convex slopes, Lithic and Mollic Leptosols were developed. Under natural conditions, the soils of the study area had high contents of surface organic carbon (over 6%), total nitrogen (over 0.4%), water holding capacity (>30%) and CEC (>30 Cmolc kg-1 soil) and dark topsoil horizons. The available P was low (< 15 ppm) in most of the soils mainly due to presence of andic properties (which fixed P availability) in the dark topsoil horizon. Salient soil attributes most affected and degraded by land use changes from uncultivated to cultivated were contents of organic carbon, total nitrogen, available phosphorus, pH, available water holding capacity and thickness of topsoil depth. This implies the need to consider the most sensitive soil attributes to changes in land use, and therefore in their management. Cultivation through exposing land to erosion reduced and/or completely destroyed the thickness of original topsoil in many of the
cultivated lands. The degrading of salient soil characteristics could lower crop production and land productivity of the study area in general. Following this, crop production (and livestock grazing) expanded to cooler higher altitude uncultivated and steeper slope parts where the rare wild animals of SMNP existed. This could result in severe shortages of resources and unsecured habitats of wild animals, which formed a major reason for their displacement and extinction (Nievergelt et al., 1988). This is an indication of the need for an intervention in developing and implementing a sound land use plan in environmental conservation of the SMNP in general and the soil resources in particular.
ACKNOWLEDGEMENTS The authors acknowledge the anonymous reviewers of SINET: Ethiopian Journal of Science for their valuable comments and Mr. Tasew Nigussie and Mohammed Seid for their kind assistance in digitizing the map.
REFERENCES
1. Amare Bantider (1996). Land use dynamics, land cover changes and land use conflicts in the Simen Mountains National Park and its environs, North Gonder, MA Thesis, Addis Ababa University, Addis Ababa.
2. Belay Tegene (1995). Morphological, physical and chemical characteristics of Mollic Andosols of Tib Mountains, Central Ethiopian Highlands. SINET: Ethiop. J. Sci. 18 (2): 143–169.
3. Baruah, T. C. and Barthakur, H. P. (1997). A Textbook of Soils Analysis. Vikas Publishing House, New Delhi.
4. Daniel Gamachu (1977). Aspects of climate and water budget in Ethiopia. Addis Ababa University Press, Addis Ababa.
5. Daniel Gamachu (1988). Environment and develop-ment in Ethiopia. In: An examination of the issues behind the famine in Ethiopia. pp. 55–96, (Penrose, A., ed.) International Institute for relief and development, Food for the Hungry International, Geneva.
6. Dent, D. and Young, A. (1981). Soil Survey and Land Evaluation. Cambridge University Press, Cambridge.
7. Dutta, D., Ray, S.K., Reddy, R.S. and Budihal, S.L. (2001). Characterization and classification of Paleosols in part of South India. J. Indian Soc. Soil Sci. 49 (4):726–734.
Mohammed Assen and Belay Tegene 102
8. EMA (1979). 1:250 000 Topo sheet, series EMA
(Ethiopian Mapping Authority), ND-37–10, Addis Ababa.
9. EWCO (1986). Bale Mountains National Park, EWCO (Ethiopia Wildlife Conservation organisation) Ministry of Agriculture, Addis Ababa.
10. FAO (1990). Guidelines for Soil Description, 3rd ed. FAO (Food and Agriculture organization of the United Nations), Rome.
11. FAO-WRB (1998). World Soil resources report 84. (Food and Agriculture organization of the United Nations World Reference Base for Soil Resource. FAO/ISSS-AISSS-IBG/ISRIC, FAO, Rome.
12. Fitzpatrick, E. (1980). Soils: Their Formation, Classification, and Distribution. Longman, London.
13. Frei, E. (1978) Andepts in some high mountains of East Africa. Geoderma, 21:19–131.
14. Hurni, H. (1978). Soil erosion forms in the Simen Mountains-Ethiopia (with map 1: 25 000), University of Berne, Berne.
15. Hurni, H. (1982). Climate and the dynamics of altitudinal belts from the last cold period to the present day-Simen Mountains, Ethiopia, Vol. II, Institute of Geography, University of Berne, Berne.
16. Hurni, H. (1986) Management plan, Simen Moun-tains National park and surrounding rural area. Unesco World heritage Committee and Wildlife Conservation, WLCO/MoA, Addis Ababa.
17. Hurni, H. and Messerli, B. (1981). Mountain research for conservation and development in Simen (with map scale 1: 25 000). Mountain Research and Development 1(1): 49–54.
18. Jackson, M. (1970). Soil Chemical Analysis. Prentice Hall Inc. Englewood Cliffs, N.J.
19. Landon, J. (1991). Booker Tropical Soils Manual: A Handbook for Soil survey and Agricultural Land Evaluation in the Tropics and Subtropics. Booker
Agriculture International Limited, Longman Inv. New York.
20. Mizota, C and Chapelle, J. (1988). Characterization of some Andepts and Andic soils in Rwanda, Central Africa. Geoderma 41:193–209.
21. Mohr, P. (1971). The Geology of Ethiopia. HIS University Press, Addis Ababa.
22. Nievergelt, Good, B, T. and Guttinger, R. (1988). A Survey of the Flora and Fauna of the Simen Mountains National Park, Ethiopia. Group for Wildlife and Conservation Biology, University of Zurich, Switzerland.
23. Olsen, S. and Dean, A. (1965) Phosphorus. In: Methods of Soils Analysis. Agronomy No. 9, pp. 1044–1046 (Black, C.A., ed.) American Society of Agronomy, Madison.
24. Speck, H. (1982). Soils of the Mount Kenya area: Their formation, ecological and agricultural significance (with soil map scale 1: 125 000) Mountain Research and Development 2(2):201–221.
25. Soil Survey Staff (1999). Soil Taxonomy: A Basic System of Soil Classification for Making and Interpreting Soil Surveys, 2nd ed. United States Department of Agriculture, Natural Resources Conservation Service, Agriculture Handbook no 436. U.S. Government Printing Office, Washington, D.C.
26. Van Reeuwijk, L.P. (1992). Procedures for Soils Analysis (3rd ed.) International Soil Reference and Information Centre (ISRIC), Wageningen, The Netherlands.
27. Wada, K. (1985). The distinctive properties of Andosols. Advances in Soil Sciences pp. 174–224.
28. Weigel, G. (1988). Some soils of the lower area of the Simen Mountains National park, Ethiopia. Research Report 9, SCRP, Addis Ababa.
29. Wielmaker, W. and Wakatsuki, T. (1982). Properties, weathering and classification of some soils formed in peralkaline volcanic ash in Kenya. Geoderma 32:21–44.