characterization and classification of soils of madahalli
TRANSCRIPT
Characterization and Classification of Soils of Madahalli Micro-watershed of Karnataka
R. Vasundhara*, M. Chandrakala, S. Dharumarajan, B. Kalaiselvi, Rajendra Hegde and S.K. Singh
ICAR-National Bureau of Soil Survey and Land Use Planning, Regional Centre, Bengaluru-560024, Karnataka, India
Abstract: Detailed soil survey was carried out to characterize and classify the soils
of Madahalli watershed, Chamrajanagar district, Karnataka using cadastral map
overlaid on Cartosat-1(ortho corrected) image as a base. Three landform units were
identified based on elevation and slope i.e. gently sloping lands (3-5%), very gently
sloping lands (1-3%) and nearly level lands (0-1%) and mapped into 6 soil series and
30 phases of soil series. These soils were classified as Alfisols (Typic Rhodustalfs,
Rhodic Paleustalfs) and Inceptisols (Typic Haplustepts). Alfisols are slightly deep to
deep, dark reddish brown to strong brown in hue 2.5YR 3/4 to 2.5YR 4/6, sandy loam
to sandy clay in texture with >35 per cent gravel. Inceptisols are very deep, yellowish
brown to dark brown with hue 10YR 4/6 to 10YR 3/3, sandy clay loam to clay in
texture. These soils are moderately acidic to moderately alkaline (pH 5.26 to 8.17).
The organic carbon content varied from low to high (0.21 to 1.16%) and CEC of the -1
soils ranged from 4.1 to 19.9 cmol (p+) kg .
Keywords: Soil survey and mapping, remote sensing, Alfisols, Inceptisols, Taxonomy
Introduction
Land and water are the most vital natural
resources of the country and these are under tremendous
stress due to ever increasing biotic pressure.
Characterization of soils is fundamental to all soil
studies, as it is an important tool for soil classification,
which is done based on soil properties. It also provides
information for understanding of the physical, chemical
and mineralogical properties of the soils and an insight
into the potentials and limitations of the soils for
management. The soil and land resource inventories
made so far in Karnataka had limited utility because the
surveys were of different types, scales and intensities at
different times with specific objectives. Hence, there is
need to generate detailed site-specific farm level
database on different land resources for all the
village/watersheds in a time bound manner that would
help to protect the valuable land resources and also to
stabilize the farm production and characterization of
Madahalli micro-watershed of Gundlupet taluk,
Chamrajnagar district is one of the case study in this
direction.
Materials and Methods
Madahalli micro-watershed is located in
Kodasogegrama panchayath, Terakanambi Hobli,
Gundlupet taluk of Chamarajnagar district (Fig.1). The
micro-watershed with total area of 698 hectares
(76°46'15.16'' and 76°48'15'' N latitude) and 11°43'
05.91'' and 11°44'43.13'' E longitude) is located at about
30 kms southeast from Gundlupet. The watershed
covers Karkla Madahalli (298 ha), Thodipura (172 ha),
Vaddagere (49 ha) Alwadi (178 ha) and Kodasoge (4 ha)
villages.*Corresponding author: (Email: [email protected])
Agropedology 2018, 28 (01), 42-47
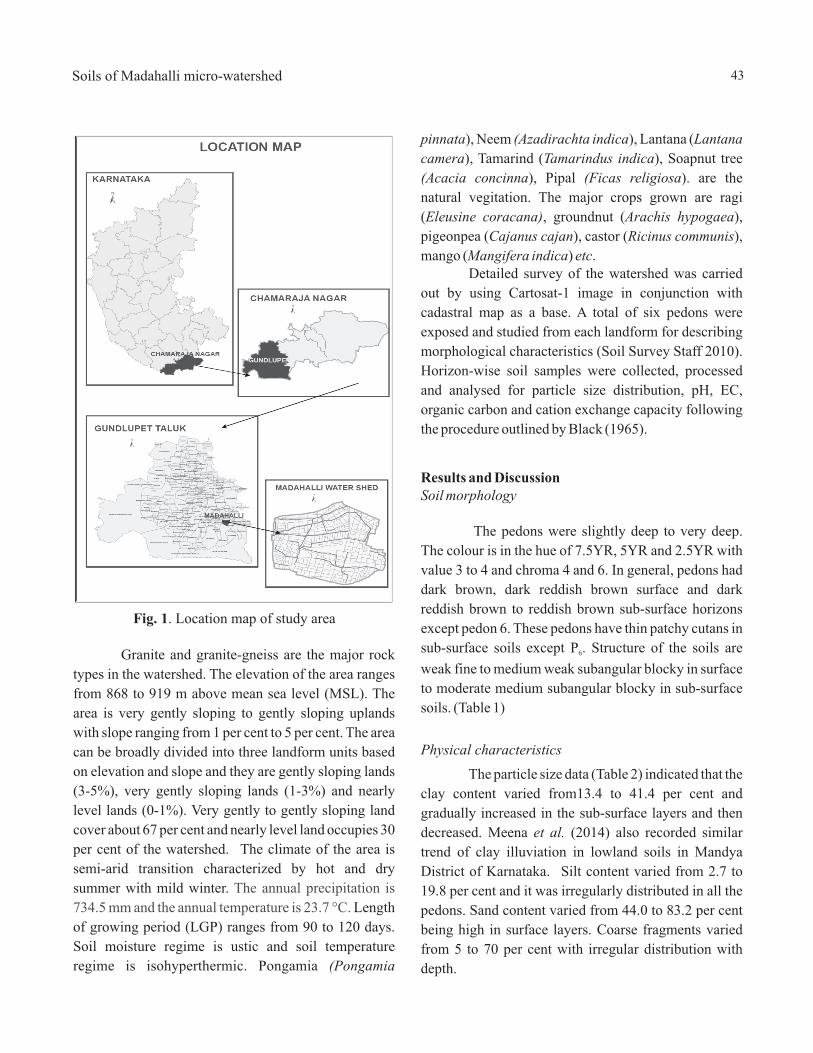
Fig. 1. Location map of study area
43Soils of Madahalli micro-watershed

44 Vasundhara et al.

Table 2. Physical and chemical properties of the soils of Madahalli micro-watershed
Depth cm
Hori-
zon
Particle size distribution (% of <2 mm)
Organic carbon
(gkg-1)
pH
EC (dS m
-1) Exchangeable bases
(cmol (p+) kg–1)
CEC
Base
saturati
on (%)
Sand (2.0-0.05
mm)
Silt (0.05-
0.002mm)
Clay (<0.00
2mm)
Ca Mg Na K
Pedon 1
82.5 4.5 13.4 11.6 6.14 0.45 4.36 0.61 0.45 0.59 4.1 100 80.5 5.8 13.5 10.6 6.21 0.27 2.72 0.64 0.27 0.65 4.7 91 51.5 12.0 36.3 8.8 5.88 0.46 5.35 0.97 0.22 0.55 12.3 58 55.0 19.8 35.2 8.1 6.41 0.49 4.11 1.0 0.13 0.51 12.7 45
Pedon 2
58.8 11.9 33.3 12.3 7.57 0.97 10.05 1.34 0.65 0.49 10.3 100 50.1 11.3 38.6 5.3 7.67 0.47 2.88 1.02 0.26 0.73 12.8 38 57.0 13.0 32.0 7.4 7.64 0.37 3.4 1.07 0.15 0.84 14.5 38 50.2 14.80 35.0 4.2 7.44 0.34 3.96 1.11 0.19 0.86 19.1 32
Pedon 3
83.2 2.7 15.1 9.5 6.28 0.38 3.61 0.99 0.35 0.63 6.7 83 57.9 6.2 35.6 7.4 5.86 0.32 3.48 0.71 0.24 0.56 9.7 51 54.5 9.7 35.8 7.7 5.89 0.33 3.36 0.76 0.19 0.55 10.7 45
Pedon 4
65.0 13.9 20.1 6.3 5.26 0.95 4.71 0.41 0.29 0.36 6.2 93 62.5 6.2 31.5 5.3 5.75 1.29 4.9 0.83 0.28 0.55 12.9 51 49.8 9.8 41.4 4.6 6.19 0.90 4.67 1.14 0.36 0.97 19.9 36 52.8 11.7 35.5 4.2 6.24 0.71 5.1 0.82 0.31 0.73 18.2 38 76.5 2.9 21.6 4.8 6.78 0.79 2.95 0.7 0.15 0.63 7.4 60
Pedon 5
71.0 8.7 23.3 6.3 7.02 0.31 1.97 0.64 0.41 0.08 4.3 72 72.1 7.4 20.5 12.3 7.15 0.43 1.9 0.61 0.19 0.58 9.1 36 44.0 15.1 40.1 8.1 7.17 0.52 3.97 0.72 0.13 0.82 10.8 52 59.4 5.6 36.0 8.8 6.68 0.44 2.8 0.82 0.12 0.96 9.6 49 57.6 7.4 36.2 5.6 7.02 0.25 1.88 0.51 0.14 0.93 8.9 39
Pedon 6
74.1 7.3 20.6 7.0 7.96 0.52 6.19 1.35 0.24 0.72 8.5 100 82.2 2.3 12.5 6.3 7.93 0.53 5.4 0.09 0.45 0.58 7.3 89.3 72.0 6.6 22.4 2.1 8.17 0.47 3.53 0.7 0.15 0.78 4.7 100 58.0 8.2 30.8 6.0 7.79 0.64 3.63 1.13 0.19 0.79 10.1 56.8 26.7 30.3 40.0 2.8 7.85 0.72 6.06 1.79 0.23 0.92 12.7 70.9
0-18 18-29 29-48 48-69
0-22 22-46 46-74 74-96
0-13 13-41 41-83
0-13 13-36 36-61 61-83
83-106
0-20 20-38 38-69 69-98
98-134
0-26 26-51 51-72
72-104 104-138 138-170
Ap Bw Bt1 Bt2
Ap Bt1 Bt2 Bt3
Ap Bt1 Bt2
Ap Bt1 Bt2 Bt3 Bt4
Ap Bw Bt1 Bt2 Bt3
Ap 2A2 3Bw1 4Bw2 5Bw3 6Bw4 55.5 9.5 35.0 4.2 8.06 0.66 5.37 1.5 0.22 0.65 13.2 58.6
Soil classification
Based on the morphological characteristics, physical
and chemical properties of the typifying pedons, all the
upland soils are grouped under Alfisols and the lowland
soils under Inceptisols (Fig. 2). Six soil series were
identified and mapped with 30 mapping units (phases of
soil series). Moderately deep, well drained red gravelly
sandy loam soils (M1 and M4 series); occupy nearly 47
per cent of the watershed area (330 ha). Series M5,
which is very deep dark red sandy clay loam soils, cover
an area of 326 ha. Other soils cover less than 5 per cent of
the area in the watershed.
45Soils of Madahalli micro-watershed

Fig.2. Soils of Madahalli microwatershed
Description of soil seriesSeries M1 (Madahalli-1)
The soils of Series M1 belonging to clayey-
skeletal, mixed isohyperthermic Rhodic Paleustalfs are
slightly deep, well drained with gravelly sandy loam
texture. The clay content varied from 13.4 to 35.2 per
cent in the sub-soil. The pH of the surface layer is 6.14
and it increased with depth. The EC of surface soil is -1
0.45 dS m . The organic carbon content of surface soil is -1
11.6 g kg and it decreased with depth.
Series M2 (Madahalli-2)
Soil series M2 representing clayey-skeletal,
mixed isohyperthermic Typic Rhodustalfs had relatively
higher clay content (38.6%) in sub-soil than the surface
layer (33.3%). The surface soil had pH 7.57 but it
decreased in sub soil. Electrical conductivity was higher
in surface layer than sub-soil. Organic carbon content of -1surface soil is 12.3 g kg and it decreased with depth.
Series M3 (Madahalli-3)
Clayey-skeletal, mixed isohyperthermic
Rhodic Paleustalfs representing M3 series had higher
clay accumulation in sub soil (35.8%) than overlying
horizon (15.1%)The pH of the surface soil is 6.28 and in the sub
soil it varies from 5.86 to 5.89. EC is less and varies from -1
0.38 in the surface to 0.33 dS m in the sub-soil. Organic -1
carbon content of surface soil is 9.5 g kg and it -1
decreases with depth to 7.7 g kg .
Series M4 (Madahalli-4)
Soils were classified as clayey-skeletal, mixed
isohyperthermic Typic Rhodustalfs. The clay content
46 Vasundhara et al.

increases from the surface (20.1%) to the sub-soil (35.5
per cent). The pH of the surface soil is 5.6 and it increases
in the sub-soil to 6.78. Organic carbon content of surface -1 -1soil is 6.3 g kg and it decreases with depth to 4.8 g kg .
Base saturation of soil ranges from 36 to 93 per cent.
Series M5 (Madahalli-5)
The clayey-skeletal, mixed isohyperthermic
Typic Rhodustalfs have sandy loam to sandy clay loam
texture. Clay content varies from 20.5 to 40.1 per cent.
Soil pH of surface and sub-surface layers are 7.02. EC in -1surface soil layer is 0.31 dS m whereas in sub-surface
-1layer it varies from 0.9 to 0.18 dS m . Organic carbon
-1content of surface soil is 6.3 g kg and it increases with
-1depth to 12.3 g kg . Base saturation of soil ranges from
36 to 72 per cent.
Series M6 (Madahalli-6)
In the soils of M6 series (Fine, mixed
isohyperthermic Typic Haplustepts), clay content
increases from the surface (26.4%) to the sub-soil
(40.0%). The pH of soil increased in the sub-soil to 7.9
from 7.0 (surface soil). The Ap horizon had low EC than -1the sub-soils (5.2 to 0.66 dS m ). Organic carbon content
-1of surface soil is 7.0 g kg and it decreased with depth to
-12.1 g kg . Base saturation of soil ranged from 56.8 to 100
per cent.
References
Black, C.A. (1965). Methods of Soil Analysis. Part 2,
American Society of Agronomy Inc., Publisher,
Madison, Wisconsin, USA, pp. 849-1348.Meena, R.S., Natarajan, A., Thayalan, S., Hegde, R.,
Niranjana, K.V., Naidu, L.G.K., and Sarkar, D.,
(2014). Characterization and classification of
lowland soils of Chikkarsinkere Hobli, Maddur
taluk, Mandya district of Karnataka.
Agropedology 24, 95-101.Soil Survey Staff (2010). 'Keys to Soil Taxonomy',
Eleventh Edition. (U.S.D.A.: Washington,
D.C.). Srinivasan, R., Natarajan, A., Anil Kumar K.S., and
Kalaivanan (2013). Characterization of major
cashew-growing soils of Dakshina Kannada
district of Karnataka. Agropedology 23, 59-64.
Received: September, 2017 Accepted: February, 2018
47Soils of Madahalli micro-watershed