characteristics of a single state nutrition program ... · nutrition program are nutritionally...
TRANSCRIPT

Peter Tiernan Shirley Chao
Chief Financial Officer Director of Nutrition
Massachusetts Executive Office of Elder Affairs
HCBS Conference
Washington D.C.
August 31, 2016
Characteristics of a Single State Nutrition Program:
Consideration of the Massachusetts Model
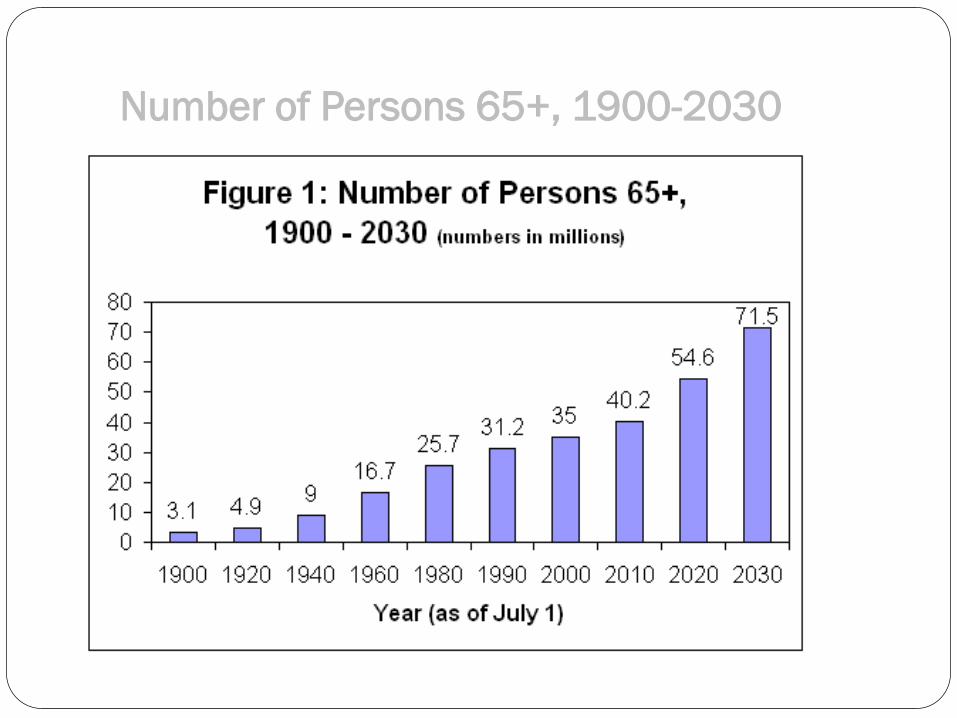
Number of Persons 65+, 1900-2030

Future Growth
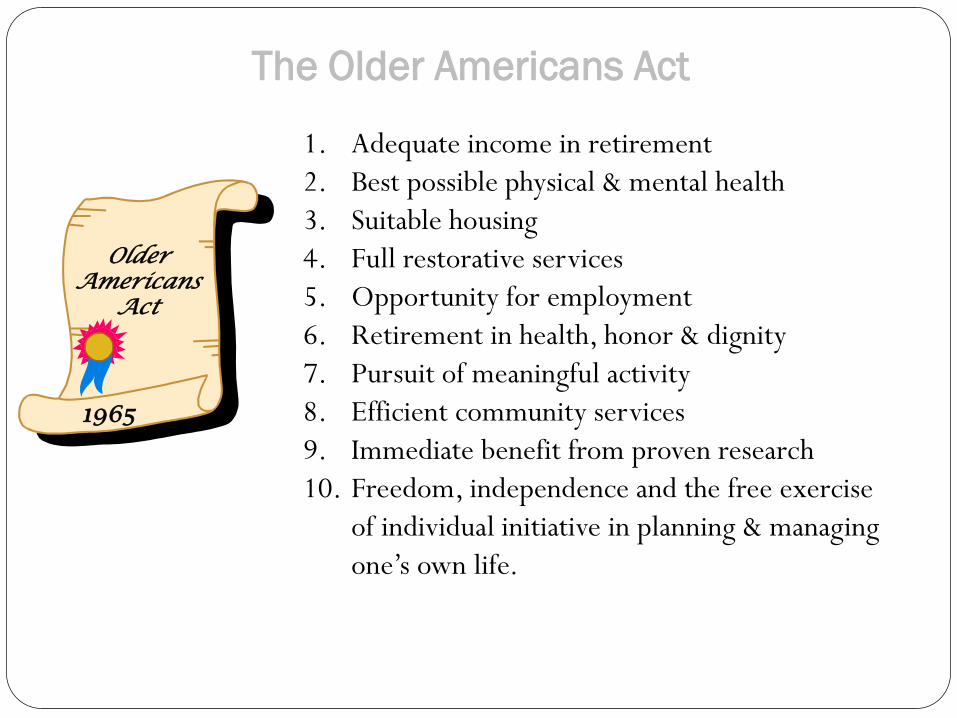
The Older Americans Act
Older Americans
Act
1. Adequate income in retirement
2. Best possible physical & mental health
3. Suitable housing
4. Full restorative services
5. Opportunity for employment
6. Retirement in health, honor & dignity
7. Pursuit of meaningful activity
8. Efficient community services
9. Immediate benefit from proven research
10. Freedom, independence and the free exercise
of individual initiative in planning & managing
one’s own life.
1965

Network
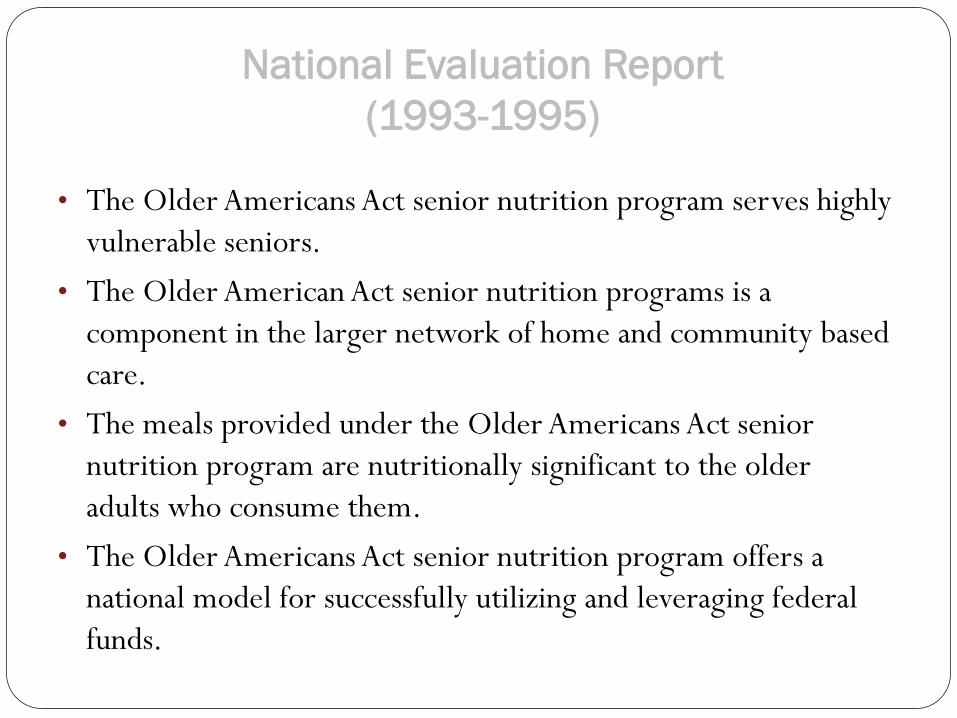
National Evaluation Report
(1993-1995)
• The Older Americans Act senior nutrition program serves highly
vulnerable seniors.
• The Older American Act senior nutrition programs is a
component in the larger network of home and community based
care.
• The meals provided under the Older Americans Act senior
nutrition program are nutritionally significant to the older
adults who consume them.
• The Older Americans Act senior nutrition program offers a
national model for successfully utilizing and leveraging federal
funds.

Nutrition Program for Elderly
• Eligibility • Home Delivered Meals:
• People age 60 or older. • Meet home delivered meal eligibility requirements. • Individuals with disabilities who reside at home with older individuals who
are eligible • No income eligibility test is required.
• Congregate meals: • People age 60 or older, and their spouses at any age. • Disabled people under age 60 who live in housing facilities occupied
primarily by the elderly, where congregate meals are served. These clients can attend the congregate meal sites at the housing facility.
• No income eligibility test is required.
• Voluntary contribution
• Meal Requirements (1/3 DRI)
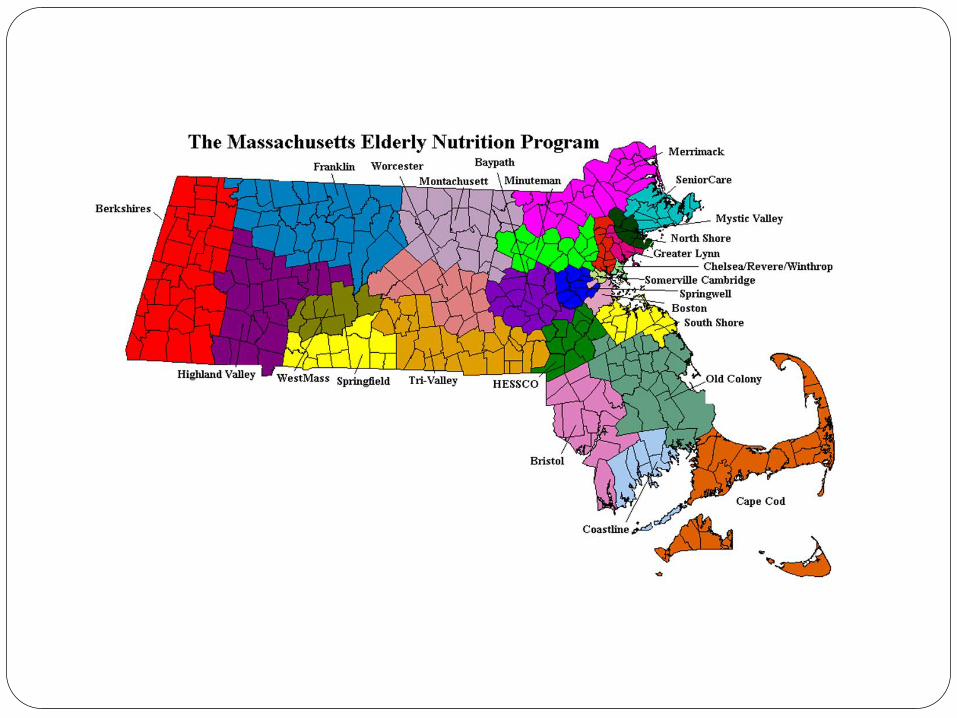
MASSACHUSETTS ELDERLY NUTRITION PROGRAM
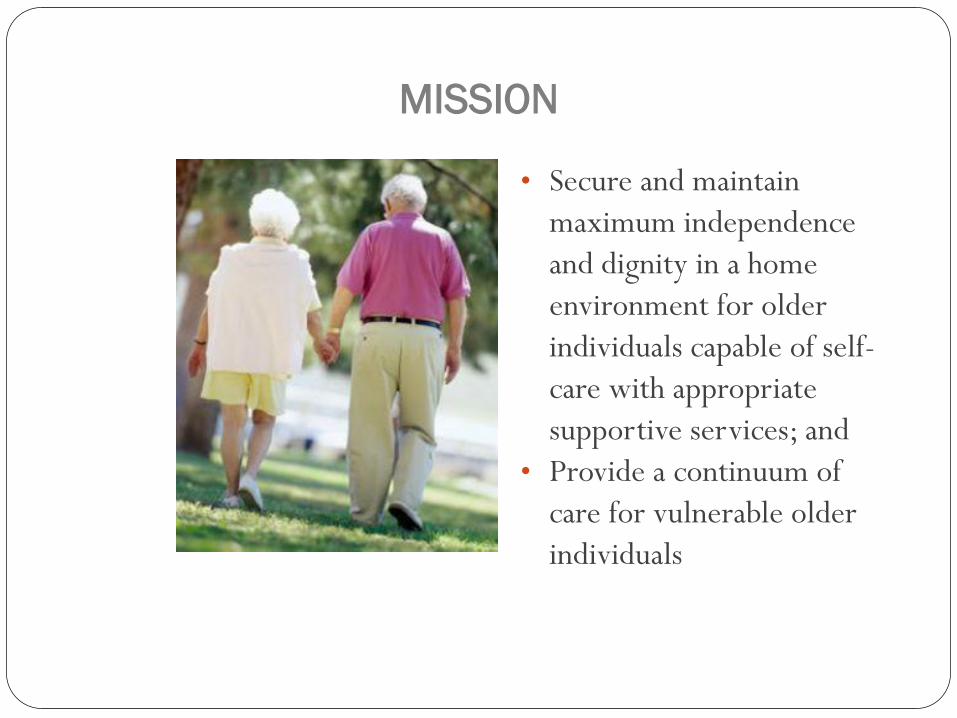
MISSION
• Secure and maintain
maximum independence
and dignity in a home
environment for older
individuals capable of self-
care with appropriate
supportive services; and
• Provide a continuum of
care for vulnerable older
individuals

OVERVIEW
• 28 nutrition projects across Massachusetts serving
8.8 million meals a year
• 7,000 volunteers contribute 450,000 hours yearly
to the Elderly Nutrition Program.
• The program addresses multiple problems faced by
elders including: poor nutrition, food insecurity,
chronic disease, and social isolation.
Meal Program
Ninety percent of the senior meals are provide by food service contractors through a competitive bidding process.
All the contracts are for a three year period, and are renewed up to five years.
The cost per meal ranges from $2.85 to $4.50.
The average USDA commodity usage is 20 to 35 cents per meal.
The prices of the group purchasing program are compatible to all the major food service contract prices, and most of the time are lower.
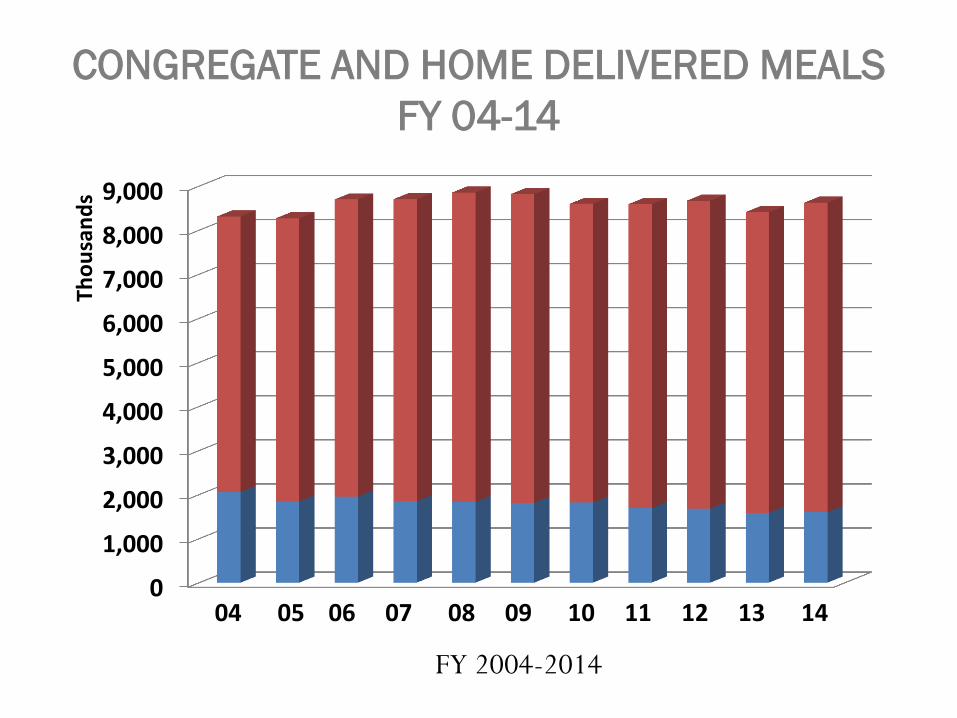
CONGREGATE AND HOME DELIVERED MEALS
FY 04-14
0
1,000
2,000
3,000
4,000
5,000
6,000
7,000
8,000
9,000
Tho
usa
nd
s
04 05 06 07 08 09 10 11 12 13 14
FY 2004-2014
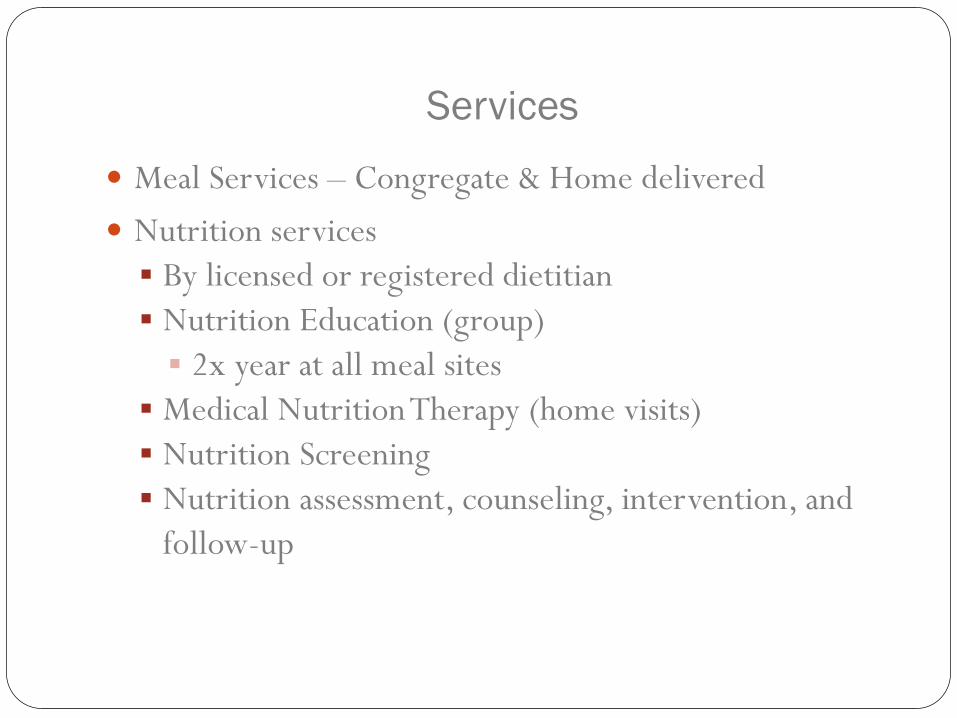
Services
Meal Services – Congregate & Home delivered
Nutrition services
By licensed or registered dietitian
Nutrition Education (group)
2x year at all meal sites
Medical Nutrition Therapy (home visits)
Nutrition Screening
Nutrition assessment, counseling, intervention, and
follow-up

Unique Characters of Massachusetts’ Elderly
Nutrition Program
• Robust combined financial resources
• Aggregated buying power
• Statewide standardized policies
OAA/NSIP
State
CMS HCBW
Managed Care Organizations (SCO, PACE)
16
Robust Combined Financial
Resources
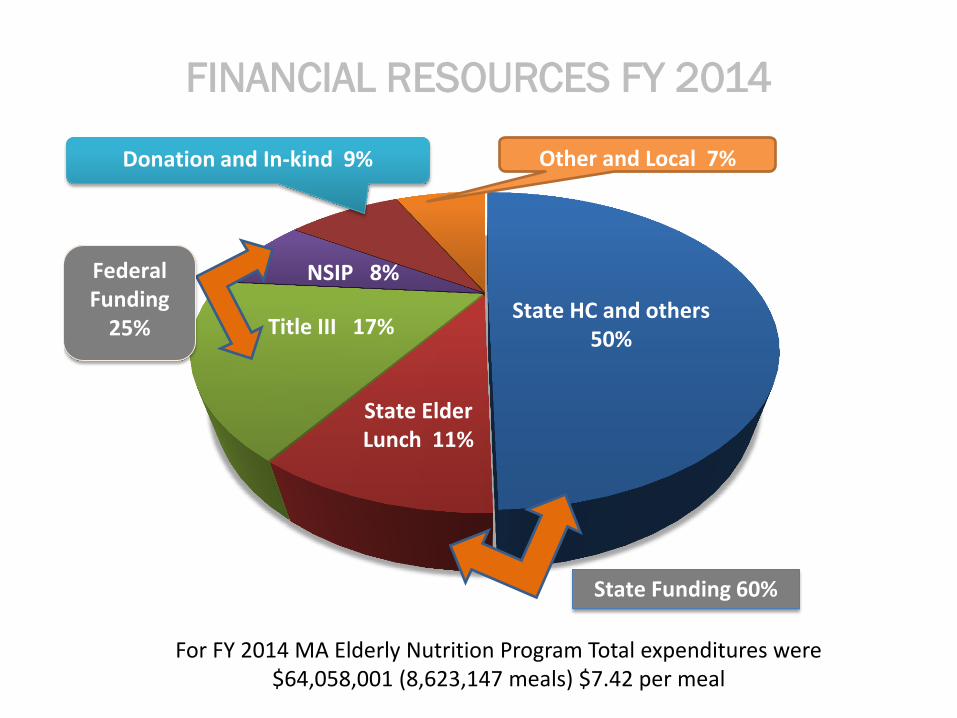
FINANCIAL RESOURCES FY 2014
For FY 2014 MA Elderly Nutrition Program Total expenditures were $64,058,001 (8,623,147 meals) $7.42 per meal
7%
Chart Title
Title III 17%
State Elder Lunch 11%
NSIP Commodities
NSIP 8%
State HC and others 50%
Donation and In-kind 9% Other and Local 7%
Federal Funding
25%
State Funding 60%

Enhance Financial Resources
Programs
Senior Community Option (SCO)
Program of All-Inclusive Care for the Elderly (PACE)
Individual Seniors
Senior Farmers Market Nutrition program (SFMNP)
Commodity Supplemental Food Program (CSFP)
SNAP program
Food Bank Brown Bag Program
Child and Adult Care Food Program (CACFP)

Statewide USDA Commodity
Distribution/Processing Program
Group Purchasing Agreement
Aggregated Buying Power
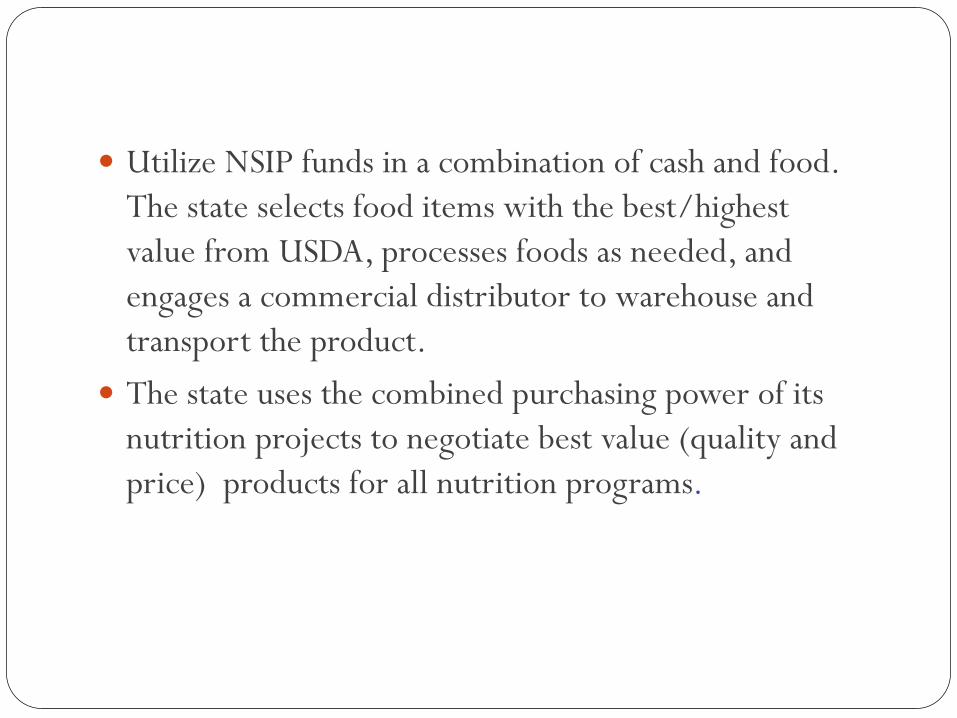
Utilize NSIP funds in a combination of cash and food.
The state selects food items with the best/highest
value from USDA, processes foods as needed, and
engages a commercial distributor to warehouse and
transport the product.
The state uses the combined purchasing power of its
nutrition projects to negotiate best value (quality and
price) products for all nutrition programs.
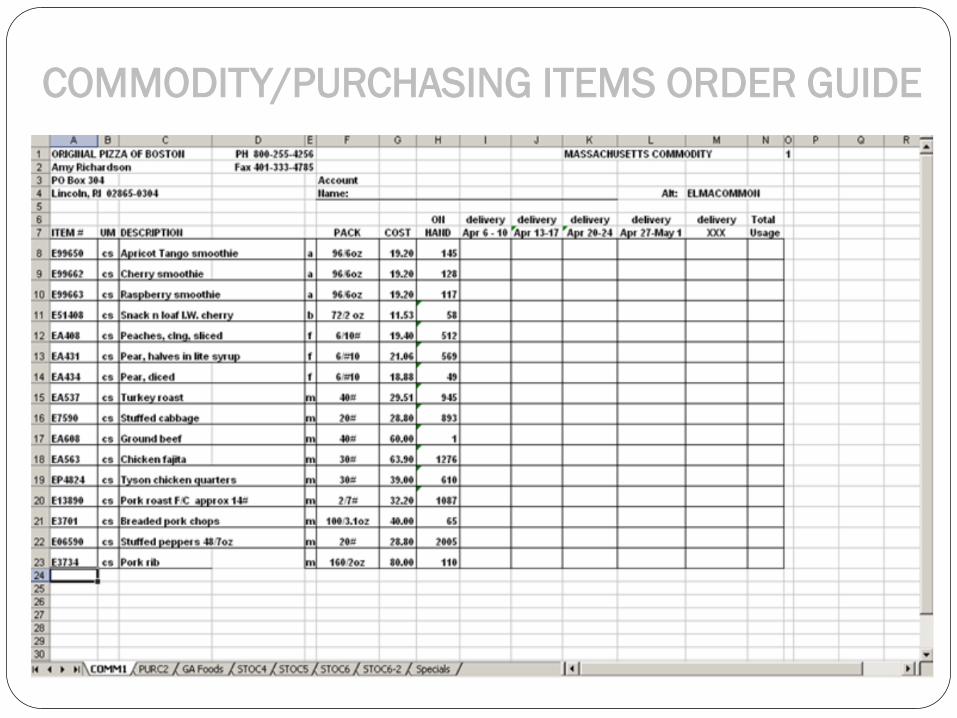
COMMODITY/PURCHASING ITEMS ORDER GUIDE
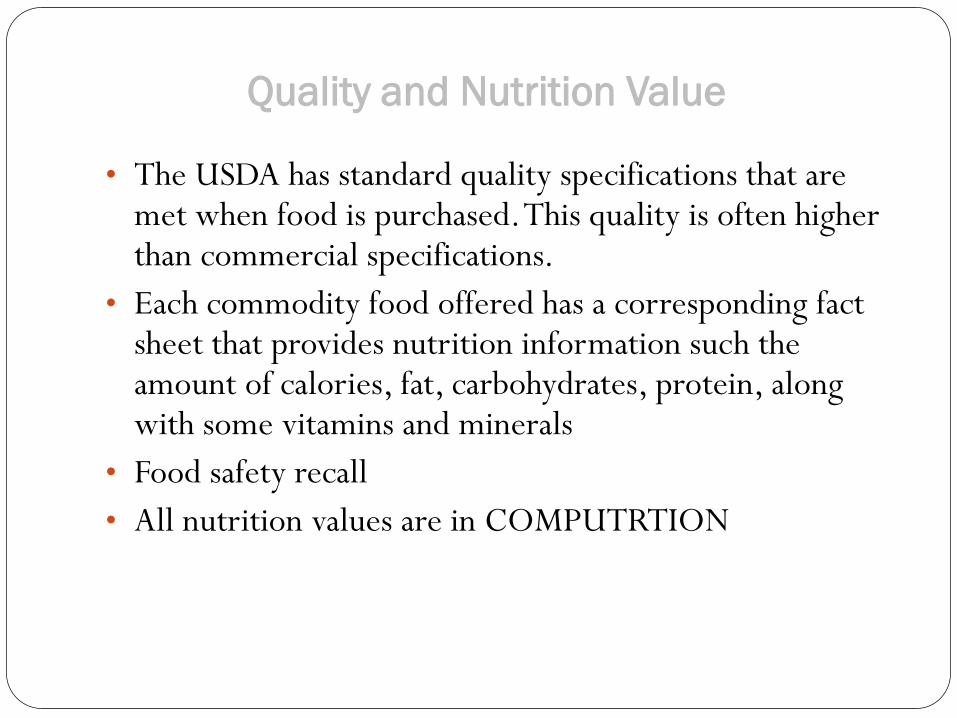
Quality and Nutrition Value
• The USDA has standard quality specifications that are met when food is purchased. This quality is often higher than commercial specifications.
• Each commodity food offered has a corresponding fact sheet that provides nutrition information such the amount of calories, fat, carbohydrates, protein, along with some vitamins and minerals
• Food safety recall
• All nutrition values are in COMPUTRTION
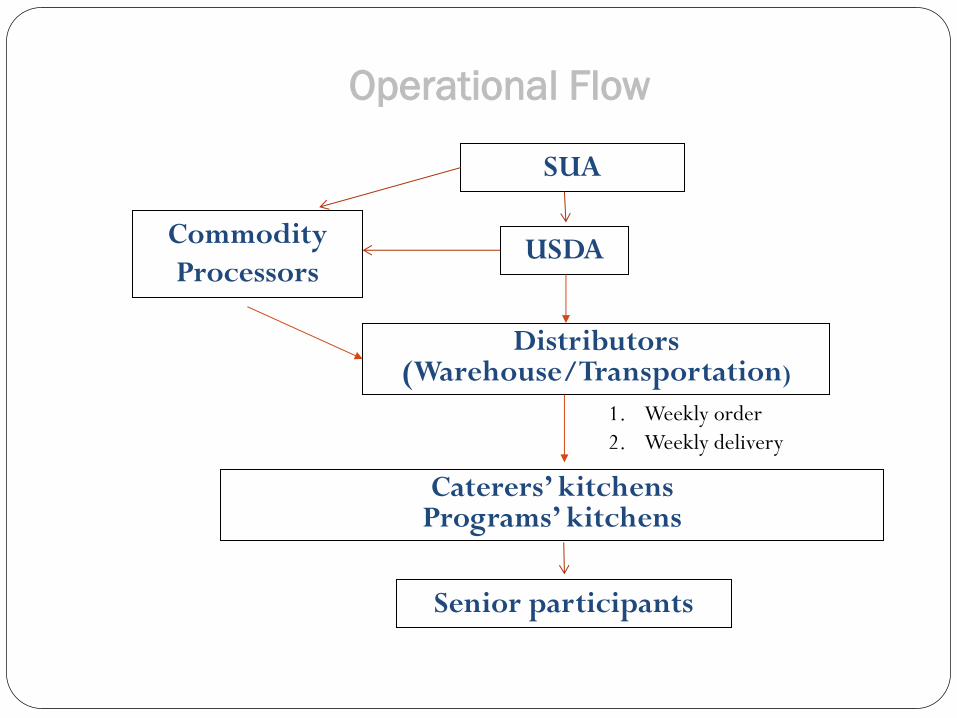
Operational Flow
SUA
Commodity
Processors
Caterers’ kitchens Programs’ kitchens
Senior participants
USDA
Distributors (Warehouse/Transportation)
1. Weekly order
2. Weekly delivery
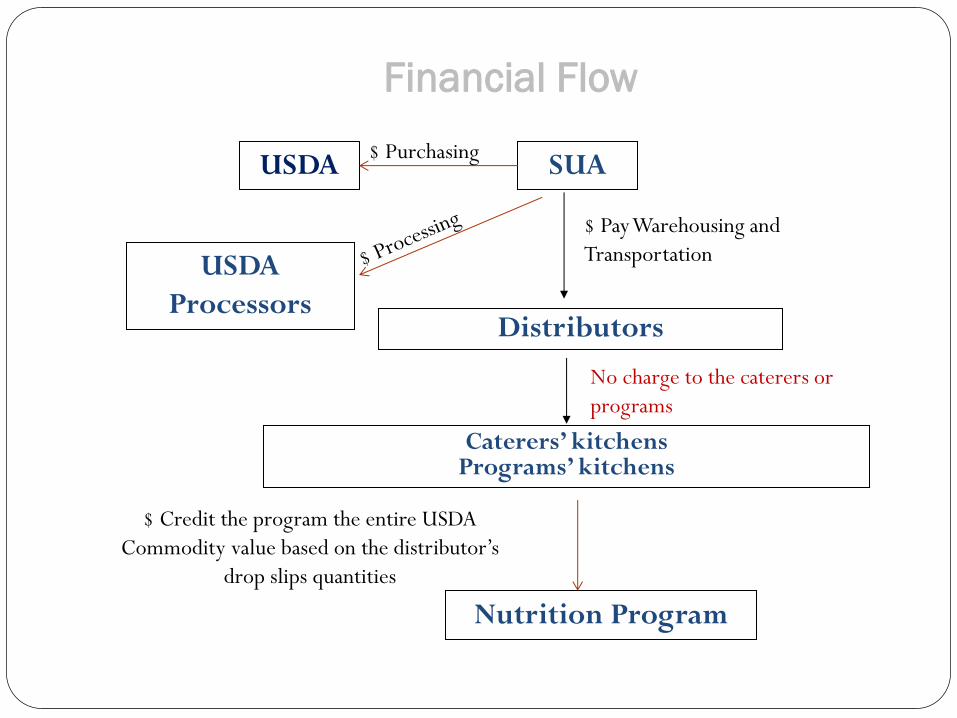
Financial Flow
SUA
USDA
Processors
Caterers’ kitchens Programs’ kitchens
Nutrition Program
Distributors
$ Pay Warehousing and
Transportation
No charge to the caterers or
programs
$ Credit the program the entire USDA
Commodity value based on the distributor’s
drop slips quantities
USDA $ Purchasing
Commodity Processing Program
25
• The EOEA intends to award at a minimum, a single
contract award and potentially multiple contract
awards to responsive vendor(s) based on the
evaluation/award criteria.
• The awarded vendor has to be an approved USDA
processor
Awarding Criteria
26
Nutrition value
Taste testing
Pricing
Commitment of pricing for multiple years
References
Delivery
Discounts being offered : i.e., volume, prompt
payment etc.
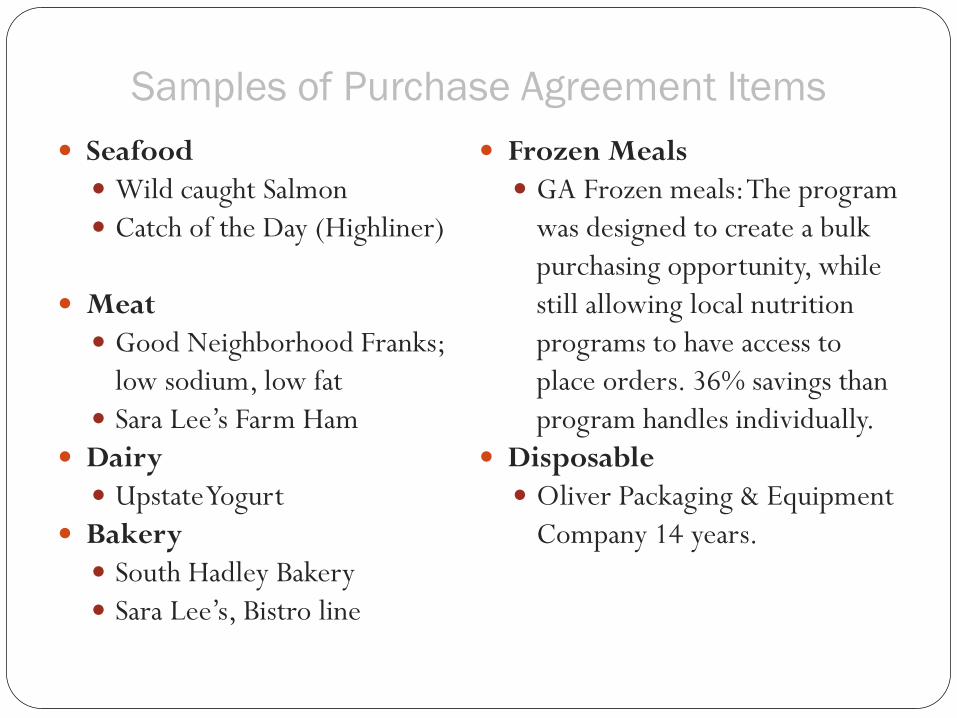
Samples of Purchase Agreement Items
Seafood
Wild caught Salmon
Catch of the Day (Highliner)
Meat
Good Neighborhood Franks;
low sodium, low fat
Sara Lee’s Farm Ham
Dairy
Upstate Yogurt
Bakery
South Hadley Bakery
Sara Lee’s, Bistro line
Frozen Meals
GA Frozen meals: The program
was designed to create a bulk
purchasing opportunity, while
still allowing local nutrition
programs to have access to
place orders. 36% savings than
program handles individually.
Disposable
Oliver Packaging & Equipment
Company 14 years.
Outcome – Nutrition and Food Safety
Food quality and safety (USDA commodity/ processing
products
US grown
Meet nutrition standards
Fully cooked, to avoid cross contamination
Known vendors, easy to trace any food safety issues
Tested and approved by meal participants
Menu analysis
Higher cost items (Roast Pork, Boneless Chicken Breast,
Salmon, and fish Florentine) can be used often as menu items
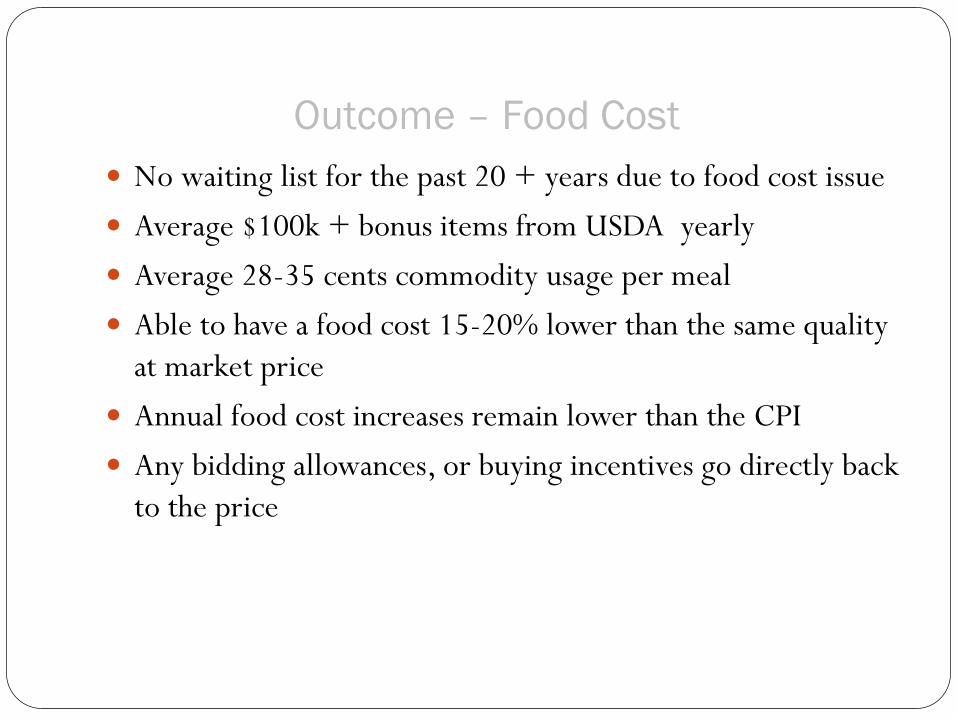
Outcome – Food Cost
No waiting list for the past 20 + years due to food cost issue
Average $100k + bonus items from USDA yearly
Average 28-35 cents commodity usage per meal
Able to have a food cost 15-20% lower than the same quality
at market price
Annual food cost increases remain lower than the CPI
Any bidding allowances, or buying incentives go directly back
to the price
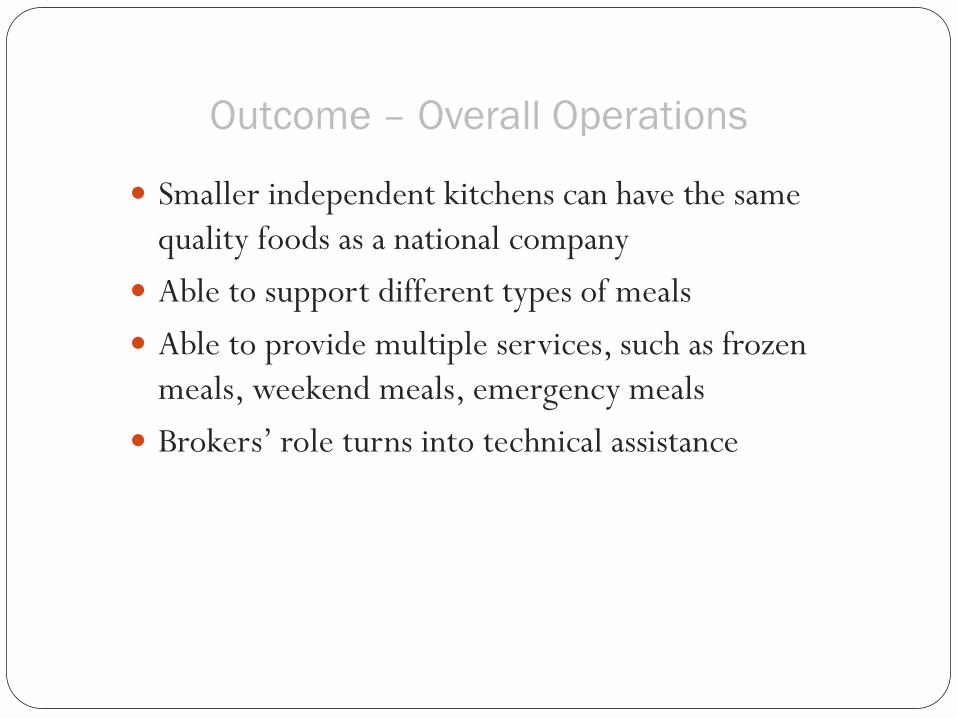
Outcome – Overall Operations
Smaller independent kitchens can have the same
quality foods as a national company
Able to support different types of meals
Able to provide multiple services, such as frozen
meals, weekend meals, emergency meals
Brokers’ role turns into technical assistance

Nutrition/Sanitation Standards,
Menu Policy
COMPUTRITION
Nutrition Education
Caterers’ RFR
Satisfaction Survey
32
Statewide Standardized Policy
Meal Quality, Safety and Nutrition
Standards
Nutrition Standards
Menus must comply with the Elder Affairs Menu Policies and Nutrition Standards
Incorporates Dietary Guidelines for Americans and the Surgeon General’s Report on Nutrition and Health
34
Nutrition Standards
Dietary Guidelines for Americans
Each meal contains at least 1/3 Dietary Reference Intake
(DRI), Institute of Medicine of the National Academy of
Sciences
Calorie range 700-800
Meets clinical "No Added Salt” criteria 3-4 gm Na
Only two higher salt days (entrée >700mg), marked on
menu
Reduced fat content (<35%), no trans-fat

Nutrition Standards
(Menu Pattern)
Complete menu pattern
Meat/Meat Alternative: 2.5 (B) - 3oz (A)
Vegetables/Fruits: 2 servings of 1/2 c each
Bread/Bread Alternative: 1 serving or 1/2 cup
Dessert: 1/2 c (regular or diet)
Milk: 8oz (low fat)
Fruit
Served as dessert at least 3 times a week
Special Focus Nutrients
Protein
Prevent sarcopenia, whole muscle meat at least
twice a week
Vitamin C
Good food source daily
Vitamin A
Good food source 3 times a week
Calcium
Daily 8 oz milk or other source
Signed menu checklist submitted to state 4
weeks in advance
Nutrition Standards
(Matrix)
Chicken minimum 1x a week
Whole muscle meat (A) at least 2x a week
Fruit dessert at least 3x a week
Good food sources of Vitamins A (3x/wk) and C (daily) are
required in the menus
3 fruit desserts a week
Foods high in fiber (high fiber breads)
Menus and signed checklist submitted to the state 4 weeks
in advance
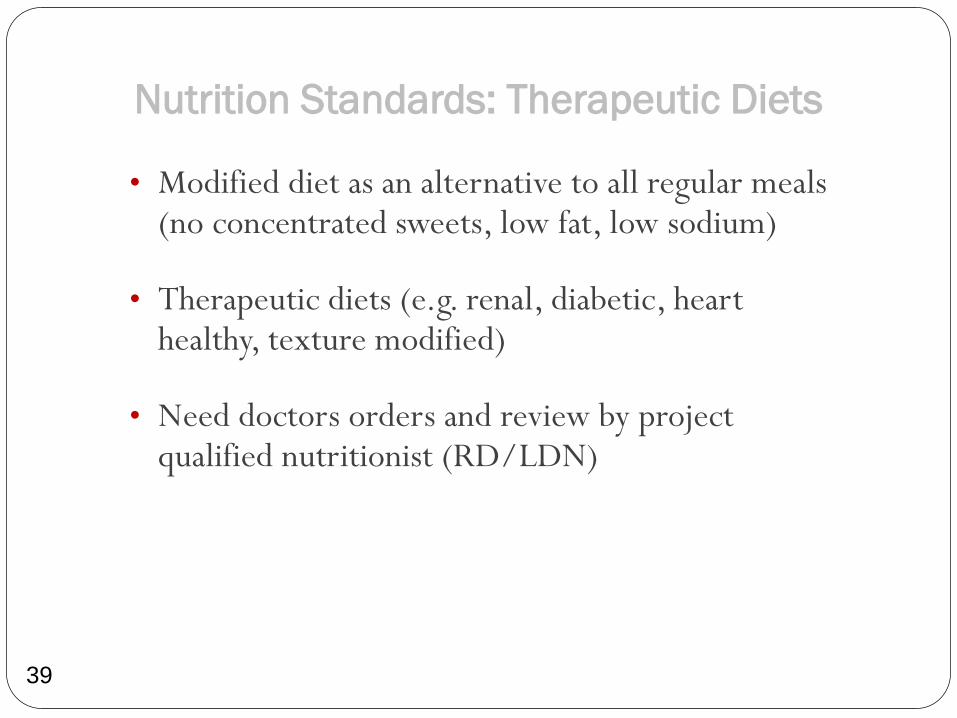
Nutrition Standards: Therapeutic Diets
39
• Modified diet as an alternative to all regular meals (no concentrated sweets, low fat, low sodium)
• Therapeutic diets (e.g. renal, diabetic, heart healthy, texture modified)
• Need doctors orders and review by project qualified nutritionist (RD/LDN)

Therapeutic Meals
Therapeutic meals # Nutrition
projects
Modified meals (2 gm Na, no
concentrated sweets, low fat) 28 (100%)
Cardiac meals 22 (78%)
Renal meals 10 (45%)
Low Lactose 8 (29%)
Ground/Soft 8 (29%)
Puree 3 (11%)

Nutrition Standards: Dietary Preferences
41
Meals reflect preferences of the elderly population within
a program’s service area:
Religious
Ethnic/Cultural
Regional
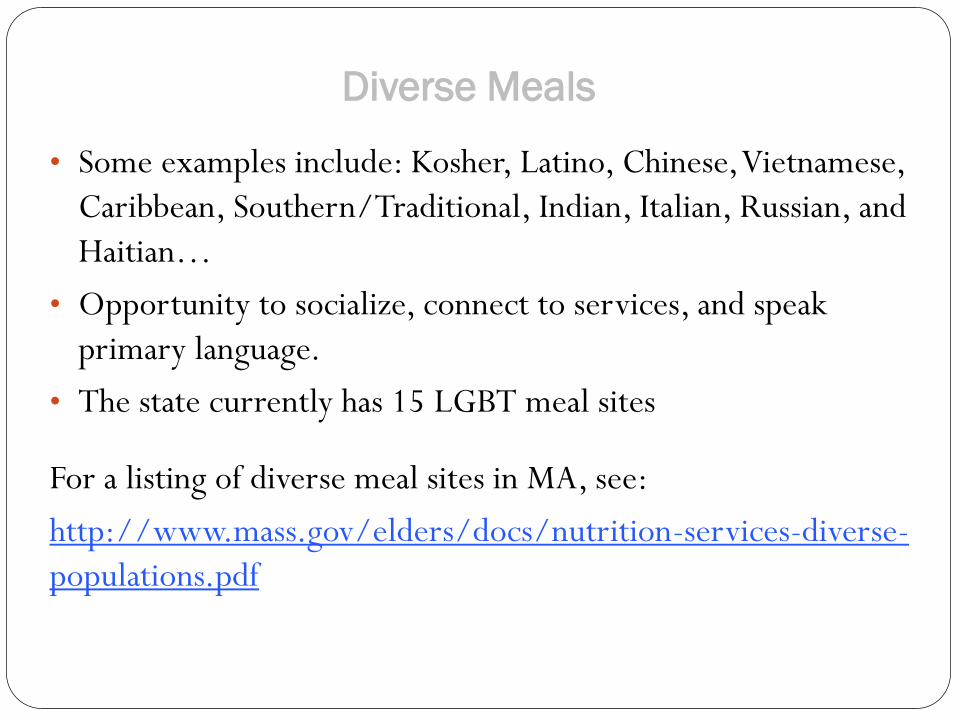
Diverse Meals
• Some examples include: Kosher, Latino, Chinese, Vietnamese,
Caribbean, Southern/Traditional, Indian, Italian, Russian, and
Haitian…
• Opportunity to socialize, connect to services, and speak
primary language.
• The state currently has 15 LGBT meal sites
For a listing of diverse meal sites in MA, see:
http://www.mass.gov/elders/docs/nutrition-services-diverse-
populations.pdf


44
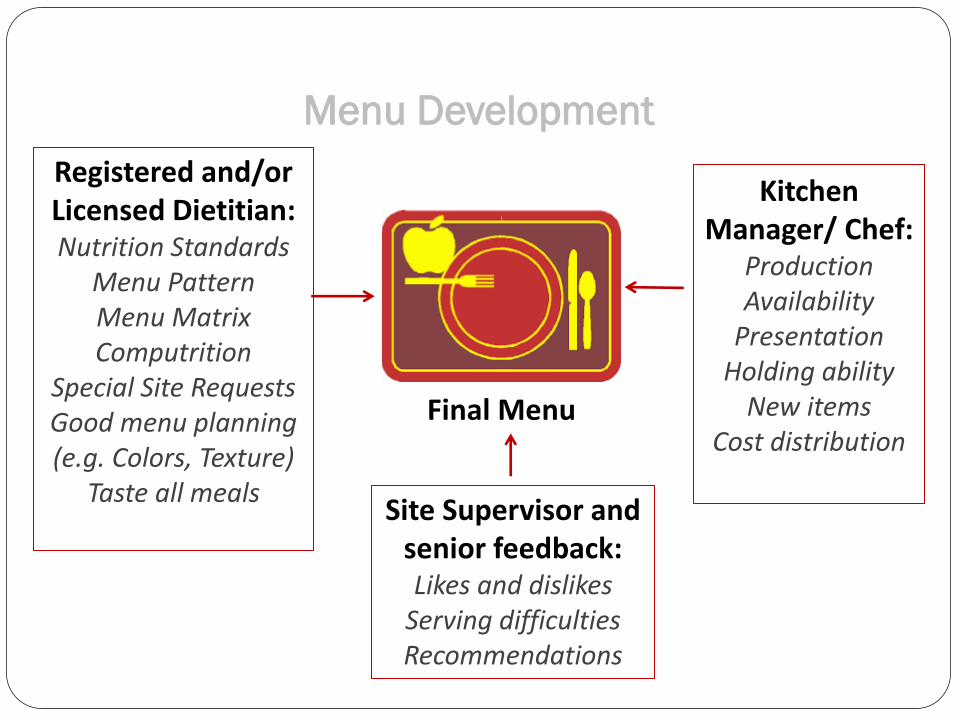
Menu Development
Registered and/or Licensed Dietitian: Nutrition Standards
Menu Pattern Menu Matrix Computrition
Special Site Requests Good menu planning (e.g. Colors, Texture)
Taste all meals
Kitchen Manager/ Chef:
Production Availability
Presentation Holding ability
New items Cost distribution
Site Supervisor and
senior feedback: Likes and dislikes
Serving difficulties Recommendations
Final Menu
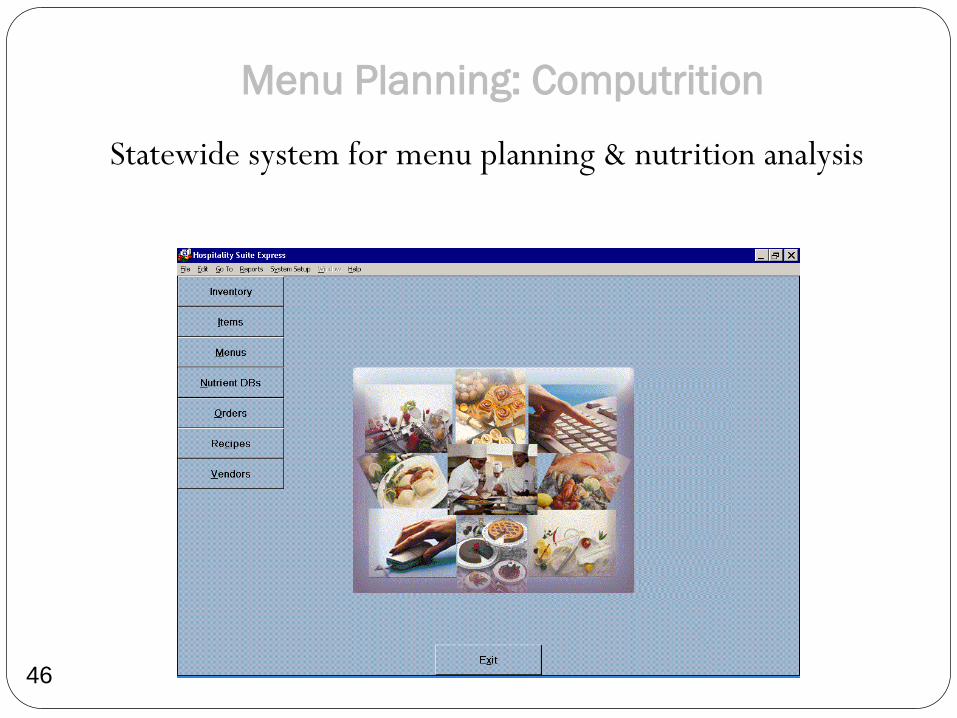
Menu Planning: Computrition
46
Statewide system for menu planning & nutrition analysis
Premier nutrition analysis system used by healthcare
facilities
Used by program dietitians during menu planning to ensure
standards
Built from the ingredients up into recipes
Contains actual products currently in use by kitchens
Uses programs’ actual recipes
Information maintained and reviewed by state
TM
• Statewide reporting (can detect nutrient deficits, research the problem, and create an intervention plan)
• Efficient method of meeting federal and state reporting requirements
• Automated nutrition analysis for recipes & menus
• Can easily adjust menu to meet nutrition standards (e.g. 1/3 DRI)
• Tool for participant’s self-management of healthy eating/lifestyle
• Nutrition information provided directly on client menus
(e.g. calories, sodium)
• Nutrition information can be used for education (e.g.
carbohydrates, calcium)
• Menus posted online
• Used by clients for disease self-management
• Easily shared with physicians and caregivers
• 84% of clients indicated that the nutrition analysis on the
menu has been helpful to them.
TM
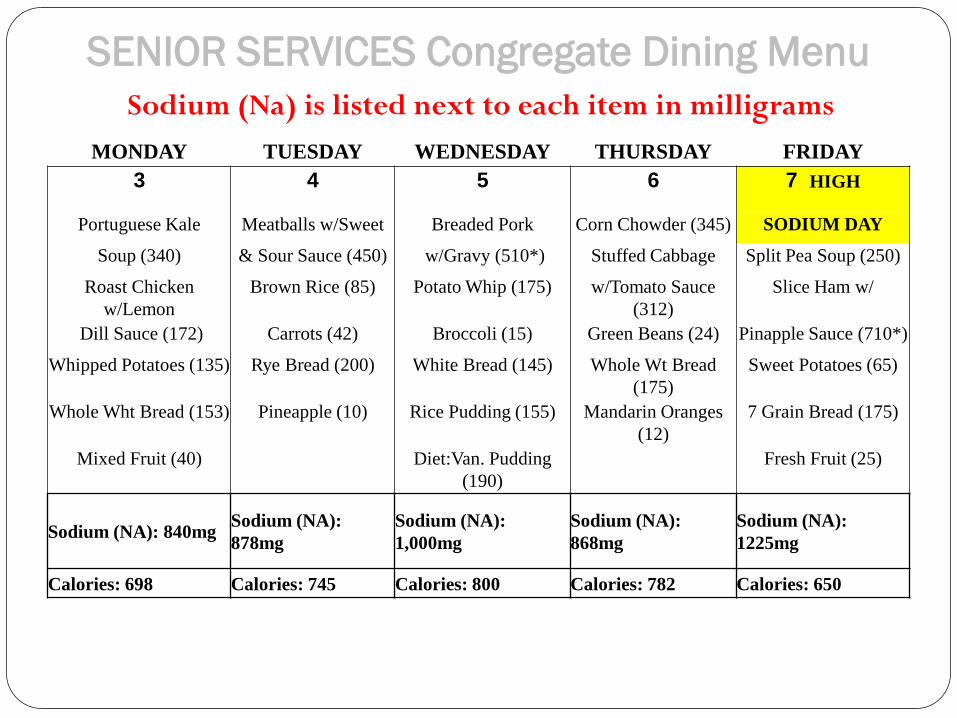
SENIOR SERVICES Congregate Dining Menu
Sodium (Na) is listed next to each item in milligrams
MONDAY TUESDAY WEDNESDAY THURSDAY FRIDAY
3 4 5 6 7 HIGH
Portuguese Kale Meatballs w/Sweet Breaded Pork Corn Chowder (345) SODIUM DAY
Soup (340) & Sour Sauce (450) w/Gravy (510*) Stuffed Cabbage Split Pea Soup (250)
Roast Chicken
w/Lemon
Brown Rice (85) Potato Whip (175) w/Tomato Sauce
(312)
Slice Ham w/
Dill Sauce (172) Carrots (42) Broccoli (15) Green Beans (24) Pinapple Sauce (710*)
Whipped Potatoes (135) Rye Bread (200) White Bread (145) Whole Wt Bread
(175)
Sweet Potatoes (65)
Whole Wht Bread (153) Pineapple (10) Rice Pudding (155) Mandarin Oranges
(12)
7 Grain Bread (175)
Mixed Fruit (40) Diet:Van. Pudding
(190)
Fresh Fruit (25)
Sodium (NA): 840mg Sodium (NA):
878mg
Sodium (NA):
1,000mg
Sodium (NA):
868mg
Sodium (NA):
1225mg
Calories: 698 Calories: 745 Calories: 800 Calories: 782 Calories: 650
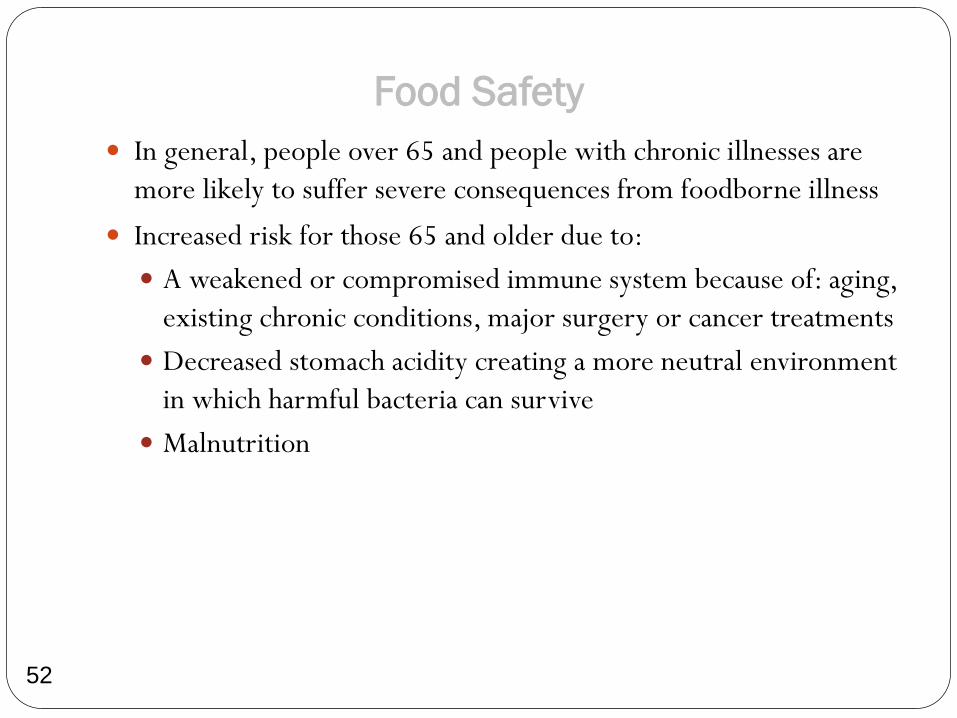
Food Safety
52
In general, people over 65 and people with chronic illnesses are
more likely to suffer severe consequences from foodborne illness
Increased risk for those 65 and older due to:
A weakened or compromised immune system because of: aging,
existing chronic conditions, major surgery or cancer treatments
Decreased stomach acidity creating a more neutral environment
in which harmful bacteria can survive
Malnutrition
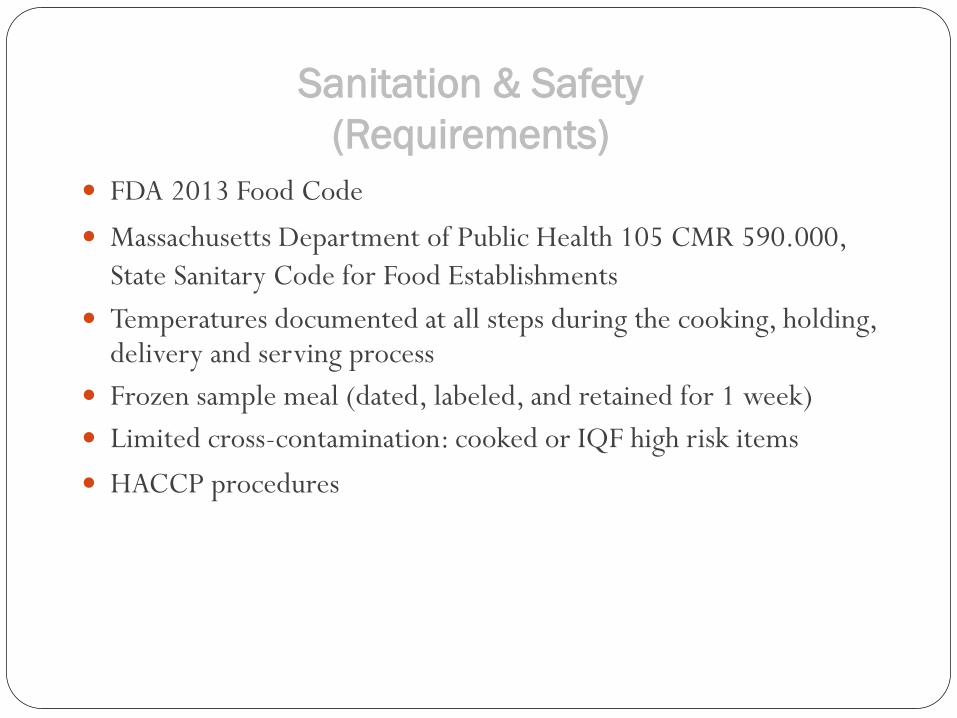
Sanitation & Safety
(Requirements)
FDA 2013 Food Code
Massachusetts Department of Public Health 105 CMR 590.000,
State Sanitary Code for Food Establishments
Temperatures documented at all steps during the cooking, holding, delivery and serving process
Frozen sample meal (dated, labeled, and retained for 1 week)
Limited cross-contamination: cooked or IQF high risk items
HACCP procedures
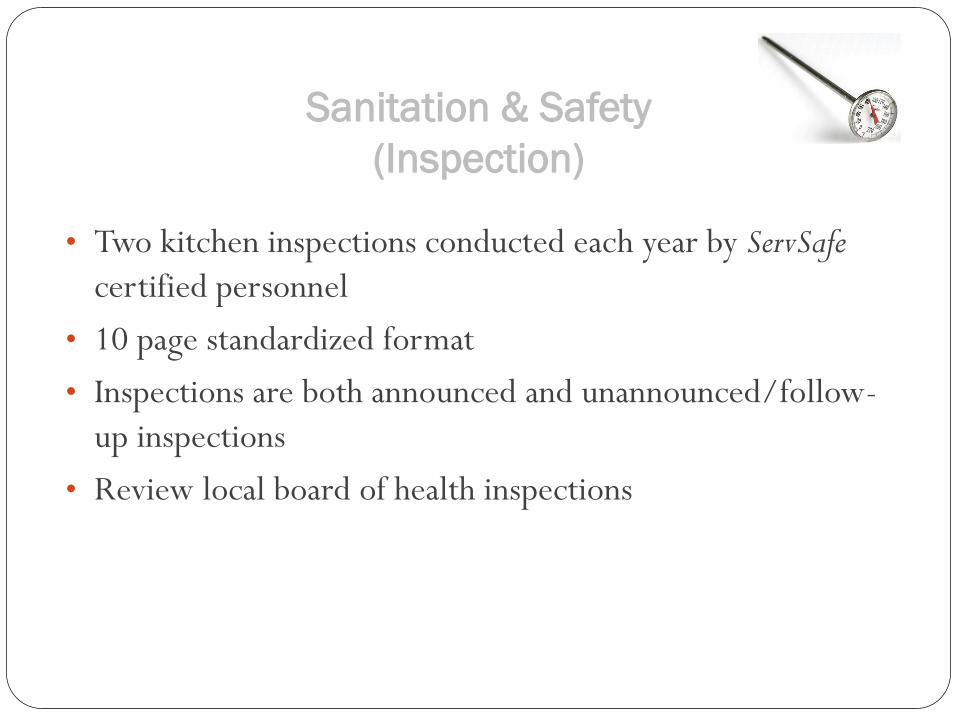
Sanitation & Safety
(Inspection)
• Two kitchen inspections conducted each year by ServSafe
certified personnel
• 10 page standardized format
• Inspections are both announced and unannounced/follow-
up inspections
• Review local board of health inspections

Sanitation & Safety
(Training)
Meal site manager must receive annual food safety training issued by state and must pass examination with a certificate issued by the Secretary.
Collaboration with DPH Food Protection Program
State wide partnership of Food Safety Education
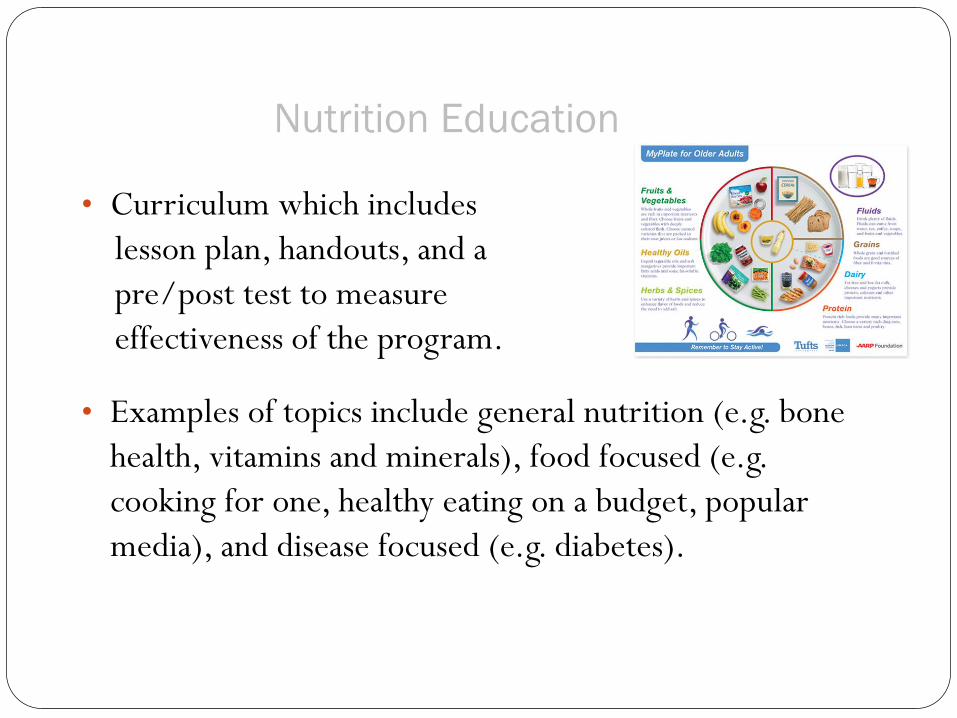
Nutrition Education
• Curriculum which includes
lesson plan, handouts, and a
pre/post test to measure
effectiveness of the program.
• Examples of topics include general nutrition (e.g. bone
health, vitamins and minerals), food focused (e.g.
cooking for one, healthy eating on a budget, popular
media), and disease focused (e.g. diabetes).

Nutrition Education
Follow-up to nutrition education demonstrated that more than half of participating seniors retained the knowledge gained from these sessions many months after the program.
Nutrition information is also provided to homebound elders through
backs of home delivered meals menus
newsletters
cable public access television
Evidence Based/Evidence Informed Programs
The Healthy Living Center of Excellence (HLCE)
Food Dollar$ program – Healthy Eating on a Budget for
Adults 50 and Older
My Life My Health: The Chronic Disease Self
Management Program -An Evidence-based Patient
Focused Program
A Matter of Balance: Managing Concerns About Falls
Healthy Eating Successful Aging – Hebrew Senior Life

Standard Bid Specifications
(Food Service Vendor’s RFR)
GOALS: • To help both the caterers and the nutrition programs
comply to the same standards and guidelines
• To help the nutrition program choose the best value
providers
• To protect the nutrition programs from all potential
legal and operational issues.
• To help the caterers present informative proposals
• To maintain a healthy caterers pool
• Competitive bidding

Standard Bid Specification
Evaluation Criteria
Termination Procedure
Payment Schedule
Contract Duration
Kitchen Audit from 3rd party –Safe maximum
production load. (Menus, Production schedule, type of
business, capacity)
Group Purchasing Agreement
NSIP Commodity Program
Food Service Vendor’s Proposal
Vehicle Information
Location of Food Preparation site (60 miles)
Equipment and Supply (who owns them)
Number of Meals (what is included, what is not
included)
Meal Cost Analysis Base cost
Sliding scale
Menu analysis –cost, standards, purchasing power
Kitchen Audit Report
Financial Statement

Annual Caterer’s Forum
The Forum sponsored by the SUA, AAA nutrition programs, and
MA Restaurant Assn. actively seeking motivated companies with
high quality products and innovative services.
Emphasize benefits of the contract : guaranteed customer counts
calculated profit margin
standard menu pattern
controlled food cost
marketing potential and growing market business
The Forum provided an overview of the MA Elderly Nutrition
Program, nutrition and sanitation standards, RFR , how to prepare
a bid and presentations from programs accepting bidders.
To maintain a healthy vendors’ pool
Statewide QA (Satisfaction) Survey/
Program impact
• Standardized survey of satisfaction and outcomes
• In FY 15, over 10,500 participants returned the
anonymous survey.
• Almost 80% rated highest satisfaction with variety,
taste, appearance, and how meals were cooked.

Sample Survey Form
64
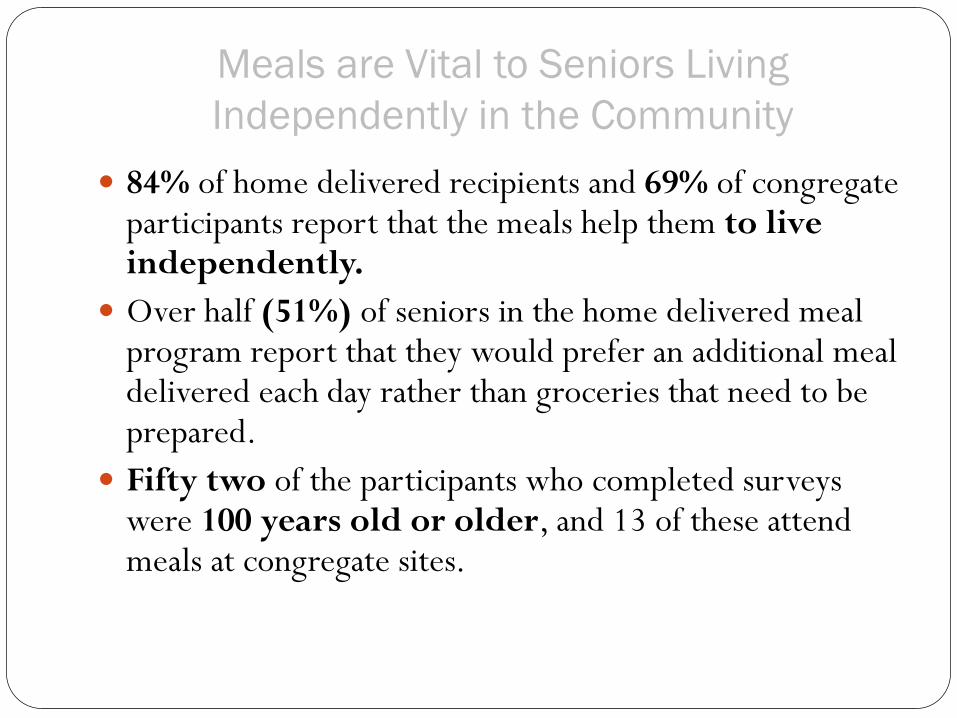
Meals are Vital to Seniors Living
Independently in the Community
84% of home delivered recipients and 69% of congregate participants report that the meals help them to live independently.
Over half (51%) of seniors in the home delivered meal program report that they would prefer an additional meal delivered each day rather than groceries that need to be prepared.
Fifty two of the participants who completed surveys were 100 years old or older, and 13 of these attend meals at congregate sites.

The Program is Important for the Food Security
of Many Seniors.
Over one-third (37%) of home delivered meal
recipients report that they would have a shortage of
food in the house if it weren’t for the program, a 9%
increase from 2014.
Approximately 84% of congregate participants said that
the meal helps them to save money on food. This
demonstrates that program participants recognize the
value of the meals.

Evidence Indicates that Nutrition Plays a
Critical Role in the Health of Seniors
71% of homebound respondents reported that the meal
was their main meal of the day.
Even though meals are only required to contain 1/3 of
the Dietary Reference Intake (DRI) for older adults*,
85% of meal recipients responded that meals contribute
to more than 1/3 of total daily intake, with 26%
reporting that meals contribute to more than ½ of daily
intake.
*Statewide nutrition analyses demonstrated that meals provide on average approximately 40% of estimated daily needs for calories, 100% of
protein, 800 mg of sodium, and 100% of the DRI for 16 other nutrients including fiber, vitamins and minerals.
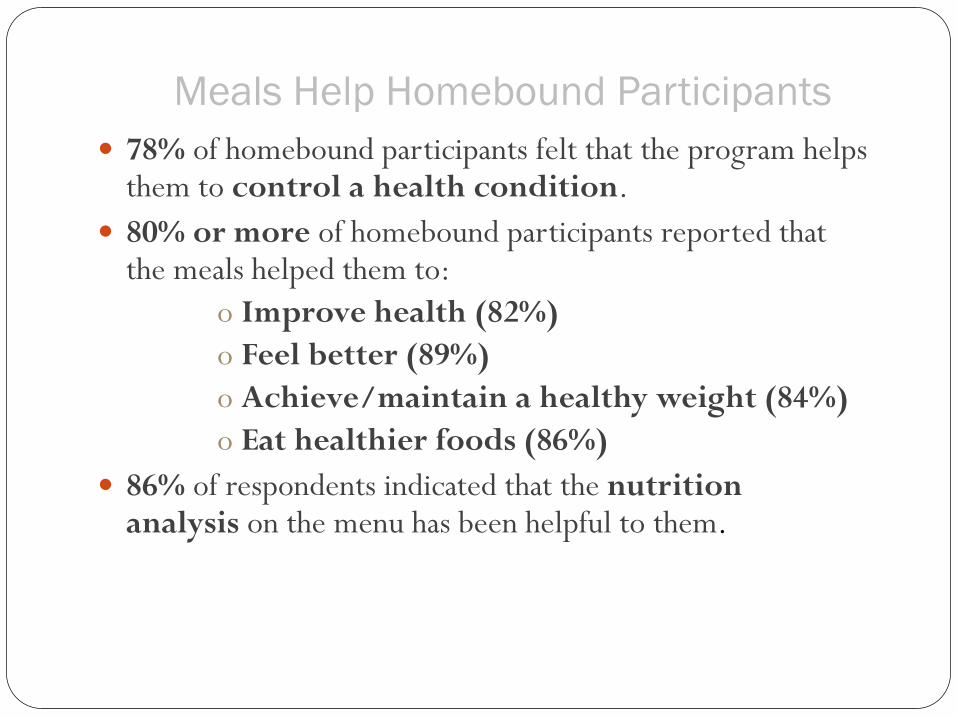
Meals Help Homebound Participants
78% of homebound participants felt that the program helps them to control a health condition.
80% or more of homebound participants reported that the meals helped them to:
o Improve health (82%)
o Feel better (89%)
o Achieve/maintain a healthy weight (84%)
o Eat healthier foods (86%)
86% of respondents indicated that the nutrition analysis on the menu has been helpful to them.
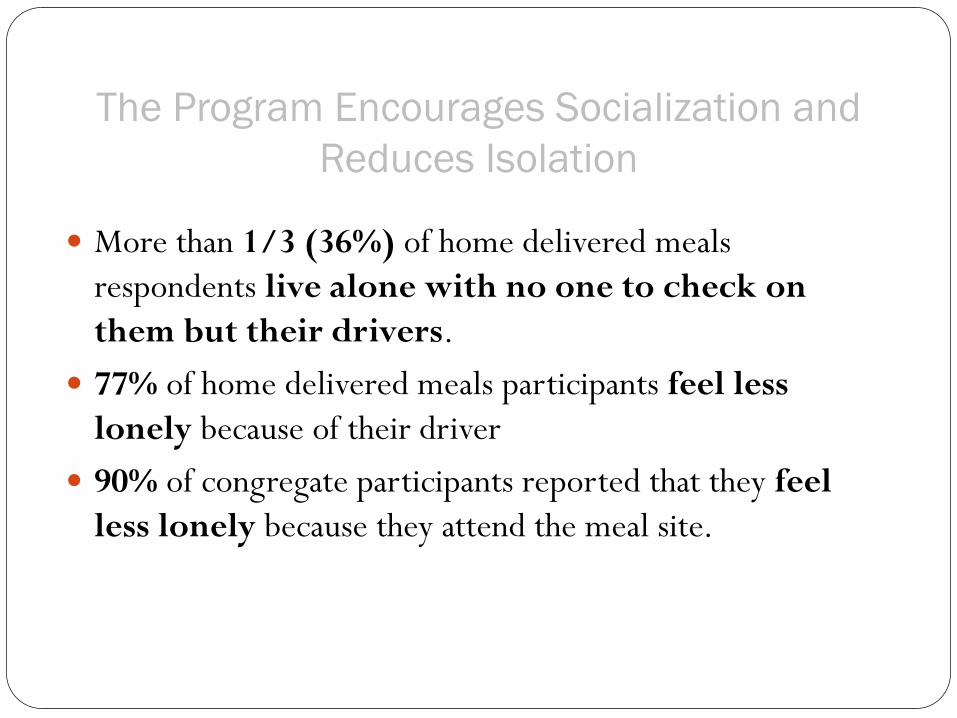
The Program Encourages Socialization and
Reduces Isolation
More than 1/3 (36%) of home delivered meals
respondents live alone with no one to check on
them but their drivers.
77% of home delivered meals participants feel less
lonely because of their driver
90% of congregate participants reported that they feel
less lonely because they attend the meal site.

Future

Challenges for the Future
• Demographic changes (aging baby boomers)
• Policy Environment (LTSS, HCBS)
• The Continued Services Model (transitional care)
• Demographic needs (no more one size fits all)
• Life style changes.
• Cultural diversity
• Under 60 disabled population
• Malnutrition and food insecurity
• Boomer Health/Nutrition needs (supplements, fitness center,
internet nutrition information, and comprehensive health care
coverage)