characteristics of business owners - census.gov · characteristics of business owners ... was...
TRANSCRIPT

EconomicCensusCBO92-1
Characteristicsof BusinessOwners
U.S. Department of CommerceEconomics and Statistics AdministrationBUREAU OF THE CENSUS

Many persons participated in conducting the 1992 Characteristics of Business Owners Survey.Primary direction was performed by Frederick T. Knickerbocker, Associate Director for EconomicPrograms; and Thomas L. Mesenbourg, Assistant Director for Economic Programs.
This report was prepared in the Agriculture and Financial Statistics Division (AGFS) under thegeneral direction of Dr. Ewen Wilson; Chief, and Ruth A. Runyan, Assistant Division Chief forFinancial Statistics.
The overall project development and planning of this report were under the direction of Eddie J.Salyers, Chief, Company Statistics Branch. Mary G. Frauenfelder directed and implementedplanning procedures, specification development, data collection, editing, and compilation of thisreport. Staff assistance was provided by Melody Atkinson, Ahmad Bakhshi, Dave Cooper, ElaineEmanuel, Barbara Esworthy, Durwin Knutson, Sungsoo Oh, and Valerie Strang.
Development and implementation of the statistical methodology were performed under the generalsupervision of Ruth Detlefsen, Assistant Division Chief for Research and Methodology. Direction inthose areas was provided by Carol Caldwell, Chief, Frame Research and Development Branch.Richard A. Moore, preceded by David Raglin, was assigned primary responsibility for sampledesign, imputation and estimation. Keying procedures were developed by Charles Fowler andBenjamin Stephens of the Mailout and Data Capture Branch, Economic Planning and CoordinationDivision.
Computer programs were developed in the Economic Statistical Methods and ProgrammingDivision under the general supervision of Charles P. Pautler, Jr., Chief; and Martin S. Harahush,Assistant Division Chief for Quinquennial Programs, with assistance from Steven G. McCraith,Chief, Quinquennial Surveys Branch; and Gary Sweetland, Chief, Mailout and Data CollectionBranch. Daniel A. Vacca was assigned primary programming responsibility with assistance from EdCarr, Diane Conley, Thaddeus S. Hess, Stephen D. Jarvis, Robert S. Jewett, John E.McCormick, Hoa Nyugen, Robert A. Penrod, and Jerry Richards. Programming for computer-assisted telephone interviewing was developed by Frank Lee of the Technologies ManagementOffice.
The staff of the Technical Services Division, Teresa Angueira, Chief, captured the response dataelectronically using a Film Optical Sensing Device for Input to Computer (FOSDIC) operation and anOptimum Solutions Corporation Imaging System.
The staff of the Administrative and Customer Services Division, Walter C. Odom, Chief,performed publication planning, design, composition, editorial review, and procurement for publica-tions. Frances B. Scott provided publication coordination and editing. Evelyn Fedorko and ShirleyBoswell were responsible for design and procurement of the report forms, respectively.
Mailout preparation and receipt operations, clerical activities, and data keying were performed bythe staff of the Data Preparation Division, Judith N. Petty, Chief.
Computer processing was performed in the Computer Services Division, Debra D. Williams,Chief.
Photocomposition programs for the statistical tables were developed in the Systems SupportDivision, Richard W. Swartz, Chief.
The overall planning and review of the census operations were performed by the staff of the officeof the Assistant Director for Economic and Agriculture Censuses.
This survey was funded by the Minority Business Development Agency (MBDA) and the SmallBusiness Administration (SBA). Richard L. Stevens of Advocacy, Research and Information atMBDA and Bruce Phillips of the Office of Advocacy at SBA served as liaisons for these agencies.
Special acknowledgment is also due to the many business owners whose cooperation hascontributed to the publication of these data.
Acknowledgments

EconomicCensus
CBO92-1
Characteristicsof Business
Owners
U.S. Department of CommerceWilliam M. Daley, Secretary
Economics and Statistics AdministrationLee Price, Acting Under Secretary
for Economic Affairs
BUREAU OF THE CENSUSMartha Farnsworth Riche, Director
Issued September 1997

AGRICULTURE AND FINANCIAL STATISTICSDIVISIONEwen M. Wilson , Chief
BUREAU OF THE CENSUSMartha Farnsworth Riche , DirectorBradford R. Huther , Deputy Director
Paula J. Schneider , Principal AssociateDirector for ProgramsFrederick T. Knickerbocker , AssociateDirector for Economic ProgramsThomas L. Mesenbourg , Assistant Directorfor Economic Programs
ECONOMIC PLANNING AND COORDINATIONDIVISIONJohn P. Govoni , Chief
ECONOMICS
AND STATISTICS
ADMINISTRATION
Economics and StatisticsAdministrationLee Price , Acting Under Secretaryfor Economic Affairs

Introduction tothe Economic Census
PURPOSES AND USES OF THE ECONOMICCENSUS
The economic census is the major source of facts aboutthe structure and functioning of the Nation’s economy. Itprovides essential information for government, business,industry, and the general public.
The economic census furnishes an important part of theframework for such composite measures as the grossdomestic product, input/output measures, production andprice indexes, and other statistical series that measureshort-term changes in economic conditions.
Policymaking agencies of the Federal Government usethe data, especially in monitoring economic activity andproviding assistance to business.
State and local governments use the data to assessbusiness activities and tax bases within their jurisdictionsand to develop programs to attract business.
Trade associations study trends in their own and com-peting industries and keep their members informed ofmarket changes.
Individual businesses use the data to locate potentialmarkets and to analyze their own production and salesperformance relative to industry or area averages.
AUTHORITY AND SCOPE
Title 13 of the United States Code (sections 131, 191,and 224) directs the Census Bureau to take the economiccensus every 5 years, covering years ending in 2 and 7.The 1992 Economic Census consists of the following eightcensuses:
x Census of Retail Trade
x Census of Wholesale Trade
x Census of Service Industries
x Census of Financial, Insurance, and Real EstateIndustries
x Census of Transportation, Communications, and Utilities
x Census of Manufactures
x Census of Mineral Industries
x Census of Construction Industries
Special programs also cover enterprise statistics andminority-owned and women-owned businesses. (The 1992Census of Agriculture and 1992 Census of Governmentsare conducted separately.) The next economic census isscheduled to be taken in 1998 covering the year 1997.
AVAILABILITY OF THE DATA
The results of the economic census are available inprinted reports for sale by the U.S. Government PrintingOffice and on compact discs for sale by the CensusBureau. Order forms for all types of products are availableon request from Customer Services, Bureau of the Census,Washington, DC 20233-1900. Amore complete descriptionof publications being issued from this census is on theinside back cover of this document.
Census facts are also widely disseminated by tradeassociations, business journals, and newspapers. Volumescontaining census statistics are available in most majorpublic and college libraries. Finally, State data centers inevery State as well as business and industry data centersin many States also supply economic census statistics.
WHAT’S NEW IN 1992
The 1992 Economic Census covers more of the economythan any previous census. New for 1992 are data oncommunications, utilities, financial, insurance, and realestate, as well as coverage of more transportation indus-tries. The economic, agriculture, and governments cen-suses now collectively cover nearly 98 percent of alleconomic activity.
Among other changes, new 1992 definitions affect theboundaries of about a third of all metropolitan areas. Also,the Survey of Women-Owned Businesses has now beenexpanded to include all corporations.
HISTORICAL INFORMATION
The economic census has been taken as an integratedprogram at 5-year intervals since 1967 and before that for1963, 1958, and 1954. Prior to that time, the individualsubcomponents of the economic census were taken sepa-rately at varying intervals.
The economic census traces its beginnings to the 1810Decennial Census, when questions on manufacturing wereincluded with those for population. Coverage of economic
INTRODUCTION III1992 ECONOMIC CENSUS

activities was expanded for 1840 and subsequent cen-suses to include mining and some commercial activities. In1902, Congress established a permanent Census Bureauand directed that a census of manufactures be taken every5 years. The 1905 Manufactures Census was the first timea census was taken apart from the regular every-10-yearpopulation census.
The first census of business was taken in 1930, covering1929. Initially it covered retail and wholesale trade andconstruction industries, but it was broadened in 1933 toinclude some of the service trades.
The 1954 Economic Census was the first census to befully integrated—providing comparable census data acrosseconomic sectors, using consistent time periods, concepts,definitions, classifications, and reporting units. It was thefirst census to be taken by mail, using lists of firms providedby the administrative records of other Federal agencies.Since 1963, administrative records also have been used toprovide basic statistics for very small firms, reducing oreliminating the need to send them census questionnaires.The Enterprise Statistics Program, which publishes com-bined data from the economic census, was made possiblewith the implementation of the integrated census programin 1954.
The range of industries covered in the economic cen-suses has continued to expand. The census of constructionindustries began on a regular basis in 1967, and the scopeof service industries was broadened in 1967, 1977, and1987. The census of transportation began in 1963 as a setof surveys covering travel, transportation of commodities,and trucks, but expanded in 1987 to cover businessestablishments in several transportation industries. For1992, these statistics are incorporated into a broadenedcensus of transportation, communications, and utilities.Also new for 1992 is the census of financial, insurance, andreal estate industries. This is part of a gradual expansion incoverage of industries previously subjected to governmentregulation.
The Survey of Minority-Owned Business Enterpriseswas first conducted as a special project in 1969 and wasincorporated into the economic census in 1972 along withthe Survey of Women-Owned Businesses.
An economic census has also been taken in Puerto Ricosince 1909, in the Virgin Islands of the United States andGuam since 1958, and in the Commonwealth of theNorthern Mariana Islands since 1982.
Statistical reports from the 1987 and earlier censusesprovide historical figures for the study of long-term timeseries and are available in some large libraries. All of thecensus data published since 1967 are still available for saleon microfiche from the Census Bureau.
AVAILABILITY OF MORE FREQUENT ECONOMICDATA
While the census provides complete enumerations every5 years, there are many needs for more frequent data aswell. The Census Bureau conducts a number of monthly,quarterly, and annual surveys, with the results appearing inpublication series such as Current Business Reports (retailand wholesale trade and service industries), the AnnualSurvey of Manufactures, Current Industrial Reports, andthe Quarterly Financial Report. Most of these surveys,while providing more frequent observations, yield lesskind-of-business and geographic detail than the census.The County Business Patterns program offers annualstatistics on the number of establishments, employment,and payroll classified by industry within each county.
SOURCES FOR MORE INFORMATIONMore information about the scope, coverage, classifica-
tion system, data items, and publications for each of theeconomic censuses and related surveys is published in theGuide to the 1992 Economic Census and Related Statis-tics. More information on the methodology, procedures,and history of the census will be published in the History ofthe 1992 Economic Census. Contact Customer Servicesfor information on availability.
IV INTRODUCTION 1992 ECONOMIC CENSUS

Characteristics of Business Owners
GENERAL
The Characteristics of Business Owners (CBO) Surveyprovides basic economic, demographic, and sociologicaldata on the characteristics of minority, women, and non-minority male business owners and their business activi-ties. The data were collected through a statistically chosenmail sample survey and were combined with administrativerecords data, which were originally obtained for use in the1992 Economic Census. The data from this sample surveyare intended to augment data published in the 1992Economic Census reports: Survey of Minority-Owned Busi-ness Enterprises (SMOBE), MB92-1, -2, -3, and -4, andSurvey of Women-Owned Businesses (WOB), WB92-1,which are limited to number of firms, employment, annualpayroll, and gross receipts. The CBO publication presentsthe traits of owners and firms by industry division, size offirm, and legal form of organization.
CENSUS DISCLOSURE RULES
The Bureau of the Census is prohibited by law frompublishing any statistics that disclose information reportedby individual companies or their establishments. Publishingthe number of firms is not considered a disclosure by theBureau of the Census rules. Therefore, these data areshown, even when other data must be withheld. Theinformation and data obtained from the Internal RevenueService (IRS), the Social Security Administration (SSA),and other sources are also treated as confidential and canbe seen only by Bureau of the Census employees sworn toprotect it from unwarranted disclosure.
SURVEY METHODOLOGY
The data in this report were developed by collectinginformation through a mail sample survey and matching itto data compiled for SMOBE and WOB. (See appendix Bfor SMOBE and WOB methodology). Any business whichfiled an IRS form 1040, Schedule C (individual proprietor-ship or self-employed person); form 1065 (partnership); orform 1120S (subchapter S corporation) in 1992 is includedin the survey universe. A subchapter S corporation is aspecial IRS designation for legally incorporated businesseswith 35 or fewer shareholders who, because of tax advan-tages, elect to be taxed as individual shareholders ratherthan as corporations. For businesses filing those forms, theIRS provided the Census Bureau with the following infor-mation:
x Name and address of the firm
x Employer identification number of the firm
x Social Security numbers (SSN’s) of the owners for filersof Form 1040, Schedule C
x Principal industrial activity code (see COMPARABILITYOF 1987 AND 1992 DATA)
x Dollar receipts
x Legal form of organization
The following information was obtained for each firmfrom the Census Bureau’s 1992 Economic Census files,including SMOBE and WOB:
x Standard industrial classification (SIC) code (see INDUS-TRY CLASSIFICATIONS.)
x Geographic code
x Legal form of organization code
x Number of employees, annual payroll, and receipts forfirms with paid employees
x Number of business owners, partners or shareholders
x Race, ethnicity, and gender for the majority of the firm’sowners
The 1992 CBO survey used five sampling frames basedon the classification of the firm in the SMOBE/WOB: 1)Hispanic; 2) Black; 3) Other minority (Asians and PacificIslanders, American Indians, and AlaskaNatives); 4)Women;and 5) Nonminority male. Each business was eligible forsampling from exactly one CBO frame, to which they wereassigned in the following order of precedence: Hispanic,other minority, Black, women, and nonminority male. Fortabulation purposes, women-owned businesses sampledin the Hispanic, other minority, or Black frames were usedto produce the estimates for women-owned businesses.
The five frames were stratified by state, industry divi-sion, and receipts size class before sample selection. Thetotal sample size was 116,557 owners, approximatelyevenly distributed among the five sampling frames.
Owners of Individual Proprietorships andSelf-Employed Persons (Filers of 1992 Form1040, Schedule C )
Each sole proprietor selected from the CBO sample wasmailed a Form CBO-1, subtitled ‘‘Sole Proprietorship.’’ This
CHARACTERISTICS OF BUSINESS OWNERS V1992 ECONOMIC CENSUS
report asked the owner and business characteristics of asole proprietor or self-employed person. The Form CBO-1questionnaire is shown in appendix C.
Owners of Partnerships and Subchapter SCorporations (Recipients of either 1992 Form1065 or 1120S)
Each partnership or subchapter S corporation selectedin the CBO sample was mailed a Form CBO-2, subtitled‘‘Partnership or Subchapter S Corporation - BusinessCharacteristics.’’ This report asked the business character-istics of a partnership or subchapter S corporation. TheForm CBO-2 questionnaire is shown in appendix C.
Based on the number of business owners stated in itsSMOBE/WOB survey response, up to ten CBO-3 question-naires were included with each CBO-2 form mailed. FormCBO-3, subtitled ‘‘Partnership or Subchapter S Corpora-tion - Owner Characteristics’’ asks the owner characteris-tics of a partner or shareholder. It was respectively theresponsibility of each partnership or subchapter S corpo-ration to distribute the CBO-3 questionnaires to its 1992partners or shareholders. The Form CBO-3 questionnaireis shown in appendix C.
RELIABILITY OF ESTIMATES
The figures shown in this report are, in part, estimatedfrom a sample and will differ from the figures which wouldhave been obtained from a complete census. Two types ofpossible errors are associated with estimates based ondata from sample surveys: sampling errors and nonsam-pling errors. The accuracy of a survey result depends notonly on the sampling errors and nonsampling errors mea-sured, but also on the nonsampling errors not explicitlymeasured. For particular estimates, the total error mayconsiderably exceed the measured errors. The following isa description of the sampling and nonsampling errorsassociated with the 1992 CBO.
Sampling variability. The particular sample used for thissurvey is one of a large number of all possible samples ofthe same size that could have been selected using thesame sample design. The estimates derived from thedifferent samples would differ from each other. The relativestandard error is a measure of the variability among theestimates from all possible samples. The estimated relativestandard errors presented in the tables estimate the sam-pling variability, and thus measure the precision with whichan estimate from the particular sample selected for thissurvey approximates the average result of all possiblesamples. Relative standard errors are applicable only tothose published cells in which sample cases are tabulated.A relative standard error is an expression of the standarderror as a percent of the quantity being estimated.
The sample estimate and an estimate of its relativestandard error can be used to estimate the standard errorand then construct interval estimates with a prescribed
level of confidence that the interval includes the averageresults of all samples. To illustrate, if all possible sampleswere surveyed under essentially the same condition, andcalculated from each sample, then:
1. Approximately 68 percent of the intervals from onestandard error below the estimate to one standarderror above the estimate would include the averagevalue of all possible samples.
2. Approximately 90 percent of the intervals from 1.6standard errors below the estimate to 1.6 standarderrors above the estimate would include the averagevalue of all possible samples.
Thus, for a particular sample, one can say with specifiedconfidence that the average of all possible samples isincluded in the specified interval.
Nonsampling errors. All surveys and censuses aresubject to nonsampling errors. Nonsampling errors areattributable to many sources: inability to obtain informationfor all cases in the universe, imputation for missing data,data errors and biases, mistakes in recording or keyingdata, errors in collection or processing, and coverageproblems.
Explicit measures of the effects of these nonsamplingerrors are not available. However, it is believed that most ofthe important operational and data errors were detectedand corrected through an automated data edit designed toreview the data for reasonableness and consistency. Qual-ity control techniques were used to verify that operatingprocedures were carried out as specified.
Approximately 62 percent of the 78,134 firm question-naires (Forms CBO-1 and CBO-2), and approximately 59percent of the 116,557 owner questionnaires (Forms CBO-1and CBO-3) were returned. Responding questionnaireswere reweighted to compensate for those that were notreturned. This procedure takes into account the samplingframe, industry division, legal form of organization, andreceipts size class. It also assumes that nonrespondents ineach of the categories possess the same characteristics asthe respondents. Since this is never exactly true, nonre-spondents with certain characteristics (e.g., deceased, notable to be located) are disproportionately underrepre-sented in the estimates.
INDUSTRY CLASSIFICATIONS
The system published in the Standard Industrial Classi-fication Manual: 1987 was used to classify firms for thisreport. Under this system, economic activities are coded ona numerical basis. Related activities are grouped at aprimary level by industry division (i.e., manufacturing,construction, retail trade, etc.). Within each industry divi-sion, successive levels of detail of the economic activity aredefined: major group (two-digit code); industry group (three-digit code); and industry (four-digit code). For example, onehierarchy in wholesale trade is:
VI CHARACTERISTICS OF BUSINESS OWNERS 1992 ECONOMIC CENSUS

SIC level SIC code Description
Industry division − Wholesale tradeMajor group 50 Durable goodsIndustry group 506 Electrical goodsIndustry 5064 Electrical appliances, tele-
vision and radio setsData in this report are presented only at the industry
division level.This study covers all industries in the SIC system except
the following: Major Groups 01 and 02, Agricultural Pro-duction; 40, Railroad Transportation; 43, U.S. Postal Serv-ice; 86, Membership Organizations; 88, Private House-holds; 91-97, Public Administration.
COMPARABILITY OF 1987 AND 1992 DATA
The following changes were made in survey methodol-ogy in 1992 which affect comparability with past reports:
1. More questions were added to the 1992 survey formsto meet the needs of CBO’s primary data users. Thishas resulted in additional tables in the 1992 CBOpublication.
2. Since the 1987 survey, the number of subchapter Scorporations (included in CBO) has risen at a muchfaster rate than the number of C corporations (notincluded in CBO). The net result was an approximately20 percent increase in the CBO universe compared toan approximately 12 percent overall increase in busi-ness tax returns.
3. In 1987, classifications for firm data were based on the1972 SIC Manual.1 For 1992, classifications are basedon the 1987 SIC Manual.2 The SIC structure waschanged to better reflect industry trends. These changeslimit the comparability of data between the 1987 and1992 CBO.
4. There was significant overstatement in the number ofemployer firms in 1987 due to processing errors. Theoverstatement primarily affects the number of employ-ers, but minimally affects the employee and payrollnumbers.
5. In 1987, data were available from the IRS and SSA toidentify the owners of partnerships and subchapter Scorporations, theirgender,andsometimes their race/ethnicity.For 1992, all information on these owners came fromresponses to the 1992 SMOBE, WOB, and CBO.
COMPARABILITY OF SURVEY DATA WITHOTHER ECONOMIC CENSUS DATA
Caution should be exercised in comparing data pre-sented in this report with published or unpublished datafrom other reports of the 1992 Economic Census. Factors
that affect comparability of data among the censuses arethe industrial scope, business unit covered, receipts size,and coverage of nonemployers.
Industrial scope. Industry data for all of the other 1992Economic Census are based on the 1987 SIC Manual2
(see Industry Classifications). Most of the industries inscope of the other 1992 Economic Censuses were also inscope of this study. However, Major Group 86, Member-ship Organizations, was within the scope of the 1992Economic Census, but out of the scope of the 1992 CBOSurvey.
The following major industry groups were in scope ofthis study, but not in scope of the other economic censuses(see exceptions below): Major Groups 07, AgriculturalServices; 08, Forestry; 09, Fishing, Hunting, and Trapping;and domestically-owned scheduled airlines in industry 4512.
In this study, industry 6552 (land subdividers and devel-opers, except cemeteries) is included with the constructionindustry group, unlike the other economic censuses whichinclude it with industry 65 (real estate).
Business unit. Most of the economic censuses areconducted on an establishment or physical location basis;each establishment owned by a firm is individually can-vassed and tabulated. In this report, however, the unittabulated was the firm rather than each establishment ofthe firm (See appendix A for definition of ‘‘firm’’.)
Receipts size. Most of the economic censuses determinewhether or not a firm may be counted as an active businessaccording to its receipts size. The specified minimums varyby industry. For this study, a firm had only to file a businesstax return with business receipts greater than $500 for it tobe counted as an active business.
Nonemployer firms. Although nonemployer firms areincluded in this survey, they are omitted from many of theeconomic census reports.
DOLLAR VALUES
All dollar values presented in this report are expressedin current dollars, i.e., 1992 data are expressed in 1992dollars and 1987 data in 1987 dollars. Consequently, whenmaking comparisons to prior years, users should take intoconsideration the inflation that has occurred.
COMPACT DISCS
Data for the economic censuses are also available oncompact discs-read only memory (CD-ROM). Discs aresold by Administrative and Customer Services Division,Bureau of the Census, Washington, DC 20233-1900.
SPECIAL TABULATIONS
Special tabulations of data collected in the 1992 Char-acteristics of Business Owners Survey may be obtained,depending on availability of time and personnel, on dis-kette, computer tape, or in tabular form. The data will be in
1Standard Industrial Classification Manual: 1972.2Standard Industrial Classification Manual: 1987. For sale by Super-
intendent of Documents, U.S. Government Printing Office, Washington,DC 20402. Stock No. 041-001-00314-2.
CHARACTERISTICS OF BUSINESS OWNERS VII1992 ECONOMIC CENSUS
summary form and subject to the same rules prohibitingdisclosure of confidential information (including name, address,kind of business, or other data for individual firms) as arethe regular publications.
Special tabulations are prepared on a cost basis. Arequest for a cost estimate, as well as exact specificationson the type and format of the data to be provided, shouldbe directed to the Chief, Company Statistics Branch,Agriculture and Financial Statistics Division, Bureau of theCensus, Washington, DC 20233-6400.
ABBREVIATIONS AND SYMBOLSThe following abbreviations and symbols are used in this
publication:- Represents zero.
(D) Withheld to avoid disclosing data for individualcompanies; data are included in higher-leveltotals.
(NA) Not available.(X) Not applicable.SIC Standard industrial classification.
VIII CHARACTERISTICS OF BUSINESS OWNERS 1992 ECONOMIC CENSUS

Contents
Characteristics of Business Owners
Page
Introduction to the Economic Census III...............................................
Characteristics of Business Owners V................................................
Summary of Findings 7............................................................
FIGURES
1. Educational Background of Owner: 1992 9........................................
2. Veteran Status of Owner: 1992 10................................................
3. Home~Based Businesses When First Established/During 1992 11......................
4. Total Capital Needed by Owner to Start/Acquire the Business: 1992 12................
5. Sources of Borrowed Capital for Owner: 1992 13....................................
6. Sources of Borrowed Capital for Firm: 1992 13.....................................
7. Percent of Owner’s Total Personal Income Produced From the Business: 1992 14......
TABLES
Summary Characteristics of Business Owners and Their Businesses by ~~
1. Minority, Women, and Nonminority Male Ownership Status: 1992 15..................
Number of Firms, Owners, and Receipts by ~~
2a. Industry Division: 1992 26.......................................................
2b. Receipts Size of Firm: 1992 27..................................................
2c. Employment Size of Firm: 1992 28...............................................
2d. Legal Form of Organization of Firm: 1992 29......................................
Ownership Status of Business by ~~
3a. Industry Division: 1992 30.......................................................
3b. Receipts Size of Firm: 1992 32..................................................
3c. Employment Size of Firm: 1992 34...............................................
3d. Legal Form of Organization of Firm: 1992 36......................................
Operating Status of Business by ~~
4a. Industry Division: 1992 38.......................................................
4b. Receipts Size of Firm: 1992 40..................................................
4c. Employment Size of Firm: 1992 42...............................................
4d. Legal Form of Organization of Firm: 1992 44......................................
Reason the Discontinued Business Is No Longer Operating by ~~
5a. Industry Division: 1992 46.......................................................
5b. Receipts Size of Firm: 1992 48..................................................
5c. Employment Size of Firm: 1992 50...............................................
5d. Legal Form of Organization of Firm: 1992 52......................................
Age, Birthplace (United States), and Marital Status of Owner by ~~
6a. Industry Division: 1992 54.......................................................
6b. Receipts Size of Firm: 1992 56..................................................
6c. Employment Size of Firm: 1992 58...............................................
6d. Legal Form of Organization of Firm: 1992 60......................................
1992 ECONOMIC CENSUS CHARACTERISTICS OF BUSINESS OWNERS 1
Page
TABLESmCon.
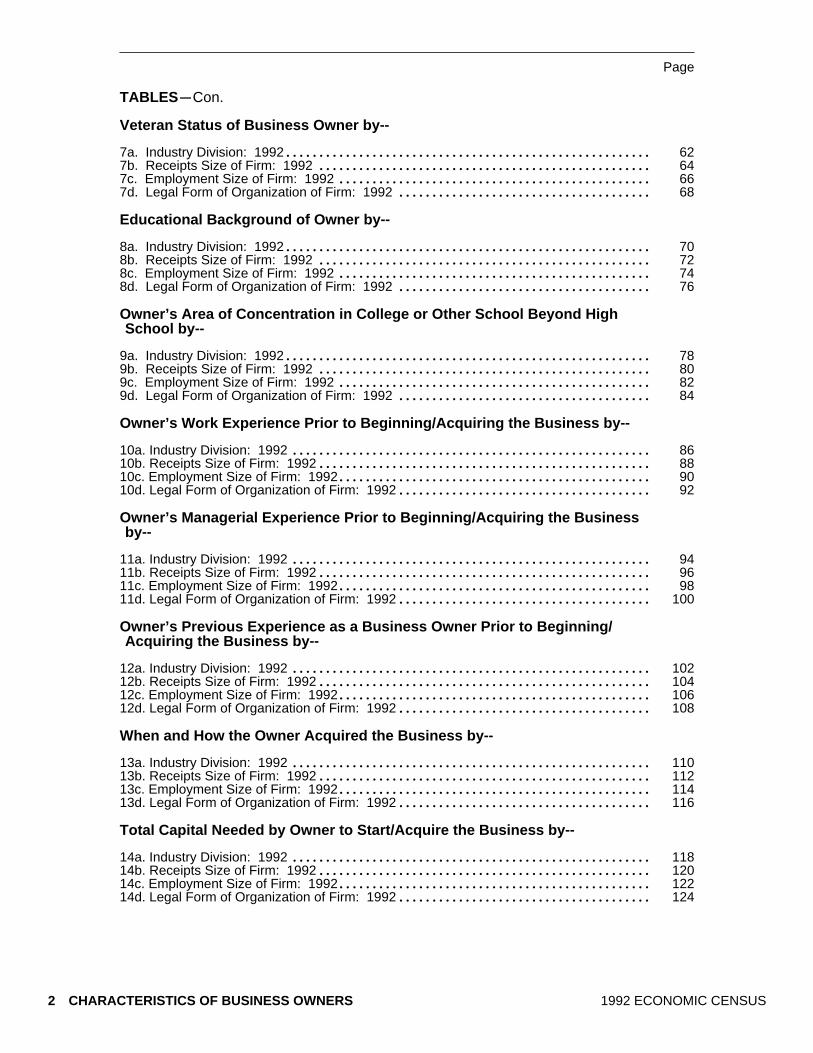
Veteran Status of Business Owner by ~~
7a. Industry Division: 1992 62.......................................................
7b. Receipts Size of Firm: 1992 64..................................................
7c. Employment Size of Firm: 1992 66...............................................
7d. Legal Form of Organization of Firm: 1992 68......................................
Educational Background of Owner by ~~
8a. Industry Division: 1992 70.......................................................
8b. Receipts Size of Firm: 1992 72..................................................
8c. Employment Size of Firm: 1992 74...............................................
8d. Legal Form of Organization of Firm: 1992 76......................................
Owner’s Area of Concentration in College or Other School Beyond HighSchool by ~~
9a. Industry Division: 1992 78.......................................................
9b. Receipts Size of Firm: 1992 80..................................................
9c. Employment Size of Firm: 1992 82...............................................
9d. Legal Form of Organization of Firm: 1992 84......................................
Owner’s Work Experience Prior to Beginning/Acquiring the Business by ~~
10a. Industry Division: 1992 86......................................................
10b. Receipts Size of Firm: 1992 88..................................................
10c. Employment Size of Firm: 1992 90...............................................
10d. Legal Form of Organization of Firm: 1992 92......................................
Owner’s Managerial Experience Prior to Beginning/Acquiring the Businessby ~~
11a. Industry Division: 1992 94......................................................
11b. Receipts Size of Firm: 1992 96..................................................
11c. Employment Size of Firm: 1992 98...............................................
11d. Legal Form of Organization of Firm: 1992 100......................................
Owner’s Previous Experience as a Business Owner Prior to Beginning/Acquiring the Business by ~~
12a. Industry Division: 1992 102......................................................
12b. Receipts Size of Firm: 1992 104..................................................
12c. Employment Size of Firm: 1992 106...............................................
12d. Legal Form of Organization of Firm: 1992 108......................................
When and How the Owner Acquired the Business by ~~
13a. Industry Division: 1992 110......................................................
13b. Receipts Size of Firm: 1992 112..................................................
13c. Employment Size of Firm: 1992 114...............................................
13d. Legal Form of Organization of Firm: 1992 116......................................
Total Capital Needed by Owner to Start/Acquire the Business by ~~
14a. Industry Division: 1992 118......................................................
14b. Receipts Size of Firm: 1992 120..................................................
14c. Employment Size of Firm: 1992 122...............................................
14d. Legal Form of Organization of Firm: 1992 124......................................
2 CHARACTERISTICS OF BUSINESS OWNERS 1992 ECONOMIC CENSUS
Page
TABLESmCon.
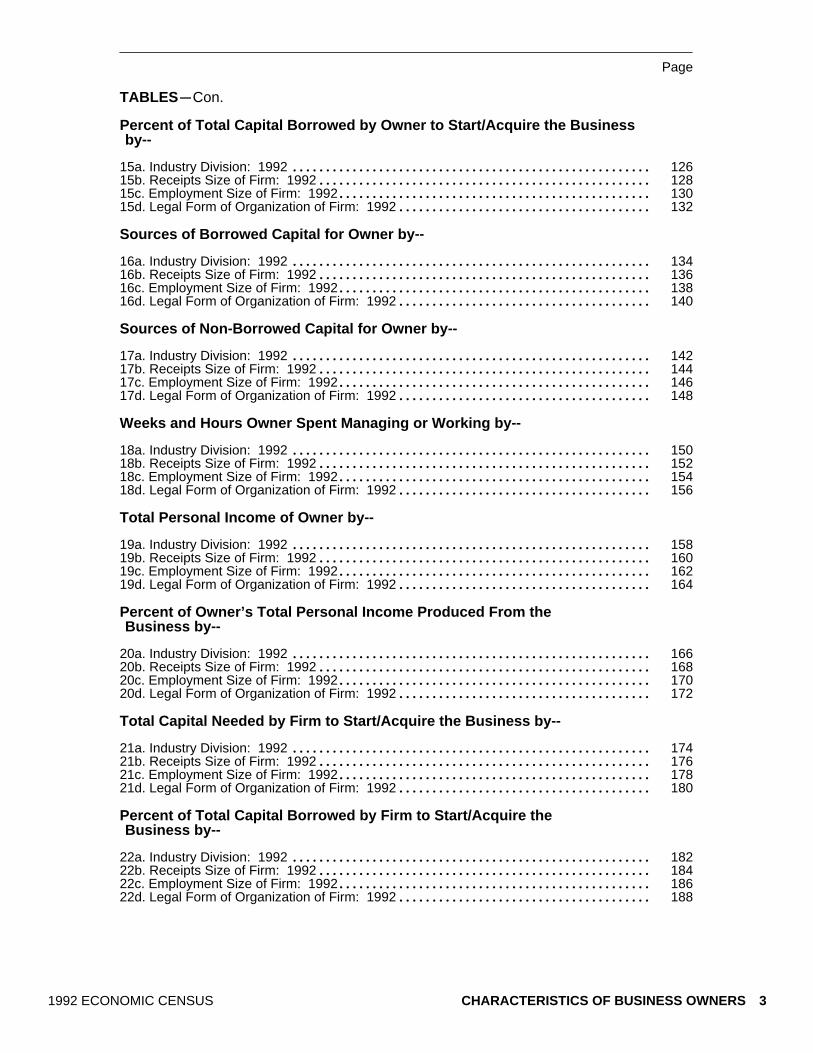
Percent of Total Capital Borrowed by Owner to Start/Acquire the Businessby ~~
15a. Industry Division: 1992 126......................................................
15b. Receipts Size of Firm: 1992 128..................................................
15c. Employment Size of Firm: 1992 130...............................................
15d. Legal Form of Organization of Firm: 1992 132......................................
Sources of Borrowed Capital for Owner by ~~
16a. Industry Division: 1992 134......................................................
16b. Receipts Size of Firm: 1992 136..................................................
16c. Employment Size of Firm: 1992 138...............................................
16d. Legal Form of Organization of Firm: 1992 140......................................
Sources of Non ~Borrowed Capital for Owner by ~~
17a. Industry Division: 1992 142......................................................
17b. Receipts Size of Firm: 1992 144..................................................
17c. Employment Size of Firm: 1992 146...............................................
17d. Legal Form of Organization of Firm: 1992 148......................................
Weeks and Hours Owner Spent Managing or Working by ~~
18a. Industry Division: 1992 150......................................................
18b. Receipts Size of Firm: 1992 152..................................................
18c. Employment Size of Firm: 1992 154...............................................
18d. Legal Form of Organization of Firm: 1992 156......................................
Total Personal Income of Owner by ~~
19a. Industry Division: 1992 158......................................................
19b. Receipts Size of Firm: 1992 160..................................................
19c. Employment Size of Firm: 1992 162...............................................
19d. Legal Form of Organization of Firm: 1992 164......................................
Percent of Owner’s Total Personal Income Produced From theBusiness by ~~
20a. Industry Division: 1992 166......................................................
20b. Receipts Size of Firm: 1992 168..................................................
20c. Employment Size of Firm: 1992 170...............................................
20d. Legal Form of Organization of Firm: 1992 172......................................
Total Capital Needed by Firm to Start/Acquire the Business by ~~
21a. Industry Division: 1992 174......................................................
21b. Receipts Size of Firm: 1992 176..................................................
21c. Employment Size of Firm: 1992 178...............................................
21d. Legal Form of Organization of Firm: 1992 180......................................
Percent of Total Capital Borrowed by Firm to Start/Acquire theBusiness by ~~
22a. Industry Division: 1992 182......................................................
22b. Receipts Size of Firm: 1992 184..................................................
22c. Employment Size of Firm: 1992 186...............................................
22d. Legal Form of Organization of Firm: 1992 188......................................
1992 ECONOMIC CENSUS CHARACTERISTICS OF BUSINESS OWNERS 3

Page
TABLESmCon.
Sources of Borrowed Capital for Firm by ~~
23a. Industry Division: 1992 190......................................................
23b. Receipts Size of Firm: 1992 192..................................................
23c. Employment Size of Firm: 1992 194...............................................
23d. Legal Form of Organization of Firm: 1992 196......................................
Home ~Based Businesses by ~~
24a. Industry Division: 1992 198......................................................
24b. Receipts Size of Firm: 1992 200..................................................
24c. Employment Size of Firm: 1992 202...............................................
24d. Legal Form of Organization of Firm: 1992 204......................................
Home ~Based Businesses’ Primary Use of Home by ~~
25a. Industry Division 206............................................................
25b. Receipts Size of Firm 208........................................................
25c. Employment Size of Firm 210.....................................................
25d. Legal Form of Organization of Firm 212............................................
Franchised Businesses by ~~
26a. Industry Division: 1992 214......................................................
26b. Receipts Size of Firm: 1992 216..................................................
26c. Employment Size of Firm: 1992 218...............................................
26d. Legal Form of Organization of Firm: 1992 220......................................
Net Profit and Net Loss by ~~
27a. Industry Division: 1992 222......................................................
27b. Receipts Size of Firm: 1992 224..................................................
27c. Employment Size of Firm: 1992 226...............................................
27d. Legal Form of Organization of Firm: 1992 228......................................
Percent of Women Employees by ~~
28a. Industry Division: 1992 230......................................................
28b. Receipts Size of Firm: 1992 232..................................................
28c. Employment Size of Firm: 1992 234...............................................
28d. Legal Form of Organization of Firm: 1992 236......................................
Percent of Minority Employees by ~~
29a. Industry Division: 1992 238......................................................
29b. Receipts Size of Firm: 1992 240..................................................
29c. Employment Size of Firm: 1992 242...............................................
29d. Legal Form of Organization of Firm: 1992 244......................................
Percent of Minority Customers by ~~
30a. Industry Division: 1992 246......................................................
30b. Receipts Size of Firm: 1992 248..................................................
30c. Employment Size of Firm: 1992 250...............................................
30d. Legal Form of Organization of Firm: 1992 252......................................
Total Sales of 10 Percent or More to Customer Categories by ~~
31a. Industry Division: 1992 254......................................................
31b. Receipts Size of Firm: 1992 256..................................................
31c. Employment Size of Firm: 1992 258...............................................
31d. Legal Form of Organization of Firm: 1992 260......................................
4 CHARACTERISTICS OF BUSINESS OWNERS 1992 ECONOMIC CENSUS

Page
TABLESmCon.
Percent of Exports by ~~
32a. Industry Division: 1992 262......................................................
32b. Receipts Size of Firm: 1992 264..................................................
32c. Employment Size of Firm: 1992 266...............................................
32d. Legal Form of Organization of Firm: 1992 268......................................
APPENDIXES
A. Explanation of Terms A–1.........................................................
B. 1992 Survey of Minority~Owned Business Enterprises and Survey of Women~OwnedBusinesses B–1...............................................................
C. Questionnaires CBO~1 C–2..................................................................
CBO~2 C–14..................................................................
CBO~3 C–25..................................................................
Publication Program Inside back cover...................................................
1992 ECONOMIC CENSUS CHARACTERISTICS OF BUSINESS OWNERS 5

Summary of Findings
The 1992 Characteristics of Business Owners (CBO)Survey was conducted to expand on the data published inthe 1992 Economic Census reports: Survey of Minority-Owned Business Enterprises (SMOBE), MB92-1, -2, -3,and -4, and Survey of Women-Owned Businesses (WOB),WB92-1.
CBO provides owner and business characteristics byrace, ethnicity, gender, kind of business, size of business,and legal form of organization for individual proprietor-ships, partnerships, and subchapter S corporations.
The 1992 Economic Census programs identified almost17.3 million individual proprietorships, partnerships, andsubchapter S corporations with sales and receipts of $3.3trillion. Table A provides summary totals of these firms bybusiness ownership group based on the responses toSMOBE, WOB, and the Economic Census.
Table A. Business Ownership Group: 1992
Ownership group Firms(number)
Salesand
receipts($1,000,000)
All businesses1 . . . . . . . . . . . . . . . . . . . . . . . . 17,253,143 3,324,200All minorities1 . . . . . . . . . . . . . . . . . . . . . . . . . 1,965,565 202,011Hispanic . . . . . . . . . . . . . . . . . . . . . . . . . . . . . 771,708 72,824Black . . . . . . . . . . . . . . . . . . . . . . . . . . . . . . . . 620,912 32,197Asian, Pacific Islander, American Indian,and Alaska Native (API/AIAN orreferred to as Other minority) . . . . . . . . . . 606,426 99,709
Women . . . . . . . . . . . . . . . . . . . . . . . . . . . . . . . 5,888,883 642,484Nonminority male . . . . . . . . . . . . . . . . . . . . . . 10,114,456 2,526,942
1Detail does not add to total because of inclusion of some firms inmore than one group. Firms that were equally owned by two or moreminorities are included in the data for each minority group, but countedonly once at total levels.
The SMOBE and WOB reports show that most of thesefirms were concentrated in the service industries. Forty-fivepercent of all U.S. firms, 48 percent of the minority-ownedfirms, 54 percent of the firms owned by women, and 41percent of the firms owned by nonminority males wereclassified as services. Retail trade has the next largestshare with 14 percent of all U.S. firms, 16 percent of theminority-owned firms, and 19 percent of the women-ownedfirms. However, construction has the second largest share(15 percent) of the nonminority male-owned firms.
These same reports show that while the nonminoritymale- and women-owned firms are spread across allStates, more than half of all minority-owned firms are
located in just four states: California, Texas, Florida, andNew York. Approximately 47 percent of the minority popu-lation is concentrated in these four states.
OWNER CHARACTERISTICS
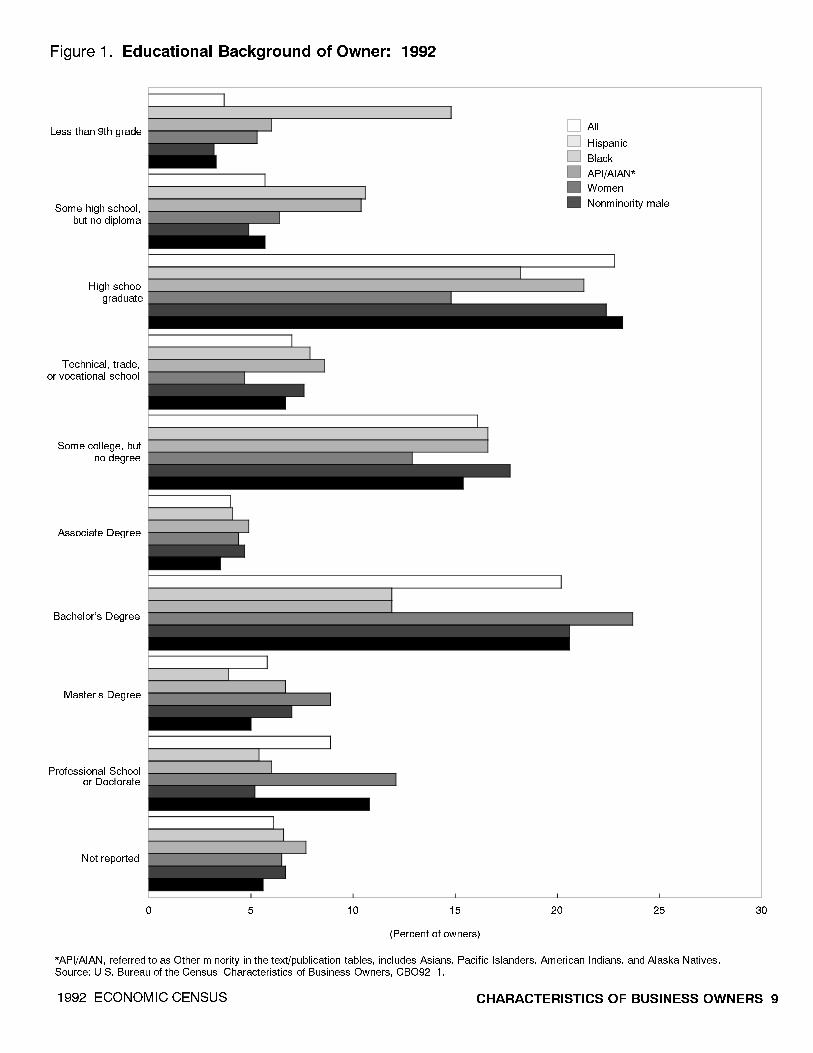
The 1992 CBO Survey shows that nearly 50 percent ofthe business owners in each group were between the agesof 35 and 54 years of age in 1992, and over half of thoseindividuals were in the 35 to 44 year age bracket. Overall,70 percent of the owners were married. Fourteen percentof the owners of women-owned firms responded as veter-ans, compared to 31 percent of the owners of nonminoritymale-owned firms. Forty-five percent of Hispanic businessowners and 63 percent of API/AIAN business owners werenot born in the United States. The highest percentage ofcollege graduates (approximately 49 percent) was amongAPI/AIAN business owners. Twenty-one percent of thosesame individuals completed graduate school. The educa-tion and foreign born percentages for the API/AIAN groupare dominated by the Asians and Pacific Islanders.
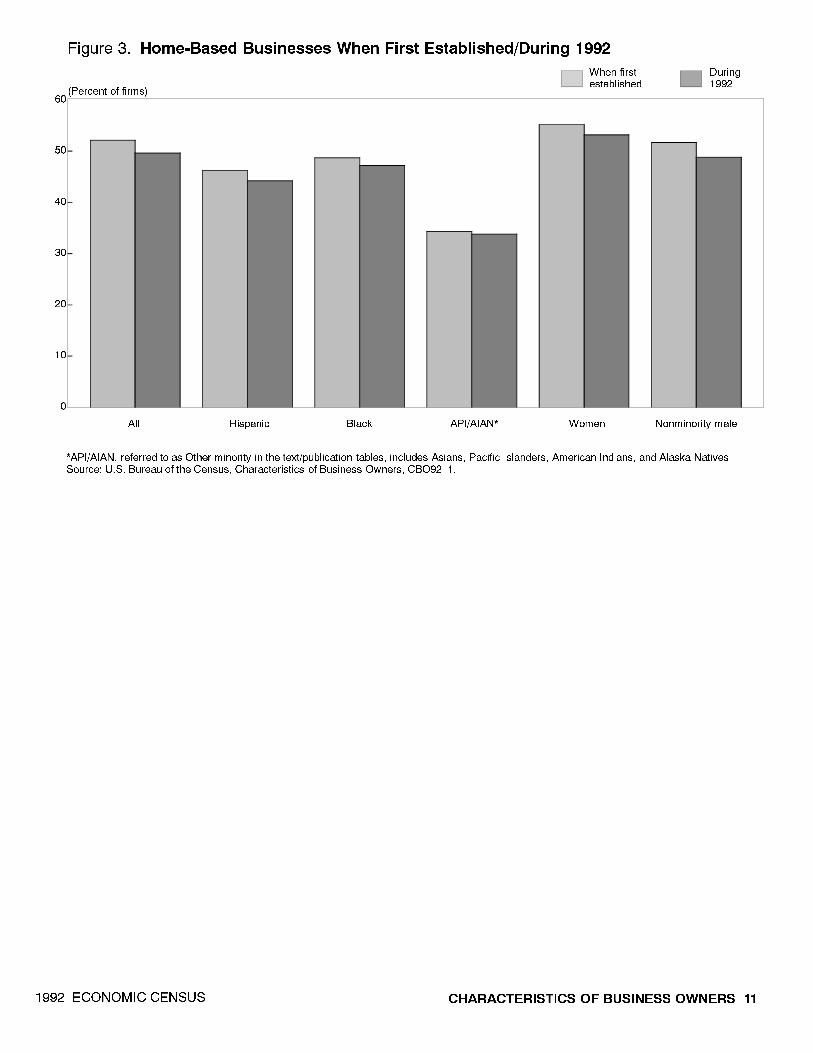
HOME-BASED BUSINESSES
Overall, approximately 50 percent of businesses in 1992were home-based. As expected, the percentage of firmsoperated from a home tended to be higher for smallerfirms. Fifty-seven percent of businesses with receipts lessthan $25,000 in 1992 were home-based, compared to 26percent of firms with receipts of $25,000 to $199,999, 16percent of firms with receipts of $200,000 to $999,000, andonly 5 percent of firms with receipts of $1,000,000 or more.
Fifty-four percent of the individual proprietorships werehome-based businesses in 1992. These same statistics forsmall corporations and partnerships were considerablyless with only 27 percent of those firms operating from ahome.
Of the home-based businesses, male-owned firms weremost likely to use the residence to do clerical work only orto telecommute. In contrast, home-based women-ownedfirms were more likely to use their residences to producegoods or services on the premises.
CAPITAL REQUIREMENTS
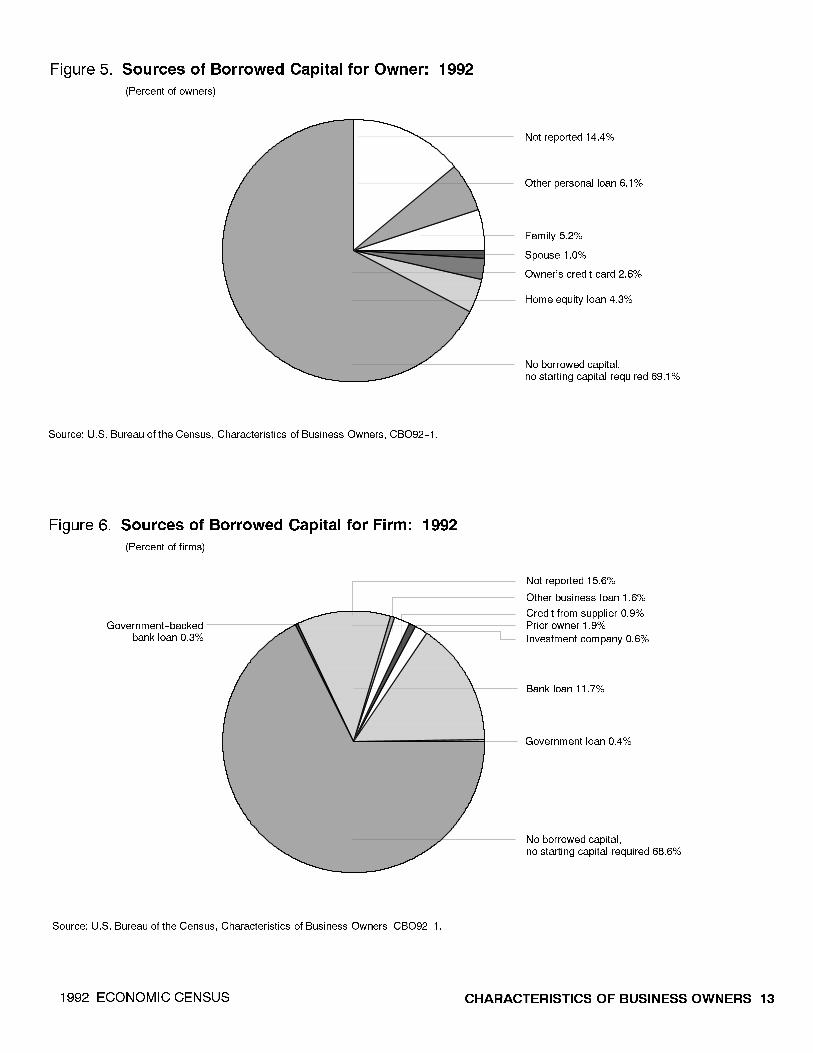
Information was collected separately on owners’ sourcesof capital to start or acquire their businesses, and the firms’use of business loans to acquire start-up capital.
CHARACTERISTICS OF BUSINESS OWNERS 71992 ECONOMIC CENSUS

Owners. The majority of 1992 business owners startedtheir enterprises with less than $5,000. The highest per-centage (66 percent) was among the owners of Black-owned firms. Owners of API/AIAN-owned firms started withthe most capital; 10 percent of them began their busi-nesses with $100,000 or more. Forty-four percent of theowners did not borrow their starting capital, but usedmoney or assets of their own or from their families.
Firms. Most firms (approximately 60 percent) reportedthat the businesses were started or acquired with no cashoutlay or with less than $5,000. Forty-three percent of allfirms did not borrow money to start or acquire theirbusinesses.
Of the firms which borrowed money, 24 to 30 percent ofthe partnerships and subchapter S corporations reportedthat their capital originated from business loans frombanking or commercial lending institutions. However, only10 percent of the individual proprietorships reported thattheir borrowed capital was provided by bank loans. Lessthan 1 percent of the businesses reported that the moneyborrowed was provided by government-guaranteed loans.
OWNER’S WORK EXPERIENCE
Sixty-six percent of the business owners stated that thebusiness they owned in 1992 was the first one they hadowned. Overall, most of the business owners reported thatthey were the original founders of the business (approxi-mately 69 percent). Approximately 21 percent purchasedtheir share of the business or received a transfer ofownership in the business. For firms with $50,000 or morein receipts in 1992, the larger the receipts size of the firm,the less likely the business was to be owned by the‘‘original founder.’’
Fifty-two percent of business owners had 10 or moreyears of work experience prior to starting/acquiring theirbusiness. However, 66 percent of business owners reportedhaving no prior experience as the owner of another busi-ness.
Fifty-one percent of the business owners managed orworked in their business the entire year. About 35 percentof business owners averaged more than 40 hours per weekin their business, while 36 percent worked less than 20hours per week. The percentage of business ownersworking less than 20 hours per week was highest in the
finance, insurance, and real estate sector. The percent ofowners working part-time ranged from 46 percent forHispanics to 56 percent for women. However, for firms withbetween $200,000 and $1,000,000 in sales and receipts,59 percent of women business owners worked more than40 hours per week compared to 35 percent of all busi-nesses.
PROFITABILITY
In 1992, 35 percent of business owners reported that 75percent or more of their total personal income was pro-duced as a result of their business, while 36 percentreported that none or less than 10 percent of their incomecame from the business.
Thirty-nine percent of businesses reported a net profit ofless than $10,000 from their business while another 21percent claimed a profit of $10,000 or more. However, 20percent of the businesses reported experiencing a net lossin 1992.
WORK FORCE CHARACTERISTICS
Hispanic-owned firms hired fewer women employeesthan any other group. Thirty-two percent of the owners ofHispanic-owned employer firms reported that in 1992 lessthan 10 percent of their employees were women. Forty-eight percent of women-owned firms reported that 50percent or more of their employees were women. Thiscompares to only 35 percent of male-owned firms. Surveyresults indicate that minorities hire minorities. Fourteen to33 percent of the owners of minority-owned employer firmsreported that their work force consisted of 76 to 100percent minority employees.
EXPORTS
Nine percent of manufacturing firms reported that somesales resulted from exporting. This ranged from 1 percentof Black-owned manufacturing firms to 11 percent ofnonminority male-owned manufacturing firms.
Seven percent of wholesale firms reported having someexport sales. Percent of sales resulting from exports variedmore widely among the wholesalers from 5 percent ofBlack-owned firms to 20 percent of Hispanic-owned firmsand 20 percent of API/AIAN-owned firms.
8 CHARACTERISTICS OF BUSINESS OWNERS 1992 ECONOMIC CENSUS
� � �� �� �� �� ��
)LJXUH �� (GXFDWLRQDO %DFNJURXQG RI 2ZQHU� ����
���� (&2120,& &(1686 &+$5$&7(5,67,&6 2) %86,1(66 2:1(56 �
$3,�$,$1� UHIHUUHG WR DV 2WKHU PLQRULW\ LQ WKH WH[W�SXEOLFDWLRQ WDEOHV� LQFOXGHV $VLDQV� 3DFLILF ,VODQGHUV� $PHULFDQ ,QGLDQV� DQG $ODVND 1DWLYHV�6RXUFH� 8�6� %XUHDX RI WKH &HQVXV� &KDUDFWHULVWLFV RI %XVLQHVV 2ZQHUV� &%2������
3URIHVVLRQDO 6FKRRORU 'RFWRUDWH
+LVSDQLF
$3,�$,$1
%ODFN
:RPHQ
1RQPLQRULW\ PDOH
/HVV WKDQ �WK JUDGH
6RPH KLJK VFKRRO�EXW QR GLSORPD
+LJK VFKRROJUDGXDWH
7HFKQLFDO� WUDGH�RU YRFDWLRQDO VFKRRO
6RPH FROOHJH� EXWQR GHJUHH
$VVRFLDWH 'HJUHH
%DFKHORU·V 'HJUHH
0DVWHU·V 'HJUHH
1RW UHSRUWHG
�3HUFHQW RI RZQHUV�
$OO

�
�
��
��
��
��
��
��
)LJXUH �� 9HWHUDQ 6WDWXV RI 2ZQHU� ����
���� (&2120,& &(1686�� &+$5$&7(5,67,&6 2) %86,1(66 2:1(56
$OO +LVSDQLF $3,�$,$1 %ODFN :RPHQ 1RQPLQRULW\ PDOH
9HWHUDQ
6HUYHG DFWLYH GXW\ GXULQJWKH 9LHWQDP HUD
:DV D GLVDEOHG YHWHUDQ
�3HUFHQW RI RZQHUV�
$3,�$,$1� UHIHUUHG WR DV 2WKHU PLQRULW\ LQ WKH WH[W�SXEOLFDWLRQ WDEOHV� LQFOXGHV $VLDQV� 3DFLILF ,VODQGHUV� $PHULFDQ ,QGLDQV� DQG $ODVND 1DWLYHV�6RXUFH� 8�6� %XUHDX RI WKH &HQVXV� &KDUDFWHULVWLFV RI %XVLQHVV 2ZQHUV� &%2������
���� (&2120,& &(1686 &+$5$&7(5,67,&6 2) %86,1(66 2:1(56 ��
�
��
��
��
��
��
��
)LJXUH �� +RPH�%DVHG %XVLQHVVHV :KHQ )LUVW (VWDEOLVKHG�'XULQJ ����
$OO +LVSDQLF %ODFN $3,�$,$1 :RPHQ 1RQPLQRULW\ PDOH
:KHQ ILUVWHVWDEOLVKHG
'XULQJ����
�3HUFHQW RI ILUPV�
$3,�$,$1� UHIHUUHG WR DV 2WKHU PLQRULW\ LQ WKH WH[W�SXEOLFDWLRQ WDEOHV� LQFOXGHV $VLDQV� 3DFLILF ,VODQGHUV� $PHULFDQ ,QGLDQV� DQG $ODVND 1DWLYHV�6RXUFH� 8�6� %XUHDX RI WKH &HQVXV� &KDUDFWHULVWLFV RI %XVLQHVV 2ZQHUV� &%2������

� � �� �� �� �� �� �� ��
���� (&2120,& &(1686�� &+$5$&7(5,67,&6 2) %86,1(66 2:1(56
)LJXUH �� 7RWDO &DSLWDO 1HHGHG E\ 2ZQHU WR 6WDUW�$FTXLUH WKH %XVLQHVV� ����
$OO
+LVSDQLF
$3,�$,$1
%ODFN
:RPHQ
1RQPLQRULW\ PDOH
������� WR �������
������� WR �������
������� WR �������
������ WR ������
/HVV WKDQ ������
1RQH
1RW UHSRUWHG
�������� WR ��������
�������� WR ��������
���������� RU PRUH
�3HUFHQW RI RZQHUV�
$3,�$,$1� UHIHUUHG WR DV 2WKHU PLQRULW\ LQ WKH WH[W�SXEOLFDWLRQ WDEOHV� LQFOXGHV $VLDQV� 3DFLILF ,VODQGHUV� $PHULFDQ ,QGLDQV� DQG $ODVND 1DWLYHV�6RXUFH� 8�6� %XUHDX RI WKH &HQVXV� &KDUDFWHULVWLFV RI %XVLQHVV 2ZQHUV� &%2������
���� (&2120,& &(1686 &+$5$&7(5,67,&6 2) %86,1(66 2:1(56 ��
)LJXUH �� 6RXUFHV RI %RUURZHG &DSLWDO IRU 2ZQHU� ����
)LJXUH �� 6RXUFHV RI %RUURZHG &DSLWDO IRU )LUP� ����
1RW UHSRUWHG �����
2WKHU EXVLQHVV ORDQ ����
&UHGLW IURP VXSSOLHU ����3ULRU RZQHU ����
,QYHVWPHQW FRPSDQ\ ����
%DQN ORDQ �����
1R ERUURZHG FDSLWDO�QR VWDUWLQJ FDSLWDO UHTXLUHG �����
1RW UHSRUWHG �����
2WKHU SHUVRQDO ORDQ ����
)DPLO\ ����
6SRXVH ����
2ZQHU·V FUHGLW FDUG ����
+RPH HTXLW\ ORDQ ����
1R ERUURZHG FDSLWDO�QR VWDUWLQJ FDSLWDO UHTXLUHG �����
*RYHUQPHQW��EDFNHGEDQN ORDQ ����
*RYHUQPHQW ORDQ ����
6RXUFH� 8�6� %XUHDX RI WKH &HQVXV� &KDUDFWHULVWLFV RI %XVLQHVV 2ZQHUV� &%2������
6RXUFH� 8�6� %XUHDX RI WKH &HQVXV� &KDUDFWHULVWLFV RI %XVLQHVV 2ZQHUV� &%2������
�3HUFHQW RI RZQHUV�
�3HUFHQW RI ILUPV�

� � �� �� �� �� �� ��
���� (&2120,& &(1686�� &+$5$&7(5,67,&6 2) %86,1(66 2:1(56
)LJXUH �� 3HUFHQW RI 2ZQHU·V 7RWDO 3HUVRQDO ,QFRPH 3URGXFHG )URP WKH %XVLQHVV� ����
1RW UHSRUWHG
��� WR ���
��� WR ���
��� WR ���
��� WR ���
/HVV WKDQ ���
1RQH
����
�3HUFHQW RI RZQHUV�
$3,�$,$1� UHIHUUHG WR DV 2WKHU PLQRULW\ LQ WKH WH[W�SXEOLFDWLRQ WDEOHV� LQFOXGHV $VLDQV� 3DFLILF ,VODQGHUV� $PHULFDQ ,QGLDQV� DQG $ODVND 1DWLYHV�6RXUFH� 8�6� %XUHDX RI WKH &HQVXV� &KDUDFWHULVWLFV RI %XVLQHVV 2ZQHUV� &%2������
+LVSDQLF
$3,�$,$1
%ODFN
:RPHQ
1RQPLQRULW\ PDOH
$OO

Table 1. Summary Characteristics of Business Owners and Their Businesses: 1992[Detail may not add to total due to rounding. For meaning of abbreviations and symbols, see introductory text. For explanation of terms, see appendix A]
Item
Standard error of estimate3
for columnmAllbusinesses1
Hispanic~owned
businesses1Black~ownedbusinesses1
Otherminority~
ownedbusinesses1 2
Women~owned
businesses1
Nonminoritymale~ownedbusinesses1
A B C D E F A B C D E F
IN 1996, STILL OWNED THE SAME BUSINESSTHAT WAS OWNED IN 19924
Yes 68.9............................................... 67.3 60.1 71.2 66.0 70.5 .4 1.1 .6 1.1 1.1 1.0No 25.5................................................ 26.9 32.1 23.2 27.7 24.2 .5 1.2 .7 .9 .9 1.0Not reported 5.7....................................... 5.7 7.7 5.6 6.3 5.3 .4 .4 .6 .6 .5 .6
IF NOT, YEAR THAT OWNERSHIP ENDED4
1992 6.1.............................................. 7.2 9.1 4.4 6.9 5.6 .3 .6 .5 .5 .5 .41993 5.3.............................................. 5.7 7.2 5.6 6.2 4.7 .3 .4 .4 .6 .5 .61994 5.4.............................................. 4.9 6.3 5.1 5.3 5.5 .3 .4 .2 .4 .4 .71995 4.5.............................................. 4.9 5.3 4.7 4.7 4.4 .3 .4 .4 .4 .6 .4Not reported 9.9....................................... 10.1 12.0 9.0 11.0 9.3 .4 .5 .6 .9 .7 .6Not applicable5 68.9..................................... 67.3 60.1 71.2 66.0 70.5 .4 1.1 .6 1.1 1.1 1.0
REASON FOR THE CHANGE IN OWNERSHIP4
Sold 3.1............................................... 2.3 1.1 4.1 2.0 3.7 .5 .2 .1 .3 .2 .8Transferred ownership/gift 1.5........................... 1.8 1.5 2.5 1.4 1.6 .2 .2 .2 .2 .2 .3Business no longer exists 18.3............................ 19.7 26.0 14.4 20.8 16.9 .6 1.1 .7 .6 .8 1.1Not reported 8.3....................................... 8.8 11.2 7.8 9.9 7.4 .4 .5 .7 .8 .6 .6Not applicable5 68.9..................................... 67.3 60.1 71.2 66.0 70.5 .4 1.1 .6 1.1 1.1 1.0
BUSINESS OWNED IN 1992 WAS STILL INOPERATION IN 19965
Yes 69.0............................................... 66.5 59.5 72.1 66.4 70.4 .7 1.2 .4 .8 .9 1.2No 24.3................................................ 25.1 28.7 20.1 25.4 23.7 .6 1.4 .6 .9 .9 .9Don’t know 1.5......................................... 1.4 1.4 2.6 1.7 1.3 .2 .3 .2 .4 .3 .3Not reported 5.3....................................... 7.0 10.4 5.3 6.5 4.5 .2 .8 .5 .6 .6 .3
IF NOT, YEAR THAT THE OPERATIONSDISCONTINUED6
1992 6.7.............................................. 7.3 8.9 4.6 7.7 6.1 .4 .7 .5 .6 .8 .51993 6.1.............................................. 6.4 6.9 5.8 6.3 6.0 .4 .6 .5 .7 .6 .71994 5.3.............................................. 4.4 5.9 4.3 5.3 5.4 .4 .6 .3 .4 .6 .71995 4.3.............................................. 4.9 5.2 4.2 4.6 4.2 .4 .6 .4 .5 .5 .5Not reported 7.2....................................... 9.1 12.2 6.4 8.0 6.5 .3 .9 .4 .6 .7 .4Not applicable7 70.4..................................... 67.9 60.9 74.6 68.1 71.8 .6 1.2 .5 1.1 1.0 1.1
STATUS OF DISCONTINUED BUSINESS ATTHE TIME THE DECISION WAS MADE TOCEASE OPERATIONS6
Successful 8.7......................................... 6.7 6.1 5.2 9.4 8.7 .6 .6 .3 .8 .5 .8Unsuccessful 14.1....................................... 16.2 20.7 14.0 14.8 13.5 .6 1.1 .5 .5 .7 1.0Not reported 6.8....................................... 9.3 12.2 6.1 7.7 6.1 .3 .9 .5 .6 .6 .5Not applicable7 70.4..................................... 67.9 60.9 74.6 68.1 71.8 .6 1.2 .5 1.1 1.0 1.1
REASON WHY A DISCONTINUED BUSINESSWAS UNSUCCESSFUL6
Inadequate cash flow or low sales 71.7..................... 67.1 63.4 67.6 70.2 73.7 2.9 2.7 1.7 3.2 3.2 5.2Lack of access to business loans/credit 8.2................ 8.8 15.5 6.1 9.3 7.3 1.4 1.6 1.6 2.2 2.1 2.2Lack of access to personal loans/credit 3.3................ 5.8 8.4 6.4 3.3 2.7 .5 .8 .8 2.1 .9 .8Other reason 71.7....................................... 68.3 69.3 75.9 75.8 69.3 2.2 1.9 1.4 3.1 3.0 4.1Not reported 1.3....................................... 3.2 4.3 2.6 2.8 – .4 1.6 .8 1.2 1.3 –
AGE AS OF DECEMBER 31, 1992 4
Under 25 2.3.......................................... 2.9 1.6 2.9 2.7 2.0 .2 .5 .2 .4 .3 .325 to 34 14.2........................................... 18.8 12.2 13.8 14.8 13.6 .6 .5 .2 1.1 .9 .835 to 44 27.1........................................... 27.6 26.6 30.5 26.9 27.0 .5 .7 .7 1.3 .8 .945 to 54 22.9........................................... 24.7 24.9 26.0 21.9 23.2 .7 .6 .8 1.0 .8 .955 to 64 17.5........................................... 14.7 17.7 14.4 17.7 17.7 .5 .5 .9 .9 .8 1.165 or over 10.4......................................... 5.4 9.5 6.1 9.5 11.4 .6 .3 .5 .4 .7 1.0Not reported 5.7....................................... 5.9 7.5 6.4 6.5 5.1 .3 .4 .5 .7 .4 .6
BORN IN THE UNITED STATES4
Yes 84.1............................................... 47.6 82.9 29.8 84.0 88.6 .4 .6 .7 1.3 .6 .5No 8.7................................................ 44.8 8.4 63.2 8.0 4.7 .4 .6 .5 1.5 .4 .6Not reported 7.2....................................... 7.6 8.7 7.0 8.0 6.7 .4 .5 .4 .6 .3 .6
MARITAL STATUS WHEN THE BUSINESSWAS STARTED/ACQUIRED 4
Never married 12.2...................................... 13.9 13.1 13.0 11.2 12.7 .5 .8 .5 .7 .6 .7Married 71.9............................................ 70.6 61.8 74.3 67.5 74.1 .6 1.1 .4 1.2 .7 1.3Divorced/separated 8.3................................. 8.6 14.3 5.1 10.9 7.1 .4 .4 .7 .3 .8 .5Widowed 1.8.......................................... .8 2.7 1.5 3.6 1.0 .2 .2 .3 .3 .3 .3Not reported 5.8....................................... 6.2 8.1 6.2 6.9 5.1 .3 .4 .4 .7 .4 .6
See footnotes at end of table.
1992 ECONOMIC CENSUS CHARACTERISTICS OF BUSINESS OWNERS 15

Table 1. Summary Characteristics of Business Owners and Their Businesses: 1992 mCon.[Detail may not add to total due to rounding. For meaning of abbreviations and symbols, see introductory text. For explanation of terms, see appendix A]
Item
Standard error of estimate3
for columnmAllbusinesses1
Hispanic~owned
businesses1Black~ownedbusinesses1
Otherminority~
ownedbusinesses1 2
Women~owned
businesses1
Nonminoritymale~ownedbusinesses1
A B C D E F A B C D E F
MARITAL STATUS AS OF DECEMBER 31,19924
Never married 8.9...................................... 11.7 10.5 9.9 8.5 8.9 .4 .9 .5 .6 .6 .6Married 69.6............................................ 65.1 55.1 71.6 64.2 72.6 .4 1.0 .4 1.1 .7 .8Divorced/separated 8.5................................. 8.5 14.0 5.4 11.5 7.2 .5 .4 .8 .3 .9 .5Widowed 2.5.......................................... 1.4 4.0 1.6 4.6 1.6 .2 .2 .3 .3 .3 .3Not reported 10.4....................................... 13.3 16.3 11.5 11.1 9.7 .3 .5 .8 .9 .4 .6
VETERAN STATUS AS OF DECEMBER 31,19924
Not a veteran 68.5...................................... 76.8 67.3 81.5 77.1 63.0 1.0 .6 .9 .7 .8 1.7Less than 6 months active duty 2.5....................... 1.2 1.1 .7 1.0 3.4 .2 .1 .1 .1 .1 .36 months or more active duty 21.7......................... 13.5 19.5 9.5 12.5 27.4 .9 .4 .6 .6 .8 1.5Not reported 7.4....................................... 8.5 12.1 8.3 9.3 6.2 .3 .3 .7 .6 .3 .6
ACTIVE MILITARY DUTY SERVED DURINGTHE VIETNAM ERA4
Yes 7.4............................................... 6.5 8.3 3.8 4.5 9.0 .5 .3 .4 .4 .4 .7No 14.1................................................ 6.8 11.3 5.7 8.0 18.2 .6 .6 .5 .6 .8 .9Not reported 7.6....................................... 8.6 12.1 8.3 9.4 6.4 .3 .3 .6 .6 .4 .6Not applicable8 70.9..................................... 78.0 68.3 82.2 78.1 66.4 .9 .5 .9 .7 .8 1.6
DISABLED VETERAN 4
Yes 1.8............................................... 1.1 2.7 1.1 1.7 1.8 .2 .2 .3 .4 .4 .2No 22.0................................................ 13.4 18.1 9.2 11.7 28.5 .9 .5 .6 .6 .8 1.5Not reported 7.8....................................... 8.7 12.0 8.2 9.4 6.8 .3 .4 .6 .7 .3 .6Not applicable9 68.5..................................... 76.8 67.3 81.5 77.1 63.0 1.0 .6 .9 .7 .8 1.7
OWNER HAD HEALTH INSURANCE DURING19924
Yes, through spouse’s insurer 25.0........................ 19.5 25.4 21.1 31.5 22.1 .6 1.0 .6 1.2 .9 .9Yes, through this business’s insurer 10.0................... 8.2 4.4 10.7 7.6 11.5 .3 .2 .3 .6 .6 .4Yes, through another business’s insurer 16.9............... 10.6 14.1 13.3 15.2 18.3 .5 .7 .6 .5 .9 .8Yes, through trade association’s insurer 2.2............... 1.3 1.1 1.7 2.0 2.3 .2 .2 .1 .3 .4 .2Yes, through some other source 29.6...................... 23.5 32.0 28.4 27.1 31.3 .7 1.0 1.2 .6 .7 1.0No 15.5................................................ 33.9 21.3 22.2 14.7 14.3 .6 .9 .6 .9 .6 1.0Not reported 6.3....................................... 7.2 8.8 7.4 7.5 5.5 .3 .4 .5 .7 .5 .5
HIGHEST LEVEL OF EDUCATIONCOMPLETED OR DEGREE RECEIVED WHENBUSINESS WAS STARTED/ACQUIRED 4
Less than 9th grade 3.7................................. 14.8 6.0 5.3 3.2 3.3 .2 .7 .3 .4 .4 .2Some high school, but no diploma 5.7.................... 10.6 10.4 6.4 4.9 5.7 .2 .6 .4 .6 .5 .4High school graduate or GED equivalency 22.6............. 18.2 21.3 14.8 22.4 23.2 .6 .7 .5 .6 .7 .8Technical, trade, or vocational school 7.0.................. 7.9 8.6 4.7 7.6 6.7 .2 .7 .5 .5 .4 .4Some college, but no degree 16.1......................... 16.6 16.6 12.9 17.7 15.4 .6 .9 .4 .8 .8 .8Associate Degree 4.0................................... 4.1 4.9 4.4 4.7 3.5 .4 .4 .4 .3 .6 .5Bachelor’s Degree 20.2.................................. 11.9 11.9 23.7 20.6 20.6 .6 .7 .6 1.5 .9 1.0Master’s Degree 5.8.................................... 3.9 6.7 8.9 7.0 5.0 .3 .2 .6 .7 .5 .5Professional School or Doctorate 8.9..................... 5.4 6.0 12.1 5.2 10.8 .2 .4 .4 .9 .5 .4Not reported 6.1....................................... 6.6 7.7 6.5 6.7 5.6 .3 .4 .5 .8 .3 .5
IF ATTENDED COLLEGE OR OTHER SCHOOLBEYOND HIGH SCHOOL, AREA OFCONCENTRATION4
Architecture/Engineering 5.0............................. 4.9 2.6 9.6 3.3 5.7 .2 .4 .3 .5 .3 .3Biological/Medical Science 6.9........................... 5.6 5.8 11.8 6.9 6.7 .3 .5 .2 .9 .4 .5Business 17.3.......................................... 14.2 14.2 17.6 16.0 18.3 .4 .6 .5 .9 .5 .8Computer Science 1.0.................................. 1.5 1.5 2.8 1.1 .8 .1 .2 .1 .4 .2 .2Construction Trade/Industrial Arts 1.9..................... 1.6 1.9 1.2 1.3 2.3 .2 .2 .1 .3 .3 .2Law and Legal Studies 3.5.............................. 2.2 2.4 2.2 2.0 4.4 .2 .2 .2 .3 .2 .4Liberal Arts/General Studies 11.7.......................... 7.8 10.1 7.7 14.9 10.5 .5 .5 .5 .8 .5 .8Mathematics .8....................................... .5 .9 1.3 .8 .8 .1 .1 .1 .2 .1 .2Military Technologies .5................................ .2 .3 .3 .1 .7 .1 .1 .1 .1 .1 .2Other college 5.9....................................... 3.8 5.5 5.3 8.2 4.9 .3 .4 .3 .4 .6 .5Other vocational 5.5.................................... 5.0 7.5 5.1 6.2 5.1 .3 .5 .5 .5 .4 .6Not reported 8.0....................................... 9.1 9.8 8.5 8.6 7.6 .3 .5 .4 .8 .5 .6Not applicable10 32.0.................................... 43.6 37.6 26.5 30.5 32.2 .6 1.0 .4 .6 .9 .9
PRIOR TO BEGINNING/ACQUIRING THEBUSINESS, THE OWNER HAD CLOSERELATIVES WHO OWNED A BUSINESS ORHAD BEEN SELF ~EMPLOYED4
Yes 49.9............................................... 37.6 30.9 43.3 49.1 51.8 1.2 1.0 .9 1.5 1.1 1.6No 45.2................................................ 57.2 61.1 52.5 45.2 43.8 1.2 .9 .8 1.6 .9 1.7Not reported 4.9....................................... 5.2 7.9 4.2 5.6 4.5 .2 .4 .4 .5 .3 .4
OWNER WORKED FOR THOSE RELATIVES 4
Yes 21.3............................................... 15.1 10.7 17.7 18.1 23.7 .8 .8 .5 1.3 1.1 1.0No 26.4................................................ 20.4 18.5 23.1 28.8 25.8 .9 .6 .5 1.4 1.1 1.3Not reported 7.1....................................... 7.3 9.6 6.7 7.8 6.7 .3 .6 .4 .6 .4 .5Not applicable11 45.2.................................... 57.2 61.1 52.5 45.2 43.8 1.2 .9 .8 1.6 .9 1.7
See footnotes at end of table.
16 CHARACTERISTICS OF BUSINESS OWNERS 1992 ECONOMIC CENSUS

Table 1. Summary Characteristics of Business Owners and Their Businesses: 1992 mCon.[Detail may not add to total due to rounding. For meaning of abbreviations and symbols, see introductory text. For explanation of terms, see appendix A]
Item
Standard error of estimate3
for columnmAllbusinesses1
Hispanic~owned
businesses1Black~ownedbusinesses1
Otherminority~
ownedbusinesses1 2
Women~owned
businesses1
Nonminoritymale~ownedbusinesses1
A B C D E F A B C D E F
YEARS OF WORK EXPERIENCE PRIOR TOSTARTING/ACQUIRING THE BUSINESS 4
None (did not work) 7.6................................. 12.8 9.7 13.7 9.0 6.3 .4 .5 .6 .9 .7 .5Less than 2 years 6.3................................... 7.8 6.4 8.5 6.9 5.7 .4 .6 .3 .8 .8 .52 to 5 years 14.2........................................ 16.5 12.7 18.9 13.8 14.1 .5 .7 .5 1.1 .5 .86 to 9 years 14.1........................................ 13.0 13.2 14.7 13.4 14.5 .5 .6 .4 .8 .6 .910 to 19 years 26.4...................................... 25.4 26.2 23.6 27.6 26.0 .6 .9 .6 .6 .8 1.020 years or more 25.9................................... 17.7 22.3 14.8 23.3 28.3 .9 .5 .3 .6 1.2 1.6Not reported 5.5....................................... 6.7 9.4 5.8 6.0 5.0 .3 .5 .4 .5 .5 .5
PREVIOUS YEARS OF WORK EXPERIENCEIN A MANAGERIAL CAPACITY 4
None 33.9.............................................. 35.1 40.6 28.1 36.0 32.7 .7 .8 .7 .9 .8 1.1Less than 2 years 8.0................................... 7.9 7.4 9.1 7.9 7.9 .5 .4 .6 .4 .6 .62 to 5 years 13.8........................................ 12.6 12.1 16.0 13.2 14.2 .4 .6 .5 1.0 .6 .76 to 9 years 9.0........................................ 7.9 6.7 9.4 9.0 9.0 .3 .5 .4 .8 .6 .510 to 19 years 11.4...................................... 9.3 8.3 10.3 10.2 12.3 .6 .6 .5 .5 .5 .920 years or more 8.2................................... 4.5 3.6 4.6 5.8 10.0 .5 .5 .2 .5 .3 .8Not sure 2.4........................................... 2.9 2.4 3.1 2.5 2.3 .2 .5 .1 .5 .4 .2Not reported 5.7....................................... 7.0 9.1 5.7 6.5 5.1 .3 .5 .6 .5 .4 .5Not applicable12 7.6.................................... 12.8 9.7 13.7 9.0 6.3 .4 .5 .6 .9 .6 .5
PREVIOUS YEARS OF WORK EXPERIENCEAS THE OWNER OF ANOTHER BUSINESS 4
None 65.5.............................................. 65.5 69.9 56.9 67.8 64.6 .7 1.3 1.0 .8 .5 1.2Less than 2 years 3.0................................... 2.6 2.7 4.4 3.3 2.7 .2 .2 .3 .4 .5 .32 to 5 years 5.6........................................ 4.8 4.3 7.4 4.9 5.9 .3 .4 .3 .8 .4 .46 to 9 years 3.3........................................ 2.4 1.5 3.9 2.4 3.9 .2 .2 .2 .4 .2 .410 to 19 years 4.8...................................... 2.9 1.6 4.7 3.2 5.9 .4 .3 .2 .5 .3 .520 years or more 3.9................................... 1.6 .8 2.1 2.3 5.1 .5 .2 .2 .2 .1 .7Not sure .8........................................... 1.0 .8 1.6 .8 .9 .1 .2 .2 .2 .1 .2Not reported 5.4....................................... 6.3 8.7 5.4 6.3 4.8 .3 .6 .5 .4 .3 .5Not applicable12 7.6.................................... 12.8 9.7 13.7 9.0 6.3 .4 .5 .6 .9 .6 .5
PREVIOUSLY WORKED FOR A BUSINESSWHOSE GOODS/SERVICE(S) WERESIMILAR TO THOSE PROVIDED BY THEBUSINESS4
Yes 42.0............................................... 43.2 35.3 40.7 36.2 45.1 .7 1.0 1.0 1.7 .9 1.3No 44.4................................................ 36.9 45.4 39.6 48.2 43.1 .7 1.3 1.4 1.4 1.1 1.2Not reported 6.0....................................... 7.1 9.6 6.0 6.6 5.5 .3 .5 .5 .5 .6 .5Not applicable12 7.6.................................... 12.8 9.7 13.7 9.0 6.3 .4 .5 .6 .9 .7 .5
TOTAL 1992 PERSONAL INCOME 4
Less than $5,000 14.2................................... 14.3 17.8 11.4 21.0 10.8 .2 .9 .6 .9 .4 .3$5,000 to $9,999 9.8................................... 13.0 11.6 9.0 12.2 8.4 .5 .7 .6 .5 .7 .8$10,000 to $14,999 9.0................................. 13.7 11.8 9.8 9.9 8.0 .4 .6 .5 .5 .5 .5$15,000 to $24,999 14.8................................. 16.1 15.6 15.9 14.3 14.9 .6 .6 .7 .9 .4 1.0$25,000 to $34,999 10.6................................. 11.2 10.9 11.7 10.4 10.6 .4 .4 .4 .4 .5 .7$35,000 to $49,999 11.0................................. 8.5 9.4 11.3 9.8 11.9 .5 .6 .4 .7 .6 .8$50,000 to $74,999 8.3................................. 6.4 5.3 9.8 5.8 9.7 .3 .3 .2 1.2 .5 .6$75,000 to $99,999 3.8................................. 2.7 1.9 4.2 2.0 4.9 .2 .2 .2 .3 .1 .3$100,000 to $149,999 3.7............................... 2.0 1.0 4.0 1.9 4.8 .3 .1 .1 .4 .2 .5$150,000 or more 5.3................................... 2.8 1.4 4.7 2.6 7.0 .3 .2 .2 .2 .4 .5Not reported 9.5....................................... 9.2 13.3 8.2 10.0 9.2 .4 .4 .6 .7 .8 .6
YEAR THAT THE BUSINESS WASESTABLISHED 6
Before 1970 10.3........................................ 6.1 9.4 6.1 8.5 11.8 .4 .6 .4 .6 .5 1.01970 to 1979 13.4....................................... 10.6 10.7 11.0 10.5 15.4 .5 .6 .4 .9 .7 .81980 to 1985 17.6....................................... 15.4 14.2 16.8 16.7 18.2 .4 .6 .4 .8 .8 .71986 to 1988 15.5....................................... 14.1 13.2 16.1 15.4 15.6 .5 .8 .5 .6 .9 .61989 6.9.............................................. 6.3 6.7 7.8 6.3 7.4 .3 .3 .3 .7 .3 .51990 7.9.............................................. 8.9 7.5 8.9 8.9 7.3 .4 .5 .3 1.0 .5 .61991 8.2.............................................. 10.1 9.0 10.8 9.1 7.5 .3 .6 .4 .7 .7 .31992 13.5.............................................. 18.9 16.2 17.5 16.5 11.4 .6 .8 .6 .7 .8 .7Not reported 6.6....................................... 9.6 13.0 5.0 8.1 5.5 .5 .8 .3 .4 .9 .5
YEAR THE OWNER ACQUIRED THEBUSINESS4
Before 1970 6.8........................................ 4.1 6.7 3.7 5.1 7.9 .3 .5 .3 .4 .4 .61970 to 1979 13.5....................................... 10.0 10.2 10.6 10.7 15.3 .4 .4 .5 .9 .8 .81980 to 1985 17.8....................................... 16.0 14.5 17.3 17.0 18.4 .5 .5 .3 .9 .9 .61986 to 1988 16.3....................................... 14.2 13.0 15.2 16.6 16.4 .5 .6 .4 .8 .9 .81989 7.5.............................................. 6.8 6.7 8.5 6.5 8.1 .4 .2 .4 .4 .3 .61990 7.7.............................................. 9.0 7.4 9.6 8.3 7.3 .4 .4 .3 .7 .4 .51991 8.3.............................................. 9.8 9.0 10.9 9.5 7.5 .4 .6 .4 .6 .7 .31992 12.8.............................................. 18.4 16.5 16.7 15.4 10.9 .5 1.0 .6 1.2 .7 .6Not reported 9.3....................................... 11.8 16.0 7.5 10.9 8.2 .4 .7 .5 .5 .8 .6
See footnotes at end of table.
1992 ECONOMIC CENSUS CHARACTERISTICS OF BUSINESS OWNERS 17

Table 1. Summary Characteristics of Business Owners and Their Businesses: 1992 mCon.[Detail may not add to total due to rounding. For meaning of abbreviations and symbols, see introductory text. For explanation of terms, see appendix A]
Item
Standard error of estimate3
for columnmAllbusinesses1
Hispanic~owned
businesses1Black~ownedbusinesses1
Otherminority~
ownedbusinesses1 2
Women~owned
businesses1
Nonminoritymale~ownedbusinesses1
A B C D E F A B C D E F
HOW THE OWNER ACQUIRED THEBUSINESS4
Founded 68.9........................................... 67.4 64.9 57.0 69.6 69.2 .8 1.1 1.1 1.1 .6 1.4Received transfer of ownership/gift 10.5.................... 8.9 4.7 16.9 8.3 11.7 .7 .2 .3 1.1 .6 1.1Purchased 10.1......................................... 9.1 12.2 15.8 9.5 10.2 .7 .5 .8 .6 .4 1.0Inherited 2.7........................................... 2.1 1.6 2.6 2.7 2.7 .2 .3 .2 .2 .3 .3Other means 2.2....................................... 5.5 6.9 2.6 3.3 1.3 .2 .5 .6 .2 .3 .3Not reported 5.6....................................... 7.0 9.6 5.2 6.6 4.9 .2 .5 .4 .5 .4 .4
REASON FOR BECOMING AN OWNER IN THEBUSINESS4
To have a primary source of income 21.3................... 24.6 17.3 27.0 17.0 23.1 .5 1.0 .4 1.0 .6 .7To have a secondary source of income 25.6................ 19.3 28.8 23.1 27.7 24.9 .7 1.0 .6 1.2 1.2 1.2To have work which conforms to owner’s healthlimitations 1.6......................................... 1.5 1.7 1.1 2.3 1.2 .2 .5 .1 .3 .3 .2
To have work not available elsewhere in the job market 1.5.. 1.4 1.4 1.5 1.6 1.4 .2 .3 .2 .2 .3 .3To have more freedom to meet family responsibilities 7.6.... 7.1 7.4 6.5 11.4 5.8 .2 .6 .3 .5 .7 .4To bring a new idea to the marketplace 2.6................ 2.0 2.2 3.2 3.2 2.2 .3 .2 .2 .4 .4 .3To advance in my profession 6.2......................... 5.8 5.7 6.3 5.6 6.6 .4 .4 .3 .4 .5 .6To be my own boss 21.5................................. 26.5 21.3 20.8 18.5 22.8 .6 .6 .6 .8 .6 1.0Other reason 6.7....................................... 5.6 6.2 5.1 6.6 7.0 .6 .6 .4 .5 .4 .9Not reported 5.5....................................... 6.1 8.1 5.4 6.2 5.0 .3 .6 .3 .6 .3 .5
TOTAL CAPITAL NEEDED BY OWNER TOSTART/ACQUIRE THE BUSINESS 4
None 25.0.............................................. 27.5 32.2 18.0 29.9 22.6 .9 .7 .9 .5 1.1 1.1Less than $5,000 32.0................................... 31.1 34.3 20.7 34.2 31.3 1.0 1.1 .6 1.1 1.3 1.1$5,000 to $9,999 9.6................................... 11.3 8.8 10.6 7.7 10.5 .5 .7 .4 1.2 .6 .7$10,000 to $24,999 11.4................................. 10.5 7.3 14.7 8.5 12.9 .6 .5 .4 1.0 .4 1.0$25,000 to $49,999 5.7................................. 4.8 3.2 11.6 4.5 6.3 .4 .4 .2 .5 .4 .7$50,000 to $99,999 4.6................................. 3.7 1.6 9.2 4.2 4.7 .2 .3 .1 .7 .4 .3$100,000 to $249,999 3.0............................... 2.0 .9 6.3 2.6 3.2 .3 .2 .1 .5 .2 .4$250,000 to $999,999 1.4............................... .8 .3 2.5 .9 1.7 .1 .1 .1 .2 .1 .2$1,000,000 or more .5................................. .2 .1 .8 .4 .5 – .1 – .2 .1 .1Not reported 6.8....................................... 8.1 11.2 5.7 7.3 6.4 .3 .6 .4 .6 .4 .5
PERCENT OF TOTAL CAPITAL BORROWEDBY OWNER, BY MEANS OF PERSONALLOANS, TO START/ACQUIRE THEBUSINESS4
None 44.0.............................................. 42.7 37.9 41.7 42.3 45.3 .7 1.0 .6 1.1 1.1 .9Less than 10 percent 2.5................................ 3.0 3.2 3.6 2.4 2.4 .3 .2 .3 .4 .3 .410 to 24 percent 2.3.................................... 2.8 2.6 4.2 2.2 2.2 .1 .2 .3 .5 .3 .225 to 49 percent 3.2.................................... 3.3 2.5 7.0 2.2 3.7 .2 .4 .3 .2 .2 .450 to 74 percent 4.4.................................... 4.0 2.9 8.8 3.8 4.6 .2 .3 .2 .5 .2 .275 to 99 percent 5.3.................................... 3.9 3.3 6.0 4.3 5.9 .3 .2 .3 .6 .3 .4100 percent 5.9........................................ 4.5 3.8 4.4 5.1 6.4 .4 .3 .4 .2 .6 .5Not reported 7.3....................................... 8.4 11.5 6.5 7.9 6.9 .3 .5 .5 .6 .4 .5Not applicable13 25.0.................................... 27.5 32.2 18.0 29.9 22.6 .9 .7 .9 .5 1.1 1.1
SOURCES OF BORROWED CAPITAL FOROWNER4
Personal loan using home mortgage/equity line of credit 4.3. 4.4 2.9 6.8 4.1 4.4 .2 .4 .2 .6 .3 .4Personal credit card 2.6................................. 3.2 3.1 4.1 2.6 2.5 .3 .3 .2 .6 .3 .4Personal loan from spouse 1.0........................... .9 1.2 1.4 1.3 .8 .2 .1 .2 .3 .3 .2Personal loan from family 5.2............................ 6.2 3.8 12.0 4.8 5.0 .2 .5 .2 1.0 .4 .4Other personal loan 6.1................................. 5.7 4.6 9.4 4.9 6.8 .4 .2 .3 .6 .2 .7Not reported 14.4....................................... 13.1 17.5 12.8 13.0 15.2 .4 .5 .6 .7 .3 .5Not applicable14 69.1.................................... 70.2 70.1 59.6 72.2 67.9 .7 .8 .8 1.2 .5 1.1
SOURCES OF NON~BORROWED CAPITALFOR OWNER4
None~~100 percent borrowed capital 5.9................... 4.5 3.8 4.4 5.1 6.4 .4 .3 .4 .2 .6 .5Use of owner’s personal/family physical assets (building,motor vehicle, equipment, etc.) 16.6...................... 13.0 12.3 12.8 16.1 17.2 .9 .5 .4 .9 1.0 1.0
Proceeds from the sale of owner’s personal assets 2.2...... 3.0 1.5 3.0 2.3 2.0 .2 .5 .2 .2 .3 .3Owner’s personal/family savings 36.5...................... 35.0 30.5 47.2 33.2 38.0 .6 .9 .8 1.5 1.2 .8Other source 3.5....................................... 5.2 6.7 3.4 3.6 3.3 .3 .6 .6 .4 .3 .4Not reported 10.4....................................... 11.7 13.0 11.3 9.9 10.4 .2 .7 .6 .8 .4 .5Not appliable13 25.0..................................... 27.5 32.2 18.0 29.9 22.6 .9 .7 .9 .5 1.1 1.1
MEASURES TAKEN BY OWNER IF THEBUSINESS WAS PRODUCING INADEQUATECASH FLOW OR LOW SALES AFTER THEINITIAL INVESTMENT OF START ~UP/ACQUISITION CAPITAL 4
Did not occur 26.5....................................... 25.6 13.2 28.8 21.8 29.2 .6 .7 .5 1.2 .5 1.0Relied upon own income from other business/job 16.6....... 13.6 20.9 16.2 16.8 16.6 .8 .8 .5 .7 .9 1.1Invested additional capital 9.2............................ 7.0 5.8 10.5 9.2 9.3 .4 .4 .1 .8 .8 .5Received help from family 8.0............................ 9.2 8.8 12.7 8.1 7.6 .4 .9 .6 .5 .5 .6Other measures taken 18.3............................... 17.8 23.6 16.4 19.8 17.5 .3 .7 .9 .8 .7 .6Not reported 33.3....................................... 36.0 43.3 26.8 37.4 31.1 1.0 .7 1.0 .9 1.2 1.3
See footnotes at end of table.
18 CHARACTERISTICS OF BUSINESS OWNERS 1992 ECONOMIC CENSUS

Table 1. Summary Characteristics of Business Owners and Their Businesses: 1992 mCon.[Detail may not add to total due to rounding. For meaning of abbreviations and symbols, see introductory text. For explanation of terms, see appendix A]
Item
Standard error of estimate3
for columnmAllbusinesses1
Hispanic~owned
businesses1Black~ownedbusinesses1
Otherminority~
ownedbusinesses1 2
Women~owned
businesses1
Nonminoritymale~ownedbusinesses1
A B C D E F A B C D E F
WEEKS SPENT IN 1992 BY THE OWNERMANAGING OR WORKING IN THEBUSINESS4
None 8.4.............................................. 9.6 6.8 8.8 6.1 9.6 .7 .6 .4 .5 .7 1.2Less than 12 weeks 12.4................................. 7.5 7.9 13.1 12.3 12.7 .5 .8 .4 .7 .8 .812 to 23 weeks 6.2..................................... 5.3 7.3 5.7 7.7 5.4 .3 .3 .4 .4 .8 .624 to 35 weeks 6.4..................................... 8.1 8.9 6.3 7.9 5.5 .3 .7 .4 .6 .5 .436 to 47 weeks 7.1..................................... 8.0 9.2 6.8 8.2 6.4 .4 .4 .4 .5 .8 .748 weeks or more 51.3................................... 51.3 46.3 51.3 48.1 53.2 .6 .9 1.0 .9 1.5 1.2Not reported 8.3....................................... 10.2 13.6 7.9 9.7 7.2 .2 .6 .4 .6 .8 .5
AVERAGE NUMBER OF HOURS PER WEEKIN 1992 SPENT BY THE OWNER MANAGINGOR WORKING IN THE BUSINESS4
None 8.4.............................................. 9.2 6.7 8.6 6.1 9.7 .7 .5 .4 .5 .7 1.2Less than 10 hours 17.1................................. 10.5 14.0 15.8 18.0 17.3 .8 .5 .7 .8 1.3 .910 to 19 hours 10.5...................................... 10.3 13.9 8.5 13.0 9.1 .5 .5 .9 .6 .9 .820 to 29 hours 8.9...................................... 9.4 12.1 7.8 11.2 7.6 .3 .6 .6 .6 .9 .630 to 39 hours 6.9...................................... 6.4 6.7 5.5 7.8 6.5 .2 .3 .2 .3 .5 .440 hours 6.4........................................... 10.4 7.3 6.0 6.8 6.0 .4 .4 .4 .6 .7 .541 to 49 hours 10.6...................................... 10.5 8.2 9.2 8.7 11.8 .5 .5 .6 .5 .6 .950 to 59 hours 10.3...................................... 10.2 7.6 11.3 8.9 11.1 .4 .4 .6 .4 .3 .760 hours or more 13.6................................... 14.5 12.4 20.7 11.6 14.3 .2 .7 .5 .8 .7 .2Not reported 7.2....................................... 8.6 11.2 6.6 7.7 6.7 .4 .7 .5 .5 .5 .6
SOURCES FROM WHICH OWNER RECEIVEDGRANTS, MANAGEMENT TRAINING, ORTECHNICAL ASSISTANCE IN THEBUSINESS START ~UP OR OPERATION4
No assistance received 64.3.............................. 61.2 46.8 67.1 58.5 67.8 .7 1.1 .7 .9 .8 .9Federal government 1.6................................. 2.5 3.4 1.3 1.7 1.5 .2 .4 .4 .3 .2 .3State and/or local government .7........................ .7 1.6 1.3 1.2 .4 .1 .1 .3 .7 .3 .1College or university 1.3................................ 1.4 2.2 1.8 1.6 1.1 .2 .2 .2 .2 .3 .2Other business/franchisor 3.2............................ 1.9 4.1 4.0 4.1 2.8 .1 .2 .2 .3 .3 .3Other source 26.8....................................... 29.1 39.6 22.1 31.6 24.1 .8 1.1 .5 .9 .7 1.0Not reported 5.3....................................... 6.1 8.8 5.0 5.9 4.8 .2 .5 .5 .7 .3 .4
SOURCES FROM WHICH FIRM RECEIVEDGRANTS, MANAGEMENT TRAINING, ORTECHNICAL ASSISTANCE IN THEBUSINESS START ~UP OR OPERATION6
No assistance received 54.4.............................. 51.6 43.3 52.9 48.9 57.8 1.1 1.3 .7 1.0 .7 1.5Federal government 1.6................................. 2.7 3.6 1.4 1.8 1.3 .2 .4 .4 .4 .2 .4State and/or local government .7........................ .6 1.6 .8 1.3 .4 .1 .1 .3 .3 .3 .1College or university 1.3................................ 1.2 2.2 1.9 1.5 1.2 .2 .2 .3 .3 .3 .2Other business/franchisor 3.4............................ 1.9 4.1 4.6 4.3 3.0 .2 .2 .2 .4 .3 .3Other source 37.7....................................... 39.4 43.3 38.8 42.1 35.2 1.1 1.2 .6 1.1 .6 1.5Not reported 5.0....................................... 6.0 8.7 3.6 5.6 4.5 .3 .6 .5 .7 .4 .5
TOTAL CAPITAL NEEDED BY FIRM TOSTART/ACQUIRE THE BUSINESS 6
None 25.6.............................................. 28.8 32.7 18.5 30.8 22.8 .9 .7 .9 .5 1.1 1.0Less than $5,000 34.3................................... 32.0 34.5 22.7 36.0 34.0 1.2 1.1 .7 1.0 1.5 1.4$5,000 to $9,999 9.0................................... 10.9 8.8 9.9 7.4 9.8 .5 .9 .4 .5 .6 .8$10,000 to $24,999 10.0................................. 9.7 6.9 13.9 8.0 10.9 .4 .4 .4 .8 .6 .7$25,000 to $49,999 5.2................................. 4.1 2.9 10.4 3.6 5.9 .3 .4 .2 .5 .4 .6$50,000 to $99,999 4.3................................. 3.0 1.5 9.0 3.8 4.5 .3 .2 .1 .5 .4 .4$100,000 to $249,999 2.9............................... 1.9 .8 6.8 2.3 3.1 .2 .1 .1 .4 .2 .3$250,000 to $999,999 1.6............................... .9 .3 3.0 1.0 2.0 .1 .1 – .2 .1 .1$1,000,000 or more .8................................. .3 .2 1.5 .4 1.0 .1 .1 – .2 .1 .1Not reported 6.4....................................... 8.4 11.4 4.4 6.8 6.0 .3 .8 .4 .5 .6 .5
PERCENT OF TOTAL CAPITAL, BY MEANSOF BUSINESS LOANS, BORROWED BYFIRM TO START/ACQUIRE THE BUSINESS 6
None 43.0.............................................. 41.8 37.6 41.3 42.1 43.7 .9 .8 .6 1.3 1.1 1.1Less than 10 percent 2.6................................ 3.2 3.1 3.3 2.5 2.5 .3 .2 .3 .5 .3 .510 to 24 percent 2.3.................................... 2.6 2.5 3.7 2.2 2.4 .1 .2 .3 .7 .2 .225 to 49 percent 3.4.................................... 3.2 2.3 7.4 2.0 4.0 .2 .4 .3 .5 .2 .450 to 74 percent 4.7.................................... 3.8 2.9 9.2 3.5 5.3 .2 .2 .2 .7 .3 .275 to 99 percent 5.7.................................... 3.8 3.3 6.7 4.5 6.5 .4 .2 .3 .3 .3 .5100 percent 5.6........................................ 4.1 4.0 4.3 4.8 6.3 .3 .3 .4 .3 .5 .4Not reported 7.0....................................... 8.5 11.6 5.4 7.6 6.6 .3 .6 .5 .5 .5 .5Not applicable15 25.6.................................... 28.8 32.7 18.5 30.8 22.8 .9 .7 .9 .5 1.1 1.0
SOURCES OF BORROWED CAPITAL FORFIRM6
Business loan from banking or commercial lendinginstitution 11.7......................................... 7.6 6.6 12.3 8.6 13.7 .3 .6 .3 .6 .4 .5
Government~guaranteed business loan from banking orcommercial lending institution .4....................... .3 .7 .7 .4 .4 .1 .1 .1 .1 .1 –
Business loan from Federal, State or local government .3.. .1 .3 .4 .2 .3 .1 – .1 .1 .1 .1Business loan from investment company/profit ornonprofit private source .6............................. .3 .5 1.1 .5 .6 .1 .1 .1 .2 .1 .2
Business loan from previous owner 1.9................... 1.6 .6 4.8 1.7 2.0 .2 .2 .1 .3 .2 .3Business trade credit from supplier .9.................... .7 .6 1.4 .8 1.0 .1 .1 .1 .3 .1 .2Other business loan 1.6................................. 1.6 .9 2.7 1.5 1.6 .1 .2 .1 .4 .1 .2
See footnotes at end of table.
1992 ECONOMIC CENSUS CHARACTERISTICS OF BUSINESS OWNERS 19

Table 1. Summary Characteristics of Business Owners and Their Businesses: 1992 mCon.[Detail may not add to total due to rounding. For meaning of abbreviations and symbols, see introductory text. For explanation of terms, see appendix A]
Item
Standard error of estimate3
for columnmAllbusinesses1
Hispanic~owned
businesses1Black~ownedbusinesses1
Otherminority~
ownedbusinesses1 2
Women~owned
businesses1
Nonminoritymale~ownedbusinesses1
A B C D E F A B C D E F
SOURCES OF BORROWED CAPITAL FORFIRM6
mCon.
Not reported 15.6....................................... 18.1 20.1 19.2 15.1 15.4 .6 .8 .6 .9 .6 .9Not applicable16 68.6.................................... 70.6 70.3 59.8 72.9 66.5 .7 .8 .8 1.3 .3 1.2
MEASURES TAKEN BY FIRM IF THEBUSINESS WAS PRODUCING INADEQUATECASH FLOW OR LOW SALES AFTER THEINITIAL INVESTMENT OF START ~UP/ACQUISITION CAPITAL 6
Did not occur 21.4....................................... 21.3 11.9 22.2 17.5 23.6 .8 .9 .4 1.0 .4 1.2Operated using existing partnership’s/subchapter Scorporation’s cash reserves 2.0......................... 1.7 .7 2.8 1.7 2.2 .1 .1 .1 .3 .1 .2
Invested additional capital 8.9............................ 6.4 5.7 11.4 8.0 9.6 .3 .4 .1 .8 .5 .5Delayed payment to suppliers 4.5........................ 4.3 4.0 6.3 3.6 4.9 .2 .4 .2 .4 .3 .2Other measures taken 27.1............................... 25.8 26.4 30.4 28.1 26.5 .5 .9 .9 1.2 .8 .8Not reported 43.4....................................... 46.5 56.7 37.1 48.1 40.6 .7 1.1 1.0 .9 .9 1.1
CUSTOMERS THAT ACCOUNTED FOR 10PERCENT OR MORE OF 1992 TOTAL SALESOF GOODS/SERVICES6
Federal government 2.6................................. 3.8 4.4 3.3 2.5 2.4 .2 .3 .2 .4 .2 .4State government 2.3................................... 2.8 3.6 3.1 2.1 2.4 .2 .3 .3 .5 .3 .3Local government (including school districts,transportation authorities, etc.) 2.8...................... 3.1 3.5 3.3 3.0 2.7 .2 .3 .3 .3 .4 .3
Other business and/or corporations 30.1................... 25.0 16.4 25.8 23.5 34.4 .8 .5 .8 1.1 1.1 1.2Individuals 52.8......................................... 46.7 45.6 54.2 51.5 54.1 .8 1.5 .8 1.6 1.1 1.5All others 6.0.......................................... 6.5 6.0 9.4 4.9 6.3 .3 .4 .4 .7 .2 .5Not reported 22.6....................................... 27.9 32.7 17.5 27.5 19.6 .8 1.0 1.0 .9 1.3 1.2
DURING 1992, THE GEOGRAPHIC AREATHAT BEST DESCRIBES THEMARKETPLACE WHERE THE BUSINESS’SGOODS/SERVICES WERE SOLD6
Neighborhood 29.7...................................... 31.9 37.3 42.2 35.1 26.0 5.3 5.1 6.1 7.0 6.4 4.7City/county 48.7......................................... 48.5 42.8 39.7 46.3 50.6 8.7 7.7 6.9 6.6 8.4 9.0Regional (adjoining counties and/or states) 22.2............. 13.3 12.1 14.3 20.0 24.5 4.0 2.1 2.0 2.5 3.7 4.4National 6.2........................................... 3.8 3.9 6.8 6.3 6.4 1.1 .7 .7 1.3 1.2 1.2International 1.8........................................ 3.0 1.1 4.4 1.4 1.8 .4 .5 .2 .9 .3 .5Not reported 9.4....................................... 13.1 17.5 8.0 9.7 8.8 1.7 2.4 2.9 1.5 1.9 1.7
DURING 1992, THE PERCENT OF MINORITYCUSTOMERS SERVED BY THE BUSINESS6
25 percent or less 45.0................................... 25.0 17.5 25.9 45.1 47.5 .6 .7 .7 1.3 .7 .826 to 50 percent 7.8.................................... 10.5 8.1 12.5 6.4 8.2 .3 .8 .3 .5 .6 .651 to 75 percent 3.3.................................... 8.2 6.0 6.8 3.7 2.6 .2 .8 .4 .6 .4 .476 to 90 percent 1.8.................................... 6.3 6.4 6.2 1.6 1.3 .2 .5 .4 .8 .1 .4More than 90 percent 6.3............................... 17.4 28.4 16.9 6.6 4.5 .3 1.0 .9 .9 .5 .5Don’t know 25.6......................................... 20.6 15.8 23.4 25.7 26.3 .7 .9 .7 1.0 .8 1.0Not reported 10.2....................................... 12.0 17.9 8.3 11.0 9.5 .3 .9 .5 .8 .9 .7
BUSINESS’S NET PROFIT (OR LOSS)BEFORE TAXES AS REPORTED ON ITS TAXRETURN6
Net Profit$100,000 or more 2.2................................. 1.4 .6 3.4 1.0 3.0 .1 .1 – .2 .1 .1$25,000 to $99,999 8.0............................... 6.7 2.5 10.1 4.2 10.3 .3 .3 .2 .4 .2 .5$10,000 to $24,999 8.3............................... 9.2 4.5 11.7 5.1 9.8 .3 .5 .2 .8 .4 .5Less than $10,000 38.5................................ 36.9 35.7 34.7 42.2 36.9 .7 1.1 1.2 1.2 1.1 1.1
Net LossLess than $10,000 15.6................................ 15.7 22.8 14.9 21.1 12.6 .6 1.0 .5 .8 .8 .7$10,000 to $24,999 2.6............................... 3.1 2.7 4.4 2.8 2.3 .3 .3 .2 .3 .3 .3$25,000 to $99,999 1.5............................... 1.4 1.3 2.0 1.0 1.7 .2 .2 .1 .3 .2 .3$100,000 or more .7................................. .4 .3 .9 .3 1.0 .1 – .1 .1 – .1
Not reported 22.5....................................... 25.2 29.6 17.8 22.4 22.5 .6 1.1 .8 .8 1.0 1.1
DURING 1992, THE PERCENT OF OWNER’STOTAL PERSONAL INCOME PRODUCED ASA RESULT OF THE BUSINESS 4
None 12.9.............................................. 12.5 17.7 15.2 15.5 11.5 .8 .7 .4 1.0 1.4 .9Less than 10 percent 22.9................................ 17.4 22.9 19.4 25.5 22.0 .8 1.1 .5 .9 .6 1.210 to 24 percent 8.4.................................... 8.5 9.5 9.5 8.1 8.5 .4 .5 .6 .8 .4 .625 to 49 percent 6.7.................................... 6.1 6.2 7.9 6.7 6.6 .4 .5 .4 .6 .4 .550 to 74 percent 5.5.................................... 5.8 5.0 6.5 5.8 5.2 .2 .5 .4 .6 .4 .375 to 99 percent 11.1.................................... 9.3 5.9 11.1 8.1 13.0 .4 .4 .5 .5 .4 .6100 percent 24.1........................................ 30.2 18.8 22.5 20.7 25.6 .5 .8 .5 .8 .9 .9Not reported 8.5....................................... 10.2 13.9 7.9 9.6 7.7 .3 .6 .5 .5 .4 .5
See footnotes at end of table.
20 CHARACTERISTICS OF BUSINESS OWNERS 1992 ECONOMIC CENSUS

Table 1. Summary Characteristics of Business Owners and Their Businesses: 1992 mCon.[Detail may not add to total due to rounding. For meaning of abbreviations and symbols, see introductory text. For explanation of terms, see appendix A]
Item
Standard error of estimate3
for columnmAllbusinesses1
Hispanic~owned
businesses1Black~ownedbusinesses1
Otherminority~
ownedbusinesses1 2
Women~owned
businesses1
Nonminoritymale~ownedbusinesses1
A B C D E F A B C D E F
IMPACT OF THE FOLLOWING ISSUES UPONTHE BUSINESS’S PROFITABILITY 6
Health insurance costsStrong positive impact 3.4............................. 3.5 4.0 4.9 2.5 3.8 .2 .5 .1 .4 .2 .4Minor positive impact 1.6.............................. 1.6 1.2 2.5 1.2 1.7 .3 .2 .2 .2 .2 .4Neutral 11.9.......................................... 10.2 8.8 13.7 10.1 13.0 .6 .5 .4 .9 .6 .8Minor negative impact 7.1............................. 4.5 3.1 6.9 5.5 8.2 .3 .2 .2 .6 .6 .5Strong negative impact 8.0............................ 6.4 5.0 5.7 6.4 9.1 .4 .5 .4 .5 .3 .8Not applicable 42.2.................................... 38.2 38.1 38.0 47.9 39.7 .7 1.2 .7 1.4 .8 1.2Don’t know 13.6....................................... 18.9 15.6 16.2 12.8 13.6 .7 .7 .6 .8 .9 1.4Not reported 12.3..................................... 16.8 24.2 12.2 13.7 10.8 .3 .9 .8 .4 .7 .5
Credit market conditionsStrong positive impact 3.0............................. 3.8 3.3 3.7 2.8 3.0 .2 .4 .2 .5 .4 .3Minor positive impact 2.6.............................. 2.3 2.0 3.5 2.0 2.9 .2 .2 .2 .3 .2 .3Neutral 16.5.......................................... 12.9 10.4 17.0 12.3 19.3 .6 .5 .4 1.0 .8 .8Minor negative impact 5.2............................. 4.5 3.6 5.8 4.1 5.8 .2 .4 .2 .5 .5 .4Strong negative impact 4.8............................ 4.7 4.7 5.3 4.6 4.8 .6 .6 .3 .4 .5 .7Not applicable 36.7.................................... 31.5 31.8 31.5 41.6 34.7 .7 1.1 .8 1.3 1.0 1.1Don’t know 17.6....................................... 20.9 16.6 19.8 17.9 17.2 .6 .9 .9 1.0 .7 1.1Not reported 13.6..................................... 19.5 27.6 13.4 14.8 12.2 .3 .7 .7 .6 .8 .6
IRS regulations or penaltiesStrong positive impact 2.8............................. 3.1 4.4 3.2 2.4 2.8 .2 .3 .5 .4 .2 .4Minor positive impact 2.0.............................. 2.1 2.3 2.7 1.7 2.1 .2 .3 .2 .3 .3 .3Neutral 17.1.......................................... 14.5 11.8 18.6 14.4 18.9 .5 .5 .6 1.0 .8 .9Minor negative impact 8.9............................. 7.4 5.2 7.9 6.5 10.5 .4 .5 .3 .7 .6 .4Strong negative impact 7.5............................ 6.9 6.3 5.5 4.8 9.1 .6 .5 .4 .5 .4 1.1Not applicable 31.5.................................... 26.2 26.0 28.4 38.1 28.6 .6 1.2 .8 1.4 .8 1.0Don’t know 16.6....................................... 21.0 17.7 20.1 17.2 15.9 .7 .9 1.0 1.0 1.0 1.3Not reported 13.6..................................... 18.8 26.3 13.5 14.9 12.2 .3 .7 .8 .5 .9 .7
Environmental regulationsStrong positive impact 1.9............................. 1.8 2.1 2.5 1.7 2.1 .2 .2 .3 .3 .3 .3Minor positive impact 1.9.............................. 1.7 1.6 2.5 1.3 2.2 .2 .2 .1 .3 .2 .3Neutral 18.6.......................................... 15.2 12.4 18.9 14.3 21.3 .7 .8 .6 .9 .7 .9Minor negative impact 6.8............................. 5.5 3.2 6.6 3.9 8.5 .3 .3 .3 .5 .3 .5Strong negative impact 4.1............................ 3.2 1.7 4.9 2.4 5.2 .3 .3 .2 .4 .3 .5Not applicable 37.6.................................... 32.6 34.0 33.4 45.1 34.1 .7 1.0 .7 1.4 1.0 1.3Don’t know 15.3....................................... 20.1 17.1 18.5 16.1 14.3 .6 .8 .7 .8 .9 1.3Not reported 13.8..................................... 19.9 27.9 12.8 15.1 12.3 .2 .7 .6 .6 .9 .7
The Americans With Disabilities ActStrong positive impact .5............................. .7 1.1 .8 .5 .5 .1 .2 .2 .3 .1 .2Minor positive impact 1.0.............................. 1.0 1.2 1.8 1.2 .8 .1 .1 .1 .3 .3 .1Neutral 20.0.......................................... 15.5 12.6 19.9 14.7 23.4 .7 .4 .4 1.0 .7 1.1Minor negative impact 2.4............................. 2.0 1.3 3.1 1.7 2.8 .2 .2 .1 .2 .1 .2Strong negative impact 1.1............................ .7 .6 2.1 .7 1.3 .1 .2 .1 .3 .1 .2Not applicable 43.3.................................... 38.0 36.9 37.9 48.1 41.4 .9 1.0 .8 1.4 1.0 1.6Don’t know 17.4....................................... 22.2 18.3 20.8 17.4 17.0 .8 .6 .8 1.0 .8 1.4Not reported 14.3..................................... 20.0 28.0 13.6 15.7 12.7 .3 .6 .7 .6 .8 .7
The Occupational Safety and Health Act (OSHA)Strong positive impact 1.2............................. 1.5 2.2 2.4 .9 1.3 .1 .1 .3 .5 .2 .3Minor positive impact 1.6.............................. 2.0 1.7 2.2 1.8 1.4 .1 .3 .2 .4 .4 .2Neutral 19.4.......................................... 16.2 12.7 20.1 14.8 22.3 .8 .6 .5 1.0 .6 1.3Minor negative impact 5.2............................. 3.7 2.9 5.8 2.9 6.5 .2 .4 .3 .4 .3 .4Strong negative impact 2.7............................ 2.5 1.3 3.4 1.8 3.3 .2 .2 .2 .3 .2 .3Not applicable 38.5.................................... 32.6 33.0 32.2 44.8 35.9 .7 1.0 .8 1.4 1.1 1.3Don’t know 17.3....................................... 21.1 18.0 20.2 17.5 16.7 .7 .8 .9 1.0 .9 1.4Not reported 14.0..................................... 20.3 28.1 13.8 15.4 12.5 .3 .7 .7 .6 .9 .8
Lack of financial capitalNeutral 17.5.......................................... 13.7 11.7 19.0 13.4 20.1 .8 .7 .5 1.2 .5 1.3Minor negative impact 10.0............................. 7.6 6.7 8.1 8.2 11.3 .7 .5 .4 .5 .5 .9Strong negative impact 12.2............................ 13.1 15.9 13.5 10.6 12.8 .6 .8 .5 .4 .6 1.1Not applicable 32.4.................................... 27.2 24.5 28.1 38.4 29.8 .3 1.2 .6 1.2 1.0 .8Don’t know 14.1....................................... 18.3 14.8 17.2 14.4 13.5 .5 1.0 .7 .6 .8 1.1Not reported 13.9..................................... 20.1 26.3 14.1 15.0 12.5 .4 .7 .5 .7 .8 .9
CrimeNeutral 18.2.......................................... 14.2 11.4 17.2 14.6 20.7 .4 .7 .5 1.0 .5 .8Minor negative impact 7.5............................. 7.0 6.7 10.2 5.8 8.4 .3 .5 .2 .5 .4 .5Strong negative impact 2.6............................ 4.2 4.7 6.8 2.1 2.5 .2 .3 .2 .4 .1 .3Not applicable 40.2.................................... 34.1 32.2 32.5 45.7 38.2 .6 1.2 .5 1.2 .9 1.1Don’t know 16.5....................................... 19.4 15.7 18.3 15.7 16.7 .8 .8 .6 .7 .8 1.4Not reported 15.0..................................... 21.2 29.1 15.0 16.2 13.4 .3 .7 .8 .8 .8 .7
PERCENT OF WOMEN EMPLOYEES DURINGTHE PAY PERIOD INCLUDING MARCH 12,19926
No women employees 2.8............................... 3.9 1.6 3.5 1.2 3.6 .1 .3 .1 .3 .1 .2Less than 10 percent 1.6................................ 2.1 1.0 2.3 1.0 2.0 .1 .2 .1 .1 .1 .110 to 24 percent 1.1.................................... 1.0 .4 1.3 .6 1.4 .1 .1 .1 .1 – .125 to 49 percent 1.4.................................... 1.2 .4 2.7 .9 1.6 .1 .1 .1 .3 .1 .150 to 74 percent 2.2.................................... 1.9 .8 4.8 1.9 2.4 .1 .2 .1 .2 .1 .275 percent or more 4.9.................................. 3.8 2.4 6.4 4.9 5.0 .2 .3 .2 .3 .3 .3Don’t know .2......................................... .2 .1 .2 .1 .2 – .1 – – – –Not reported 2.1....................................... 2.2 1.7 2.7 1.6 2.4 .2 .2 .2 .1 .2 .2Not applicable17 83.6.................................... 83.7 91.6 76.2 87.7 81.4 .4 .5 .2 .5 .5 .6
PERCENT OF MINORITY EMPLOYEESDURING THE PAY PERIOD INCLUDINGMARCH 12, 19926
25 percent or less 9.3................................... 2.6 .8 5.9 7.1 11.4 .4 .2 .1 .3 .3 .626 to 50 percent 1.1.................................... 1.6 .5 2.3 .7 1.3 .1 .2 .1 .1 .1 .151 to 75 percent .6.................................... .9 .3 1.5 .4 .6 .1 .1 – .1 .1 .176 to 90 percent .4.................................... .7 .4 1.4 .3 .3 – .1 .1 .1 – .1More than 90 percent 1.9............................... 6.9 4.2 7.7 1.4 1.5 .1 .2 .2 .4 .1 .2Don’t know .9......................................... .9 .3 2.1 .7 1.0 .1 .1 .1 .3 .1 .1Not reported 2.3....................................... 2.6 1.9 2.9 1.7 2.5 .2 .3 .2 .2 .2 .3Not applicable17 83.6.................................... 83.7 91.6 76.2 87.7 81.4 .4 .5 .2 .5 .5 .6
See footnotes at end of table.
1992 ECONOMIC CENSUS CHARACTERISTICS OF BUSINESS OWNERS 21

Table 1. Summary Characteristics of Business Owners and Their Businesses: 1992 mCon.[Detail may not add to total due to rounding. For meaning of abbreviations and symbols, see introductory text. For explanation of terms, see appendix A]
Item
Standard error of estimate3
for columnmAllbusinesses1
Hispanic~owned
businesses1Black~ownedbusinesses1
Otherminority~
ownedbusinesses1 2
Women~owned
businesses1
Nonminoritymale~ownedbusinesses1
A B C D E F A B C D E F
DURING 1992, OFFERED RETIREMENT PLAN(PROFIT SHARING, EMPLOYEE STOCKOWNERSHIP, PENSION, INCLUDING 401(K),ANNUITY, KEOGH, SEP, ETC.) TOEMPLOYEES6
Yes 2.3............................................... 1.3 .7 3.1 1.2 3.0 .2 .1 .1 .2 .1 .3No 12.7................................................ 13.5 6.7 18.6 9.9 14.1 .4 .3 .1 .4 .5 .6Not reported 1.4....................................... 1.4 1.1 2.1 1.1 1.6 .1 .2 .1 .1 .2 .1Not applicable17 83.6.................................... 83.7 91.6 76.2 87.7 81.4 .4 .5 .2 .5 .5 .6
DURING 1992, HEALTH PLAN WAS OFFEREDTO EMPLOYEES
Yes 5.4............................................... 3.6 1.4 5.9 3.6 6.7 .2 .2 .1 .2 .2 .3No 10.0................................................ 11.7 6.3 16.5 8.0 10.9 .3 .4 .2 .5 .5 .4Not reported 1.0....................................... .9 .6 1.4 .7 1.1 .1 .1 .1 .1 .1 .1Not applicable17 83.6.................................... 83.7 91.6 76.2 87.7 81.4 .4 .5 .2 .5 .5 .6
DURING 1992, THE MAIN REASON NOHEALTH PLAN WAS OFFERED TOEMPLOYEES6
Costs/premiums were too high~priced 4.4................. 6.1 2.7 8.3 3.3 4.8 .2 .2 .2 .4 .1 .3Rejected by health insurers .1.......................... .1 – .1 – .1 – – – .1 – –Dropped by this business’s health insurer –.............. – – – – – – – – – – –Not needed to attract or retain employees 2.0.............. 1.7 1.0 2.2 1.3 2.4 .2 .3 .1 .2 .2 .3High full~/part~time employee turnover .5................. .4 .5 1.0 .4 .5 .1 – .1 .1 .1 .1Administrative burden .1............................... .2 .1 .5 .1 .1 – .1 – .1 – .1Not desired by employees 1.5........................... 1.2 .9 1.9 1.4 1.6 .1 .1 .1 .3 .1 .1Don’t know .4......................................... .8 .2 1.0 .4 .3 .1 .2 – .1 .1 .1Other reason 1.0....................................... 1.2 .9 1.4 .8 1.0 .1 .1 .1 .2 .2 .2Not reported 1.1....................................... 1.0 .8 1.6 .9 1.2 .1 .1 .1 .1 .1 .2Not applicable18 89.0.................................... 87.4 93.0 82.1 91.3 88.0 .3 .5 .1 .5 .5 .4
DURING 1992, 50 PERCENT OR MORE OFTHE BUSINESS WAS OWNED ORCONTROLLED BY CLOSE RELATIVES 6
Yes 48.2............................................... 48.5 40.2 49.7 63.0 41.6 1.7 1.8 2.3 2.2 2.0 2.7No 49.5................................................ 47.1 55.6 46.2 34.4 56.4 1.6 1.6 2.4 2.3 1.7 2.5Not reported 2.4....................................... 4.3 4.2 4.0 2.6 2.0 .3 .8 1.0 .9 .4 .5
FRANCHISE DURING 19926
Yes 2.9............................................... 2.5 3.5 4.5 3.2 2.7 .2 .2 .3 .5 .4 .4No 89.9................................................ 86.4 82.1 89.0 88.0 91.5 .4 .9 .8 .6 .9 .7Not reported 7.2....................................... 11.1 14.4 6.5 8.8 5.8 .3 .9 .7 .3 .7 .4
OPERATED PRIMARILY FROM OR IN AHOME WHEN FIRST ESTABLISHED 6
Yes 52.1............................................... 46.2 48.7 34.3 55.2 51.7 .6 1.4 1.2 1.0 .8 .7No 40.0................................................ 43.4 36.7 56.9 35.4 41.7 .6 .8 1.0 1.1 .4 .8Don’t know 1.7......................................... 2.0 2.1 3.3 1.7 1.6 .3 .3 .2 .2 .3 .3Not reported 6.2....................................... 8.4 12.5 5.5 7.7 5.0 .3 .9 .4 .2 .7 .4
OPERATED PRIMARILY FROM OR IN AHOME DURING 19926
Yes 49.6............................................... 44.2 47.2 33.8 53.2 48.8 .6 1.6 1.1 1.0 .7 .8No 43.2................................................ 45.7 37.7 59.9 38.2 45.2 .4 1.0 .9 1.1 .4 .7Not reported 7.2....................................... 10.1 15.1 6.3 8.6 6.0 .4 1.0 .4 .5 .8 .5
HOME~BASED BUSINESSES’ PRIMARY USEOF THE HOME6
To produce goods/services on the premises 20.2............ 17.4 18.5 15.8 26.4 17.3 .6 1.2 .8 1.1 .8 .9To do clerical work (goods/services produced off thepremises) 23.7......................................... 18.9 21.2 13.9 22.6 24.9 .7 1.0 .7 .7 .8 .9
To telecommute (outside employment doing office workat home) 8.2.......................................... 8.1 8.1 7.0 6.8 9.0 .4 .2 .4 .7 .5 .8
Not reported 13.1....................................... 17.6 21.8 13.1 14.3 11.9 .5 1.3 .8 .5 .8 .8Not applicable19 34.9.................................... 38.1 30.3 50.3 30.0 36.8 .4 .8 .9 .9 .5 .7
LANGUAGES IN WHICH BUSINESSTRANSACTIONS CAN BE CONDUCTED 6
Arabic .8............................................. .5 .9 .7 .6 1.0 .2 .1 .1 .2 .1 .3Chinese 1.7........................................... .8 1.2 16.1 1.6 1.3 .2 .1 .1 1.1 .2 .3English 89.0............................................ 78.0 84.0 82.2 87.9 90.7 .4 1.0 .5 .9 .9 .5French 3.8............................................ 2.8 4.5 3.4 3.9 3.9 .3 .3 .4 .4 .3 .5German 2.1........................................... 1.0 1.2 1.3 2.3 2.1 .2 .2 .1 .4 .3 .5Greek .7............................................. .4 .5 .6 1.2 .5 .1 .1 – .2 .3 .2Hindi (Urdu) .7........................................ .3 .4 4.1 .7 .5 .1 .1 – .3 .1 .2Italian 1.3............................................. 1.9 .7 .7 1.5 1.2 .2 .3 .1 .2 .2 .3Japanese .9.......................................... .5 .8 5.7 1.1 .7 .1 .1 .1 .4 .2 .2Korean .9............................................ .4 .8 7.2 1.0 .6 .1 .1 .1 .6 .1 .2
See footnotes at end of table.
22 CHARACTERISTICS OF BUSINESS OWNERS 1992 ECONOMIC CENSUS
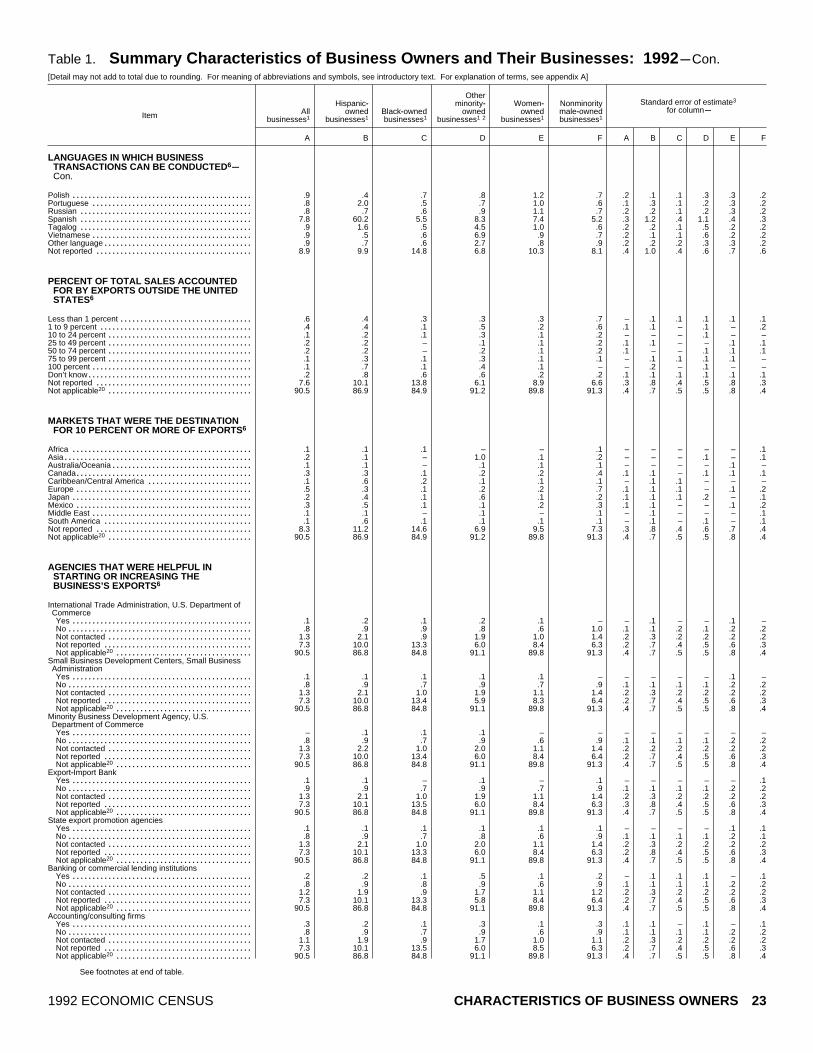
Table 1. Summary Characteristics of Business Owners and Their Businesses: 1992 mCon.[Detail may not add to total due to rounding. For meaning of abbreviations and symbols, see introductory text. For explanation of terms, see appendix A]
Item
Standard error of estimate3
for columnmAllbusinesses1
Hispanic~owned
businesses1Black~ownedbusinesses1
Otherminority~
ownedbusinesses1 2
Women~owned
businesses1
Nonminoritymale~ownedbusinesses1
A B C D E F A B C D E F
LANGUAGES IN WHICH BUSINESSTRANSACTIONS CAN BE CONDUCTED 6
m
Con.
Polish .9............................................. .4 .7 .8 1.2 .7 .2 .1 .1 .3 .3 .2Portuguese .8........................................ 2.0 .5 .7 1.0 .6 .1 .3 .1 .2 .3 .2Russian .8........................................... .7 .6 .9 1.1 .7 .2 .2 .1 .2 .3 .2Spanish 7.8........................................... 60.2 5.5 8.3 7.4 5.2 .3 1.2 .4 1.1 .4 .3Tagalog .9........................................... 1.6 .5 4.5 1.0 .6 .2 .2 .1 .5 .2 .2Vietnamese .9........................................ .5 .6 6.9 .9 .7 .2 .1 .1 .6 .2 .2Other language .9..................................... .7 .6 2.7 .8 .9 .2 .2 .2 .3 .3 .2Not reported 8.9....................................... 9.9 14.8 6.8 10.3 8.1 .4 1.0 .4 .6 .7 .6
PERCENT OF TOTAL SALES ACCOUNTEDFOR BY EXPORTS OUTSIDE THE UNITEDSTATES6
Less than 1 percent .6................................. .4 .3 .3 .3 .7 – .1 .1 .1 .1 .11 to 9 percent .4...................................... .4 .1 .5 .2 .6 .1 .1 – .1 – .210 to 24 percent .1.................................... .2 .1 .3 .1 .2 – – – .1 – –25 to 49 percent .2.................................... .2 – .1 .1 .2 .1 .1 – – .1 .150 to 74 percent .2.................................... .2 – .2 .1 .2 .1 – – .1 .1 .175 to 99 percent .1.................................... .3 .1 .3 .1 .1 – .1 .1 .1 .1 –100 percent .1........................................ .7 .1 .4 .1 – – .2 – .1 – –Don’t know .2......................................... .8 .6 .6 .2 .2 .1 .1 .1 .1 .1 .1Not reported 7.6....................................... 10.1 13.8 6.1 8.9 6.6 .3 .8 .4 .5 .8 .3Not applicable20 90.5.................................... 86.9 84.9 91.2 89.8 91.3 .4 .7 .5 .5 .8 .4
MARKETS THAT WERE THE DESTINATIONFOR 10 PERCENT OR MORE OF EXPORTS6
Africa .1............................................. .1 .1 – – .1 – – – – – .1Asia .2............................................... .1 – 1.0 .1 .2 – – – .1 – .1Australia/Oceania .1................................... .1 – .1 .1 .1 – – – – .1 –Canada .3............................................ .3 .1 .2 .2 .4 .1 .1 – .1 .1 .1Caribbean/Central America .1.......................... .6 .2 .1 .1 .1 – .1 .1 – – –Europe .5............................................ .3 .1 .2 .2 .7 .1 .1 .1 – .1 .2Japan .2............................................. .4 .1 .6 .1 .2 .1 .1 .1 .2 – .1Mexico .3............................................ .5 .1 .1 .2 .3 .1 .1 – – .1 .2Middle East .1........................................ .1 – .1 – .1 – .1 – – – .1South America .1..................................... .6 .1 .1 .1 .1 – .1 – .1 – .1Not reported 8.3....................................... 11.2 14.6 6.9 9.5 7.3 .3 .8 .4 .6 .7 .4Not applicable20 90.5.................................... 86.9 84.9 91.2 89.8 91.3 .4 .7 .5 .5 .8 .4
AGENCIES THAT WERE HELPFUL INSTARTING OR INCREASING THEBUSINESS’S EXPORTS6
International Trade Administration, U.S. Department ofCommerceYes .1............................................. .2 .1 .2 .1 – – .1 – – .1 –No .8.............................................. .9 .9 .8 .6 1.0 .1 .1 .2 .1 .2 .2Not contacted 1.3.................................... 2.1 .9 1.9 1.0 1.4 .2 .3 .2 .2 .2 .2Not reported 7.3..................................... 10.0 13.3 6.0 8.4 6.3 .2 .7 .4 .5 .6 .3Not applicable20 90.5.................................. 86.8 84.8 91.1 89.8 91.3 .4 .7 .5 .5 .8 .4
Small Business Development Centers, Small BusinessAdministrationYes .1............................................. .1 .1 .1 .1 – – – – – .1 –No .8.............................................. .9 .7 .9 .7 .9 .1 .1 .1 .1 .2 .2Not contacted 1.3.................................... 2.1 1.0 1.9 1.1 1.4 .2 .3 .2 .2 .2 .2Not reported 7.3..................................... 10.0 13.4 5.9 8.3 6.4 .2 .7 .4 .5 .6 .3Not applicable20 90.5.................................. 86.8 84.8 91.1 89.8 91.3 .4 .7 .5 .5 .8 .4
Minority Business Development Agency, U.S.Department of CommerceYes –............................................. .1 .1 .1 – – – – – – – –No .8.............................................. .9 .7 .9 .6 .9 .1 .1 .1 .1 .2 .2Not contacted 1.3.................................... 2.2 1.0 2.0 1.1 1.4 .2 .2 .2 .2 .2 .2Not reported 7.3..................................... 10.0 13.4 6.0 8.4 6.4 .2 .7 .4 .5 .6 .3Not applicable20 90.5.................................. 86.8 84.8 91.1 89.8 91.3 .4 .7 .5 .5 .8 .4
Export~Import BankYes .1............................................. .1 – .1 – .1 – – – – – .1No .9.............................................. .9 .7 .9 .7 .9 .1 .1 .1 .1 .2 .2Not contacted 1.3.................................... 2.1 1.0 1.9 1.1 1.4 .2 .3 .2 .2 .2 .2Not reported 7.3..................................... 10.1 13.5 6.0 8.4 6.3 .3 .8 .4 .5 .6 .3Not applicable20 90.5.................................. 86.8 84.8 91.1 89.8 91.3 .4 .7 .5 .5 .8 .4
State export promotion agenciesYes .1............................................. .1 .1 .1 .1 .1 – – – – .1 .1No .8.............................................. .9 .7 .8 .6 .9 .1 .1 .1 .1 .2 .1Not contacted 1.3.................................... 2.1 1.0 2.0 1.1 1.4 .2 .3 .2 .2 .2 .2Not reported 7.3..................................... 10.1 13.3 6.0 8.4 6.3 .2 .8 .4 .5 .6 .3Not applicable20 90.5.................................. 86.8 84.8 91.1 89.8 91.3 .4 .7 .5 .5 .8 .4
Banking or commercial lending institutionsYes .2............................................. .2 .1 .5 .1 .2 – .1 .1 .1 – .1No .8.............................................. .9 .8 .9 .6 .9 .1 .1 .1 .1 .2 .2Not contacted 1.2.................................... 1.9 .9 1.7 1.1 1.2 .2 .3 .2 .2 .2 .2Not reported 7.3..................................... 10.1 13.3 5.8 8.4 6.4 .2 .7 .4 .5 .6 .3Not applicable20 90.5.................................. 86.8 84.8 91.1 89.8 91.3 .4 .7 .5 .5 .8 .4
Accounting/consulting firmsYes .3............................................. .2 .1 .3 .1 .3 .1 .1 – .1 – .1No .8.............................................. .9 .7 .9 .6 .9 .1 .1 .1 .1 .2 .2Not contacted 1.1.................................... 1.9 .9 1.7 1.0 1.1 .2 .3 .2 .2 .2 .2Not reported 7.3..................................... 10.1 13.5 6.0 8.5 6.3 .2 .7 .4 .5 .6 .3Not applicable20 90.5.................................. 86.8 84.8 91.1 89.8 91.3 .4 .7 .5 .5 .8 .4
See footnotes at end of table.
1992 ECONOMIC CENSUS CHARACTERISTICS OF BUSINESS OWNERS 23

Table 1. Summary Characteristics of Business Owners and Their Businesses: 1992 mCon.[Detail may not add to total due to rounding. For meaning of abbreviations and symbols, see introductory text. For explanation of terms, see appendix A]
Item
Standard error of estimate3
for columnmAllbusinesses1
Hispanic~owned
businesses1Black~ownedbusinesses1
Otherminority~
ownedbusinesses1 2
Women~owned
businesses1
Nonminoritymale~ownedbusinesses1
A B C D E F A B C D E F
AGENCIES THAT WERE HELPFUL INSTARTING OR INCREASING THEBUSINESS’S EXPORTS6
mCon.
Other agenciesYes .2............................................. .1 – .1 – .3 .1 – – – – .1No .5.............................................. .6 .5 .6 .5 .5 .1 .1 .1 .1 .2 .1Not contacted .5.................................... .9 .4 1.0 .5 .5 .1 .2 .1 .2 .1 .1Not reported 8.2..................................... 11.5 14.2 7.3 9.2 7.4 .3 .7 .4 .4 .6 .3Not applicable20 90.5.................................. 86.8 84.8 91.1 89.8 91.3 .4 .7 .5 .5 .8 .4
LENGTH OF TIME BEFORE DECEMBER 31,1992 THAT THE BUSINESS HAD BEENINVOLVED IN EXPORTING6
Less than 1 year .7.................................... 1.0 .5 .9 .5 .9 .1 .2 .1 .2 .2 .21 to 5 years .5........................................ .9 .3 .9 .3 .6 .1 .2 .1 .2 .1 .16 to 10 years .2....................................... .3 – .4 .1 .2 – .1 – .1 – –More than 10 years .3................................. .5 .2 .4 .2 .3 – .1 – .1 – .1Not reported 7.8....................................... 10.5 14.1 6.3 9.1 6.8 .3 .7 .4 .7 .7 .3Not applicable20 90.5.................................... 86.8 84.8 91.1 89.8 91.3 .4 .7 .5 .5 .8 .4
PLANNING ON STARTING OR INCREASINGEXPORTS IN THE NEAR FUTURE6
Yes 2.0............................................... 3.4 2.6 4.7 1.5 2.1 .2 .4 .3 .3 .2 .4No 85.9................................................ 78.7 75.0 83.6 84.8 87.4 .6 .9 .6 .7 .6 .8Not reported 12.0....................................... 17.9 22.4 11.7 13.7 10.5 .5 .8 .7 .8 .6 .7
ISSUES IMPORTANT TO THE BUSINESS’SABILITY TO EXPORT 6
Export financingVery important 1.7................................... 2.5 2.6 3.6 1.4 1.7 .2 .3 .3 .4 .2 .3Somewhat important 1.0.............................. 1.4 .6 1.2 .7 1.1 .2 .2 .1 .2 .2 .2Not important 5.4.................................... 5.5 5.7 4.9 5.3 5.5 .4 .4 .4 .7 .4 .6Not applicable 52.8.................................... 43.7 43.7 48.4 52.3 54.3 1.0 1.0 1.0 1.2 1.0 1.5Don’t know 10.8....................................... 12.7 10.1 14.4 9.8 11.1 .5 .7 .5 .8 .7 .9Not reported 28.2..................................... 34.1 37.4 27.5 30.6 26.3 .7 1.1 .8 1.2 .5 1.2
Information on export opportunitiesVery important 2.1................................... 3.4 2.7 3.8 2.1 1.9 .2 .3 .2 .4 .4 .2Somewhat important 1.5.............................. 1.8 1.3 2.3 .8 1.8 .2 .3 .2 .2 .1 .3Not important 5.2.................................... 5.3 5.6 4.3 5.0 5.3 .3 .4 .4 .5 .4 .4Not applicable 52.2.................................... 43.4 42.9 47.4 51.9 53.6 .9 1.0 1.0 1.2 1.1 1.5Don’t know 10.5....................................... 11.7 9.3 13.9 9.6 10.7 .4 .8 .4 .8 .7 .7Not reported 28.5..................................... 34.4 38.2 28.3 30.6 26.7 .6 1.1 .7 1.2 .4 1.1
Foreign trade restrictionsVery important 1.9................................... 3.1 2.0 3.4 2.0 1.7 .2 .3 .2 .4 .3 .3Somewhat important 1.5.............................. 1.2 1.0 2.2 .9 1.8 .3 .1 .1 .3 .2 .4Not important 5.1.................................... 5.3 6.0 4.5 4.9 5.1 .3 .5 .3 .6 .4 .4Not applicable 52.3.................................... 43.3 42.8 47.2 52.1 53.5 .9 1.1 1.0 1.2 1.1 1.3Don’t know 10.8....................................... 12.4 9.5 14.0 9.7 11.2 .5 .6 .5 .8 .7 .8Not reported 28.4..................................... 34.6 38.6 28.7 30.4 26.6 .7 1.2 .7 1.1 .4 1.2
U.S. trade restrictionsVery important 1.7................................... 2.6 2.2 3.2 1.8 1.6 .2 .3 .2 .5 .3 .3Somewhat important 1.4.............................. 1.5 1.0 2.2 .8 1.7 .2 .2 .1 .2 .2 .3Not important 5.1.................................... 5.4 5.8 4.9 5.1 5.1 .3 .4 .3 .6 .4 .4Not applicable 52.3.................................... 43.0 42.8 46.9 51.8 53.7 .9 1.1 1.0 1.4 1.0 1.3Don’t know 11.0....................................... 12.7 9.7 14.1 9.8 11.5 .5 .7 .5 .9 .7 .9Not reported 28.4..................................... 34.7 38.5 28.7 30.8 26.4 .6 1.2 .8 1.2 .4 1.1
Competition in the foreign marketVery important 1.9................................... 2.7 2.0 3.9 1.5 1.9 .2 .3 .2 .3 .2 .2Somewhat important 1.5.............................. 1.9 1.2 2.3 1.4 1.6 .3 .3 .2 .2 .2 .4Not important 5.3.................................... 5.5 5.9 4.7 5.1 5.3 .3 .5 .4 .5 .4 .4Not applicable 52.2.................................... 43.0 42.7 46.6 51.9 53.6 .9 1.0 1.1 1.4 1.0 1.5Don’t know 10.7....................................... 12.1 9.6 13.9 9.7 11.1 .5 .7 .4 .8 .7 .8Not reported 28.4..................................... 34.8 38.6 28.7 30.4 26.5 .7 1.2 .8 1.1 .4 1.3
Price of this business’s exportsVery important 1.8................................... 2.8 2.2 4.3 1.6 1.7 .2 .3 .2 .4 .2 .3Somewhat important 1.3.............................. 1.5 1.0 2.2 1.0 1.5 .2 .3 .2 .2 .2 .3Not important 5.4.................................... 5.3 5.8 4.3 5.3 5.5 .3 .4 .4 .4 .5 .4Not applicable 52.3.................................... 43.5 42.8 46.9 51.8 53.8 .9 1.2 1.0 1.2 1.1 1.4Don’t know 11.4....................................... 13.1 10.8 14.5 10.5 11.7 .5 .6 .5 .8 .7 .8Not reported 27.7..................................... 33.8 37.5 27.8 29.8 25.8 .6 1.1 .7 1.3 .6 1.1
Dollar exchange rateVery important 2.1................................... 3.1 2.3 3.9 2.3 1.8 .2 .4 .2 .3 .3 .3Somewhat important 1.7.............................. 1.9 1.2 2.8 .9 2.1 .2 .2 .1 .2 .2 .4Not important 5.3.................................... 5.1 5.8 4.3 5.2 5.3 .4 .4 .4 .4 .4 .5Not applicable 51.8.................................... 42.9 42.3 46.5 51.6 53.1 .8 1.1 1.0 1.4 1.0 1.3Don’t know 11.0....................................... 12.7 10.4 14.2 9.9 11.4 .5 .6 .5 .8 .6 .8Not reported 28.1..................................... 34.3 37.9 28.2 30.1 26.3 .6 1.1 .7 1.2 .6 1.1
Local environmental restrictionsVery important 1.9................................... 2.1 1.9 2.3 1.9 1.9 .2 .3 .2 .3 .2 .3Somewhat important 2.0.............................. 1.9 1.8 2.9 1.2 2.4 .2 .3 .2 .4 .2 .4Not important 5.5.................................... 5.6 5.8 5.1 5.2 5.7 .4 .4 .3 .7 .3 .5Not applicable 51.3.................................... 42.9 42.2 46.7 51.4 52.4 .7 1.1 1.0 1.5 1.0 1.1Don’t know 11.4....................................... 13.4 10.7 14.7 10.5 11.7 .4 .7 .4 .9 .7 .7Not reported 27.8..................................... 34.1 37.6 28.2 29.8 26.0 .6 1.2 .8 1.2 .6 1.1
Other issuesVery important .6................................... .3 .6 .6 .9 .5 .1 .1 .1 .2 .3 .2Somewhat important .1.............................. .2 .2 .2 .2 .1 – .1 .1 .1 .1 –Not important 2.6.................................... 2.9 3.9 2.3 2.5 2.6 .3 .3 .3 .5 .3 .4Not applicable 25.2.................................... 20.3 18.5 22.3 23.1 27.0 .6 .6 .5 .7 .6 1.0Don’t know 6.2....................................... 7.3 4.9 8.2 4.5 7.0 .4 .7 .4 .5 .4 .6Not reported 65.2..................................... 69.1 71.9 66.3 68.8 62.7 .7 .8 .7 1.1 .7 1.3
See footnotes at end of table.
24 CHARACTERISTICS OF BUSINESS OWNERS 1992 ECONOMIC CENSUS

Table 1. Summary Characteristics of Business Owners and Their Businesses: 1992 mCon.[Detail may not add to total due to rounding. For meaning of abbreviations and symbols, see introductory text. For explanation of terms, see appendix A]
Item
Standard error of estimate3
for columnmAllbusinesses1
Hispanic~owned
businesses1Black~ownedbusinesses1
Otherminority~
ownedbusinesses1 2
Women~owned
businesses1
Nonminoritymale~ownedbusinesses1
A B C D E F A B C D E F
EXPORTS TO CANADA WILL INCREASESUBSTANTIALLY AS A RESULT OF THENORTH AMERICAN FREE TRADEAGREEMENT6
Yes .6............................................... 1.1 1.0 1.5 .6 .6 .1 .2 .1 .2 .2 .1No 76.4................................................ 71.5 67.4 74.6 72.7 79.2 .5 .9 .9 1.1 1.0 1.0Not reported 22.9....................................... 27.3 31.7 23.9 26.7 20.3 .5 .9 .8 1.0 1.1 1.0
EXPORTS TO MEXICO WILL INCREASESUBSTANTIALLY AS A RESULT OF THENORTH AMERICAN FREE TRADEAGREEMENT6
Yes .9............................................... 2.4 1.1 1.6 .7 .8 .1 .3 .2 .3 .2 .2No 75.6................................................ 70.5 65.9 74.2 72.5 78.1 .6 .8 .9 1.0 1.0 1.1Not reported 23.5....................................... 27.1 33.0 24.2 26.9 21.1 .6 .9 .9 1.0 1.1 1.2
PRODUCTION FACILITIES WILL RELOCATETO CANADA AS A RESULT OF THE NORTHAMERICAN FREE TRADE AGREEMENT 6
Yes .2............................................... .3 .4 .9 .2 .1 – .1 .1 .2 .1 –No 76.3................................................ 71.3 67.3 74.7 72.5 79.1 .5 1.0 .8 1.3 1.0 1.1Not reported 23.5....................................... 28.4 32.3 24.4 27.3 20.8 .4 1.0 .7 1.3 1.0 1.0
PRODUCTION FACILITIES WILL RELOCATETO MEXICO AS A RESULT OF THE NORTHAMERICAN FREE TRADE AGREEMENT 6
Yes .3............................................... .9 .5 1.3 .4 .2 .1 .3 .1 .3 .1 .1No 75.7................................................ 71.5 65.9 74.1 72.1 78.4 .6 1.1 .9 1.2 1.0 1.2Not reported 24.0....................................... 27.6 33.6 24.7 27.5 21.4 .6 1.1 .9 1.1 1.0 1.2
1Includes individual proprietorships, partnerships, and subchapter S corporations.2Includes Asians, Pacific Islanders, American Indians, and Alaska Natives.3For explanation of relative standard errors, see Reliability of Estimates in the introductory text.4Data represent percentage of owners reporting in the designated categories.5Includes respondents who have owned the same businesses since 1992.6Data represent percentage of firms reporting in the designated categories.7Includes businesses still in operation as of the date the respondents completed the report forms.8Includes owners who were not veterans or served less than 6 months active duty.9Includes owners who were not veterans.10Includes owners who did not receive any education past high school.11Includes owners who never had any close relatives who owned a business.12Includes owners who had no previous work experience prior to starting/acquiring their businesses.13Includes owners who did not require capital to start/acquire their businesses.14Includes owners who did not require capital to start/acquire their businesses or who did not borrow capital.15Includes firms that did not require capital to start/acquire their businesses.16Includes firms that did not require capital to start/acquire their businesses or that did not borrow capital.17Includes businesses with no paid employees in 1992.18Includes businesses with no paid employees in 1992 or that offered a health plan.19Includes businesses that were not home~based when first established, or during 1992 or 1994.20Includes businesses with no exports during 1992.
1992 ECONOMIC CENSUS CHARACTERISTICS OF BUSINESS OWNERS 25

Table 2a. Number of Firms, Owners, and Receipts by Industry Division: 1992[Detail may not add to total due to rounding. For meaning of abbreviations and symbols, see introductory text. For explanation of terms, see appendix A]
Type of firm and industry division
Relative standard error of estimate (percent)1 2 for columnmFirms
(number)Owners
(number)
Sales andreceipts
($1,000,000)
A B C A B C
All businesses 3 17 253 143...................................... 19 287 647 3 324 200 (X) – (X)1
Agricultural services, forestry, fishing, and mining 583 253............... 648 074 62 326 (X) – (X)2Construction 1 829 620................................................ 1 973 461 307 123 (X) – (X)3Manufacturing 517 714.............................................. 639 469 451 719 (X) – (X)4Transportation, communications, and utilities 698 903................... 752 946 130 033 (X) – (X)5Wholesale trade 538 339............................................ 648 722 641 051 (X) – (X)6
Retail trade 2 478 045................................................. 2 717 455 722 713 (X) – (X)7Finance, insurance, and real estate 1 941 029............................ 2 797 739 322 251 (X) – (X)8Services 7 784 016................................................... 8 216 918 661 284 (X) – (X)9Industries not classified 882 224...................................... 892 865 25 699 (X) – (X)10
Hispanic ~owned businesses 3 771 708......................... 811 287 72 824 – – 1.011
Agricultural services, forestry, fishing, and mining 32 927............... 33 367 1 769 1.0 1.0 4.012Construction 97 476................................................ 100 552 8 212 1.0 1.0 2.013Manufacturing 18 461.............................................. 20 732 6 158 1.0 2.0 8.014Transportation, communications, and utilities 47 797................... 48 741 3 703 1.0 1.0 2.015Wholesale trade 17 727............................................ 20 895 12 489 2.0 2.0 3.016
Retail trade 107 846................................................. 114 735 17 731 1.0 1.0 3.017Finance, insurance, and real estate 49 231............................ 59 757 4 832 1.0 2.0 6.018Services 347 297................................................... 359 331 16 787 – – 2.019Industries not classified 52 945...................................... 53 178 1 144 1.0 – 5.020
Black ~owned businesses 3 620 912............................ 638 203 32 197 – – 2.021
Agricultural services, forestry, fishing, and mining 10 309............... 10 592 331 1.0 2.0 5.022Construction 43 381................................................ 44 577 2 651 – 1.0 4.023Manufacturing 10 469.............................................. 10 931 1 319 1.0 2.0 8.024Transportation, communications, and utilities 49 095................... 50 405 2 498 – 1.0 4.025Wholesale trade 7 550............................................ 8 196 2 944 2.0 3.0 3.026
Retail trade 86 840................................................. 88 595 6 968 – – 5.027Finance, insurance, and real estate 40 924............................ 45 208 3 777 1.0 2.0 3.028Services 332 981................................................... 340 073 11 057 – – 1.029Industries not classified 39 363...................................... 39 627 652 – – 1.030
Other minority ~owned businesses 3 4 606 426.................. 697 710 99 709 – – 1.031
Agricultural services, forestry, fishing, and mining 15 218............... 16 402 1 316 1.0 1.0 3.032Construction 28 295................................................ 31 695 5 165 1.0 1.0 4.033Manufacturing 18 976.............................................. 22 433 8 359 1.0 2.0 3.034Transportation, communications, and utilities 24 362................... 26 206 2 251 1.0 1.0 3.035Wholesale trade 20 043............................................ 25 029 18 199 1.0 2.0 3.036
Retail trade 132 483................................................. 154 668 28 768 1.0 1.0 1.037Finance, insurance, and real estate 64 762............................ 95 115 8 988 1.0 2.0 4.038Services 273 774................................................... 297 069 25 595 – – 2.039Industries not classified 28 512...................................... 29 092 1 069 1.0 1.0 6.040
Women ~owned businesses 3 5 888 883.......................... 6 447 988 642 484 – – 2.041
Agricultural services, forestry, fishing, and mining 119 731............... 132 547 11 893 – 1.0 1.042Construction 183 695................................................ 219 341 45 978 – 1.0 1.043Manufacturing 152 346.............................................. 185 132 90 635 – 1.0 9.044Transportation, communications, and utilities 141 623................... 159 570 25 822 – 1.0 3.045Wholesale trade 154 542............................................ 187 643 124 847 – 1.0 4.046
Retail trade 1 093 342................................................. 1 198 222 155 853 – – 1.047Finance, insurance, and real estate 602 802............................ 785 756 51 748 – – 2.048Services 3 158 444................................................... 3 292 383 130 745 – – 1.049Industries not classified 282 358...................................... 287 394 4 963 – – 3.050
Nonminority male ~owned businesses 3 10 114 456................. 11 498 830 2 526 942 – – 1.051
Agricultural services, forestry, fishing, and mining 412 917............... 463 349 47 803 – – –52Construction 1 496 056................................................ 1 599 234 248 285 – – 1.053Manufacturing 333 485.............................................. 418 386 355 130 – – 1.054Transportation, communications, and utilities 458 400................... 492 210 96 774 – – 1.055Wholesale trade 352 721............................................ 425 131 488 539 – – 2.056
Retail trade 1 197 943................................................. 1 314 996 533 323 – – 1.057Finance, insurance, and real estate 1 240 594............................ 1 883 576 254 274 – – 1.058Services 4 102 294................................................... 4 376 208 484 760 – – 1.059Industries not classified 520 046...................................... 525 739 18 054 – – 1.060
1For explanation of relative standard errors, see Reliability of Estimates in the introductory text.2Relative standard errors are not applicable for columns A and C, lines 1 through 10 since these data are the result of censuses, not surveys.3Includes individual proprietorships, partnerships, and subchapter S corporations.4Includes Asians, Pacific Islanders, American Indians, and Alaska Natives.
26 CHARACTERISTICS OF BUSINESS OWNERS 1992 ECONOMIC CENSUS

Table 2b. Number of Firms, Owners, and Receipts by Receipts Size of Firm: 1992[Detail may not add to total due to rounding. For meaning of abbreviations and symbols, see introductory text. For explanation of terms, see appendix A]
Type of firm and receipts size
Relative standard error of estimate (percent)1 2 for columnmFirms
(number)Owners
(number)
Sales andreceipts
($1,000,000)
A B C A B C
All businesses 3 17 253 143...................................... 19 287 647 3 324 200 (X) – (X)1
Less than $5,000 5 226 553........................................... 5 362 636 10 810 (X) – (X)2$5,000 to $9,999 2 443 946............................................ 2 540 075 16 441 (X) – (X)3$10,000 to $24,999 3 076 410.......................................... 3 248 339 48 241 (X) – (X)4$25,000 to $49,999 1 945 806.......................................... 2 120 121 68 441 (X) – (X)5$50,000 to $99,999 1 615 940.......................................... 1 832 117 114 179 (X) – (X)6
$100,000 to $199,999 1 197 996....................................... 1 455 899 168 374 (X) – (X)7$200,000 to $249,999 301 794....................................... 389 760 67 166 (X) 1.0 (X)8$250,000 to $499,999 682 583....................................... 945 709 237 533 (X) – (X)9$500,000 to $999,999 372 078....................................... 593 483 257 549 (X) 1.0 (X)10$1,000,000 or more 390 037......................................... 799 506 2 335 467 (X) – (X)11
Hispanic ~owned businesses 3 771 708......................... 811 287 72 824 – – 1.012
Less than $5,000 219 226........................................... 220 613 476 1.0 – 1.013$5,000 to $9,999 140 362............................................ 141 204 959 1.0 – 1.014$10,000 to $24,999 165 667.......................................... 169 116 2 557 1.0 – 1.015$25,000 to $49,999 87 288.......................................... 90 903 3 050 1.0 1.0 1.016$50,000 to $99,999 64 742.......................................... 70 002 4 528 1.0 1.0 1.017
$100,000 to $199,999 41 578....................................... 47 338 5 864 1.0 2.0 1.018$200,000 to $249,999 10 030....................................... 12 000 2 232 3.0 4.0 3.019$250,000 to $499,999 22 301....................................... 28 348 7 744 2.0 3.0 2.020$500,000 to $999,999 11 319....................................... 15 715 7 801 3.0 4.0 3.021$1,000,000 or more 9 194......................................... 16 049 37 613 2.0 3.0 2.022
Black ~owned businesses 3 620 912............................ 638 203 32 197 – – 2.023
Less than $5,000 236 722........................................... 238 347 488 – – –24$5,000 to $9,999 111 512............................................ 112 757 751 – – –25$10,000 to $24,999 129 901.......................................... 132 219 2 007 – – –26$25,000 to $49,999 62 209.......................................... 63 361 2 151 – 1.0 –27$50,000 to $99,999 39 218.......................................... 41 898 2 725 1.0 1.0 1.028
$100,000 to $199,999 20 936....................................... 23 294 2 904 1.0 2.0 1.029$200,000 to $249,999 4 533....................................... 5 556 1 010 3.0 6.0 3.030$250,000 to $499,999 9 029....................................... 10 664 3 126 3.0 4.0 3.031$500,000 to $999,999 3 823....................................... 5 062 2 657 4.0 7.0 4.032$1,000,000 or more 3 028......................................... 5 045 14 377 4.0 6.0 4.033
Other minority ~owned businesses 3 4 606 426.................. 697 710 99 709 – – 1.034
Less than $5,000 132 493........................................... 136 982 290 1.0 – 1.035$5,000 to $9,999 80 435............................................ 84 020 544 1.0 1.0 1.036$10,000 to $24,999 108 195.......................................... 114 826 1 706 1.0 1.0 1.037$25,000 to $49,999 77 345.......................................... 85 736 2 746 1.0 1.0 1.038$50,000 to $99,999 70 360.......................................... 80 400 5 013 1.0 1.0 1.039
$100,000 to $199,999 58 620....................................... 72 906 8 295 1.0 1.0 1.040$200,000 to $249,999 15 740....................................... 21 484 3 509 2.0 3.0 2.041$250,000 to $499,999 34 266....................................... 49 419 11 958 1.0 2.0 2.042$500,000 to $999,999 16 467....................................... 25 979 11 248 2.0 3.0 2.043$1,000,000 or more 12 505......................................... 25 958 54 401 2.0 3.0 2.044
Women ~owned businesses 3 5 888 883.......................... 6 447 988 642 484 – – 2.045
Less than $5,000 2 310 303........................................... 2 345 179 4 689 – – –46$5,000 to $9,999 967 380............................................ 999 235 6 475 – – –47$10,000 to $24,999 1 051 358.......................................... 1 106 350 16 210 – – –48$25,000 to $49,999 538 885.......................................... 597 450 18 759 – – –49$50,000 to $99,999 381 517.......................................... 452 828 26 773 – 1.0 –50
$100,000 to $199,999 267 089....................................... 352 240 37 500 – 1.0 –51$200,000 to $249,999 66 464....................................... 93 294 14 775 1.0 1.0 1.052$250,000 to $499,999 146 313....................................... 221 942 50 866 1.0 1.0 1.053$500,000 to $999,999 80 539....................................... 129 949 55 796 1.0 1.0 1.054$1,000,000 or more 79 037......................................... 149 522 410 643 1.0 1.0 2.055
Nonminority male ~owned businesses 3 10 114 456................. 11 498 830 2 526 942 – – 1.056
Less than $5,000 2 608 047........................................... 2 703 054 5 454 – – –57$5,000 to $9,999 1 285 456............................................ 1 345 455 8 668 – – –58$10,000 to $24,999 1 763 830.......................................... 1 874 914 27 940 – – –59$25,000 to $49,999 1 248 482.......................................... 1 357 444 44 103 – – –60$50,000 to $99,999 1 108 065.......................................... 1 242 814 78 500 – – –61
$100,000 to $199,999 840 723....................................... 1 001 459 118 247 – – –62$200,000 to $249,999 212 693....................................... 268 692 47 334 – 1.0 –63$250,000 to $499,999 488 462....................................... 660 265 169 859 – 1.0 –64$500,000 to $999,999 266 408....................................... 429 068 184 670 – 1.0 1.065$1,000,000 or more 292 290......................................... 615 667 1 842 167 – – 1.066
1For explanation of relative standard errors, see Reliability of Estimates in the introductory text.2Relative standard errors are not applicable for columns A and C, lines 1 through 11 since these data are the result of censuses, not surveys.3Includes individual proprietorships, partnerships, and subchapter S corporations.4Includes Asians, Pacific Islanders, American Indians, and Alaska Natives.
1992 ECONOMIC CENSUS CHARACTERISTICS OF BUSINESS OWNERS 27

Table 2c. Number of Firms, Owners, and Receipts by Employment Size of Firm: 1992[Detail may not add to total due to rounding. For meaning of abbreviations and symbols, see introductory text. For explanation of terms, see appendix A]
Type of firm and employment size
Relative standard error of estimate (percent)1 2 for columnmFirms
(number)Owners
(number)
Sales andreceipts
($1,000,000)
A B C A B C
All businesses 3 17 253 143...................................... 19 287 647 3 324 200 (X) – (X)1
With no paid employees 14 118 184...................................... 15 088 030 417 067 (X) – (X)2With paid employees 3 134 959........................................ 4 199 618 2 907 132 (X) – (X)3
No employees4 435 838........................................... 495 556 61 540 (X) 1.0 (X)41 to 4 employees 1 716 076.......................................... 2 057 934 387 498 (X) – (X)55 to 9 employees 503 808.......................................... 717 863 313 432 (X) – (X)610 to 19 employees 256 110....................................... 436 516 331 235 (X) 1.0 (X)720 to 49 employees 144 734....................................... 292 445 470 981 (X) 1.0 (X)850 to 99 employees 45 331....................................... 108 176 356 732 (X) 1.0 (X)9100 employees or more 33 062.................................... 91 128 985 714 (X) 1.0 (X)10
Hispanic ~owned businesses 3 771 708......................... 811 287 72 824 – – 1.011
With no paid employees 656 343...................................... 671 125 15 637 – – 1.012With paid employees 115 364........................................ 140 162 57 187 1.0 1.0 2.013
No employees4 19 569........................................... 21 800 2 198 2.0 3.0 4.0141 to 4 employees 64 631.......................................... 74 290 11 970 1.0 1.0 2.0155 to 9 employees 16 937.......................................... 21 767 8 795 2.0 2.0 4.01610 to 19 employees 8 553....................................... 12 627 8 678 3.0 4.0 4.01720 to 49 employees 4 050....................................... 6 632 8 905 4.0 5.0 2.01850 to 99 employees 948....................................... 1 727 5 945 6.0 5.0 5.019100 employees or more 676.................................... 1 319 10 696 8.0 7.0 6.020
Black ~owned businesses 3 620 912............................ 638 203 32 197 – – 2.021
With no paid employees 556 434...................................... 564 841 9 608 – – 1.022With paid employees 64 478........................................ 73 362 22 590 1.0 1.0 3.023
No employees4 13 725........................................... 14 672 881 2.0 3.0 5.0241 to 4 employees 37 587.......................................... 41 068 5 048 1.0 1.0 3.0255 to 9 employees 7 853.......................................... 9 689 3 290 3.0 4.0 2.02610 to 19 employees 2 839....................................... 3 534 2 421 4.0 5.0 5.02720 to 49 employees 1 700....................................... 2 996 3 076 6.0 1.0 6.02850 to 99 employees 432....................................... 640 2 102 8.0 6.0 3.029100 employees or more 342.................................... 764 5 772 – 7.0 6.030
Other minority ~owned businesses 3 5 606 426.................. 697 710 99 709 – – 1.031
With no paid employees 470 075...................................... 507 127 18 626 – – 1.032With paid employees 136 351........................................ 190 584 81 084 1.0 1.0 1.033
No employees4 19 989........................................... 25 494 2 954 2.0 3.0 3.0341 to 4 employees 76 636.......................................... 97 191 19 052 1.0 1.0 2.0355 to 9 employees 22 862.......................................... 34 744 12 798 2.0 2.0 2.03610 to 19 employees 10 051....................................... 18 087 10 104 2.0 3.0 2.03720 to 49 employees 5 034....................................... 10 628 11 065 4.0 4.0 3.03850 to 99 employees 1 075....................................... 2 867 7 253 6.0 7.0 6.039100 employees or more 705.................................... 1 572 17 858 6.0 8.0 3.040
Women ~owned businesses 3 5 888 883.......................... 6 447 988 642 484 – – 2.041
With no paid employees 5 071 110...................................... 5 306 015 92 059 – – –42With paid employees 817 773........................................ 1 141 973 550 425 – – 2.043
No employees4 127 905........................................... 152 308 14 719 1.0 1.0 2.0441 to 4 employees 435 550.......................................... 572 029 84 262 – – 1.0455 to 9 employees 134 476.......................................... 205 190 67 583 1.0 1.0 1.04610 to 19 employees 67 487....................................... 112 149 69 767 1.0 1.0 2.04720 to 49 employees 35 515....................................... 63 948 92 381 1.0 2.0 3.04850 to 99 employees 10 178....................................... 21 274 64 223 2.0 3.0 3.049100 employees or more 6 663.................................... 15 074 157 490 2.0 2.0 6.050
Nonminority male ~owned businesses 3 10 114 456................. 11 498 830 2 526 942 – – 1.051
With no paid employees 8 019 462...................................... 8 717 650 293 057 – – –52With paid employees 2 094 993........................................ 2 781 180 2 233 885 – – 1.053
No employees4 271 380........................................... 301 609 41 974 – 1.0 1.0541 to 4 employees 1 155 800.......................................... 1 340 033 276 729 – – 1.0555 to 9 employees 334 483.......................................... 467 655 222 110 – 1.0 1.05610 to 19 employees 173 140....................................... 301 489 253 914 1.0 1.0 4.05720 to 49 employees 101 938....................................... 214 021 365 312 1.0 1.0 1.05850 to 99 employees 33 406....................................... 83 052 280 496 1.0 1.0 1.059100 employees or more 24 846.................................... 73 318 793 350 1.0 1.0 1.060
1For explanation of relative standard errors, see Reliability of Estimates in the introductory text.2Relative standard errors are not applicable for columns A and C, lines 1 through 10 since these data are the result of censuses, not surveys.3Includes individual proprietorships, partnerships, and subchapter S corporations.4Firms reported annual payroll, but did not report any employees on their payroll during specified period in 1992.5Includes Asians, Pacific Islanders, American Indians, and Alaska Natives.
28 CHARACTERISTICS OF BUSINESS OWNERS 1992 ECONOMIC CENSUS

Table 2d. Number of Firms, Owners, and Receipts by Legal Form of Organization of Firm: 1992[Detail may not add to total due to rounding. For meaning of abbreviations and symbols, see introductory text. For explanation of terms, see appendix A]
Type of firm and legal form of organization
Relative standard error of estimate (percent)1 2 for columnmFirms
(number)Owners
(number)
Sales andreceipts
($1,000,000)
A B C A B C
All businesses 3 17 253 143...................................... 19 287 647 3 324 200 (X) – (X)1
Individual proprietorships 14 599 295..................................... 14 599 295 721 565 (X) – (X)2Partnerships 1 089 578................................................ 2 130 947 664 927 (X) – (X)3Subchapter S corporations 1 564 270................................... 2 557 406 1 937 707 (X) – (X)4
Hispanic ~owned businesses 3 771 708......................... 811 287 72 824 – – 1.05
Individual proprietorships 689 015..................................... 689 015 25 666 – – 1.06Partnerships 32 650................................................ 49 594 11 934 2.0 3.0 5.07Subchapter S corporations 50 042................................... 72 678 35 224 1.0 2.0 2.08
Black ~owned businesses 3 620 912............................ 638 203 32 197 – – 2.09
Individual proprietorships 584 256..................................... 584 256 15 947 – – –10Partnerships 14 727................................................ 22 143 3 983 3.0 4.0 4.011Subchapter S corporations 21 928................................... 31 804 12 267 2.0 3.0 5.012
Other minority ~owned businesses 3 4 606 426.................. 697 710 99 709 – – 1.013
Individual proprietorships 502 022..................................... 502 022 35 389 – – 1.014Partnerships 49 489................................................ 92 179 23 702 1.0 2.0 3.015Subchapter S corporations 54 915................................... 103 510 40 619 1.0 2.0 2.016
Women ~owned businesses 3 5 888 883.......................... 6 447 988 642 484 – – 2.017
Individual proprietorships 5 078 077..................................... 5 078 077 121 883 – – –18Partnerships 243 651................................................ 454 236 88 296 1.0 1.0 2.019Subchapter S corporations 567 155................................... 915 675 432 305 – – 2.020
Nonminority male ~owned businesses 3 10 114 456................. 11 498 830 2 526 942 – – 1.021
Individual proprietorships 8 414 238..................................... 8 414 238 539 391 – – –22Partnerships 777 379................................................ 1 563 501 533 705 – – 1.023Subchapter S corporations 922 838................................... 1 521 091 1 453 845 – – 1.024
1For explanation of relative standard errors, see Reliability of Estimates in the introductory text.2Relative standard errors are not applicable for columns A and C, lines 1 through 4 since these data are the result of censuses, not surveys.3Includes individual proprietorships, partnerships, and subchapter S corporations.4Includes Asians, Pacific Islanders, American Indians, and Alaska Natives.
1992 ECONOMIC CENSUS CHARACTERISTICS OF BUSINESS OWNERS 29
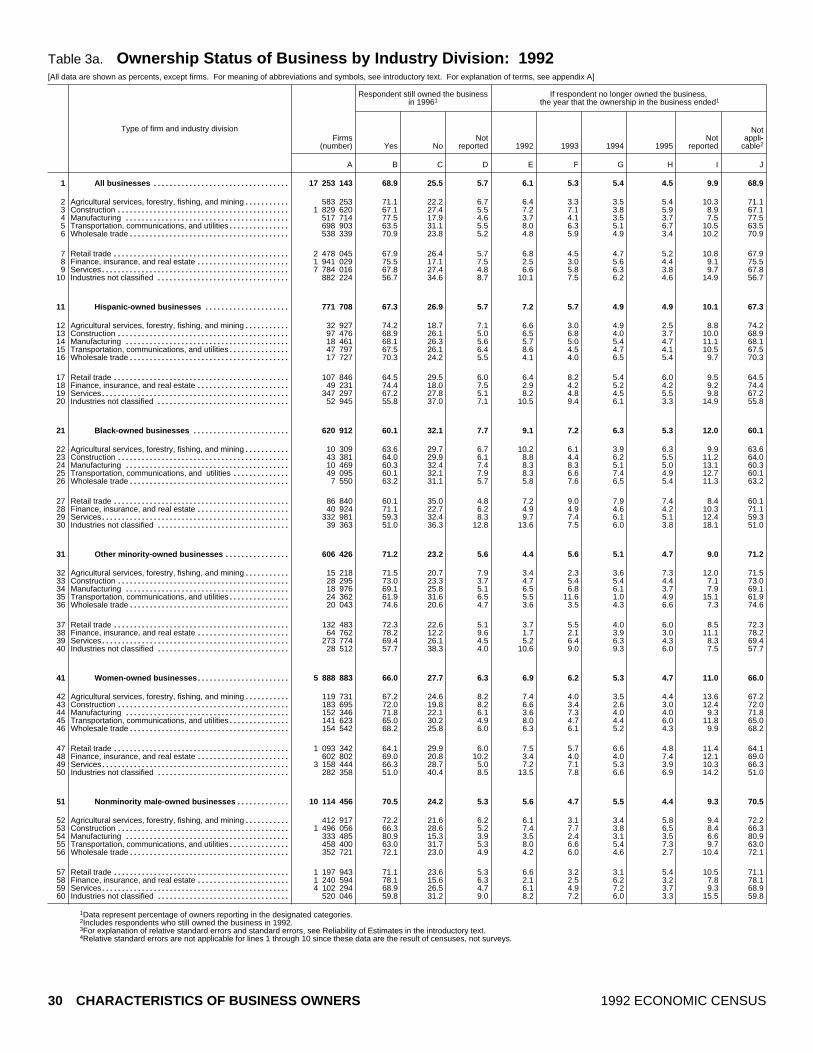
Table 3a. Ownership Status of Business by Industry Division: 1992[All data are shown as percents, except firms. For meaning of abbreviations and symbols, see introductory text. For explanation of terms, see appendix A]
Type of firm and industry division
Respondent still owned the businessin 19961
If respondent no longer owned the business, the year that the ownership in the business ended1
Firms(number) Yes No
Notreported 1992 1993 1994 1995
Notreported
Notappli~
cable2
A B C D E F G H I J
All businesses 17 253 143.................................. 68.9 25.5 5.7 6.1 5.3 5.4 4.5 9.9 68.91
Agricultural services, forestry, fishing, and mining 583 253........... 71.1 22.2 6.7 6.4 3.3 3.5 5.4 10.3 71.12Construction 1 829 620........................................... 67.1 27.4 5.5 7.2 7.1 3.8 5.9 8.9 67.13Manufacturing 517 714......................................... 77.5 17.9 4.6 3.7 4.1 3.5 3.7 7.5 77.54Transportation, communications, and utilities 698 903............... 63.5 31.1 5.5 8.0 6.3 5.1 6.7 10.5 63.55Wholesale trade 538 339........................................ 70.9 23.8 5.2 4.8 5.9 4.9 3.4 10.2 70.96
Retail trade 2 478 045............................................ 67.9 26.4 5.7 6.8 4.5 4.7 5.2 10.8 67.97Finance, insurance, and real estate 1 941 029....................... 75.5 17.1 7.5 2.5 3.0 5.6 4.4 9.1 75.58Services 7 784 016............................................... 67.8 27.4 4.8 6.6 5.8 6.3 3.8 9.7 67.89Industries not classified 882 224................................. 56.7 34.6 8.7 10.1 7.5 6.2 4.6 14.9 56.710
Hispanic ~owned businesses 771 708..................... 67.3 26.9 5.7 7.2 5.7 4.9 4.9 10.1 67.311
Agricultural services, forestry, fishing, and mining 32 927........... 74.2 18.7 7.1 6.6 3.0 4.9 2.5 8.8 74.212Construction 97 476........................................... 68.9 26.1 5.0 6.5 6.8 4.0 3.7 10.0 68.913Manufacturing 18 461......................................... 68.1 26.3 5.6 5.7 5.0 5.4 4.7 11.1 68.114Transportation, communications, and utilities 47 797............... 67.5 26.1 6.4 8.6 4.5 4.7 4.1 10.5 67.515Wholesale trade 17 727........................................ 70.3 24.2 5.5 4.1 4.0 6.5 5.4 9.7 70.316
Retail trade 107 846............................................ 64.5 29.5 6.0 6.4 8.2 5.4 6.0 9.5 64.517Finance, insurance, and real estate 49 231....................... 74.4 18.0 7.5 2.9 4.2 5.2 4.2 9.2 74.418Services 347 297............................................... 67.2 27.8 5.1 8.2 4.8 4.5 5.5 9.8 67.219Industries not classified 52 945................................. 55.8 37.0 7.1 10.5 9.4 6.1 3.3 14.9 55.820
Black ~owned businesses 620 912........................ 60.1 32.1 7.7 9.1 7.2 6.3 5.3 12.0 60.121
Agricultural services, forestry, fishing, and mining 10 309........... 63.6 29.7 6.7 10.2 6.1 3.9 6.3 9.9 63.622Construction 43 381........................................... 64.0 29.9 6.1 8.8 4.4 6.2 5.5 11.2 64.023Manufacturing 10 469......................................... 60.3 32.4 7.4 8.3 8.3 5.1 5.0 13.1 60.324Transportation, communications, and utilities 49 095.............. 60.1 32.1 7.9 8.3 6.6 7.4 4.9 12.7 60.125Wholesale trade 7 550........................................ 63.2 31.1 5.7 5.8 7.6 6.5 5.4 11.3 63.226
Retail trade 86 840............................................ 60.1 35.0 4.8 7.2 9.0 7.9 7.4 8.4 60.127Finance, insurance, and real estate 40 924....................... 71.1 22.7 6.2 4.9 4.9 4.6 4.2 10.3 71.128Services 332 981............................................... 59.3 32.4 8.3 9.7 7.4 6.1 5.1 12.4 59.329Industries not classified 39 363................................. 51.0 36.3 12.8 13.6 7.5 6.0 3.8 18.1 51.030
Other minority ~owned businesses 606 426................ 71.2 23.2 5.6 4.4 5.6 5.1 4.7 9.0 71.231
Agricultural services, forestry, fishing, and mining 15 218........... 71.5 20.7 7.9 3.4 2.3 3.6 7.3 12.0 71.532Construction 28 295........................................... 73.0 23.3 3.7 4.7 5.4 5.4 4.4 7.1 73.033Manufacturing 18 976......................................... 69.1 25.8 5.1 6.5 6.8 6.1 3.7 7.9 69.134Transportation, communications, and utilities 24 362............... 61.9 31.6 6.5 5.5 11.6 1.0 4.9 15.1 61.935Wholesale trade 20 043........................................ 74.6 20.6 4.7 3.6 3.5 4.3 6.6 7.3 74.636
Retail trade 132 483............................................ 72.3 22.6 5.1 3.7 5.5 4.0 6.0 8.5 72.337Finance, insurance, and real estate 64 762....................... 78.2 12.2 9.6 1.7 2.1 3.9 3.0 11.1 78.238Services 273 774............................................... 69.4 26.1 4.5 5.2 6.4 6.3 4.3 8.3 69.439Industries not classified 28 512................................. 57.7 38.3 4.0 10.6 9.0 9.3 6.0 7.5 57.740
Women ~owned businesses 5 888 883....................... 66.0 27.7 6.3 6.9 6.2 5.3 4.7 11.0 66.041
Agricultural services, forestry, fishing, and mining 119 731........... 67.2 24.6 8.2 7.4 4.0 3.5 4.4 13.6 67.242Construction 183 695........................................... 72.0 19.8 8.2 6.6 3.4 2.6 3.0 12.4 72.043Manufacturing 152 346......................................... 71.8 22.1 6.1 3.6 7.3 4.0 4.0 9.3 71.844Transportation, communications, and utilities 141 623............... 65.0 30.2 4.9 8.0 4.7 4.4 6.0 11.8 65.045Wholesale trade 154 542........................................ 68.2 25.8 6.0 6.3 6.1 5.2 4.3 9.9 68.246
Retail trade 1 093 342............................................ 64.1 29.9 6.0 7.5 5.7 6.6 4.8 11.4 64.147Finance, insurance, and real estate 602 802....................... 69.0 20.8 10.2 3.4 4.0 4.0 7.4 12.1 69.048Services 3 158 444............................................... 66.3 28.7 5.0 7.2 7.1 5.3 3.9 10.3 66.349Industries not classified 282 358................................. 51.0 40.4 8.5 13.5 7.8 6.6 6.9 14.2 51.050
Nonminority male ~owned businesses 10 114 456............. 70.5 24.2 5.3 5.6 4.7 5.5 4.4 9.3 70.551
Agricultural services, forestry, fishing, and mining 412 917........... 72.2 21.6 6.2 6.1 3.1 3.4 5.8 9.4 72.252Construction 1 496 056........................................... 66.3 28.6 5.2 7.4 7.7 3.8 6.5 8.4 66.353Manufacturing 333 485......................................... 80.9 15.3 3.9 3.5 2.4 3.1 3.5 6.6 80.954Transportation, communications, and utilities 458 400............... 63.0 31.7 5.3 8.0 6.6 5.4 7.3 9.7 63.055Wholesale trade 352 721........................................ 72.1 23.0 4.9 4.2 6.0 4.6 2.7 10.4 72.156
Retail trade 1 197 943............................................ 71.1 23.6 5.3 6.6 3.2 3.1 5.4 10.5 71.157Finance, insurance, and real estate 1 240 594....................... 78.1 15.6 6.3 2.1 2.5 6.2 3.2 7.8 78.158Services 4 102 294............................................... 68.9 26.5 4.7 6.1 4.9 7.2 3.7 9.3 68.959Industries not classified 520 046................................. 59.8 31.2 9.0 8.2 7.2 6.0 3.3 15.5 59.860
1Data represent percentage of owners reporting in the designated categories.2Includes respondents who still owned the business in 1992.3For explanation of relative standard errors and standard errors, see Reliability of Estimates in the introductory text.4Relative standard errors are not applicable for lines 1 through 10 since these data are the result of censuses, not surveys.
30 CHARACTERISTICS OF BUSINESS OWNERS 1992 ECONOMIC CENSUS

If the respondent no longer owned the business, the reason stated for the change in ownership1
Standard error of estimate3 for columnm
Sold
Trans~ferred
ownership/gift
Businessno longer
existsNot
reported
Notappli~
cable2
Relativestandard
error ofestimate3 4
K L M N O A B C D E F G H I J K L M N O
3.1 1.5 18.3 8.3 68.9 (X) .4 .5 .4 .3 .3 .3 .3 .4 .4 .5 .2 .6 .4 .4 1
1.8 1.5 14.9 10.7 71.1 (X) 3.3 3.2 1.3 1.0 1.0 .9 2.0 1.2 3.3 .5 .6 2.7 1.1 3.3 21.7 2.0 22.8 6.4 67.1 (X) 2.4 3.1 1.0 1.3 1.6 .8 1.5 1.2 2.4 .5 .5 2.6 1.0 2.4 32.4 1.8 12.4 6.0 77.5 (X) 1.8 1.5 .4 .8 1.6 .8 .6 .6 1.8 .5 .3 1.8 .5 1.8 43.7 2.1 21.9 8.8 63.5 (X) 2.7 2.0 1.0 1.2 1.2 1.0 1.4 1.5 2.7 .9 .6 1.8 1.3 2.7 52.7 2.3 16.0 8.1 70.9 (X) 1.3 1.5 .6 1.0 1.2 .8 .4 .8 1.3 .3 .5 1.3 .9 1.3 6
5.3 1.7 16.8 8.3 67.9 (X) 1.7 1.7 .6 .8 .7 .5 .8 .9 1.7 .8 .2 1.7 .8 1.7 73.7 1.3 10.9 8.6 75.5 (X) 2.1 2.2 1.1 .6 1.1 1.4 .9 1.5 2.1 1.3 .6 1.3 1.3 2.1 82.5 1.3 20.3 8.0 67.8 (X) .8 .8 .6 .4 .7 .5 .4 .7 .8 .6 .2 1.0 .6 .8 92.6 1.7 25.1 13.9 56.7 (X) 3.6 2.6 1.8 1.2 1.2 1.4 .8 2.2 3.6 1.3 .7 1.6 2.5 3.6 10
2.3 1.8 19.7 8.8 67.3 – 1.1 1.2 .4 .6 .4 .4 .4 .5 1.1 .2 .2 1.1 .5 1.1 11
1.0 1.8 14.8 8.3 74.2 1.0 2.8 1.3 2.4 1.0 1.1 1.6 .9 2.5 2.8 .4 .7 1.4 2.5 2.8 12.5 1.0 21.3 8.3 68.9 1.0 3.1 3.1 .7 1.0 1.8 .7 1.3 2.1 3.1 .3 .4 2.1 1.2 3.1 13
1.2 3.5 18.4 8.7 68.1 1.0 2.3 2.5 .7 1.5 1.0 1.2 1.1 .9 2.3 .4 .7 2.0 .8 2.3 142.7 2.2 18.3 9.3 67.5 1.0 2.1 1.8 1.3 1.3 1.3 1.2 1.0 1.3 2.1 1.2 .7 1.1 1.8 2.1 152.9 2.7 16.3 7.8 70.3 2.0 2.4 2.3 1.3 1.1 .9 2.2 1.2 1.0 2.4 1.4 .7 1.8 1.2 2.4 16
3.3 2.7 20.6 9.0 64.5 1.0 1.9 1.7 1.0 1.2 1.2 1.0 1.0 1.2 1.9 .7 .4 2.4 1.4 1.9 174.6 1.4 10.0 9.5 74.4 1.0 2.7 2.5 1.1 .6 1.0 .9 1.0 1.3 2.7 2.0 .5 1.3 1.3 2.7 182.2 1.7 20.9 8.1 67.2 – 2.3 2.7 .7 1.5 .8 .9 .6 .7 2.3 .3 .6 2.4 .9 2.3 192.0 1.0 26.9 14.3 55.8 1.0 3.0 4.0 2.1 1.9 2.4 1.6 1.1 2.0 3.0 .8 .5 3.4 2.0 3.0 20
1.1 1.5 26.0 11.2 60.1 – .6 .7 .6 .5 .4 .2 .4 .6 .6 .1 .2 .7 .7 .6 21
.8 1.1 25.2 9.4 63.6 1.0 2.1 1.7 .9 1.2 1.4 1.0 1.6 1.3 2.1 .3 .3 1.1 1.7 2.1 22
.7 1.1 24.7 9.5 64.0 – 1.4 1.7 .8 1.6 1.2 .9 1.2 1.0 1.4 .3 .5 1.4 1.1 1.4 231.6 2.1 25.0 11.0 60.3 1.0 2.6 2.4 1.4 1.0 1.2 1.0 .9 1.8 2.6 .5 .6 2.4 1.4 2.6 241.7 2.1 25.0 11.2 60.1 – 2.3 2.5 1.6 1.3 1.4 .8 .9 1.7 2.3 .8 .7 2.0 1.6 2.3 251.9 1.8 24.4 8.6 63.2 2.0 2.9 2.7 1.8 1.1 1.5 .9 1.5 2.1 2.9 .6 1.0 1.8 2.1 2.9 26
1.8 2.4 28.0 7.6 60.1 – 1.3 1.3 .6 1.0 1.2 1.0 1.5 .7 1.3 .5 .6 .9 .8 1.3 271.0 1.3 17.1 9.5 71.1 1.0 1.6 1.3 .8 .9 .8 .9 .8 1.0 1.6 .4 .3 1.4 1.3 1.6 28.9 1.3 26.5 12.0 59.3 – 1.2 1.0 1.1 .8 .7 .3 .5 1.3 1.2 .2 .2 .9 1.3 1.2 29
1.3 1.5 29.5 16.8 51.0 – 2.8 2.6 1.7 2.0 .8 1.2 .8 2.2 2.8 .5 .5 3.0 2.3 2.8 30
4.1 2.5 14.4 7.8 71.2 – 1.1 .9 .6 .5 .6 .4 .4 .9 1.1 .3 .2 .6 .8 1.1 31
3.2 2.5 12.1 10.8 71.5 1.0 3.4 2.4 1.7 1.4 1.1 1.1 2.5 2.3 3.4 1.2 1.5 1.8 2.3 3.4 32.7 2.7 18.2 5.5 73.0 1.0 2.6 2.9 1.1 1.3 1.9 1.4 1.2 1.4 2.6 .3 .9 3.3 1.4 2.6 33
2.2 3.9 18.1 6.7 69.1 1.0 3.6 3.6 1.5 2.2 1.7 2.1 .9 1.6 3.6 .8 1.6 3.1 1.5 3.6 342.7 1.3 19.5 14.6 61.9 1.0 3.6 4.0 1.7 1.7 3.4 .5 1.6 2.7 3.6 1.3 .9 3.2 3.1 3.6 351.3 1.4 16.2 6.5 74.6 1.0 2.8 2.4 1.2 1.3 1.1 1.5 1.4 2.2 2.8 .4 .3 2.0 1.9 2.8 36
7.8 3.3 9.8 6.8 72.3 1.0 2.4 2.1 .8 1.0 1.4 1.0 1.0 1.2 2.4 .9 1.0 1.3 1.1 2.4 373.9 2.0 5.7 10.1 78.2 1.0 2.4 2.5 2.1 .6 1.0 1.4 1.1 1.8 2.4 1.9 1.1 1.7 2.1 2.4 383.2 2.3 17.9 7.2 69.4 – 1.5 1.3 .7 1.0 .9 .9 .6 1.0 1.5 .7 .6 1.3 .8 1.5 393.6 3.5 28.1 7.1 57.7 1.0 4.2 3.9 1.2 1.7 2.2 2.1 1.7 1.3 4.2 1.6 1.1 3.4 1.3 4.2 40
2.0 1.4 20.8 9.9 66.0 – 1.1 .9 .5 .5 .5 .4 .6 .7 1.1 .2 .2 .8 .6 1.1 41
2.3 1.8 16.5 12.3 67.2 – 1.8 1.6 2.0 2.0 1.1 .9 1.2 2.9 1.8 .6 .7 2.7 2.9 1.8 421.2 .4 16.5 9.9 72.0 – 2.2 1.5 1.4 1.7 1.3 .5 .6 1.7 2.2 .3 .2 2.0 1.4 2.2 431.5 2.6 15.6 8.5 71.8 – 2.7 2.6 .9 1.2 2.8 .9 .5 1.5 2.7 .5 .6 2.9 1.1 2.7 444.0 1.5 20.2 9.2 65.0 – 3.3 3.6 .9 1.4 1.7 1.0 1.6 .9 3.3 1.0 .3 3.0 1.3 3.3 452.6 1.6 19.5 8.1 68.2 – 1.3 1.9 1.2 1.0 1.5 1.5 1.0 1.6 1.3 .7 .6 1.4 1.3 1.3 46
3.5 1.7 22.6 8.1 64.1 – 2.5 2.2 1.3 1.1 1.0 .9 1.2 1.7 2.5 .7 .4 1.9 1.7 2.5 472.7 1.1 14.9 12.3 69.0 – 2.1 2.7 1.7 1.1 .8 1.1 2.3 1.8 2.1 1.0 .5 2.0 1.8 2.1 481.0 1.3 21.7 9.7 66.3 – 1.8 1.3 .7 .9 .9 .9 .5 1.0 1.8 .2 .3 1.4 .8 1.8 492.9 1.0 31.8 13.2 51.0 – 3.0 2.8 1.4 2.4 2.0 1.9 1.2 1.9 3.0 .9 .5 1.8 1.9 3.0 50
3.7 1.6 16.9 7.4 70.5 – 1.0 1.0 .6 .4 .6 .7 .4 .6 1.0 .8 .3 1.1 .6 1.0 51
1.8 1.3 14.4 10.4 72.2 – 4.7 4.5 2.0 1.7 1.3 1.1 2.9 2.0 4.7 .7 .9 4.0 2.0 4.7 521.8 2.3 23.8 5.8 66.3 – 3.0 3.8 1.2 1.7 2.0 .9 1.9 1.6 3.0 .7 .6 3.2 1.1 3.0 532.9 1.2 10.3 4.7 80.9 – 2.0 1.7 .7 1.1 1.1 1.3 .6 .7 2.0 .5 .4 1.9 .6 2.0 543.9 2.3 22.7 8.1 63.0 – 4.2 3.4 1.2 2.0 1.9 1.6 2.0 2.1 4.2 1.1 .9 3.0 1.7 4.2 552.7 2.5 14.4 8.2 72.1 – 2.2 2.3 .8 1.8 1.6 1.1 .4 1.4 2.2 .5 .9 1.9 1.1 2.2 56
6.7 1.6 12.1 8.5 71.1 – 2.8 2.9 1.1 1.1 1.2 .9 1.8 1.3 2.8 1.4 .3 2.3 1.4 2.8 574.1 1.4 9.4 7.0 78.1 – 2.9 3.3 1.2 .7 1.4 1.9 1.0 1.7 2.9 1.7 .8 1.8 1.4 2.9 583.7 1.2 19.3 6.8 68.9 – 1.7 1.4 .9 .9 1.0 1.1 .7 .9 1.7 1.1 .4 1.8 .9 1.7 592.4 2.1 21.3 14.3 59.8 – 5.5 4.2 2.9 2.1 1.8 1.8 1.5 3.8 5.5 1.9 1.1 2.6 4.1 5.5 60
1992 ECONOMIC CENSUS CHARACTERISTICS OF BUSINESS OWNERS 31

Table 3b. Ownership Status of Business by Receipts Size of Firm: 1992[All data are shown as percents, except firms. For meaning of abbreviations and symbols, see introductory text. For explanation of terms, see appendix A]
Type of firm and receipts size
Respondent still owned the businessin 19961
If respondent no longer owned the business, the year that the ownership in the business ended1
Firms(number) Yes No
Notreported 1992 1993 1994 1995
Notreported
Notappli~
cable2
A B C D E F G H I J
All businesses 17 253 143.................................. 68.9 25.5 5.7 6.1 5.3 5.4 4.5 9.9 68.91
Less than $5,000 5 226 553....................................... 53.4 40.4 6.2 12.7 7.9 8.1 4.3 13.5 53.42$5,000 to $9,999 2 443 946....................................... 58.7 33.8 7.6 7.7 10.0 7.0 5.6 11.1 58.73$10,000 to $24,999 3 076 410..................................... 70.6 25.2 4.2 6.0 6.0 4.2 5.9 7.3 70.64$25,000 to $49,999 1 945 806..................................... 74.8 20.9 4.3 4.2 4.7 5.1 4.5 6.7 74.85$50,000 to $99,999 1 615 940..................................... 79.2 16.3 4.5 1.9 2.1 4.7 3.7 8.4 79.26
$100,000 to $199,999 1 197 996................................... 82.1 13.1 4.7 1.5 1.7 3.1 4.0 7.6 82.17$200,000 to $249,999 301 794................................... 85.3 11.1 3.6 .2 .7 2.4 3.7 7.7 85.38$250,000 to $499,999 682 583................................... 82.2 10.1 7.7 .4 .8 3.2 2.7 10.6 82.29$500,000 to $999,999 372 078................................... 82.5 9.8 7.7 .6 .5 2.7 3.4 10.3 82.510$1,000,000 or more 390 037..................................... 82.7 9.3 8.0 .4 .6 2.2 3.5 10.7 82.711
Hispanic ~owned businesses 771 708..................... 67.3 26.9 5.7 7.2 5.7 4.9 4.9 10.1 67.312
Less than $5,000 219 226....................................... 46.0 48.2 5.7 17.0 10.6 5.9 5.9 14.5 46.013$5,000 to $9,999 140 362....................................... 57.6 34.6 7.7 10.5 9.4 4.5 5.2 12.7 57.614$10,000 to $24,999 165 667..................................... 68.2 27.1 4.7 7.5 5.6 6.3 4.7 7.7 68.215$25,000 to $49,999 87 288..................................... 79.3 15.2 5.5 1.2 3.9 3.9 5.1 6.6 79.316$50,000 to $99,999 64 742..................................... 78.5 17.6 3.9 1.6 2.5 4.7 5.8 7.0 78.517
$100,000 to $199,999 41 578................................... 84.0 11.6 4.4 .9 1.4 3.1 3.5 7.1 84.018$200,000 to $249,999 10 030................................... 80.3 12.9 6.7 1.7 .4 2.9 3.2 11.5 80.319$250,000 to $499,999 22 301................................... 79.7 13.2 7.1 .3 .6 5.3 3.3 10.8 79.720$500,000 to $999,999 11 319................................... 80.2 10.0 9.9 1.3 1.0 1.2 3.4 13.0 80.221$1,000,000 or more 9 194..................................... 85.0 7.9 7.0 .2 .2 2.6 2.3 9.7 85.022
Black ~owned businesses 620 912........................ 60.1 32.1 7.7 9.1 7.2 6.3 5.3 12.0 60.123
Less than $5,000 236 722....................................... 46.0 43.8 10.2 15.2 9.9 7.7 5.4 15.8 46.024$5,000 to $9,999 111 512....................................... 56.9 35.1 8.0 8.3 8.4 6.7 7.7 12.0 56.925$10,000 to $24,999 129 901..................................... 66.1 27.5 6.4 6.5 6.2 6.2 5.1 9.9 66.126$25,000 to $49,999 62 209..................................... 71.9 22.8 5.3 6.0 3.9 5.7 4.1 8.4 71.927$50,000 to $99,999 39 218..................................... 80.2 15.8 3.9 2.1 4.4 3.5 2.4 7.3 80.228
$100,000 to $199,999 20 936................................... 80.9 13.5 5.5 1.0 1.9 3.8 3.9 8.5 80.929$200,000 to $249,999 4 533................................... 83.6 12.6 3.8 .2 1.2 3.8 4.5 6.8 83.630$250,000 to $499,999 9 029................................... 83.3 10.8 5.9 .9 1.4 2.1 4.1 8.1 83.331$500,000 to $999,999 3 823................................... 85.8 7.2 7.0 .2 .5 1.3 2.9 9.3 85.832$1,000,000 or more 3 028..................................... 79.1 11.2 9.7 .1 .3 2.0 3.6 14.8 79.133
Other minority ~owned businesses 606 426................ 71.2 23.2 5.6 4.4 5.6 5.1 4.7 9.0 71.234
Less than $5,000 132 493....................................... 56.0 39.6 4.4 10.8 11.1 8.0 4.3 9.9 56.035$5,000 to $9,999 80 435....................................... 59.7 37.0 3.3 12.9 8.6 3.9 4.3 10.5 59.736$10,000 to $24,999 108 195..................................... 67.5 26.3 6.2 4.0 5.6 4.9 10.6 7.5 67.537$25,000 to $49,999 77 345..................................... 66.8 26.7 6.5 2.3 8.9 9.3 4.0 8.7 66.838$50,000 to $99,999 70 360..................................... 77.4 17.7 4.9 2.6 4.5 4.4 4.0 7.1 77.439
$100,000 to $199,999 58 620................................... 79.3 14.7 6.0 1.0 1.6 3.4 4.4 10.4 79.340$200,000 to $249,999 15 740................................... 81.1 10.5 8.4 .6 1.6 4.1 4.0 8.6 81.141$250,000 to $499,999 34 266................................... 85.0 10.8 4.2 .8 1.0 2.5 3.1 7.6 85.042$500,000 to $999,999 16 467................................... 85.2 7.5 7.3 .4 .7 2.1 2.2 9.4 85.243$1,000,000 or more 12 505..................................... 82.7 8.0 9.4 .5 .6 2.3 2.0 11.9 82.744
Women ~owned businesses 5 888 883....................... 66.0 27.7 6.3 6.9 6.2 5.3 4.7 11.0 66.045
Less than $5,000 2 310 303....................................... 51.5 41.9 6.6 13.8 9.7 6.7 4.6 13.7 51.546$5,000 to $9,999 967 380....................................... 62.6 29.7 7.7 6.7 9.0 6.3 4.2 11.2 62.647$10,000 to $24,999 1 051 358..................................... 71.4 24.3 4.3 4.5 5.3 4.6 7.0 7.2 71.448$25,000 to $49,999 538 885..................................... 74.1 21.3 4.5 2.8 4.1 5.9 3.9 9.1 74.149$50,000 to $99,999 381 517..................................... 75.2 17.5 7.3 1.6 2.3 4.2 4.7 12.0 75.250
$100,000 to $199,999 267 089................................... 84.0 11.4 4.6 .9 .8 2.6 3.9 7.7 84.051$200,000 to $249,999 66 464................................... 86.9 5.8 7.3 – .1 .8 2.0 10.2 86.952$250,000 to $499,999 146 313................................... 80.1 12.3 7.6 .6 .3 3.2 4.3 11.5 80.153$500,000 to $999,999 80 539................................... 82.2 7.9 10.0 .4 .2 2.1 2.6 12.5 82.254$1,000,000 or more 79 037..................................... 84.0 6.9 9.1 .2 .6 1.6 1.9 11.8 84.055
Nonminority male ~owned businesses 10 114 456............. 70.5 24.2 5.3 5.6 4.7 5.5 4.4 9.3 70.556
Less than $5,000 2 608 047....................................... 55.5 38.7 5.8 11.5 6.3 9.5 4.0 13.3 55.557$5,000 to $9,999 1 285 456....................................... 56.0 36.5 7.5 8.0 10.8 7.9 6.7 10.6 56.058$10,000 to $24,999 1 763 830..................................... 70.6 25.5 3.9 6.9 6.4 3.7 5.2 7.2 70.659$25,000 to $49,999 1 248 482..................................... 75.1 20.8 4.1 5.0 4.9 4.6 4.9 5.5 75.160$50,000 to $99,999 1 108 065..................................... 80.5 16.0 3.5 2.1 1.8 5.0 3.3 7.4 80.561
$100,000 to $199,999 840 723................................... 81.5 13.7 4.8 1.8 2.0 3.3 4.0 7.5 81.562$200,000 to $249,999 212 693................................... 85.2 12.9 1.9 .1 .9 2.8 4.3 6.6 85.263$250,000 to $499,999 488 462................................... 82.9 9.1 8.1 .3 1.0 3.2 2.0 10.6 82.964$500,000 to $999,999 266 408................................... 82.7 10.4 6.9 .6 .6 3.0 3.7 9.5 82.765$1,000,000 or more 292 290..................................... 82.4 10.0 7.7 .4 .6 2.3 3.9 10.4 82.466
1Data represent percentage of owners reporting in the designated categories.2Includes respondents who still owned the business in 1992.3For explanation of relative standard errors and standard errors, see Reliability of Estimates in the introductory text.4Relative standard errors are not applicable for lines 1 through 11 since these data are the result of censuses, not surveys.
32 CHARACTERISTICS OF BUSINESS OWNERS 1992 ECONOMIC CENSUS
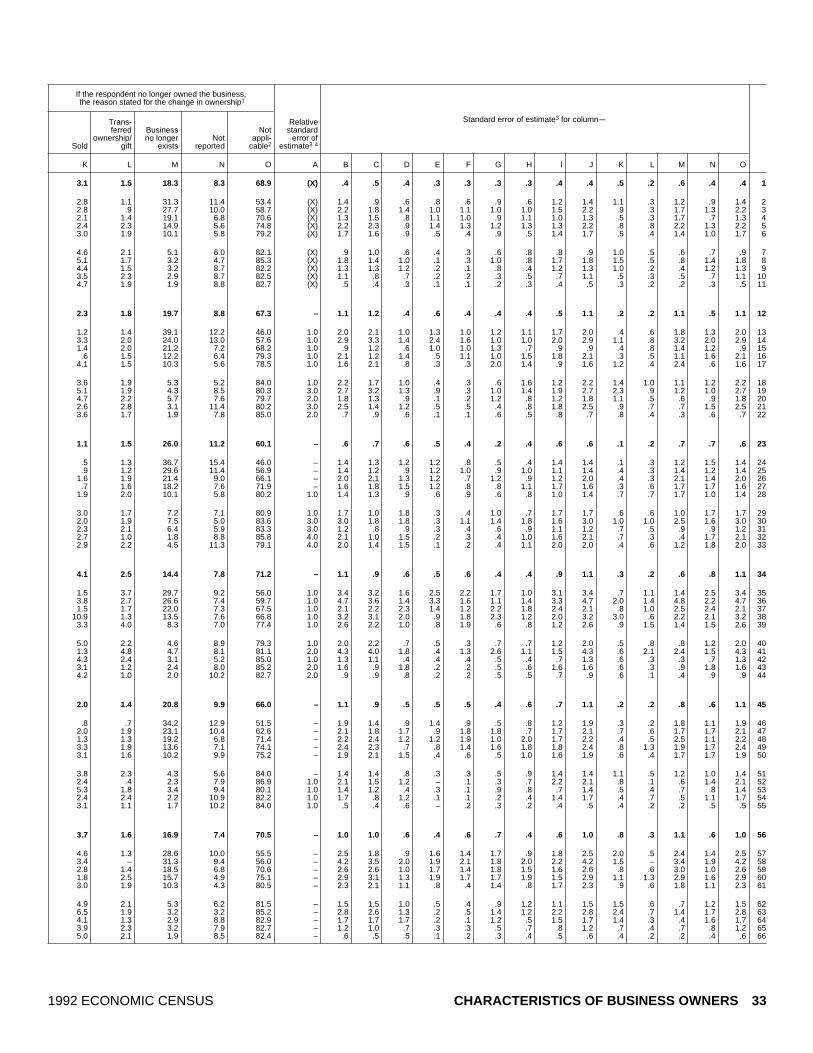
If the respondent no longer owned the business, the reason stated for the change in ownership1
Standard error of estimate3 for columnm
Sold
Trans~ferred
ownership/gift
Businessno longer
existsNot
reported
Notappli~
cable2
Relativestandard
error ofestimate3 4
K L M N O A B C D E F G H I J K L M N O
3.1 1.5 18.3 8.3 68.9 (X) .4 .5 .4 .3 .3 .3 .3 .4 .4 .5 .2 .6 .4 .4 1
2.8 1.1 31.3 11.4 53.4 (X) 1.4 .9 .6 .8 .6 .9 .6 1.2 1.4 1.1 .3 1.2 .9 1.4 22.8 .9 27.7 10.0 58.7 (X) 2.2 1.8 1.4 1.0 1.1 1.0 1.0 1.5 2.2 .9 .3 1.7 1.3 2.2 32.1 1.4 19.1 6.8 70.6 (X) 1.3 1.5 .8 1.1 1.0 .9 1.1 1.0 1.3 .5 .3 1.7 .7 1.3 42.4 2.3 14.9 5.6 74.8 (X) 2.2 2.3 .9 1.4 1.3 1.2 1.3 1.3 2.2 .8 .8 2.2 1.3 2.2 53.0 1.9 10.1 5.8 79.2 (X) 1.7 1.6 .9 .5 .4 .9 .5 1.4 1.7 .5 .4 1.4 1.0 1.7 6
4.6 2.1 5.1 6.0 82.1 (X) .9 1.0 .6 .4 .3 .6 .8 .8 .9 1.0 .5 .6 .7 .9 75.1 1.7 3.2 4.7 85.3 (X) 1.8 1.4 1.0 .1 .3 1.0 .8 1.7 1.8 1.5 .5 .8 1.4 1.8 84.4 1.5 3.2 8.7 82.2 (X) 1.3 1.3 1.2 .2 .1 .8 .4 1.2 1.3 1.0 .2 .4 1.2 1.3 93.5 2.3 2.9 8.7 82.5 (X) 1.1 .8 .7 .2 .2 .3 .5 .7 1.1 .5 .3 .5 .7 1.1 104.7 1.9 1.9 8.8 82.7 (X) .5 .4 .3 .1 .1 .2 .3 .4 .5 .3 .2 .2 .3 .5 11
2.3 1.8 19.7 8.8 67.3 – 1.1 1.2 .4 .6 .4 .4 .4 .5 1.1 .2 .2 1.1 .5 1.1 12
1.2 1.4 39.1 12.2 46.0 1.0 2.0 2.1 1.0 1.3 1.0 1.2 1.1 1.7 2.0 .4 .6 1.8 1.3 2.0 133.3 2.0 24.0 13.0 57.6 1.0 2.9 3.3 1.4 2.4 1.6 1.0 1.0 2.0 2.9 1.1 .8 3.2 2.0 2.9 141.4 2.0 21.2 7.2 68.2 1.0 .9 1.2 .6 1.0 1.0 1.3 .7 .9 .9 .4 .8 1.4 1.2 .9 15.6 1.5 12.2 6.4 79.3 1.0 2.1 1.2 1.4 .5 1.1 1.0 1.5 1.8 2.1 .3 .5 1.1 1.6 2.1 16
4.1 1.5 10.3 5.6 78.5 1.0 1.6 2.1 .8 .3 .3 2.0 1.4 .9 1.6 1.2 .4 2.4 .6 1.6 17
3.6 1.9 5.3 5.2 84.0 1.0 2.2 1.7 1.0 .4 .3 .6 1.6 1.2 2.2 1.4 1.0 1.1 1.2 2.2 185.1 1.9 4.3 8.5 80.3 3.0 2.7 3.2 1.3 .9 .3 1.0 1.4 1.9 2.7 2.3 .9 1.2 1.0 2.7 194.7 2.2 5.7 7.6 79.7 2.0 1.8 1.3 .9 .1 .2 1.2 .8 1.2 1.8 1.1 .5 .6 .9 1.8 202.6 2.8 3.1 11.4 80.2 3.0 2.5 1.4 1.2 .5 .5 .4 .8 1.8 2.5 .9 .7 .7 1.5 2.5 213.6 1.7 1.9 7.8 85.0 2.0 .7 .9 .6 .1 .1 .6 .5 .8 .7 .8 .4 .3 .6 .7 22
1.1 1.5 26.0 11.2 60.1 – .6 .7 .6 .5 .4 .2 .4 .6 .6 .1 .2 .7 .7 .6 23
.5 1.3 36.7 15.4 46.0 – 1.4 1.3 1.2 1.2 .8 .5 .4 1.4 1.4 .1 .3 1.2 1.5 1.4 24
.9 1.2 29.6 11.4 56.9 – 1.4 1.2 .9 1.2 1.0 .9 1.0 1.1 1.4 .4 .3 1.4 1.2 1.4 251.6 1.9 21.4 9.0 66.1 – 2.0 2.1 1.3 1.2 .7 1.2 .9 1.2 2.0 .4 .3 2.1 1.4 2.0 26.7 1.6 18.2 7.6 71.9 – 1.6 1.8 1.5 1.2 .8 .8 1.1 1.7 1.6 .3 .6 1.7 1.7 1.6 27
1.9 2.0 10.1 5.8 80.2 1.0 1.4 1.3 .9 .6 .9 .6 .8 1.0 1.4 .7 .7 1.7 1.0 1.4 28
3.0 1.7 7.2 7.1 80.9 1.0 1.7 1.0 1.8 .3 .4 1.0 .7 1.7 1.7 .6 .6 1.0 1.7 1.7 292.0 1.9 7.5 5.0 83.6 3.0 3.0 1.8 1.8 .3 1.1 1.4 1.8 1.6 3.0 1.0 1.0 2.5 1.6 3.0 302.3 2.1 6.4 5.9 83.3 3.0 1.2 .8 .9 .3 .4 .6 .9 1.1 1.2 .7 .5 .9 .9 1.2 312.7 1.0 1.8 8.8 85.8 4.0 2.1 1.0 1.5 .2 .3 .4 1.0 1.6 2.1 .7 .3 .4 1.7 2.1 322.9 2.2 4.5 11.3 79.1 4.0 2.0 1.4 1.5 .1 .2 .4 1.1 2.0 2.0 .4 .6 1.2 1.8 2.0 33
4.1 2.5 14.4 7.8 71.2 – 1.1 .9 .6 .5 .6 .4 .4 .9 1.1 .3 .2 .6 .8 1.1 34
1.5 3.7 29.7 9.2 56.0 1.0 3.4 3.2 1.6 2.5 2.2 1.7 1.0 3.1 3.4 .7 1.1 1.4 2.5 3.4 353.8 2.7 26.6 7.4 59.7 1.0 4.7 3.6 1.4 3.3 1.6 1.1 1.4 3.3 4.7 2.0 1.4 4.8 2.2 4.7 361.5 1.7 22.0 7.3 67.5 1.0 2.1 2.2 2.3 1.4 1.2 2.2 1.8 2.4 2.1 .8 1.0 2.5 2.4 2.1 37
10.9 1.3 13.5 7.6 66.8 1.0 3.2 3.1 2.0 .9 1.8 2.3 1.2 2.0 3.2 3.0 .6 2.2 2.1 3.2 383.3 4.0 8.3 7.0 77.4 1.0 2.6 2.2 1.0 .8 1.9 .6 .8 1.2 2.6 .9 1.5 1.4 1.5 2.6 39
5.0 2.2 4.6 8.9 79.3 1.0 2.0 2.2 .7 .5 .3 .7 .7 1.2 2.0 .5 .8 .8 1.2 2.0 401.3 4.8 4.7 8.1 81.1 2.0 4.3 4.0 1.8 .4 1.3 2.6 1.1 1.5 4.3 .6 2.1 2.4 1.5 4.3 414.3 2.4 3.1 5.2 85.0 1.0 1.3 1.1 .4 .4 .4 .5 .4 .7 1.3 .6 .3 .3 .7 1.3 423.1 1.2 2.4 8.0 85.2 2.0 1.6 .9 1.8 .2 .2 .5 .6 1.6 1.6 .6 .3 .9 1.8 1.6 434.2 1.0 2.0 10.2 82.7 2.0 .9 .9 .8 .2 .2 .5 .5 .7 .9 .6 .1 .4 .9 .9 44
2.0 1.4 20.8 9.9 66.0 – 1.1 .9 .5 .5 .5 .4 .6 .7 1.1 .2 .2 .8 .6 1.1 45
.8 .7 34.2 12.9 51.5 – 1.9 1.4 .9 1.4 .9 .5 .8 1.2 1.9 .3 .2 1.8 1.1 1.9 462.0 1.9 23.1 10.4 62.6 – 2.1 1.8 1.7 .9 1.8 1.8 .7 1.7 2.1 .7 .6 1.7 1.7 2.1 471.3 1.3 19.2 6.8 71.4 – 2.2 2.4 1.2 1.2 1.9 1.0 2.0 1.7 2.2 .4 .5 2.5 1.1 2.2 483.3 1.9 13.6 7.1 74.1 – 2.4 2.3 .7 .8 1.4 1.6 1.8 1.8 2.4 .8 1.3 1.9 1.7 2.4 493.1 1.6 10.2 9.9 75.2 – 1.9 2.1 1.5 .4 .6 .5 1.0 1.6 1.9 .6 .4 1.7 1.7 1.9 50
3.8 2.3 4.3 5.6 84.0 – 1.4 1.4 .8 .3 .3 .5 .9 1.4 1.4 1.1 .5 1.2 1.0 1.4 512.4 .4 2.3 7.9 86.9 1.0 2.1 1.5 1.2 – .1 .3 .7 2.2 2.1 .8 .1 .6 1.4 2.1 525.3 1.8 3.4 9.4 80.1 1.0 1.4 1.2 .4 .3 .1 .9 .8 .7 1.4 .5 .4 .7 .8 1.4 532.4 2.4 2.2 10.9 82.2 1.0 1.7 .8 1.2 .1 .1 .2 .4 1.4 1.7 .4 .7 .5 1.1 1.7 543.1 1.1 1.7 10.2 84.0 1.0 .5 .4 .6 – .2 .3 .2 .4 .5 .4 .2 .2 .5 .5 55
3.7 1.6 16.9 7.4 70.5 – 1.0 1.0 .6 .4 .6 .7 .4 .6 1.0 .8 .3 1.1 .6 1.0 56
4.6 1.3 28.6 10.0 55.5 – 2.5 1.8 .9 1.6 1.4 1.7 .9 1.8 2.5 2.0 .5 2.4 1.4 2.5 573.4 – 31.3 9.4 56.0 – 4.2 3.5 2.0 1.9 2.1 1.8 2.0 2.2 4.2 1.5 – 3.4 1.9 4.2 582.8 1.4 18.5 6.8 70.6 – 2.6 2.6 1.0 1.7 1.4 1.8 1.5 1.6 2.6 .8 .6 3.0 1.0 2.6 591.8 2.5 15.7 4.9 75.1 – 2.9 3.1 1.3 1.9 1.7 1.7 1.9 1.5 2.9 1.1 1.3 2.9 1.6 2.9 603.0 1.9 10.3 4.3 80.5 – 2.3 2.1 1.1 .8 .4 1.4 .8 1.7 2.3 .9 .6 1.8 1.1 2.3 61
4.9 2.1 5.3 6.2 81.5 – 1.5 1.5 1.0 .5 .4 .9 1.2 1.1 1.5 1.5 .6 .7 1.2 1.5 626.5 1.9 3.2 3.2 85.2 – 2.8 2.6 1.3 .2 .5 1.4 1.2 2.2 2.8 2.4 .7 1.4 1.7 2.8 634.1 1.3 2.9 8.8 82.9 – 1.7 1.7 1.7 .2 .1 1.2 .5 1.5 1.7 1.4 .3 .4 1.6 1.7 643.9 2.3 3.2 7.9 82.7 – 1.2 1.0 .7 .3 .3 .5 .7 .8 1.2 .7 .4 .7 .8 1.2 655.0 2.1 1.9 8.5 82.4 – .6 .5 .5 .1 .2 .3 .4 .5 .6 .4 .2 .2 .4 .6 66
1992 ECONOMIC CENSUS CHARACTERISTICS OF BUSINESS OWNERS 33

Table 3c. Ownership Status of Business by Employment Size of Firm: 1992[All data are shown as percents, except firms. For meaning of abbreviations and symbols, see introductory text. For explanation of terms, see appendix A]
Type of firm and employment size
Respondent still owned the businessin 19961
If respondent no longer owned the business, the year that the ownership in the business ended1
Firms(number) Yes No
Notreported 1992 1993 1994 1995
Notreported
Notappli~
cable2
A B C D E F G H I J
All businesses 17 253 143.................................. 68.9 25.5 5.7 6.1 5.3 5.4 4.5 9.9 68.91
With no paid employees 14 118 184................................. 65.2 29.2 5.5 7.6 6.6 6.1 4.7 9.7 65.22With paid employees 3 134 959.................................... 80.8 12.9 6.3 1.0 .9 3.1 3.7 10.5 80.83
No employees5 435 838....................................... 77.7 16.1 6.2 2.5 2.7 4.2 3.0 9.9 77.741 to 4 employees 1 716 076..................................... 80.6 14.1 5.3 1.2 .9 3.0 4.0 10.2 80.655 to 9 employees 503 808..................................... 80.8 11.8 7.4 .8 .5 2.7 4.0 11.2 80.8610 to 19 employees 256 110................................... 83.6 9.4 7.0 .1 .5 3.0 2.5 10.2 83.6720 to 49 employees 144 734................................... 81.9 10.7 7.4 .2 .3 3.3 4.0 10.3 81.9850 to 99 employees 45 331................................... 82.5 9.1 8.4 .3 .6 2.7 3.3 10.6 82.59100 employees or more 33 062............................... 78.5 11.3 10.2 1.2 .3 1.6 3.8 14.6 78.510
Hispanic ~owned businesses 771 708..................... 67.3 26.9 5.7 7.2 5.7 4.9 4.9 10.1 67.311
With no paid employees 656 343................................. 63.3 31.2 5.5 9.2 7.0 5.4 5.2 9.8 63.312With paid employees 115 364.................................... 80.5 12.9 6.6 .5 1.3 2.9 3.9 10.8 80.513
No employees5 19 569....................................... 80.4 12.6 7.0 1.3 2.0 3.9 2.0 10.4 80.4141 to 4 employees 64 631..................................... 79.4 14.6 6.1 .1 1.6 2.8 4.6 11.6 79.4155 to 9 employees 16 937..................................... 83.2 10.9 5.9 1.4 .7 2.3 4.1 8.1 83.21610 to 19 employees 8 553................................... 79.6 11.1 9.3 – .6 3.0 3.8 13.0 79.61720 to 49 employees 4 050................................... 80.1 11.2 8.7 .2 .6 4.0 3.2 11.9 80.11850 to 99 employees 948................................... 90.3 5.7 4.0 – – 2.6 1.7 5.4 90.319100 employees or more 676............................... 90.9 4.7 4.4 – – .8 2.2 6.1 90.920
Black ~owned businesses 620 912........................ 60.1 32.1 7.7 9.1 7.2 6.3 5.3 12.0 60.121
With no paid employees 556 434................................. 57.5 34.4 8.1 10.0 7.9 6.7 5.6 12.3 57.522With paid employees 64 478.................................... 79.5 15.7 4.8 2.1 2.4 3.7 3.0 9.4 79.523
No employees5 13 725....................................... 66.8 25.8 7.4 8.0 5.0 4.8 3.5 11.9 66.8241 to 4 employees 37 587..................................... 82.9 14.0 3.0 .9 1.5 4.0 2.7 8.1 82.9255 to 9 employees 7 853..................................... 80.8 13.5 5.7 .5 4.0 2.1 3.8 8.7 80.82610 to 19 employees 2 839................................... 81.5 8.7 9.8 .4 .6 2.5 1.8 13.2 81.52720 to 49 employees 1 700................................... 82.8 8.3 8.9 – (D) (D) 4.7 11.3 82.82850 to 99 employees 432................................... 78.6 17.1 4.2 – (D) (D) 1.4 13.9 78.629100 employees or more 342............................... 81.9 9.4 8.7 – (D) (D) .9 15.2 81.930
Other minority ~owned businesses 606 426................ 71.2 23.2 5.6 4.4 5.6 5.1 4.7 9.0 71.231
With no paid employees 470 075................................. 66.2 29.1 4.8 6.2 7.4 6.3 5.3 8.5 66.232With paid employees 136 351.................................... 81.3 11.4 7.3 .8 1.8 2.8 3.4 10.0 81.333
No employees5 19 989....................................... 83.1 9.6 7.3 1.6 1.2 1.5 5.2 7.4 83.1341 to 4 employees 76 636..................................... 79.9 13.2 6.9 1.1 3.0 3.6 2.6 9.7 79.9355 to 9 employees 22 862..................................... 82.6 9.5 8.0 .1 .2 2.9 4.0 10.2 82.63610 to 19 employees 10 051................................... 83.5 10.4 6.1 – .2 1.7 4.5 10.0 83.53720 to 49 employees 5 034................................... 83.1 9.1 7.8 .1 .9 .8 3.0 11.9 83.13850 to 99 employees 1 075................................... 77.6 7.2 15.3 – .7 .4 1.7 19.7 77.639100 employees or more 705............................... 72.4 15.0 12.7 3.9 .6 1.8 .9 20.5 72.440
Women ~owned businesses 5 888 883....................... 66.0 27.7 6.3 6.9 6.2 5.3 4.7 11.0 66.041
With no paid employees 5 071 110................................. 62.6 31.2 6.2 8.3 7.5 5.7 5.0 11.0 62.642With paid employees 817 773.................................... 80.2 13.3 6.6 1.0 .7 3.5 3.5 11.1 80.243
No employees5 127 905....................................... 77.2 17.7 5.1 2.4 .3 10.7 2.0 7.4 77.2441 to 4 employees 435 550..................................... 78.9 15.0 6.2 1.1 1.1 2.3 4.4 12.2 78.9455 to 9 employees 134 476..................................... 83.6 10.0 6.3 .8 .2 2.8 3.2 9.3 83.64610 to 19 employees 67 487................................... 81.3 10.1 8.7 .1 .2 3.2 2.7 12.5 81.34720 to 49 employees 35 515................................... 83.6 8.5 7.9 .3 .2 2.6 2.5 10.8 83.64850 to 99 employees 10 178................................... 85.4 5.4 9.2 – .2 2.1 1.7 10.7 85.449100 employees or more 6 663............................... 78.5 9.3 12.2 – 1.2 1.9 2.2 16.3 78.550
Nonminority male ~owned businesses 10 114 456............. 70.5 24.2 5.3 5.6 4.7 5.5 4.4 9.3 70.551
With no paid employees 8 019 462................................. 66.9 28.0 5.1 7.2 6.0 6.4 4.6 9.0 66.952With paid employees 2 094 993.................................... 81.1 12.8 6.1 1.1 .9 2.9 3.8 10.2 81.153
No employees5 271 380....................................... 78.1 15.4 6.5 2.5 3.9 .9 3.5 11.0 78.1541 to 4 employees 1 155 800..................................... 81.5 13.7 4.8 1.3 .7 3.3 3.8 9.4 81.5555 to 9 employees 334 483..................................... 79.3 12.8 7.9 .8 .5 2.7 4.4 12.2 79.35610 to 19 employees 173 140................................... 84.6 9.0 6.4 .1 .7 3.0 2.3 9.3 84.65720 to 49 employees 101 938................................... 81.6 11.4 7.1 .2 .2 3.7 4.4 9.9 81.65850 to 99 employees 33 406................................... 81.8 10.1 8.2 .4 .7 2.9 3.7 10.5 81.859100 employees or more 24 846............................... 78.3 11.9 9.8 1.5 – 1.5 4.4 14.3 78.360
1Data represent percentage of owners reporting in the designated categories.2Includes respondents who still owned the business in 1992.3For explanation of relative standard errors and standard errors, see Reliability of Estimates in the introductory text.4Relative standard errors are not applicable for lines 1 through 10 since these data are the result of censuses, not surveys.5Firms reported annual payroll, but did not report any employees on their payroll during specified period in 1992.
34 CHARACTERISTICS OF BUSINESS OWNERS 1992 ECONOMIC CENSUS
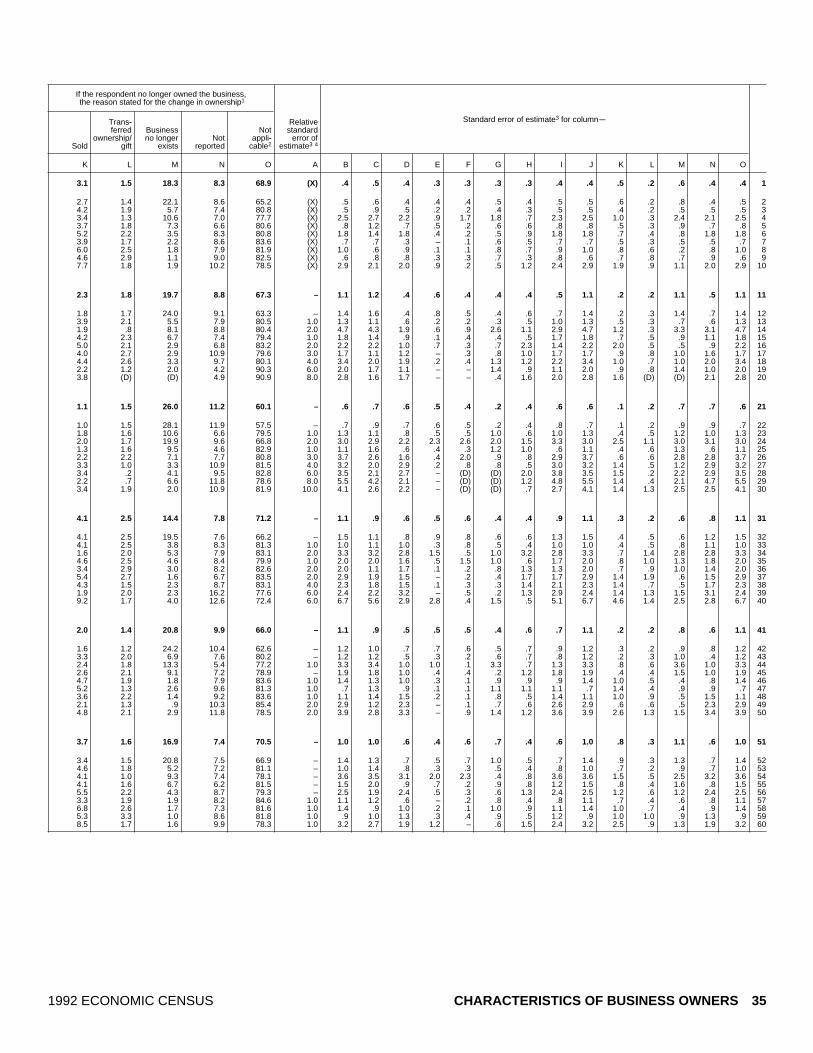
If the respondent no longer owned the business, the reason stated for the change in ownership1
Standard error of estimate3 for columnm
Sold
Trans~ferred
ownership/gift
Businessno longer
existsNot
reported
Notappli~
cable2
Relativestandard
error ofestimate3 4
K L M N O A B C D E F G H I J K L M N O
3.1 1.5 18.3 8.3 68.9 (X) .4 .5 .4 .3 .3 .3 .3 .4 .4 .5 .2 .6 .4 .4 1
2.7 1.4 22.1 8.6 65.2 (X) .5 .6 .4 .4 .4 .5 .4 .5 .5 .6 .2 .8 .4 .5 24.2 1.9 5.7 7.4 80.8 (X) .5 .9 .5 .2 .2 .4 .3 .5 .5 .4 .2 .5 .5 .5 33.4 1.3 10.6 7.0 77.7 (X) 2.5 2.7 2.2 .9 1.7 1.8 .7 2.3 2.5 1.0 .3 2.4 2.1 2.5 43.7 1.8 7.3 6.6 80.6 (X) .8 1.2 .7 .5 .2 .6 .6 .8 .8 .5 .3 .9 .7 .8 55.2 2.2 3.5 8.3 80.8 (X) 1.8 1.4 1.8 .4 .2 .5 .9 1.8 1.8 .7 .4 .8 1.8 1.8 63.9 1.7 2.2 8.6 83.6 (X) .7 .7 .3 – .1 .6 .5 .7 .7 .5 .3 .5 .5 .7 76.0 2.5 1.8 7.9 81.9 (X) 1.0 .6 .9 .1 .1 .8 .7 .9 1.0 .8 .6 .2 .8 1.0 84.6 2.9 1.1 9.0 82.5 (X) .6 .8 .8 .3 .3 .7 .3 .8 .6 .7 .8 .7 .9 .6 97.7 1.8 1.9 10.2 78.5 (X) 2.9 2.1 2.0 .9 .2 .5 1.2 2.4 2.9 1.9 .9 1.1 2.0 2.9 10
2.3 1.8 19.7 8.8 67.3 – 1.1 1.2 .4 .6 .4 .4 .4 .5 1.1 .2 .2 1.1 .5 1.1 11
1.8 1.7 24.0 9.1 63.3 – 1.4 1.6 .4 .8 .5 .4 .6 .7 1.4 .2 .3 1.4 .7 1.4 123.9 2.1 5.5 7.9 80.5 1.0 1.3 1.1 .6 .2 .2 .3 .5 1.0 1.3 .5 .3 .7 .6 1.3 131.9 .8 8.1 8.8 80.4 2.0 4.7 4.3 1.9 .6 .9 2.6 1.1 2.9 4.7 1.2 .3 3.3 3.1 4.7 144.2 2.3 6.7 7.4 79.4 1.0 1.8 1.4 .9 .1 .4 .4 .5 1.7 1.8 .7 .5 .9 1.1 1.8 155.0 2.1 2.9 6.8 83.2 2.0 2.2 2.2 1.0 .7 .3 .7 2.3 1.4 2.2 2.0 .5 .5 .9 2.2 164.0 2.7 2.9 10.9 79.6 3.0 1.7 1.1 1.2 – .3 .8 1.0 1.7 1.7 .9 .8 1.0 1.6 1.7 174.4 2.6 3.3 9.7 80.1 4.0 3.4 2.0 1.9 .2 .4 1.3 1.2 2.2 3.4 1.0 .7 1.0 2.0 3.4 182.2 1.2 2.0 4.2 90.3 6.0 2.0 1.7 1.1 – – 1.4 .9 1.1 2.0 .9 .8 1.4 1.0 2.0 193.8 (D) (D) 4.9 90.9 8.0 2.8 1.6 1.7 – – .4 1.6 2.0 2.8 1.6 (D) (D) 2.1 2.8 20
1.1 1.5 26.0 11.2 60.1 – .6 .7 .6 .5 .4 .2 .4 .6 .6 .1 .2 .7 .7 .6 21
1.0 1.5 28.1 11.9 57.5 – .7 .9 .7 .6 .5 .2 .4 .8 .7 .1 .2 .9 .9 .7 221.8 1.6 10.6 6.6 79.5 1.0 1.3 1.1 .8 .5 .5 1.0 .6 1.0 1.3 .4 .5 1.2 1.0 1.3 232.0 1.7 19.9 9.6 66.8 2.0 3.0 2.9 2.2 2.3 2.6 2.0 1.5 3.3 3.0 2.5 1.1 3.0 3.1 3.0 241.3 1.6 9.5 4.6 82.9 1.0 1.1 1.6 .6 .4 .3 1.2 1.0 .6 1.1 .4 .6 1.3 .6 1.1 252.2 2.2 7.1 7.7 80.8 3.0 3.7 2.6 1.6 .4 2.0 .9 .8 2.9 3.7 .6 .6 2.8 2.8 3.7 263.3 1.0 3.3 10.9 81.5 4.0 3.2 2.0 2.9 .2 .8 .8 .5 3.0 3.2 1.4 .5 1.2 2.9 3.2 273.4 .2 4.1 9.5 82.8 6.0 3.5 2.1 2.7 – (D) (D) 2.0 3.8 3.5 1.5 .2 2.2 2.9 3.5 282.2 .7 6.6 11.8 78.6 8.0 5.5 4.2 2.1 – (D) (D) 1.2 4.8 5.5 1.4 .4 2.1 4.7 5.5 293.4 1.9 2.0 10.9 81.9 10.0 4.1 2.6 2.2 – (D) (D) .7 2.7 4.1 1.4 1.3 2.5 2.5 4.1 30
4.1 2.5 14.4 7.8 71.2 – 1.1 .9 .6 .5 .6 .4 .4 .9 1.1 .3 .2 .6 .8 1.1 31
4.1 2.5 19.5 7.6 66.2 – 1.5 1.1 .8 .9 .8 .6 .6 1.3 1.5 .4 .5 .6 1.2 1.5 324.1 2.5 3.8 8.3 81.3 1.0 1.0 1.1 1.0 .3 .8 .5 .4 1.0 1.0 .4 .5 .8 1.1 1.0 331.6 2.0 5.3 7.9 83.1 2.0 3.3 3.2 2.8 1.5 .5 1.0 3.2 2.8 3.3 .7 1.4 2.8 2.8 3.3 344.6 2.5 4.6 8.4 79.9 1.0 2.0 2.0 1.6 .5 1.5 1.0 .6 1.7 2.0 .8 1.0 1.3 1.8 2.0 353.4 2.9 3.0 8.2 82.6 2.0 2.0 1.1 1.7 .1 .2 .8 1.3 1.3 2.0 .7 .9 1.0 1.4 2.0 365.4 2.7 1.6 6.7 83.5 2.0 2.9 1.9 1.5 – .2 .4 1.7 1.7 2.9 1.4 1.9 .6 1.5 2.9 374.3 1.5 2.3 8.7 83.1 4.0 2.3 1.8 1.5 .1 .3 .3 1.4 2.1 2.3 1.4 .7 .5 1.7 2.3 381.9 2.0 2.3 16.2 77.6 6.0 2.4 2.2 3.2 – .5 .2 1.3 2.9 2.4 1.4 1.3 1.5 3.1 2.4 399.2 1.7 4.0 12.6 72.4 6.0 6.7 5.6 2.9 2.8 .4 1.5 .5 5.1 6.7 4.6 1.4 2.5 2.8 6.7 40
2.0 1.4 20.8 9.9 66.0 – 1.1 .9 .5 .5 .5 .4 .6 .7 1.1 .2 .2 .8 .6 1.1 41
1.6 1.2 24.2 10.4 62.6 – 1.2 1.0 .7 .7 .6 .5 .7 .9 1.2 .3 .2 .9 .8 1.2 423.3 2.0 6.9 7.6 80.2 – 1.2 1.2 .5 .3 .2 .6 .7 .8 1.2 .2 .3 1.0 .4 1.2 432.4 1.8 13.3 5.4 77.2 1.0 3.3 3.4 1.0 1.0 .1 3.3 .7 1.3 3.3 .8 .6 3.6 1.0 3.3 442.6 2.1 9.1 7.2 78.9 – 1.9 1.8 1.0 .4 .4 .2 1.2 1.8 1.9 .4 .4 1.5 1.0 1.9 454.7 1.9 1.8 7.9 83.6 1.0 1.4 1.3 1.0 .3 .1 .9 .9 .9 1.4 1.0 .5 .4 .8 1.4 465.2 1.3 2.6 9.6 81.3 1.0 .7 1.3 .9 .1 .1 1.1 1.1 1.1 .7 1.4 .4 .9 .9 .7 473.6 2.2 1.4 9.2 83.6 1.0 1.1 1.4 1.5 .2 .1 .8 .5 1.4 1.1 1.0 .9 .5 1.5 1.1 482.1 1.3 .9 10.3 85.4 2.0 2.9 1.2 2.3 – .1 .7 .6 2.6 2.9 .6 .6 .5 2.3 2.9 494.8 2.1 2.9 11.8 78.5 2.0 3.9 2.8 3.3 – .9 1.4 1.2 3.6 3.9 2.6 1.3 1.5 3.4 3.9 50
3.7 1.6 16.9 7.4 70.5 – 1.0 1.0 .6 .4 .6 .7 .4 .6 1.0 .8 .3 1.1 .6 1.0 51
3.4 1.5 20.8 7.5 66.9 – 1.4 1.3 .7 .5 .7 1.0 .5 .7 1.4 .9 .3 1.3 .7 1.4 524.6 1.8 5.2 7.2 81.1 – 1.0 1.4 .8 .3 .3 .5 .4 .8 1.0 .7 .2 .9 .7 1.0 534.1 1.0 9.3 7.4 78.1 – 3.6 3.5 3.1 2.0 2.3 .4 .8 3.6 3.6 1.5 .5 2.5 3.2 3.6 544.1 1.6 6.7 6.2 81.5 – 1.5 2.0 .9 .7 .2 .9 .8 1.2 1.5 .8 .4 1.6 .8 1.5 555.5 2.2 4.3 8.7 79.3 – 2.5 1.9 2.4 .5 .3 .6 1.3 2.4 2.5 1.2 .6 1.2 2.4 2.5 563.3 1.9 1.9 8.2 84.6 1.0 1.1 1.2 .6 – .2 .8 .4 .8 1.1 .7 .4 .6 .8 1.1 576.8 2.6 1.7 7.3 81.6 1.0 1.4 .9 1.0 .2 .1 1.0 .9 1.1 1.4 1.0 .7 .4 .9 1.4 585.3 3.3 1.0 8.6 81.8 1.0 .9 1.0 1.3 .3 .4 .9 .5 1.2 .9 1.0 1.0 .9 1.3 .9 598.5 1.7 1.6 9.9 78.3 1.0 3.2 2.7 1.9 1.2 – .6 1.5 2.4 3.2 2.5 .9 1.3 1.9 3.2 60
1992 ECONOMIC CENSUS CHARACTERISTICS OF BUSINESS OWNERS 35
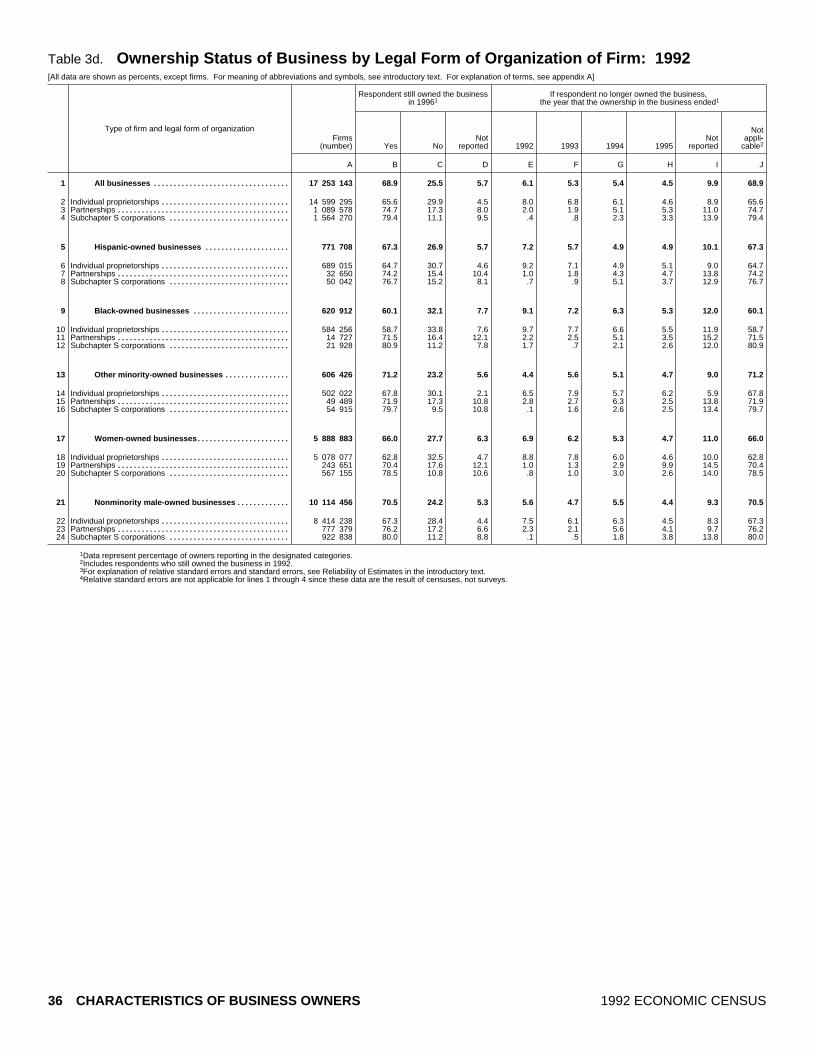
Table 3d. Ownership Status of Business by Legal Form of Organization of Firm: 1992[All data are shown as percents, except firms. For meaning of abbreviations and symbols, see introductory text. For explanation of terms, see appendix A]
Type of firm and legal form of organization
Respondent still owned the businessin 19961
If respondent no longer owned the business, the year that the ownership in the business ended1
Firms(number) Yes No
Notreported 1992 1993 1994 1995
Notreported
Notappli~
cable2
A B C D E F G H I J
All businesses 17 253 143.................................. 68.9 25.5 5.7 6.1 5.3 5.4 4.5 9.9 68.91
Individual proprietorships 14 599 295................................ 65.6 29.9 4.5 8.0 6.8 6.1 4.6 8.9 65.62Partnerships 1 089 578........................................... 74.7 17.3 8.0 2.0 1.9 5.1 5.3 11.0 74.73Subchapter S corporations 1 564 270.............................. 79.4 11.1 9.5 .4 .8 2.3 3.3 13.9 79.44
Hispanic ~owned businesses 771 708..................... 67.3 26.9 5.7 7.2 5.7 4.9 4.9 10.1 67.35
Individual proprietorships 689 015................................ 64.7 30.7 4.6 9.2 7.1 4.9 5.1 9.0 64.76Partnerships 32 650........................................... 74.2 15.4 10.4 1.0 1.8 4.3 4.7 13.8 74.27Subchapter S corporations 50 042.............................. 76.7 15.2 8.1 .7 .9 5.1 3.7 12.9 76.78
Black ~owned businesses 620 912........................ 60.1 32.1 7.7 9.1 7.2 6.3 5.3 12.0 60.19
Individual proprietorships 584 256................................ 58.7 33.8 7.6 9.7 7.7 6.6 5.5 11.9 58.710Partnerships 14 727........................................... 71.5 16.4 12.1 2.2 2.5 5.1 3.5 15.2 71.511Subchapter S corporations 21 928.............................. 80.9 11.2 7.8 1.7 .7 2.1 2.6 12.0 80.912
Other minority ~owned businesses 606 426................ 71.2 23.2 5.6 4.4 5.6 5.1 4.7 9.0 71.213
Individual proprietorships 502 022................................ 67.8 30.1 2.1 6.5 7.9 5.7 6.2 5.9 67.814Partnerships 49 489........................................... 71.9 17.3 10.8 2.8 2.7 6.3 2.5 13.8 71.915Subchapter S corporations 54 915.............................. 79.7 9.5 10.8 .1 1.6 2.6 2.5 13.4 79.716
Women ~owned businesses 5 888 883....................... 66.0 27.7 6.3 6.9 6.2 5.3 4.7 11.0 66.017
Individual proprietorships 5 078 077................................ 62.8 32.5 4.7 8.8 7.8 6.0 4.6 10.0 62.818Partnerships 243 651........................................... 70.4 17.6 12.1 1.0 1.3 2.9 9.9 14.5 70.419Subchapter S corporations 567 155.............................. 78.5 10.8 10.6 .8 1.0 3.0 2.6 14.0 78.520
Nonminority male ~owned businesses 10 114 456............. 70.5 24.2 5.3 5.6 4.7 5.5 4.4 9.3 70.521
Individual proprietorships 8 414 238................................ 67.3 28.4 4.4 7.5 6.1 6.3 4.5 8.3 67.322Partnerships 777 379........................................... 76.2 17.2 6.6 2.3 2.1 5.6 4.1 9.7 76.223Subchapter S corporations 922 838.............................. 80.0 11.2 8.8 .1 .5 1.8 3.8 13.8 80.024
1Data represent percentage of owners reporting in the designated categories.2Includes respondents who still owned the business in 1992.3For explanation of relative standard errors and standard errors, see Reliability of Estimates in the introductory text.4Relative standard errors are not applicable for lines 1 through 4 since these data are the result of censuses, not surveys.
36 CHARACTERISTICS OF BUSINESS OWNERS 1992 ECONOMIC CENSUS

If the respondent no longer owned the business, the reason stated for the change in ownership1
Standard error of estimate3 for columnm
Sold
Trans~ferred
ownership/gift
Businessno longer
existsNot
reported
Notappli~
cable2
Relativestandard
error ofestimate3 4
K L M N O A B C D E F G H I J K L M N O
3.1 1.5 18.3 8.3 68.9 (X) .4 .5 .4 .3 .3 .3 .3 .4 .4 .5 .2 .6 .4 .4 1
2.4 1.4 22.8 7.7 65.6 (X) .9 .9 .2 .4 .5 .4 .5 .5 .9 .3 .2 .9 .5 .9 25.5 2.6 8.4 8.7 74.7 (X) 2.1 1.9 .9 .7 .9 1.4 1.1 1.7 2.1 1.7 .9 1.9 .9 2.1 34.1 1.1 4.7 10.8 79.4 (X) 1.7 1.4 1.5 .3 .4 .3 .5 1.6 1.7 .7 .2 .9 1.4 1.7 4
2.3 1.8 19.7 8.8 67.3 – 1.1 1.2 .4 .6 .4 .4 .4 .5 1.1 .2 .2 1.1 .5 1.1 5
1.7 1.8 23.4 8.4 64.7 – 1.3 1.5 .4 .8 .5 .6 .5 .8 1.3 .2 .3 1.2 .7 1.3 64.2 2.6 7.3 11.6 74.2 2.0 3.1 1.9 1.7 .6 .5 1.0 1.5 2.4 3.1 1.3 .7 1.7 2.0 3.1 74.4 .9 8.7 9.4 76.7 1.0 2.0 1.9 1.0 .2 .3 1.4 .6 1.3 2.0 .6 .2 2.1 1.1 2.0 8
1.1 1.5 26.0 11.2 60.1 – .6 .7 .6 .5 .4 .2 .4 .6 .6 .1 .2 .7 .7 .6 9
1.1 1.5 27.6 11.2 58.7 – .7 .9 .6 .5 .5 .2 .4 .6 .7 .1 .2 .8 .7 .7 101.5 4.0 9.1 14.0 71.5 3.0 5.0 4.2 2.8 1.5 1.4 1.7 1.4 2.8 5.0 .6 1.4 4.3 2.6 5.0 111.5 .9 6.7 9.9 80.9 2.0 1.8 1.6 1.0 1.2 .4 .6 1.0 1.2 1.8 .7 .2 1.6 1.2 1.8 12
4.1 2.5 14.4 7.8 71.2 – 1.1 .9 .6 .5 .6 .4 .4 .9 1.1 .3 .2 .6 .8 1.1 13
4.5 2.6 20.1 4.9 67.8 – 1.7 1.5 .5 .8 .7 .7 .8 1.1 1.7 .5 .5 .9 .9 1.7 144.9 3.5 7.5 12.1 71.9 1.0 3.4 2.3 2.0 1.0 1.3 1.6 .3 2.3 3.4 2.1 1.0 1.6 2.1 3.4 152.4 1.3 4.5 12.0 79.7 1.0 1.6 1.4 1.6 .1 .8 .8 .5 1.7 1.6 .3 .4 1.2 1.7 1.6 16
2.0 1.4 20.8 9.9 66.0 – 1.1 .9 .5 .5 .5 .4 .6 .7 1.1 .2 .2 .8 .6 1.1 17
1.7 1.4 25.1 9.1 62.8 – 1.2 .9 .6 .8 .7 .5 .5 .9 1.2 .3 .2 .8 .7 1.2 183.8 1.4 10.3 14.1 70.4 1.0 3.8 4.0 2.0 .7 .5 .6 3.0 2.1 3.8 2.0 .4 4.0 2.2 3.8 192.4 1.2 6.4 11.4 78.5 – 1.9 1.6 1.6 .6 .7 .7 .4 1.4 1.9 .3 .3 1.6 1.6 1.9 20
3.7 1.6 16.9 7.4 70.5 – 1.0 1.0 .6 .4 .6 .7 .4 .6 1.0 .8 .3 1.1 .6 1.0 21
2.9 1.4 21.5 6.9 67.3 – 1.5 1.3 .6 .5 .8 .8 .7 .7 1.5 .5 .3 1.3 .7 1.5 226.1 2.9 7.9 6.9 76.2 – 3.3 3.2 .9 1.1 1.2 1.8 1.1 2.2 3.3 2.4 1.1 2.6 .9 3.3 235.1 1.0 3.5 10.3 80.0 – 1.9 1.8 1.8 – .3 .3 .9 2.0 1.9 1.1 .2 .9 1.7 1.9 24
1992 ECONOMIC CENSUS CHARACTERISTICS OF BUSINESS OWNERS 37

Table 4a. Operating Status of Business by Industry Division: 1992[All data are shown as percents, except firms. For meaning of abbreviations and symbols, see introductory text. For explanation of terms, see appendix A]
Type of firm and industry division
Business the respondent owned in 1992 wasstill in operation in 19961
If the business was no longer operating,the year that the businessoperations discontinued1
Firms(number) Yes No
Don’tknow
Notreported 1992 1993 1994 1995
Notreported
Notappli~
cable2
A B C D E F G H I J K
All businesses 17 253 143.............................. 69.0 24.3 1.5 5.3 6.7 6.1 5.3 4.3 7.2 70.41
Agricultural services, forestry, fishing, and mining 583 253...... 68.5 21.3 3.6 6.6 7.4 3.5 3.6 6.2 7.1 72.12Construction 1 829 620...................................... 67.1 28.5 1.2 3.2 7.4 8.6 4.0 6.4 5.4 68.33Manufacturing 517 714..................................... 76.7 18.7 1.1 3.5 4.8 4.3 5.0 3.2 5.0 77.84Transportation, communications, and utilities 698 903.......... 63.1 27.6 1.4 7.9 7.6 6.4 5.1 6.8 9.6 64.55Wholesale trade 538 339................................... 71.7 22.7 2.2 3.4 6.4 6.2 5.2 2.8 5.4 73.96
Retail trade 2 478 045....................................... 71.2 22.7 .9 5.2 6.3 4.4 5.0 4.6 7.5 72.17Finance, insurance, and real estate 1 941 029.................. 76.3 18.5 .9 4.4 3.3 3.6 5.8 3.4 6.7 77.18Services 7 784 016.......................................... 67.9 25.1 1.7 5.3 7.3 6.7 5.7 3.8 6.9 69.69Industries not classified 882 224............................. 57.5 29.1 2.0 11.4 9.7 8.1 5.6 4.1 12.9 59.510
Hispanic ~owned businesses 771 708................. 66.5 25.1 1.4 7.0 7.3 6.4 4.4 4.9 9.1 67.911
Agricultural services, forestry, fishing, and mining 32 927...... 72.2 18.3 1.3 8.2 7.1 2.0 6.5 2.2 8.8 73.512Construction 97 476...................................... 66.4 26.1 .9 6.6 6.8 7.6 3.5 4.4 10.4 67.313Manufacturing 18 461..................................... 70.2 25.2 .4 4.2 7.7 4.7 5.1 4.5 7.5 70.614Transportation, communications, and utilities 47 797.......... 67.0 21.3 3.0 8.6 7.6 4.3 3.9 3.7 10.5 70.015Wholesale trade 17 727................................... 75.4 20.1 .3 4.2 4.3 5.2 5.0 4.7 5.1 75.716
Retail trade 107 846....................................... 66.4 26.8 2.0 4.8 6.1 8.3 4.9 5.8 6.5 68.417Finance, insurance, and real estate 49 231.................. 76.4 17.3 .3 5.9 3.8 5.1 4.7 2.3 7.2 76.818Services 347 297.......................................... 65.5 26.2 1.1 7.2 7.9 6.5 4.0 5.8 9.2 66.619Industries not classified 52 945............................. 55.3 29.3 3.3 12.0 10.2 7.0 6.1 3.4 14.7 58.720
Black ~owned businesses 620 912.................... 59.5 28.7 1.4 10.4 8.9 6.9 5.9 5.2 12.2 60.921
Agricultural services, forestry, fishing, and mining 10 309...... 61.1 28.7 1.0 9.2 11.3 6.5 4.8 4.5 10.7 62.122Construction 43 381...................................... 63.9 26.8 1.4 7.9 8.9 5.5 5.4 5.7 9.2 65.323Manufacturing 10 469..................................... 57.6 31.7 1.9 8.8 8.7 9.1 4.8 6.1 11.7 59.624Transportation, communications, and utilities 49 095......... 58.7 26.6 2.2 12.4 7.2 6.0 6.6 4.5 14.8 60.925Wholesale trade 7 550................................... 63.2 29.4 1.4 6.1 7.2 7.9 8.0 4.7 7.6 64.526
Retail trade 86 840....................................... 58.9 31.9 1.8 7.4 7.9 8.6 7.1 6.9 8.8 60.627Finance, insurance, and real estate 40 924.................. 70.0 22.4 1.1 6.4 5.4 6.2 5.8 4.2 7.3 71.228Services 332 981.......................................... 59.1 28.7 1.1 11.1 9.2 6.9 5.7 5.0 13.0 60.229Industries not classified 39 363............................. 51.2 31.3 2.4 15.2 12.6 6.8 5.7 3.5 17.8 53.630
Other minority ~owned businesses 606 426........... 72.1 20.1 2.6 5.3 4.6 5.8 4.3 4.2 6.4 74.631
Agricultural services, forestry, fishing, and mining 15 218...... 74.9 18.2 1.9 4.9 3.7 2.0 3.6 5.2 8.8 76.932Construction 28 295...................................... 70.7 23.3 .9 5.2 5.7 7.4 5.3 4.1 6.0 71.533Manufacturing 18 976..................................... 65.1 28.5 1.9 4.5 10.1 7.6 5.2 4.6 5.5 67.034Transportation, communications, and utilities 24 362.......... 65.5 24.7 2.2 7.6 5.6 9.5 1.0 4.6 11.6 67.735Wholesale trade 20 043................................... 74.9 19.8 .9 4.4 3.9 6.1 3.7 4.7 5.7 75.836
Retail trade 132 483....................................... 75.7 17.5 2.1 4.6 3.1 5.7 3.9 4.2 5.3 77.937Finance, insurance, and real estate 64 762.................. 81.6 9.8 2.9 5.8 1.6 1.0 3.5 3.6 5.8 84.538Services 273 774.......................................... 70.4 21.9 2.9 4.8 5.0 6.6 4.8 4.2 6.1 73.339Industries not classified 28 512............................. 55.3 29.2 4.7 10.8 11.8 6.4 5.4 5.3 11.0 60.040
Women ~owned businesses 5 888 883.................. 66.4 25.4 1.7 6.5 7.7 6.3 5.3 4.6 8.0 68.141
Agricultural services, forestry, fishing, and mining 119 731...... 65.1 23.1 1.9 9.8 8.3 3.6 4.1 5.0 11.9 67.042Construction 183 695...................................... 69.5 23.1 .1 7.3 9.5 5.2 3.4 4.3 8.0 69.643Manufacturing 152 346..................................... 73.3 21.7 .6 4.4 4.5 5.7 4.9 5.1 5.9 73.944Transportation, communications, and utilities 141 623.......... 64.6 29.5 .5 5.3 10.3 6.6 5.1 5.8 6.9 65.245Wholesale trade 154 542................................... 67.6 26.7 2.0 3.7 8.2 5.9 5.6 5.1 5.5 69.646
Retail trade 1 093 342....................................... 66.7 26.3 .9 6.1 7.6 4.1 6.6 5.8 8.4 67.647Finance, insurance, and real estate 602 802.................. 75.4 16.1 1.9 6.7 4.3 4.8 3.9 2.5 7.2 77.248Services 3 158 444.......................................... 65.3 26.3 2.1 6.3 7.8 7.4 5.3 4.2 7.8 67.449Industries not classified 282 358............................. 54.5 34.5 1.1 9.9 13.3 8.0 4.8 6.4 11.9 55.650
Nonminority male ~owned businesses 10 114 456........ 70.4 23.7 1.3 4.5 6.1 6.0 5.4 4.2 6.5 71.851
Agricultural services, forestry, fishing, and mining 412 917...... 69.1 21.0 4.4 5.5 7.2 3.6 3.3 6.9 5.5 73.552Construction 1 496 056...................................... 66.8 29.4 1.4 2.4 7.2 9.1 4.0 6.8 4.7 68.153Manufacturing 333 485..................................... 79.3 16.5 1.2 3.0 4.5 3.5 4.9 2.2 4.4 80.554Transportation, communications, and utilities 458 400.......... 62.5 27.9 1.3 8.2 7.0 6.3 5.3 7.7 9.8 63.855Wholesale trade 352 721................................... 73.2 21.2 2.4 3.2 5.8 6.4 5.1 1.7 5.4 75.656
Retail trade 1 197 943....................................... 75.2 19.9 .7 4.3 5.6 4.5 3.8 3.4 6.9 75.857Finance, insurance, and real estate 1 240 594.................. 76.4 19.9 .4 3.3 2.9 3.1 6.7 3.8 6.6 76.858Services 4 102 294.......................................... 69.9 24.3 1.4 4.4 6.7 6.2 6.2 3.5 6.1 71.359Industries not classified 520 046............................. 59.4 26.1 2.2 12.2 7.6 8.5 6.1 2.8 13.3 61.660
1Data represent percentage of firms reporting in the designated categories.2Includes businesses still in operation as of the date the respondents completed the report forms.3For explanation of relative standard errors and standard errors, see Reliability of Estimates in the introductory text.4Relative standard errors are not applicable for lines 1 through 10 since these data are the result of censuses, not surveys.
38 CHARACTERISTICS OF BUSINESS OWNERS 1992 ECONOMIC CENSUS
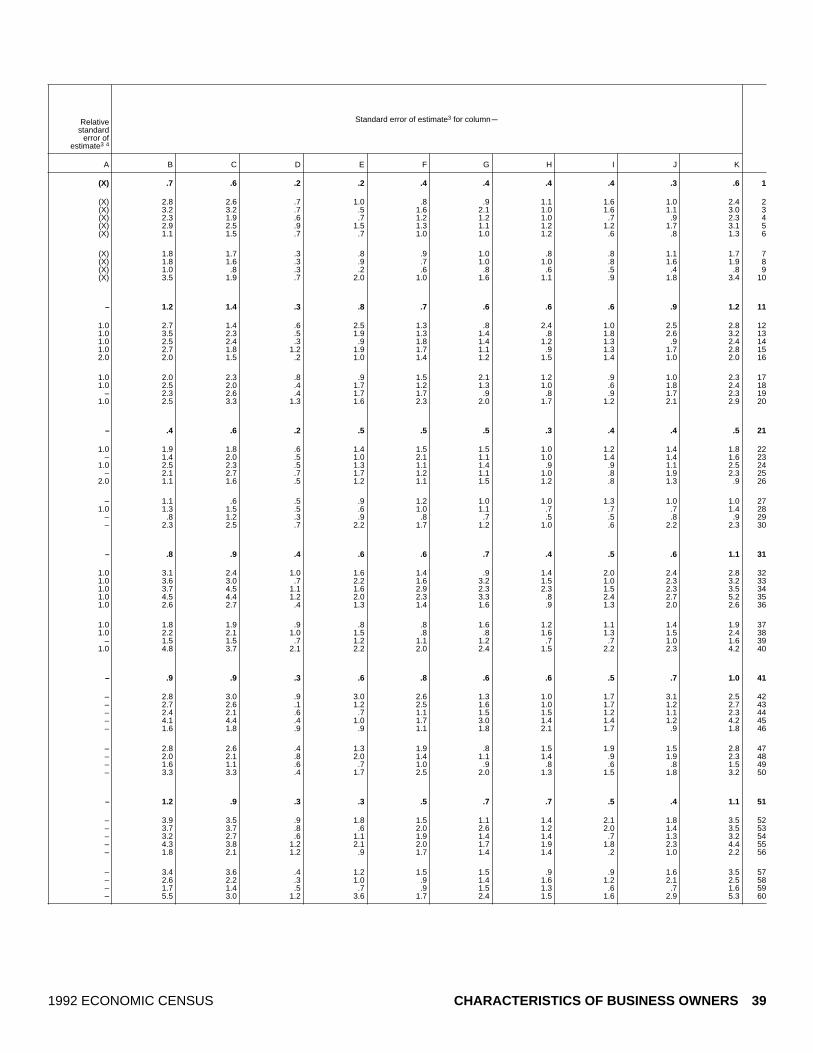
Standard error of estimate3 for columnmRelativestandard
error ofestimate3 4
A B C D E F G H I J K
(X) .7 .6 .2 .2 .4 .4 .4 .4 .3 .6 1
(X) 2.8 2.6 .7 1.0 .8 .9 1.1 1.6 1.0 2.4 2(X) 3.2 3.2 .7 .5 1.6 2.1 1.0 1.6 1.1 3.0 3(X) 2.3 1.9 .6 .7 1.2 1.2 1.0 .7 .9 2.3 4(X) 2.9 2.5 .9 1.5 1.3 1.1 1.2 1.2 1.7 3.1 5(X) 1.1 1.5 .7 .7 1.0 1.0 1.2 .6 .8 1.3 6
(X) 1.8 1.7 .3 .8 .9 1.0 .8 .8 1.1 1.7 7(X) 1.8 1.6 .3 .9 .7 1.0 1.0 .8 1.6 1.9 8(X) 1.0 .8 .3 .2 .6 .8 .6 .5 .4 .8 9(X) 3.5 1.9 .7 2.0 1.0 1.6 1.1 .9 1.8 3.4 10
– 1.2 1.4 .3 .8 .7 .6 .6 .6 .9 1.2 11
1.0 2.7 1.4 .6 2.5 1.3 .8 2.4 1.0 2.5 2.8 121.0 3.5 2.3 .5 1.9 1.3 1.4 .8 1.8 2.6 3.2 131.0 2.5 2.4 .3 .9 1.8 1.4 1.2 1.3 .9 2.4 141.0 2.7 1.8 1.2 1.9 1.7 1.1 .9 1.3 1.7 2.8 152.0 2.0 1.5 .2 1.0 1.4 1.2 1.5 1.4 1.0 2.0 16
1.0 2.0 2.3 .8 .9 1.5 2.1 1.2 .9 1.0 2.3 171.0 2.5 2.0 .4 1.7 1.2 1.3 1.0 .6 1.8 2.4 18
– 2.3 2.6 .4 1.7 1.7 .9 .8 .9 1.7 2.3 191.0 2.5 3.3 1.3 1.6 2.3 2.0 1.7 1.2 2.1 2.9 20
– .4 .6 .2 .5 .5 .5 .3 .4 .4 .5 21
1.0 1.9 1.8 .6 1.4 1.5 1.5 1.0 1.2 1.4 1.8 22– 1.4 2.0 .5 1.0 2.1 1.1 1.0 1.4 1.4 1.6 23
1.0 2.5 2.3 .5 1.3 1.1 1.4 .9 .9 1.1 2.5 24– 2.1 2.7 .7 1.7 1.2 1.1 1.0 .8 1.9 2.3 25
2.0 1.1 1.6 .5 1.2 1.1 1.5 1.2 .8 1.3 .9 26
– 1.1 .6 .5 .9 1.2 1.0 1.0 1.3 1.0 1.0 271.0 1.3 1.5 .5 .6 1.0 1.1 .7 .7 .7 1.4 28
– .8 1.2 .3 .9 .8 .7 .5 .5 .8 .9 29– 2.3 2.5 .7 2.2 1.7 1.2 1.0 .6 2.2 2.3 30
– .8 .9 .4 .6 .6 .7 .4 .5 .6 1.1 31
1.0 3.1 2.4 1.0 1.6 1.4 .9 1.4 2.0 2.4 2.8 321.0 3.6 3.0 .7 2.2 1.6 3.2 1.5 1.0 2.3 3.2 331.0 3.7 4.5 1.1 1.6 2.9 2.3 2.3 1.5 2.3 3.5 341.0 4.5 4.4 1.2 2.0 2.3 3.3 .8 2.4 2.7 5.2 351.0 2.6 2.7 .4 1.3 1.4 1.6 .9 1.3 2.0 2.6 36
1.0 1.8 1.9 .9 .8 .8 1.6 1.2 1.1 1.4 1.9 371.0 2.2 2.1 1.0 1.5 .8 .8 1.6 1.3 1.5 2.4 38
– 1.5 1.5 .7 1.2 1.1 1.2 .7 .7 1.0 1.6 391.0 4.8 3.7 2.1 2.2 2.0 2.4 1.5 2.2 2.3 4.2 40
– .9 .9 .3 .6 .8 .6 .6 .5 .7 1.0 41
– 2.8 3.0 .9 3.0 2.6 1.3 1.0 1.7 3.1 2.5 42– 2.7 2.6 .1 1.2 2.5 1.6 1.0 1.7 1.2 2.7 43– 2.4 2.1 .6 .7 1.1 1.5 1.5 1.2 1.1 2.3 44– 4.1 4.4 .4 1.0 1.7 3.0 1.4 1.4 1.2 4.2 45– 1.6 1.8 .9 .9 1.1 1.8 2.1 1.7 .9 1.8 46
– 2.8 2.6 .4 1.3 1.9 .8 1.5 1.9 1.5 2.8 47– 2.0 2.1 .8 2.0 1.4 1.1 1.4 .9 1.9 2.3 48– 1.6 1.1 .6 .7 1.0 .9 .8 .6 .8 1.5 49– 3.3 3.3 .4 1.7 2.5 2.0 1.3 1.5 1.8 3.2 50
– 1.2 .9 .3 .3 .5 .7 .7 .5 .4 1.1 51
– 3.9 3.5 .9 1.8 1.5 1.1 1.4 2.1 1.8 3.5 52– 3.7 3.7 .8 .6 2.0 2.6 1.2 2.0 1.4 3.5 53– 3.2 2.7 .6 1.1 1.9 1.4 1.4 .7 1.3 3.2 54– 4.3 3.8 1.2 2.1 2.0 1.7 1.9 1.8 2.3 4.4 55– 1.8 2.1 1.2 .9 1.7 1.4 1.4 .2 1.0 2.2 56
– 3.4 3.6 .4 1.2 1.5 1.5 .9 .9 1.6 3.5 57– 2.6 2.2 .3 1.0 .9 1.4 1.6 1.2 2.1 2.5 58– 1.7 1.4 .5 .7 .9 1.5 1.3 .6 .7 1.6 59– 5.5 3.0 1.2 3.6 1.7 2.4 1.5 1.6 2.9 5.3 60
1992 ECONOMIC CENSUS CHARACTERISTICS OF BUSINESS OWNERS 39
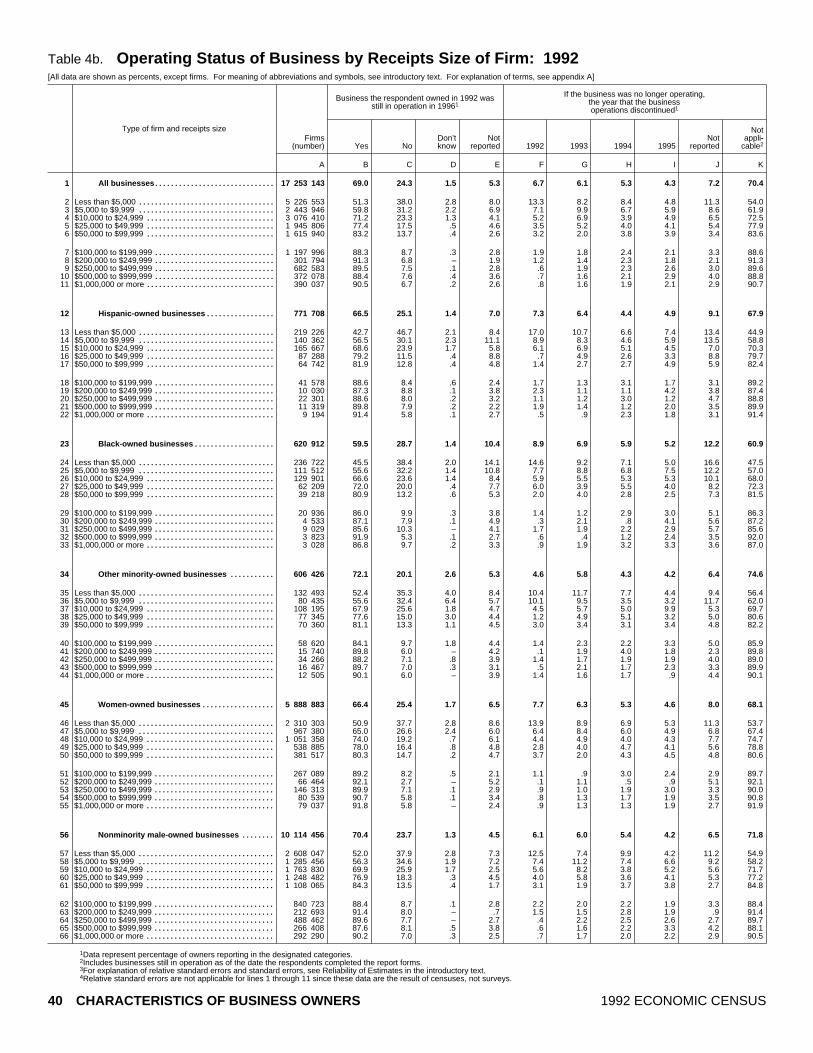
Table 4b. Operating Status of Business by Receipts Size of Firm: 1992[All data are shown as percents, except firms. For meaning of abbreviations and symbols, see introductory text. For explanation of terms, see appendix A]
Type of firm and receipts size
Business the respondent owned in 1992 wasstill in operation in 19961
If the business was no longer operating,the year that the businessoperations discontinued1
Firms(number) Yes No
Don’tknow
Notreported 1992 1993 1994 1995
Notreported
Notappli~
cable2
A B C D E F G H I J K
All businesses 17 253 143.............................. 69.0 24.3 1.5 5.3 6.7 6.1 5.3 4.3 7.2 70.41
Less than $5,000 5 226 553.................................. 51.3 38.0 2.8 8.0 13.3 8.2 8.4 4.8 11.3 54.02$5,000 to $9,999 2 443 946.................................. 59.8 31.2 2.2 6.9 7.1 9.9 6.7 5.9 8.6 61.93$10,000 to $24,999 3 076 410................................ 71.2 23.3 1.3 4.1 5.2 6.9 3.9 4.9 6.5 72.54$25,000 to $49,999 1 945 806................................ 77.4 17.5 .5 4.6 3.5 5.2 4.0 4.1 5.4 77.95$50,000 to $99,999 1 615 940................................ 83.2 13.7 .4 2.6 3.2 2.0 3.8 3.9 3.4 83.66
$100,000 to $199,999 1 197 996.............................. 88.3 8.7 .3 2.8 1.9 1.8 2.4 2.1 3.3 88.67$200,000 to $249,999 301 794.............................. 91.3 6.8 – 1.9 1.2 1.4 2.3 1.8 2.1 91.38$250,000 to $499,999 682 583.............................. 89.5 7.5 .1 2.8 .6 1.9 2.3 2.6 3.0 89.69$500,000 to $999,999 372 078.............................. 88.4 7.6 .4 3.6 .7 1.6 2.1 2.9 4.0 88.810$1,000,000 or more 390 037................................ 90.5 6.7 .2 2.6 .8 1.6 1.9 2.1 2.9 90.711
Hispanic ~owned businesses 771 708................. 66.5 25.1 1.4 7.0 7.3 6.4 4.4 4.9 9.1 67.912
Less than $5,000 219 226.................................. 42.7 46.7 2.1 8.4 17.0 10.7 6.6 7.4 13.4 44.913$5,000 to $9,999 140 362.................................. 56.5 30.1 2.3 11.1 8.9 8.3 4.6 5.9 13.5 58.814$10,000 to $24,999 165 667................................ 68.6 23.9 1.7 5.8 6.1 6.9 5.1 4.5 7.0 70.315$25,000 to $49,999 87 288................................ 79.2 11.5 .4 8.8 .7 4.9 2.6 3.3 8.8 79.716$50,000 to $99,999 64 742................................ 81.9 12.8 .4 4.8 1.4 2.7 2.7 4.9 5.9 82.417
$100,000 to $199,999 41 578.............................. 88.6 8.4 .6 2.4 1.7 1.3 3.1 1.7 3.1 89.218$200,000 to $249,999 10 030.............................. 87.3 8.8 .1 3.8 2.3 1.1 1.1 4.2 3.8 87.419$250,000 to $499,999 22 301.............................. 88.6 8.0 .2 3.2 1.1 1.2 3.0 1.2 4.7 88.820$500,000 to $999,999 11 319.............................. 89.8 7.9 .2 2.2 1.9 1.4 1.2 2.0 3.5 89.921$1,000,000 or more 9 194................................ 91.4 5.8 .1 2.7 .5 .9 2.3 1.8 3.1 91.422
Black ~owned businesses 620 912.................... 59.5 28.7 1.4 10.4 8.9 6.9 5.9 5.2 12.2 60.923
Less than $5,000 236 722.................................. 45.5 38.4 2.0 14.1 14.6 9.2 7.1 5.0 16.6 47.524$5,000 to $9,999 111 512.................................. 55.6 32.2 1.4 10.8 7.7 8.8 6.8 7.5 12.2 57.025$10,000 to $24,999 129 901................................ 66.6 23.6 1.4 8.4 5.9 5.5 5.3 5.3 10.1 68.026$25,000 to $49,999 62 209................................ 72.0 20.0 .4 7.7 6.0 3.9 5.5 4.0 8.2 72.327$50,000 to $99,999 39 218................................ 80.9 13.2 .6 5.3 2.0 4.0 2.8 2.5 7.3 81.528
$100,000 to $199,999 20 936.............................. 86.0 9.9 .3 3.8 1.4 1.2 2.9 3.0 5.1 86.329$200,000 to $249,999 4 533.............................. 87.1 7.9 .1 4.9 .3 2.1 .8 4.1 5.6 87.230$250,000 to $499,999 9 029.............................. 85.6 10.3 – 4.1 1.7 1.9 2.2 2.9 5.7 85.631$500,000 to $999,999 3 823.............................. 91.9 5.3 .1 2.7 .6 .4 1.2 2.4 3.5 92.032$1,000,000 or more 3 028................................ 86.8 9.7 .2 3.3 .9 1.9 3.2 3.3 3.6 87.033
Other minority ~owned businesses 606 426........... 72.1 20.1 2.6 5.3 4.6 5.8 4.3 4.2 6.4 74.634
Less than $5,000 132 493.................................. 52.4 35.3 4.0 8.4 10.4 11.7 7.7 4.4 9.4 56.435$5,000 to $9,999 80 435.................................. 55.6 32.4 6.4 5.7 10.1 9.5 3.5 3.2 11.7 62.036$10,000 to $24,999 108 195................................ 67.9 25.6 1.8 4.7 4.5 5.7 5.0 9.9 5.3 69.737$25,000 to $49,999 77 345................................ 77.6 15.0 3.0 4.4 1.2 4.9 5.1 3.2 5.0 80.638$50,000 to $99,999 70 360................................ 81.1 13.3 1.1 4.5 3.0 3.4 3.1 3.4 4.8 82.239
$100,000 to $199,999 58 620.............................. 84.1 9.7 1.8 4.4 1.4 2.3 2.2 3.3 5.0 85.940$200,000 to $249,999 15 740.............................. 89.8 6.0 – 4.2 .1 1.9 4.0 1.8 2.3 89.841$250,000 to $499,999 34 266.............................. 88.2 7.1 .8 3.9 1.4 1.7 1.9 1.9 4.0 89.042$500,000 to $999,999 16 467.............................. 89.7 7.0 .3 3.1 .5 2.1 1.7 2.3 3.3 89.943$1,000,000 or more 12 505................................ 90.1 6.0 – 3.9 1.4 1.6 1.7 .9 4.4 90.144
Women ~owned businesses 5 888 883.................. 66.4 25.4 1.7 6.5 7.7 6.3 5.3 4.6 8.0 68.145
Less than $5,000 2 310 303.................................. 50.9 37.7 2.8 8.6 13.9 8.9 6.9 5.3 11.3 53.746$5,000 to $9,999 967 380.................................. 65.0 26.6 2.4 6.0 6.4 8.4 6.0 4.9 6.8 67.447$10,000 to $24,999 1 051 358................................ 74.0 19.2 .7 6.1 4.4 4.9 4.0 4.3 7.7 74.748$25,000 to $49,999 538 885................................ 78.0 16.4 .8 4.8 2.8 4.0 4.7 4.1 5.6 78.849$50,000 to $99,999 381 517................................ 80.3 14.7 .2 4.7 3.7 2.0 4.3 4.5 4.8 80.650
$100,000 to $199,999 267 089.............................. 89.2 8.2 .5 2.1 1.1 .9 3.0 2.4 2.9 89.751$200,000 to $249,999 66 464.............................. 92.1 2.7 – 5.2 .1 1.1 .5 .9 5.1 92.152$250,000 to $499,999 146 313.............................. 89.9 7.1 .1 2.9 .9 1.0 1.9 3.0 3.3 90.053$500,000 to $999,999 80 539.............................. 90.7 5.8 .1 3.4 .8 1.3 1.7 1.9 3.5 90.854$1,000,000 or more 79 037................................ 91.8 5.8 – 2.4 .9 1.3 1.3 1.9 2.7 91.955
Nonminority male ~owned businesses 10 114 456........ 70.4 23.7 1.3 4.5 6.1 6.0 5.4 4.2 6.5 71.856
Less than $5,000 2 608 047.................................. 52.0 37.9 2.8 7.3 12.5 7.4 9.9 4.2 11.2 54.957$5,000 to $9,999 1 285 456.................................. 56.3 34.6 1.9 7.2 7.4 11.2 7.4 6.6 9.2 58.258$10,000 to $24,999 1 763 830................................ 69.9 25.9 1.7 2.5 5.6 8.2 3.8 5.2 5.6 71.759$25,000 to $49,999 1 248 482................................ 76.9 18.3 .3 4.5 4.0 5.8 3.6 4.1 5.3 77.260$50,000 to $99,999 1 108 065................................ 84.3 13.5 .4 1.7 3.1 1.9 3.7 3.8 2.7 84.861
$100,000 to $199,999 840 723.............................. 88.4 8.7 .1 2.8 2.2 2.0 2.2 1.9 3.3 88.462$200,000 to $249,999 212 693.............................. 91.4 8.0 – .7 1.5 1.5 2.8 1.9 .9 91.463$250,000 to $499,999 488 462.............................. 89.6 7.7 – 2.7 .4 2.2 2.5 2.6 2.7 89.764$500,000 to $999,999 266 408.............................. 87.6 8.1 .5 3.8 .6 1.6 2.2 3.3 4.2 88.165$1,000,000 or more 292 290................................ 90.2 7.0 .3 2.5 .7 1.7 2.0 2.2 2.9 90.566
1Data represent percentage of owners reporting in the designated categories.2Includes businesses still in operation as of the date the respondents completed the report forms.3For explanation of relative standard errors and standard errors, see Reliability of Estimates in the introductory text.4Relative standard errors are not applicable for lines 1 through 11 since these data are the result of censuses, not surveys.
40 CHARACTERISTICS OF BUSINESS OWNERS 1992 ECONOMIC CENSUS

Standard error of estimate3 for columnmRelativestandard
error ofestimate3 4
A B C D E F G H I J K
(X) .7 .6 .2 .2 .4 .4 .4 .4 .3 .6 1
(X) 1.3 .8 .4 .4 .8 .9 .8 .7 .8 1.1 2(X) 2.1 1.6 .6 .7 .9 1.0 1.4 1.1 .9 2.1 3(X) 1.5 1.8 .4 .5 .9 .7 .9 .9 .7 1.6 4(X) 2.1 2.1 .2 1.2 .8 1.6 .8 1.3 1.1 1.9 5(X) 1.4 1.4 .2 .5 .9 .3 .6 .7 .4 1.4 6
(X) .9 .6 .1 .7 .5 .3 .5 .5 .7 1.0 7(X) 1.0 1.1 – .5 .8 .8 1.1 .4 .5 1.0 8(X) .9 .6 – .5 .1 .3 .4 .5 .5 .9 9(X) .5 .7 .2 .4 .1 .3 .3 .6 .3 .6 10(X) .4 .3 .1 .3 .1 .1 .2 .3 .2 .4 11
– 1.2 1.4 .3 .8 .7 .6 .6 .6 .9 1.2 12
1.0 2.6 2.6 .8 1.1 1.3 .8 1.7 1.3 1.8 2.5 131.0 2.9 3.8 .9 1.4 2.6 1.6 1.0 1.3 1.4 3.2 141.0 1.5 1.7 .6 1.3 1.3 1.7 .9 .7 .9 1.3 151.0 2.2 1.3 .5 2.6 .2 1.3 .9 .9 2.5 2.3 161.0 2.0 1.9 .2 1.2 .5 .3 .7 1.1 1.1 1.8 17
1.0 .8 1.0 .2 .6 .5 .4 .9 .5 .7 .8 183.0 2.0 1.6 .1 1.2 1.3 .5 .6 1.4 1.2 2.1 192.0 1.3 .9 .2 .6 .3 .5 .6 .3 .9 1.3 203.0 1.4 1.6 .1 .7 .5 .6 .4 .7 1.1 1.4 212.0 .7 .7 – .7 .3 .3 .5 .3 .7 .7 22
– .4 .6 .2 .5 .5 .5 .3 .4 .4 .5 23
– 1.3 1.3 .4 1.0 1.1 .9 .6 .6 .8 1.4 24– 1.9 1.4 .4 .8 1.0 1.2 1.0 1.1 1.1 1.9 25– 1.9 1.9 .3 1.1 1.3 .9 .7 .7 1.0 1.9 26– 2.2 2.2 .2 1.4 1.2 .8 1.0 1.1 1.5 2.2 27
1.0 1.7 1.6 .3 1.0 .6 1.0 .5 .7 1.1 1.6 28
1.0 1.4 1.5 .2 .7 .6 .3 1.0 .5 .5 1.3 293.0 5.2 3.0 .1 4.0 .4 2.5 .4 1.8 3.9 5.2 303.0 1.4 1.6 – .8 .6 .5 1.0 .8 1.0 1.4 314.0 1.4 1.3 .1 .8 .2 .3 .4 1.5 .9 1.5 324.0 1.5 1.7 .2 .5 .3 .4 1.0 1.0 .6 1.5 33
– .8 .9 .4 .6 .6 .7 .4 .5 .6 1.1 34
1.0 2.4 2.2 1.5 1.4 1.6 2.2 1.4 1.0 1.6 3.0 351.0 4.5 4.4 2.2 1.3 3.4 2.9 1.3 1.0 3.4 4.8 361.0 2.9 2.8 .7 1.4 1.2 1.3 2.5 1.7 1.4 3.0 371.0 2.3 2.4 1.4 1.7 .4 1.4 1.4 1.2 1.9 1.9 381.0 2.3 1.9 .5 1.1 .8 1.2 .9 .9 1.0 2.4 39
1.0 1.2 1.2 .6 .5 .4 .5 .7 .8 .6 1.3 402.0 3.0 2.2 – 1.2 .1 .9 2.5 .9 .8 3.0 411.0 1.6 1.2 .2 .6 .5 .5 .6 .3 .7 1.5 422.0 1.2 .9 .2 .8 .2 .7 .5 .7 .6 1.1 432.0 .5 .5 – .7 .3 .4 .5 .2 .7 .5 44
– .9 .9 .3 .6 .8 .6 .6 .5 .7 1.0 45
– 2.4 2.0 .7 .9 1.3 .7 .7 .6 1.3 2.4 46– 2.0 1.7 1.0 1.8 1.6 1.9 1.6 1.0 1.8 2.0 47– 1.7 1.9 .2 1.3 1.7 1.8 .8 1.6 1.7 1.7 48– 3.2 3.0 .4 1.3 .7 1.7 1.7 1.6 1.4 3.1 49– 1.8 1.7 .1 1.4 1.6 .6 .7 1.1 .9 1.8 50
– 1.7 1.4 .2 .4 .4 .4 .7 .6 .9 1.6 511.0 2.1 .6 – 1.9 .1 .4 .3 .5 1.9 2.1 521.0 1.1 1.0 .1 .8 .2 .5 .5 .6 .7 1.1 531.0 .8 .8 .1 .8 .4 .3 .6 .5 .8 .8 541.0 .6 .4 – .6 .2 .3 .2 .2 .5 .6 55
– 1.2 .9 .3 .3 .5 .7 .7 .5 .4 1.1 56
– 2.2 1.8 .7 .8 1.7 1.9 1.8 1.1 1.1 2.1 57– 3.5 2.7 1.1 1.7 1.6 1.6 2.1 2.1 1.7 3.9 58– 2.4 2.7 .7 .9 1.2 1.1 1.8 1.6 1.8 2.5 59– 2.2 2.7 .2 1.6 1.2 2.2 1.5 1.8 1.5 2.1 60– 1.9 1.8 .3 .5 1.3 .4 1.0 1.2 .7 1.9 61
– 1.2 1.0 .1 .8 .7 .5 .6 .8 .8 1.2 62– 1.8 1.7 – .4 1.1 1.2 1.6 .7 .4 1.8 63– 1.4 .9 – .7 .1 .5 .6 .7 .7 1.4 64– .7 .9 .3 .5 .2 .4 .4 .8 .4 .7 65– .4 .4 .1 .3 .2 .2 .2 .3 .3 .5 66
1992 ECONOMIC CENSUS CHARACTERISTICS OF BUSINESS OWNERS 41
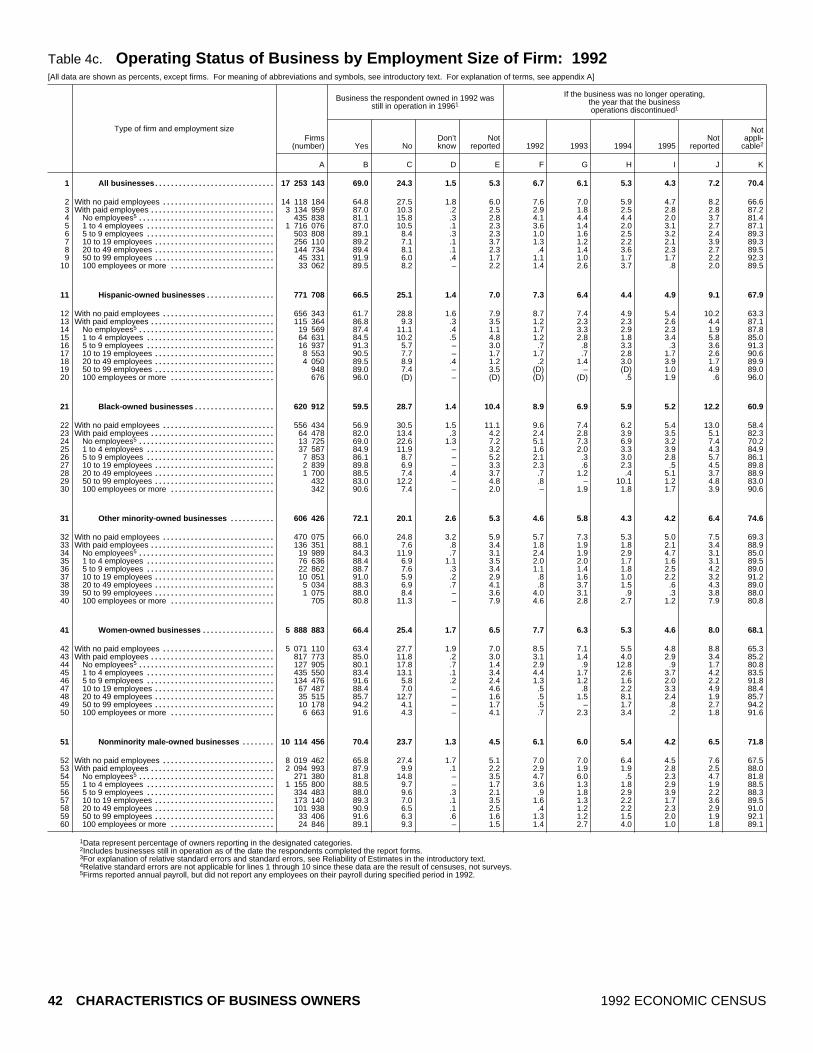
Table 4c. Operating Status of Business by Employment Size of Firm: 1992[All data are shown as percents, except firms. For meaning of abbreviations and symbols, see introductory text. For explanation of terms, see appendix A]
Type of firm and employment size
Business the respondent owned in 1992 wasstill in operation in 19961
If the business was no longer operating,the year that the businessoperations discontinued1
Firms(number) Yes No
Don’tknow
Notreported 1992 1993 1994 1995
Notreported
Notappli~
cable2
A B C D E F G H I J K
All businesses 17 253 143.............................. 69.0 24.3 1.5 5.3 6.7 6.1 5.3 4.3 7.2 70.41
With no paid employees 14 118 184............................ 64.8 27.5 1.8 6.0 7.6 7.0 5.9 4.7 8.2 66.62With paid employees 3 134 959............................... 87.0 10.3 .2 2.5 2.9 1.8 2.5 2.8 2.8 87.23
No employees5 435 838.................................. 81.1 15.8 .3 2.8 4.1 4.4 4.4 2.0 3.7 81.441 to 4 employees 1 716 076................................ 87.0 10.5 .1 2.3 3.6 1.4 2.0 3.1 2.7 87.155 to 9 employees 503 808................................ 89.1 8.4 .3 2.3 1.0 1.6 2.5 3.2 2.4 89.3610 to 19 employees 256 110.............................. 89.2 7.1 .1 3.7 1.3 1.2 2.2 2.1 3.9 89.3720 to 49 employees 144 734.............................. 89.4 8.1 .1 2.3 .4 1.4 3.6 2.3 2.7 89.5850 to 99 employees 45 331.............................. 91.9 6.0 .4 1.7 1.1 1.0 1.7 1.7 2.2 92.39100 employees or more 33 062.......................... 89.5 8.2 – 2.2 1.4 2.6 3.7 .8 2.0 89.510
Hispanic ~owned businesses 771 708................. 66.5 25.1 1.4 7.0 7.3 6.4 4.4 4.9 9.1 67.911
With no paid employees 656 343............................ 61.7 28.8 1.6 7.9 8.7 7.4 4.9 5.4 10.2 63.312With paid employees 115 364............................... 86.8 9.3 .3 3.5 1.2 2.3 2.3 2.6 4.4 87.113
No employees5 19 569.................................. 87.4 11.1 .4 1.1 1.7 3.3 2.9 2.3 1.9 87.8141 to 4 employees 64 631................................ 84.5 10.2 .5 4.8 1.2 2.8 1.8 3.4 5.8 85.0155 to 9 employees 16 937................................ 91.3 5.7 – 3.0 .7 .8 3.3 .3 3.6 91.31610 to 19 employees 8 553.............................. 90.5 7.7 – 1.7 1.7 .7 2.8 1.7 2.6 90.61720 to 49 employees 4 050.............................. 89.5 8.9 .4 1.2 .2 1.4 3.0 3.9 1.7 89.91850 to 99 employees 948.............................. 89.0 7.4 – 3.5 (D) – (D) 1.0 4.9 89.019100 employees or more 676.......................... 96.0 (D) – (D) (D) (D) .5 1.9 .6 96.020
Black ~owned businesses 620 912.................... 59.5 28.7 1.4 10.4 8.9 6.9 5.9 5.2 12.2 60.921
With no paid employees 556 434............................ 56.9 30.5 1.5 11.1 9.6 7.4 6.2 5.4 13.0 58.422With paid employees 64 478............................... 82.0 13.4 .3 4.2 2.4 2.8 3.9 3.5 5.1 82.323
No employees5 13 725.................................. 69.0 22.6 1.3 7.2 5.1 7.3 6.9 3.2 7.4 70.2241 to 4 employees 37 587................................ 84.9 11.9 – 3.2 1.6 2.0 3.3 3.9 4.3 84.9255 to 9 employees 7 853................................ 86.1 8.7 – 5.2 2.1 .3 3.0 2.8 5.7 86.12610 to 19 employees 2 839.............................. 89.8 6.9 – 3.3 2.3 .6 2.3 .5 4.5 89.82720 to 49 employees 1 700.............................. 88.5 7.4 .4 3.7 .7 1.2 .4 5.1 3.7 88.92850 to 99 employees 432.............................. 83.0 12.2 – 4.8 .8 – 10.1 1.2 4.8 83.029100 employees or more 342.......................... 90.6 7.4 – 2.0 – 1.9 1.8 1.7 3.9 90.630
Other minority ~owned businesses 606 426........... 72.1 20.1 2.6 5.3 4.6 5.8 4.3 4.2 6.4 74.631
With no paid employees 470 075............................ 66.0 24.8 3.2 5.9 5.7 7.3 5.3 5.0 7.5 69.332With paid employees 136 351............................... 88.1 7.6 .8 3.4 1.8 1.9 1.8 2.1 3.4 88.933
No employees5 19 989.................................. 84.3 11.9 .7 3.1 2.4 1.9 2.9 4.7 3.1 85.0341 to 4 employees 76 636................................ 88.4 6.9 1.1 3.5 2.0 2.0 1.7 1.6 3.1 89.5355 to 9 employees 22 862................................ 88.7 7.6 .3 3.4 1.1 1.4 1.8 2.5 4.2 89.03610 to 19 employees 10 051.............................. 91.0 5.9 .2 2.9 .8 1.6 1.0 2.2 3.2 91.23720 to 49 employees 5 034.............................. 88.3 6.9 .7 4.1 .8 3.7 1.5 .6 4.3 89.03850 to 99 employees 1 075.............................. 88.0 8.4 – 3.6 4.0 3.1 .9 .3 3.8 88.039100 employees or more 705.......................... 80.8 11.3 – 7.9 4.6 2.8 2.7 1.2 7.9 80.840
Women ~owned businesses 5 888 883.................. 66.4 25.4 1.7 6.5 7.7 6.3 5.3 4.6 8.0 68.141
With no paid employees 5 071 110............................ 63.4 27.7 1.9 7.0 8.5 7.1 5.5 4.8 8.8 65.342With paid employees 817 773............................... 85.0 11.8 .2 3.0 3.1 1.4 4.0 2.9 3.4 85.243
No employees5 127 905.................................. 80.1 17.8 .7 1.4 2.9 .9 12.8 .9 1.7 80.8441 to 4 employees 435 550................................ 83.4 13.1 .1 3.4 4.4 1.7 2.6 3.7 4.2 83.5455 to 9 employees 134 476................................ 91.6 5.8 .2 2.4 1.3 1.2 1.6 2.0 2.2 91.84610 to 19 employees 67 487.............................. 88.4 7.0 – 4.6 .5 .8 2.2 3.3 4.9 88.44720 to 49 employees 35 515.............................. 85.7 12.7 – 1.6 .5 1.5 8.1 2.4 1.9 85.74850 to 99 employees 10 178.............................. 94.2 4.1 – 1.7 .5 – 1.7 .8 2.7 94.249100 employees or more 6 663.......................... 91.6 4.3 – 4.1 .7 2.3 3.4 .2 1.8 91.650
Nonminority male ~owned businesses 10 114 456........ 70.4 23.7 1.3 4.5 6.1 6.0 5.4 4.2 6.5 71.851
With no paid employees 8 019 462............................ 65.8 27.4 1.7 5.1 7.0 7.0 6.4 4.5 7.6 67.552With paid employees 2 094 993............................... 87.9 9.9 .1 2.2 2.9 1.9 1.9 2.8 2.5 88.053
No employees5 271 380.................................. 81.8 14.8 – 3.5 4.7 6.0 .5 2.3 4.7 81.8541 to 4 employees 1 155 800................................ 88.5 9.7 – 1.7 3.6 1.3 1.8 2.9 1.9 88.5555 to 9 employees 334 483................................ 88.0 9.6 .3 2.1 .9 1.8 2.9 3.9 2.2 88.35610 to 19 employees 173 140.............................. 89.3 7.0 .1 3.5 1.6 1.3 2.2 1.7 3.6 89.55720 to 49 employees 101 938.............................. 90.9 6.5 .1 2.5 .4 1.2 2.2 2.3 2.9 91.05850 to 99 employees 33 406.............................. 91.6 6.3 .6 1.6 1.3 1.2 1.5 2.0 1.9 92.159100 employees or more 24 846.......................... 89.1 9.3 – 1.5 1.4 2.7 4.0 1.0 1.8 89.160
1Data represent percentage of owners reporting in the designated categories.2Includes businesses still in operation as of the date the respondents completed the report forms.3For explanation of relative standard errors and standard errors, see Reliability of Estimates in the introductory text.4Relative standard errors are not applicable for lines 1 through 10 since these data are the result of censuses, not surveys.5Firms reported annual payroll, but did not report any employees on their payroll during specified period in 1992.
42 CHARACTERISTICS OF BUSINESS OWNERS 1992 ECONOMIC CENSUS
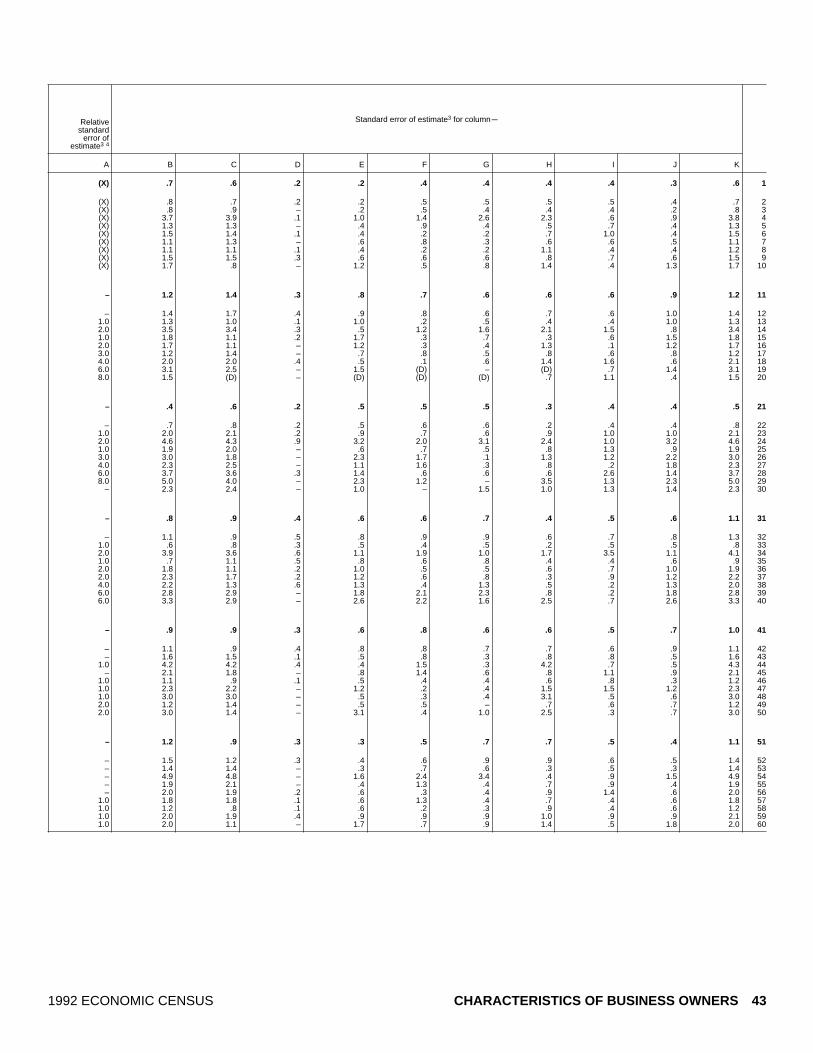
Standard error of estimate3 for columnmRelativestandard
error ofestimate3 4
A B C D E F G H I J K
(X) .7 .6 .2 .2 .4 .4 .4 .4 .3 .6 1
(X) .8 .7 .2 .2 .5 .5 .5 .5 .4 .7 2(X) .8 .9 – .2 .5 .4 .4 .4 .2 .8 3(X) 3.7 3.9 .1 1.0 1.4 2.6 2.3 .6 .9 3.8 4(X) 1.3 1.3 – .4 .9 .4 .5 .7 .4 1.3 5(X) 1.5 1.4 .1 .4 .2 .2 .7 1.0 .4 1.5 6(X) 1.1 1.3 – .6 .8 .3 .6 .6 .5 1.1 7(X) 1.1 1.1 .1 .4 .2 .2 1.1 .4 .4 1.2 8(X) 1.5 1.5 .3 .6 .6 .6 .8 .7 .6 1.5 9(X) 1.7 .8 – 1.2 .5 .8 1.4 .4 1.3 1.7 10
– 1.2 1.4 .3 .8 .7 .6 .6 .6 .9 1.2 11
– 1.4 1.7 .4 .9 .8 .6 .7 .6 1.0 1.4 121.0 1.3 1.0 .1 1.0 .2 .5 .4 .4 1.0 1.3 132.0 3.5 3.4 .3 .5 1.2 1.6 2.1 1.5 .8 3.4 141.0 1.8 1.1 .2 1.7 .3 .7 .3 .6 1.5 1.8 152.0 1.7 1.1 – 1.2 .3 .4 1.3 .1 1.2 1.7 163.0 1.2 1.4 – .7 .8 .5 .8 .6 .8 1.2 174.0 2.0 2.0 .4 .5 .1 .6 1.4 1.6 .6 2.1 186.0 3.1 2.5 – 1.5 (D) – (D) .7 1.4 3.1 198.0 1.5 (D) – (D) (D) (D) .7 1.1 .4 1.5 20
– .4 .6 .2 .5 .5 .5 .3 .4 .4 .5 21
– .7 .8 .2 .5 .6 .6 .2 .4 .4 .8 221.0 2.0 2.1 .2 .9 .7 .6 .9 1.0 1.0 2.1 232.0 4.6 4.3 .9 3.2 2.0 3.1 2.4 1.0 3.2 4.6 241.0 1.9 2.0 – .6 .7 .5 .8 1.3 .9 1.9 253.0 3.0 1.8 – 2.3 1.7 .1 1.3 1.2 2.2 3.0 264.0 2.3 2.5 – 1.1 1.6 .3 .8 .2 1.8 2.3 276.0 3.7 3.6 .3 1.4 .6 .6 .6 2.6 1.4 3.7 288.0 5.0 4.0 – 2.3 1.2 – 3.5 1.3 2.3 5.0 29
– 2.3 2.4 – 1.0 – 1.5 1.0 1.3 1.4 2.3 30
– .8 .9 .4 .6 .6 .7 .4 .5 .6 1.1 31
– 1.1 .9 .5 .8 .9 .9 .6 .7 .8 1.3 321.0 .6 .8 .3 .5 .4 .5 .2 .5 .5 .8 332.0 3.9 3.6 .6 1.1 1.9 1.0 1.7 3.5 1.1 4.1 341.0 .7 1.1 .5 .8 .6 .8 .4 .4 .6 .9 352.0 1.8 1.1 .2 1.0 .5 .5 .6 .7 1.0 1.9 362.0 2.3 1.7 .2 1.2 .6 .8 .3 .9 1.2 2.2 374.0 2.2 1.3 .6 1.3 .4 1.3 .5 .2 1.3 2.0 386.0 2.8 2.9 – 1.8 2.1 2.3 .8 .2 1.8 2.8 396.0 3.3 2.9 – 2.6 2.2 1.6 2.5 .7 2.6 3.3 40
– .9 .9 .3 .6 .8 .6 .6 .5 .7 1.0 41
– 1.1 .9 .4 .8 .8 .7 .7 .6 .9 1.1 42– 1.6 1.5 .1 .5 .8 .3 .8 .8 .5 1.6 43
1.0 4.2 4.2 .4 .4 1.5 .3 4.2 .7 .5 4.3 44– 2.1 1.8 – .8 1.4 .6 .8 1.1 .9 2.1 45
1.0 1.1 .9 .1 .5 .4 .4 .6 .8 .3 1.2 461.0 2.3 2.2 – 1.2 .2 .4 1.5 1.5 1.2 2.3 471.0 3.0 3.0 – .5 .3 .4 3.1 .5 .6 3.0 482.0 1.2 1.4 – .5 .5 – .7 .6 .7 1.2 492.0 3.0 1.4 – 3.1 .4 1.0 2.5 .3 .7 3.0 50
– 1.2 .9 .3 .3 .5 .7 .7 .5 .4 1.1 51
– 1.5 1.2 .3 .4 .6 .9 .9 .6 .5 1.4 52– 1.4 1.4 – .3 .7 .6 .3 .5 .3 1.4 53– 4.9 4.8 – 1.6 2.4 3.4 .4 .9 1.5 4.9 54– 1.9 2.1 – .4 1.3 .4 .7 .9 .4 1.9 55– 2.0 1.9 .2 .6 .3 .4 .9 1.4 .6 2.0 56
1.0 1.8 1.8 .1 .6 1.3 .4 .7 .4 .6 1.8 571.0 1.2 .8 .1 .6 .2 .3 .9 .4 .6 1.2 581.0 2.0 1.9 .4 .9 .9 .9 1.0 .9 .9 2.1 591.0 2.0 1.1 – 1.7 .7 .9 1.4 .5 1.8 2.0 60
1992 ECONOMIC CENSUS CHARACTERISTICS OF BUSINESS OWNERS 43

Table 4d. Operating Status of Business by Legal Form of Organization of Firm: 1992[All data are shown as percents, except firms. For meaning of abbreviations and symbols, see introductory text. For explanation of terms, see appendix A]
Type of firm and legal form of organization
Business the respondent owned in 1992 wasstill in operation in 19961
If the business was no longer operating,the year that the businessoperations discontinued1
Firms(number) Yes No
Don’tknow
Notreported 1992 1993 1994 1995
Notreported
Notappli~
cable2
A B C D E F G H I J K
All businesses 17 253 143.............................. 69.0 24.3 1.5 5.3 6.7 6.1 5.3 4.3 7.2 70.41
Individual proprietorships 14 599 295........................... 66.4 26.0 1.7 5.9 7.3 6.7 5.6 4.4 7.9 68.12Partnerships 1 089 578...................................... 81.6 15.9 .4 2.1 2.9 3.4 4.4 4.2 3.0 82.03Subchapter S corporations 1 564 270.......................... 85.7 12.2 .1 1.9 3.4 2.0 2.8 3.8 2.3 85.84
Hispanic ~owned businesses 771 708................. 66.5 25.1 1.4 7.0 7.3 6.4 4.4 4.9 9.1 67.95
Individual proprietorships 689 015........................... 64.1 26.8 1.6 7.5 8.1 6.9 4.5 5.1 9.8 65.76Partnerships 32 650...................................... 74.5 18.4 .2 6.9 1.4 5.6 5.9 4.8 7.6 74.77Subchapter S corporations 50 042.......................... 85.7 12.2 .1 2.0 2.7 2.3 2.9 3.2 3.0 85.88
Black ~owned businesses 620 912.................... 59.5 28.7 1.4 10.4 8.9 6.9 5.9 5.2 12.2 60.99
Individual proprietorships 584 256........................... 58.5 29.3 1.5 10.7 9.1 7.1 6.0 5.2 12.6 60.010Partnerships 14 727...................................... 77.8 19.5 .2 2.5 3.6 4.3 4.9 4.7 4.5 78.011Subchapter S corporations 21 928.......................... 85.3 11.6 .2 3.0 1.6 4.5 2.4 2.4 3.6 85.412
Other minority ~owned businesses 606 426........... 72.1 20.1 2.6 5.3 4.6 5.8 4.3 4.2 6.4 74.613
Individual proprietorships 502 022........................... 68.7 22.5 3.0 5.8 5.5 6.8 4.1 4.8 7.1 71.714Partnerships 49 489...................................... 77.3 15.6 2.3 4.8 2.4 2.6 7.0 3.2 5.1 79.615Subchapter S corporations 54 915.......................... 87.7 9.6 .3 2.3 1.2 2.6 3.5 1.8 2.9 88.116
Women ~owned businesses 5 888 883.................. 66.4 25.4 1.7 6.5 7.7 6.3 5.3 4.6 8.0 68.117
Individual proprietorships 5 078 077........................... 63.6 27.4 1.9 7.1 8.5 6.8 5.5 4.8 8.8 65.518Partnerships 243 651...................................... 86.0 10.6 1.0 2.4 2.0 2.4 2.6 3.3 2.7 87.019Subchapter S corporations 567 155.......................... 85.1 12.5 .1 2.3 2.4 2.9 4.2 2.9 2.4 85.220
Nonminority male ~owned businesses 10 114 456........ 70.4 23.7 1.3 4.5 6.1 6.0 5.4 4.2 6.5 71.821
Individual proprietorships 8 414 238........................... 68.0 25.4 1.6 5.0 6.6 6.6 5.8 4.1 7.3 69.622Partnerships 777 379...................................... 80.9 17.2 .1 1.8 3.3 3.7 4.6 4.5 2.9 81.023Subchapter S corporations 922 838.......................... 86.0 12.2 .1 1.7 4.1 1.3 1.9 4.6 2.1 86.124
1Data represent percentage of owners reporting in the designated categories.2Includes businesses still in operation as of the date the respondents completed the report forms.3For explanation of relative standard errors and standard errors, see Reliability of Estimates in the introductory text.4Relative standard errors are not applicable for lines 1 through 4 since these data are the result of censuses, not surveys.
44 CHARACTERISTICS OF BUSINESS OWNERS 1992 ECONOMIC CENSUS

Standard error of estimate3 for columnmRelativestandard
error ofestimate3 4
A B C D E F G H I J K
(X) .7 .6 .2 .2 .4 .4 .4 .4 .3 .6 1
(X) .8 .8 .2 .2 .5 .5 .4 .5 .4 .7 2(X) 2.1 1.9 .2 .6 1.4 .8 .8 .9 1.0 2.1 3(X) 1.5 1.4 – .3 .7 .5 .5 .8 .4 1.5 4
– 1.2 1.4 .3 .8 .7 .6 .6 .6 .9 1.2 5
– 1.4 1.7 .3 .8 .7 .7 .7 .6 .9 1.4 62.0 2.9 1.4 .1 2.1 .5 1.3 1.1 1.6 2.1 2.9 71.0 1.6 1.7 .1 .4 1.0 .6 .5 1.0 .6 1.7 8
– .4 .6 .2 .5 .5 .5 .3 .4 .4 .5 9
– .5 .7 .2 .5 .5 .5 .3 .4 .4 .6 103.0 4.5 4.9 .3 1.0 2.3 1.5 1.1 2.4 1.3 4.6 112.0 2.3 2.4 .1 1.1 1.0 1.8 .7 .8 1.0 2.3 12
– .8 .9 .4 .6 .6 .7 .4 .5 .6 1.1 13
– 1.3 1.1 .4 .8 .7 .8 .6 .6 .8 1.5 141.0 3.2 1.8 1.1 1.5 1.1 .7 1.4 1.0 1.5 3.0 151.0 1.5 1.0 .2 .5 .4 .7 .9 .3 .6 1.4 16
– .9 .9 .3 .6 .8 .6 .6 .5 .7 1.0 17
– 1.1 1.0 .4 .7 .9 .7 .6 .6 .8 1.1 181.0 1.9 2.2 .4 .9 1.1 .8 .9 1.2 .9 1.9 19
– 1.6 1.5 – .4 .4 1.5 1.2 .6 .4 1.5 20
– 1.2 .9 .3 .3 .5 .7 .7 .5 .4 1.1 21
– 1.4 1.2 .3 .3 .6 .9 .8 .7 .5 1.4 22– 3.5 3.1 .1 .9 1.9 1.0 1.2 1.3 1.5 3.5 23– 2.4 2.4 – .4 1.5 .4 .5 1.2 .7 2.4 24
1992 ECONOMIC CENSUS CHARACTERISTICS OF BUSINESS OWNERS 45

Table 5a. Reason the Discontinued Business Is No Longer Operating by Industry Division:[All data are shown as percents, except firms. For meaning of abbreviations and symbols, see introductory text. For explanation of terms, see appendix A]
Type of firm and industry division
If the business is no longer operating, the status of the businessat the time the decision was made to cease operations1
Firms(number) Successful Unsuccessful Not reported Not applicable2
A B C D E
All businesses 17 253 143......................... 8.7 14.1 6.8 70.41
Agricultural services, forestry, fishing, and mining 583 253. 7.6 12.1 8.2 72.12Construction 1 829 620.................................. 10.8 16.3 4.6 68.33Manufacturing 517 714................................ 4.7 12.0 5.5 77.84Transportation, communications, and utilities 698 903..... 7.5 19.2 8.8 64.55Wholesale trade 538 339.............................. 7.1 14.1 4.9 73.96
Retail trade 2 478 045................................... 4.5 16.3 7.0 72.17Finance, insurance, and real estate 1 941 029.............. 8.1 9.2 5.6 77.18Services 7 784 016..................................... 10.3 13.5 6.6 69.69Industries not classified 882 224........................ 8.5 17.9 14.1 59.510
Hispanic ~owned businesses 771 708............ 6.7 16.2 9.3 67.911
Agricultural services, forestry, fishing, and mining 32 927. 4.0 14.0 8.5 73.512Construction 97 476.................................. 6.5 16.0 10.2 67.313Manufacturing 18 461................................ 3.9 18.3 7.2 70.614Transportation, communications, and utilities 47 797..... 5.1 14.9 10.0 70.015Wholesale trade 17 727.............................. 5.3 14.5 4.5 75.716
Retail trade 107 846................................... 4.2 21.5 5.9 68.417Finance, insurance, and real estate 49 231.............. 5.7 10.6 6.9 76.818Services 347 297..................................... 8.5 15.0 9.9 66.619Industries not classified 52 945........................ 5.8 20.7 14.9 58.720
Black ~owned businesses 620 912............... 6.1 20.7 12.2 60.921
Agricultural services, forestry, fishing, and mining 10 309. 6.3 20.0 11.6 62.122Construction 43 381.................................. 4.5 20.8 9.4 65.323Manufacturing 10 469................................ 5.3 23.5 11.6 59.624Transportation, communications, and utilities 49 095..... 3.0 21.7 14.3 60.925Wholesale trade 7 550.............................. 4.3 23.7 7.5 64.526
Retail trade 86 840................................... 4.2 25.9 9.2 60.627Finance, insurance, and real estate 40 924.............. 3.7 18.2 7.0 71.228Services 332 981..................................... 7.6 19.3 12.9 60.229Industries not classified 39 363........................ 6.0 22.3 18.1 53.630
Other minority ~owned businesses 606 426....... 5.2 14.0 6.1 74.631
Agricultural services, forestry, fishing, and mining 15 218. 5.9 7.6 9.6 76.932Construction 28 295.................................. 4.1 18.9 5.5 71.533Manufacturing 18 976................................ 3.6 23.6 5.8 67.034Transportation, communications, and utilities 24 362..... 6.9 14.8 10.5 67.735Wholesale trade 20 043.............................. 3.4 15.0 5.8 75.836
Retail trade 132 483................................... 2.9 14.5 4.7 77.937Finance, insurance, and real estate 64 762.............. 2.3 8.1 5.1 84.538Services 273 774..................................... 7.0 13.5 6.1 73.339Industries not classified 28 512........................ 7.4 21.7 10.9 60.040
Women ~owned businesses 5 888 883............. 9.4 14.8 7.7 68.141
Agricultural services, forestry, fishing, and mining 119 731. 9.4 10.6 12.9 67.042Construction 183 695.................................. 7.9 15.0 7.5 69.643Manufacturing 152 346................................ 7.7 12.2 6.1 73.944Transportation, communications, and utilities 141 623..... 7.9 21.7 5.2 65.245Wholesale trade 154 542.............................. 5.5 20.3 4.6 69.646
Retail trade 1 093 342................................... 5.2 18.4 8.8 67.647Finance, insurance, and real estate 602 802.............. 3.8 12.1 6.8 77.248Services 3 158 444..................................... 12.2 13.3 7.1 67.449Industries not classified 282 358........................ 10.8 20.2 13.4 55.650
Nonminority male ~owned businesses 10 114 456.... 8.7 13.5 6.1 71.851
Agricultural services, forestry, fishing, and mining 412 917. 7.5 12.5 6.6 73.552Construction 1 496 056.................................. 11.7 16.4 3.8 68.153Manufacturing 333 485................................ 3.4 10.9 5.1 80.554Transportation, communications, and utilities 458 400..... 8.2 18.9 9.1 63.855Wholesale trade 352 721.............................. 8.0 11.4 4.9 75.656
Retail trade 1 197 943................................... 4.2 14.3 5.7 75.857Finance, insurance, and real estate 1 240 594.............. 10.4 7.7 5.1 76.858Services 4 102 294..................................... 9.2 13.5 6.0 71.359Industries not classified 520 046........................ 7.6 16.3 14.4 61.660
1Data represent percentage of firms reporting in the designated categories.2Includes businesses still in operation as of the date the respondents completed the report forms.3For explanation of relative standard errors and standard errors, see Reliability of Estimates in the introductory text.4Relative standard errors are not applicable for lines 1 through 10 since these data are the result of censuses, not surveys.
46 CHARACTERISTICS OF BUSINESS OWNERS 1992 ECONOMIC CENSUS
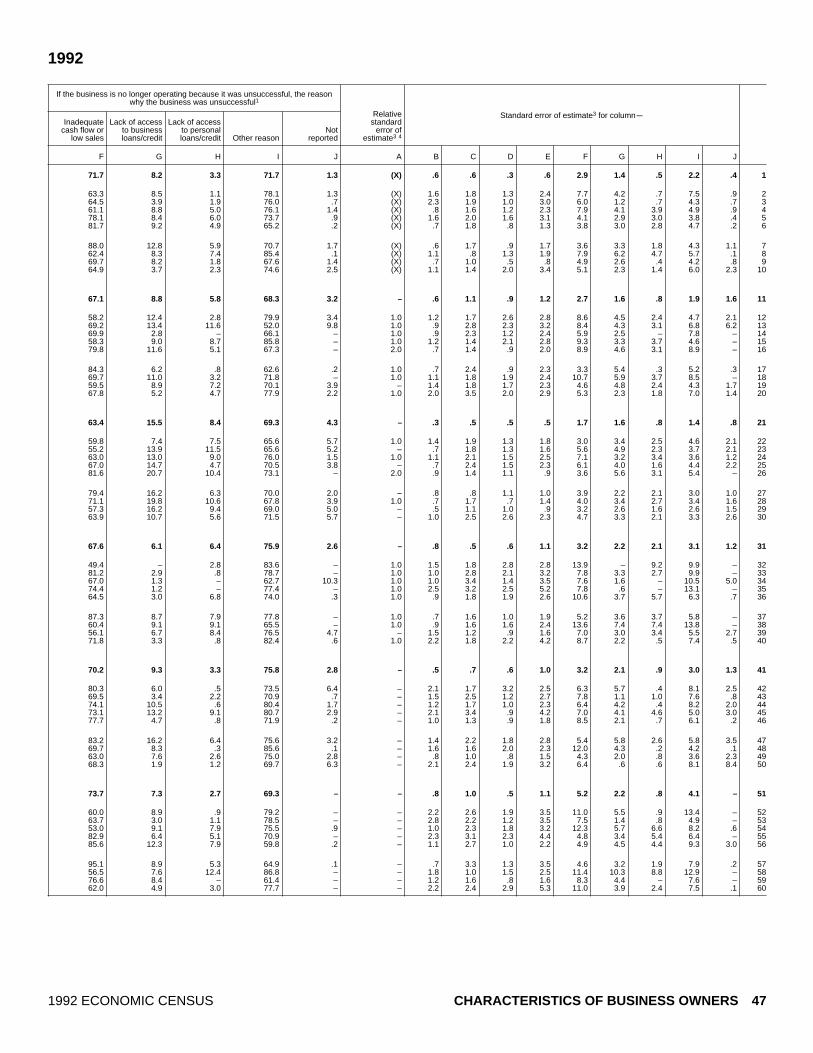
1992
If the business is no longer operating because it was unsuccessful, the reasonwhy the business was unsuccessful1
Standard error of estimate3 for columnmInadequate
cash flow orlow sales
Lack of accessto businessloans/credit
Lack of accessto personalloans/credit Other reason
Notreported
Relativestandard
error ofestimate3 4
F G H I J A B C D E F G H I J
71.7 8.2 3.3 71.7 1.3 (X) .6 .6 .3 .6 2.9 1.4 .5 2.2 .4 1
63.3 8.5 1.1 78.1 1.3 (X) 1.6 1.8 1.3 2.4 7.7 4.2 .7 7.5 .9 264.5 3.9 1.9 76.0 .7 (X) 2.3 1.9 1.0 3.0 6.0 1.2 .7 4.3 .7 361.1 8.8 5.0 76.1 1.4 (X) .8 1.6 1.2 2.3 7.9 4.1 3.9 4.9 .9 478.1 8.4 6.0 73.7 .9 (X) 1.6 2.0 1.6 3.1 4.1 2.9 3.0 3.8 .4 581.7 9.2 4.9 65.2 .2 (X) .7 1.8 .8 1.3 3.8 3.0 2.8 4.7 .2 6
88.0 12.8 5.9 70.7 1.7 (X) .6 1.7 .9 1.7 3.6 3.3 1.8 4.3 1.1 762.4 8.3 7.4 85.4 .1 (X) 1.1 .8 1.3 1.9 7.9 6.2 4.7 5.7 .1 869.7 8.2 1.8 67.6 1.4 (X) .7 1.0 .5 .8 4.9 2.6 .4 4.2 .8 964.9 3.7 2.3 74.6 2.5 (X) 1.1 1.4 2.0 3.4 5.1 2.3 1.4 6.0 2.3 10
67.1 8.8 5.8 68.3 3.2 – .6 1.1 .9 1.2 2.7 1.6 .8 1.9 1.6 11
58.2 12.4 2.8 79.9 3.4 1.0 1.2 1.7 2.6 2.8 8.6 4.5 2.4 4.7 2.1 1269.2 13.4 11.6 52.0 9.8 1.0 .9 2.8 2.3 3.2 8.4 4.3 3.1 6.8 6.2 1369.9 2.8 – 66.1 – 1.0 .9 2.3 1.2 2.4 5.9 2.5 – 7.8 – 1458.3 9.0 8.7 85.8 – 1.0 1.2 1.4 2.1 2.8 9.3 3.3 3.7 4.6 – 1579.8 11.6 5.1 67.3 – 2.0 .7 1.4 .9 2.0 8.9 4.6 3.1 8.9 – 16
84.3 6.2 .8 62.6 .2 1.0 .7 2.4 .9 2.3 3.3 5.4 .3 5.2 .3 1769.7 11.0 3.2 71.8 – 1.0 1.1 1.8 1.9 2.4 10.7 5.9 3.7 8.5 – 1859.5 8.9 7.2 70.1 3.9 – 1.4 1.8 1.7 2.3 4.6 4.8 2.4 4.3 1.7 1967.8 5.2 4.7 77.9 2.2 1.0 2.0 3.5 2.0 2.9 5.3 2.3 1.8 7.0 1.4 20
63.4 15.5 8.4 69.3 4.3 – .3 .5 .5 .5 1.7 1.6 .8 1.4 .8 21
59.8 7.4 7.5 65.6 5.7 1.0 1.4 1.9 1.3 1.8 3.0 3.4 2.5 4.6 2.1 2255.2 13.9 11.5 65.6 5.2 – .7 1.8 1.3 1.6 5.6 4.9 2.3 3.7 2.1 2363.0 13.0 9.0 76.0 1.5 1.0 1.1 2.1 1.5 2.5 7.1 3.2 3.4 3.6 1.2 2467.0 14.7 4.7 70.5 3.8 – .7 2.4 1.5 2.3 6.1 4.0 1.6 4.4 2.2 2581.6 20.7 10.4 73.1 – 2.0 .9 1.4 1.1 .9 3.6 5.6 3.1 5.4 – 26
79.4 16.2 6.3 70.0 2.0 – .8 .8 1.1 1.0 3.9 2.2 2.1 3.0 1.0 2771.1 19.8 10.6 67.8 3.9 1.0 .7 1.7 .7 1.4 4.0 3.4 2.7 3.4 1.6 2857.3 16.2 9.4 69.0 5.0 – .5 1.1 1.0 .9 3.2 2.6 1.6 2.6 1.5 2963.9 10.7 5.6 71.5 5.7 – 1.0 2.5 2.6 2.3 4.7 3.3 2.1 3.3 2.6 30
67.6 6.1 6.4 75.9 2.6 – .8 .5 .6 1.1 3.2 2.2 2.1 3.1 1.2 31
49.4 – 2.8 83.6 – 1.0 1.5 1.8 2.8 2.8 13.9 – 9.2 9.9 – 3281.2 2.9 .8 78.7 – 1.0 1.0 2.8 2.1 3.2 7.8 3.3 2.7 9.9 – 3367.0 1.3 – 62.7 10.3 1.0 1.0 3.4 1.4 3.5 7.6 1.6 – 10.5 5.0 3474.4 1.2 – 77.4 – 1.0 2.5 3.2 2.5 5.2 7.8 .6 – 13.1 – 3564.5 3.0 6.8 74.0 .3 1.0 .9 1.8 1.9 2.6 10.6 3.7 5.7 6.3 .7 36
87.3 8.7 7.9 77.8 – 1.0 .7 1.6 1.0 1.9 5.2 3.6 3.7 5.8 – 3760.4 9.1 9.1 65.5 – 1.0 .9 1.6 1.6 2.4 13.6 7.4 7.4 13.8 – 3856.1 6.7 8.4 76.5 4.7 – 1.5 1.2 .9 1.6 7.0 3.0 3.4 5.5 2.7 3971.8 3.3 .8 82.4 .6 1.0 2.2 1.8 2.2 4.2 8.7 2.2 .5 7.4 .5 40
70.2 9.3 3.3 75.8 2.8 – .5 .7 .6 1.0 3.2 2.1 .9 3.0 1.3 41
80.3 6.0 .5 73.5 6.4 – 2.1 1.7 3.2 2.5 6.3 5.7 .4 8.1 2.5 4269.5 3.4 2.2 70.9 .7 – 1.5 2.5 1.2 2.7 7.8 1.1 1.0 7.6 .8 4374.1 10.5 .6 80.4 1.7 – 1.2 1.7 1.0 2.3 6.4 4.2 .4 8.2 2.0 4473.1 13.2 9.1 80.7 2.9 – 2.1 3.4 .9 4.2 7.0 4.1 4.6 5.0 3.0 4577.7 4.7 .8 71.9 .2 – 1.0 1.3 .9 1.8 8.5 2.1 .7 6.1 .2 46
83.2 16.2 6.4 75.6 3.2 – 1.4 2.2 1.8 2.8 5.4 5.8 2.6 5.8 3.5 4769.7 8.3 .3 85.6 .1 – 1.6 1.6 2.0 2.3 12.0 4.3 .2 4.2 .1 4863.0 7.6 2.6 75.0 2.8 – .8 1.0 .8 1.5 4.3 2.0 .8 3.6 2.3 4968.3 1.9 1.2 69.7 6.3 – 2.1 2.4 1.9 3.2 6.4 .6 .6 8.1 8.4 50
73.7 7.3 2.7 69.3 – – .8 1.0 .5 1.1 5.2 2.2 .8 4.1 – 51
60.0 8.9 .9 79.2 – – 2.2 2.6 1.9 3.5 11.0 5.5 .9 13.4 – 5263.7 3.0 1.1 78.5 – – 2.8 2.2 1.2 3.5 7.5 1.4 .8 4.9 – 5353.0 9.1 7.9 75.5 .9 – 1.0 2.3 1.8 3.2 12.3 5.7 6.6 8.2 .6 5482.9 6.4 5.1 70.9 – – 2.3 3.1 2.3 4.4 4.8 3.4 5.4 6.4 – 5585.6 12.3 7.9 59.8 .2 – 1.1 2.7 1.0 2.2 4.9 4.5 4.4 9.3 3.0 56
95.1 8.9 5.3 64.9 .1 – .7 3.3 1.3 3.5 4.6 3.2 1.9 7.9 .2 5756.5 7.6 12.4 86.8 – – 1.8 1.0 1.5 2.5 11.4 10.3 8.8 12.9 – 5876.6 8.4 – 61.4 – – 1.2 1.6 .8 1.6 8.3 4.4 – 7.6 – 5962.0 4.9 3.0 77.7 – – 2.2 2.4 2.9 5.3 11.0 3.9 2.4 7.5 .1 60
1992 ECONOMIC CENSUS CHARACTERISTICS OF BUSINESS OWNERS 47

Table 5b. Reason the Discontinued Business Is No Longer Operating by Receipts Size of Firm:[All data are shown as percents, except firms. For meaning of abbreviations and symbols, see introductory text. For explanation of terms, see appendix A]
Type of firm and receipts size
If the business is no longer operating, the status of the businessat the time the decision was made to cease operations1
Firms(number) Successful Unsuccessful Not reported Not applicable2
A B C D E
All businesses 17 253 143......................... 8.7 14.1 6.8 70.41
Less than $5,000 5 226 553............................. 10.3 25.0 10.7 54.02$5,000 to $9,999 2 443 946.............................. 13.1 16.3 8.6 61.93$10,000 to $24,999 3 076 410............................ 8.4 13.4 5.7 72.54$25,000 to $49,999 1 945 806............................ 8.8 8.2 5.0 77.95$50,000 to $99,999 1 615 940............................ 5.9 7.2 3.2 83.66
$100,000 to $199,999 1 197 996......................... 4.4 4.0 3.1 88.67$200,000 to $249,999 301 794......................... 4.8 2.0 2.0 91.38$250,000 to $499,999 682 583......................... 4.8 2.4 3.2 89.69$500,000 to $999,999 372 078......................... 4.7 2.6 3.9 88.810$1,000,000 or more 390 037........................... 4.0 2.5 2.8 90.711
Hispanic ~owned businesses 771 708............ 6.7 16.2 9.3 67.912
Less than $5,000 219 226............................. 10.4 30.8 13.9 44.913$5,000 to $9,999 140 362.............................. 9.7 19.7 11.8 58.814$10,000 to $24,999 165 667............................ 5.7 15.8 8.2 70.315$25,000 to $49,999 87 288............................ 2.4 8.3 9.6 79.716$50,000 to $99,999 64 742............................ 5.1 6.8 5.7 82.417
$100,000 to $199,999 41 578......................... 3.9 4.1 2.8 89.218$200,000 to $249,999 10 030......................... 4.4 4.4 3.8 87.419$250,000 to $499,999 22 301......................... 3.7 3.6 3.9 88.820$500,000 to $999,999 11 319......................... 4.2 2.9 2.9 89.921$1,000,000 or more 9 194........................... 4.2 1.5 2.8 91.422
Black ~owned businesses 620 912............... 6.1 20.7 12.2 60.923
Less than $5,000 236 722............................. 6.3 29.3 16.8 47.524$5,000 to $9,999 111 512.............................. 8.1 23.2 11.7 57.025$10,000 to $24,999 129 901............................ 5.5 15.6 10.9 68.026$25,000 to $49,999 62 209............................ 5.8 14.6 7.2 72.327$50,000 to $99,999 39 218............................ 4.1 7.5 6.9 81.528
$100,000 to $199,999 20 936......................... 3.1 6.4 4.2 86.329$200,000 to $249,999 4 533......................... 6.5 .8 5.6 87.230$250,000 to $499,999 9 029......................... 4.5 4.3 5.6 85.631$500,000 to $999,999 3 823......................... 1.7 3.0 3.3 92.032$1,000,000 or more 3 028........................... 4.2 5.1 3.7 87.033
Other minority ~owned businesses 606 426....... 5.2 14.0 6.1 74.634
Less than $5,000 132 493............................. 9.6 25.5 8.5 56.435$5,000 to $9,999 80 435.............................. 8.2 17.4 12.4 62.036$10,000 to $24,999 108 195............................ 3.6 22.3 4.5 69.737$25,000 to $49,999 77 345............................ 1.8 12.7 4.9 80.638$50,000 to $99,999 70 360............................ 5.2 8.2 4.4 82.239
$100,000 to $199,999 58 620......................... 3.6 5.7 4.9 85.940$200,000 to $249,999 15 740......................... 2.4 3.5 4.2 89.841$250,000 to $499,999 34 266......................... 4.1 2.8 4.1 89.042$500,000 to $999,999 16 467......................... 4.7 2.5 2.9 89.943$1,000,000 or more 12 505........................... 3.5 2.3 4.1 90.144
Women ~owned businesses 5 888 883............. 9.4 14.8 7.7 68.145
Less than $5,000 2 310 303............................. 11.3 24.6 10.3 53.746$5,000 to $9,999 967 380.............................. 10.2 14.6 7.8 67.447$10,000 to $24,999 1 051 358............................ 9.1 9.5 6.7 74.748$25,000 to $49,999 538 885............................ 8.9 6.3 6.1 78.849$50,000 to $99,999 381 517............................ 7.1 7.0 5.3 80.650
$100,000 to $199,999 267 089......................... 4.3 3.9 2.1 89.751$200,000 to $249,999 66 464......................... 1.7 1.1 5.1 92.152$250,000 to $499,999 146 313......................... 4.8 2.2 3.0 90.053$500,000 to $999,999 80 539......................... 2.5 3.2 3.5 90.854$1,000,000 or more 79 037........................... 3.6 2.1 2.4 91.955
Nonminority male ~owned businesses 10 114 456.... 8.7 13.5 6.1 71.856
Less than $5,000 2 608 047............................. 9.6 24.8 10.7 54.957$5,000 to $9,999 1 285 456.............................. 16.0 17.1 8.8 58.258$10,000 to $24,999 1 763 830............................ 8.3 15.2 4.8 71.759$25,000 to $49,999 1 248 482............................ 9.6 8.6 4.5 77.260$50,000 to $99,999 1 108 065............................ 5.7 7.3 2.2 84.861
$100,000 to $199,999 840 723......................... 4.4 3.8 3.3 88.462$200,000 to $249,999 212 693......................... 6.0 2.0 .7 91.463$250,000 to $499,999 488 462......................... 4.9 2.4 3.0 89.764$500,000 to $999,999 266 408......................... 5.3 2.4 4.1 88.165$1,000,000 or more 292 290........................... 4.1 2.6 2.8 90.566
1Data represent percentage of firms reporting in the designated categories.2Includes businesses still in operation as of the date the respondents completed the report forms.3For explanation of relative standard errors and standard errors, see Reliability of Estimates in the introductory text.4Relative standard errors are not applicable for lines 1 through 11 since these data are the result of censuses, not surveys.
48 CHARACTERISTICS OF BUSINESS OWNERS 1992 ECONOMIC CENSUS
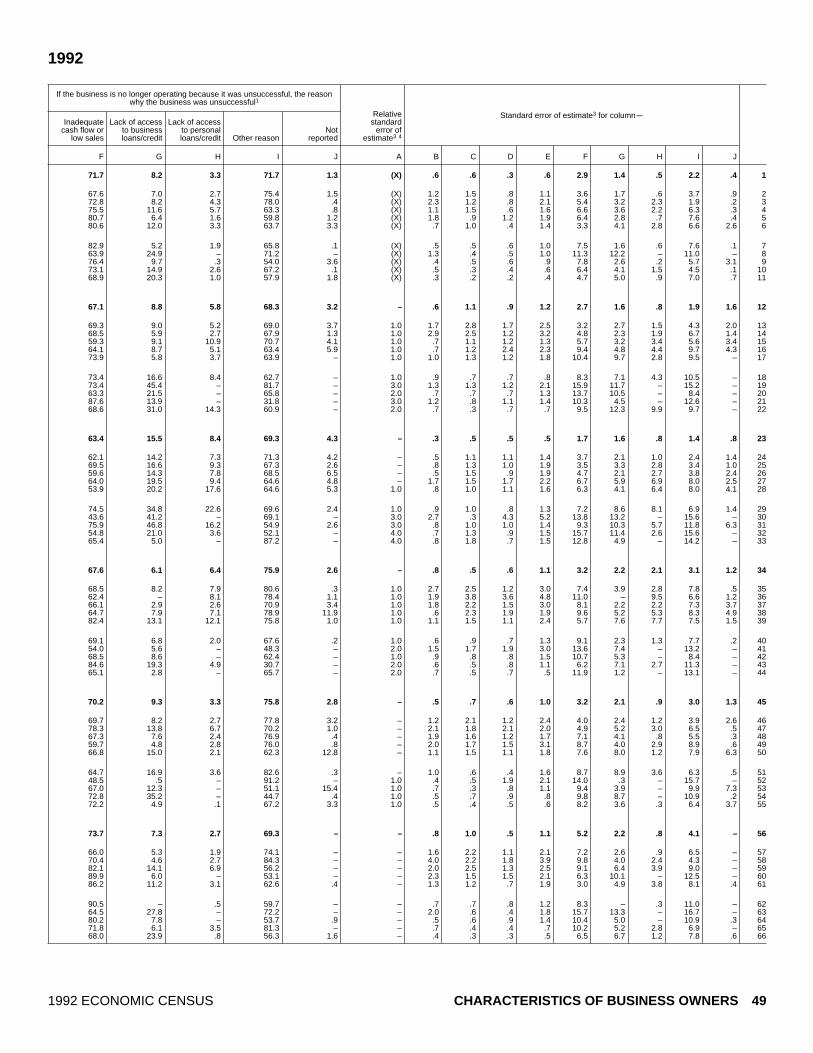
1992
If the business is no longer operating because it was unsuccessful, the reasonwhy the business was unsuccessful1
Standard error of estimate3 for columnmInadequate
cash flow orlow sales
Lack of accessto businessloans/credit
Lack of accessto personalloans/credit Other reason
Notreported
Relativestandard
error ofestimate3 4
F G H I J A B C D E F G H I J
71.7 8.2 3.3 71.7 1.3 (X) .6 .6 .3 .6 2.9 1.4 .5 2.2 .4 1
67.6 7.0 2.7 75.4 1.5 (X) 1.2 1.5 .8 1.1 3.6 1.7 .6 3.7 .9 272.8 8.2 4.3 78.0 .4 (X) 2.3 1.2 .8 2.1 5.4 3.2 2.3 1.9 .2 375.5 11.6 5.7 63.3 .8 (X) 1.1 1.5 .6 1.6 6.6 3.6 2.2 6.3 .3 480.7 6.4 1.6 59.8 1.2 (X) 1.8 .9 1.2 1.9 6.4 2.8 .7 7.6 .4 580.6 12.0 3.3 63.7 3.3 (X) .7 1.0 .4 1.4 3.3 4.1 2.8 6.6 2.6 6
82.9 5.2 1.9 65.8 .1 (X) .5 .5 .6 1.0 7.5 1.6 .6 7.6 .1 763.9 24.9 – 71.2 – (X) 1.3 .4 .5 1.0 11.3 12.2 – 11.0 – 876.4 9.7 .3 54.0 3.6 (X) .4 .5 .6 .9 7.8 2.6 .2 5.7 3.1 973.1 14.9 2.6 67.2 .1 (X) .5 .3 .4 .6 6.4 4.1 1.5 4.5 .1 1068.9 20.3 1.0 57.9 1.8 (X) .3 .2 .2 .4 4.7 5.0 .9 7.0 .7 11
67.1 8.8 5.8 68.3 3.2 – .6 1.1 .9 1.2 2.7 1.6 .8 1.9 1.6 12
69.3 9.0 5.2 69.0 3.7 1.0 1.7 2.8 1.7 2.5 3.2 2.7 1.5 4.3 2.0 1368.5 5.9 2.7 67.9 1.3 1.0 2.9 2.5 1.2 3.2 4.8 2.3 1.9 6.7 1.4 1459.3 9.1 10.9 70.7 4.1 1.0 .7 1.1 1.2 1.3 5.7 3.2 3.4 5.6 3.4 1564.1 8.7 5.1 63.4 5.9 1.0 .7 1.2 2.4 2.3 9.4 4.8 4.4 9.7 4.3 1673.9 5.8 3.7 63.9 – 1.0 1.0 1.3 1.2 1.8 10.4 9.7 2.8 9.5 – 17
73.4 16.6 8.4 62.7 – 1.0 .9 .7 .7 .8 8.3 7.1 4.3 10.5 – 1873.4 45.4 – 81.7 – 3.0 1.3 1.3 1.2 2.1 15.9 11.7 – 15.2 – 1963.3 21.5 – 65.8 – 2.0 .7 .7 .7 1.3 13.7 10.5 – 8.4 – 2087.6 13.9 – 31.8 – 3.0 1.2 .8 1.1 1.4 10.3 4.5 – 12.6 – 2168.6 31.0 14.3 60.9 – 2.0 .7 .3 .7 .7 9.5 12.3 9.9 9.7 – 22
63.4 15.5 8.4 69.3 4.3 – .3 .5 .5 .5 1.7 1.6 .8 1.4 .8 23
62.1 14.2 7.3 71.3 4.2 – .5 1.1 1.1 1.4 3.7 2.1 1.0 2.4 1.4 2469.5 16.6 9.3 67.3 2.6 – .8 1.3 1.0 1.9 3.5 3.3 2.8 3.4 1.0 2559.6 14.3 7.8 68.5 6.5 – .5 1.5 .9 1.9 4.7 2.1 2.7 3.8 2.4 2664.0 19.5 9.4 64.6 4.8 – 1.7 1.5 1.7 2.2 6.7 5.9 6.9 8.0 2.5 2753.9 20.2 17.6 64.6 5.3 1.0 .8 1.0 1.1 1.6 6.3 4.1 6.4 8.0 4.1 28
74.5 34.8 22.6 69.6 2.4 1.0 .9 1.0 .8 1.3 7.2 8.6 8.1 6.9 1.4 2943.6 41.2 – 69.1 – 3.0 2.7 .3 4.3 5.2 13.8 13.2 – 15.6 – 3075.9 46.8 16.2 54.9 2.6 3.0 .8 1.0 1.0 1.4 9.3 10.3 5.7 11.8 6.3 3154.8 21.0 3.6 52.1 – 4.0 .7 1.3 .9 1.5 15.7 11.4 2.6 15.6 – 3265.4 5.0 – 87.2 – 4.0 .8 1.8 .7 1.5 12.8 4.9 – 14.2 – 33
67.6 6.1 6.4 75.9 2.6 – .8 .5 .6 1.1 3.2 2.2 2.1 3.1 1.2 34
68.5 8.2 7.9 80.6 .3 1.0 2.7 2.5 1.2 3.0 7.4 3.9 2.8 7.8 .5 3562.4 – 8.1 78.4 1.1 1.0 1.9 3.8 3.6 4.8 11.0 – 9.5 6.6 1.2 3666.1 2.9 2.6 70.9 3.4 1.0 1.8 2.2 1.5 3.0 8.1 2.2 2.2 7.3 3.7 3764.7 7.9 7.1 78.9 11.9 1.0 .6 2.3 1.9 1.9 9.6 5.2 5.3 8.3 4.9 3882.4 13.1 12.1 75.8 1.0 1.0 1.1 1.5 1.1 2.4 5.7 7.6 7.7 7.5 1.5 39
69.1 6.8 2.0 67.6 .2 1.0 .6 .9 .7 1.3 9.1 2.3 1.3 7.7 .2 4054.0 5.6 – 48.3 – 2.0 1.5 1.7 1.9 3.0 13.6 7.4 – 13.2 – 4168.5 8.6 – 62.4 – 1.0 .9 .8 .8 1.5 10.7 5.3 – 8.4 – 4284.6 19.3 4.9 30.7 – 2.0 .6 .5 .8 1.1 6.2 7.1 2.7 11.3 – 4365.1 2.8 – 65.7 – 2.0 .7 .5 .7 .5 11.9 1.2 – 13.1 – 44
70.2 9.3 3.3 75.8 2.8 – .5 .7 .6 1.0 3.2 2.1 .9 3.0 1.3 45
69.7 8.2 2.7 77.8 3.2 – 1.2 2.1 1.2 2.4 4.0 2.4 1.2 3.9 2.6 4678.3 13.8 6.7 70.2 1.0 – 2.1 1.8 2.1 2.0 4.9 5.2 3.0 6.5 .5 4767.3 7.6 2.4 76.9 .4 – 1.9 1.6 1.2 1.7 7.1 4.1 .8 5.5 .3 4859.7 4.8 2.8 76.0 .8 – 2.0 1.7 1.5 3.1 8.7 4.0 2.9 8.9 .6 4966.8 15.0 2.1 62.3 12.8 – 1.1 1.5 1.1 1.8 7.6 8.0 1.2 7.9 6.3 50
64.7 16.9 3.6 82.6 .3 – 1.0 .6 .4 1.6 8.7 8.9 3.6 6.3 .5 5148.5 .5 – 91.2 – 1.0 .4 .5 1.9 2.1 14.0 .3 – 15.7 – 5267.0 12.3 – 51.1 15.4 1.0 .7 .3 .8 1.1 9.4 3.9 – 9.9 7.3 5372.8 35.2 – 44.7 .4 1.0 .5 .7 .9 .8 9.8 8.7 – 10.9 .2 5472.2 4.9 .1 67.2 3.3 1.0 .5 .4 .5 .6 8.2 3.6 .3 6.4 3.7 55
73.7 7.3 2.7 69.3 – – .8 1.0 .5 1.1 5.2 2.2 .8 4.1 – 56
66.0 5.3 1.9 74.1 – – 1.6 2.2 1.1 2.1 7.2 2.6 .9 6.5 – 5770.4 4.6 2.7 84.3 – – 4.0 2.2 1.8 3.9 9.8 4.0 2.4 4.3 – 5882.1 14.1 6.9 56.2 – – 2.0 2.5 1.3 2.5 9.1 6.4 3.9 9.0 – 5989.9 6.0 – 53.1 – – 2.3 1.5 1.5 2.1 6.3 10.1 – 12.5 – 6086.2 11.2 3.1 62.6 .4 – 1.3 1.2 .7 1.9 3.0 4.9 3.8 8.1 .4 61
90.5 – .5 59.7 – – .7 .7 .8 1.2 8.3 – .3 11.0 – 6264.5 27.8 – 72.2 – – 2.0 .6 .4 1.8 15.7 13.3 – 16.7 – 6380.2 7.8 – 53.7 .9 – .5 .6 .9 1.4 10.4 5.0 – 10.9 .3 6471.8 6.1 3.5 81.3 – – .7 .4 .4 .7 10.2 5.2 2.8 6.9 – 6568.0 23.9 .8 56.3 1.6 – .4 .3 .3 .5 6.5 6.7 1.2 7.8 .6 66
1992 ECONOMIC CENSUS CHARACTERISTICS OF BUSINESS OWNERS 49
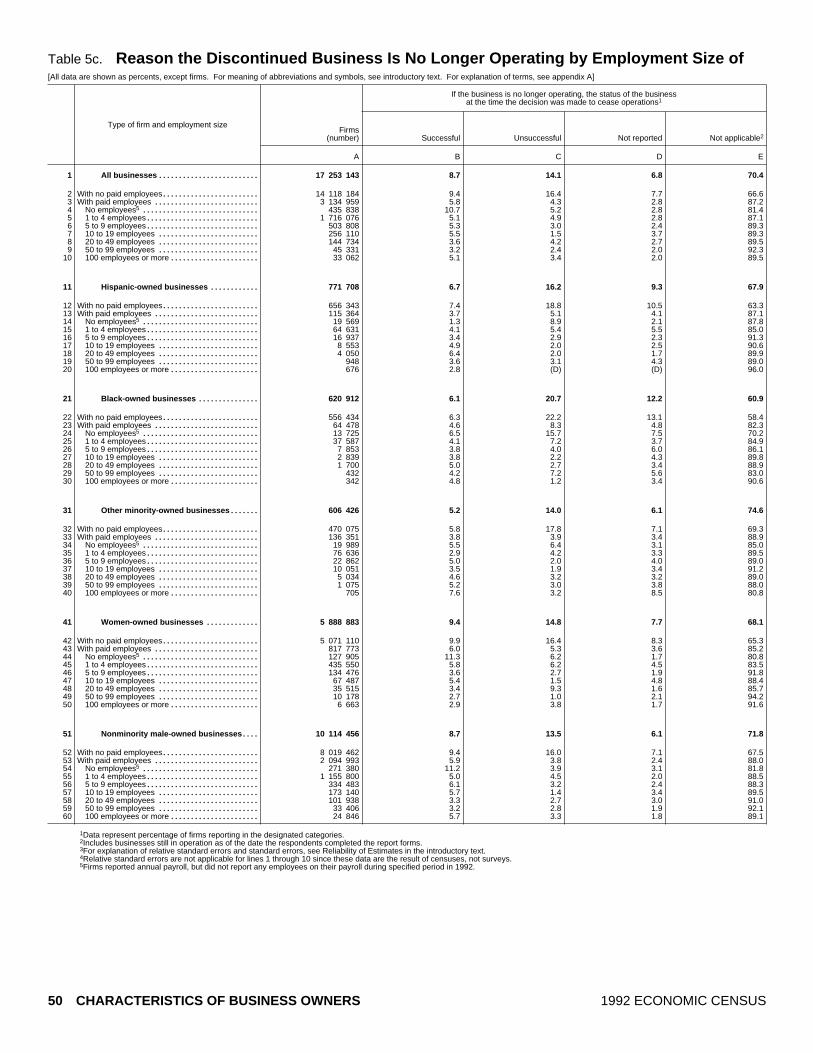
Table 5c. Reason the Discontinued Business Is No Longer Operating by Employment Size of[All data are shown as percents, except firms. For meaning of abbreviations and symbols, see introductory text. For explanation of terms, see appendix A]
Type of firm and employment size
If the business is no longer operating, the status of the businessat the time the decision was made to cease operations1
Firms(number) Successful Unsuccessful Not reported Not applicable2
A B C D E
All businesses 17 253 143......................... 8.7 14.1 6.8 70.41
With no paid employees 14 118 184........................ 9.4 16.4 7.7 66.62With paid employees 3 134 959.......................... 5.8 4.3 2.8 87.23
No employees5 435 838............................. 10.7 5.2 2.8 81.441 to 4 employees 1 716 076............................ 5.1 4.9 2.8 87.155 to 9 employees 503 808............................ 5.3 3.0 2.4 89.3610 to 19 employees 256 110......................... 5.5 1.5 3.7 89.3720 to 49 employees 144 734......................... 3.6 4.2 2.7 89.5850 to 99 employees 45 331......................... 3.2 2.4 2.0 92.39100 employees or more 33 062...................... 5.1 3.4 2.0 89.510
Hispanic ~owned businesses 771 708............ 6.7 16.2 9.3 67.911
With no paid employees 656 343........................ 7.4 18.8 10.5 63.312With paid employees 115 364.......................... 3.7 5.1 4.1 87.113
No employees5 19 569............................. 1.3 8.9 2.1 87.8141 to 4 employees 64 631............................ 4.1 5.4 5.5 85.0155 to 9 employees 16 937............................ 3.4 2.9 2.3 91.31610 to 19 employees 8 553......................... 4.9 2.0 2.5 90.61720 to 49 employees 4 050......................... 6.4 2.0 1.7 89.91850 to 99 employees 948......................... 3.6 3.1 4.3 89.019100 employees or more 676...................... 2.8 (D) (D) 96.020
Black ~owned businesses 620 912............... 6.1 20.7 12.2 60.921
With no paid employees 556 434........................ 6.3 22.2 13.1 58.422With paid employees 64 478.......................... 4.6 8.3 4.8 82.323
No employees5 13 725............................. 6.5 15.7 7.5 70.2241 to 4 employees 37 587............................ 4.1 7.2 3.7 84.9255 to 9 employees 7 853............................ 3.8 4.0 6.0 86.12610 to 19 employees 2 839......................... 3.8 2.2 4.3 89.82720 to 49 employees 1 700......................... 5.0 2.7 3.4 88.92850 to 99 employees 432......................... 4.2 7.2 5.6 83.029100 employees or more 342...................... 4.8 1.2 3.4 90.630
Other minority ~owned businesses 606 426....... 5.2 14.0 6.1 74.631
With no paid employees 470 075........................ 5.8 17.8 7.1 69.332With paid employees 136 351.......................... 3.8 3.9 3.4 88.933
No employees5 19 989............................. 5.5 6.4 3.1 85.0341 to 4 employees 76 636............................ 2.9 4.2 3.3 89.5355 to 9 employees 22 862............................ 5.0 2.0 4.0 89.03610 to 19 employees 10 051......................... 3.5 1.9 3.4 91.23720 to 49 employees 5 034......................... 4.6 3.2 3.2 89.03850 to 99 employees 1 075......................... 5.2 3.0 3.8 88.039100 employees or more 705...................... 7.6 3.2 8.5 80.840
Women ~owned businesses 5 888 883............. 9.4 14.8 7.7 68.141
With no paid employees 5 071 110........................ 9.9 16.4 8.3 65.342With paid employees 817 773.......................... 6.0 5.3 3.6 85.243
No employees5 127 905............................. 11.3 6.2 1.7 80.8441 to 4 employees 435 550............................ 5.8 6.2 4.5 83.5455 to 9 employees 134 476............................ 3.6 2.7 1.9 91.84610 to 19 employees 67 487......................... 5.4 1.5 4.8 88.44720 to 49 employees 35 515......................... 3.4 9.3 1.6 85.74850 to 99 employees 10 178......................... 2.7 1.0 2.1 94.249100 employees or more 6 663...................... 2.9 3.8 1.7 91.650
Nonminority male ~owned businesses 10 114 456.... 8.7 13.5 6.1 71.851
With no paid employees 8 019 462........................ 9.4 16.0 7.1 67.552With paid employees 2 094 993.......................... 5.9 3.8 2.4 88.053
No employees5 271 380............................. 11.2 3.9 3.1 81.8541 to 4 employees 1 155 800............................ 5.0 4.5 2.0 88.5555 to 9 employees 334 483............................ 6.1 3.2 2.4 88.35610 to 19 employees 173 140......................... 5.7 1.4 3.4 89.55720 to 49 employees 101 938......................... 3.3 2.7 3.0 91.05850 to 99 employees 33 406......................... 3.2 2.8 1.9 92.159100 employees or more 24 846...................... 5.7 3.3 1.8 89.160
1Data represent percentage of firms reporting in the designated categories.2Includes businesses still in operation as of the date the respondents completed the report forms.3For explanation of relative standard errors and standard errors, see Reliability of Estimates in the introductory text.4Relative standard errors are not applicable for lines 1 through 10 since these data are the result of censuses, not surveys.5Firms reported annual payroll, but did not report any employees on their payroll during specified period in 1992.
50 CHARACTERISTICS OF BUSINESS OWNERS 1992 ECONOMIC CENSUS
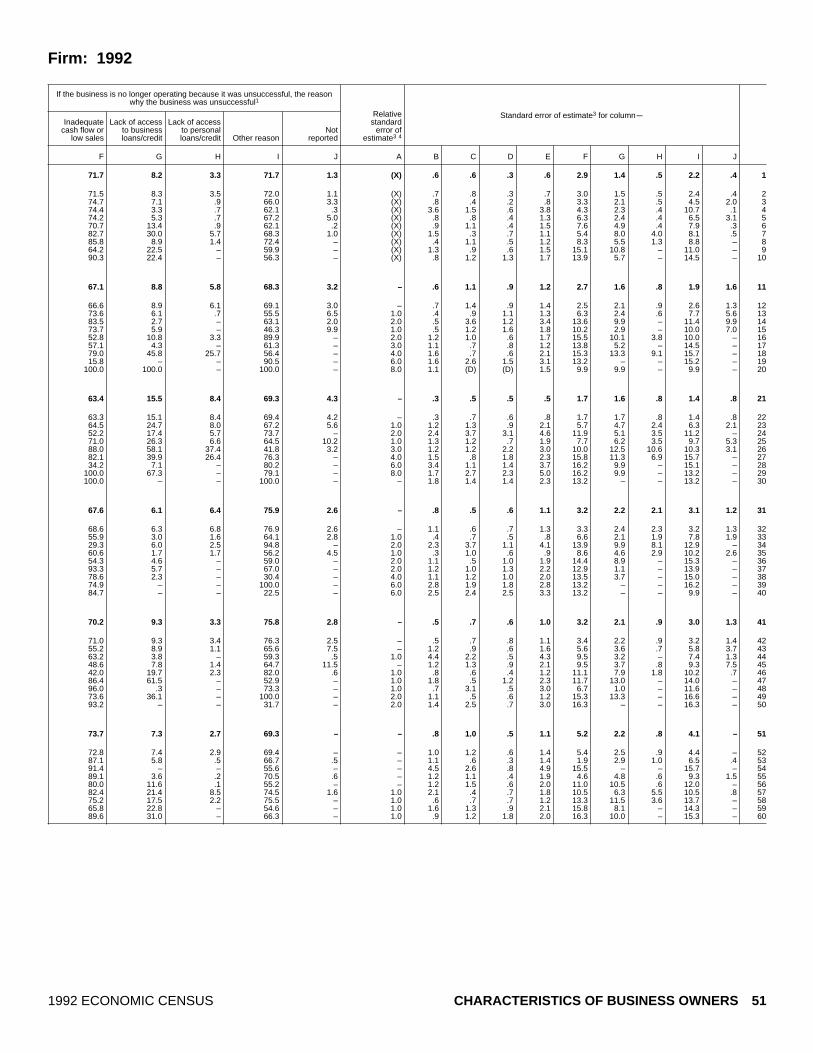
Firm: 1992
If the business is no longer operating because it was unsuccessful, the reasonwhy the business was unsuccessful1
Standard error of estimate3 for columnmInadequate
cash flow orlow sales
Lack of accessto businessloans/credit
Lack of accessto personalloans/credit Other reason
Notreported
Relativestandard
error ofestimate3 4
F G H I J A B C D E F G H I J
71.7 8.2 3.3 71.7 1.3 (X) .6 .6 .3 .6 2.9 1.4 .5 2.2 .4 1
71.5 8.3 3.5 72.0 1.1 (X) .7 .8 .3 .7 3.0 1.5 .5 2.4 .4 274.7 7.1 .9 66.0 3.3 (X) .8 .4 .2 .8 3.3 2.1 .5 4.5 2.0 374.4 3.3 .7 62.1 .3 (X) 3.6 1.5 .6 3.8 4.3 2.3 .4 10.7 .1 474.2 5.3 .7 67.2 5.0 (X) .8 .8 .4 1.3 6.3 2.4 .4 6.5 3.1 570.7 13.4 .9 62.1 .2 (X) .9 1.1 .4 1.5 7.6 4.9 .4 7.9 .3 682.7 30.0 5.7 68.3 1.0 (X) 1.5 .3 .7 1.1 5.4 8.0 4.0 8.1 .5 785.8 8.9 1.4 72.4 – (X) .4 1.1 .5 1.2 8.3 5.5 1.3 8.8 – 864.2 22.5 – 59.9 – (X) 1.3 .9 .6 1.5 15.1 10.8 – 11.0 – 990.3 22.4 – 56.3 – (X) .8 1.2 1.3 1.7 13.9 5.7 – 14.5 – 10
67.1 8.8 5.8 68.3 3.2 – .6 1.1 .9 1.2 2.7 1.6 .8 1.9 1.6 11
66.6 8.9 6.1 69.1 3.0 – .7 1.4 .9 1.4 2.5 2.1 .9 2.6 1.3 1273.6 6.1 .7 55.5 6.5 1.0 .4 .9 1.1 1.3 6.3 2.4 .6 7.7 5.6 1383.5 2.7 – 63.1 2.0 2.0 .5 3.6 1.2 3.4 13.6 9.9 – 11.4 9.9 1473.7 5.9 – 46.3 9.9 1.0 .5 1.2 1.6 1.8 10.2 2.9 – 10.0 7.0 1552.8 10.8 3.3 89.9 – 2.0 1.2 1.0 .6 1.7 15.5 10.1 3.8 10.0 – 1657.1 4.3 – 61.3 – 3.0 1.1 .7 .8 1.2 13.8 5.2 – 14.5 – 1779.0 45.8 25.7 56.4 – 4.0 1.6 .7 .6 2.1 15.3 13.3 9.1 15.7 – 1815.8 – – 90.5 – 6.0 1.6 2.6 1.5 3.1 13.2 – – 15.2 – 19
100.0 100.0 – 100.0 – 8.0 1.1 (D) (D) 1.5 9.9 9.9 – 9.9 – 20
63.4 15.5 8.4 69.3 4.3 – .3 .5 .5 .5 1.7 1.6 .8 1.4 .8 21
63.3 15.1 8.4 69.4 4.2 – .3 .7 .6 .8 1.7 1.7 .8 1.4 .8 2264.5 24.7 8.0 67.2 5.6 1.0 1.2 1.3 .9 2.1 5.7 4.7 2.4 6.3 2.1 2352.2 17.4 5.7 73.7 – 2.0 2.4 3.7 3.1 4.6 11.9 5.1 3.5 11.2 – 2471.0 26.3 6.6 64.5 10.2 1.0 1.3 1.2 .7 1.9 7.7 6.2 3.5 9.7 5.3 2588.0 58.1 37.4 41.8 3.2 3.0 1.2 1.2 2.2 3.0 10.0 12.5 10.6 10.3 3.1 2682.1 39.9 26.4 76.3 – 4.0 1.5 .8 1.8 2.3 15.8 11.3 6.9 15.7 – 2734.2 7.1 – 80.2 – 6.0 3.4 1.1 1.4 3.7 16.2 9.9 – 15.1 – 28
100.0 67.3 – 79.1 – 8.0 1.7 2.7 2.3 5.0 16.2 9.9 – 13.2 – 29100.0 – – 100.0 – – 1.8 1.4 1.4 2.3 13.2 – – 13.2 – 30
67.6 6.1 6.4 75.9 2.6 – .8 .5 .6 1.1 3.2 2.2 2.1 3.1 1.2 31
68.6 6.3 6.8 76.9 2.6 – 1.1 .6 .7 1.3 3.3 2.4 2.3 3.2 1.3 3255.9 3.0 1.6 64.1 2.8 1.0 .4 .7 .5 .8 6.6 2.1 1.9 7.8 1.9 3329.3 6.0 2.5 94.8 – 2.0 2.3 3.7 1.1 4.1 13.9 9.9 8.1 12.9 – 3460.6 1.7 1.7 56.2 4.5 1.0 .3 1.0 .6 .9 8.6 4.6 2.9 10.2 2.6 3554.3 4.6 – 59.0 – 2.0 1.1 .5 1.0 1.9 14.4 8.9 – 15.3 – 3693.3 5.7 – 67.0 – 2.0 1.2 1.0 1.3 2.2 12.9 1.1 – 13.9 – 3778.6 2.3 – 30.4 – 4.0 1.1 1.2 1.0 2.0 13.5 3.7 – 15.0 – 3874.9 – – 100.0 – 6.0 2.8 1.9 1.8 2.8 13.2 – – 16.2 – 3984.7 – – 22.5 – 6.0 2.5 2.4 2.5 3.3 13.2 – – 9.9 – 40
70.2 9.3 3.3 75.8 2.8 – .5 .7 .6 1.0 3.2 2.1 .9 3.0 1.3 41
71.0 9.3 3.4 76.3 2.5 – .5 .7 .8 1.1 3.4 2.2 .9 3.2 1.4 4255.2 8.9 1.1 65.6 7.5 – 1.2 .9 .6 1.6 5.6 3.6 .7 5.8 3.7 4363.2 3.8 – 59.3 .5 1.0 4.4 2.2 .5 4.3 9.5 3.2 – 7.4 1.3 4448.6 7.8 1.4 64.7 11.5 – 1.2 1.3 .9 2.1 9.5 3.7 .8 9.3 7.5 4542.0 19.7 2.3 82.0 .6 1.0 .8 .6 .4 1.2 11.1 7.9 1.8 10.2 .7 4686.4 61.5 – 52.9 – 1.0 1.8 .5 1.2 2.3 11.7 13.0 – 14.0 – 4796.0 .3 – 73.3 – 1.0 .7 3.1 .5 3.0 6.7 1.0 – 11.6 – 4873.6 36.1 – 100.0 – 2.0 1.1 .5 .6 1.2 15.3 13.3 – 16.6 – 4993.2 – – 31.7 – 2.0 1.4 2.5 .7 3.0 16.3 – – 16.3 – 50
73.7 7.3 2.7 69.3 – – .8 1.0 .5 1.1 5.2 2.2 .8 4.1 – 51
72.8 7.4 2.9 69.4 – – 1.0 1.2 .6 1.4 5.4 2.5 .9 4.4 – 5287.1 5.8 .5 66.7 .5 – 1.1 .6 .3 1.4 1.9 2.9 1.0 6.5 .4 5391.4 – – 55.6 – – 4.5 2.6 .8 4.9 15.5 – – 15.7 – 5489.1 3.6 .2 70.5 .6 – 1.2 1.1 .4 1.9 4.6 4.8 .6 9.3 1.5 5580.0 11.6 .1 55.2 – – 1.2 1.5 .6 2.0 11.0 10.5 .6 12.0 – 5682.4 21.4 8.5 74.5 1.6 1.0 2.1 .4 .7 1.8 10.5 6.3 5.5 10.5 .8 5775.2 17.5 2.2 75.5 – 1.0 .6 .7 .7 1.2 13.3 11.5 3.6 13.7 – 5865.8 22.8 – 54.6 – 1.0 1.6 1.3 .9 2.1 15.8 8.1 – 14.3 – 5989.6 31.0 – 66.3 – 1.0 .9 1.2 1.8 2.0 16.3 10.0 – 15.3 – 60
1992 ECONOMIC CENSUS CHARACTERISTICS OF BUSINESS OWNERS 51

Table 5d. Reason the Discontinued Business Is No Longer Operating by Legal Form of[All data are shown as percents, except firms. For meaning of abbreviations and symbols, see introductory text. For explanation of terms, see appendix A]
Type of firm and legal form of organization
If the business is no longer operating, the status of the businessat the time the decision was made to cease operations1
Firms(number) Successful Unsuccessful Not reported Not applicable2
A B C D E
All businesses 17 253 143......................... 8.7 14.1 6.8 70.41
Individual proprietorships 14 599 295....................... 8.9 15.5 7.5 68.12Partnerships 1 089 578.................................. 8.5 7.0 2.5 82.03Subchapter S corporations 1 564 270..................... 6.9 5.1 2.1 85.84
Hispanic ~owned businesses 771 708............ 6.7 16.2 9.3 67.95
Individual proprietorships 689 015....................... 7.0 17.4 10.0 65.76Partnerships 32 650.................................. 7.5 10.5 7.3 74.77Subchapter S corporations 50 042..................... 3.6 7.5 3.1 85.88
Black ~owned businesses 620 912............... 6.1 20.7 12.2 60.99
Individual proprietorships 584 256....................... 6.2 21.3 12.6 60.010Partnerships 14 727.................................. 6.3 12.0 3.6 78.011Subchapter S corporations 21 928..................... 3.0 7.8 3.8 85.412
Other minority ~owned businesses 606 426....... 5.2 14.0 6.1 74.613
Individual proprietorships 502 022....................... 5.2 16.3 6.8 71.714Partnerships 49 489.................................. 6.5 8.3 5.6 79.615Subchapter S corporations 54 915..................... 4.3 4.9 2.7 88.116
Women ~owned businesses 5 888 883............. 9.4 14.8 7.7 68.117
Individual proprietorships 5 078 077....................... 9.7 16.4 8.4 65.518Partnerships 243 651.................................. 5.9 3.7 3.4 87.019Subchapter S corporations 567 155..................... 7.4 4.7 2.7 85.220
Nonminority male ~owned businesses 10 114 456.... 8.7 13.5 6.1 71.821
Individual proprietorships 8 414 238....................... 8.8 14.8 6.8 69.622Partnerships 777 379.................................. 9.4 7.6 2.0 81.023Subchapter S corporations 922 838..................... 6.9 5.3 1.8 86.124
1Data represent percentage of firms reporting in the designated categories.2Includes businesses still in operation as of the date the respondents completed the report forms.3For explanation of relative standard errors and standard errors, see Reliability of Estimates in the introductory text.4Relative standard errors are not applicable for lines 1 through 4 since these data are the result of censuses, not surveys.
52 CHARACTERISTICS OF BUSINESS OWNERS 1992 ECONOMIC CENSUS

Organization of Firm: 1992
If the business is no longer operating because it was unsuccessful, the reasonwhy the business was unsuccessful1
Standard error of estimate3 for columnmInadequate
cash flow orlow sales
Lack of accessto businessloans/credit
Lack of accessto personalloans/credit Other reason
Notreported
Relativestandard
error ofestimate3 4
F G H I J A B C D E F G H I J
71.7 8.2 3.3 71.7 1.3 (X) .6 .6 .3 .6 2.9 1.4 .5 2.2 .4 1
70.7 8.1 3.5 73.1 1.3 (X) .7 .7 .3 .7 2.9 1.5 .5 2.5 .4 287.6 11.6 – 58.0 .7 (X) 1.7 1.8 .6 2.1 6.8 6.2 – 9.4 1.4 386.7 8.8 – 42.6 .3 (X) .9 .8 .3 1.5 2.9 3.0 – 6.2 .3 4
67.1 8.8 5.8 68.3 3.2 – .6 1.1 .9 1.2 2.7 1.6 .8 1.9 1.6 5
66.1 8.8 6.3 70.2 3.4 – .8 1.2 .9 1.4 2.9 1.8 .9 2.1 1.7 675.9 6.7 – 51.2 .9 2.0 2.0 1.9 2.1 2.9 6.5 2.5 – 11.8 2.3 782.1 9.8 – 37.8 – 1.0 .5 1.4 .7 1.7 5.2 4.2 – 7.3 – 8
63.4 15.5 8.4 69.3 4.3 – .3 .5 .5 .5 1.7 1.6 .8 1.4 .8 9
63.4 15.2 8.5 69.6 4.3 – .3 .6 .6 .6 1.6 1.6 .8 1.5 .8 1045.6 52.3 – 56.7 8.7 3.0 1.3 4.0 1.3 4.6 12.6 11.1 – 12.7 5.9 1177.3 18.6 – 54.2 – 2.0 1.0 2.0 1.0 2.3 9.6 9.6 – 12.3 – 12
67.6 6.1 6.4 75.9 2.6 – .8 .5 .6 1.1 3.2 2.2 2.1 3.1 1.2 13
66.5 6.6 7.1 77.7 3.0 – 1.1 .7 .7 1.5 3.4 2.4 2.2 3.5 1.3 1476.7 1.1 – 72.9 – 1.0 1.2 1.5 1.4 3.0 9.1 1.2 – 12.5 – 1577.9 1.8 – 45.7 – 1.0 .7 1.2 .6 1.4 4.9 .7 – 7.1 – 16
70.2 9.3 3.3 75.8 2.8 – .5 .7 .6 1.0 3.2 2.1 .9 3.0 1.3 17
69.9 9.1 3.4 76.8 2.8 – .6 .7 .7 1.1 3.2 2.1 .9 3.2 1.3 1860.0 5.6 – 64.3 4.3 1.0 1.8 .9 1.0 1.9 12.3 2.0 – 13.6 8.7 1981.1 14.6 – 47.2 .7 – 1.6 .7 .4 1.5 5.6 6.3 – 5.3 .4 20
73.7 7.3 2.7 69.3 – – .8 1.0 .5 1.1 5.2 2.2 .8 4.1 – 21
72.2 7.1 3.0 70.8 – – 1.0 1.1 .5 1.4 5.2 2.4 .9 4.1 – 2293.5 12.9 – 57.4 .1 – 2.4 2.6 .9 3.5 8.3 8.9 – 9.7 .4 2391.4 5.2 – 39.7 .2 – 1.7 1.7 .4 2.4 5.0 6.2 – 10.0 .2 24
1992 ECONOMIC CENSUS CHARACTERISTICS OF BUSINESS OWNERS 53

Table 6a. Age, Birthplace (United States), and Marital Status of Owner by Industry Division:[All data are shown as percents, except firms. For meaning of abbreviations and symbols, see introductory text. For explanation of terms, see appendix A]
Type of firm and industry division
Owner’s age as of December 31, 19921 Owner’s birthplace wasUnited States1
Firms(number) Under 25 25 to 34 35 to 44 45 to 54 55 to 64
65 andover
Notreported Yes No
Notreported
A B C D E F G H I J K
All businesses 17 253 143................................ 2.3 14.2 27.1 22.9 17.5 10.4 5.7 84.1 8.7 7.21
Agricultural services, forestry, fishing, and mining 583 253........ 3.9 12.9 30.5 19.0 17.5 9.0 7.2 82.9 7.6 9.52Construction 1 829 620......................................... 3.0 20.3 28.7 21.1 15.9 7.2 3.6 89.2 5.7 5.13Manufacturing 517 714....................................... 1.5 14.5 28.0 20.8 17.9 12.2 5.1 83.9 8.7 7.44Transportation, communications, and utilities 698 903............ 2.4 13.6 25.9 24.8 17.6 9.0 6.7 80.1 11.6 8.35Wholesale trade 538 339..................................... 1.7 10.4 26.0 26.2 16.9 12.3 6.4 82.8 8.5 8.76
Retail trade 2 478 045.......................................... 2.3 15.7 25.8 22.9 18.1 9.1 6.3 80.6 12.0 7.47Finance, insurance, and real estate 1 941 029..................... .8 6.4 19.7 25.4 23.4 17.2 7.1 85.5 6.0 8.58Services 7 784 016............................................ 2.3 15.6 29.8 22.5 15.8 9.2 4.8 84.7 9.1 6.29Industries not classified 882 224............................... 5.9 13.7 27.0 21.3 13.6 9.0 9.4 79.7 8.3 11.910
Hispanic ~owned businesses 771 708................... 2.9 18.8 27.6 24.7 14.7 5.4 5.9 47.6 44.8 7.611
Agricultural services, forestry, fishing, and mining 32 927........ 2.9 19.7 30.3 21.7 12.9 5.4 7.0 39.7 51.8 8.512Construction 97 476......................................... 1.9 24.7 27.8 21.5 12.9 5.1 6.1 48.9 43.8 7.313Manufacturing 18 461....................................... 1.9 15.4 27.5 26.1 17.2 6.2 5.8 48.4 44.1 7.514Transportation, communications, and utilities 47 797............ 3.5 21.9 28.4 22.1 14.2 2.9 7.1 39.7 52.0 8.315Wholesale trade 17 727..................................... 2.1 14.0 26.1 27.7 16.9 7.3 6.0 46.2 47.0 6.816
Retail trade 107 846.......................................... 2.5 15.4 30.2 23.9 17.0 5.3 5.7 48.1 44.5 7.317Finance, insurance, and real estate 49 231..................... 2.6 10.6 25.4 25.8 18.8 9.6 7.2 52.8 38.0 9.218Services 347 297............................................ 3.1 19.9 27.5 26.4 13.5 4.7 5.0 49.1 44.0 6.919Industries not classified 52 945............................... 5.6 19.6 22.8 21.9 14.9 6.1 9.1 39.5 50.0 10.620
Black ~owned businesses 620 912...................... 1.6 12.2 26.6 24.9 17.7 9.5 7.5 82.9 8.4 8.721
Agricultural services, forestry, fishing, and mining 10 309........ 1.8 11.0 25.2 24.9 20.3 8.8 8.0 88.6 2.9 8.522Construction 43 381......................................... .9 8.8 28.4 23.9 22.6 9.9 5.4 87.0 6.1 6.923Manufacturing 10 469....................................... .7 12.1 24.6 28.2 19.8 7.9 6.6 85.4 6.5 8.124Transportation, communications, and utilities 49 095............ 1.9 8.3 25.0 25.4 19.0 11.0 9.5 72.4 15.9 11.725Wholesale trade 7 550..................................... 1.2 13.5 33.2 25.5 14.2 6.7 5.8 81.5 10.8 7.726
Retail trade 86 840.......................................... 1.4 10.0 26.9 26.3 19.5 9.4 6.5 84.3 8.5 7.227Finance, insurance, and real estate 40 924..................... 1.3 10.0 24.2 30.1 18.6 8.8 7.1 84.3 6.5 9.128Services 332 981............................................ 1.8 14.4 26.7 23.9 16.5 9.2 7.6 83.5 8.1 8.529Industries not classified 39 363............................... 1.5 9.7 27.7 24.5 15.4 11.8 9.6 80.1 8.4 11.530
Other minority ~owned businesses 606 426.............. 2.9 13.8 30.5 26.0 14.4 6.1 6.4 29.8 63.2 7.031
Agricultural services, forestry, fishing, and mining 15 218........ 4.1 11.6 24.3 19.4 14.2 17.7 8.7 52.9 36.6 10.432Construction 28 295......................................... .6 12.8 36.8 26.7 12.3 5.0 5.8 53.0 40.3 6.733Manufacturing 18 976....................................... 2.7 16.5 35.7 20.6 14.0 5.1 5.5 36.4 58.1 5.434Transportation, communications, and utilities 24 362............ 3.6 18.4 34.6 25.0 9.2 2.8 6.3 24.6 68.1 7.335Wholesale trade 20 043..................................... 2.7 17.2 31.3 26.2 11.7 4.5 6.4 34.4 59.4 6.236
Retail trade 132 483.......................................... 3.4 16.9 32.8 24.4 12.5 4.4 5.6 17.4 75.9 6.737Finance, insurance, and real estate 64 762..................... 2.0 6.2 21.4 25.4 21.8 11.6 11.7 40.0 48.7 11.338Services 273 774............................................ 3.1 14.0 31.6 28.1 13.7 4.6 4.9 29.0 65.2 5.839Industries not classified 28 512............................... 3.5 19.8 30.3 24.6 10.4 8.3 3.2 19.7 76.2 4.140
Women ~owned businesses 5 888 883.................... 2.7 14.8 26.9 21.9 17.7 9.5 6.5 84.0 8.0 8.041
Agricultural services, forestry, fishing, and mining 119 731........ 4.8 12.2 25.0 22.1 14.5 13.4 7.9 85.6 5.2 9.242Construction 183 695......................................... .7 15.7 31.2 23.1 16.1 6.1 7.2 86.5 5.6 7.943Manufacturing 152 346....................................... 1.2 13.4 29.7 22.2 17.8 10.7 4.9 84.4 9.6 6.044Transportation, communications, and utilities 141 623............ 1.2 14.4 25.8 24.1 19.2 9.1 6.2 84.8 8.0 7.245Wholesale trade 154 542..................................... 2.4 7.3 23.0 29.9 18.0 12.0 7.4 80.3 9.6 10.046
Retail trade 1 093 342.......................................... 2.8 15.1 25.4 21.4 19.0 9.5 6.7 83.7 8.9 7.447Finance, insurance, and real estate 602 802..................... .9 8.3 19.0 23.3 25.0 14.2 9.2 81.9 6.3 11.848Services 3 158 444............................................ 3.3 17.4 29.7 21.0 15.3 8.0 5.4 84.9 8.1 7.049Industries not classified 282 358............................... 4.4 12.1 25.6 20.9 17.6 9.5 9.9 80.5 8.0 11.450
Nonminority male ~owned businesses 10 114 456........... 2.0 13.6 27.0 23.2 17.7 11.4 5.1 88.6 4.7 6.751
Agricultural services, forestry, fishing, and mining 412 917........ 3.7 12.7 32.5 17.7 18.8 7.8 6.8 86.0 4.4 9.652Construction 1 496 056......................................... 3.5 21.1 28.3 20.6 16.1 7.5 2.9 92.8 2.7 4.553Manufacturing 333 485....................................... 1.6 14.8 27.0 19.9 18.1 13.4 5.2 86.6 5.2 8.254Transportation, communications, and utilities 458 400............ 2.7 12.7 25.3 25.4 17.7 9.7 6.5 85.7 5.9 8.555Wholesale trade 352 721..................................... 1.3 11.3 27.0 24.6 16.7 13.0 6.1 87.0 4.7 8.456
Retail trade 1 197 943.......................................... 1.7 16.1 25.5 23.7 17.8 9.3 5.9 85.1 7.6 7.357Finance, insurance, and real estate 1 240 594..................... .6 5.6 19.7 26.3 22.9 18.9 6.1 89.9 3.2 6.958Services 4 102 294............................................ 1.5 14.2 29.9 23.2 16.4 10.5 4.3 89.1 5.3 5.759Industries not classified 520 046............................... 7.1 14.2 27.9 21.4 11.2 8.9 9.3 84.9 2.5 12.660
1Data represent percentage of owners reporting in the designated categories.2For explanation of relative standard errors and standard errors, see Reliability of Estimates in the introductory text.3Relative standard errors are not applicable for lines 1 through 10 since these data are the result of censuses, not surveys.
54 CHARACTERISTICS OF BUSINESS OWNERS 1992 ECONOMIC CENSUS

1992
Owner’s marital status as of December 31, 19921
Standard error of estimate2 for columnmNever
married MarriedDivorced/separated Widowed
Notreported
Relativestandard
error ofestimate2 3
L M N O P A B C D E F G H I J K L M N O P
8.9 69.6 8.5 2.5 10.4 (X) .2 .6 .5 .7 .5 .6 .3 .4 .4 .4 .4 .4 .5 .2 .3 1
9.9 68.1 8.8 1.8 11.5 (X) 1.2 1.3 2.1 1.4 1.6 1.4 1.3 1.7 .9 1.5 1.3 2.1 2.2 .4 1.2 29.6 74.8 7.3 1.3 7.1 (X) .7 1.3 1.8 1.3 2.3 1.6 .9 1.2 .9 1.2 1.8 2.0 1.2 .6 1.0 37.0 73.9 7.6 2.1 9.4 (X) .6 1.5 1.9 1.1 1.5 1.3 .6 1.5 1.1 1.1 .9 1.5 1.0 .4 .7 47.6 68.7 10.8 1.0 12.0 (X) .9 1.6 1.9 2.2 1.5 1.4 1.1 1.7 1.3 .9 .7 1.6 1.3 .3 1.1 56.1 74.2 8.1 2.0 9.6 (X) .4 .8 1.7 1.2 1.3 1.1 .6 .8 .7 .6 .7 1.9 1.0 .7 1.2 6
7.8 70.4 7.7 2.6 11.5 (X) .5 1.4 1.3 1.1 .7 .8 .8 1.2 1.1 .8 .9 1.6 .8 .4 .9 75.9 72.9 6.7 4.0 10.6 (X) .3 1.2 1.6 1.6 1.6 2.1 .9 1.0 .7 1.0 1.2 1.8 .9 .6 1.3 8
10.4 67.4 9.8 2.3 10.1 (X) .5 .9 .8 1.0 .7 .5 .5 .7 .6 .4 .8 .9 1.0 .3 .7 911.8 59.4 8.2 3.8 16.8 (X) 1.6 1.2 2.9 1.8 1.2 1.4 2.1 2.4 .5 2.3 1.8 2.6 1.1 1.2 3.0 10
11.7 65.1 8.5 1.4 13.3 – .5 .5 .7 .6 .5 .3 .4 .6 .6 .5 .9 1.0 .4 .2 .5 11
8.9 68.4 6.4 1.3 15.0 1.0 1.0 2.3 2.4 3.4 2.4 1.1 2.3 3.1 2.8 2.1 1.2 2.9 1.3 .8 1.9 128.3 72.0 6.5 1.0 12.2 1.0 .6 2.7 1.7 1.6 2.1 1.3 .9 1.5 1.9 1.1 1.7 2.3 1.3 .5 1.1 138.0 71.3 7.4 .9 12.3 1.0 .7 2.7 2.4 1.6 1.7 .9 .8 1.9 2.2 1.2 1.5 2.6 1.0 .4 1.3 14
12.1 65.6 7.7 .8 13.9 1.0 .9 2.1 2.8 2.8 2.2 .8 1.3 1.6 1.7 1.4 2.4 2.2 1.5 .5 1.8 157.1 75.2 7.5 .6 9.6 2.0 .6 1.5 2.7 2.9 1.3 1.1 .9 2.2 2.7 1.2 1.1 1.8 1.1 .2 1.3 16
11.0 65.8 7.2 2.0 14.0 1.0 .8 1.7 2.3 1.8 1.6 1.2 1.0 2.0 2.6 1.2 1.9 2.5 1.1 .6 1.1 178.4 67.0 10.5 2.5 11.6 1.0 .8 1.4 2.0 1.4 1.3 1.4 1.0 2.4 2.1 1.0 1.8 2.1 1.1 .8 1.2 18
13.6 62.4 9.4 1.2 13.4 – .8 1.5 .7 1.7 1.3 .5 .6 1.2 1.0 .6 1.5 1.7 1.2 .5 .9 1916.9 56.3 9.5 1.7 15.8 1.0 1.9 1.6 3.4 2.8 2.1 2.2 1.8 2.1 2.2 2.1 2.8 2.5 1.6 .9 2.3 20
10.5 55.1 14.0 4.0 16.3 – .2 .2 .7 .8 .9 .5 .5 .7 .5 .4 .5 .4 .8 .3 .8 21
6.7 67.1 9.5 1.0 15.8 1.0 .5 1.8 2.1 1.9 2.1 1.1 .9 1.4 .9 1.1 1.1 1.7 1.1 .4 1.7 225.1 67.0 10.2 2.1 15.7 – .4 1.7 1.7 1.8 1.3 1.7 1.0 1.6 .8 1.4 1.1 2.2 1.3 .6 1.0 239.9 61.7 11.9 2.3 14.3 1.0 .4 1.2 1.9 1.7 1.6 1.0 .8 1.7 1.3 1.2 1.1 2.5 1.7 .5 1.3 249.3 55.7 12.5 1.5 21.1 – .6 1.0 1.9 1.3 1.4 2.0 1.4 1.2 1.0 1.5 1.2 1.3 1.5 .9 1.2 258.9 62.9 12.1 1.2 14.9 2.0 .6 1.1 2.1 1.7 1.4 1.2 1.8 2.4 .9 1.9 1.1 3.3 1.9 .4 1.8 26
7.9 55.5 15.3 5.0 16.3 – .4 1.1 2.3 2.1 1.5 1.2 .8 .8 .7 .8 1.1 2.6 1.5 .8 2.0 275.6 60.4 14.8 3.8 15.3 1.0 .7 1.2 1.4 2.2 1.4 1.0 1.2 1.7 1.0 .9 1.0 2.5 1.8 .7 1.9 28
12.6 52.6 14.9 4.6 15.3 – .3 .6 .8 1.1 1.2 .9 .9 1.3 .9 .8 .9 1.3 1.3 .6 1.2 2912.4 50.9 11.5 4.2 21.0 – .6 1.0 2.0 2.4 1.6 1.2 1.7 1.9 1.1 1.7 1.2 2.5 2.4 1.5 2.3 30
9.9 71.6 5.4 1.6 11.5 – .4 1.1 1.3 1.0 .9 .4 .7 1.3 1.5 .6 .6 1.1 .3 .3 .9 31
15.2 63.8 4.2 2.1 14.7 1.0 1.4 2.2 3.2 3.5 2.2 2.2 1.5 3.0 3.4 2.0 1.7 3.1 1.8 1.0 3.1 325.4 72.8 7.7 .1 14.0 1.0 .2 2.1 3.5 2.9 2.2 1.9 1.4 2.7 3.0 .9 1.3 3.0 1.6 .1 1.7 33
10.8 71.9 6.3 .4 10.5 1.0 1.3 2.5 2.6 1.5 2.5 1.0 1.2 5.3 4.7 1.3 2.5 3.3 1.9 .1 3.0 346.5 73.3 5.9 .9 13.4 1.0 1.6 3.3 1.7 3.5 2.6 1.0 1.3 3.3 3.4 1.2 1.7 3.3 2.1 .4 1.9 359.6 73.9 6.6 .9 9.0 1.0 .8 2.9 2.9 2.8 2.0 1.0 2.1 2.7 3.0 1.3 1.8 3.1 1.5 .3 1.2 36
9.5 74.2 5.9 .8 9.6 1.0 .7 2.0 1.7 1.6 1.3 1.0 .7 1.8 1.6 .8 1.3 1.6 .6 .2 1.5 378.1 70.4 4.1 2.6 14.7 1.0 .8 1.5 2.4 2.4 4.0 1.7 2.3 3.7 4.5 2.3 2.1 3.6 .9 1.0 2.2 38
11.0 70.3 5.5 1.9 11.4 – .6 2.2 2.4 1.9 1.4 .6 .7 1.9 1.9 .6 1.5 2.3 .6 .7 1.3 3913.2 74.7 2.7 2.4 7.1 1.0 1.5 1.7 3.0 3.9 2.8 2.0 1.0 2.1 1.8 1.1 2.4 3.6 1.0 .8 1.6 40
8.5 64.2 11.5 4.6 11.1 – .3 .9 .8 .8 .8 .7 .4 .6 .4 .3 .6 .7 .9 .3 .4 41
9.2 60.0 10.7 7.5 12.6 – 2.0 2.1 2.5 2.5 1.4 2.3 1.7 2.5 1.1 2.3 1.8 3.2 1.7 2.2 2.1 422.1 82.3 4.1 1.6 9.9 – .5 1.8 2.1 2.1 2.3 1.6 1.6 1.7 .7 1.7 .9 1.5 .7 .5 2.0 435.8 73.2 10.2 3.0 7.8 – .5 2.3 1.4 1.4 1.3 1.5 .9 1.6 1.1 1.1 .9 1.9 1.3 .7 .8 448.3 70.7 11.0 1.9 8.1 – .9 2.0 1.6 2.1 2.4 2.1 1.1 2.6 2.0 1.1 2.0 2.3 1.6 .7 1.1 455.6 74.1 6.6 3.8 9.9 – .6 1.0 1.7 1.9 1.6 1.3 1.1 1.8 1.0 1.0 .9 1.6 .6 .8 1.0 46
6.0 68.4 8.5 4.7 12.5 – 1.2 2.2 2.0 1.5 1.4 1.3 .9 1.6 1.0 .7 1.3 1.7 1.3 .5 1.2 474.9 66.1 9.9 6.3 12.7 – .6 1.5 1.7 1.6 2.5 1.9 1.4 1.4 1.4 1.8 1.2 2.3 2.1 1.0 2.1 48
11.0 60.6 13.8 4.3 10.3 – .7 1.0 1.0 1.6 1.3 .8 .7 1.1 .7 .6 1.2 1.2 1.3 .6 .7 4910.9 52.2 15.3 6.4 15.2 – 1.0 1.7 3.2 1.5 2.9 1.5 1.9 2.0 1.5 2.0 2.0 4.0 1.9 1.7 2.8 50
8.9 72.6 7.2 1.6 9.7 – .3 .8 .9 .9 1.1 1.0 .6 .5 .6 .6 .6 .8 .5 .3 .6 51
10.1 70.7 8.5 .1 10.6 – 1.5 1.5 3.3 1.9 2.3 1.8 1.8 2.1 1.2 1.9 1.6 3.3 2.7 – 1.7 5210.8 74.2 7.6 1.3 6.0 – 1.0 1.4 2.4 1.4 2.7 1.9 1.1 1.5 1.0 1.5 2.4 2.6 1.4 .7 1.2 53
7.3 74.4 6.5 1.8 9.9 – 1.0 1.7 2.6 1.3 2.2 1.7 .9 2.1 1.4 1.8 1.2 2.3 1.2 .6 1.2 546.9 68.9 11.3 .8 12.1 – 1.1 2.1 2.6 3.2 2.1 1.9 1.4 2.1 1.8 1.1 1.5 2.4 1.7 .4 1.4 556.1 74.3 8.8 1.3 9.5 – .5 1.2 2.6 1.5 1.6 1.3 .9 1.1 .9 .9 1.1 2.7 1.5 .8 1.6 56
9.0 72.2 7.3 1.1 10.4 – .5 2.6 2.5 2.1 1.6 1.7 1.5 1.7 2.0 1.4 1.2 3.1 1.5 .5 2.0 576.2 75.7 5.4 3.3 9.5 – .3 1.4 2.6 2.5 2.7 3.4 1.0 1.2 .7 1.1 1.6 2.9 .8 .8 1.4 589.7 72.2 7.5 1.1 9.6 – .5 1.4 1.3 1.3 1.4 1.2 .8 1.2 1.2 .7 1.3 1.2 1.2 .5 1.0 59
12.1 62.6 4.7 2.7 17.9 – 2.7 1.8 4.6 3.3 1.7 2.2 2.9 3.4 .9 3.1 2.9 3.2 1.4 1.6 4.4 60
1992 ECONOMIC CENSUS CHARACTERISTICS OF BUSINESS OWNERS 55

Table 6b. Age, Birthplace (United States), and Marital Status of Owner by Receipts Size of Firm:[All data are shown as percents, except firms. For meaning of abbreviations and symbols, see introductory text. For explanation of terms, see appendix A]
Type of firm and receipts size
Owner’s age as of December 31, 19921 Owner’s birthplace wasUnited States1
Firms(number) Under 25 25 to 34 35 to 44 45 to 54 55 to 64
65 andover
Notreported Yes No
Notreported
A B C D E F G H I J K
All businesses 17 253 143................................ 2.3 14.2 27.1 22.9 17.5 10.4 5.7 84.1 8.7 7.21
Less than $5,000 5 226 553.................................... 4.7 15.9 27.0 20.6 14.2 11.8 5.8 86.3 6.3 7.42$5,000 to $9,999 2 443 946..................................... 3.3 18.6 22.9 19.7 17.7 10.7 7.0 82.3 8.2 9.53$10,000 to $24,999 3 076 410................................... 1.7 16.5 26.9 20.5 20.6 10.3 3.5 86.0 8.8 5.24$25,000 to $49,999 1 945 806................................... .6 14.2 26.1 24.8 19.9 9.5 4.9 84.4 9.8 5.85$50,000 to $99,999 1 615 940................................... .8 11.3 30.0 24.7 18.0 10.5 4.8 82.8 11.2 6.16
$100,000 to $199,999 1 197 996................................ .7 11.4 28.9 28.5 18.0 7.5 5.1 82.5 10.4 7.17$200,000 to $249,999 301 794................................ .2 7.4 31.8 25.5 16.9 13.2 4.9 84.9 8.2 6.98$250,000 to $499,999 682 583................................ .9 9.9 30.4 24.8 17.1 8.8 8.0 79.5 11.5 9.09$500,000 to $999,999 372 078................................ 1.2 8.7 28.0 26.3 17.5 9.2 9.1 82.2 8.7 9.110$1,000,000 or more 390 037.................................. 1.3 8.4 24.8 27.2 17.6 11.3 9.3 82.0 8.3 9.711
Hispanic ~owned businesses 771 708................... 2.9 18.8 27.6 24.7 14.7 5.4 5.9 47.6 44.8 7.612
Less than $5,000 219 226.................................... 5.3 24.2 25.6 20.2 13.4 4.8 6.5 49.9 41.2 8.913$5,000 to $9,999 140 362..................................... 3.7 19.0 26.2 22.0 13.8 8.1 7.3 40.7 49.7 9.614$10,000 to $24,999 165 667................................... 2.8 19.9 29.1 23.2 15.6 5.6 3.8 44.1 51.1 4.815$25,000 to $49,999 87 288................................... 2.2 18.8 27.2 27.5 14.8 4.8 4.7 45.5 49.0 5.516$50,000 to $99,999 64 742................................... 1.0 15.9 28.0 31.5 14.0 3.7 5.9 52.5 39.3 8.217
$100,000 to $199,999 41 578................................ 2.1 14.7 30.7 27.2 16.1 4.2 5.1 50.7 42.3 7.018$200,000 to $249,999 10 030................................ 1.2 11.1 31.6 24.6 17.3 6.8 7.4 55.7 36.7 7.619$250,000 to $499,999 22 301................................ .5 13.8 31.9 25.4 15.8 5.7 7.0 52.4 39.2 8.420$500,000 to $999,999 11 319................................ 1.8 13.8 24.5 29.4 14.2 4.9 11.5 50.4 36.7 12.921$1,000,000 or more 9 194.................................. 1.4 11.4 24.3 31.2 17.0 6.7 8.0 52.6 39.2 8.222
Black ~owned businesses 620 912...................... 1.6 12.2 26.6 24.9 17.7 9.5 7.5 82.9 8.4 8.723
Less than $5,000 236 722.................................... 2.7 14.6 27.0 21.1 15.3 9.9 9.3 84.0 5.8 10.224$5,000 to $9,999 111 512..................................... 1.2 13.2 24.5 24.6 17.2 10.9 8.4 81.8 8.7 9.525$10,000 to $24,999 129 901................................... .9 10.9 26.7 26.2 19.2 9.6 6.5 82.4 10.4 7.326$25,000 to $49,999 62 209................................... 1.3 9.8 28.7 26.3 21.9 8.2 3.9 80.3 13.4 6.327$50,000 to $99,999 39 218................................... .3 9.4 27.2 32.3 18.6 7.3 4.9 85.7 7.4 6.928
$100,000 to $199,999 20 936................................ .7 8.4 23.9 32.9 20.5 6.8 6.8 82.5 9.4 8.129$200,000 to $249,999 4 533................................ – 11.4 32.1 26.5 18.6 8.1 3.3 83.8 13.0 3.230$250,000 to $499,999 9 029................................ .8 7.0 31.5 29.9 15.7 8.0 7.2 83.8 8.4 7.831$500,000 to $999,999 3 823................................ – 7.4 22.6 27.4 22.1 11.2 9.3 83.1 7.8 9.132$1,000,000 or more 3 028.................................. 2.0 8.7 25.1 29.2 16.3 6.5 12.3 80.6 7.2 12.233
Other minority ~owned businesses 606 426.............. 2.9 13.8 30.5 26.0 14.4 6.1 6.4 29.8 63.2 7.034
Less than $5,000 132 493.................................... 9.1 16.9 29.2 18.3 18.6 4.6 3.3 39.4 57.3 3.335$5,000 to $9,999 80 435..................................... 2.6 19.6 27.0 22.4 13.9 9.0 5.5 29.8 64.4 5.836$10,000 to $24,999 108 195................................... 2.4 15.2 34.3 23.4 13.5 5.1 6.1 29.6 62.2 8.237$25,000 to $49,999 77 345................................... 2.1 11.2 29.0 31.2 13.6 5.8 7.1 27.2 65.8 7.038$50,000 to $99,999 70 360................................... .8 14.0 28.8 27.4 15.3 8.4 5.3 26.3 67.8 5.939
$100,000 to $199,999 58 620................................ 2.0 13.0 28.6 29.4 12.4 6.4 8.2 21.7 68.3 10.040$200,000 to $249,999 15 740................................ .1 16.1 32.5 27.7 10.2 5.3 8.1 32.2 58.5 9.341$250,000 to $499,999 34 266................................ 1.2 9.1 37.7 27.1 15.0 4.1 5.8 26.3 67.8 5.942$500,000 to $999,999 16 467................................ .9 10.4 30.3 33.2 11.5 5.2 8.7 30.8 60.0 9.143$1,000,000 or more 12 505.................................. 1.5 8.4 30.2 28.3 12.6 6.9 12.1 38.4 49.1 12.544
Women ~owned businesses 5 888 883.................... 2.7 14.8 26.9 21.9 17.7 9.5 6.5 84.0 8.0 8.045
Less than $5,000 2 310 303.................................... 4.1 18.3 26.2 19.6 14.5 10.8 6.5 85.6 6.1 8.346$5,000 to $9,999 967 380..................................... 4.1 20.3 23.8 21.0 17.4 7.3 6.1 82.9 9.1 8.147$10,000 to $24,999 1 051 358................................... 2.1 14.0 29.9 19.6 19.8 9.4 5.2 87.0 7.3 5.748$25,000 to $49,999 538 885................................... 1.5 9.2 26.1 23.2 25.5 8.8 5.8 82.9 8.7 8.549$50,000 to $99,999 381 517................................... 1.2 9.7 28.3 26.5 15.7 10.1 8.5 80.5 9.4 10.250
$100,000 to $199,999 267 089................................ .4 10.7 29.0 27.4 19.5 7.6 5.3 81.4 11.1 7.551$200,000 to $249,999 66 464................................ .3 7.4 28.7 25.7 21.0 10.0 6.9 80.9 11.2 7.952$250,000 to $499,999 146 313................................ .8 11.4 28.5 26.2 15.9 8.8 8.4 80.1 11.2 8.753$500,000 to $999,999 80 539................................ .9 7.7 27.0 28.2 17.8 7.3 11.1 80.6 8.6 10.854$1,000,000 or more 79 037.................................. 2.4 8.7 24.4 24.8 17.2 12.2 10.3 80.8 8.3 10.955
Nonminority male ~owned businesses 10 114 456........... 2.0 13.6 27.0 23.2 17.7 11.4 5.1 88.6 4.7 6.756
Less than $5,000 2 608 047.................................... 5.1 13.7 27.8 21.6 13.8 13.0 5.0 89.9 3.4 6.657$5,000 to $9,999 1 285 456..................................... 2.8 17.4 21.8 18.7 18.4 13.3 7.5 86.4 3.0 10.658$10,000 to $24,999 1 763 830................................... 1.3 18.2 24.6 20.7 21.7 11.6 1.9 90.9 4.4 4.759$25,000 to $49,999 1 248 482................................... – 16.2 25.6 25.2 18.3 10.4 4.4 90.1 5.3 4.660$50,000 to $99,999 1 108 065................................... .6 11.6 30.7 23.1 19.3 11.3 3.4 88.2 7.2 4.661
$100,000 to $199,999 840 723................................ .7 11.4 28.8 28.7 17.8 7.6 5.0 88.1 5.0 6.962$200,000 to $249,999 212 693................................ .2 6.2 33.2 25.3 15.7 15.3 4.0 92.0 1.4 6.663$250,000 to $499,999 488 462................................ 1.0 9.3 30.4 24.1 17.8 9.2 8.2 84.2 6.3 9.564$500,000 to $999,999 266 408................................ 1.2 8.6 28.4 25.5 17.8 10.2 8.3 87.0 4.7 8.365$1,000,000 or more 292 290.................................. 1.1 8.2 24.8 27.7 17.9 11.4 8.9 84.9 5.8 9.366
1Data represent percentage of owners reporting in the designated categories.2For explanation of relative standard errors and standard errors, see Reliability of Estimates in the introductory text.3Relative standard errors are not applicable for lines 1 through 11 since these data are the result of censuses, not surveys.
56 CHARACTERISTICS OF BUSINESS OWNERS 1992 ECONOMIC CENSUS

1992
Owner’s marital status as of December 31, 19921
Standard error of estimate2 for columnmNever
married MarriedDivorced/separated Widowed
Notreported
Relativestandard
error ofestimate2 3
L M N O P A B C D E F G H I J K L M N O P
8.9 69.6 8.5 2.5 10.4 (X) .2 .6 .5 .7 .5 .6 .3 .4 .4 .4 .4 .4 .5 .2 .3 1
11.0 66.3 7.6 3.0 12.0 (X) .4 1.8 1.3 1.5 1.0 1.4 .5 .8 .6 .7 .7 .9 .8 .5 1.2 213.0 63.0 10.4 2.4 11.2 (X) .8 1.9 1.6 1.8 2.0 1.5 1.4 1.6 1.5 1.6 1.0 1.9 1.7 .4 1.5 3
9.2 67.4 11.4 3.6 8.5 (X) .6 1.0 1.6 2.1 1.4 1.0 .6 1.1 .9 .7 1.4 2.6 1.4 .9 .9 46.2 70.8 9.4 2.4 11.2 (X) .3 1.7 2.4 2.2 .9 1.7 1.3 1.5 1.0 1.1 1.4 1.4 .9 .9 1.7 58.1 73.2 7.7 1.5 9.5 (X) .2 1.3 1.9 1.9 1.7 1.5 1.1 1.1 .8 1.3 1.0 1.3 1.0 .4 1.2 6
7.0 74.1 7.8 2.1 9.0 (X) .2 .9 1.1 1.4 .8 .8 .6 .9 .7 .8 .8 1.4 .7 .5 1.0 76.2 80.5 5.4 1.4 6.5 (X) .1 1.1 3.9 1.8 2.2 4.0 1.0 2.2 1.0 2.1 1.7 2.8 1.4 .4 1.0 85.5 75.9 5.9 1.9 10.7 (X) .2 .8 1.6 .9 1.1 .7 1.2 1.1 1.0 1.2 .4 1.0 .5 .3 1.1 95.6 76.1 6.7 1.6 10.0 (X) .2 .9 1.1 1.0 1.3 .9 .6 .8 .5 .7 .5 1.0 .5 .2 .4 105.2 76.9 6.3 1.6 10.0 (X) .1 .3 .6 .6 .4 .4 .4 .5 .4 .4 .3 .5 .4 .1 .4 11
11.7 65.1 8.5 1.4 13.3 – .5 .5 .7 .6 .5 .3 .4 .6 .6 .5 .9 1.0 .4 .2 .5 12
17.8 59.0 6.4 1.1 15.6 1.0 1.5 1.8 2.4 1.9 1.6 .7 1.1 1.9 2.2 1.4 2.6 2.3 .9 .5 1.7 1316.3 54.6 11.7 2.9 14.6 1.0 1.2 1.3 2.0 2.2 1.6 1.1 1.3 3.0 3.5 1.5 2.9 2.4 1.8 .8 1.5 1410.7 64.3 9.3 1.4 14.3 1.0 .8 3.5 1.7 2.8 1.6 1.5 1.1 1.5 1.5 1.1 1.6 2.1 .9 .4 1.5 15
9.6 67.7 8.0 1.4 13.3 1.0 1.3 2.4 2.3 3.0 2.2 1.5 1.5 3.2 3.4 1.3 1.4 1.8 1.5 .8 2.5 167.5 71.2 9.6 .8 10.8 1.0 .3 1.9 2.3 2.8 1.8 .8 1.4 2.4 2.6 1.2 1.3 1.9 1.7 .4 1.5 17
8.3 71.7 8.7 .6 10.7 1.0 .6 1.5 1.5 2.2 1.5 .5 1.3 1.7 2.3 1.5 1.3 2.2 1.1 .2 1.5 185.2 77.5 4.8 2.3 10.2 3.0 .8 2.5 3.5 3.6 2.7 1.8 1.4 2.5 3.4 1.3 1.8 3.1 1.9 .7 2.5 197.1 74.6 8.4 .8 9.0 2.0 .2 1.5 1.8 1.2 1.5 .8 .8 1.8 1.7 .7 .9 1.4 .9 .3 .8 206.2 72.8 7.0 .6 13.3 3.0 .9 2.3 1.4 2.7 2.2 .9 1.9 1.9 1.8 1.9 1.5 1.5 1.1 .1 1.6 214.9 78.8 6.0 1.6 8.7 2.0 .3 1.3 1.2 1.5 1.2 .8 .5 2.2 1.9 .8 .4 1.2 .7 .3 .8 22
10.5 55.1 14.0 4.0 16.3 – .2 .2 .7 .8 .9 .5 .5 .7 .5 .4 .5 .4 .8 .3 .8 23
13.4 49.1 15.1 4.8 17.6 – .4 .9 1.2 1.3 1.3 .8 .9 1.1 .6 .9 .9 1.8 .7 .8 1.3 249.6 55.1 15.1 3.5 16.7 – .3 .9 1.8 1.3 1.1 .7 1.0 1.3 .9 .8 .9 1.0 1.6 .4 1.2 259.6 55.6 14.8 4.0 16.1 – .3 1.2 1.9 1.2 1.9 .9 .8 1.5 1.0 .9 1.5 2.0 1.3 .7 1.3 269.2 62.1 10.8 3.3 14.6 – .4 1.0 1.7 2.1 2.1 1.5 .8 3.0 2.9 .6 1.3 2.9 1.6 .8 1.7 278.4 59.5 12.9 3.9 15.3 1.0 .1 1.3 1.6 2.1 1.6 .6 1.0 1.2 1.1 1.0 1.4 2.8 1.9 .8 .7 28
5.7 66.0 10.9 3.3 14.1 1.0 .4 1.2 1.7 2.0 2.0 .4 1.4 2.1 1.9 1.8 .8 1.9 1.2 .7 1.4 295.7 77.6 7.0 3.3 6.4 3.0 – 2.6 6.2 4.9 1.5 2.1 1.2 2.9 2.4 .9 1.6 3.5 2.3 2.2 1.5 307.9 66.9 9.5 2.8 12.9 3.0 .5 1.3 2.2 1.3 1.4 1.2 .7 2.2 1.6 1.3 2.0 2.4 1.5 .5 1.4 315.6 72.1 9.2 2.7 10.5 4.0 – 2.8 2.4 3.9 1.7 1.9 2.1 2.3 1.7 2.1 1.4 3.4 2.3 .8 2.2 326.7 68.0 9.6 2.4 13.3 4.0 .9 1.4 2.4 2.4 1.8 1.3 1.4 2.5 2.2 1.4 1.1 2.4 1.8 .5 1.5 33
9.9 71.6 5.4 1.6 11.5 – .4 1.1 1.3 1.0 .9 .4 .7 1.3 1.5 .6 .6 1.1 .3 .3 .9 34
17.2 64.5 7.6 2.0 8.7 1.0 2.5 2.7 2.2 3.6 3.6 1.2 1.5 2.4 3.2 1.6 3.4 2.6 1.6 1.2 1.5 3511.9 67.5 3.9 3.4 13.2 1.0 1.1 4.0 4.6 3.6 3.6 1.7 2.1 6.3 5.7 2.0 2.0 2.6 1.5 2.2 2.2 3611.3 62.8 7.4 2.4 16.0 1.0 1.3 4.2 3.9 1.6 3.6 1.3 2.2 3.1 3.4 2.2 2.8 4.2 1.6 1.1 2.2 37
8.2 74.4 4.6 .3 12.5 1.0 1.5 2.4 1.7 4.7 2.6 1.8 2.1 3.7 4.8 2.1 3.0 4.6 1.1 .2 3.0 388.7 74.6 5.5 1.1 10.1 1.0 .4 1.7 1.5 1.5 1.0 1.6 1.3 3.3 4.1 1.4 2.1 2.2 1.6 .4 1.1 39
7.7 75.1 4.8 1.4 11.1 1.0 .5 .5 1.6 2.4 .8 1.9 1.4 2.1 2.4 1.4 .6 1.8 .9 .4 1.3 405.2 74.6 4.0 1.8 14.5 2.0 .1 3.4 4.4 4.2 1.8 2.0 1.5 3.8 3.4 1.1 1.8 3.2 1.4 .8 2.4 416.0 81.6 3.6 .7 8.1 1.0 .3 .7 1.7 1.3 .9 .7 .5 1.6 1.7 .4 .7 1.0 .5 .2 .5 424.5 78.6 4.7 1.1 11.1 2.0 .3 1.7 1.5 1.4 1.1 .9 1.7 2.2 2.8 1.8 .7 1.9 1.2 .3 1.9 437.2 74.1 4.5 1.2 12.9 2.0 .3 1.1 1.3 1.0 1.1 1.1 1.1 2.2 2.3 .8 .6 1.0 .5 .4 .8 44
8.5 64.2 11.5 4.6 11.1 – .3 .9 .8 .8 .8 .7 .4 .6 .4 .3 .6 .7 .9 .3 .4 45
9.6 61.8 10.7 5.3 12.6 – .7 2.3 1.4 1.7 .7 1.4 .9 1.3 .6 1.0 .6 2.2 1.2 .8 1.3 4612.4 57.6 15.0 3.9 11.1 – 1.3 3.1 2.4 1.8 1.6 1.1 1.6 2.3 2.6 1.5 2.4 2.8 2.4 .6 1.4 47
9.4 63.3 12.7 5.1 9.5 – 1.1 1.3 2.6 2.4 2.3 1.5 1.0 1.4 .9 1.0 1.7 3.6 2.4 .9 1.4 483.7 65.5 14.8 4.1 12.0 – 1.1 1.7 3.1 2.3 3.7 2.1 1.7 1.9 1.9 1.4 2.0 2.8 2.7 1.6 1.7 497.7 66.8 10.2 3.2 12.2 – .5 1.6 3.1 2.1 .9 2.3 1.7 2.0 1.0 1.8 .9 1.6 1.4 .8 1.7 50
6.4 70.8 9.9 5.5 7.5 – .1 1.2 2.1 1.3 1.7 .6 1.1 1.6 1.3 1.5 1.3 2.1 1.2 1.3 1.2 511.9 78.8 7.3 4.3 7.7 1.0 .2 2.4 4.1 3.7 3.5 2.8 1.2 1.6 1.6 1.5 .4 2.0 1.8 1.2 1.2 524.7 74.3 7.1 4.4 9.5 1.0 .2 1.1 1.3 1.5 1.0 .8 .3 1.4 1.1 .4 .5 1.4 .8 .7 .4 534.7 76.3 5.4 2.3 11.3 1.0 .2 .7 1.8 1.8 1.5 .8 1.1 1.4 .9 1.1 .9 1.6 .8 .3 1.0 546.2 74.6 5.1 3.8 10.3 1.0 .3 .6 .6 .9 .8 .9 .6 .7 .8 .5 .6 .8 .4 .2 .6 55
8.9 72.6 7.2 1.6 9.7 – .3 .8 .9 .9 1.1 1.0 .6 .5 .6 .6 .6 .8 .5 .3 .6 56
11.5 70.3 5.3 1.4 11.4 – .6 2.4 2.6 2.4 2.2 2.5 1.1 1.4 1.0 1.1 1.0 1.9 1.0 .4 1.8 5713.6 66.7 7.6 1.6 10.6 – 1.5 2.2 3.1 3.2 3.4 3.0 2.0 2.2 1.3 2.3 1.7 3.1 2.3 .8 2.2 58
8.7 70.6 11.1 3.0 6.7 – .5 1.7 2.6 2.5 2.6 1.9 .8 1.6 1.6 1.1 2.1 4.0 2.5 1.3 1.4 596.7 73.1 7.6 1.9 10.7 – – 2.7 3.4 3.0 1.9 2.8 1.5 2.1 1.2 1.4 1.8 2.4 1.2 1.0 2.5 608.3 75.5 6.9 1.0 8.3 – .2 1.7 2.1 2.4 2.3 1.8 1.1 1.0 1.0 1.4 1.5 1.8 1.4 .4 1.4 61
7.2 75.2 7.2 1.0 9.4 – .2 1.1 1.7 1.8 .8 1.3 .9 1.4 .9 1.1 .9 1.5 .7 .3 1.4 628.1 81.4 5.0 .2 5.3 – .2 1.5 6.0 3.4 4.1 5.3 1.3 3.2 .8 3.4 2.6 3.8 1.9 .1 1.6 635.7 76.0 5.7 1.2 11.4 – .3 .9 2.5 1.0 1.4 .9 1.7 1.4 1.1 1.6 .7 1.4 .7 .4 1.6 645.8 76.2 7.2 1.5 9.3 – .2 1.1 1.6 1.3 1.9 1.3 .7 1.1 .7 .7 .6 1.3 .7 .3 .4 654.9 77.5 6.7 1.2 9.7 – .2 .4 .7 .8 .6 .5 .6 .7 .4 .5 .3 .6 .5 .2 .6 66
1992 ECONOMIC CENSUS CHARACTERISTICS OF BUSINESS OWNERS 57

Table 6c. Age, Birthplace (United States), and Marital Status of Owner by Employment Size of[All data are shown as percents, except firms. For meaning of abbreviations and symbols, see introductory text. For explanation of terms, see appendix A]
Type of firm and employment size
Owner’s age as of December 31, 19921 Owner’s birthplace wasUnited States1
Firms(number) Under 25 25 to 34 35 to 44 45 to 54 55 to 64
65 andover
Notreported Yes No
Notreported
A B C D E F G H I J K
All businesses 17 253 143................................ 2.3 14.2 27.1 22.9 17.5 10.4 5.7 84.1 8.7 7.21
With no paid employees 14 118 184............................... 2.7 15.2 26.0 21.9 17.8 11.0 5.3 84.7 8.3 6.92With paid employees 3 134 959................................. .8 10.9 30.7 26.1 16.3 8.4 6.8 82.1 9.8 8.13
No employees4 435 838.................................... .9 18.3 37.2 21.7 13.6 4.1 4.2 82.6 11.2 6.241 to 4 employees 1 716 076................................... .6 10.4 31.2 27.0 16.1 8.9 5.9 82.1 10.3 7.655 to 9 employees 503 808................................... .9 9.2 28.9 27.7 17.7 7.6 8.1 81.1 9.6 9.3610 to 19 employees 256 110................................ 1.4 10.5 31.1 23.7 15.8 9.3 8.2 82.7 9.1 8.2720 to 49 employees 144 734................................ 1.1 9.7 26.5 26.5 17.0 10.7 8.4 82.8 8.2 9.0850 to 99 employees 45 331................................ 1.3 9.3 22.1 23.8 20.7 12.9 9.9 83.2 6.1 10.89100 employees or more 33 062............................. 1.8 7.0 23.4 28.0 17.8 9.6 12.4 83.1 4.8 12.110
Hispanic ~owned businesses 771 708................... 2.9 18.8 27.6 24.7 14.7 5.4 5.9 47.6 44.8 7.611
With no paid employees 656 343............................... 3.4 20.3 27.1 23.6 14.3 5.7 5.6 45.5 47.1 7.412With paid employees 115 364................................. 1.4 14.1 29.1 28.2 15.8 4.4 7.0 54.5 37.1 8.313
No employees4 19 569.................................... 1.9 21.8 34.2 22.1 9.7 1.5 8.8 58.7 30.3 11.0141 to 4 employees 64 631................................... 1.2 12.8 28.3 29.6 18.1 3.8 6.1 51.9 40.7 7.4155 to 9 employees 16 937................................... .4 13.7 29.5 29.9 13.8 6.2 6.5 57.2 34.4 8.41610 to 19 employees 8 553................................ 2.9 12.0 28.0 25.5 16.2 6.7 8.6 53.6 37.2 9.21720 to 49 employees 4 050................................ 1.2 11.1 27.7 29.3 14.1 6.1 10.5 58.4 31.6 10.01850 to 99 employees 948................................ 1.7 11.9 21.4 29.2 22.5 8.8 4.5 47.4 46.9 5.719100 employees or more 676............................. 1.9 13.3 18.5 35.1 15.3 9.1 6.8 75.8 19.0 5.120
Black ~owned businesses 620 912...................... 1.6 12.2 26.6 24.9 17.7 9.5 7.5 82.9 8.4 8.721
With no paid employees 556 434............................... 1.7 12.7 26.6 24.3 17.3 9.5 7.8 82.6 8.6 8.922With paid employees 64 478................................. .8 8.5 26.5 29.0 20.0 9.5 5.8 85.2 7.5 7.223
No employees4 13 725.................................... 1.1 10.2 25.9 25.7 19.6 11.9 5.6 88.5 1.9 9.7241 to 4 employees 37 587................................... .6 8.5 26.1 30.7 20.0 9.4 4.6 84.4 10.0 5.6255 to 9 employees 7 853................................... 1.4 6.6 29.1 25.6 23.0 7.7 6.6 85.6 6.4 8.02610 to 19 employees 2 839................................ – 6.0 25.8 32.8 16.1 8.6 10.7 85.3 4.2 10.52720 to 49 employees 1 700................................ 1.2 6.9 26.9 25.1 18.5 7.1 14.3 82.3 5.4 12.32850 to 99 employees 432................................ – 6.3 25.2 36.1 24.4 2.7 5.3 91.4 4.0 4.629100 employees or more 342............................. – 13.9 27.5 26.2 15.4 5.7 11.3 75.1 15.3 9.630
Other minority ~owned businesses 606 426.............. 2.9 13.8 30.5 26.0 14.4 6.1 6.4 29.8 63.2 7.031
With no paid employees 470 075............................... 3.7 14.8 29.9 24.8 15.1 6.4 5.4 30.5 63.7 5.832With paid employees 136 351................................. 1.2 11.9 31.6 28.5 12.9 5.5 8.3 28.3 62.1 9.533
No employees4 19 989.................................... 1.7 20.2 28.3 28.0 8.5 5.9 7.6 29.6 61.4 9.0341 to 4 employees 76 636................................... 1.1 11.0 31.8 28.8 13.8 5.8 7.6 26.3 63.7 9.9355 to 9 employees 22 862................................... 1.3 14.0 34.0 27.3 10.7 4.2 8.5 26.8 64.9 8.33610 to 19 employees 10 051................................ 1.8 9.0 33.1 28.7 15.0 4.5 7.9 30.6 62.4 7.03720 to 49 employees 5 034................................ .4 6.9 30.5 30.8 14.3 6.5 10.5 36.5 52.8 10.73850 to 99 employees 1 075................................ 1.2 5.5 23.1 28.9 15.9 4.6 20.9 42.9 35.9 21.239100 employees or more 705............................. 1.4 5.0 22.3 21.5 14.8 13.4 21.6 40.3 37.8 21.940
Women ~owned businesses 5 888 883.................... 2.7 14.8 26.9 21.9 17.7 9.5 6.5 84.0 8.0 8.041
With no paid employees 5 071 110............................... 3.1 15.9 26.3 21.0 17.7 9.7 6.3 84.6 7.6 7.842With paid employees 817 773................................. 1.0 10.5 29.4 25.6 17.6 8.3 7.5 81.5 9.4 9.143
No employees4 127 905.................................... 1.9 16.1 35.2 18.7 17.4 5.7 5.0 81.4 12.1 6.5441 to 4 employees 435 550................................... .6 9.2 30.1 27.1 17.2 8.3 7.5 81.2 9.2 9.6455 to 9 employees 134 476................................... .8 9.6 26.2 28.4 20.0 8.7 6.4 81.6 10.1 8.24610 to 19 employees 67 487................................ 1.2 10.5 28.4 23.1 17.4 9.0 10.4 81.1 8.5 10.44720 to 49 employees 35 515................................ 1.9 13.7 27.1 24.8 14.2 9.2 9.1 83.4 7.4 9.24850 to 99 employees 10 178................................ 2.2 7.3 22.9 22.8 20.5 13.5 10.8 82.6 5.0 12.349100 employees or more 6 663............................. 4.8 11.1 20.2 22.3 17.2 12.3 12.1 83.2 4.0 12.750
Nonminority male ~owned businesses 10 114 456........... 2.0 13.6 27.0 23.2 17.7 11.4 5.1 88.6 4.7 6.751
With no paid employees 8 019 462............................... 2.4 14.6 25.5 22.3 18.2 12.3 4.7 89.2 4.4 6.452With paid employees 2 094 993................................. .7 10.8 31.4 26.0 16.0 8.9 6.4 86.9 5.5 7.653
No employees4 271 380.................................... .2 19.2 39.2 23.0 12.2 3.3 2.8 88.7 6.1 5.3541 to 4 employees 1 155 800................................... .5 10.6 32.0 26.6 15.6 9.6 5.1 87.6 5.7 6.7555 to 9 employees 334 483................................... .9 8.5 29.6 27.3 17.3 7.4 9.0 85.0 5.0 10.05610 to 19 employees 173 140................................ 1.4 10.5 32.4 23.4 15.2 9.7 7.4 87.2 5.4 7.45720 to 49 employees 101 938................................ .9 8.6 26.2 26.7 18.2 11.6 7.9 85.6 5.8 8.75850 to 99 employees 33 406................................ 1.1 9.8 21.9 23.8 20.7 13.2 9.5 85.3 4.5 10.259100 employees or more 24 846............................. .9 5.5 24.6 29.9 18.0 8.8 12.3 84.6 3.5 11.960
1Data represent percentage of owners reporting in the designated categories.2For explanation of relative standard errors and standard errors, see Reliability of Estimates in the introductory text.3Relative standard errors are not applicable for lines 1 through 10 since these data are the result of censuses, not surveys.4Firms reported annual payroll, but did not report any employees on their payroll during specified period in 1992.
58 CHARACTERISTICS OF BUSINESS OWNERS 1992 ECONOMIC CENSUS

Firm: 1992
Owner’s marital status as of December 31, 19921
Standard error of estimate2 for columnmNever
married MarriedDivorced/separated Widowed
Notreported
Relativestandard
error ofestimate2 3
L M N O P A B C D E F G H I J K L M N O P
8.9 69.6 8.5 2.5 10.4 (X) .2 .6 .5 .7 .5 .6 .3 .4 .4 .4 .4 .4 .5 .2 .3 1
9.5 67.8 9.0 2.8 10.9 (X) .2 .8 .6 .9 .6 .7 .3 .5 .5 .4 .6 .5 .5 .2 .4 27.0 75.6 7.0 1.6 8.9 (X) .1 .4 .6 .5 .5 .4 .5 .4 .4 .6 .4 1.3 .7 .2 .6 39.1 79.0 4.4 1.1 6.4 (X) .4 2.6 2.7 2.9 2.5 .9 .9 2.0 1.6 1.4 1.1 2.0 1.2 .4 1.3 47.8 73.9 7.9 1.3 9.2 (X) .1 .7 1.4 1.5 .6 .7 .8 .9 .9 .7 .9 2.2 1.3 .2 .9 54.5 78.2 6.2 1.9 9.2 (X) .2 .7 2.2 1.2 1.4 .5 1.6 1.5 .7 1.6 .7 2.0 .7 .6 1.9 65.8 75.6 6.9 2.6 9.0 (X) .3 1.1 1.8 1.1 1.2 .7 .5 1.1 .6 .5 .7 1.0 .8 .5 .5 76.8 76.1 6.5 1.7 8.8 (X) .3 1.3 .9 1.6 1.1 1.2 .8 1.3 .8 .8 1.4 1.7 .7 .2 .9 86.7 75.3 6.4 1.6 10.0 (X) .4 1.3 1.9 1.6 1.0 1.7 .9 1.3 .8 1.0 1.1 1.2 1.1 .3 1.2 95.8 72.7 7.9 1.1 12.6 (X) .4 1.1 2.8 2.0 1.2 1.3 2.6 2.8 .7 2.6 .9 1.7 1.7 .3 2.4 10
11.7 65.1 8.5 1.4 13.3 – .5 .5 .7 .6 .5 .3 .4 .6 .6 .5 .9 1.0 .4 .2 .5 11
13.1 62.8 8.6 1.5 14.0 – .7 .9 1.0 1.0 .5 .5 .4 .7 .8 .5 1.2 1.3 .5 .3 .7 127.4 72.7 8.0 1.0 10.9 1.0 .2 1.1 1.3 1.1 .9 .6 .6 1.1 .8 .7 .9 .9 .7 .2 .7 13
13.6 62.8 10.6 .1 12.9 2.0 1.0 4.2 2.2 2.8 2.3 1.1 2.4 3.9 4.6 2.7 2.7 2.6 3.2 .1 2.1 146.2 74.6 6.7 1.0 11.5 1.0 .4 1.6 2.7 1.6 1.4 .6 .8 1.6 1.8 1.0 1.1 1.7 1.0 .4 .8 157.2 72.5 10.4 1.5 8.5 2.0 .2 2.0 2.0 2.7 1.7 1.7 1.0 1.9 1.3 1.3 1.1 2.0 1.0 .5 1.1 166.8 73.7 8.3 1.2 10.0 3.0 1.4 1.1 1.8 2.3 1.5 1.3 1.6 2.5 2.0 1.7 1.3 2.4 1.6 .4 1.6 173.9 76.9 6.6 2.3 10.3 4.0 .4 1.8 4.3 2.9 2.1 1.3 1.7 2.6 1.8 1.6 .7 2.2 1.6 .8 1.5 185.7 76.5 7.7 1.2 8.8 6.0 .8 3.9 3.7 4.0 3.2 1.8 1.2 5.5 5.7 .9 1.5 1.7 1.2 .5 1.7 194.4 84.8 4.7 .9 5.2 8.0 1.1 6.7 2.8 5.3 3.3 3.0 2.1 4.9 3.7 2.0 1.1 3.2 1.4 .6 2.0 20
10.5 55.1 14.0 4.0 16.3 – .2 .2 .7 .8 .9 .5 .5 .7 .5 .4 .5 .4 .8 .3 .8 21
11.2 53.4 14.4 4.1 16.8 – .2 .3 .8 .9 1.0 .5 .6 .8 .6 .5 .5 .4 .8 .4 .7 225.6 67.5 11.3 3.3 12.3 1.0 .2 1.1 1.6 1.2 1.1 1.1 .4 1.5 1.1 .5 .8 1.7 1.2 .6 1.0 236.4 63.6 16.5 1.2 12.3 2.0 1.1 2.6 2.9 4.0 3.1 3.6 1.8 3.3 1.2 3.0 2.1 5.3 3.9 .6 3.0 245.2 69.3 9.9 4.2 11.5 1.0 .4 1.4 1.7 1.7 1.7 1.3 .9 1.9 1.8 .6 .8 1.5 1.3 .7 .8 256.2 68.0 10.4 3.3 12.1 3.0 .6 1.4 3.4 2.9 2.9 1.5 1.3 1.6 1.5 2.0 1.4 2.7 1.3 1.3 1.7 266.3 62.9 9.8 1.6 19.3 4.0 – 2.0 4.1 3.9 1.5 2.1 3.3 3.2 1.5 3.1 1.3 2.8 2.4 1.1 3.5 275.5 65.3 10.1 2.8 16.4 6.0 .5 2.1 3.8 4.0 2.5 2.8 2.7 2.5 1.9 2.7 1.6 4.6 3.4 .7 3.7 286.9 70.3 14.5 1.4 6.8 8.0 – 2.5 5.5 6.1 5.9 1.5 2.1 5.0 4.2 2.3 2.0 5.9 6.8 1.0 2.6 294.2 66.2 16.2 2.3 11.1 10.0 – 5.5 5.1 4.6 2.7 2.2 2.3 5.4 4.7 2.1 1.5 5.8 4.6 .7 2.1 30
9.9 71.6 5.4 1.6 11.5 – .4 1.1 1.3 1.0 .9 .4 .7 1.3 1.5 .6 .6 1.1 .3 .3 .9 31
11.2 69.4 5.9 1.9 11.6 – .7 1.5 1.8 1.3 1.1 .8 1.0 1.7 1.8 .9 .9 1.6 .5 .5 1.5 327.1 76.2 4.3 1.0 11.4 1.0 .2 1.2 1.1 1.5 1.0 .8 1.0 1.8 2.1 1.0 .9 .8 .5 .1 .9 339.2 75.7 2.1 .8 12.2 2.0 .9 2.9 5.7 4.8 2.5 1.8 2.9 5.7 7.3 2.7 3.6 4.1 .8 .7 3.1 347.3 76.0 4.3 .9 11.5 1.0 .3 1.5 2.0 2.1 1.5 1.7 1.5 2.4 2.4 1.6 1.2 1.0 .9 .3 1.7 356.6 77.6 4.3 1.6 9.9 2.0 .5 1.5 2.5 2.0 1.6 .9 1.5 3.0 3.2 1.0 1.3 1.3 .7 .5 .9 365.6 76.6 7.2 .7 10.0 2.0 .8 1.3 3.1 2.5 2.4 .8 1.8 3.4 2.9 1.6 .9 3.3 1.8 .3 1.7 376.6 77.0 3.8 1.3 11.2 4.0 .2 .8 3.0 3.5 2.3 1.3 1.7 3.4 3.8 1.6 1.1 1.9 1.0 .3 2.0 384.1 71.1 4.6 .4 19.8 6.0 .3 1.7 3.5 5.1 2.4 2.0 4.9 5.7 6.1 5.1 1.2 5.0 1.3 .3 4.6 397.0 65.0 2.4 2.3 23.2 6.0 1.0 2.0 3.1 3.1 3.0 3.2 7.2 5.5 3.7 7.2 1.7 5.9 1.8 1.4 6.9 40
8.5 64.2 11.5 4.6 11.1 – .3 .9 .8 .8 .8 .7 .4 .6 .4 .3 .6 .7 .9 .3 .4 41
9.3 61.9 12.3 4.8 11.7 – .3 1.1 1.0 1.0 1.0 .7 .5 .8 .6 .5 .7 .7 .9 .3 .5 425.3 73.7 8.3 3.8 8.9 – .1 .7 1.4 1.1 1.0 .6 .5 .7 .7 .5 .5 1.5 .9 .5 .6 435.2 76.8 8.1 2.7 7.2 1.0 .8 3.4 4.8 3.9 4.3 1.4 1.0 3.1 3.1 1.3 1.0 2.7 2.6 1.9 1.6 445.3 73.2 9.2 3.0 9.3 – .2 .9 2.2 1.3 1.6 .9 1.1 .9 .9 .9 .8 1.9 1.1 .3 1.2 453.7 76.7 7.7 4.6 7.3 1.0 .3 1.3 1.7 1.5 1.2 1.2 1.0 1.2 1.0 .8 .4 2.2 1.3 1.2 1.0 464.8 70.5 6.9 7.2 10.7 1.0 .3 1.5 1.7 1.5 1.8 .9 1.0 1.6 .8 1.1 .8 1.6 1.2 1.8 1.1 47
10.7 70.5 6.0 3.6 9.3 1.0 .6 2.8 2.8 1.1 1.7 1.0 1.5 2.2 1.1 1.5 2.8 2.2 1.0 .7 1.5 487.4 70.9 6.6 3.6 11.5 2.0 .6 1.3 2.9 2.2 2.0 2.8 2.4 3.1 1.6 2.3 1.7 3.1 .8 1.1 2.2 498.0 71.6 5.3 2.8 12.3 2.0 1.1 2.3 2.7 2.8 2.6 1.9 3.1 3.0 .8 3.2 1.5 3.6 1.4 .6 2.9 50
8.9 72.6 7.2 1.6 9.7 – .3 .8 .9 .9 1.1 1.0 .6 .5 .6 .6 .6 .8 .5 .3 .6 51
9.3 71.3 7.4 1.8 10.1 – .4 1.1 1.2 1.2 1.4 1.2 .6 .7 .6 .6 .7 1.0 .5 .4 .6 527.6 76.5 6.6 .8 8.6 – .1 .5 1.0 .6 .5 .7 .7 .6 .7 .8 .7 1.4 .8 .1 .8 53
10.5 82.4 2.2 .3 4.5 – .1 3.7 5.0 4.4 2.5 1.7 1.3 2.4 2.0 2.1 2.1 3.2 .9 .2 2.2 549.1 73.9 7.6 .7 8.7 – .2 1.1 1.7 2.2 .9 1.2 1.0 1.3 1.5 .8 1.5 2.7 1.8 .3 1.2 554.4 79.2 5.6 .9 10.0 – .3 1.3 3.1 2.1 2.0 .7 2.2 2.4 1.1 2.2 1.0 2.6 .6 .3 2.6 566.1 77.5 7.0 1.1 8.3 1.0 .3 1.2 2.6 1.2 2.0 .9 1.0 1.6 .8 1.0 1.0 1.2 1.2 .3 .9 575.8 77.8 6.8 1.2 8.4 1.0 .3 1.2 1.3 2.3 1.7 1.6 .9 1.3 .9 .8 .8 1.7 1.0 .3 1.0 586.6 76.5 6.3 1.2 9.4 1.0 .5 1.5 2.4 2.1 1.3 1.9 1.4 1.6 .8 1.3 1.3 1.5 1.3 .3 1.6 595.1 73.0 8.8 .6 12.5 1.0 .4 1.4 3.4 2.7 1.5 1.4 2.8 3.2 .7 2.7 1.1 1.7 2.1 .4 2.5 60
1992 ECONOMIC CENSUS CHARACTERISTICS OF BUSINESS OWNERS 59

Table 6d. Age, Birthplace (United States), and Marital Status of Owner by Legal Form of[All data are shown as percents, except firms. For meaning of abbreviations and symbols, see introductory text. For explanation of terms, see appendix A]
Type of firm and legal form of organization
Owner’s age as of December 31, 19921 Owner’s birthplace wasUnited States1
Firms(number) Under 25 25 to 34 35 to 44 45 to 54 55 to 64
65 andover
Notreported Yes No
Notreported
A B C D E F G H I J K
All businesses 17 253 143................................ 2.3 14.2 27.1 22.9 17.5 10.4 5.7 84.1 8.7 7.21
Individual proprietorships 14 599 295.............................. 2.7 16.1 28.0 22.3 16.9 9.8 4.2 85.1 8.7 6.22Partnerships 1 089 578......................................... .7 8.8 22.0 22.6 20.9 16.1 8.9 83.5 7.4 9.03Subchapter S corporations 1 564 270............................ 1.6 9.3 27.1 25.9 17.6 8.5 10.0 80.2 9.3 10.54
Hispanic ~owned businesses 771 708................... 2.9 18.8 27.6 24.7 14.7 5.4 5.9 47.6 44.8 7.65
Individual proprietorships 689 015.............................. 3.2 19.7 28.5 24.1 14.5 5.3 4.7 45.9 47.7 6.46Partnerships 32 650......................................... 2.4 17.4 25.0 20.5 17.1 6.2 11.3 53.9 33.0 13.17Subchapter S corporations 50 042............................ 1.9 14.9 24.7 31.1 13.8 5.2 8.5 52.3 37.7 9.98
Black ~owned businesses 620 912...................... 1.6 12.2 26.6 24.9 17.7 9.5 7.5 82.9 8.4 8.79
Individual proprietorships 584 256.............................. 1.7 12.4 26.8 24.4 17.8 9.5 7.3 83.1 8.4 8.510Partnerships 14 727......................................... .3 11.7 14.6 31.2 16.6 10.7 14.8 76.6 9.0 14.411Subchapter S corporations 21 928............................ .9 8.4 30.6 29.6 15.0 8.4 7.2 82.5 9.7 7.812
Other minority ~owned businesses 606 426.............. 2.9 13.8 30.5 26.0 14.4 6.1 6.4 29.8 63.2 7.013
Individual proprietorships 502 022.............................. 3.9 16.9 33.0 26.0 13.5 4.5 2.2 23.9 73.0 3.114Partnerships 49 489......................................... 1.8 8.1 22.4 23.9 19.0 10.9 13.9 40.6 45.4 14.015Subchapter S corporations 54 915............................ 1.2 10.4 30.3 27.7 12.9 6.3 11.3 36.8 51.5 11.716
Women ~owned businesses 5 888 883.................... 2.7 14.8 26.9 21.9 17.7 9.5 6.5 84.0 8.0 8.017
Individual proprietorships 5 078 077.............................. 3.3 16.9 27.9 21.2 16.6 9.3 4.8 85.2 8.1 6.718Partnerships 243 651......................................... 1.4 7.9 14.9 21.5 25.6 15.5 13.2 81.7 5.4 13.019Subchapter S corporations 567 155............................ .8 8.8 28.4 24.9 18.7 7.2 11.1 79.5 8.7 11.820
Nonminority male ~owned businesses 10 114 456........... 2.0 13.6 27.0 23.2 17.7 11.4 5.1 88.6 4.7 6.721
Individual proprietorships 8 414 238.............................. 2.3 15.6 27.8 22.6 17.2 10.6 3.8 89.7 4.4 5.922Partnerships 777 379......................................... .3 8.7 23.9 22.8 19.9 17.0 7.3 88.0 4.5 7.523Subchapter S corporations 922 838............................ 2.1 9.1 26.2 26.3 17.4 9.6 9.2 84.4 6.1 9.524
1Data represent percentage of owners reporting in the designated categories.2For explanation of relative standard errors and standard errors, see Reliability of Estimates in the introductory text.3Relative standard errors are not applicable for lines 1 through 4 since these data are the result of censuses, not surveys.
60 CHARACTERISTICS OF BUSINESS OWNERS 1992 ECONOMIC CENSUS

Organization of Firm: 1992
Owner’s marital status as of December 31, 19921
Standard error of estimate2 for columnmNever
married MarriedDivorced/separated Widowed
Notreported
Relativestandard
error ofestimate2 3
L M N O P A B C D E F G H I J K L M N O P
8.9 69.6 8.5 2.5 10.4 (X) .2 .6 .5 .7 .5 .6 .3 .4 .4 .4 .4 .4 .5 .2 .3 1
9.5 67.3 9.9 2.7 10.6 (X) .2 .7 .5 .7 .6 .6 .4 .6 .5 .4 .4 .6 .6 .2 .5 27.5 74.7 4.9 2.8 10.1 (X) .2 1.4 2.0 1.7 1.7 2.3 .7 1.0 .5 .8 1.5 1.5 .3 .5 1.0 37.0 76.1 5.4 1.5 9.9 (X) .4 .8 1.4 1.2 .9 .8 1.5 1.2 .7 1.5 .6 1.1 .6 .2 1.5 4
11.7 65.1 8.5 1.4 13.3 – .5 .5 .7 .6 .5 .3 .4 .6 .6 .5 .9 1.0 .4 .2 .5 5
12.5 62.9 8.6 1.5 14.4 – .6 .9 1.0 1.1 .6 .4 .4 .7 .8 .7 1.0 1.2 .4 .3 .7 613.4 66.2 7.0 1.5 11.9 2.0 1.2 2.6 2.1 2.2 1.7 1.5 1.7 1.7 1.7 1.7 2.8 3.2 .7 .4 1.7 7
6.4 75.8 8.8 .5 8.5 1.0 .3 1.8 1.6 2.0 1.0 .7 1.2 1.6 1.8 1.1 .7 1.7 1.7 .1 1.1 8
10.5 55.1 14.0 4.0 16.3 – .2 .2 .7 .8 .9 .5 .5 .7 .5 .4 .5 .4 .8 .3 .8 9
10.8 54.1 14.3 4.1 16.8 – .2 .3 .7 .8 .9 .6 .5 .7 .5 .4 .5 .5 .9 .4 .8 106.4 64.9 10.5 2.8 15.3 3.0 .3 2.3 3.2 2.9 2.3 2.7 3.0 3.9 2.5 2.9 1.6 2.8 2.7 1.6 3.5 118.3 68.2 12.2 4.0 7.3 2.0 .5 1.5 1.8 2.2 1.4 1.3 .5 1.8 1.6 .6 1.8 1.8 1.5 1.0 .6 12
9.9 71.6 5.4 1.6 11.5 – .4 1.1 1.3 1.0 .9 .4 .7 1.3 1.5 .6 .6 1.1 .3 .3 .9 13
11.7 69.7 6.4 1.7 10.5 – .6 1.4 2.1 1.1 1.1 .5 .6 1.5 1.4 .5 1.1 1.3 .5 .5 1.0 147.5 72.1 3.5 1.9 15.0 1.0 .7 1.4 2.6 2.5 3.1 1.8 2.6 3.6 3.0 2.6 1.7 3.5 .5 .8 2.4 156.9 76.4 4.3 .9 11.5 1.0 .2 1.4 1.8 2.4 1.0 1.0 1.6 2.2 2.5 1.6 .9 2.2 .5 .2 1.8 16
8.5 64.2 11.5 4.6 11.1 – .3 .9 .8 .8 .8 .7 .4 .6 .4 .3 .6 .7 .9 .3 .4 17
9.8 61.0 13.5 4.9 10.9 – .3 1.2 .9 1.1 .9 .7 .4 .8 .5 .4 .8 1.1 1.2 .4 .6 185.0 69.1 6.6 5.1 14.2 1.0 .3 1.8 1.0 2.3 2.9 1.9 2.1 2.5 1.0 2.2 .9 2.2 1.3 1.4 2.0 194.4 76.8 5.1 2.8 10.9 – .1 1.2 1.3 1.5 1.2 .6 1.6 1.3 .4 1.5 .4 1.3 .6 .6 1.5 20
8.9 72.6 7.2 1.6 9.7 – .3 .8 .9 .9 1.1 1.0 .6 .5 .6 .6 .6 .8 .5 .3 .6 21
9.2 71.1 8.2 1.5 10.0 – .3 .9 .9 1.0 1.3 1.1 .6 .9 .7 .7 .7 .7 .6 .3 .8 228.1 76.6 4.3 2.4 8.6 – .1 2.0 2.5 2.2 2.5 3.0 .8 1.2 .7 .8 1.9 2.5 .6 .6 1.4 238.6 75.8 5.6 .8 9.2 – .6 .8 2.0 1.5 1.5 1.2 1.8 1.6 1.2 1.8 .9 1.5 .9 .1 1.8 24
1992 ECONOMIC CENSUS CHARACTERISTICS OF BUSINESS OWNERS 61

Table 7a. Veteran Status of Business Owner by Industry Division: 1992[All data are shown as percents, except firms. For meaning of abbreviations and symbols, see introductory text. For explanation of terms, see appendix A]
Type of firm and industry division
Veteran status1 Active duty served during Vietnam era1
Active duty
Firms(number)
Less than6 months
6 monthsor more
Non~veterans
Notreported Yes No
Notreported
Notapplicable2
A B C D E F G H I
All businesses 17 253 143..................................... 2.5 21.7 68.5 7.4 7.4 14.1 7.6 70.91
Agricultural services, forestry, fishing, and mining 583 253.............. 3.1 19.5 67.1 10.3 7.0 12.9 9.9 70.22Construction 1 829 620.............................................. 1.5 28.7 65.2 4.6 12.3 16.3 4.7 66.73Manufacturing 517 714............................................ 1.8 22.8 69.4 6.0 6.8 15.6 6.4 71.24Transportation, communications, and utilities 698 903.................. 1.7 23.4 66.6 8.4 8.1 15.2 8.4 68.35Wholesale trade 538 339........................................... 2.9 23.9 66.2 7.0 7.2 16.9 6.8 69.16
Retail trade 2 478 045............................................... 1.6 16.3 73.5 8.6 5.7 10.4 8.7 75.17Finance, insurance, and real estate 1 941 029.......................... 3.7 28.1 60.0 8.1 6.8 20.9 8.5 63.88Services 7 784 016.................................................. 2.6 19.8 70.9 6.7 7.2 12.4 6.9 73.59Industries not classified 882 224.................................... 2.3 15.4 70.7 11.6 4.6 10.8 11.6 73.010
Hispanic ~owned businesses 771 708........................ 1.2 13.5 76.8 8.5 6.5 6.8 8.6 78.011
Agricultural services, forestry, fishing, and mining 32 927.............. .2 6.7 83.3 9.8 1.6 5.1 9.8 83.512Construction 97 476.............................................. 1.0 15.7 75.9 7.4 7.4 7.6 8.0 76.913Manufacturing 18 461............................................ 1.7 16.1 74.7 7.6 5.7 10.3 7.7 76.414Transportation, communications, and utilities 47 797.................. .7 10.5 78.5 10.3 3.8 6.5 10.5 79.315Wholesale trade 17 727........................................... 1.8 15.5 73.8 8.9 6.6 9.1 8.7 75.616
Retail trade 107 846............................................... 2.3 11.2 79.4 7.1 5.0 6.3 7.1 81.617Finance, insurance, and real estate 49 231.......................... 1.9 20.5 69.0 8.6 8.3 11.2 9.6 70.918Services 347 297.................................................. .8 13.6 77.2 8.4 7.5 6.2 8.3 78.019Industries not classified 52 945.................................... 2.1 8.7 77.8 11.3 4.9 3.8 11.4 79.920
Black ~owned businesses 620 912........................... 1.1 19.5 67.3 12.1 8.3 11.3 12.1 68.321
Agricultural services, forestry, fishing, and mining 10 309.............. 1.5 24.0 63.4 11.0 9.7 14.6 10.7 64.922Construction 43 381.............................................. 1.4 26.6 63.8 8.1 9.1 17.5 8.1 65.323Manufacturing 10 469............................................ 1.2 19.0 70.4 9.4 7.8 11.1 9.4 71.624Transportation, communications, and utilities 49 095................. 1.0 21.1 63.5 14.3 8.7 12.7 14.1 64.625Wholesale trade 7 550........................................... 1.6 23.6 66.7 8.2 10.5 12.9 8.4 68.226
Retail trade 86 840............................................... .8 16.7 69.8 12.7 8.0 8.8 12.7 70.627Finance, insurance, and real estate 40 924.......................... 1.6 25.4 63.7 9.4 10.8 14.4 9.5 65.328Services 332 981.................................................. 1.0 18.1 68.6 12.4 7.5 10.6 12.3 69.529Industries not classified 39 363.................................... 1.6 20.4 62.9 15.1 10.6 10.1 14.9 64.530
Other minority ~owned businesses 606 426................... .7 9.5 81.5 8.3 3.8 5.7 8.3 82.231
Agricultural services, forestry, fishing, and mining 15 218.............. 1.6 15.4 72.7 10.3 4.1 11.3 10.3 74.332Construction 28 295.............................................. 1.2 13.9 76.0 8.9 6.8 7.7 8.3 77.233Manufacturing 18 976............................................ .8 12.1 80.4 6.8 5.1 7.0 6.8 81.134Transportation, communications, and utilities 24 362.................. .1 10.3 79.0 10.7 5.6 4.7 10.7 79.135Wholesale trade 20 043........................................... .6 10.3 82.2 6.8 5.6 4.7 6.8 82.936
Retail trade 132 483............................................... .5 7.4 85.3 6.8 2.7 4.8 6.8 85.837Finance, insurance, and real estate 64 762.......................... 1.7 12.4 72.8 13.1 4.3 8.0 13.2 74.538Services 273 774.................................................. .4 8.4 84.0 7.2 3.3 5.1 7.2 84.439Industries not classified 28 512.................................... .4 8.2 84.6 6.8 4.4 3.8 6.8 85.040
Women ~owned businesses 5 888 883.......................... 1.0 12.5 77.1 9.3 4.5 8.0 9.4 78.141
Agricultural services, forestry, fishing, and mining 119 731.............. 3.1 14.5 72.5 9.9 5.4 9.1 9.9 75.642Construction 183 695.............................................. 2.8 19.6 69.4 8.2 6.7 12.8 8.2 72.243Manufacturing 152 346............................................ 1.9 15.2 75.9 7.0 4.1 11.0 7.1 77.844Transportation, communications, and utilities 141 623.................. .4 15.8 76.9 6.9 6.9 8.9 7.0 77.345Wholesale trade 154 542........................................... 2.6 20.7 68.6 8.0 8.0 12.6 8.2 71.246
Retail trade 1 093 342............................................... .7 9.9 78.9 10.5 5.3 4.6 10.5 79.647Finance, insurance, and real estate 602 802.......................... 1.3 17.8 69.9 11.0 4.4 13.4 11.0 71.348Services 3 158 444.................................................. .8 11.1 79.5 8.5 3.9 7.2 8.6 80.349Industries not classified 282 358.................................... .2 7.5 79.5 12.9 1.7 5.8 12.9 79.650
Nonminority male ~owned businesses 10 114 456................ 3.4 27.4 63.0 6.2 9.0 18.2 6.4 66.451
Agricultural services, forestry, fishing, and mining 412 917.............. 3.4 21.9 64.2 10.4 7.9 14.7 9.8 67.652Construction 1 496 056.............................................. 1.4 31.0 63.8 3.8 13.5 17.4 3.8 65.253Manufacturing 333 485............................................ 1.8 26.8 65.9 5.6 8.1 18.2 6.1 67.654Transportation, communications, and utilities 458 400.................. 2.3 27.7 62.0 8.1 8.9 18.7 8.1 64.355Wholesale trade 352 721........................................... 3.2 26.0 64.3 6.5 6.9 19.5 6.1 67.556
Retail trade 1 197 943............................................... 2.4 22.8 67.9 7.0 6.3 16.2 7.3 70.257Finance, insurance, and real estate 1 240 594.......................... 4.8 33.1 55.4 6.7 7.8 24.8 7.2 60.258Services 4 102 294.................................................. 4.1 26.5 64.0 5.3 9.6 16.6 5.7 68.259Industries not classified 520 046.................................... 3.6 20.1 65.3 11.1 6.0 14.1 11.1 68.860
1Data represent percentage of owners reporting in the designated categories.2Includes owners who were not veterans or served less than 6 months active duty.3Includes owners who were not veterans.4For explanation of relative standard errors and standard errors, see Reliability of Estimates in the introductory text.5Relative standard errors are not applicable for lines 1 through 10 since these data are the result of censuses, not surveys.
62 CHARACTERISTICS OF BUSINESS OWNERS 1992 ECONOMIC CENSUS

Disabled veteran1
Standard error of estimate4 for columnm
Yes NoNot
reportedNot
applicable3
Relativestandard
error ofestimate4 5
J K L M A B C D E F G H I J K L M
1.8 22.0 7.8 68.5 (X) .2 .9 1.0 .3 .5 .6 .3 .9 .2 .9 .3 1.0 1
1.1 21.4 10.4 67.1 (X) 1.0 1.8 1.5 1.3 .9 1.8 1.1 1.2 .5 2.2 1.4 1.5 21.1 28.2 5.5 65.2 (X) .4 3.6 3.5 .9 2.0 2.0 1.0 3.7 .5 3.5 1.0 3.5 31.3 22.6 6.7 69.4 (X) .4 1.9 1.8 .7 .8 2.2 .9 2.0 .3 1.8 .9 1.8 41.7 23.2 8.5 66.6 (X) .6 2.4 2.1 1.5 1.4 1.8 1.5 2.3 .6 2.3 1.5 2.1 51.3 25.1 7.5 66.2 (X) .5 .8 1.4 .8 1.0 1.0 .7 1.3 .4 .9 .8 1.4 6
1.8 15.9 8.8 73.5 (X) .4 1.0 1.4 1.1 .5 .7 1.3 1.1 .3 1.1 1.1 1.4 72.4 28.7 8.9 60.0 (X) .5 2.3 2.7 1.1 1.1 2.2 1.0 2.7 .7 2.0 1.3 2.7 81.8 20.3 7.0 70.9 (X) .5 1.0 1.2 .4 .5 .9 .4 .9 .3 1.1 .4 1.2 91.8 15.8 11.8 70.7 (X) 1.0 1.8 3.4 2.4 1.3 1.5 2.4 3.6 .6 1.4 2.4 3.4 10
1.1 13.4 8.7 76.8 – .1 .4 .6 .3 .3 .6 .3 .5 .2 .5 .4 .6 11
.4 6.5 9.8 83.3 1.0 .1 1.4 2.0 2.0 .4 1.4 2.0 2.0 .1 1.4 2.0 2.0 12
.7 15.5 7.8 75.9 1.0 .3 1.5 2.3 1.4 1.5 1.3 1.4 2.3 .3 1.5 1.5 2.3 13
.3 17.2 7.8 74.7 1.0 .4 1.9 2.3 1.0 1.2 1.2 1.1 2.3 .1 2.1 1.1 2.3 141.5 10.2 9.7 78.5 1.0 .4 1.6 1.8 1.7 1.2 1.0 1.8 1.8 .7 1.9 1.6 1.8 15.8 16.5 8.9 73.8 2.0 .6 1.9 1.6 1.1 1.1 1.5 1.0 1.8 .4 1.9 1.1 1.6 16
.8 12.1 7.7 79.4 1.0 .7 1.6 2.0 1.1 1.0 1.2 1.1 2.2 .3 1.4 1.2 2.0 172.0 19.9 9.1 69.0 1.0 .7 1.7 2.7 .9 1.7 1.9 1.5 2.4 .6 2.3 1.2 2.7 181.2 13.1 8.5 77.2 – .3 .8 1.1 .8 .4 .9 .8 1.2 .4 1.0 .8 1.1 191.2 9.3 11.6 77.8 1.0 .7 1.2 1.8 1.7 .9 1.1 1.7 2.1 1.0 .9 1.7 1.8 20
2.7 18.1 12.0 67.3 – .1 .6 .9 .7 .4 .5 .6 .9 .3 .6 .6 .9 21
3.0 24.0 9.6 63.4 1.0 .4 1.7 1.2 1.6 1.1 1.6 1.5 1.3 1.1 2.0 1.2 1.2 221.9 26.0 8.2 63.8 – .4 1.0 1.1 1.1 1.3 1.3 1.2 1.2 .5 .8 1.1 1.1 232.7 17.7 9.2 70.4 1.0 .6 1.1 .9 1.3 1.0 .7 1.3 1.1 .8 1.1 1.2 .9 242.3 20.1 14.1 63.5 – .4 1.4 2.1 1.9 .9 .8 1.8 2.2 .7 1.6 1.7 2.1 253.1 22.0 8.3 66.7 2.0 .6 1.4 1.5 1.9 .9 1.3 1.8 1.6 .7 1.6 1.8 1.5 26
2.5 15.7 12.0 69.8 – .3 1.4 2.0 1.4 .8 1.0 1.4 1.9 .7 1.3 1.3 2.0 274.3 22.3 9.8 63.7 1.0 .3 2.0 2.2 .9 1.4 1.6 .9 2.1 .9 2.4 1.0 2.2 282.6 16.5 12.3 68.6 – .2 .8 1.4 1.0 .6 .6 .9 1.5 .4 .8 .9 1.4 292.9 19.4 14.8 62.9 – .5 2.0 2.7 2.6 1.4 1.4 2.7 2.8 .7 1.9 2.4 2.7 30
1.1 9.2 8.2 81.5 – .1 .6 .7 .6 .4 .6 .6 .7 .4 .6 .7 .7 31
.5 17.0 9.8 72.7 1.0 .8 2.4 2.2 2.1 1.2 2.3 2.1 2.5 .6 2.5 2.0 2.2 322.1 13.5 8.4 76.0 1.0 .6 2.0 2.8 1.3 1.5 1.6 1.1 2.6 .8 2.3 1.2 2.8 33.8 12.1 6.7 80.4 1.0 .3 1.6 1.9 1.1 1.2 1.8 1.1 1.8 .9 1.9 1.1 1.9 34.5 10.2 10.4 79.0 1.0 .1 2.2 2.6 2.0 1.3 1.6 2.0 2.6 .4 2.2 1.8 2.6 35.1 10.8 6.8 82.2 1.0 .3 1.5 2.2 1.6 1.3 1.1 1.6 2.2 .1 1.4 1.5 2.2 36
.4 7.4 6.9 85.3 1.0 .3 1.2 1.3 .6 .6 1.2 .7 1.4 .2 1.1 .6 1.3 371.0 13.2 13.0 72.8 1.0 .5 1.7 2.8 2.5 1.0 .8 2.5 2.8 .6 1.5 2.6 2.8 381.6 7.5 6.9 84.0 – .2 .9 .9 .5 .6 1.1 .5 .8 .9 1.2 .5 .9 391.2 6.4 7.8 84.6 1.0 .3 1.8 2.1 1.4 1.7 1.4 1.4 2.2 .6 1.6 1.1 2.1 40
1.7 11.7 9.4 77.1 – .1 .8 .8 .3 .4 .8 .4 .8 .4 .8 .3 .8 41
1.2 16.2 10.1 72.5 – 1.2 2.1 1.9 1.8 1.1 1.6 1.8 2.0 .6 2.0 1.8 1.9 421.7 20.3 8.5 69.4 – 1.0 1.7 3.0 1.6 1.1 1.7 1.6 2.4 .6 2.3 1.7 3.0 431.1 15.1 7.9 75.9 – .6 1.7 2.2 .7 .8 1.9 .7 2.0 .4 1.8 .9 2.2 441.5 14.7 7.0 76.9 – .2 2.4 2.5 .9 1.1 1.8 .9 2.6 .7 2.2 .9 2.5 451.7 21.3 8.4 68.6 – .7 1.7 1.9 1.1 1.3 1.1 1.3 1.9 .8 1.7 1.1 1.9 46
1.2 9.2 10.7 78.9 – .2 1.6 1.4 1.4 1.0 .8 1.4 1.4 .5 1.3 1.4 1.4 472.4 16.6 11.1 69.9 – .5 1.9 1.9 1.4 .9 2.0 1.4 1.8 .8 2.3 1.4 1.9 481.9 10.0 8.6 79.5 – .3 1.3 1.6 .6 .6 1.3 .6 1.4 .5 1.4 .6 1.6 49.4 7.2 12.9 79.5 – – 1.2 2.6 2.7 .6 .9 2.7 2.6 .1 1.2 2.7 2.6 50
1.8 28.5 6.8 63.0 – .3 1.5 1.7 .6 .7 .9 .6 1.6 .2 1.5 .6 1.7 51
1.1 24.1 10.5 64.2 – 1.4 2.1 1.9 1.9 1.3 2.3 1.6 1.6 .6 2.7 1.9 1.9 521.0 30.4 4.8 63.8 – .5 4.4 4.2 1.1 2.4 2.5 1.3 4.5 .6 4.2 1.2 4.2 531.5 26.5 6.2 65.9 – .6 2.5 2.2 1.1 1.3 2.6 1.3 2.4 .4 2.2 1.3 2.2 541.8 28.0 8.2 62.0 – 1.0 3.6 3.1 1.9 1.9 2.6 1.9 3.4 .9 3.5 1.9 3.1 551.1 27.5 7.1 64.3 – .7 1.4 2.0 1.0 1.1 1.6 .8 1.7 .7 1.4 1.0 2.0 56
2.3 22.5 7.3 67.9 – .8 1.6 2.7 1.5 1.0 1.2 1.9 2.3 .7 1.9 1.5 2.7 572.4 34.4 7.8 55.4 – 1.0 3.3 3.7 1.3 1.6 3.4 1.2 3.8 .9 2.6 1.5 3.7 581.7 28.5 5.7 64.0 – 1.0 2.1 2.0 .9 1.1 1.5 .8 1.8 .5 2.1 .8 2.0 592.6 20.9 11.3 65.3 – 2.4 3.4 4.9 2.7 2.4 3.0 2.7 4.9 1.1 2.9 2.7 4.9 60
1992 ECONOMIC CENSUS CHARACTERISTICS OF BUSINESS OWNERS 63

Table 7b. Veteran Status of Business Owner by Receipts Size of Firm: 1992[All data are shown as percents, except firms. For meaning of abbreviations and symbols, see introductory text. For explanation of terms, see appendix A]
Type of firm and receipts size
Veteran status1 Active duty served during Vietnam era1
Active duty
Firms(number)
Less than6 months
6 monthsor more
Non~veterans
Notreported Yes No
Notreported
Notapplicable2
A B C D E F G H I
All businesses 17 253 143..................................... 2.5 21.7 68.5 7.4 7.4 14.1 7.6 70.91
Less than $5,000 5 226 553.......................................... 2.5 19.3 70.3 7.8 7.3 11.7 8.2 72.92$5,000 to $9,999 2 443 946.......................................... 2.0 22.1 66.2 9.7 7.5 14.4 9.9 68.23$10,000 to $24,999 3 076 410........................................ 2.6 21.0 71.0 5.4 5.7 15.4 5.4 73.64$25,000 to $49,999 1 945 806........................................ 1.7 24.4 67.7 6.2 8.4 15.7 6.5 69.45$50,000 to $99,999 1 615 940........................................ 2.8 22.7 68.1 6.4 7.7 14.9 6.5 70.96
$100,000 to $199,999 1 197 996...................................... 3.3 21.6 68.6 6.6 8.2 13.4 6.6 71.87$200,000 to $249,999 301 794...................................... 2.9 29.4 62.8 4.9 7.9 21.9 4.6 65.68$250,000 to $499,999 682 583...................................... 2.3 22.5 66.2 8.9 8.1 14.3 9.1 68.69$500,000 to $999,999 372 078...................................... 2.4 21.5 66.4 9.7 7.1 14.3 9.7 68.810$1,000,000 or more 390 037........................................ 3.2 22.5 64.7 9.6 7.0 15.3 9.8 67.911
Hispanic ~owned businesses 771 708........................ 1.2 13.5 76.8 8.5 6.5 6.8 8.6 78.012
Less than $5,000 219 226.......................................... .8 13.1 76.8 9.3 7.2 6.0 9.3 77.613$5,000 to $9,999 140 362.......................................... 1.5 10.4 78.6 9.6 2.3 7.1 10.5 80.114$10,000 to $24,999 165 667........................................ 1.0 13.8 77.4 7.8 6.9 6.8 7.9 78.415$25,000 to $49,999 87 288........................................ 1.2 14.6 76.2 7.9 9.2 5.7 7.6 77.416$50,000 to $99,999 64 742........................................ 1.7 14.2 77.5 6.6 7.0 6.9 6.9 79.217
$100,000 to $199,999 41 578...................................... 1.1 15.2 77.0 6.7 7.4 7.7 6.6 78.218$200,000 to $249,999 10 030...................................... 3.7 13.7 73.7 8.9 5.4 8.3 8.9 77.419$250,000 to $499,999 22 301...................................... .7 13.9 76.7 8.7 5.2 8.7 8.8 77.420$500,000 to $999,999 11 319...................................... 1.7 15.5 69.6 13.1 7.0 8.2 13.4 71.321$1,000,000 or more 9 194........................................ 1.8 14.3 74.8 9.1 5.5 8.6 9.3 76.622
Black ~owned businesses 620 912........................... 1.1 19.5 67.3 12.1 8.3 11.3 12.1 68.323
Less than $5,000 236 722.......................................... 1.5 18.4 66.1 14.0 7.7 10.8 13.8 67.624$5,000 to $9,999 111 512.......................................... .2 20.8 65.8 13.2 8.7 12.7 12.6 66.025$10,000 to $24,999 129 901........................................ .9 18.8 67.9 12.4 7.5 11.3 12.4 68.826$25,000 to $49,999 62 209........................................ 1.1 18.8 71.9 8.2 9.7 8.5 8.8 73.027$50,000 to $99,999 39 218........................................ 1.3 20.9 69.8 8.0 9.2 11.7 8.0 71.128
$100,000 to $199,999 20 936...................................... 1.5 23.8 65.6 9.2 9.7 13.6 9.6 67.029$200,000 to $249,999 4 533...................................... 1.7 20.8 69.1 8.3 10.1 9.5 9.6 70.830$250,000 to $499,999 9 029...................................... 1.7 24.2 65.2 8.9 11.1 13.1 9.0 66.931$500,000 to $999,999 3 823...................................... 1.0 26.0 64.0 9.0 5.6 20.3 9.2 65.032$1,000,000 or more 3 028........................................ 1.6 19.7 65.8 12.8 7.7 11.1 13.7 67.433
Other minority ~owned businesses 606 426................... .7 9.5 81.5 8.3 3.8 5.7 8.3 82.234
Less than $5,000 132 493.......................................... .5 11.0 81.3 7.2 4.4 6.4 7.4 81.835$5,000 to $9,999 80 435.......................................... .7 9.4 83.2 6.7 3.2 6.1 6.7 83.936$10,000 to $24,999 108 195........................................ .5 7.3 84.0 8.3 3.9 3.4 8.3 84.437$25,000 to $49,999 77 345........................................ 1.3 6.0 83.5 9.2 2.1 4.1 9.0 84.838$50,000 to $99,999 70 360........................................ .7 11.4 81.1 6.8 4.8 6.6 6.7 81.839
$100,000 to $199,999 58 620...................................... .9 10.4 78.9 9.7 3.4 7.1 9.7 79.940$200,000 to $249,999 15 740...................................... .6 12.6 77.5 9.3 7.1 5.7 9.1 78.141$250,000 to $499,999 34 266...................................... .2 8.8 84.0 7.1 3.2 5.6 7.1 84.242$500,000 to $999,999 16 467...................................... .8 9.9 79.5 9.8 4.2 5.7 9.8 80.343$1,000,000 or more 12 505........................................ 1.1 11.4 74.8 12.7 3.6 7.8 12.7 75.944
Women ~owned businesses 5 888 883.......................... 1.0 12.5 77.1 9.3 4.5 8.0 9.4 78.145
Less than $5,000 2 310 303.......................................... 1.0 12.4 76.9 9.7 4.7 7.6 9.9 77.946$5,000 to $9,999 967 380.......................................... .7 11.8 78.0 9.5 4.9 7.0 9.5 78.747$10,000 to $24,999 1 051 358........................................ .8 10.9 80.0 8.3 3.3 7.7 8.3 80.848$25,000 to $49,999 538 885........................................ 1.2 12.7 77.3 8.8 2.9 9.8 8.8 78.549$50,000 to $99,999 381 517........................................ 1.0 14.6 74.1 10.3 6.4 8.2 10.3 75.150
$100,000 to $199,999 267 089...................................... .9 12.7 78.8 7.7 4.1 8.6 7.7 79.651$200,000 to $249,999 66 464...................................... 1.8 12.9 76.1 9.2 5.3 7.5 9.3 77.952$250,000 to $499,999 146 313...................................... 1.3 14.6 74.2 9.9 5.9 8.7 9.9 75.553$500,000 to $999,999 80 539...................................... 1.9 15.7 71.0 11.4 5.8 9.8 11.6 72.854$1,000,000 or more 79 037........................................ 2.7 15.8 70.7 10.8 4.8 10.9 10.8 73.455
Nonminority male ~owned businesses 10 114 456................ 3.4 27.4 63.0 6.2 9.0 18.2 6.4 66.456
Less than $5,000 2 608 047.......................................... 3.9 25.0 65.0 6.1 9.4 15.0 6.7 68.957$5,000 to $9,999 1 285 456.......................................... 3.1 30.4 56.7 9.9 9.7 20.5 10.0 59.858$10,000 to $24,999 1 763 830........................................ 4.0 28.7 64.4 2.8 7.0 21.7 2.8 68.559$25,000 to $49,999 1 248 482........................................ 1.9 30.6 62.4 5.1 10.8 19.3 5.6 64.360$50,000 to $99,999 1 108 065........................................ 3.6 26.6 64.8 5.0 8.3 18.3 5.1 68.461
$100,000 to $199,999 840 723...................................... 4.4 25.5 64.0 6.1 9.9 15.6 6.1 68.362$200,000 to $249,999 212 693...................................... 3.4 38.3 55.5 2.9 9.0 29.8 2.4 58.863$250,000 to $499,999 488 462...................................... 2.9 26.6 61.8 8.7 9.3 17.1 8.9 64.764$500,000 to $999,999 266 408...................................... 2.7 24.1 64.3 8.9 7.7 16.3 8.9 67.065$1,000,000 or more 292 290........................................ 3.4 24.9 62.6 9.2 7.8 16.9 9.4 66.066
1Data represent percentage of owners reporting in the designated categories.2Includes owners who were not veterans or served less than 6 months active duty.3Includes owners who were not veterans.4For explanation of relative standard errors and standard errors, see Reliability of Estimates in the introductory text.5Relative standard errors are not applicable for lines 1 through 11 since these data are the result of censuses, not surveys.
64 CHARACTERISTICS OF BUSINESS OWNERS 1992 ECONOMIC CENSUS

Disabled veteran1
Standard error of estimate4 for columnm
Yes NoNot
reportedNot
applicable3
Relativestandard
error ofestimate4 5
J K L M A B C D E F G H I J K L M
1.8 22.0 7.8 68.5 (X) .2 .9 1.0 .3 .5 .6 .3 .9 .2 .9 .3 1.0 1
2.4 19.3 8.0 70.3 (X) .6 1.4 1.5 .6 .9 1.2 .7 1.6 .3 1.2 .6 1.5 21.5 22.4 9.9 66.2 (X) .6 1.7 2.0 1.8 1.5 1.5 1.8 1.7 .4 1.8 1.9 2.0 31.6 21.4 5.9 71.0 (X) .9 1.6 1.7 .6 .6 1.3 .6 1.5 .4 1.6 .8 1.7 41.7 23.7 6.9 67.7 (X) 1.1 3.1 3.2 1.1 1.5 1.9 1.3 3.0 .6 3.1 1.2 3.2 52.0 23.1 6.8 68.1 (X) .5 1.6 2.4 1.0 .5 1.7 .9 2.2 .7 1.5 1.1 2.4 6
1.4 22.7 7.3 68.6 (X) .6 1.1 1.4 .7 .8 .7 .7 1.6 .4 .8 .7 1.4 72.1 30.1 5.1 62.8 (X) .9 4.5 4.1 1.3 1.8 4.6 1.0 4.2 1.2 4.5 1.3 4.1 81.5 22.9 9.4 66.2 (X) .7 .8 1.5 1.2 .6 1.0 1.3 1.7 .4 .9 1.1 1.5 9.8 22.8 10.0 66.4 (X) .3 1.0 1.1 1.1 .6 .8 1.0 1.3 .2 1.0 1.0 1.1 10.7 24.5 10.1 64.7 (X) .3 .8 .6 .5 .4 .6 .5 .7 .2 .8 .5 .6 11
1.1 13.4 8.7 76.8 – .1 .4 .6 .3 .3 .6 .3 .5 .2 .5 .4 .6 12
.8 12.9 9.4 76.8 1.0 .4 1.6 2.3 1.1 .9 1.3 1.1 2.3 .2 1.5 1.2 2.3 131.3 9.8 10.3 78.6 1.0 .6 1.5 1.9 1.3 .8 1.3 1.2 1.6 .8 1.6 1.4 1.9 14.7 13.9 8.0 77.4 1.0 .4 1.0 2.0 1.3 1.2 1.1 1.4 1.8 .2 1.1 1.2 2.0 15
2.6 13.5 7.7 76.2 1.0 .4 2.3 2.8 1.9 2.3 1.3 1.7 2.7 1.5 2.0 1.9 2.8 16.7 14.8 6.9 77.5 1.0 .5 1.8 2.3 1.5 1.2 1.1 1.5 2.1 .4 1.8 1.5 2.3 17
.9 14.9 7.1 77.0 1.0 .4 1.4 2.2 1.4 1.3 .8 1.4 1.9 .5 1.5 1.6 2.2 181.3 15.9 9.0 73.7 3.0 2.2 1.7 2.8 1.6 1.5 1.8 1.6 2.3 .9 2.1 1.7 2.8 19.7 13.8 8.9 76.7 2.0 .2 1.6 1.5 1.2 .7 1.2 1.2 1.5 .2 1.5 1.2 1.5 20
1.5 15.9 12.9 69.6 3.0 .8 1.4 1.8 1.7 .9 1.1 1.7 2.1 .3 1.1 1.8 1.8 21.6 15.1 9.5 74.8 2.0 .4 .7 1.3 1.0 .3 .7 1.0 1.2 .1 .9 1.0 1.3 22
2.7 18.1 12.0 67.3 – .1 .6 .9 .7 .4 .5 .6 .9 .3 .6 .6 .9 23
3.0 17.5 13.4 66.1 – .3 .7 1.4 1.2 .3 .6 1.2 1.5 .5 1.0 1.1 1.4 242.9 18.2 13.1 65.8 – .1 1.6 2.3 1.0 1.2 1.1 1.0 2.3 .6 1.5 1.0 2.3 252.4 17.1 12.6 67.9 – .1 1.2 1.4 1.5 .9 1.2 1.5 1.4 .5 1.1 1.4 1.4 262.5 17.4 8.2 71.9 – .4 1.7 2.4 1.4 1.4 1.2 1.3 2.3 .6 1.7 1.3 2.4 271.9 20.2 8.1 69.8 1.0 .3 1.6 2.3 1.3 1.3 1.2 1.3 2.2 .5 1.5 1.1 2.3 28
2.1 22.1 10.3 65.6 1.0 .4 .9 2.0 1.7 .8 .9 1.6 2.1 .3 .8 1.8 2.0 292.9 20.5 7.5 69.1 3.0 1.0 2.7 4.2 3.3 3.5 1.6 3.2 4.3 1.8 1.6 3.2 4.2 303.0 23.0 8.9 65.2 3.0 .5 1.9 2.9 1.4 1.8 1.4 1.4 2.8 .9 2.2 1.0 2.9 31.7 26.2 9.1 64.0 4.0 .3 3.7 4.0 2.2 1.2 3.4 2.3 3.8 .2 3.8 2.2 4.0 32
1.6 19.8 12.8 65.8 4.0 .3 1.8 1.3 1.2 1.1 1.7 1.6 1.5 .2 1.6 1.3 1.3 33
1.1 9.2 8.2 81.5 – .1 .6 .7 .6 .4 .6 .6 .7 .4 .6 .7 .7 34
2.7 8.9 7.1 81.3 1.0 .2 2.2 2.2 1.4 2.4 1.1 1.3 2.3 1.6 1.5 1.4 2.2 351.1 9.0 6.7 83.2 1.0 .4 2.7 2.9 2.2 1.0 2.1 2.2 2.9 .6 2.5 2.2 2.9 361.3 6.6 8.1 84.0 1.0 .3 1.3 2.3 2.3 1.3 1.4 2.3 2.4 .8 1.5 2.3 2.3 37.5 7.1 8.9 83.5 1.0 .8 1.6 2.8 2.2 .9 1.3 2.2 3.2 .5 1.3 2.3 2.8 38.8 11.8 6.4 81.1 1.0 .3 1.9 2.5 1.5 1.0 1.7 1.5 2.4 .5 2.1 1.4 2.5 39
.6 10.6 9.9 78.9 1.0 .3 1.7 2.3 1.6 .6 1.7 1.6 2.2 .3 1.7 1.6 2.3 402.1 11.0 9.4 77.5 2.0 .5 2.3 2.9 1.7 2.5 2.2 1.6 2.7 1.3 2.8 1.6 2.9 41.4 8.7 6.9 84.0 1.0 .1 1.0 1.1 .5 .5 .9 .5 1.1 .2 1.0 .5 1.1 42.6 10.1 9.8 79.5 2.0 .2 1.0 2.4 1.9 .8 .8 1.9 2.3 .4 .9 1.9 2.4 43.4 12.0 12.8 74.8 2.0 .2 .9 1.4 1.0 .4 .9 1.0 1.4 .1 1.0 .9 1.4 44
1.7 11.7 9.4 77.1 – .1 .8 .8 .3 .4 .8 .4 .8 .4 .8 .3 .8 45
2.8 10.4 9.9 76.9 – .3 1.4 1.7 1.3 .8 1.1 1.3 1.7 .7 1.4 1.4 1.7 462.2 10.3 9.5 78.0 – .3 1.4 2.4 1.7 1.1 1.7 1.7 2.2 1.0 1.5 1.8 2.4 47.8 10.8 8.4 80.0 – .2 1.1 .8 .9 .7 1.3 .9 .8 .2 .9 .9 .8 48.9 13.0 8.8 77.3 – 1.3 2.4 3.6 1.5 .7 2.5 1.5 3.0 .5 3.1 1.6 3.6 49
1.4 13.9 10.6 74.1 – .4 1.8 2.0 1.6 1.9 .9 1.6 2.1 .6 2.3 1.7 2.0 50
.5 12.9 7.8 78.8 – .3 1.5 1.9 1.7 1.0 1.3 1.7 2.0 .1 1.5 1.7 1.9 511.4 13.3 9.2 76.1 1.0 1.5 3.0 3.7 1.6 2.4 2.0 1.6 3.8 .6 2.7 1.7 3.7 521.5 14.4 9.9 74.2 1.0 .3 1.1 1.2 .3 1.3 .8 .3 1.2 .5 1.1 .3 1.2 531.0 16.3 11.7 71.0 1.0 .4 .7 1.0 1.1 .5 .7 1.1 1.1 .3 .8 1.2 1.0 54.4 17.7 11.2 70.7 1.0 .3 .8 .8 .8 .6 .5 .8 .6 .1 1.0 .7 .8 55
1.8 28.5 6.8 63.0 – .3 1.5 1.7 .6 .7 .9 .6 1.6 .2 1.5 .6 1.7 56
2.0 26.6 6.4 65.0 – 1.3 2.2 2.5 1.1 1.3 2.1 1.0 2.4 .6 1.9 .9 2.5 571.0 32.3 10.0 56.7 – 1.1 3.4 3.3 2.6 2.3 2.4 2.6 3.0 .4 3.3 2.6 3.3 582.2 29.6 3.8 64.4 – 1.6 2.8 3.0 .9 1.1 1.9 .9 2.6 .7 2.8 1.2 3.0 592.0 29.5 6.1 62.4 – 1.2 4.0 3.7 1.4 2.2 2.7 1.7 3.7 .8 3.8 1.6 3.7 602.3 27.4 5.5 64.8 – .8 2.5 3.5 1.3 .9 2.4 1.3 3.1 1.0 2.3 1.5 3.5 61
1.8 27.2 7.1 64.0 – .9 1.6 2.2 1.0 1.1 1.1 1.0 2.3 .5 1.5 1.1 2.2 622.4 39.0 3.1 55.5 – 1.3 5.3 4.5 1.7 2.9 5.4 1.2 4.9 1.6 5.6 1.7 4.5 631.6 27.2 9.4 61.8 – 1.0 1.1 1.9 1.7 .7 1.3 1.8 2.1 .6 1.2 1.6 1.9 64.8 25.7 9.2 64.3 – .4 1.4 1.5 1.2 1.0 1.2 1.2 1.6 .3 1.4 1.0 1.5 65.8 26.9 9.7 62.6 – .3 1.0 .8 .6 .4 .8 .6 .9 .2 .8 .6 .8 66
1992 ECONOMIC CENSUS CHARACTERISTICS OF BUSINESS OWNERS 65
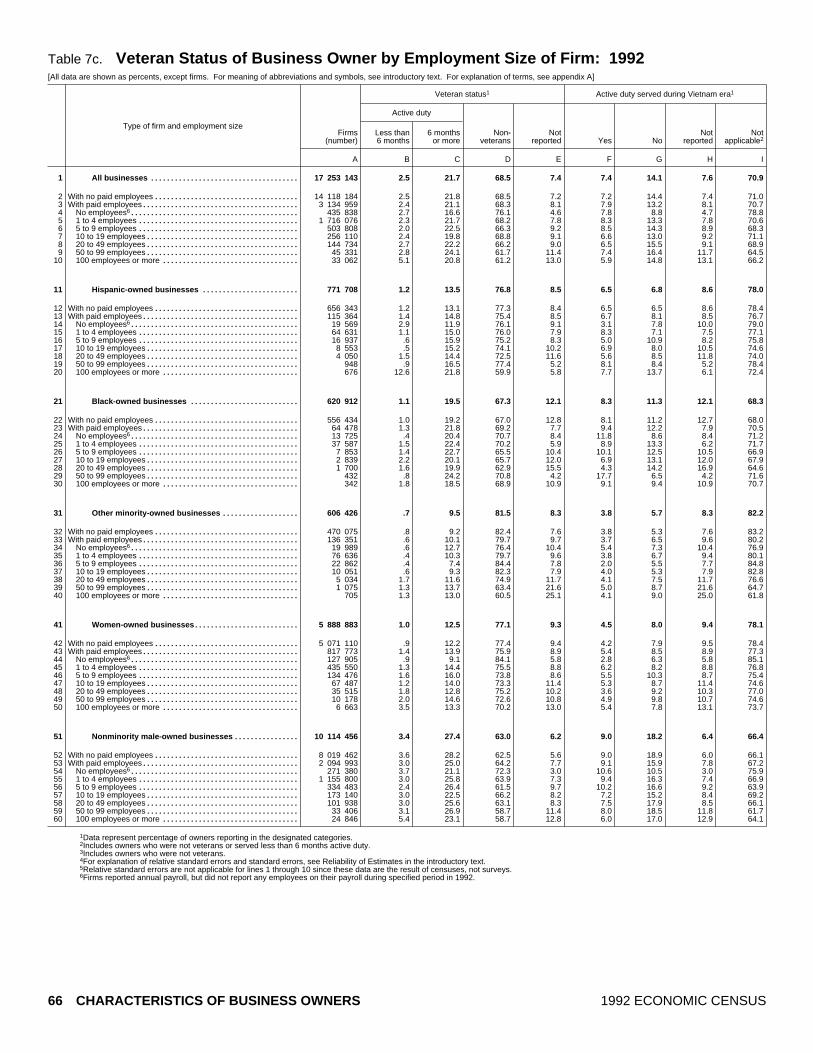
Table 7c. Veteran Status of Business Owner by Employment Size of Firm: 1992[All data are shown as percents, except firms. For meaning of abbreviations and symbols, see introductory text. For explanation of terms, see appendix A]
Type of firm and employment size
Veteran status1 Active duty served during Vietnam era1
Active duty
Firms(number)
Less than6 months
6 monthsor more
Non~veterans
Notreported Yes No
Notreported
Notapplicable2
A B C D E F G H I
All businesses 17 253 143..................................... 2.5 21.7 68.5 7.4 7.4 14.1 7.6 70.91
With no paid employees 14 118 184.................................... 2.5 21.8 68.5 7.2 7.2 14.4 7.4 71.02With paid employees 3 134 959....................................... 2.4 21.1 68.3 8.1 7.9 13.2 8.1 70.73
No employees6 435 838.......................................... 2.7 16.6 76.1 4.6 7.8 8.8 4.7 78.841 to 4 employees 1 716 076........................................ 2.3 21.7 68.2 7.8 8.3 13.3 7.8 70.655 to 9 employees 503 808........................................ 2.0 22.5 66.3 9.2 8.5 14.3 8.9 68.3610 to 19 employees 256 110...................................... 2.4 19.8 68.8 9.1 6.6 13.0 9.2 71.1720 to 49 employees 144 734...................................... 2.7 22.2 66.2 9.0 6.5 15.5 9.1 68.9850 to 99 employees 45 331...................................... 2.8 24.1 61.7 11.4 7.4 16.4 11.7 64.59100 employees or more 33 062.................................. 5.1 20.8 61.2 13.0 5.9 14.8 13.1 66.210
Hispanic ~owned businesses 771 708........................ 1.2 13.5 76.8 8.5 6.5 6.8 8.6 78.011
With no paid employees 656 343.................................... 1.2 13.1 77.3 8.4 6.5 6.5 8.6 78.412With paid employees 115 364....................................... 1.4 14.8 75.4 8.5 6.7 8.1 8.5 76.713
No employees6 19 569.......................................... 2.9 11.9 76.1 9.1 3.1 7.8 10.0 79.0141 to 4 employees 64 631........................................ 1.1 15.0 76.0 7.9 8.3 7.1 7.5 77.1155 to 9 employees 16 937........................................ .6 15.9 75.2 8.3 5.0 10.9 8.2 75.81610 to 19 employees 8 553...................................... .5 15.2 74.1 10.2 6.9 8.0 10.5 74.61720 to 49 employees 4 050...................................... 1.5 14.4 72.5 11.6 5.6 8.5 11.8 74.01850 to 99 employees 948...................................... .9 16.5 77.4 5.2 8.1 8.4 5.2 78.419100 employees or more 676.................................. 12.6 21.8 59.9 5.8 7.7 13.7 6.1 72.420
Black ~owned businesses 620 912........................... 1.1 19.5 67.3 12.1 8.3 11.3 12.1 68.321
With no paid employees 556 434.................................... 1.0 19.2 67.0 12.8 8.1 11.2 12.7 68.022With paid employees 64 478....................................... 1.3 21.8 69.2 7.7 9.4 12.2 7.9 70.523
No employees6 13 725.......................................... .4 20.4 70.7 8.4 11.8 8.6 8.4 71.2241 to 4 employees 37 587........................................ 1.5 22.4 70.2 5.9 8.9 13.3 6.2 71.7255 to 9 employees 7 853........................................ 1.4 22.7 65.5 10.4 10.1 12.5 10.5 66.92610 to 19 employees 2 839...................................... 2.2 20.1 65.7 12.0 6.9 13.1 12.0 67.92720 to 49 employees 1 700...................................... 1.6 19.9 62.9 15.5 4.3 14.2 16.9 64.62850 to 99 employees 432...................................... .8 24.2 70.8 4.2 17.7 6.5 4.2 71.629100 employees or more 342.................................. 1.8 18.5 68.9 10.9 9.1 9.4 10.9 70.730
Other minority ~owned businesses 606 426................... .7 9.5 81.5 8.3 3.8 5.7 8.3 82.231
With no paid employees 470 075.................................... .8 9.2 82.4 7.6 3.8 5.3 7.6 83.232With paid employees 136 351....................................... .6 10.1 79.7 9.7 3.7 6.5 9.6 80.233
No employees6 19 989.......................................... .6 12.7 76.4 10.4 5.4 7.3 10.4 76.9341 to 4 employees 76 636........................................ .4 10.3 79.7 9.6 3.8 6.7 9.4 80.1355 to 9 employees 22 862........................................ .4 7.4 84.4 7.8 2.0 5.5 7.7 84.83610 to 19 employees 10 051...................................... .6 9.3 82.3 7.9 4.0 5.3 7.9 82.83720 to 49 employees 5 034...................................... 1.7 11.6 74.9 11.7 4.1 7.5 11.7 76.63850 to 99 employees 1 075...................................... 1.3 13.7 63.4 21.6 5.0 8.7 21.6 64.739100 employees or more 705.................................. 1.3 13.0 60.5 25.1 4.1 9.0 25.0 61.840
Women ~owned businesses 5 888 883.......................... 1.0 12.5 77.1 9.3 4.5 8.0 9.4 78.141
With no paid employees 5 071 110.................................... .9 12.2 77.4 9.4 4.2 7.9 9.5 78.442With paid employees 817 773....................................... 1.4 13.9 75.9 8.9 5.4 8.5 8.9 77.343
No employees6 127 905.......................................... .9 9.1 84.1 5.8 2.8 6.3 5.8 85.1441 to 4 employees 435 550........................................ 1.3 14.4 75.5 8.8 6.2 8.2 8.8 76.8455 to 9 employees 134 476........................................ 1.6 16.0 73.8 8.6 5.5 10.3 8.7 75.44610 to 19 employees 67 487...................................... 1.2 14.0 73.3 11.4 5.3 8.7 11.4 74.64720 to 49 employees 35 515...................................... 1.8 12.8 75.2 10.2 3.6 9.2 10.3 77.04850 to 99 employees 10 178...................................... 2.0 14.6 72.6 10.8 4.9 9.8 10.7 74.649100 employees or more 6 663.................................. 3.5 13.3 70.2 13.0 5.4 7.8 13.1 73.750
Nonminority male ~owned businesses 10 114 456................ 3.4 27.4 63.0 6.2 9.0 18.2 6.4 66.451
With no paid employees 8 019 462.................................... 3.6 28.2 62.5 5.6 9.0 18.9 6.0 66.152With paid employees 2 094 993....................................... 3.0 25.0 64.2 7.7 9.1 15.9 7.8 67.253
No employees6 271 380.......................................... 3.7 21.1 72.3 3.0 10.6 10.5 3.0 75.9541 to 4 employees 1 155 800........................................ 3.0 25.8 63.9 7.3 9.4 16.3 7.4 66.9555 to 9 employees 334 483........................................ 2.4 26.4 61.5 9.7 10.2 16.6 9.2 63.95610 to 19 employees 173 140...................................... 3.0 22.5 66.2 8.2 7.2 15.2 8.4 69.25720 to 49 employees 101 938...................................... 3.0 25.6 63.1 8.3 7.5 17.9 8.5 66.15850 to 99 employees 33 406...................................... 3.1 26.9 58.7 11.4 8.0 18.5 11.8 61.759100 employees or more 24 846.................................. 5.4 23.1 58.7 12.8 6.0 17.0 12.9 64.160
1Data represent percentage of owners reporting in the designated categories.2Includes owners who were not veterans or served less than 6 months active duty.3Includes owners who were not veterans.4For explanation of relative standard errors and standard errors, see Reliability of Estimates in the introductory text.5Relative standard errors are not applicable for lines 1 through 10 since these data are the result of censuses, not surveys.6Firms reported annual payroll, but did not report any employees on their payroll during specified period in 1992.
66 CHARACTERISTICS OF BUSINESS OWNERS 1992 ECONOMIC CENSUS
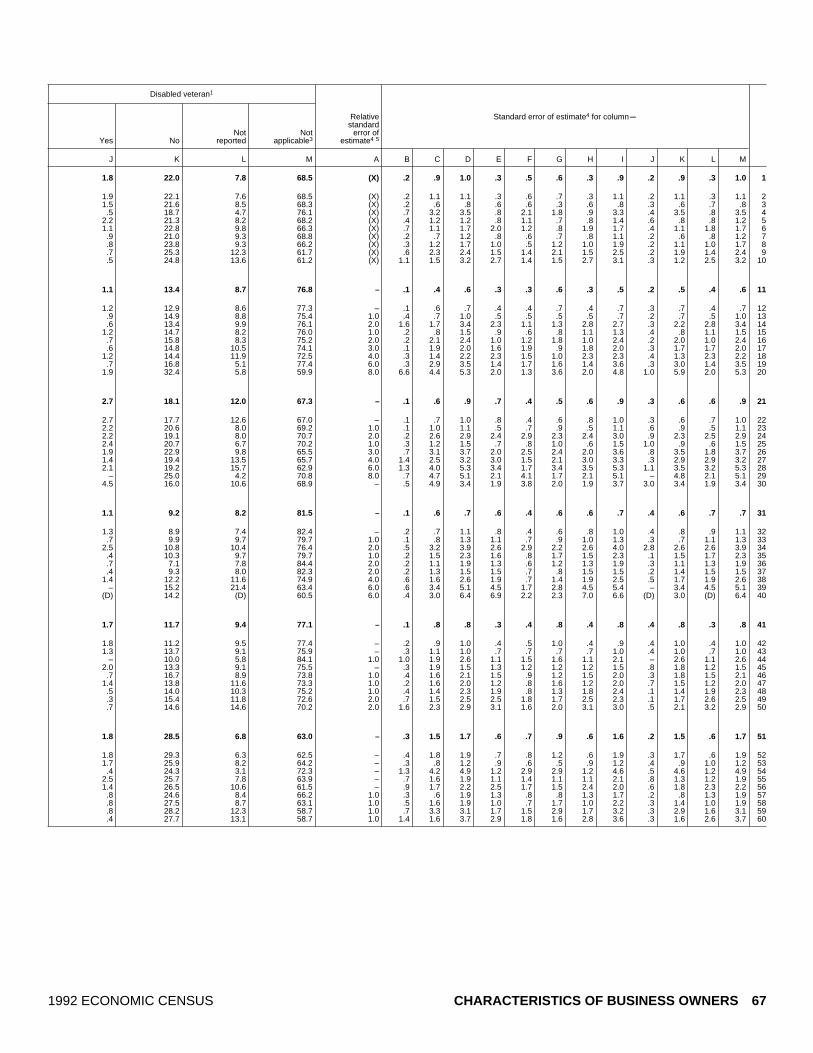
Disabled veteran1
Standard error of estimate4 for columnm
Yes NoNot
reportedNot
applicable3
Relativestandard
error ofestimate4 5
J K L M A B C D E F G H I J K L M
1.8 22.0 7.8 68.5 (X) .2 .9 1.0 .3 .5 .6 .3 .9 .2 .9 .3 1.0 1
1.9 22.1 7.6 68.5 (X) .2 1.1 1.1 .3 .6 .7 .3 1.1 .2 1.1 .3 1.1 21.5 21.6 8.5 68.3 (X) .2 .6 .8 .6 .6 .3 .6 .8 .3 .6 .7 .8 3.5 18.7 4.7 76.1 (X) .7 3.2 3.5 .8 2.1 1.8 .9 3.3 .4 3.5 .8 3.5 4
2.2 21.3 8.2 68.2 (X) .4 1.2 1.2 .8 1.1 .7 .8 1.4 .6 .8 .8 1.2 51.1 22.8 9.8 66.3 (X) .7 1.1 1.7 2.0 1.2 .8 1.9 1.7 .4 1.1 1.8 1.7 6.9 21.0 9.3 68.8 (X) .2 .7 1.2 .8 .6 .7 .8 1.1 .2 .6 .8 1.2 7.8 23.8 9.3 66.2 (X) .3 1.2 1.7 1.0 .5 1.2 1.0 1.9 .2 1.1 1.0 1.7 8.7 25.3 12.3 61.7 (X) .6 2.3 2.4 1.5 1.4 2.1 1.5 2.5 .2 1.9 1.4 2.4 9.5 24.8 13.6 61.2 (X) 1.1 1.5 3.2 2.7 1.4 1.5 2.7 3.1 .3 1.2 2.5 3.2 10
1.1 13.4 8.7 76.8 – .1 .4 .6 .3 .3 .6 .3 .5 .2 .5 .4 .6 11
1.2 12.9 8.6 77.3 – .1 .6 .7 .4 .4 .7 .4 .7 .3 .7 .4 .7 12.9 14.9 8.8 75.4 1.0 .4 .7 1.0 .5 .5 .5 .5 .7 .2 .7 .5 1.0 13.6 13.4 9.9 76.1 2.0 1.6 1.7 3.4 2.3 1.1 1.3 2.8 2.7 .3 2.2 2.8 3.4 14
1.2 14.7 8.2 76.0 1.0 .2 .8 1.5 .9 .6 .8 1.1 1.3 .4 .8 1.1 1.5 15.7 15.8 8.3 75.2 2.0 .2 2.1 2.4 1.0 1.2 1.8 1.0 2.4 .2 2.0 1.0 2.4 16.6 14.8 10.5 74.1 3.0 .1 1.9 2.0 1.6 1.9 .9 1.8 2.0 .3 1.7 1.7 2.0 17
1.2 14.4 11.9 72.5 4.0 .3 1.4 2.2 2.3 1.5 1.0 2.3 2.3 .4 1.3 2.3 2.2 18.7 16.8 5.1 77.4 6.0 .3 2.9 3.5 1.4 1.7 1.6 1.4 3.6 .3 3.0 1.4 3.5 19
1.9 32.4 5.8 59.9 8.0 6.6 4.4 5.3 2.0 1.3 3.6 2.0 4.8 1.0 5.9 2.0 5.3 20
2.7 18.1 12.0 67.3 – .1 .6 .9 .7 .4 .5 .6 .9 .3 .6 .6 .9 21
2.7 17.7 12.6 67.0 – .1 .7 1.0 .8 .4 .6 .8 1.0 .3 .6 .7 1.0 222.2 20.6 8.0 69.2 1.0 .1 1.0 1.1 .5 .7 .9 .5 1.1 .6 .9 .5 1.1 232.2 19.1 8.0 70.7 2.0 .2 2.6 2.9 2.4 2.9 2.3 2.4 3.0 .9 2.3 2.5 2.9 242.4 20.7 6.7 70.2 1.0 .3 1.2 1.5 .7 .8 1.0 .6 1.5 1.0 .9 .6 1.5 251.9 22.9 9.8 65.5 3.0 .7 3.1 3.7 2.0 2.5 2.4 2.0 3.6 .8 3.5 1.8 3.7 261.4 19.4 13.5 65.7 4.0 1.4 2.5 3.2 3.0 1.5 2.1 3.0 3.3 .3 2.9 2.9 3.2 272.1 19.2 15.7 62.9 6.0 1.3 4.0 5.3 3.4 1.7 3.4 3.5 5.3 1.1 3.5 3.2 5.3 28
– 25.0 4.2 70.8 8.0 .7 4.7 5.1 2.1 4.1 1.7 2.1 5.1 – 4.8 2.1 5.1 294.5 16.0 10.6 68.9 – .5 4.9 3.4 1.9 3.8 2.0 1.9 3.7 3.0 3.4 1.9 3.4 30
1.1 9.2 8.2 81.5 – .1 .6 .7 .6 .4 .6 .6 .7 .4 .6 .7 .7 31
1.3 8.9 7.4 82.4 – .2 .7 1.1 .8 .4 .6 .8 1.0 .4 .8 .9 1.1 32.7 9.9 9.7 79.7 1.0 .1 .8 1.3 1.1 .7 .9 1.0 1.3 .3 .7 1.1 1.3 33
2.5 10.8 10.4 76.4 2.0 .5 3.2 3.9 2.6 2.9 2.2 2.6 4.0 2.8 2.6 2.6 3.9 34.4 10.3 9.7 79.7 1.0 .2 1.5 2.3 1.6 .8 1.7 1.5 2.3 .1 1.5 1.7 2.3 35.7 7.1 7.8 84.4 2.0 .2 1.1 1.9 1.3 .6 1.2 1.3 1.9 .3 1.1 1.3 1.9 36.4 9.3 8.0 82.3 2.0 .2 1.3 1.5 1.5 .7 .8 1.5 1.5 .2 1.4 1.5 1.5 37
1.4 12.2 11.6 74.9 4.0 .6 1.6 2.6 1.9 .7 1.4 1.9 2.5 .5 1.7 1.9 2.6 38– 15.2 21.4 63.4 6.0 .6 3.4 5.1 4.5 1.7 2.8 4.5 5.4 – 3.4 4.5 5.1 39
(D) 14.2 (D) 60.5 6.0 .4 3.0 6.4 6.9 2.2 2.3 7.0 6.6 (D) 3.0 (D) 6.4 40
1.7 11.7 9.4 77.1 – .1 .8 .8 .3 .4 .8 .4 .8 .4 .8 .3 .8 41
1.8 11.2 9.5 77.4 – .2 .9 1.0 .4 .5 1.0 .4 .9 .4 1.0 .4 1.0 421.3 13.7 9.1 75.9 – .3 1.1 1.0 .7 .7 .7 .7 1.0 .4 1.0 .7 1.0 43
– 10.0 5.8 84.1 1.0 1.0 1.9 2.6 1.1 1.5 1.6 1.1 2.1 – 2.6 1.1 2.6 442.0 13.3 9.1 75.5 – .3 1.9 1.5 1.3 1.2 1.2 1.2 1.5 .8 1.8 1.2 1.5 45.7 16.7 8.9 73.8 1.0 .4 1.6 2.1 1.5 .9 1.2 1.5 2.0 .3 1.8 1.5 2.1 46
1.4 13.8 11.6 73.3 1.0 .2 1.6 2.0 1.2 .8 1.6 1.2 2.0 .7 1.5 1.2 2.0 47.5 14.0 10.3 75.2 1.0 .4 1.4 2.3 1.9 .8 1.3 1.8 2.4 .1 1.4 1.9 2.3 48.3 15.4 11.8 72.6 2.0 .7 1.5 2.5 2.5 1.8 1.7 2.5 2.3 .1 1.7 2.6 2.5 49.7 14.6 14.6 70.2 2.0 1.6 2.3 2.9 3.1 1.6 2.0 3.1 3.0 .5 2.1 3.2 2.9 50
1.8 28.5 6.8 63.0 – .3 1.5 1.7 .6 .7 .9 .6 1.6 .2 1.5 .6 1.7 51
1.8 29.3 6.3 62.5 – .4 1.8 1.9 .7 .8 1.2 .6 1.9 .3 1.7 .6 1.9 521.7 25.9 8.2 64.2 – .3 .8 1.2 .9 .6 .5 .9 1.2 .4 .9 1.0 1.2 53.4 24.3 3.1 72.3 – 1.3 4.2 4.9 1.2 2.9 2.9 1.2 4.6 .5 4.6 1.2 4.9 54
2.5 25.7 7.8 63.9 – .7 1.6 1.9 1.1 1.4 1.1 1.1 2.1 .8 1.3 1.2 1.9 551.4 26.5 10.6 61.5 – .9 1.7 2.2 2.5 1.7 1.5 2.4 2.0 .6 1.8 2.3 2.2 56.8 24.6 8.4 66.2 1.0 .3 .6 1.9 1.3 .8 .8 1.3 1.7 .2 .8 1.3 1.9 57.8 27.5 8.7 63.1 1.0 .5 1.6 1.9 1.0 .7 1.7 1.0 2.2 .3 1.4 1.0 1.9 58.8 28.2 12.3 58.7 1.0 .7 3.3 3.1 1.7 1.5 2.9 1.7 3.2 .3 2.9 1.6 3.1 59.4 27.7 13.1 58.7 1.0 1.4 1.6 3.7 2.9 1.8 1.6 2.8 3.6 .3 1.6 2.6 3.7 60
1992 ECONOMIC CENSUS CHARACTERISTICS OF BUSINESS OWNERS 67

Table 7d. Veteran Status of Business Owner by Legal Form of Organization of Firm: 1992[All data are shown as percents, except firms. For meaning of abbreviations and symbols, see introductory text. For explanation of terms, see appendix A]
Type of firm and legal form of organization
Veteran status1 Active duty served during Vietnam era1
Active duty
Firms(number)
Less than6 months
6 monthsor more
Non~veterans
Notreported Yes No
Notreported
Notapplicable2
A B C D E F G H I
All businesses 17 253 143..................................... 2.5 21.7 68.5 7.4 7.4 14.1 7.6 70.91
Individual proprietorships 14 599 295................................... 2.4 21.4 69.8 6.3 7.6 13.7 6.5 72.22Partnerships 1 089 578.............................................. 3.8 22.6 63.9 9.7 4.9 17.2 10.2 67.73Subchapter S corporations 1 564 270................................. 1.9 22.0 65.7 10.4 8.2 13.8 10.5 67.64
Hispanic ~owned businesses 771 708........................ 1.2 13.5 76.8 8.5 6.5 6.8 8.6 78.05
Individual proprietorships 689 015................................... 1.2 13.0 78.2 7.6 6.6 6.3 7.7 79.46Partnerships 32 650.............................................. .9 16.6 68.5 13.9 5.4 10.1 15.0 69.47Subchapter S corporations 50 042................................. 1.7 14.0 75.3 9.0 6.6 7.3 9.0 77.08
Black ~owned businesses 620 912........................... 1.1 19.5 67.3 12.1 8.3 11.3 12.1 68.39
Individual proprietorships 584 256................................... 1.1 19.1 67.5 12.2 8.1 11.1 12.2 68.610Partnerships 14 727.............................................. .6 26.4 58.4 14.6 9.2 16.6 15.2 59.011Subchapter S corporations 21 928................................. .9 22.8 68.1 8.2 11.4 11.0 8.6 69.012
Other minority ~owned businesses 606 426................... .7 9.5 81.5 8.3 3.8 5.7 8.3 82.213
Individual proprietorships 502 022................................... .6 7.2 87.3 4.9 3.2 4.1 4.8 87.914Partnerships 49 489.............................................. 1.4 12.1 71.7 14.8 3.4 8.5 15.0 73.115Subchapter S corporations 54 915................................. .5 13.4 74.0 12.1 5.6 7.8 12.0 74.516
Women ~owned businesses 5 888 883.......................... 1.0 12.5 77.1 9.3 4.5 8.0 9.4 78.117
Individual proprietorships 5 078 077................................... .9 11.9 78.9 8.3 4.3 7.5 8.4 79.818Partnerships 243 651.............................................. 1.2 12.9 72.1 13.8 2.4 10.5 13.8 73.319Subchapter S corporations 567 155................................. 1.4 15.2 71.6 11.8 6.0 9.2 11.9 72.920
Nonminority male ~owned businesses 10 114 456................ 3.4 27.4 63.0 6.2 9.0 18.2 6.4 66.421
Individual proprietorships 8 414 238................................... 3.4 27.8 63.7 5.1 9.6 18.0 5.3 67.122Partnerships 777 379.............................................. 4.8 26.1 61.0 8.2 5.6 19.9 8.8 65.723Subchapter S corporations 922 838................................. 2.2 26.9 61.4 9.5 9.6 17.2 9.6 63.624
1Data represent percentage of owners reporting in the designated categories.2Includes owners who were not veterans or served less than 6 months active duty.3Includes owners who were not veterans.4For explanation of relative standard errors and standard errors, see Reliability of Estimates in the introductory text.5Relative standard errors are not applicable for lines 1 through 4 since these data are the result of censuses, not surveys.
68 CHARACTERISTICS OF BUSINESS OWNERS 1992 ECONOMIC CENSUS

Disabled veteran1
Standard error of estimate4 for columnm
Yes NoNot
reportedNot
applicable3
Relativestandard
error ofestimate4 5
J K L M A B C D E F G H I J K L M
1.8 22.0 7.8 68.5 (X) .2 .7 .8 .4 .3 .5 .4 .7 .2 .7 .4 .8 1
1.9 21.6 6.7 69.8 (X) .3 .9 .9 .5 .5 .7 .5 .9 .2 .9 .5 .9 21.4 24.1 10.5 63.9 (X) 1.1 1.7 2.1 .7 .8 1.2 .7 2.0 .4 1.8 .7 2.1 31.5 22.1 10.7 65.7 (X) .1 .9 1.3 .7 .6 .9 .7 1.3 .3 .8 .7 1.3 4
1.1 13.4 8.7 76.8 – .2 1.0 1.1 .4 .8 .4 .4 1.1 .2 1.0 .4 1.1 5
1.3 12.8 7.7 78.2 – .2 1.0 1.2 .4 .8 .5 .4 1.1 .2 1.0 .4 1.2 6.8 15.7 15.1 68.5 2.0 .3 1.2 1.6 1.7 1.1 1.0 1.7 1.6 .2 1.3 1.7 1.6 7.6 15.0 9.1 75.3 1.0 .3 1.5 1.9 .5 1.1 .6 .5 1.8 .1 1.7 .5 1.9 8
2.7 18.1 12.0 67.3 – .2 .5 .4 .7 .5 .3 .6 .5 .2 .4 .6 .4 9
2.7 17.7 12.1 67.5 – .2 .5 .4 .7 .5 .2 .7 .4 .3 .5 .6 .4 102.4 23.7 15.5 58.4 3.0 .4 2.7 3.4 2.7 1.5 2.5 2.7 3.4 .5 2.9 2.6 3.4 112.5 20.9 8.5 68.1 2.0 .2 2.2 2.4 1.4 2.0 1.1 1.5 2.4 .9 2.1 1.4 2.4 12
1.1 9.2 8.2 81.5 – .2 .6 .8 .6 .5 .5 .6 .9 .2 .5 .6 .8 13
1.0 7.0 4.7 87.3 – .2 .6 .7 .6 .4 .5 .6 .7 .3 .4 .5 .7 141.2 12.4 14.7 71.7 1.0 .5 1.5 2.4 1.4 .8 1.7 1.5 2.6 .5 1.4 1.4 2.4 151.3 12.6 12.1 74.0 1.0 .2 1.0 1.5 1.1 .8 .8 1.1 1.4 .4 1.0 1.1 1.5 16
1.7 11.7 9.4 77.1 – .2 .6 .8 .8 .3 .6 .8 .8 .2 .6 .8 .8 17
1.9 10.8 8.4 78.9 – .2 .7 1.0 .9 .4 .7 .9 1.0 .3 .7 .9 1.0 18.9 13.1 13.9 72.1 1.0 .4 1.6 2.9 1.8 .9 1.6 1.8 3.1 .7 1.3 1.9 2.9 19
1.3 14.9 12.2 71.6 – .2 1.4 1.6 1.1 .9 1.0 1.1 1.6 .3 1.5 1.1 1.6 20
1.8 28.5 6.8 63.0 – .4 1.1 1.0 .5 .6 .8 .5 .9 .3 1.1 .6 1.0 21
1.9 28.7 5.6 63.7 – .4 1.3 1.2 .6 .8 .9 .5 1.1 .3 1.4 .7 1.2 221.6 28.3 9.2 61.0 – 1.7 2.2 3.0 1.0 .9 1.6 1.2 2.6 .6 2.5 1.2 3.0 231.6 27.3 9.8 61.4 – .3 2.1 2.3 1.1 1.0 1.6 1.1 2.2 .6 1.9 1.1 2.3 24
1992 ECONOMIC CENSUS CHARACTERISTICS OF BUSINESS OWNERS 69
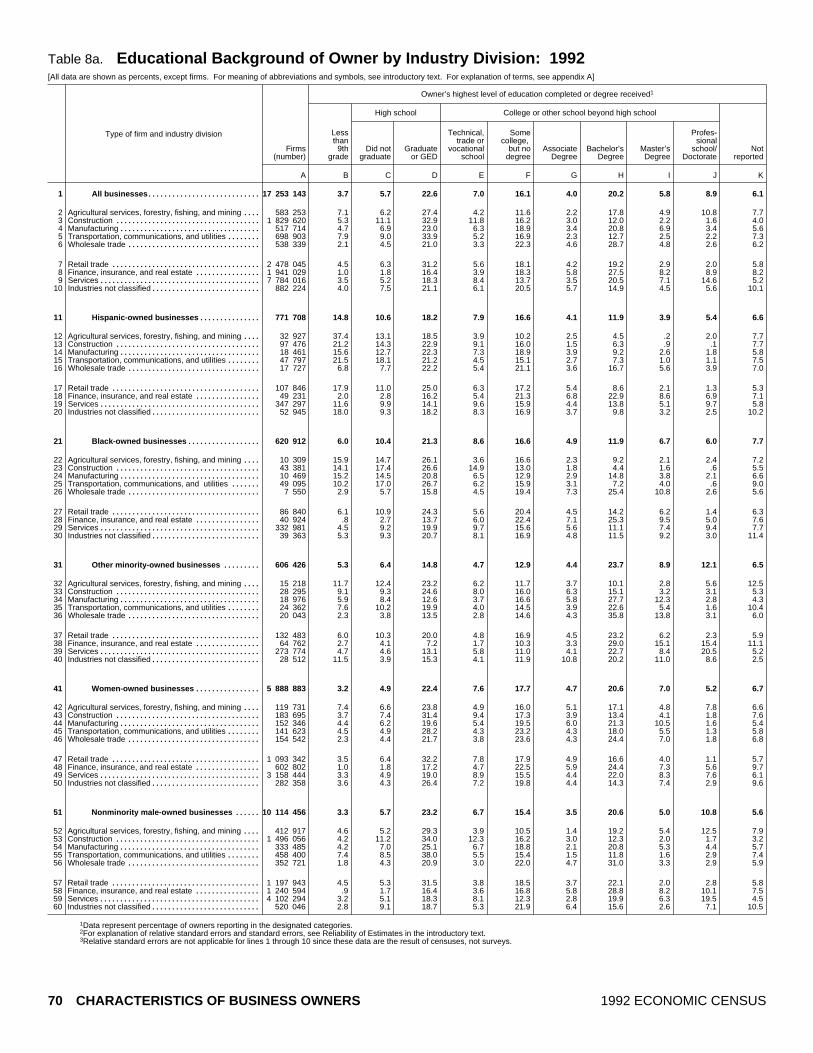
Table 8a. Educational Background of Owner by Industry Division: 1992[All data are shown as percents, except firms. For meaning of abbreviations and symbols, see introductory text. For explanation of terms, see appendix A]
Type of firm and industry division
Owner’s highest level of education completed or degree received1
High school College or other school beyond high school
Firms(number)
Lessthan
9thgrade
Did notgraduate
Graduateor GED
Technical,trade or
vocationalschool
Somecollege,
but nodegree
AssociateDegree
Bachelor’sDegree
Master’sDegree
Profes~sional
school/Doctorate
Notreported
A B C D E F G H I J K
All businesses 17 253 143............................ 3.7 5.7 22.6 7.0 16.1 4.0 20.2 5.8 8.9 6.11
Agricultural services, forestry, fishing, and mining 583 253.... 7.1 6.2 27.4 4.2 11.6 2.2 17.8 4.9 10.8 7.72Construction 1 829 620.................................... 5.3 11.1 32.9 11.8 16.2 3.0 12.0 2.2 1.6 4.03Manufacturing 517 714................................... 4.7 6.9 23.0 6.3 18.9 3.4 20.8 6.9 3.4 5.64Transportation, communications, and utilities 698 903........ 7.9 9.0 33.9 5.2 16.9 2.3 12.7 2.5 2.2 7.35Wholesale trade 538 339................................. 2.1 4.5 21.0 3.3 22.3 4.6 28.7 4.8 2.6 6.26
Retail trade 2 478 045..................................... 4.5 6.3 31.2 5.6 18.1 4.2 19.2 2.9 2.0 5.87Finance, insurance, and real estate 1 941 029................ 1.0 1.8 16.4 3.9 18.3 5.8 27.5 8.2 8.9 8.28Services 7 784 016........................................ 3.5 5.2 18.3 8.4 13.7 3.5 20.5 7.1 14.6 5.29Industries not classified 882 224........................... 4.0 7.5 21.1 6.1 20.5 5.7 14.9 4.5 5.6 10.110
Hispanic ~owned businesses 771 708............... 14.8 10.6 18.2 7.9 16.6 4.1 11.9 3.9 5.4 6.611
Agricultural services, forestry, fishing, and mining 32 927.... 37.4 13.1 18.5 3.9 10.2 2.5 4.5 .2 2.0 7.712Construction 97 476.................................... 21.2 14.3 22.9 9.1 16.0 1.5 6.3 .9 .1 7.713Manufacturing 18 461................................... 15.6 12.7 22.3 7.3 18.9 3.9 9.2 2.6 1.8 5.814Transportation, communications, and utilities 47 797........ 21.5 18.1 21.2 4.5 15.1 2.7 7.3 1.0 1.1 7.515Wholesale trade 17 727................................. 6.8 7.7 22.2 5.4 21.1 3.6 16.7 5.6 3.9 7.016
Retail trade 107 846..................................... 17.9 11.0 25.0 6.3 17.2 5.4 8.6 2.1 1.3 5.317Finance, insurance, and real estate 49 231................ 2.0 2.8 16.2 5.4 21.3 6.8 22.9 8.6 6.9 7.118Services 347 297........................................ 11.6 9.9 14.1 9.6 15.9 4.4 13.8 5.1 9.7 5.819Industries not classified 52 945........................... 18.0 9.3 18.2 8.3 16.9 3.7 9.8 3.2 2.5 10.220
Black ~owned businesses 620 912.................. 6.0 10.4 21.3 8.6 16.6 4.9 11.9 6.7 6.0 7.721
Agricultural services, forestry, fishing, and mining 10 309.... 15.9 14.7 26.1 3.6 16.6 2.3 9.2 2.1 2.4 7.222Construction 43 381.................................... 14.1 17.4 26.6 14.9 13.0 1.8 4.4 1.6 .6 5.523Manufacturing 10 469................................... 15.2 14.5 20.8 6.5 12.9 2.9 14.8 3.8 2.1 6.624Transportation, communications, and utilities 49 095....... 10.2 17.0 26.7 6.2 15.9 3.1 7.2 4.0 .6 9.025Wholesale trade 7 550................................. 2.9 5.7 15.8 4.5 19.4 7.3 25.4 10.8 2.6 5.626
Retail trade 86 840..................................... 6.1 10.9 24.3 5.6 20.4 4.5 14.2 6.2 1.4 6.327Finance, insurance, and real estate 40 924................ .8 2.7 13.7 6.0 22.4 7.1 25.3 9.5 5.0 7.628Services 332 981........................................ 4.5 9.2 19.9 9.7 15.6 5.6 11.1 7.4 9.4 7.729Industries not classified 39 363........................... 5.3 9.3 20.7 8.1 16.9 4.8 11.5 9.2 3.0 11.430
Other minority ~owned businesses 606 426......... 5.3 6.4 14.8 4.7 12.9 4.4 23.7 8.9 12.1 6.531
Agricultural services, forestry, fishing, and mining 15 218.... 11.7 12.4 23.2 6.2 11.7 3.7 10.1 2.8 5.6 12.532Construction 28 295.................................... 9.1 9.3 24.6 8.0 16.0 6.3 15.1 3.2 3.1 5.333Manufacturing 18 976................................... 5.9 8.4 12.6 3.7 16.6 5.8 27.7 12.3 2.8 4.334Transportation, communications, and utilities 24 362........ 7.6 10.2 19.9 4.0 14.5 3.9 22.6 5.4 1.6 10.435Wholesale trade 20 043................................. 2.3 3.8 13.5 2.8 14.6 4.3 35.8 13.8 3.1 6.036
Retail trade 132 483..................................... 6.0 10.3 20.0 4.8 16.9 4.5 23.2 6.2 2.3 5.937Finance, insurance, and real estate 64 762................ 2.7 4.1 7.2 1.7 10.3 3.3 29.0 15.1 15.4 11.138Services 273 774........................................ 4.7 4.6 13.1 5.8 11.0 4.1 22.7 8.4 20.5 5.239Industries not classified 28 512........................... 11.5 3.9 15.3 4.1 11.9 10.8 20.2 11.0 8.6 2.540
Women ~owned businesses 5 888 883................ 3.2 4.9 22.4 7.6 17.7 4.7 20.6 7.0 5.2 6.741
Agricultural services, forestry, fishing, and mining 119 731.... 7.4 6.6 23.8 4.9 16.0 5.1 17.1 4.8 7.8 6.642Construction 183 695.................................... 3.7 7.4 31.4 9.4 17.3 3.9 13.4 4.1 1.8 7.643Manufacturing 152 346................................... 4.4 6.2 19.6 5.4 19.5 6.0 21.3 10.5 1.6 5.444Transportation, communications, and utilities 141 623........ 4.5 4.9 28.2 4.3 23.2 4.3 18.0 5.5 1.3 5.845Wholesale trade 154 542................................. 2.3 4.4 21.7 3.8 23.6 4.3 24.4 7.0 1.8 6.846
Retail trade 1 093 342..................................... 3.5 6.4 32.2 7.8 17.9 4.9 16.6 4.0 1.1 5.747Finance, insurance, and real estate 602 802................ 1.0 1.8 17.2 4.7 22.5 5.9 24.4 7.3 5.6 9.748Services 3 158 444........................................ 3.3 4.9 19.0 8.9 15.5 4.4 22.0 8.3 7.6 6.149Industries not classified 282 358........................... 3.6 4.3 26.4 7.2 19.8 4.4 14.3 7.4 2.9 9.650
Nonminority male ~owned businesses 10 114 456...... 3.3 5.7 23.2 6.7 15.4 3.5 20.6 5.0 10.8 5.651
Agricultural services, forestry, fishing, and mining 412 917.... 4.6 5.2 29.3 3.9 10.5 1.4 19.2 5.4 12.5 7.952Construction 1 496 056.................................... 4.2 11.2 34.0 12.3 16.2 3.0 12.3 2.0 1.7 3.253Manufacturing 333 485................................... 4.2 7.0 25.1 6.7 18.8 2.1 20.8 5.3 4.4 5.754Transportation, communications, and utilities 458 400........ 7.4 8.5 38.0 5.5 15.4 1.5 11.8 1.6 2.9 7.455Wholesale trade 352 721................................. 1.8 4.3 20.9 3.0 22.0 4.7 31.0 3.3 2.9 5.956
Retail trade 1 197 943..................................... 4.5 5.3 31.5 3.8 18.5 3.7 22.1 2.0 2.8 5.857Finance, insurance, and real estate 1 240 594................ .9 1.7 16.4 3.6 16.8 5.8 28.8 8.2 10.1 7.558Services 4 102 294........................................ 3.2 5.1 18.3 8.1 12.3 2.8 19.9 6.3 19.5 4.559Industries not classified 520 046........................... 2.8 9.1 18.7 5.3 21.9 6.4 15.6 2.6 7.1 10.560
1Data represent percentage of owners reporting in the designated categories.2For explanation of relative standard errors and standard errors, see Reliability of Estimates in the introductory text.3Relative standard errors are not applicable for lines 1 through 10 since these data are the result of censuses, not surveys.
70 CHARACTERISTICS OF BUSINESS OWNERS 1992 ECONOMIC CENSUS
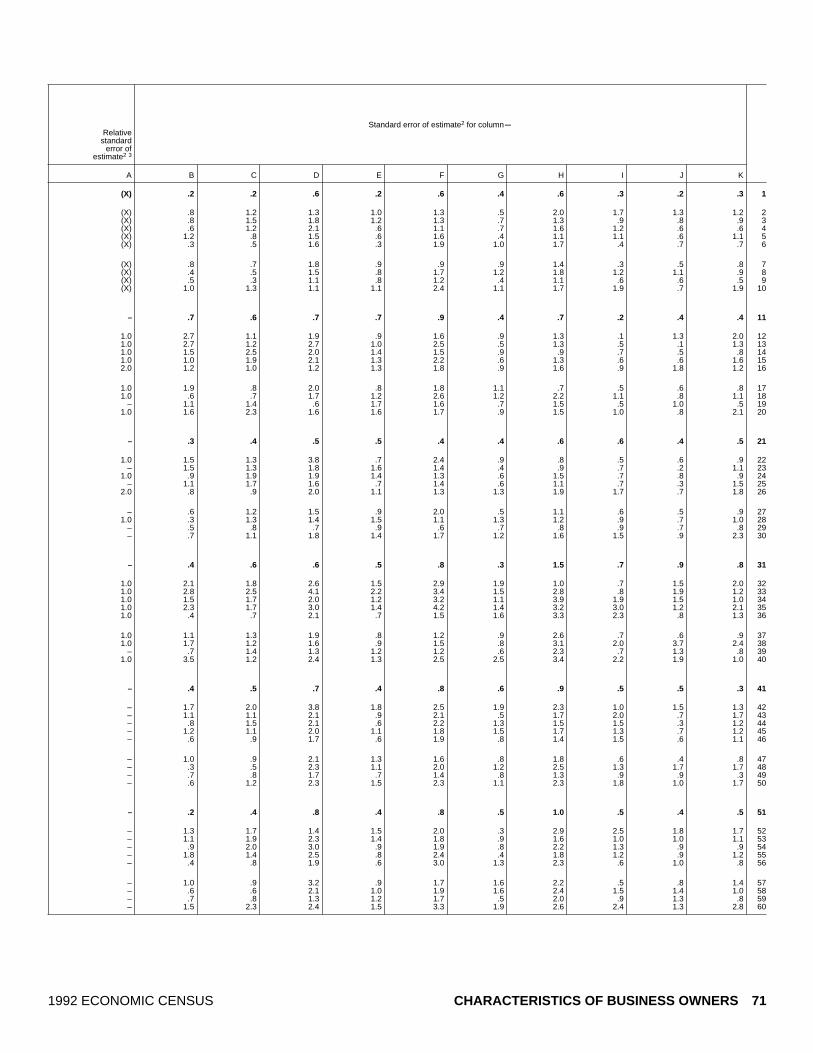
Standard error of estimate2 for columnmRelative
standarderror of
estimate2 3
A B C D E F G H I J K
(X) .2 .2 .6 .2 .6 .4 .6 .3 .2 .3 1
(X) .8 1.2 1.3 1.0 1.3 .5 2.0 1.7 1.3 1.2 2(X) .8 1.5 1.8 1.2 1.3 .7 1.3 .9 .8 .9 3(X) .6 1.2 2.1 .6 1.1 .7 1.6 1.2 .6 .6 4(X) 1.2 .8 1.5 .6 1.6 .4 1.1 1.1 .6 1.1 5(X) .3 .5 1.6 .3 1.9 1.0 1.7 .4 .7 .7 6
(X) .8 .7 1.8 .9 .9 .9 1.4 .3 .5 .8 7(X) .4 .5 1.5 .8 1.7 1.2 1.8 1.2 1.1 .9 8(X) .5 .3 1.1 .8 1.2 .4 1.1 .6 .6 .5 9(X) 1.0 1.3 1.1 1.1 2.4 1.1 1.7 1.9 .7 1.9 10
– .7 .6 .7 .7 .9 .4 .7 .2 .4 .4 11
1.0 2.7 1.1 1.9 .9 1.6 .9 1.3 .1 1.3 2.0 121.0 2.7 1.2 2.7 1.0 2.5 .5 1.3 .5 .1 1.3 131.0 1.5 2.5 2.0 1.4 1.5 .9 .9 .7 .5 .8 141.0 1.0 1.9 2.1 1.3 2.2 .6 1.3 .6 .6 1.6 152.0 1.2 1.0 1.2 1.3 1.8 .9 1.6 .9 1.8 1.2 16
1.0 1.9 .8 2.0 .8 1.8 1.1 .7 .5 .6 .8 171.0 .6 .7 1.7 1.2 2.6 1.2 2.2 1.1 .8 1.1 18
– 1.1 1.4 .6 1.7 1.6 .7 1.5 .5 1.0 .5 191.0 1.6 2.3 1.6 1.6 1.7 .9 1.5 1.0 .8 2.1 20
– .3 .4 .5 .5 .4 .4 .6 .6 .4 .5 21
1.0 1.5 1.3 3.8 .7 2.4 .9 .8 .5 .6 .9 22– 1.5 1.3 1.8 1.6 1.4 .4 .9 .7 .2 1.1 23
1.0 .9 1.9 1.9 1.4 1.3 .6 1.5 .7 .8 .9 24– 1.1 1.7 1.6 .7 1.4 .6 1.1 .7 .3 1.5 25
2.0 .8 .9 2.0 1.1 1.3 1.3 1.9 1.7 .7 1.8 26
– .6 1.2 1.5 .9 2.0 .5 1.1 .6 .5 .9 271.0 .3 1.3 1.4 1.5 1.1 1.3 1.2 .9 .7 1.0 28
– .5 .8 .7 .9 .6 .7 .8 .9 .7 .8 29– .7 1.1 1.8 1.4 1.7 1.2 1.6 1.5 .9 2.3 30
– .4 .6 .6 .5 .8 .3 1.5 .7 .9 .8 31
1.0 2.1 1.8 2.6 1.5 2.9 1.9 1.0 .7 1.5 2.0 321.0 2.8 2.5 4.1 2.2 3.4 1.5 2.8 .8 1.9 1.2 331.0 1.5 1.7 2.0 1.2 3.2 1.1 3.9 1.9 1.5 1.0 341.0 2.3 1.7 3.0 1.4 4.2 1.4 3.2 3.0 1.2 2.1 351.0 .4 .7 2.1 .7 1.5 1.6 3.3 2.3 .8 1.3 36
1.0 1.1 1.3 1.9 .8 1.2 .9 2.6 .7 .6 .9 371.0 1.7 1.2 1.6 .9 1.5 .8 3.1 2.0 3.7 2.4 38
– .7 1.4 1.3 1.2 1.2 .6 2.3 .7 1.3 .8 391.0 3.5 1.2 2.4 1.3 2.5 2.5 3.4 2.2 1.9 1.0 40
– .4 .5 .7 .4 .8 .6 .9 .5 .5 .3 41
– 1.7 2.0 3.8 1.8 2.5 1.9 2.3 1.0 1.5 1.3 42– 1.1 1.1 2.1 .9 2.1 .5 1.7 2.0 .7 1.7 43– .8 1.5 2.1 .6 2.2 1.3 1.5 1.5 .3 1.2 44– 1.2 1.1 2.0 1.1 1.8 1.5 1.7 1.3 .7 1.2 45– .6 .9 1.7 .6 1.9 .8 1.4 1.5 .6 1.1 46
– 1.0 .9 2.1 1.3 1.6 .8 1.8 .6 .4 .8 47– .3 .5 2.3 1.1 2.0 1.2 2.5 1.3 1.7 1.7 48– .7 .8 1.7 .7 1.4 .8 1.3 .9 .9 .3 49– .6 1.2 2.3 1.5 2.3 1.1 2.3 1.8 1.0 1.7 50
– .2 .4 .8 .4 .8 .5 1.0 .5 .4 .5 51
– 1.3 1.7 1.4 1.5 2.0 .3 2.9 2.5 1.8 1.7 52– 1.1 1.9 2.3 1.4 1.8 .9 1.6 1.0 1.0 1.1 53– .9 2.0 3.0 .9 1.9 .8 2.2 1.3 .9 .9 54– 1.8 1.4 2.5 .8 2.4 .4 1.8 1.2 .9 1.2 55– .4 .8 1.9 .6 3.0 1.3 2.3 .6 1.0 .8 56
– 1.0 .9 3.2 .9 1.7 1.6 2.2 .5 .8 1.4 57– .6 .6 2.1 1.0 1.9 1.6 2.4 1.5 1.4 1.0 58– .7 .8 1.3 1.2 1.7 .5 2.0 .9 1.3 .8 59– 1.5 2.3 2.4 1.5 3.3 1.9 2.6 2.4 1.3 2.8 60
1992 ECONOMIC CENSUS CHARACTERISTICS OF BUSINESS OWNERS 71

Table 8b. Educational Background of Owner by Receipts Size of Firm: 1992[All data are shown as percents, except firms. For meaning of abbreviations and symbols, see introductory text. For explanation of terms, see appendix A]
Type of firm and receipts size
Owner’s highest level of education completed or degree received1
High school College or other school beyond high school
Firms(number)
Lessthan
9thgrade
Did notgraduate
Graduateor GED
Technical,trade or
vocationalschool
Somecollege,
but nodegree
AssociateDegree
Bachelor’sDegree
Master’sDegree
Profes~sional
school/Doctorate
Notreported
A B C D E F G H I J K
All businesses 17 253 143............................ 3.7 5.7 22.6 7.0 16.1 4.0 20.2 5.8 8.9 6.11
Less than $5,000 5 226 553................................ 3.7 6.0 23.7 6.5 16.7 4.4 20.2 6.9 5.2 6.72$5,000 to $9,999 2 443 946................................ 5.0 5.7 24.0 6.6 17.2 4.5 17.3 5.7 6.6 7.43$10,000 to $24,999 3 076 410.............................. 5.0 8.0 24.7 6.9 16.0 5.3 19.6 5.1 6.0 3.44$25,000 to $49,999 1 945 806.............................. 4.0 5.0 21.9 11.9 16.7 3.3 19.0 5.0 7.9 5.35$50,000 to $99,999 1 615 940.............................. 2.7 5.4 22.5 8.4 13.2 3.3 21.6 5.3 12.5 4.96
$100,000 to $199,999 1 197 996............................ 2.9 5.3 22.1 6.2 17.1 2.9 18.3 5.3 14.1 5.77$200,000 to $249,999 301 794............................ 2.3 4.7 22.9 5.6 14.8 2.4 16.3 4.9 21.0 5.08$250,000 to $499,999 682 583............................ 2.6 5.0 18.6 5.1 14.9 3.1 22.2 4.1 16.3 8.19$500,000 to $999,999 372 078............................ 1.9 4.1 16.8 3.1 15.3 3.3 24.4 5.9 16.3 9.010$1,000,000 or more 390 037.............................. 2.6 2.8 16.0 2.5 15.7 2.8 30.1 7.8 10.6 9.211
Hispanic ~owned businesses 771 708............... 14.8 10.6 18.2 7.9 16.6 4.1 11.9 3.9 5.4 6.612
Less than $5,000 219 226................................ 17.2 7.9 16.4 8.1 18.6 6.7 11.0 3.7 2.9 7.513$5,000 to $9,999 140 362................................ 20.1 13.4 14.9 7.8 15.5 5.0 9.1 2.9 2.1 9.114$10,000 to $24,999 165 667.............................. 17.7 14.0 19.0 8.0 15.3 3.0 12.4 3.0 2.5 5.215$25,000 to $49,999 87 288.............................. 15.0 11.1 16.9 12.3 18.3 2.5 8.7 4.5 5.6 5.116$50,000 to $99,999 64 742.............................. 10.1 11.9 21.8 7.1 15.4 3.9 14.0 4.8 6.9 4.317
$100,000 to $199,999 41 578............................ 10.0 8.3 21.4 6.7 15.2 3.7 14.3 4.2 10.8 5.318$200,000 to $249,999 10 030............................ 9.4 6.3 21.3 3.8 13.9 2.8 11.4 7.7 16.6 6.819$250,000 to $499,999 22 301............................ 8.6 6.3 19.4 5.3 18.5 2.1 15.3 3.6 14.0 6.820$500,000 to $999,999 11 319............................ 7.0 8.3 21.2 5.4 16.3 3.3 11.5 4.3 10.8 12.021$1,000,000 or more 9 194.............................. 5.8 5.6 19.2 4.2 15.2 3.4 21.7 5.2 11.1 8.722
Black ~owned businesses 620 912.................. 6.0 10.4 21.3 8.6 16.6 4.9 11.9 6.7 6.0 7.723
Less than $5,000 236 722................................ 4.7 9.3 19.9 8.3 17.7 6.1 12.6 8.6 2.7 10.224$5,000 to $9,999 111 512................................ 7.1 10.6 21.6 7.8 14.7 4.5 13.7 7.3 4.1 8.525$10,000 to $24,999 129 901.............................. 6.5 12.1 24.6 11.1 15.9 4.4 9.3 4.8 5.3 6.026$25,000 to $49,999 62 209.............................. 7.6 10.7 21.3 9.7 17.5 5.4 9.3 3.7 10.5 4.227$50,000 to $99,999 39 218.............................. 7.4 12.4 21.4 7.1 19.0 2.4 11.2 5.5 9.3 4.228
$100,000 to $199,999 20 936............................ 4.8 9.4 18.5 5.2 15.8 4.3 12.3 7.7 16.1 5.929$200,000 to $249,999 4 533............................ 4.6 6.6 14.9 8.3 13.6 3.7 15.4 4.4 25.5 3.130$250,000 to $499,999 9 029............................ 5.4 6.1 18.4 6.0 12.4 3.4 16.8 4.2 21.4 5.931$500,000 to $999,999 3 823............................ 2.8 3.3 14.0 3.7 15.6 4.6 17.6 9.3 20.7 8.332$1,000,000 or more 3 028.............................. 1.1 4.7 17.4 2.1 14.7 3.1 26.3 8.5 11.2 10.833
Other minority ~owned businesses 606 426......... 5.3 6.4 14.8 4.7 12.9 4.4 23.7 8.9 12.1 6.534
Less than $5,000 132 493................................ 4.3 5.1 11.6 3.6 15.4 5.8 28.5 12.4 9.4 3.935$5,000 to $9,999 80 435................................ 10.2 3.7 15.8 6.2 10.7 7.5 23.2 9.4 7.4 5.836$10,000 to $24,999 108 195.............................. 6.5 8.3 16.0 4.9 13.4 2.9 20.1 7.3 13.1 7.437$25,000 to $49,999 77 345.............................. 7.5 12.3 18.4 4.2 12.5 2.1 21.5 7.5 6.7 7.338$50,000 to $99,999 70 360.............................. 5.5 6.0 18.2 6.8 13.6 4.3 21.5 8.5 10.0 5.439
$100,000 to $199,999 58 620............................ 3.7 5.7 12.7 5.2 10.7 5.6 25.3 7.3 16.3 7.640$200,000 to $249,999 15 740............................ 1.3 5.8 14.7 5.6 12.2 4.5 18.9 8.0 20.9 8.341$250,000 to $499,999 34 266............................ 3.8 5.0 14.4 3.3 13.6 4.5 23.0 8.2 19.1 5.042$500,000 to $999,999 16 467............................ 2.2 4.7 11.0 3.3 12.6 3.1 27.9 8.0 18.9 8.343$1,000,000 or more 12 505.............................. 2.4 2.9 10.0 3.4 12.6 3.3 27.6 13.0 12.3 12.444
Women ~owned businesses 5 888 883................ 3.2 4.9 22.4 7.6 17.7 4.7 20.6 7.0 5.2 6.745
Less than $5,000 2 310 303................................ 3.7 5.3 22.7 6.8 17.1 4.4 19.9 8.7 4.2 7.046$5,000 to $9,999 967 380................................ 4.6 4.5 21.5 9.8 18.3 5.5 20.3 5.7 3.0 6.847$10,000 to $24,999 1 051 358.............................. 2.7 5.3 25.4 8.4 17.0 4.8 20.1 7.3 4.5 4.548$25,000 to $49,999 538 885.............................. 2.9 5.0 23.0 8.6 19.6 4.9 19.3 5.6 5.2 6.049$50,000 to $99,999 381 517.............................. 1.8 3.4 19.7 9.6 15.1 4.5 21.8 6.0 9.0 9.150
$100,000 to $199,999 267 089............................ 2.2 4.7 19.4 6.1 19.9 5.0 22.1 6.0 9.6 4.951$200,000 to $249,999 66 464............................ .7 5.9 23.7 2.7 23.1 3.7 18.5 4.9 9.4 7.352$250,000 to $499,999 146 313............................ 2.2 4.8 21.5 6.3 18.0 4.8 21.8 4.9 7.7 8.053$500,000 to $999,999 80 539............................ 1.7 3.9 19.8 3.8 16.4 4.9 25.0 6.8 7.4 10.354$1,000,000 or more 79 037.............................. 3.5 3.4 19.1 3.1 18.2 3.0 26.1 7.5 5.5 10.655
Nonminority male ~owned businesses 10 114 456...... 3.3 5.7 23.2 6.7 15.4 3.5 20.6 5.0 10.8 5.656
Less than $5,000 2 608 047................................ 3.1 6.2 25.2 6.3 16.4 4.4 20.9 5.4 5.9 6.357$5,000 to $9,999 1 285 456................................ 4.1 6.0 27.2 4.0 16.9 3.7 15.4 5.6 9.5 7.658$10,000 to $24,999 1 763 830.............................. 5.5 9.2 25.0 5.7 15.4 5.9 20.4 3.5 7.1 2.259$25,000 to $49,999 1 248 482.............................. 3.4 3.9 21.8 14.0 15.8 2.7 19.6 4.8 9.2 4.960$50,000 to $99,999 1 108 065.............................. 2.3 5.5 23.8 8.3 12.4 2.8 22.4 4.9 14.2 3.561
$100,000 to $199,999 840 723............................ 2.7 5.2 23.8 6.4 16.7 1.9 16.7 4.9 15.6 6.162$200,000 to $249,999 212 693............................ 2.6 4.0 23.7 6.6 11.6 1.5 15.7 4.7 25.5 4.163$250,000 to $499,999 488 462............................ 2.3 4.9 17.8 4.8 13.7 2.5 22.8 3.6 18.9 8.564$500,000 to $999,999 266 408............................ 1.7 3.8 16.0 2.8 15.2 2.8 24.7 5.6 19.0 8.465$1,000,000 or more 292 290.............................. 2.3 2.6 15.4 2.3 15.2 2.7 31.5 7.7 11.6 8.766
1Data represent percentage of owners reporting in the designated categories.2For explanation of relative standard errors and standard errors, see Reliability of Estimates in the introductory text.3Relative standard errors are not applicable for lines 1 through 11 since these data are the result of censuses, not surveys.
72 CHARACTERISTICS OF BUSINESS OWNERS 1992 ECONOMIC CENSUS

Standard error of estimate2 for columnmRelative
standarderror of
estimate2 3
A B C D E F G H I J K
(X) .2 .2 .6 .2 .6 .4 .6 .3 .2 .3 1
(X) .4 .8 1.6 1.0 1.7 .7 1.4 .6 .7 .8 2(X) 1.1 1.0 1.5 .6 1.1 .9 1.7 .6 .9 1.6 3(X) .8 1.1 .8 .6 1.4 1.3 1.6 .9 .8 .6 4(X) .9 .9 2.5 1.8 2.1 .8 2.1 1.2 1.8 1.3 5(X) .5 .5 1.5 .4 1.2 .8 1.7 .7 1.4 1.0 6
(X) .4 .8 1.6 .6 .6 .4 1.5 .7 .5 .7 7(X) .8 1.6 2.5 1.2 2.1 .5 2.4 1.4 3.9 1.3 8(X) .5 .5 .7 .4 .9 .4 1.4 .3 1.1 1.2 9(X) .2 .7 1.2 .2 .6 .4 1.3 .5 1.4 .9 10(X) .3 .2 .3 .2 .7 .1 .9 .4 .7 .4 11
– .7 .6 .7 .7 .9 .4 .7 .2 .4 .4 12
1.0 2.5 1.4 1.7 1.4 1.5 1.3 1.6 .4 .6 1.3 131.0 2.0 2.0 1.9 2.0 1.6 1.5 1.2 .9 .6 1.4 141.0 2.6 1.7 1.7 1.3 1.2 .7 2.4 .7 .6 1.0 151.0 1.9 2.0 1.5 2.1 2.5 .7 2.0 1.5 1.8 1.4 161.0 1.0 1.4 2.6 1.0 2.1 1.0 1.5 .8 .6 1.1 17
1.0 1.1 .8 1.2 1.0 1.6 .9 1.5 1.1 1.2 1.1 183.0 2.2 3.1 3.8 .8 1.8 1.0 2.2 1.7 3.3 1.8 192.0 1.7 1.2 2.2 .9 1.3 .4 1.0 .8 1.7 .6 203.0 1.2 1.7 2.4 1.0 1.2 .8 1.1 .9 1.8 2.1 212.0 .6 1.0 1.6 .7 1.2 .5 1.8 .8 1.7 .9 22
– .3 .4 .5 .5 .4 .4 .6 .6 .4 .5 23
– .6 .9 1.2 1.0 1.1 .8 .8 .8 .4 1.2 24– .7 .9 1.3 1.1 .9 .5 1.4 1.4 .6 .8 25– .8 1.4 1.4 .9 1.1 .8 .9 .6 .8 1.1 26– 1.6 1.9 2.1 1.4 1.8 1.4 1.1 1.4 1.3 1.2 27
1.0 1.1 1.7 2.3 1.5 1.7 .6 1.2 .9 1.3 .9 28
1.0 .7 .9 1.1 1.0 1.6 1.0 1.5 .7 2.0 1.6 293.0 1.7 2.0 4.0 2.9 1.9 1.7 2.1 2.0 4.0 1.3 303.0 1.4 1.2 2.8 1.0 1.2 .7 1.9 .8 1.6 .8 314.0 .7 .7 1.5 1.1 1.9 1.5 2.6 1.6 2.9 2.2 324.0 .2 1.4 2.1 .4 2.1 .8 2.6 .9 2.1 1.2 33
– .4 .6 .6 .5 .8 .3 1.5 .7 .9 .8 34
1.0 1.4 1.7 2.5 1.0 3.2 1.4 4.2 1.9 3.1 1.7 351.0 2.2 1.2 3.3 1.7 1.8 1.9 3.2 2.0 1.6 2.0 361.0 2.1 1.6 1.5 1.7 2.0 1.0 3.7 1.9 2.0 2.2 371.0 2.5 3.2 2.6 1.9 3.0 .7 3.2 2.5 1.9 2.5 381.0 1.5 1.9 2.6 1.9 2.1 1.0 2.7 1.8 1.7 1.1 39
1.0 .6 1.0 1.6 .6 1.3 1.1 2.5 1.1 1.6 1.2 402.0 1.2 1.4 2.3 1.6 2.5 1.4 2.7 1.2 2.5 1.3 411.0 .7 .8 1.4 .8 1.1 .7 1.5 1.1 1.7 .5 422.0 .5 .8 .8 .6 1.4 .5 1.8 1.2 1.3 1.8 432.0 .3 .3 .8 .5 .9 .5 1.1 1.0 1.6 1.0 44
– .4 .5 .7 .4 .8 .6 .9 .5 .5 .3 45
– .7 .9 1.6 1.0 1.2 .7 1.6 1.0 .6 1.0 46– 1.3 .9 2.2 1.0 2.3 1.3 2.5 1.5 .7 1.3 47– .8 1.3 2.2 1.2 1.7 1.2 1.8 2.1 .8 .9 48– 1.7 1.2 2.6 2.4 2.0 1.4 3.1 1.7 3.1 1.6 49– .4 .6 2.4 1.2 1.7 1.3 3.4 .5 1.6 1.5 50
– .5 .8 1.1 .7 1.9 .8 1.9 1.5 1.3 1.0 511.0 .3 2.6 4.5 .6 4.1 1.5 2.9 1.8 1.9 1.1 521.0 .4 .9 1.3 1.1 1.0 .9 1.4 .5 .7 .4 531.0 .2 .8 1.3 .6 .8 .9 1.7 .8 .7 1.2 541.0 .3 .3 .8 .3 .6 .1 .7 .4 .7 .7 55
– .2 .4 .8 .4 .8 .5 1.0 .5 .4 .5 56
– .6 1.8 2.5 1.4 3.3 1.2 2.7 1.0 1.1 1.0 57– 1.4 2.1 2.1 .9 2.2 1.5 2.7 1.3 1.6 2.2 58– 1.3 2.4 1.9 1.0 2.3 2.0 2.4 1.3 1.5 .8 59– 1.4 1.0 3.6 2.5 2.8 1.0 3.3 1.6 2.2 1.5 60– .6 .8 1.8 .8 1.6 .7 2.3 1.2 1.9 1.1 61
– .6 1.0 2.3 .8 1.2 .5 2.7 1.2 1.0 1.1 62– 1.3 1.6 3.8 1.7 2.7 .7 4.2 2.2 6.4 1.6 63– .8 .9 1.0 .4 1.1 .5 2.0 .5 1.6 1.7 64– .2 .8 1.4 .4 .9 .6 1.7 .5 1.9 1.0 65– .5 .3 .4 .3 .9 .2 1.1 .5 1.0 .6 66
1992 ECONOMIC CENSUS CHARACTERISTICS OF BUSINESS OWNERS 73

Table 8c. Educational Background of Owner by Employment Size of Firm: 1992[All data are shown as percents, except firms. For meaning of abbreviations and symbols, see introductory text. For explanation of terms, see appendix A]
Type of firm and employment size
Owner’s highest level of education completed or degree received1
High school College or other school beyond high school
Firms(number)
Lessthan
9thgrade
Did notgraduate
Graduateor GED
Technical,trade or
vocationalschool
Somecollege,
but nodegree
AssociateDegree
Bachelor’sDegree
Master’sDegree
Profes~sional
school/Doctorate
Notreported
A B C D E F G H I J K
All businesses 17 253 143............................ 3.7 5.7 22.6 7.0 16.1 4.0 20.2 5.8 8.9 6.11
With no paid employees 14 118 184.......................... 4.0 6.2 23.1 7.4 16.1 4.2 20.1 5.9 7.3 5.92With paid employees 3 134 959............................. 3.0 4.3 20.9 5.8 16.1 3.1 20.8 5.4 13.8 6.83
No employees4 435 838................................ 4.8 3.8 24.2 4.9 16.9 5.3 22.7 7.5 5.6 4.341 to 4 employees 1 716 076.............................. 2.6 4.6 21.9 7.0 16.1 2.8 17.9 4.7 16.3 6.155 to 9 employees 503 808.............................. 3.1 5.0 21.3 5.1 16.0 3.0 19.2 4.3 15.3 7.6610 to 19 employees 256 110............................ 3.4 3.6 19.4 5.9 16.0 2.6 22.4 5.7 12.7 8.3720 to 49 employees 144 734............................ 2.3 2.8 15.9 3.5 16.0 3.9 31.1 6.2 10.0 8.3850 to 99 employees 45 331............................ 2.3 3.1 12.4 1.5 15.2 3.0 33.0 10.0 7.7 11.69100 employees or more 33 062........................ 2.0 3.0 10.1 1.1 15.6 1.8 28.8 10.5 15.2 11.810
Hispanic ~owned businesses 771 708............... 14.8 10.6 18.2 7.9 16.6 4.1 11.9 3.9 5.4 6.611
With no paid employees 656 343.......................... 16.3 11.2 17.5 8.4 16.8 4.4 11.4 3.7 3.8 6.512With paid employees 115 364............................. 9.9 8.5 20.7 6.4 15.9 3.2 13.3 4.3 10.9 6.913
No employees4 19 569................................ 12.2 9.4 16.2 8.3 18.6 4.2 11.8 6.6 5.1 7.5141 to 4 employees 64 631.............................. 10.9 9.2 21.9 6.4 13.6 3.0 12.1 3.8 13.0 5.9155 to 9 employees 16 937.............................. 7.3 7.1 20.3 7.0 18.2 3.1 14.5 3.2 12.0 7.31610 to 19 employees 8 553............................ 8.4 7.7 22.9 4.5 18.0 2.7 14.1 3.5 8.8 9.41720 to 49 employees 4 050............................ 6.9 5.8 20.3 4.8 18.1 3.5 16.9 4.7 9.1 9.91850 to 99 employees 948............................ 6.5 8.0 14.8 3.4 14.3 5.5 26.8 11.3 5.0 4.519100 employees or more 676........................ 6.0 2.7 22.3 3.3 19.1 3.5 24.3 5.1 8.3 5.420
Black ~owned businesses 620 912.................. 6.0 10.4 21.3 8.6 16.6 4.9 11.9 6.7 6.0 7.721
With no paid employees 556 434.......................... 6.0 10.5 21.6 8.7 16.6 5.1 11.7 6.8 5.0 8.022With paid employees 64 478............................. 5.9 9.3 19.2 8.5 16.5 3.7 12.9 5.9 13.2 4.923
No employees4 13 725................................ 7.6 10.9 22.8 10.7 21.3 2.9 9.7 1.8 7.6 4.6241 to 4 employees 37 587.............................. 6.4 10.3 18.0 8.0 15.4 4.1 12.0 6.6 15.6 3.7255 to 9 employees 7 853.............................. 4.0 6.5 21.5 9.8 15.4 2.7 16.1 5.2 13.0 5.92610 to 19 employees 2 839............................ 4.3 4.5 19.4 6.4 14.4 5.1 14.2 8.9 12.7 10.02720 to 49 employees 1 700............................ 2.4 4.9 11.4 6.1 15.6 4.0 23.1 9.4 10.1 12.92850 to 99 employees 432............................ (D) (D) 11.7 1.1 22.1 4.7 36.8 12.9 4.4 4.629100 employees or more 342........................ – 2.0 21.0 2.1 14.7 2.7 28.6 14.9 3.8 10.130
Other minority ~owned businesses 606 426......... 5.3 6.4 14.8 4.7 12.9 4.4 23.7 8.9 12.1 6.531
With no paid employees 470 075.......................... 6.1 7.3 15.1 4.3 12.7 4.8 24.0 9.3 10.7 5.832With paid employees 136 351............................. 3.7 4.8 14.0 5.6 13.5 3.7 23.1 8.3 15.1 8.133
No employees4 19 989................................ 3.0 2.5 13.9 4.6 19.7 2.8 22.0 11.8 11.9 7.7341 to 4 employees 76 636.............................. 3.4 4.5 13.8 6.5 12.2 3.9 23.5 7.2 17.2 7.7355 to 9 employees 22 862.............................. 4.7 7.6 14.6 4.8 12.8 3.9 21.3 7.0 16.1 7.23610 to 19 employees 10 051............................ 4.0 4.1 17.0 6.2 13.4 4.6 23.2 8.5 11.5 7.43720 to 49 employees 5 034............................ 4.5 5.2 11.6 2.3 15.9 2.8 26.7 11.9 9.1 10.03850 to 99 employees 1 075............................ 2.6 2.3 8.0 5.7 12.1 2.1 25.0 9.4 10.7 22.039100 employees or more 705........................ 3.6 2.1 8.7 1.8 10.0 1.6 21.3 16.6 11.7 22.440
Women ~owned businesses 5 888 883................ 3.2 4.9 22.4 7.6 17.7 4.7 20.6 7.0 5.2 6.741
With no paid employees 5 071 110.......................... 3.4 5.1 22.5 7.8 17.2 4.8 20.4 7.4 4.8 6.542With paid employees 817 773............................. 2.1 4.2 22.2 6.7 19.6 4.1 21.1 5.6 7.1 7.443
No employees4 127 905................................ 2.6 4.5 16.1 6.0 22.6 7.4 24.1 7.8 3.9 4.9441 to 4 employees 435 550.............................. 1.6 4.0 23.5 7.8 19.0 3.3 19.8 5.2 8.5 7.3455 to 9 employees 134 476.............................. 2.0 5.7 23.4 6.3 20.8 4.5 19.7 3.4 8.1 6.24610 to 19 employees 67 487............................ 3.2 2.7 26.1 6.7 17.9 3.4 19.5 5.9 4.2 10.44720 to 49 employees 35 515............................ 3.2 2.3 17.7 3.4 18.5 4.9 28.7 7.6 5.0 8.74850 to 99 employees 10 178............................ 2.5 3.3 15.0 2.9 19.2 4.4 29.2 10.0 3.1 10.349100 employees or more 6 663........................ 4.2 6.3 15.3 1.1 18.1 2.8 26.6 7.2 6.4 12.050
Nonminority male ~owned businesses 10 114 456...... 3.3 5.7 23.2 6.7 15.4 3.5 20.6 5.0 10.8 5.651
With no paid employees 8 019 462.......................... 3.4 6.3 24.1 7.2 15.6 3.8 20.5 4.9 8.9 5.352With paid employees 2 094 993............................. 2.9 3.9 20.7 5.4 15.0 2.7 21.1 5.3 16.5 6.553
No employees4 271 380................................ 5.4 2.4 29.7 3.8 14.0 4.5 23.7 7.3 5.9 3.2541 to 4 employees 1 155 800.............................. 2.4 4.5 21.8 6.8 15.4 2.4 17.2 4.5 19.6 5.5555 to 9 employees 334 483.............................. 3.3 4.5 21.0 4.5 14.2 2.2 19.1 4.6 18.2 8.45610 to 19 employees 173 140............................ 3.2 3.5 17.0 5.8 15.3 2.2 24.0 5.4 15.9 7.65720 to 49 employees 101 938............................ 1.9 2.8 15.5 3.5 15.4 3.7 32.5 5.6 11.4 7.85850 to 99 employees 33 406............................ 2.3 3.0 11.8 1.0 14.4 2.7 34.3 10.0 8.8 11.759100 employees or more 24 846........................ 1.2 2.1 8.3 1.1 14.9 1.5 29.8 11.4 18.1 11.660
1Data represent percentage of owners reporting in the designated categories.2For explanation of relative standard errors and standard errors, see Reliability of Estimates in the introductory text.3Relative standard errors are not applicable for lines 1 through 10 since these data are the result of censuses, not surveys.4Firms reported annual payroll, but did not report any employees on their payroll during specified period in 1992.
74 CHARACTERISTICS OF BUSINESS OWNERS 1992 ECONOMIC CENSUS

Standard error of estimate2 for columnmRelative
standarderror of
estimate2 3
A B C D E F G H I J K
(X) .2 .2 .6 .2 .6 .4 .6 .3 .2 .3 1
(X) .2 .2 1.0 .3 .7 .5 .8 .3 .3 .3 2(X) .4 .3 .8 .3 .5 .3 1.1 .5 .9 .5 3(X) 1.8 1.0 3.3 1.3 2.9 1.5 1.6 2.0 .9 1.1 4(X) .4 .4 1.4 .7 .9 .4 1.8 .9 1.5 .7 5(X) .7 .5 1.6 .7 1.2 .2 .7 .5 .9 1.7 6(X) .8 .5 .7 1.1 .8 .5 1.1 .5 1.1 .5 7(X) .5 .5 .9 .8 1.2 .5 1.9 .6 1.4 .8 8(X) .5 .6 1.2 .3 1.3 .4 2.6 1.8 1.7 1.8 9(X) .3 .6 1.2 .3 2.3 .6 3.0 1.9 4.7 2.6 10
– .7 .6 .7 .7 .9 .4 .7 .2 .4 .4 11
– .8 .8 1.1 .9 1.1 .5 .7 .3 .4 .4 121.0 .8 .9 1.2 .8 1.1 .4 .8 .4 1.0 .6 132.0 2.1 4.5 2.2 2.1 4.6 2.8 3.2 3.1 1.9 2.0 141.0 1.4 .9 2.1 1.0 .9 .3 1.3 .5 1.2 .8 152.0 1.2 .8 2.6 1.6 2.2 1.2 2.2 .5 1.6 1.1 163.0 1.5 1.3 3.0 1.4 2.0 .6 2.6 .7 1.6 2.1 174.0 1.0 1.4 2.4 1.8 2.1 1.0 1.7 1.4 2.6 1.6 186.0 1.6 1.6 2.3 .8 1.9 1.5 4.2 3.5 1.4 1.1 198.0 2.0 1.6 6.8 1.5 3.7 3.2 3.5 1.3 2.3 2.1 20
– .3 .4 .5 .5 .4 .4 .6 .6 .4 .5 21
– .3 .6 .6 .4 .5 .5 .7 .6 .4 .5 221.0 .7 1.2 .7 1.0 1.0 .9 1.1 1.0 .9 .5 232.0 1.7 3.2 3.7 3.3 2.2 1.2 2.8 1.3 2.7 1.8 241.0 1.0 1.3 1.2 1.4 1.6 1.2 1.6 1.4 .8 .7 253.0 .8 1.5 2.3 2.7 1.9 1.0 2.2 1.4 2.0 1.4 264.0 1.1 1.6 2.5 2.8 2.3 1.2 2.3 3.8 2.3 2.9 276.0 1.9 2.3 2.4 2.2 2.7 1.1 3.0 2.7 3.4 3.2 288.0 (D) (D) 5.8 .9 5.3 1.7 8.8 2.8 1.7 2.2 29
– – 1.5 4.0 2.5 4.6 1.9 7.2 4.1 2.5 2.1 30
– .4 .6 .6 .5 .8 .3 1.5 .7 .9 .8 31
– .6 .9 1.1 .6 1.3 .4 2.1 .8 1.1 1.1 321.0 .4 .4 1.2 .5 .9 .5 1.3 .7 .9 1.0 332.0 .9 .6 3.1 1.5 4.5 .9 3.7 3.9 4.4 2.8 341.0 .7 .6 1.7 1.1 1.4 .7 2.0 1.0 1.2 1.6 352.0 1.2 1.0 1.2 .9 1.7 1.1 2.3 .9 1.5 1.2 362.0 .7 1.0 2.3 2.4 2.1 1.0 2.2 1.0 .8 1.5 374.0 1.5 1.3 1.7 .6 2.1 1.2 1.6 .9 1.9 1.8 386.0 1.1 .7 2.2 1.8 4.8 .5 4.4 1.8 4.7 4.5 396.0 2.4 .6 2.0 .8 2.2 .9 4.2 3.8 3.6 6.9 40
– .4 .5 .7 .4 .8 .6 .9 .5 .5 .3 41
– .5 .6 .9 .5 .8 .7 1.2 .6 .5 .4 42– .3 .3 .8 .6 1.1 .3 1.6 .7 .9 .5 43
1.0 2.5 1.6 2.2 2.8 4.2 1.3 4.9 1.5 .9 1.0 44– .4 .6 1.0 1.0 1.6 .6 1.9 1.2 1.4 .9 45
1.0 .5 .9 1.3 1.6 2.5 1.0 1.3 .5 2.0 1.1 461.0 .6 .6 1.7 1.0 1.0 .5 1.6 .8 1.0 1.2 471.0 .4 .4 1.5 .7 2.2 1.2 2.8 .8 1.2 1.5 482.0 .9 1.4 2.5 1.2 2.2 1.1 3.5 1.6 .8 2.4 492.0 1.3 1.4 2.9 .5 2.5 .8 2.1 1.6 2.1 3.2 50
– .2 .4 .8 .4 .8 .5 1.0 .5 .4 .5 51
– .2 .5 1.2 .5 1.0 .6 1.3 .6 .4 .6 52– .5 .4 1.0 .6 .6 .4 1.0 .6 1.5 .8 53– 2.0 1.2 5.8 1.7 2.8 2.3 2.4 2.9 1.8 1.6 54– .6 .7 1.8 1.1 1.1 .5 2.3 1.0 2.3 .9 55– 1.0 .7 2.1 1.1 1.4 .4 1.1 .8 1.4 2.3 56
1.0 1.2 .8 .9 1.5 1.4 .8 1.3 .9 1.7 1.1 571.0 .6 .5 1.3 1.1 1.4 .6 2.2 .8 2.2 .9 581.0 .7 .9 1.9 .3 1.3 .5 3.6 2.2 2.0 2.0 591.0 .3 .9 1.4 .5 2.9 .8 4.1 2.8 6.5 2.7 60
1992 ECONOMIC CENSUS CHARACTERISTICS OF BUSINESS OWNERS 75

Table 8d. Educational Background of Owner by Legal Form of Organization of Firm: 1992[All data are shown as percents, except firms. For meaning of abbreviations and symbols, see introductory text. For explanation of terms, see appendix A]
Type of firm and legal form of organization
Owner’s highest level of education completed or degree received1
High school College or other school beyond high school
Firms(number)
Lessthan
9thgrade
Did notgraduate
Graduateor GED
Technical,trade or
vocationalschool
Somecollege,
but nodegree
AssociateDegree
Bachelor’sDegree
Master’sDegree
Profes~sional
school/Doctorate
Notreported
A B C D E F G H I J K
All businesses 17 253 143............................ 3.7 5.7 22.6 7.0 16.1 4.0 20.2 5.8 8.9 6.11
Individual proprietorships 14 599 295......................... 4.2 6.7 24.6 7.9 16.9 4.0 18.0 5.2 7.8 4.62Partnerships 1 089 578.................................... 2.6 3.3 19.1 4.6 12.1 3.9 23.1 7.2 14.3 10.03Subchapter S corporations 1 564 270........................ 2.4 3.1 15.7 4.5 15.8 3.8 28.6 7.0 9.2 9.94
Hispanic ~owned businesses 771 708............... 14.8 10.6 18.2 7.9 16.6 4.1 11.9 3.9 5.4 6.65
Individual proprietorships 689 015......................... 18.2 12.2 18.2 8.2 16.6 4.3 9.1 3.0 4.5 5.76Partnerships 32 650.................................... 5.2 5.4 18.7 8.4 14.1 5.3 19.1 5.5 7.5 10.87Subchapter S corporations 50 042........................ 3.6 5.3 17.9 5.9 18.5 2.6 21.4 7.3 9.1 8.38
Black ~owned businesses 620 912.................. 6.0 10.4 21.3 8.6 16.6 4.9 11.9 6.7 6.0 7.79
Individual proprietorships 584 256......................... 6.4 10.8 21.5 8.8 16.6 5.0 11.1 6.6 5.7 7.410Partnerships 14 727.................................... 2.1 6.4 20.6 6.3 11.7 3.9 20.7 6.3 8.2 13.811Subchapter S corporations 21 928........................ 1.6 4.8 17.4 6.4 19.7 4.9 20.4 8.5 9.0 7.512
Other minority ~owned businesses 606 426......... 5.3 6.4 14.8 4.7 12.9 4.4 23.7 8.9 12.1 6.513
Individual proprietorships 502 022......................... 6.7 6.7 15.3 5.0 13.8 5.0 23.9 8.5 12.3 2.714Partnerships 49 489.................................... 3.6 7.1 14.0 2.8 9.0 3.4 22.4 7.9 16.2 13.515Subchapter S corporations 54 915........................ 2.9 5.2 13.8 5.4 13.8 3.9 24.4 11.0 8.3 11.116
Women ~owned businesses 5 888 883................ 3.2 4.9 22.4 7.6 17.7 4.7 20.6 7.0 5.2 6.717
Individual proprietorships 5 078 077......................... 3.6 5.5 22.9 7.8 17.5 4.8 20.6 7.1 5.0 5.118Partnerships 243 651.................................... 1.5 2.7 24.4 8.5 14.9 4.3 17.5 6.9 6.4 13.019Subchapter S corporations 567 155........................ 1.9 3.1 19.4 6.2 19.9 4.4 22.1 6.6 5.5 10.920
Nonminority male ~owned businesses 10 114 456...... 3.3 5.7 23.2 6.7 15.4 3.5 20.6 5.0 10.8 5.621
Individual proprietorships 8 414 238......................... 3.5 6.9 26.4 8.1 16.7 3.5 17.0 4.1 9.4 4.222Partnerships 777 379.................................... 2.8 3.0 17.8 3.5 11.3 3.7 25.0 7.2 16.7 8.923Subchapter S corporations 922 838........................ 2.7 2.7 13.5 3.4 13.5 3.5 33.3 6.9 11.4 9.224
1Data represent percentage of owners reporting in the designated categories.2For explanation of relative standard errors and standard errors, see Reliability of Estimates in the introductory text.3Relative standard errors are not applicable for lines 1 through 4 since these data are the result of censuses, not surveys.
76 CHARACTERISTICS OF BUSINESS OWNERS 1992 ECONOMIC CENSUS

Standard error of estimate2 for columnmRelative
standarderror of
estimate2 3
A B C D E F G H I J K
(X) .2 .2 .6 .2 .6 .4 .6 .3 .2 .3 1
(X) .3 .3 .9 .3 .8 .4 .8 .3 .4 .3 2(X) .8 .6 1.8 .8 1.4 1.1 2.1 .8 1.8 .8 3(X) .4 .3 .6 .7 .8 .5 1.0 .7 .7 1.5 4
– .7 .6 .7 .7 .9 .4 .7 .2 .4 .4 5
– .8 .8 .8 .7 .7 .5 .7 .3 .4 .4 62.0 1.1 1.1 1.2 2.9 2.4 1.4 3.7 1.0 1.1 1.8 71.0 .5 .6 1.6 .6 1.2 .3 2.0 1.0 .9 1.1 8
– .3 .4 .5 .5 .4 .4 .6 .6 .4 .5 9
– .4 .5 .5 .4 .5 .4 .7 .6 .4 .5 103.0 .9 1.9 2.8 2.9 2.3 1.6 3.2 1.0 1.3 2.7 112.0 .5 1.1 2.1 1.1 2.0 1.0 2.2 1.5 1.1 .8 12
– .4 .6 .6 .5 .8 .3 1.5 .7 .9 .8 13
– .4 .6 .8 .6 1.1 .5 1.9 .7 .9 .8 141.0 2.0 1.6 2.3 1.1 1.2 .8 2.0 1.6 2.7 2.6 151.0 .6 .7 1.1 .5 1.5 .7 2.1 1.1 1.0 1.7 16
– .4 .5 .7 .4 .8 .6 .9 .5 .5 .3 17
– .6 .6 .9 .5 .8 .7 1.0 .6 .6 .4 181.0 .4 .9 3.1 1.5 2.0 1.4 1.7 .8 1.7 2.2 19
– .3 .5 .7 1.2 1.9 .7 1.2 .6 .7 1.5 20
– .2 .4 .8 .4 .8 .5 1.0 .5 .4 .5 21
– .4 .8 1.1 .6 1.1 .5 1.0 .6 .7 .6 22– 1.2 .7 2.3 1.0 1.5 1.3 2.8 1.1 2.2 .9 23– .7 .5 1.1 .6 1.3 .7 1.7 1.0 1.0 1.8 24
1992 ECONOMIC CENSUS CHARACTERISTICS OF BUSINESS OWNERS 77
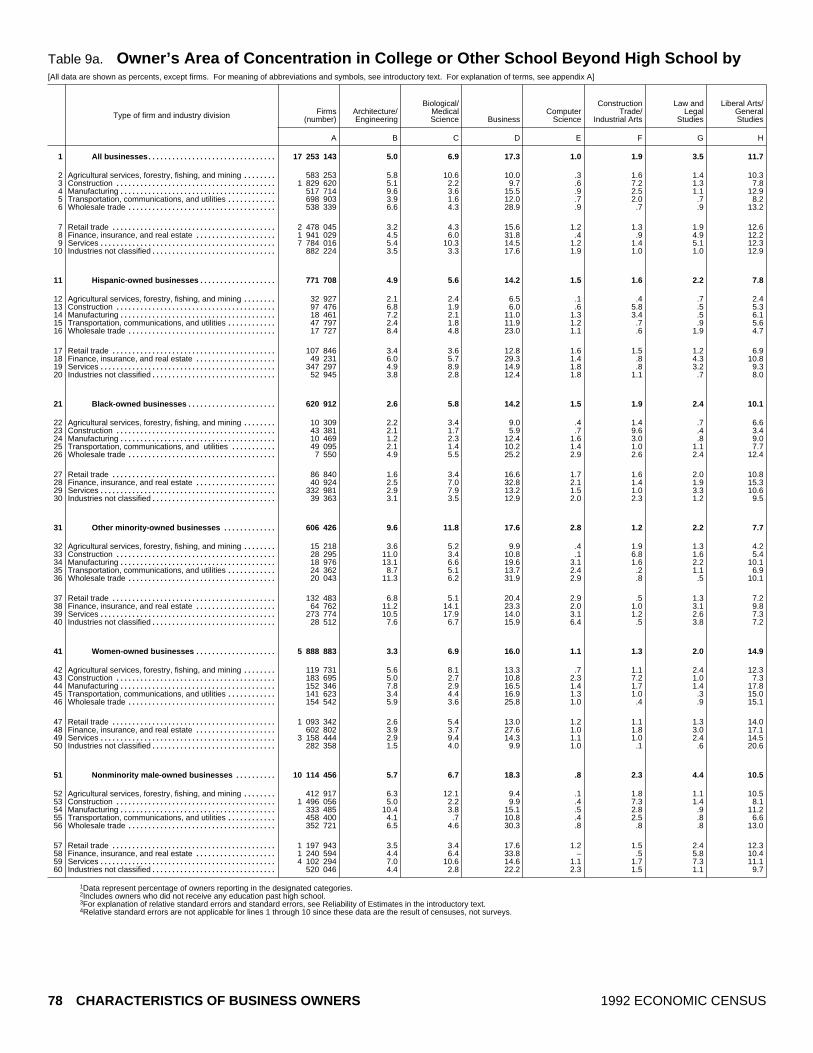
Table 9a. Owner’s Area of Concentration in College or Other School Beyond High School by[All data are shown as percents, except firms. For meaning of abbreviations and symbols, see introductory text. For explanation of terms, see appendix A]
Type of firm and industry division Firms(number)
Architecture/Engineering
Biological/MedicalScience Business
ComputerScience
ConstructionTrade/
Industrial Arts
Law andLegal
Studies
Liberal Arts/GeneralStudies
A B C D E F G H
All businesses 17 253 143................................ 5.0 6.9 17.3 1.0 1.9 3.5 11.71
Agricultural services, forestry, fishing, and mining 583 253........ 5.8 10.6 10.0 .3 1.6 1.4 10.32Construction 1 829 620........................................ 5.1 2.2 9.7 .6 7.2 1.3 7.83Manufacturing 517 714....................................... 9.6 3.6 15.5 .9 2.5 1.1 12.94Transportation, communications, and utilities 698 903............ 3.9 1.6 12.0 .7 2.0 .7 8.25Wholesale trade 538 339..................................... 6.6 4.3 28.9 .9 .7 .9 13.26
Retail trade 2 478 045......................................... 3.2 4.3 15.6 1.2 1.3 1.9 12.67Finance, insurance, and real estate 1 941 029.................... 4.5 6.0 31.8 .4 .9 4.9 12.28Services 7 784 016............................................ 5.4 10.3 14.5 1.2 1.4 5.1 12.39Industries not classified 882 224............................... 3.5 3.3 17.6 1.9 1.0 1.0 12.910
Hispanic ~owned businesses 771 708................... 4.9 5.6 14.2 1.5 1.6 2.2 7.811
Agricultural services, forestry, fishing, and mining 32 927........ 2.1 2.4 6.5 .1 .4 .7 2.412Construction 97 476........................................ 6.8 1.9 6.0 .6 5.8 .5 5.313Manufacturing 18 461....................................... 7.2 2.1 11.0 1.3 3.4 .5 6.114Transportation, communications, and utilities 47 797............ 2.4 1.8 11.9 1.2 .7 .9 5.615Wholesale trade 17 727..................................... 8.4 4.8 23.0 1.1 .6 1.9 4.716
Retail trade 107 846......................................... 3.4 3.6 12.8 1.6 1.5 1.2 6.917Finance, insurance, and real estate 49 231.................... 6.0 5.7 29.3 1.4 .8 4.3 10.818Services 347 297............................................ 4.9 8.9 14.9 1.8 .8 3.2 9.319Industries not classified 52 945............................... 3.8 2.8 12.4 1.8 1.1 .7 8.020
Black ~owned businesses 620 912...................... 2.6 5.8 14.2 1.5 1.9 2.4 10.121
Agricultural services, forestry, fishing, and mining 10 309........ 2.2 3.4 9.0 .4 1.4 .7 6.622Construction 43 381........................................ 2.1 1.7 5.9 .7 9.6 .4 3.423Manufacturing 10 469....................................... 1.2 2.3 12.4 1.6 3.0 .8 9.024Transportation, communications, and utilities 49 095........... 2.1 1.4 10.2 1.4 1.0 1.1 7.725Wholesale trade 7 550..................................... 4.9 5.5 25.2 2.9 2.6 2.4 12.426
Retail trade 86 840......................................... 1.6 3.4 16.6 1.7 1.6 2.0 10.827Finance, insurance, and real estate 40 924.................... 2.5 7.0 32.8 2.1 1.4 1.9 15.328Services 332 981............................................ 2.9 7.9 13.2 1.5 1.0 3.3 10.629Industries not classified 39 363............................... 3.1 3.5 12.9 2.0 2.3 1.2 9.530
Other minority ~owned businesses 606 426............. 9.6 11.8 17.6 2.8 1.2 2.2 7.731
Agricultural services, forestry, fishing, and mining 15 218........ 3.6 5.2 9.9 .4 1.9 1.3 4.232Construction 28 295........................................ 11.0 3.4 10.8 .1 6.8 1.6 5.433Manufacturing 18 976....................................... 13.1 6.6 19.6 3.1 1.6 2.2 10.134Transportation, communications, and utilities 24 362............ 8.7 5.1 13.7 2.4 .2 1.1 6.935Wholesale trade 20 043..................................... 11.3 6.2 31.9 2.9 .8 .5 10.136
Retail trade 132 483......................................... 6.8 5.1 20.4 2.9 .5 1.3 7.237Finance, insurance, and real estate 64 762.................... 11.2 14.1 23.3 2.0 1.0 3.1 9.838Services 273 774............................................ 10.5 17.9 14.0 3.1 1.2 2.6 7.339Industries not classified 28 512............................... 7.6 6.7 15.9 6.4 .5 3.8 7.240
Women ~owned businesses 5 888 883.................... 3.3 6.9 16.0 1.1 1.3 2.0 14.941
Agricultural services, forestry, fishing, and mining 119 731........ 5.6 8.1 13.3 .7 1.1 2.4 12.342Construction 183 695........................................ 5.0 2.7 10.8 2.3 7.2 1.0 7.343Manufacturing 152 346....................................... 7.8 2.9 16.5 1.4 1.7 1.4 17.844Transportation, communications, and utilities 141 623............ 3.4 4.4 16.9 1.3 1.0 .3 15.045Wholesale trade 154 542..................................... 5.9 3.6 25.8 1.0 .4 .9 15.146
Retail trade 1 093 342......................................... 2.6 5.4 13.0 1.2 1.1 1.3 14.047Finance, insurance, and real estate 602 802.................... 3.9 3.7 27.6 1.0 1.8 3.0 17.148Services 3 158 444............................................ 2.9 9.4 14.3 1.1 1.0 2.4 14.549Industries not classified 282 358............................... 1.5 4.0 9.9 1.0 .1 .6 20.650
Nonminority male ~owned businesses 10 114 456.......... 5.7 6.7 18.3 .8 2.3 4.4 10.551
Agricultural services, forestry, fishing, and mining 412 917........ 6.3 12.1 9.4 .1 1.8 1.1 10.552Construction 1 496 056........................................ 5.0 2.2 9.9 .4 7.3 1.4 8.153Manufacturing 333 485....................................... 10.4 3.8 15.1 .5 2.8 .9 11.254Transportation, communications, and utilities 458 400............ 4.1 .7 10.8 .4 2.5 .8 6.655Wholesale trade 352 721..................................... 6.5 4.6 30.3 .8 .8 .8 13.056
Retail trade 1 197 943......................................... 3.5 3.4 17.6 1.2 1.5 2.4 12.357Finance, insurance, and real estate 1 240 594.................... 4.4 6.4 33.8 – .5 5.8 10.458Services 4 102 294............................................ 7.0 10.6 14.6 1.1 1.7 7.3 11.159Industries not classified 520 046............................... 4.4 2.8 22.2 2.3 1.5 1.1 9.760
1Data represent percentage of owners reporting in the designated categories.2Includes owners who did not receive any education past high school.3For explanation of relative standard errors and standard errors, see Reliability of Estimates in the introductory text.4Relative standard errors are not applicable for lines 1 through 10 since these data are the result of censuses, not surveys.
78 CHARACTERISTICS OF BUSINESS OWNERS 1992 ECONOMIC CENSUS

Industry Division: 1992
Standard error of estimate3 for columnmMathe~matics
MilitaryTechno~
logiesOther
collegeOther
vocationalNot
reported
Notappli~
cable2
Relativestandard
error ofestimate3 4
I J K L M N A B C D E F G H I J K L M N
.8 .5 5.9 5.5 8.0 32.0 (X) .2 .3 .4 .1 .2 .2 .5 .1 .1 .3 .3 .3 .6 1
.2 – 7.7 3.1 8.3 40.8 (X) 1.1 1.1 1.6 .1 .9 .5 1.8 .1 – 1.9 .6 1.2 1.9 21.1 .2 2.4 4.9 8.2 49.2 (X) .7 .8 1.1 .2 1.4 .7 1.0 .5 .1 .4 1.5 1.4 1.6 31.8 .3 5.8 3.9 7.4 34.6 (X) 1.1 .4 1.2 .2 .6 .3 1.2 .7 .2 .8 .6 .7 2.8 4.4 .6 4.7 5.7 8.7 50.7 (X) .6 .2 1.5 .1 .8 .2 1.0 .2 .3 1.3 1.1 1.3 1.6 5
1.1 .4 4.3 3.7 7.5 27.6 (X) .9 .9 1.0 .3 .2 .2 1.2 .3 .2 .5 .7 .7 1.8 6
.6 .4 4.9 4.7 7.4 42.0 (X) .6 .6 1.0 .3 .5 .4 .9 .2 .1 .7 .7 .9 1.4 7
.8 1.0 5.0 3.6 9.9 19.2 (X) .9 .7 1.5 .1 .3 .9 2.1 .2 .7 1.0 .6 .9 1.5 8
.9 .4 7.6 6.8 7.2 27.0 (X) .6 .5 .8 .2 .3 .5 .5 .2 .2 .6 .5 .7 1.2 9
.7 .3 6.4 7.3 11.4 32.7 (X) .8 .9 2.5 1.1 .5 .5 2.5 .4 .2 1.1 1.4 2.4 2.0 10
.5 .2 3.8 5.0 9.1 43.6 – .4 .5 .6 .2 .2 .2 .5 .1 .1 .4 .5 .5 1.0 11
.6 .2 3.6 3.1 8.8 69.1 1.0 .7 .5 1.2 .1 .2 .2 .9 .4 .1 .9 .9 1.9 3.1 12
.3 .5 .9 2.4 10.6 58.4 1.0 1.0 .9 .9 .4 1.1 .4 1.4 .1 .4 .4 .7 1.3 2.4 13
.9 .7 2.3 6.1 8.0 50.6 1.0 1.2 .8 .9 .6 1.0 .2 1.1 .6 .4 .5 .7 1.3 2.9 14
.6 – 2.7 3.3 8.0 60.9 1.0 1.0 .7 1.3 .6 .3 .4 1.4 .4 – .8 1.2 1.3 2.3 15
.4 .2 4.8 4.7 8.7 36.6 2.0 2.1 1.7 2.2 .3 .3 .6 .8 .3 .1 1.3 1.4 .9 1.7 16
.8 .3 2.3 5.1 6.8 53.8 1.0 .3 .8 1.2 .5 .5 .5 1.4 .4 .2 .4 1.1 .8 1.3 17
.8 – 6.6 3.9 9.4 21.0 1.0 1.0 .9 1.6 .3 .3 1.0 2.0 .3 .1 .7 1.3 1.2 2.1 18
.5 .1 4.6 6.2 9.2 35.6 – .6 .9 1.1 .6 .3 .4 1.0 .2 .1 .7 1.0 1.0 1.5 19
.1 .4 5.2 6.2 11.9 45.5 1.0 1.1 1.0 2.4 .8 .8 .3 1.6 .1 .5 1.5 1.2 2.4 3.6 20
.9 .3 5.5 7.5 9.8 37.6 – .3 .2 .5 .1 .1 .2 .5 .1 .1 .3 .5 .4 .4 21
.3 .1 5.8 5.6 8.1 56.6 1.0 .7 .6 1.4 .2 .7 .4 1.2 .2 – 1.0 1.1 .9 2.6 22
.8 .3 1.4 6.0 9.6 58.1 – .6 .5 .8 .3 1.2 .3 .5 .3 .2 .5 1.0 1.4 2.4 23
.7 .6 4.4 5.2 8.2 50.5 1.0 .4 .8 1.1 .6 1.1 .4 1.8 .3 .4 1.3 1.6 1.4 2.5 24
.1 .3 3.9 5.2 11.7 53.9 – .7 .4 1.2 .6 .4 .4 .7 – .2 .8 1.3 1.5 1.7 251.0 .6 5.0 6.2 7.0 24.4 2.0 1.0 .9 2.0 .7 1.1 .8 1.8 .5 .5 1.2 1.1 1.7 1.8 26
.8 .3 7.0 4.6 8.1 41.4 – .5 .9 1.8 .3 .4 .5 1.7 .3 .2 .5 .9 .7 1.9 272.0 .4 5.2 4.0 8.1 17.2 1.0 .4 .8 2.0 .4 .4 .5 1.5 .5 .3 .9 1.0 1.2 1.6 28.8 .3 5.9 9.2 9.8 33.6 – .5 .5 .7 .2 .2 .3 .7 .2 .1 .4 .6 .5 .6 29
1.5 .7 5.7 8.4 13.9 35.2 – .7 .9 2.0 .8 .3 .5 1.2 .6 .3 .9 1.3 1.8 1.7 30
1.3 .3 5.3 5.1 8.5 26.5 – .5 .9 .9 .4 .3 .3 .8 .2 .1 .4 .5 .8 .6 31
.1 .6 4.4 7.8 13.3 47.3 1.0 1.0 1.7 2.5 .2 .5 .8 1.6 .1 .4 1.1 2.2 2.1 3.7 321.5 .1 5.4 3.1 7.7 43.0 1.0 .9 1.1 2.4 .1 1.0 .9 1.3 .8 .1 1.5 1.3 1.6 3.1 33.5 .1 6.2 5.0 5.0 26.8 1.0 2.1 2.5 2.8 1.2 .5 1.1 1.7 .2 .1 2.2 .9 1.2 3.1 34
1.4 – 5.1 3.8 13.8 37.6 1.0 2.3 1.8 3.3 1.4 .1 .9 2.5 1.3 – 2.0 1.0 2.1 4.1 35.8 1.0 5.4 1.4 8.1 19.6 1.0 1.2 1.5 2.3 .7 .3 .2 1.3 .2 .6 .6 .2 1.8 1.6 36
1.7 .2 5.3 5.0 7.3 36.3 1.0 1.0 .5 2.0 .9 .2 .4 .8 .6 .1 .6 1.0 .9 2.4 371.1 .5 3.3 3.2 13.4 14.0 1.0 2.0 4.0 2.3 .6 .5 1.2 1.6 .6 .4 1.1 .7 2.4 2.6 381.3 .1 5.8 6.3 7.4 22.4 – .8 1.2 1.3 .7 .6 .4 1.2 .4 – 1.2 1.1 1.0 1.3 391.5 1.6 7.4 6.9 3.8 30.8 1.0 1.7 1.2 2.0 1.5 .3 1.9 2.0 .6 1.1 1.6 2.5 1.5 3.8 40
.8 .1 8.2 6.2 8.6 30.5 – .3 .4 .5 .2 .3 .2 .5 .1 .1 .6 .4 .5 .9 41
.3 .1 6.7 3.6 8.0 37.8 – 1.0 1.2 2.1 .5 .5 1.1 2.3 .2 .1 1.2 1.0 1.3 2.9 421.1 .1 5.0 4.3 10.6 42.6 – 1.0 .6 .9 1.1 1.5 .4 1.2 .4 – 1.4 .8 2.2 1.6 43.7 .4 8.5 3.5 7.1 30.2 – 2.0 .7 2.0 .4 .5 .8 1.9 .2 .4 1.1 .5 1.1 2.4 44.3 .3 6.4 5.1 7.9 37.7 – 1.0 1.0 2.8 .7 .5 .1 2.4 .1 .3 1.3 1.9 1.4 1.6 45
1.1 .2 4.7 4.1 8.8 28.4 – .9 .7 2.0 .4 .1 .2 1.1 .4 .1 .7 1.5 1.5 1.6 46
.6 .1 4.6 6.0 7.9 42.1 – .5 .9 1.4 .5 .5 .4 1.6 .3 .1 .9 1.3 1.0 1.5 471.5 .1 5.6 3.8 11.0 20.0 – .9 .7 2.4 .5 .6 .7 2.0 .5 – 1.4 .9 1.0 2.5 48.8 .1 11.0 7.4 7.9 27.2 – .7 .7 1.1 .3 .3 .4 1.1 .3 .1 1.0 .5 .8 2.0 49.2 .7 7.2 8.2 11.6 34.3 – .6 1.1 2.0 .6 – .2 4.0 .1 .7 1.4 1.6 2.1 1.8 50
.8 .7 4.9 5.1 7.6 32.2 – .3 .5 .8 .2 .2 .4 .8 .2 .2 .5 .6 .6 .9 51
.2 – 8.5 2.8 8.1 39.1 – 1.5 1.2 2.3 .1 1.2 .7 2.7 .1 – 3.1 1.0 1.7 2.7 521.2 .2 2.1 5.1 7.7 49.4 – .9 1.1 1.5 .3 2.0 .8 1.3 .6 .1 .5 2.0 1.7 1.9 532.4 .2 4.9 3.9 7.6 36.3 – 1.2 .7 1.7 .2 .7 .3 1.8 .9 .1 .9 .9 .8 4.1 54.4 .8 4.3 6.2 8.5 53.9 – 1.0 .2 1.7 .3 1.2 .4 1.5 .2 .4 1.5 1.6 1.4 2.6 55
1.1 .4 4.1 3.5 7.0 27.0 – 1.1 1.3 1.4 .3 .3 .3 1.8 .4 .3 .7 .8 .9 2.2 56
.4 .7 5.4 3.7 6.7 41.3 – 1.4 1.1 1.8 .6 .8 1.0 1.6 .2 .3 1.3 1.2 1.4 2.4 57
.4 1.4 4.8 3.5 9.3 19.1 – 1.0 1.0 2.0 – .2 1.2 2.8 .2 1.1 1.4 .9 1.2 2.2 581.0 .6 5.4 6.5 6.6 26.6 – 1.2 .8 1.5 .3 .5 1.2 1.3 .3 .4 1.0 .9 1.1 1.9 59.9 – 6.0 7.0 11.3 30.7 – 1.5 1.1 3.6 1.9 .8 .7 3.0 .6 – 1.5 2.0 3.5 4.1 60
1992 ECONOMIC CENSUS CHARACTERISTICS OF BUSINESS OWNERS 79
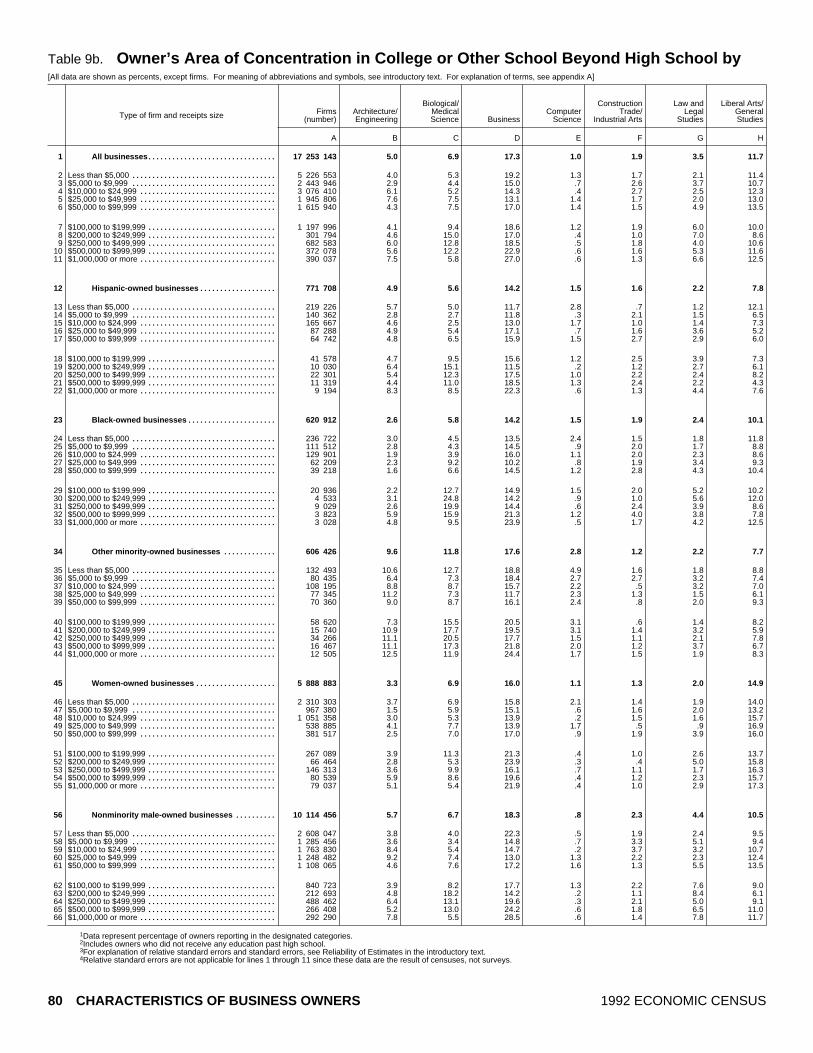
Table 9b. Owner’s Area of Concentration in College or Other School Beyond High School by[All data are shown as percents, except firms. For meaning of abbreviations and symbols, see introductory text. For explanation of terms, see appendix A]
Type of firm and receipts size Firms(number)
Architecture/Engineering
Biological/MedicalScience Business
ComputerScience
ConstructionTrade/
Industrial Arts
Law andLegal
Studies
Liberal Arts/GeneralStudies
A B C D E F G H
All businesses 17 253 143................................ 5.0 6.9 17.3 1.0 1.9 3.5 11.71
Less than $5,000 5 226 553.................................... 4.0 5.3 19.2 1.3 1.7 2.1 11.42$5,000 to $9,999 2 443 946.................................... 2.9 4.4 15.0 .7 2.6 3.7 10.73$10,000 to $24,999 3 076 410.................................. 6.1 5.2 14.3 .4 2.7 2.5 12.34$25,000 to $49,999 1 945 806.................................. 7.6 7.5 13.1 1.4 1.7 2.0 13.05$50,000 to $99,999 1 615 940.................................. 4.3 7.5 17.0 1.4 1.5 4.9 13.56
$100,000 to $199,999 1 197 996................................ 4.1 9.4 18.6 1.2 1.9 6.0 10.07$200,000 to $249,999 301 794................................ 4.6 15.0 17.0 .4 1.0 7.0 8.68$250,000 to $499,999 682 583................................ 6.0 12.8 18.5 .5 1.8 4.0 10.69$500,000 to $999,999 372 078................................ 5.6 12.2 22.9 .6 1.6 5.3 11.610$1,000,000 or more 390 037.................................. 7.5 5.8 27.0 .6 1.3 6.6 12.511
Hispanic ~owned businesses 771 708................... 4.9 5.6 14.2 1.5 1.6 2.2 7.812
Less than $5,000 219 226.................................... 5.7 5.0 11.7 2.8 .7 1.2 12.113$5,000 to $9,999 140 362.................................... 2.8 2.7 11.8 .3 2.1 1.5 6.514$10,000 to $24,999 165 667.................................. 4.6 2.5 13.0 1.7 1.0 1.4 7.315$25,000 to $49,999 87 288.................................. 4.9 5.4 17.1 .7 1.6 3.6 5.216$50,000 to $99,999 64 742.................................. 4.8 6.5 15.9 1.5 2.7 2.9 6.017
$100,000 to $199,999 41 578................................ 4.7 9.5 15.6 1.2 2.5 3.9 7.318$200,000 to $249,999 10 030................................ 6.4 15.1 11.5 .2 1.2 2.7 6.119$250,000 to $499,999 22 301................................ 5.4 12.3 17.5 1.0 2.2 2.4 8.220$500,000 to $999,999 11 319................................ 4.4 11.0 18.5 1.3 2.4 2.2 4.321$1,000,000 or more 9 194.................................. 8.3 8.5 22.3 .6 1.3 4.4 7.622
Black ~owned businesses 620 912...................... 2.6 5.8 14.2 1.5 1.9 2.4 10.123
Less than $5,000 236 722.................................... 3.0 4.5 13.5 2.4 1.5 1.8 11.824$5,000 to $9,999 111 512.................................... 2.8 4.3 14.5 .9 2.0 1.7 8.825$10,000 to $24,999 129 901.................................. 1.9 3.9 16.0 1.1 2.0 2.3 8.626$25,000 to $49,999 62 209.................................. 2.3 9.2 10.2 .8 1.9 3.4 9.327$50,000 to $99,999 39 218.................................. 1.6 6.6 14.5 1.2 2.8 4.3 10.428
$100,000 to $199,999 20 936................................ 2.2 12.7 14.9 1.5 2.0 5.2 10.229$200,000 to $249,999 4 533................................ 3.1 24.8 14.2 .9 1.0 5.6 12.030$250,000 to $499,999 9 029................................ 2.6 19.9 14.4 .6 2.4 3.9 8.631$500,000 to $999,999 3 823................................ 5.9 15.9 21.3 1.2 4.0 3.8 7.832$1,000,000 or more 3 028.................................. 4.8 9.5 23.9 .5 1.7 4.2 12.533
Other minority ~owned businesses 606 426............. 9.6 11.8 17.6 2.8 1.2 2.2 7.734
Less than $5,000 132 493.................................... 10.6 12.7 18.8 4.9 1.6 1.8 8.835$5,000 to $9,999 80 435.................................... 6.4 7.3 18.4 2.7 2.7 3.2 7.436$10,000 to $24,999 108 195.................................. 8.8 8.7 15.7 2.2 .5 3.2 7.037$25,000 to $49,999 77 345.................................. 11.2 7.3 11.7 2.3 1.3 1.5 6.138$50,000 to $99,999 70 360.................................. 9.0 8.7 16.1 2.4 .8 2.0 9.339
$100,000 to $199,999 58 620................................ 7.3 15.5 20.5 3.1 .6 1.4 8.240$200,000 to $249,999 15 740................................ 10.9 17.7 19.5 3.1 1.4 3.2 5.941$250,000 to $499,999 34 266................................ 11.1 20.5 17.7 1.5 1.1 2.1 7.842$500,000 to $999,999 16 467................................ 11.1 17.3 21.8 2.0 1.2 3.7 6.743$1,000,000 or more 12 505.................................. 12.5 11.9 24.4 1.7 1.5 1.9 8.344
Women ~owned businesses 5 888 883.................... 3.3 6.9 16.0 1.1 1.3 2.0 14.945
Less than $5,000 2 310 303.................................... 3.7 6.9 15.8 2.1 1.4 1.9 14.046$5,000 to $9,999 967 380.................................... 1.5 5.9 15.1 .6 1.6 2.0 13.247$10,000 to $24,999 1 051 358.................................. 3.0 5.3 13.9 .2 1.5 1.6 15.748$25,000 to $49,999 538 885.................................. 4.1 7.7 13.9 1.7 .5 .9 16.949$50,000 to $99,999 381 517.................................. 2.5 7.0 17.0 .9 1.9 3.9 16.050
$100,000 to $199,999 267 089................................ 3.9 11.3 21.3 .4 1.0 2.6 13.751$200,000 to $249,999 66 464................................ 2.8 5.3 23.9 .3 .4 5.0 15.852$250,000 to $499,999 146 313................................ 3.6 9.9 16.1 .7 1.1 1.7 16.353$500,000 to $999,999 80 539................................ 5.9 8.6 19.6 .4 1.2 2.3 15.754$1,000,000 or more 79 037.................................. 5.1 5.4 21.9 .4 1.0 2.9 17.355
Nonminority male ~owned businesses 10 114 456.......... 5.7 6.7 18.3 .8 2.3 4.4 10.556
Less than $5,000 2 608 047.................................... 3.8 4.0 22.3 .5 1.9 2.4 9.557$5,000 to $9,999 1 285 456.................................... 3.6 3.4 14.8 .7 3.3 5.1 9.458$10,000 to $24,999 1 763 830.................................. 8.4 5.4 14.7 .2 3.7 3.2 10.759$25,000 to $49,999 1 248 482.................................. 9.2 7.4 13.0 1.3 2.2 2.3 12.460$50,000 to $99,999 1 108 065.................................. 4.6 7.6 17.2 1.6 1.3 5.5 13.561
$100,000 to $199,999 840 723................................ 3.9 8.2 17.7 1.3 2.2 7.6 9.062$200,000 to $249,999 212 693................................ 4.8 18.2 14.2 .2 1.1 8.4 6.163$250,000 to $499,999 488 462................................ 6.4 13.1 19.6 .3 2.1 5.0 9.164$500,000 to $999,999 266 408................................ 5.2 13.0 24.2 .6 1.8 6.5 11.065$1,000,000 or more 292 290.................................. 7.8 5.5 28.5 .6 1.4 7.8 11.766
1Data represent percentage of owners reporting in the designated categories.2Includes owners who did not receive any education past high school.3For explanation of relative standard errors and standard errors, see Reliability of Estimates in the introductory text.4Relative standard errors are not applicable for lines 1 through 11 since these data are the result of censuses, not surveys.
80 CHARACTERISTICS OF BUSINESS OWNERS 1992 ECONOMIC CENSUS

Receipts Size of Firm: 1992
Standard error of estimate3 for columnmMathe~matics
MilitaryTechno~
logiesOther
collegeOther
vocationalNot
reported
Notappli~
cable2
Relativestandard
error ofestimate3 4
I J K L M N A B C D E F G H I J K L M N
.8 .5 5.9 5.5 8.0 32.0 (X) .2 .3 .4 .1 .2 .2 .5 .1 .1 .3 .3 .3 .6 1
1.0 .4 6.3 5.8 8.1 33.4 (X) .6 .6 1.4 .2 .5 .4 .9 .3 .3 .7 .7 .9 1.8 2.6 .5 9.3 5.6 9.5 34.7 (X) .7 .8 1.0 .3 .6 .9 1.5 .2 .4 1.3 .8 1.5 1.7 3.9 .1 7.0 5.9 4.8 37.8 (X) 1.1 .7 1.8 .1 .5 .4 1.3 .4 .1 .5 .6 .9 1.6 4.4 1.4 4.1 7.3 9.5 30.9 (X) 1.3 1.1 1.0 .7 .6 .6 1.9 .3 .9 .8 1.1 1.5 2.6 5.9 .4 5.1 5.6 7.2 30.7 (X) .7 1.4 1.5 .4 .4 1.2 1.2 .2 .1 .6 1.1 1.1 1.7 6
.8 .2 4.9 4.7 7.9 30.3 (X) .5 .7 1.5 .4 .4 .8 1.0 .2 .1 .6 .8 .8 2.0 7
.7 – 4.7 5.3 5.8 30.0 (X) 1.6 2.4 2.0 .2 .5 3.4 1.6 .4 – 1.5 1.4 1.4 2.2 81.0 .3 4.5 4.0 9.9 26.1 (X) .5 .7 .8 .1 .3 .5 .5 .2 .1 .6 .5 1.1 1.1 9.8 .2 4.0 2.6 9.9 22.7 (X) .7 1.3 1.6 .2 .4 .5 .9 .2 .1 .4 .3 1.0 1.6 10.9 .3 3.4 2.2 10.5 21.4 (X) .7 .4 .9 .1 .1 .7 .5 .1 .1 .3 .2 .5 .6 11
.5 .2 3.8 5.0 9.1 43.6 – .4 .5 .6 .2 .2 .2 .5 .1 .1 .4 .5 .5 1.0 12
.7 .4 4.0 5.3 9.0 41.5 1.0 1.4 1.7 2.0 .6 .3 .4 1.7 .2 .2 1.2 1.0 1.3 3.7 13– .3 4.9 6.4 12.1 48.5 1.0 .8 .7 1.5 .2 1.2 .5 2.2 – .4 1.1 1.5 1.9 1.8 14
.4 – 5.2 4.6 7.7 50.7 1.0 .8 .8 1.7 .7 .4 .4 1.2 .2 – .9 1.0 1.3 3.1 15
.2 – 2.0 6.5 9.6 43.0 1.0 1.0 1.4 2.7 .4 .6 1.3 1.8 .1 – .7 1.5 1.3 2.7 161.1 .3 3.4 4.4 6.7 43.8 1.0 .8 .9 2.6 1.0 .7 .7 .9 .5 .2 .8 .9 1.5 2.7 17
.6 .3 2.1 4.6 7.8 39.8 1.0 1.1 1.1 1.3 .4 .5 1.1 1.4 .3 .3 .7 1.0 1.5 1.7 18
.9 – 7.6 2.7 8.6 36.9 3.0 1.6 2.6 2.7 .1 .4 2.0 1.5 .5 – 2.4 1.6 1.7 5.6 191.0 .1 3.2 3.9 8.5 34.3 2.0 .7 1.8 .7 .3 .7 .6 1.2 .4 .1 1.0 .5 .9 2.0 20.3 .2 1.2 3.9 13.8 36.5 3.0 1.1 1.4 1.9 .6 .5 .6 .7 .2 .2 .4 .7 2.1 3.4 21.4 .3 2.8 2.2 10.6 30.6 2.0 .7 1.0 1.4 .1 .4 .7 .8 .1 .2 .6 .4 .9 1.9 22
.9 .3 5.5 7.5 9.8 37.6 – .3 .2 .5 .1 .1 .2 .5 .1 .1 .3 .5 .4 .4 23
1.0 .5 6.9 7.7 11.6 33.9 – .5 .2 .5 .3 .3 .4 1.1 .3 .1 .6 .8 1.1 1.2 241.0 .4 7.1 6.2 10.9 39.3 – .7 .8 1.1 .4 .4 .5 1.1 .4 .2 .8 1.1 .9 1.3 25.5 .2 3.2 8.5 8.8 43.1 – .4 1.1 1.3 .3 .4 .6 .7 .2 .2 .6 1.1 1.0 1.7 26.9 .1 5.8 9.7 6.5 39.7 – .9 1.5 1.4 .2 .7 .8 2.1 .4 .1 1.4 1.8 1.3 2.3 27.9 – 2.3 6.4 7.7 41.2 1.0 .6 1.1 1.7 .4 .8 1.1 1.5 .4 – .5 1.4 1.0 2.6 28
1.6 .8 4.1 5.6 6.5 32.8 1.0 .5 2.2 1.3 .5 .5 1.1 1.5 .4 .5 1.0 1.1 1.6 1.3 29– .2 2.7 2.9 6.4 26.1 3.0 1.6 4.2 3.0 .6 .5 2.0 2.8 .1 .3 1.8 1.7 1.5 3.8 30
.7 .1 5.5 4.5 6.9 29.9 3.0 .8 2.3 1.7 .5 .6 1.0 1.7 .2 .1 1.2 1.6 .7 3.5 31
.6 .1 6.1 4.6 8.7 20.1 4.0 1.4 1.7 2.8 .5 1.7 1.8 1.4 .2 .1 1.6 1.4 2.1 1.6 32
.8 .2 4.5 2.0 12.1 23.2 4.0 .7 2.0 1.6 .2 .5 .6 1.9 .2 .1 .6 .3 1.3 2.1 33
1.3 .3 5.3 5.1 8.5 26.5 – .5 .9 .9 .4 .3 .3 .8 .2 .1 .4 .5 .8 .6 34
1.6 .9 5.4 6.5 5.5 21.0 1.0 1.7 4.0 3.4 1.5 .7 .7 2.7 .6 .4 1.3 1.3 2.2 2.0 352.2 – 7.3 5.9 6.6 29.8 1.0 2.3 1.8 3.1 1.6 1.4 1.1 2.8 1.6 – 2.3 1.6 2.0 3.6 361.4 .2 5.2 6.7 9.6 30.9 1.0 1.6 2.3 1.6 1.1 .2 1.6 2.4 .7 .2 1.1 1.7 2.5 3.1 37.9 – 5.4 4.2 10.0 38.2 1.0 1.2 1.5 1.9 1.5 .9 .7 1.5 .6 – 2.1 2.2 2.5 3.1 38
1.0 .1 6.1 6.3 8.3 29.8 1.0 1.8 1.2 2.1 .7 .2 .8 1.1 .4 .1 1.0 1.8 1.3 4.2 39
.5 .2 5.6 4.8 10.2 22.0 1.0 1.0 1.8 2.7 .9 .2 .4 .9 .2 .1 1.2 1.0 1.1 1.7 40
.3 .2 3.3 2.9 10.0 21.8 2.0 1.4 3.1 2.6 1.2 .6 1.8 2.1 .2 .1 1.1 2.8 1.4 1.9 411.8 .1 3.4 3.3 6.4 23.2 1.0 1.2 1.3 1.6 .3 .3 .6 .9 .3 .1 .7 .7 .7 2.0 421.6 .3 4.0 2.0 10.2 17.9 2.0 1.4 1.2 2.1 .6 .4 .4 .7 .4 .2 .7 .8 1.8 1.0 431.3 .4 3.7 3.4 13.6 15.3 2.0 1.1 1.2 .8 .3 .3 .3 1.0 .3 .2 .4 .4 1.0 1.1 44
.8 .1 8.2 6.2 8.6 30.5 – .3 .4 .5 .2 .3 .2 .5 .1 .1 .6 .4 .5 .9 45
.8 .2 8.1 5.4 8.0 31.8 – .8 1.0 1.6 .5 .6 .4 .6 .4 .1 1.0 .8 .9 1.9 461.0 .2 10.7 8.9 8.6 30.6 – .6 1.4 1.6 .3 .5 .7 1.7 .4 .2 1.5 1.7 1.7 2.3 47.7 – 10.7 7.3 6.9 33.3 – .6 1.1 1.9 .1 .6 .7 1.4 .3 – 1.5 1.0 1.3 1.7 48.3 .1 6.6 6.7 9.7 30.8 – 1.2 2.5 3.1 1.5 .3 .4 3.6 .2 .1 1.5 2.1 3.4 3.2 49.6 .1 7.0 6.0 12.3 24.9 – .4 1.3 1.9 .5 .8 1.3 1.5 .3 – 1.0 1.0 2.3 2.1 50
1.3 .3 6.0 5.3 6.6 26.3 – .7 1.6 1.7 .2 .6 1.4 1.0 .4 .2 1.1 1.0 1.3 1.8 511.2 .1 4.5 1.7 8.5 30.4 1.0 .7 1.2 2.6 .2 .2 1.8 3.5 .9 – 1.6 .7 1.1 5.5 521.3 .2 5.5 5.5 9.9 28.4 1.0 .5 .7 .9 .2 .2 .3 .6 .5 .1 .5 .9 .5 .9 531.2 .2 5.0 2.8 11.8 25.3 1.0 .9 .7 1.2 .1 .3 .4 1.7 .2 .1 .5 .7 1.0 1.4 54.9 .3 4.4 2.4 12.0 26.0 1.0 .4 .4 .5 .1 .1 .6 .8 .1 .1 .5 .2 .6 .8 55
.8 .7 4.9 5.1 7.6 32.2 – .3 .5 .8 .2 .2 .4 .8 .2 .2 .5 .6 .6 .9 56
1.2 .7 5.0 6.1 8.0 34.5 – .9 1.0 2.1 .4 .7 .7 1.4 .4 .5 1.0 1.4 1.4 3.2 57.2 .7 8.8 2.9 9.8 37.3 – 1.3 1.5 1.5 .6 .9 1.9 2.3 .1 .8 2.4 .9 2.2 2.8 58
1.2 .1 4.9 5.1 2.7 39.7 – 2.0 1.3 2.7 .2 .9 .7 2.2 .6 .1 .8 1.2 1.0 3.3 59.4 2.1 3.2 7.8 9.5 29.1 – 1.9 1.9 2.1 .9 .9 .9 2.2 .4 1.2 1.1 1.4 2.0 4.0 60
1.0 .6 4.6 5.5 5.4 31.6 – 1.1 2.0 1.8 .5 .5 1.8 1.8 .3 .2 .8 1.5 1.1 1.9 61
.6 .2 4.7 4.5 8.4 31.7 – .7 1.1 2.0 .5 .5 1.4 1.4 .2 .1 .9 .9 1.3 2.7 62
.5 – 4.8 6.9 4.5 30.3 – 2.8 3.6 2.7 .1 .7 5.6 1.9 .5 – 2.6 1.9 2.0 3.8 63
.8 .3 4.4 3.6 10.3 25.0 – .7 1.0 1.3 .1 .4 .8 .6 .3 .2 .9 .6 1.7 1.5 64
.7 .2 3.8 2.5 9.0 21.5 – .8 1.8 2.4 .2 .5 .8 1.0 .2 .1 .6 .4 1.2 1.8 65
.9 .3 3.2 2.2 10.0 20.2 – .9 .5 1.2 .1 .2 .9 .6 .1 .1 .3 .2 .5 .8 66
1992 ECONOMIC CENSUS CHARACTERISTICS OF BUSINESS OWNERS 81

Table 9c. Owner’s Area of Concentration in College or Other School Beyond High School by[All data are shown as percents, except firms. For meaning of abbreviations and symbols, see introductory text. For explanation of terms, see appendix A]
Type of firm and employment size Firms(number)
Architecture/Engineering
Biological/MedicalScience Business
ComputerScience
ConstructionTrade/
Industrial Arts
Law andLegal
Studies
Liberal Arts/GeneralStudies
A B C D E F G H
All businesses 17 253 143................................ 5.0 6.9 17.3 1.0 1.9 3.5 11.71
With no paid employees 14 118 184.............................. 5.0 6.0 16.9 1.0 2.0 2.9 11.92With paid employees 3 134 959................................. 5.1 9.8 18.7 1.0 1.6 5.3 11.23
No employees5 435 838.................................... 8.5 6.3 17.8 1.1 2.0 1.7 10.141 to 4 employees 1 716 076.................................. 4.0 10.2 15.6 1.3 1.6 6.6 11.655 to 9 employees 503 808.................................. 4.2 14.2 17.9 .6 1.4 3.6 9.4610 to 19 employees 256 110................................ 6.1 9.0 22.8 .4 1.8 4.4 10.7720 to 49 employees 144 734................................ 6.3 6.8 28.8 .5 1.8 5.2 12.7850 to 99 employees 45 331................................ 7.8 3.1 32.2 .4 .7 5.5 13.79100 employees or more 33 062............................ 7.0 2.7 24.9 .7 1.4 12.4 15.210
Hispanic ~owned businesses 771 708................... 4.9 5.6 14.2 1.5 1.6 2.2 7.811
With no paid employees 656 343.............................. 4.9 4.2 13.5 1.6 1.2 1.9 8.312With paid employees 115 364................................. 4.8 10.2 16.5 .9 2.7 3.1 6.213
No employees5 19 569.................................... 5.4 8.7 15.9 1.3 2.7 1.8 6.3141 to 4 employees 64 631.................................. 4.1 11.7 14.5 .9 3.0 3.3 5.3155 to 9 employees 16 937.................................. 6.2 10.1 17.6 .7 3.0 3.3 6.31610 to 19 employees 8 553................................ 3.3 8.0 19.3 .8 .8 2.6 8.61720 to 49 employees 4 050................................ 6.0 7.2 22.1 .3 2.9 2.7 7.41850 to 99 employees 948................................ 9.0 6.5 27.2 1.1 1.4 5.0 6.719100 employees or more 676............................ 5.1 1.2 30.0 .6 – 8.9 12.220
Black ~owned businesses 620 912...................... 2.6 5.8 14.2 1.5 1.9 2.4 10.121
With no paid employees 556 434.............................. 2.6 5.0 13.8 1.5 1.7 2.3 10.422With paid employees 64 478................................. 2.8 11.1 16.9 1.4 3.0 3.7 7.323
No employees5 13 725.................................... 5.3 5.1 14.8 2.8 3.2 4.6 5.8241 to 4 employees 37 587.................................. 1.3 13.4 17.4 .9 3.0 3.9 6.7255 to 9 employees 7 853.................................. 4.6 11.2 13.3 1.7 2.9 2.0 10.72610 to 19 employees 2 839................................ 3.1 10.9 15.2 1.9 4.7 2.7 7.52720 to 49 employees 1 700................................ 4.4 9.0 24.7 .3 1.3 3.6 8.82850 to 99 employees 432................................ 7.2 7.7 46.0 (D) 1.2 (D) 11.729100 employees or more 342............................ 2.8 4.2 30.9 – 1.3 3.3 15.830
Other minority ~owned businesses 606 426............. 9.6 11.8 17.6 2.8 1.2 2.2 7.731
With no paid employees 470 075.............................. 9.3 10.7 16.3 3.2 1.3 2.4 7.732With paid employees 136 351................................. 10.2 14.0 20.2 1.9 1.0 2.0 7.833
No employees5 19 989.................................... 15.9 8.9 23.7 2.1 .6 .9 9.4341 to 4 employees 76 636.................................. 8.1 16.1 19.0 1.8 1.1 1.5 8.3355 to 9 employees 22 862.................................. 9.3 16.4 19.0 2.0 .6 3.2 5.53610 to 19 employees 10 051................................ 13.9 10.4 19.8 2.1 2.0 2.7 7.13720 to 49 employees 5 034................................ 9.9 7.6 28.4 .9 .7 2.5 8.53850 to 99 employees 1 075................................ 18.3 9.9 18.5 .3 .6 1.5 6.639100 employees or more 705............................ 12.4 9.8 19.4 5.3 .5 1.4 4.840
Women ~owned businesses 5 888 883.................... 3.3 6.9 16.0 1.1 1.3 2.0 14.941
With no paid employees 5 071 110.............................. 3.1 6.8 15.4 1.2 1.3 1.9 15.142With paid employees 817 773................................. 4.2 7.2 18.5 1.0 1.2 2.6 14.043
No employees5 127 905.................................... 7.8 6.2 15.4 .2 1.1 1.2 15.2441 to 4 employees 435 550.................................. 3.3 7.5 17.5 1.6 1.3 3.1 14.0455 to 9 employees 134 476.................................. 3.9 8.7 19.5 .6 1.3 2.9 11.84610 to 19 employees 67 487................................ 5.0 5.9 18.3 .4 1.2 1.5 12.94720 to 49 employees 35 515................................ 3.4 6.7 28.1 .2 1.0 1.8 15.54850 to 99 employees 10 178................................ 3.2 4.5 27.1 .1 .7 1.6 22.849100 employees or more 6 663............................ 2.8 5.2 21.0 .4 – 2.9 21.150
Nonminority male ~owned businesses 10 114 456.......... 5.7 6.7 18.3 .8 2.3 4.4 10.551
With no paid employees 8 019 462.............................. 5.9 5.5 18.1 .7 2.4 3.6 10.552With paid employees 2 094 993................................. 5.1 10.4 18.8 .9 1.7 6.7 10.753
No employees5 271 380.................................... 8.7 6.4 19.5 1.4 2.5 1.8 8.2541 to 4 employees 1 155 800.................................. 4.0 10.6 14.7 1.1 1.7 8.7 11.4555 to 9 employees 334 483.................................. 3.8 16.4 17.3 .5 1.4 3.9 8.85610 to 19 employees 173 140................................ 6.1 10.0 24.8 .3 2.1 5.7 10.25720 to 49 employees 101 938................................ 6.9 6.6 29.2 .5 2.1 6.5 12.35850 to 99 employees 33 406................................ 8.3 2.5 33.9 .4 .6 6.6 12.059100 employees or more 24 846............................ 7.9 1.8 26.1 .7 1.8 15.7 13.960
1Data represent percentage of owners reporting in the designated categories.2Includes owners who did not receive any education past high school.3For explanation of relative standard errors and standard errors, see Reliability of Estimates in the introductory text.4Relative standard errors are not applicable for lines 1 through 10 since these data are the result of censuses, not surveys.5Firms reported annual payroll, but did not report any employees on their payroll during specified period in 1992.
82 CHARACTERISTICS OF BUSINESS OWNERS 1992 ECONOMIC CENSUS

Employment Size of Firm: 1992
Standard error of estimate3 for columnmMathe~matics
MilitaryTechno~
logiesOther
collegeOther
vocationalNot
reported
Notappli~
cable2
Relativestandard
error ofestimate3 4
I J K L M N A B C D E F G H I J K L M N
.8 .5 5.9 5.5 8.0 32.0 (X) .3 .3 .5 .1 .2 .3 .5 .1 .2 .4 .3 .5 .7 1
.8 .5 6.3 5.6 7.9 33.2 (X) .4 .3 .6 .2 .2 .4 .7 .2 .2 .5 .5 .6 .9 21.0 .4 4.6 5.0 8.4 28.1 (X) .2 .4 .4 .2 .2 .3 .6 .1 .2 .4 .3 .6 .5 3.5 – 4.6 7.0 7.6 32.8 (X) 2.4 1.3 2.2 .7 .7 .7 1.9 .3 – 1.0 1.6 1.9 2.8 4
1.0 .6 5.3 5.5 7.7 29.1 (X) .3 .8 .5 .5 .3 .6 1.3 .3 .3 .6 .7 1.0 1.3 51.0 .3 4.3 4.7 8.8 29.4 (X) .3 .7 .9 .1 .2 .4 .6 .4 .2 .7 .9 .7 1.1 61.0 .2 3.7 4.1 9.4 26.4 (X) .5 .5 1.2 .1 .7 .4 .4 .3 .1 .5 .6 .5 1.6 71.3 .2 3.2 2.8 9.4 21.1 (X) .5 .3 1.2 .2 .4 .6 .9 .2 .1 .2 .8 .6 1.0 81.0 .2 3.4 1.5 12.6 17.9 (X) .7 .4 1.3 .3 .2 .5 1.0 .4 .1 .3 .3 1.5 1.1 9.6 – 4.2 2.7 13.1 15.1 (X) .9 .6 1.4 .2 .3 1.2 1.8 .2 – .7 .7 1.4 1.3 10
.5 .2 3.8 5.0 9.1 43.6 – .4 .4 .5 .3 .3 .1 .6 .1 .1 .4 .6 .5 1.1 11
.5 .2 4.2 5.4 9.0 45.0 – .5 .6 .7 .4 .4 .2 .8 .1 .1 .5 .8 .6 1.4 12
.8 .1 2.6 3.7 9.5 39.1 1.0 .4 .5 1.1 .3 .4 .3 .7 .3 – .3 .4 1.0 1.4 13
.4 – 4.9 2.9 11.9 37.8 2.0 1.4 2.3 3.3 .5 1.2 1.1 1.5 .2 – 2.1 .8 3.4 4.1 141.2 – 1.9 3.2 8.7 42.0 1.0 .5 .6 1.4 .4 .5 .7 .9 .6 – .4 .4 1.2 2.4 15.4 .2 2.3 5.8 9.4 34.7 2.0 .7 1.2 2.1 .3 .7 .8 1.3 .2 .1 .4 1.6 1.6 1.7 16.3 .3 2.7 3.9 10.2 38.9 3.0 .6 .8 1.5 .3 .1 .8 1.2 .1 .1 .6 .8 1.0 1.4 17.3 .3 2.4 4.6 10.7 33.0 4.0 .8 1.4 3.2 .1 1.3 .3 1.4 .1 .3 .6 1.7 1.8 1.4 18
(D) (D) 6.5 1.5 5.6 29.3 6.0 1.9 2.5 3.6 .8 .7 1.4 2.5 (D) (D) 2.5 .4 1.1 3.4 19(D) – (D) 2.2 6.1 31.0 8.0 1.2 .5 4.5 .4 – 2.5 2.9 (D) – (D) .8 1.6 4.8 20
.9 .3 5.5 7.5 9.8 37.6 – .2 .3 .7 .2 .2 .4 .4 .2 .1 .4 .3 .6 .8 21
.9 .3 5.8 7.5 10.1 38.1 – .2 .3 .7 .2 .2 .4 .4 .2 .1 .5 .4 .6 .8 22
.9 .3 3.6 7.4 7.3 34.4 1.0 .5 .7 1.4 .4 .5 .7 .7 .3 .1 .5 .8 .9 2.1 231.7 .2 1.6 3.0 10.7 41.3 2.0 3.1 2.5 4.0 1.4 1.1 1.7 1.7 .9 .1 1.0 .8 3.0 4.2 24.7 .4 3.6 8.7 5.5 34.6 1.0 .5 1.4 1.9 .3 .7 .8 1.0 .3 .2 .9 1.3 .8 2.3 25
1.0 .1 4.2 9.0 7.4 32.0 3.0 1.4 2.1 2.9 .6 .8 .5 1.9 .6 .1 .7 2.4 1.7 2.7 26.7 – 6.6 8.1 10.3 28.2 4.0 .7 2.1 2.4 .9 1.9 .7 1.9 .4 – 1.7 4.6 2.8 4.6 27
(D) (D) 8.1 6.4 14.1 18.7 6.0 1.7 2.0 4.5 .2 .5 1.0 2.1 (D) (D) 2.8 3.7 3.0 3.3 282.2 – 3.0 2.1 4.6 13.3 8.0 2.9 1.6 4.8 (D) .9 (D) 4.3 1.5 – 1.5 1.3 1.1 3.9 292.0 – (D) (D) 12.0 23.0 – 1.2 1.6 4.8 – .7 1.1 5.0 1.4 – (D) (D) 2.6 6.7 30
1.3 .3 5.3 5.1 8.5 26.5 – .5 .4 .7 .4 .2 .3 .5 .3 .1 .6 .6 .4 .9 31
1.3 .3 5.6 5.5 7.8 28.5 – .6 .6 .7 .6 .3 .4 .8 .4 .1 .6 .8 .6 1.3 321.3 .2 4.6 4.5 10.0 22.6 1.0 .6 .6 1.0 .1 .1 .3 .6 .3 .1 .7 .6 1.0 .6 33.3 – 3.8 3.7 11.4 19.4 2.0 3.8 1.2 4.2 .8 .4 .4 2.6 .4 – 1.1 1.0 3.7 3.2 34
1.5 .2 5.6 5.4 9.6 21.7 1.0 .8 .7 1.4 .3 .3 .4 1.0 .7 .1 1.0 1.2 1.4 1.2 351.2 .3 3.9 2.9 8.8 26.9 2.0 .7 1.3 2.3 .7 .2 .9 1.1 .4 .2 .6 .7 1.0 1.2 361.0 – 3.4 4.4 8.1 25.1 2.0 1.8 1.3 1.4 .8 .3 .4 .8 .2 – .8 1.7 .8 2.1 371.2 .4 3.4 3.3 11.8 21.3 4.0 1.2 .9 1.7 .3 .3 1.1 1.0 .4 .1 .7 .8 1.6 2.4 381.9 .9 2.5 3.6 22.5 13.0 6.0 2.5 1.9 1.8 .2 .6 1.2 1.7 1.0 .7 .8 1.2 3.8 2.4 392.3 – 5.5 1.4 22.7 14.5 6.0 1.8 3.1 1.7 2.2 .4 1.1 1.1 1.1 – 1.8 .6 3.3 2.5 40
.8 .1 8.2 6.2 8.6 30.5 – .5 .6 .5 .2 .2 .2 .5 .2 – .8 .5 .9 .8 41
.8 .1 8.7 6.4 8.3 31.0 – .5 .7 .6 .3 .2 .2 .6 .3 – .9 .7 1.0 1.0 421.0 .2 6.5 5.5 9.7 28.5 – .6 .4 .5 .3 .2 .4 .9 .1 .1 .6 .5 1.0 .8 43.7 – 7.9 8.1 12.8 23.3 1.0 4.1 .9 1.4 .1 .5 .8 3.3 .5 – 2.4 2.1 4.4 3.2 44.9 .2 7.1 5.4 8.9 29.1 – .6 .8 1.1 .7 .3 .6 1.6 .2 .1 1.3 .9 1.2 1.9 45
1.5 .1 5.5 4.5 8.6 31.0 1.0 .5 .7 1.4 .2 .2 .6 .9 .4 .1 .9 .8 .7 1.9 46.5 .3 4.6 6.3 11.2 32.1 1.0 .7 .9 1.4 .1 .2 .3 .9 .1 .2 .7 1.3 1.3 2.6 47
1.3 .2 5.8 3.6 9.2 23.1 1.0 .5 1.0 2.5 – .4 .3 .4 .3 .1 1.5 .7 1.0 1.8 48.3 .4 5.7 1.6 11.1 20.8 2.0 .7 .6 1.5 – .2 .3 1.7 .1 .2 1.2 .3 1.9 2.5 49.8 – 4.8 2.2 12.9 25.8 2.0 .5 1.5 2.9 .3 – 1.2 1.8 .4 – 1.5 .8 1.2 2.7 50
.8 .7 4.9 5.1 7.6 32.2 – .4 .4 .7 .1 .3 .5 .6 .2 .3 .3 .4 .6 .9 51
.8 .7 5.2 5.2 7.6 33.8 – .6 .4 .9 .2 .3 .6 .8 .2 .3 .4 .5 .7 1.2 52
.9 .5 4.0 4.9 7.8 27.5 – .3 .5 .7 .2 .3 .4 .7 .2 .2 .5 .5 .7 .7 53
.3 – 2.9 7.0 3.8 37.6 – 3.6 2.0 3.4 1.1 1.1 1.0 2.6 .3 – .9 2.7 1.0 4.0 54
.9 .8 4.7 5.7 7.1 28.6 – .5 1.0 1.0 .4 .5 .9 1.5 .5 .5 .9 .9 1.1 1.7 55
.9 .4 3.9 4.9 9.0 28.7 – .5 1.3 1.2 .2 .3 .6 .9 .6 .2 .9 1.2 1.1 1.5 561.2 .3 3.3 3.3 8.9 23.7 1.0 .7 .9 1.9 .1 .9 .7 .4 .5 .1 .7 .7 .8 1.9 571.3 .2 2.5 2.5 9.2 20.1 1.0 .5 .5 1.5 .2 .5 .8 1.3 .3 .2 .3 1.0 .6 1.2 581.2 .2 2.8 1.5 12.8 17.0 1.0 .8 .5 1.6 .3 .3 .7 1.3 .5 .1 .3 .4 1.8 1.4 59.5 – 4.0 2.9 13.0 11.7 1.0 1.3 .4 1.7 .3 .4 1.6 2.5 .2 – .9 1.0 2.0 1.4 60
1992 ECONOMIC CENSUS CHARACTERISTICS OF BUSINESS OWNERS 83

Table 9d. Owner’s Area of Concentration in College or Other School Beyond High School by[All data are shown as percents, except firms. For meaning of abbreviations and symbols, see introductory text. For explanation of terms, see appendix A]
Type of firm and legal form of organization Firms(number)
Architecture/Engineering
Biological/MedicalScience Business
ComputerScience
ConstructionTrade/
Industrial Arts
Law andLegal
Studies
Liberal Arts/GeneralStudies
A B C D E F G H
All businesses 17 253 143................................ 5.0 6.9 17.3 1.0 1.9 3.5 11.71
Individual proprietorships 14 599 295............................. 4.8 6.4 14.9 1.1 2.2 2.9 11.82Partnerships 1 089 578........................................ 5.1 7.9 21.7 .4 .9 7.8 10.23Subchapter S corporations 1 564 270............................ 6.0 8.5 25.3 1.0 1.3 2.8 12.64
Hispanic ~owned businesses 771 708................... 4.9 5.6 14.2 1.5 1.6 2.2 7.85
Individual proprietorships 689 015............................. 4.1 5.0 12.2 1.2 1.7 2.0 7.36Partnerships 32 650........................................ 5.2 5.4 17.9 2.1 1.2 2.8 13.07Subchapter S corporations 50 042............................ 8.7 8.9 22.7 2.3 1.3 2.5 7.08
Black ~owned businesses 620 912...................... 2.6 5.8 14.2 1.5 1.9 2.4 10.19
Individual proprietorships 584 256............................. 2.5 5.6 13.5 1.5 1.9 2.3 10.110Partnerships 14 727........................................ 3.0 5.5 18.9 1.6 2.1 5.3 8.511Subchapter S corporations 21 928............................ 4.0 9.1 25.3 2.1 1.9 3.4 10.812
Other minority ~owned businesses 606 426............. 9.6 11.8 17.6 2.8 1.2 2.2 7.713
Individual proprietorships 502 022............................. 9.4 12.1 15.9 2.9 1.5 2.3 7.614Partnerships 49 489........................................ 8.1 15.0 17.9 1.5 .8 2.8 7.415Subchapter S corporations 54 915............................ 11.5 8.4 22.1 3.5 .8 1.4 8.316
Women ~owned businesses 5 888 883.................... 3.3 6.9 16.0 1.1 1.3 2.0 14.917
Individual proprietorships 5 078 077............................. 3.0 7.2 14.4 1.2 1.3 2.0 15.218Partnerships 243 651........................................ 4.8 6.1 16.3 .7 2.0 2.3 13.819Subchapter S corporations 567 155............................ 3.7 5.7 22.9 1.2 1.1 2.2 14.020
Nonminority male ~owned businesses 10 114 456.......... 5.7 6.7 18.3 .8 2.3 4.4 10.521
Individual proprietorships 8 414 238............................. 5.7 5.8 15.3 .9 2.8 3.4 10.422Partnerships 777 379........................................ 4.9 7.9 23.7 .1 .6 10.0 9.323Subchapter S corporations 922 838............................ 6.7 10.0 27.2 .7 1.4 3.2 12.624
1Data represent percentage of owners reporting in the designated categories.2Includes owners who did not receive any education past high school.3For explanation of relative standard errors and standard errors, see Reliability of Estimates in the introductory text.4Relative standard errors are not applicable for lines 1 through 4 since these data are the result of censuses, not surveys.
84 CHARACTERISTICS OF BUSINESS OWNERS 1992 ECONOMIC CENSUS

Legal Form of Organization of Firm: 1992
Standard error of estimate3 for columnmMathe~matics
MilitaryTechno~
logiesOther
collegeOther
vocationalNot
reported
Notappli~
cable2
Relativestandard
error ofestimate3 4
I J K L M N A B C D E F G H I J K L M N
.8 .5 5.9 5.5 8.0 32.0 (X) .2 .3 .4 .1 .2 .2 .5 .1 .1 .3 .3 .3 .6 1
.8 .4 6.8 6.1 6.4 35.5 (X) .4 .3 .7 .1 .2 .3 .5 .1 .1 .3 .3 .4 .8 2
.9 .9 3.4 3.9 11.9 25.0 (X) .8 1.3 2.0 .2 .2 1.4 1.0 .3 .8 .7 .6 1.2 1.7 3
.9 .1 4.1 3.8 12.4 21.2 (X) .6 .8 1.2 .3 .3 .4 1.3 .2 .1 .3 .8 1.6 .9 4
.5 .2 3.8 5.0 9.1 43.6 – .4 .5 .6 .2 .2 .2 .5 .1 .1 .4 .5 .5 1.0 5
.5 .2 4.0 5.1 8.0 48.6 – .6 .7 .7 .3 .2 .3 .7 .1 .1 .5 .5 .5 1.1 6
.4 .2 2.0 6.0 14.3 29.4 2.0 1.1 1.4 1.6 .8 .5 .5 2.3 .2 .1 .4 2.3 1.6 1.9 71.0 – 4.0 4.0 10.8 26.8 1.0 1.0 1.1 1.9 1.1 .3 .4 .7 .5 – 1.0 .7 1.2 1.9 8
.9 .3 5.5 7.5 9.8 37.6 – .3 .2 .5 .1 .1 .2 .5 .1 .1 .3 .5 .4 .4 9
.9 .3 5.6 7.6 9.7 38.6 – .3 .3 .6 .2 .1 .2 .6 .1 .1 .3 .5 .4 .5 101.6 .4 3.6 6.1 14.4 29.0 3.0 1.1 1.0 1.3 .7 .9 1.8 2.5 1.1 .3 1.6 1.9 2.6 2.6 11.4 .3 4.7 5.7 8.5 23.7 2.0 .5 1.5 2.0 .5 .7 .9 2.5 .2 .3 .9 1.6 .8 2.1 12
1.3 .3 5.3 5.1 8.5 26.5 – .5 .9 .9 .4 .3 .3 .8 .2 .1 .4 .5 .8 .6 13
1.6 .2 6.9 6.3 4.6 28.8 – .8 1.0 1.2 .5 .4 .3 1.1 .4 .1 .8 .7 .9 .7 141.0 .5 2.1 2.7 15.4 24.7 1.0 1.1 2.5 1.3 .5 .4 .9 1.3 .2 .3 .4 1.3 2.7 2.3 15.8 .3 3.5 4.0 13.4 22.0 1.0 .5 .8 1.5 1.1 .2 .3 .7 .2 .1 .6 .7 1.5 1.2 16
.8 .1 8.2 6.2 8.6 30.5 – .3 .4 .5 .2 .3 .2 .5 .1 .1 .6 .4 .5 .9 17
.7 .1 9.3 6.9 6.7 32.0 – .5 .5 .8 .2 .3 .2 .5 .2 .1 .7 .5 .6 1.2 181.7 .2 4.0 4.4 14.9 28.5 1.0 1.2 1.4 2.7 .7 .8 .7 1.7 .9 .1 .8 1.5 2.4 3.4 19.9 .1 5.3 4.0 14.3 24.5 – .4 .5 1.4 .6 .2 .6 .7 .2 – .7 .6 1.7 .6 20
.8 .7 4.9 5.1 7.6 32.2 – .3 .5 .8 .2 .2 .4 .8 .2 .2 .5 .6 .6 .9 21
.9 .6 5.5 5.7 6.2 36.8 – .6 .5 1.1 .2 .3 .6 .8 .2 .2 .6 .7 .6 1.2 22
.7 1.2 3.3 3.8 10.9 23.6 – .8 1.6 2.7 – .1 1.8 1.3 .3 1.0 .9 .8 1.5 1.8 23
.8 .2 3.5 3.7 11.1 18.8 – .9 1.2 1.8 .2 .5 .5 2.1 .3 .1 .5 1.2 1.9 1.6 24
1992 ECONOMIC CENSUS CHARACTERISTICS OF BUSINESS OWNERS 85
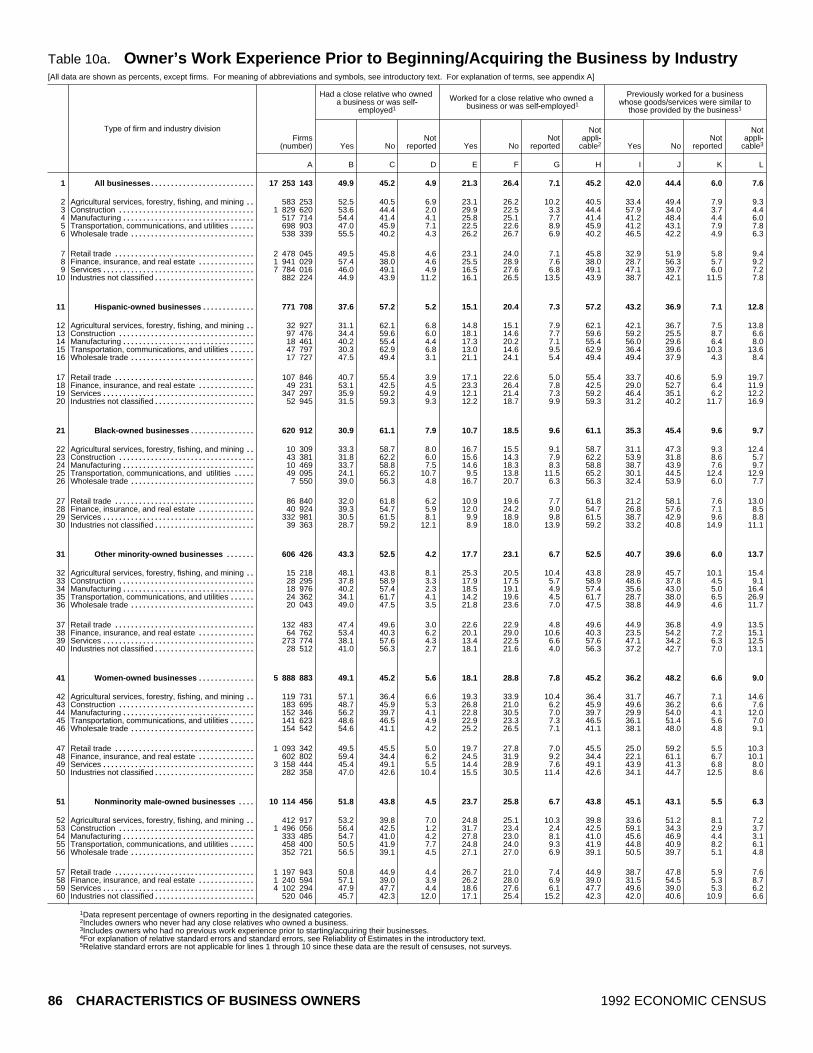
Table 10a. Owner’s Work Experience Prior to Beginning/Acquiring the Business by Industry[All data are shown as percents, except firms. For meaning of abbreviations and symbols, see introductory text. For explanation of terms, see appendix A]
Type of firm and industry division
Had a close relative who owneda business or was self~
employed1
Worked for a close relative who owned a business or was self~employed1
Previously worked for a businesswhose goods/services were similar to
those provided by the business1
Firms(number) Yes No
Notreported Yes No
Notreported
Notappli~
cable2 Yes NoNot
reported
Notappli~
cable3
A B C D E F G H I J K L
All businesses 17 253 143.......................... 49.9 45.2 4.9 21.3 26.4 7.1 45.2 42.0 44.4 6.0 7.61
Agricultural services, forestry, fishing, and mining 583 253.. 52.5 40.5 6.9 23.1 26.2 10.2 40.5 33.4 49.4 7.9 9.32Construction 1 829 620.................................. 53.6 44.4 2.0 29.9 22.5 3.3 44.4 57.9 34.0 3.7 4.43Manufacturing 517 714................................. 54.4 41.4 4.1 25.8 25.1 7.7 41.4 41.2 48.4 4.4 6.04Transportation, communications, and utilities 698 903...... 47.0 45.9 7.1 22.5 22.6 8.9 45.9 41.2 43.1 7.9 7.85Wholesale trade 538 339............................... 55.5 40.2 4.3 26.2 26.7 6.9 40.2 46.5 42.2 4.9 6.36
Retail trade 2 478 045................................... 49.5 45.8 4.6 23.1 24.0 7.1 45.8 32.9 51.9 5.8 9.47Finance, insurance, and real estate 1 941 029.............. 57.4 38.0 4.6 25.5 28.9 7.6 38.0 28.7 56.3 5.7 9.28Services 7 784 016...................................... 46.0 49.1 4.9 16.5 27.6 6.8 49.1 47.1 39.7 6.0 7.29Industries not classified 882 224......................... 44.9 43.9 11.2 16.1 26.5 13.5 43.9 38.7 42.1 11.5 7.810
Hispanic ~owned businesses 771 708............. 37.6 57.2 5.2 15.1 20.4 7.3 57.2 43.2 36.9 7.1 12.811
Agricultural services, forestry, fishing, and mining 32 927.. 31.1 62.1 6.8 14.8 15.1 7.9 62.1 42.1 36.7 7.5 13.812Construction 97 476.................................. 34.4 59.6 6.0 18.1 14.6 7.7 59.6 59.2 25.5 8.7 6.613Manufacturing 18 461................................. 40.2 55.4 4.4 17.3 20.2 7.1 55.4 56.0 29.6 6.4 8.014Transportation, communications, and utilities 47 797...... 30.3 62.9 6.8 13.0 14.6 9.5 62.9 36.4 39.6 10.3 13.615Wholesale trade 17 727............................... 47.5 49.4 3.1 21.1 24.1 5.4 49.4 49.4 37.9 4.3 8.416
Retail trade 107 846................................... 40.7 55.4 3.9 17.1 22.6 5.0 55.4 33.7 40.6 5.9 19.717Finance, insurance, and real estate 49 231.............. 53.1 42.5 4.5 23.3 26.4 7.8 42.5 29.0 52.7 6.4 11.918Services 347 297...................................... 35.9 59.2 4.9 12.1 21.4 7.3 59.2 46.4 35.1 6.2 12.219Industries not classified 52 945......................... 31.5 59.3 9.3 12.2 18.7 9.9 59.3 31.2 40.2 11.7 16.920
Black ~owned businesses 620 912................ 30.9 61.1 7.9 10.7 18.5 9.6 61.1 35.3 45.4 9.6 9.721
Agricultural services, forestry, fishing, and mining 10 309.. 33.3 58.7 8.0 16.7 15.5 9.1 58.7 31.1 47.3 9.3 12.422Construction 43 381.................................. 31.8 62.2 6.0 15.6 14.3 7.9 62.2 53.9 31.8 8.6 5.723Manufacturing 10 469................................. 33.7 58.8 7.5 14.6 18.3 8.3 58.8 38.7 43.9 7.6 9.724Transportation, communications, and utilities 49 095..... 24.1 65.2 10.7 9.5 13.8 11.5 65.2 30.1 44.5 12.4 12.925Wholesale trade 7 550............................... 39.0 56.3 4.8 16.7 20.7 6.3 56.3 32.4 53.9 6.0 7.726
Retail trade 86 840................................... 32.0 61.8 6.2 10.9 19.6 7.7 61.8 21.2 58.1 7.6 13.027Finance, insurance, and real estate 40 924.............. 39.3 54.7 5.9 12.0 24.2 9.0 54.7 26.8 57.6 7.1 8.528Services 332 981...................................... 30.5 61.5 8.1 9.9 18.9 9.8 61.5 38.7 42.9 9.6 8.829Industries not classified 39 363......................... 28.7 59.2 12.1 8.9 18.0 13.9 59.2 33.2 40.8 14.9 11.130
Other minority ~owned businesses 606 426....... 43.3 52.5 4.2 17.7 23.1 6.7 52.5 40.7 39.6 6.0 13.731
Agricultural services, forestry, fishing, and mining 15 218.. 48.1 43.8 8.1 25.3 20.5 10.4 43.8 28.9 45.7 10.1 15.432Construction 28 295.................................. 37.8 58.9 3.3 17.9 17.5 5.7 58.9 48.6 37.8 4.5 9.133Manufacturing 18 976................................. 40.2 57.4 2.3 18.5 19.1 4.9 57.4 35.6 43.0 5.0 16.434Transportation, communications, and utilities 24 362...... 34.1 61.7 4.1 14.2 19.6 4.5 61.7 28.7 38.0 6.5 26.935Wholesale trade 20 043............................... 49.0 47.5 3.5 21.8 23.6 7.0 47.5 38.8 44.9 4.6 11.736
Retail trade 132 483................................... 47.4 49.6 3.0 22.6 22.9 4.8 49.6 44.9 36.8 4.9 13.537Finance, insurance, and real estate 64 762.............. 53.4 40.3 6.2 20.1 29.0 10.6 40.3 23.5 54.2 7.2 15.138Services 273 774...................................... 38.1 57.6 4.3 13.4 22.5 6.6 57.6 47.1 34.2 6.3 12.539Industries not classified 28 512......................... 41.0 56.3 2.7 18.1 21.6 4.0 56.3 37.2 42.7 7.0 13.140
Women ~owned businesses 5 888 883.............. 49.1 45.2 5.6 18.1 28.8 7.8 45.2 36.2 48.2 6.6 9.041
Agricultural services, forestry, fishing, and mining 119 731.. 57.1 36.4 6.6 19.3 33.9 10.4 36.4 31.7 46.7 7.1 14.642Construction 183 695.................................. 48.7 45.9 5.3 26.8 21.0 6.2 45.9 49.6 36.2 6.6 7.643Manufacturing 152 346................................. 56.2 39.7 4.1 22.8 30.5 7.0 39.7 29.9 54.0 4.1 12.044Transportation, communications, and utilities 141 623...... 48.6 46.5 4.9 22.9 23.3 7.3 46.5 36.1 51.4 5.6 7.045Wholesale trade 154 542............................... 54.6 41.1 4.2 25.2 26.5 7.1 41.1 38.1 48.0 4.8 9.146
Retail trade 1 093 342................................... 49.5 45.5 5.0 19.7 27.8 7.0 45.5 25.0 59.2 5.5 10.347Finance, insurance, and real estate 602 802.............. 59.4 34.4 6.2 24.5 31.9 9.2 34.4 22.1 61.1 6.7 10.148Services 3 158 444...................................... 45.4 49.1 5.5 14.4 28.9 7.6 49.1 43.9 41.3 6.8 8.049Industries not classified 282 358......................... 47.0 42.6 10.4 15.5 30.5 11.4 42.6 34.1 44.7 12.5 8.650
Nonminority male ~owned businesses 10 114 456.... 51.8 43.8 4.5 23.7 25.8 6.7 43.8 45.1 43.1 5.5 6.351
Agricultural services, forestry, fishing, and mining 412 917.. 53.2 39.8 7.0 24.8 25.1 10.3 39.8 33.6 51.2 8.1 7.252Construction 1 496 056.................................. 56.4 42.5 1.2 31.7 23.4 2.4 42.5 59.1 34.3 2.9 3.753Manufacturing 333 485................................. 54.7 41.0 4.2 27.8 23.0 8.1 41.0 45.6 46.9 4.4 3.154Transportation, communications, and utilities 458 400...... 50.5 41.9 7.7 24.8 24.0 9.3 41.9 44.8 40.9 8.2 6.155Wholesale trade 352 721............................... 56.5 39.1 4.5 27.1 27.0 6.9 39.1 50.5 39.7 5.1 4.856
Retail trade 1 197 943................................... 50.8 44.9 4.4 26.7 21.0 7.4 44.9 38.7 47.8 5.9 7.657Finance, insurance, and real estate 1 240 594.............. 57.1 39.0 3.9 26.2 28.0 6.9 39.0 31.5 54.5 5.3 8.758Services 4 102 294...................................... 47.9 47.7 4.4 18.6 27.6 6.1 47.7 49.6 39.0 5.3 6.259Industries not classified 520 046......................... 45.7 42.3 12.0 17.1 25.4 15.2 42.3 42.0 40.6 10.9 6.660
1Data represent percentage of owners reporting in the designated categories.2Includes owners who never had any close relatives who owned a business.3Includes owners who had no previous work experience prior to starting/acquiring their businesses.4For explanation of relative standard errors and standard errors, see Reliability of Estimates in the introductory text.5Relative standard errors are not applicable for lines 1 through 10 since these data are the result of censuses, not surveys.
86 CHARACTERISTICS OF BUSINESS OWNERS 1992 ECONOMIC CENSUS
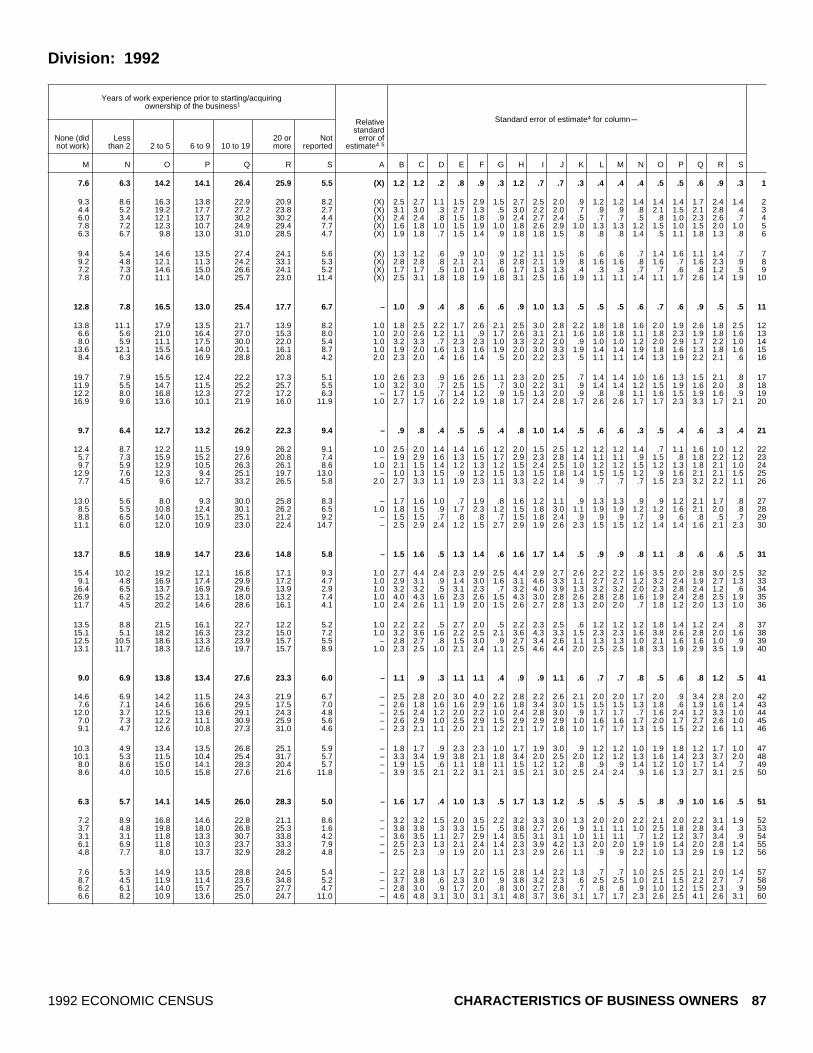
Division: 1992
Years of work experience prior to starting/acquiring ownership of the business1
Standard error of estimate4 for columnm
None (didnot work)
Lessthan 2 2 to 5 6 to 9 10 to 19
20 ormore
Notreported
Relativestandard
error ofestimate4 5
M N O P Q R S A B C D E F G H I J K L M N O P Q R S
7.6 6.3 14.2 14.1 26.4 25.9 5.5 (X) 1.2 1.2 .2 .8 .9 .3 1.2 .7 .7 .3 .4 .4 .4 .5 .5 .6 .9 .3 1
9.3 8.6 16.3 13.8 22.9 20.9 8.2 (X) 2.5 2.7 1.1 1.5 2.9 1.5 2.7 2.5 2.0 .9 1.2 1.2 1.4 1.4 1.4 1.7 2.4 1.4 24.4 5.2 19.2 17.7 27.2 23.8 2.7 (X) 3.1 3.0 .3 2.7 1.3 .5 3.0 2.2 2.0 .7 .9 .9 .8 2.1 1.5 2.1 2.8 .4 36.0 3.4 12.1 13.7 30.2 30.2 4.4 (X) 2.4 2.4 .8 1.5 1.8 .9 2.4 2.7 2.4 .5 .7 .7 .5 .8 1.0 2.3 2.6 .7 47.8 7.2 12.3 10.7 24.9 29.4 7.7 (X) 1.6 1.8 1.0 1.5 1.9 1.0 1.8 2.6 2.9 1.0 1.3 1.3 1.2 1.5 1.0 1.5 2.0 1.0 56.3 6.7 9.8 13.0 31.0 28.5 4.7 (X) 1.9 1.8 .7 1.5 1.4 .9 1.8 1.8 1.5 .8 .8 .8 1.4 .5 1.1 1.8 1.3 .8 6
9.4 5.4 14.6 13.5 27.4 24.1 5.6 (X) 1.3 1.2 .6 .9 1.0 .9 1.2 1.1 1.5 .6 .6 .6 .7 1.4 1.6 1.1 1.4 .7 79.2 4.8 12.1 11.3 24.2 33.1 5.3 (X) 2.8 2.8 .8 2.1 2.1 .8 2.8 2.1 1.9 .8 1.6 1.6 .8 1.6 .7 1.6 2.3 .9 87.2 7.3 14.6 15.0 26.6 24.1 5.2 (X) 1.7 1.7 .5 1.0 1.4 .6 1.7 1.3 1.3 .4 .3 .3 .7 .7 .6 .8 1.2 .5 97.8 7.0 11.1 14.0 25.7 23.0 11.4 (X) 2.5 3.1 1.8 1.8 1.9 1.8 3.1 2.5 1.6 1.9 1.1 1.1 1.4 1.1 1.7 2.6 1.4 1.9 10
12.8 7.8 16.5 13.0 25.4 17.7 6.7 – 1.0 .9 .4 .8 .6 .6 .9 1.0 1.3 .5 .5 .5 .6 .7 .6 .9 .5 .5 11
13.8 11.1 17.9 13.5 21.7 13.9 8.2 1.0 1.8 2.5 2.2 1.7 2.6 2.1 2.5 3.0 2.8 2.2 1.8 1.8 1.6 2.0 1.9 2.6 1.8 2.5 126.6 5.6 21.0 16.4 27.0 15.3 8.0 1.0 2.0 2.6 1.2 1.1 .9 1.7 2.6 3.1 2.1 1.6 1.8 1.8 1.1 1.8 2.3 1.9 1.8 1.6 138.0 5.9 11.1 17.5 30.0 22.0 5.4 1.0 3.2 3.3 .7 2.3 2.3 1.0 3.3 2.2 2.0 .9 1.0 1.0 1.2 2.0 2.9 1.7 2.2 1.0 14
13.6 12.1 15.5 14.0 20.1 16.1 8.7 1.0 1.9 2.0 1.6 1.3 1.6 1.9 2.0 3.0 3.3 1.9 1.4 1.4 1.9 1.8 1.6 1.3 1.8 1.6 158.4 6.3 14.6 16.9 28.8 20.8 4.2 2.0 2.3 2.0 .4 1.6 1.4 .5 2.0 2.2 2.3 .5 1.1 1.1 1.4 1.3 1.9 2.2 2.1 .6 16
19.7 7.9 15.5 12.4 22.2 17.3 5.1 1.0 2.6 2.3 .9 1.6 2.6 1.1 2.3 2.0 2.5 .7 1.4 1.4 1.0 1.6 1.3 1.5 2.1 .8 1711.9 5.5 14.7 11.5 25.2 25.7 5.5 1.0 3.2 3.0 .7 2.5 1.5 .7 3.0 2.2 3.1 .9 1.4 1.4 1.2 1.5 1.9 1.6 2.0 .8 1812.2 8.0 16.8 12.3 27.2 17.2 6.3 – 1.7 1.5 .7 1.4 1.2 .9 1.5 1.3 2.0 .9 .8 .8 1.1 1.6 1.5 1.9 1.6 .9 1916.9 9.6 13.6 10.1 21.9 16.0 11.9 1.0 2.7 1.7 1.6 2.2 1.9 1.8 1.7 2.4 2.8 1.7 2.6 2.6 1.7 1.7 2.3 3.3 1.7 2.1 20
9.7 6.4 12.7 13.2 26.2 22.3 9.4 – .9 .8 .4 .5 .5 .4 .8 1.0 1.4 .5 .6 .6 .3 .5 .4 .6 .3 .4 21
12.4 8.7 12.2 11.5 19.9 26.2 9.1 1.0 2.5 2.0 1.4 1.4 1.6 1.2 2.0 1.5 2.5 1.2 1.2 1.2 1.4 .7 1.1 1.6 1.0 1.2 225.7 7.3 15.9 15.2 27.6 20.8 7.4 – 1.9 2.9 1.6 1.3 1.5 1.7 2.9 2.3 2.8 1.4 1.1 1.1 .9 1.5 .8 1.8 2.2 1.2 239.7 5.9 12.9 10.5 26.3 26.1 8.6 1.0 2.1 1.5 1.4 1.2 1.3 1.2 1.5 2.4 2.5 1.0 1.2 1.2 1.5 1.2 1.3 1.8 2.1 1.0 24
12.9 7.6 12.3 9.4 25.1 19.7 13.0 – 1.0 1.3 1.5 .9 1.2 1.5 1.3 1.5 1.8 1.4 1.5 1.5 1.2 .9 1.6 2.1 2.1 1.5 257.7 4.5 9.6 12.7 33.2 26.5 5.8 2.0 2.7 3.3 1.1 1.9 2.3 1.1 3.3 2.2 1.4 .9 .7 .7 .7 1.5 2.3 3.2 2.2 1.1 26
13.0 5.6 8.0 9.3 30.0 25.8 8.3 – 1.7 1.6 1.0 .7 1.9 .8 1.6 1.2 1.1 .9 1.3 1.3 .9 .9 1.2 2.1 1.7 .8 278.5 5.5 10.8 12.4 30.1 26.2 6.5 1.0 1.8 1.5 .9 1.7 2.3 1.2 1.5 1.8 3.0 1.1 1.9 1.9 1.2 1.2 1.6 2.1 2.0 .8 288.8 6.5 14.0 15.1 25.1 21.2 9.2 – 1.5 1.5 .7 .8 .8 .7 1.5 1.8 2.4 .9 .9 .9 .7 .9 .6 .8 .5 .7 29
11.1 6.0 12.0 10.9 23.0 22.4 14.7 – 2.5 2.9 2.4 1.2 1.5 2.7 2.9 1.9 2.6 2.3 1.5 1.5 1.2 1.4 1.4 1.6 2.1 2.3 30
13.7 8.5 18.9 14.7 23.6 14.8 5.8 – 1.5 1.6 .5 1.3 1.4 .6 1.6 1.7 1.4 .5 .9 .9 .8 1.1 .8 .6 .6 .5 31
15.4 10.2 19.2 12.1 16.8 17.1 9.3 1.0 2.7 4.4 2.4 2.3 2.9 2.5 4.4 2.9 2.7 2.6 2.2 2.2 1.6 3.5 2.0 2.8 3.0 2.5 329.1 4.8 16.9 17.4 29.9 17.2 4.7 1.0 2.9 3.1 .9 1.4 3.0 1.6 3.1 4.6 3.3 1.1 2.7 2.7 1.2 3.2 2.4 1.9 2.7 1.3 33
16.4 6.5 13.7 16.9 29.6 13.9 2.9 1.0 3.2 3.2 .5 3.1 2.3 .7 3.2 4.0 3.9 1.3 3.2 3.2 2.0 2.3 2.8 2.4 1.2 .6 3426.9 6.2 15.2 13.1 18.0 13.2 7.4 1.0 4.0 4.3 1.6 2.3 2.6 1.5 4.3 3.0 2.8 2.6 2.8 2.8 1.6 1.9 2.4 2.8 2.5 1.9 3511.7 4.5 20.2 14.6 28.6 16.1 4.1 1.0 2.4 2.6 1.1 1.9 2.0 1.5 2.6 2.7 2.8 1.3 2.0 2.0 .7 1.8 1.2 2.0 1.3 1.0 36
13.5 8.8 21.5 16.1 22.7 12.2 5.2 1.0 2.2 2.2 .5 2.7 2.0 .5 2.2 2.3 2.5 .6 1.2 1.2 1.2 1.8 1.4 1.2 2.4 .8 3715.1 5.1 18.2 16.3 23.2 15.0 7.2 1.0 3.2 3.6 1.6 2.2 2.5 2.1 3.6 4.3 3.3 1.5 2.3 2.3 1.6 3.8 2.6 2.8 2.0 1.6 3812.5 10.5 18.6 13.3 23.9 15.7 5.5 – 2.8 2.7 .8 1.5 3.0 .9 2.7 3.4 2.6 1.1 1.3 1.3 1.0 2.1 1.6 1.6 1.0 .9 3913.1 11.7 18.3 12.6 19.7 15.7 8.9 1.0 2.3 2.5 1.0 2.1 2.4 1.1 2.5 4.6 4.4 2.0 2.5 2.5 1.8 3.3 1.9 2.9 3.5 1.9 40
9.0 6.9 13.8 13.4 27.6 23.3 6.0 – 1.1 .9 .3 1.1 1.1 .4 .9 .9 1.1 .6 .7 .7 .8 .5 .6 .8 1.2 .5 41
14.6 6.9 14.2 11.5 24.3 21.9 6.7 – 2.5 2.8 2.0 3.0 4.0 2.2 2.8 2.2 2.6 2.1 2.0 2.0 1.7 2.0 .9 3.4 2.8 2.0 427.6 7.1 14.6 16.6 29.5 17.5 7.0 – 2.6 1.8 1.6 1.6 2.9 1.6 1.8 3.4 3.0 1.5 1.5 1.5 1.3 1.8 .6 1.9 1.6 1.4 43
12.0 3.7 12.5 13.6 29.1 24.3 4.8 – 2.5 2.4 1.2 2.0 2.2 1.0 2.4 2.8 3.0 .9 1.7 1.7 .7 1.6 2.4 1.2 3.3 1.0 447.0 7.3 12.2 11.1 30.9 25.9 5.6 – 2.6 2.9 1.0 2.5 2.9 1.5 2.9 2.9 2.9 1.0 1.6 1.6 1.7 2.0 1.7 2.7 2.6 1.0 459.1 4.7 12.6 10.8 27.3 31.0 4.6 – 2.3 2.1 1.1 2.0 2.1 1.2 2.1 1.7 1.8 1.0 1.7 1.7 1.3 1.5 1.5 2.2 1.6 1.1 46
10.3 4.9 13.4 13.5 26.8 25.1 5.9 – 1.8 1.7 .9 2.3 2.3 1.0 1.7 1.9 3.0 .9 1.2 1.2 1.0 1.9 1.8 1.2 1.7 1.0 4710.1 5.3 11.5 10.4 25.4 31.7 5.7 – 3.3 3.4 1.9 3.8 2.1 1.8 3.4 2.0 2.5 2.0 1.2 1.2 1.3 1.6 1.4 2.3 3.7 2.0 48
8.0 8.6 15.0 14.1 28.3 20.4 5.7 – 1.9 1.5 .6 1.1 1.8 1.1 1.5 1.2 1.2 .8 .9 .9 1.4 1.2 1.0 1.7 1.4 .7 498.6 4.0 10.5 15.8 27.6 21.6 11.8 – 3.9 3.5 2.1 2.2 3.1 2.1 3.5 2.1 3.0 2.5 2.4 2.4 .9 1.6 1.3 2.7 3.1 2.5 50
6.3 5.7 14.1 14.5 26.0 28.3 5.0 – 1.6 1.7 .4 1.0 1.3 .5 1.7 1.3 1.2 .5 .5 .5 .5 .8 .9 1.0 1.6 .5 51
7.2 8.9 16.8 14.6 22.8 21.1 8.6 – 3.2 3.2 1.5 2.0 3.5 2.2 3.2 3.3 3.0 1.3 2.0 2.0 2.2 2.1 2.0 2.2 3.1 1.9 523.7 4.8 19.8 18.0 26.8 25.3 1.6 – 3.8 3.8 .3 3.3 1.5 .5 3.8 2.7 2.6 .9 1.1 1.1 1.0 2.5 1.8 2.8 3.4 .3 533.1 3.1 11.8 13.3 30.7 33.8 4.2 – 3.6 3.5 1.1 2.7 2.9 1.4 3.5 3.1 3.1 1.0 1.1 1.1 .7 1.2 1.2 3.7 3.4 .9 546.1 6.9 11.8 10.3 23.7 33.3 7.9 – 2.5 2.3 1.3 2.1 2.4 1.4 2.3 3.9 4.2 1.3 2.0 2.0 1.9 1.9 1.4 2.0 2.8 1.4 554.8 7.7 8.0 13.7 32.9 28.2 4.8 – 2.5 2.3 .9 1.9 2.0 1.1 2.3 2.9 2.6 1.1 .9 .9 2.2 1.0 1.3 2.9 1.9 1.2 56
7.6 5.3 14.9 13.5 28.8 24.5 5.4 – 2.2 2.8 1.3 1.7 2.2 1.5 2.8 1.4 2.2 1.3 .7 .7 1.0 2.5 2.5 2.1 2.0 1.4 578.7 4.5 11.9 11.4 23.6 34.8 5.2 – 3.7 3.8 .6 2.3 3.0 .9 3.8 3.2 2.3 .6 2.5 2.5 1.0 2.1 1.5 2.2 2.7 .7 586.2 6.1 14.0 15.7 25.7 27.7 4.7 – 2.8 3.0 .9 1.7 2.0 .8 3.0 2.7 2.8 .7 .8 .8 .9 1.0 1.2 1.5 2.3 .9 596.6 8.2 10.9 13.6 25.0 24.7 11.0 – 4.6 4.8 3.1 3.0 3.1 3.1 4.8 3.7 3.6 3.1 1.7 1.7 2.3 2.6 2.5 4.1 2.6 3.1 60
1992 ECONOMIC CENSUS CHARACTERISTICS OF BUSINESS OWNERS 87

Table 10b. Owner’s Work Experience Prior to Beginning/Acquiring the Business by Receipts[All data are shown as percents, except firms. For meaning of abbreviations and symbols, see introductory text. For explanation of terms, see appendix A]
Type of firm and receipts size
Had a close relative who owneda business or was self~
employed1
Worked for a close relative who owned a business or was self~employed1
Previously worked for a businesswhose goods/services were similar to
those provided by the business1
Firms(number) Yes No
Notreported Yes No
Notreported
Notappli~
cable2 Yes NoNot
reported
Notappli~
cable3
A B C D E F G H I J K L
All businesses 17 253 143.......................... 49.9 45.2 4.9 21.3 26.4 7.1 45.2 42.0 44.4 6.0 7.61
Less than $5,000 5 226 553.............................. 47.5 45.5 7.0 15.8 30.4 8.4 45.5 30.0 51.7 8.4 9.92$5,000 to $9,999 2 443 946.............................. 43.5 50.2 6.3 18.1 23.2 8.4 50.2 39.5 46.2 5.9 8.53$10,000 to $24,999 3 076 410............................ 47.1 49.3 3.6 19.8 25.3 5.7 49.3 42.6 45.1 5.6 6.84$25,000 to $49,999 1 945 806............................ 51.6 44.2 4.3 23.3 26.1 6.4 44.2 50.3 39.1 4.6 5.95$50,000 to $99,999 1 615 940............................ 51.8 45.2 3.1 22.2 27.6 5.0 45.2 49.9 40.4 4.2 5.46
$100,000 to $199,999 1 197 996.......................... 53.8 43.2 3.0 25.5 25.4 5.9 43.2 50.0 39.8 4.5 5.77$200,000 to $249,999 301 794.......................... 44.8 53.7 1.5 22.2 20.1 3.9 53.7 42.4 42.7 2.1 12.88$250,000 to $499,999 682 583.......................... 58.4 37.0 4.7 29.6 25.7 7.7 37.0 49.7 38.0 5.7 6.59$500,000 to $999,999 372 078.......................... 57.7 37.5 4.7 30.3 23.5 8.7 37.5 47.6 40.0 6.2 6.110$1,000,000 or more 390 037............................ 60.7 34.3 5.1 34.9 21.1 9.7 34.3 48.3 38.7 6.1 6.911
Hispanic ~owned businesses 771 708............. 37.6 57.2 5.2 15.1 20.4 7.3 57.2 43.2 36.9 7.1 12.812
Less than $5,000 219 226.............................. 32.3 60.3 7.4 11.1 19.2 9.4 60.3 30.7 41.6 9.9 17.713$5,000 to $9,999 140 362.............................. 32.4 60.4 7.2 12.4 17.9 9.3 60.4 35.4 39.1 10.5 15.014$10,000 to $24,999 165 667............................ 30.9 63.5 5.7 12.0 18.4 6.1 63.5 44.9 35.2 6.3 13.715$25,000 to $49,999 87 288............................ 38.2 58.8 3.0 12.6 22.8 5.9 58.8 45.9 37.1 5.2 11.816$50,000 to $99,999 64 742............................ 43.6 52.9 3.6 19.4 22.1 5.7 52.9 52.0 34.8 4.4 8.717
$100,000 to $199,999 41 578.......................... 45.7 51.5 2.8 21.1 22.0 5.4 51.5 55.4 32.0 4.7 7.918$200,000 to $249,999 10 030.......................... 46.8 49.9 3.3 22.2 22.4 5.5 49.9 49.8 34.0 5.4 10.819$250,000 to $499,999 22 301.......................... 51.0 45.6 3.5 22.3 24.9 7.3 45.6 51.9 34.6 5.0 8.620$500,000 to $999,999 11 319.......................... 51.9 43.2 4.9 24.4 24.2 8.2 43.2 54.1 32.3 6.0 7.621$1,000,000 or more 9 194............................ 54.3 41.5 4.2 29.7 20.6 8.2 41.5 55.1 32.9 5.2 6.822
Black ~owned businesses 620 912................ 30.9 61.1 7.9 10.7 18.5 9.6 61.1 35.3 45.4 9.6 9.723
Less than $5,000 236 722.............................. 28.3 60.4 11.3 7.9 18.9 12.7 60.4 27.9 49.9 11.6 10.724$5,000 to $9,999 111 512.............................. 28.2 63.3 8.5 8.0 18.9 9.7 63.3 32.2 45.2 10.9 11.825$10,000 to $24,999 129 901............................ 31.1 62.1 6.8 12.6 17.3 8.1 62.1 38.2 42.4 10.4 9.026$25,000 to $49,999 62 209............................ 30.9 65.3 3.8 11.6 16.8 6.4 65.3 45.6 40.5 5.4 8.527$50,000 to $99,999 39 218............................ 37.8 58.1 4.1 16.3 19.9 5.7 58.1 45.2 42.9 5.4 6.528
$100,000 to $199,999 20 936.......................... 40.7 56.6 2.7 17.7 18.0 7.7 56.6 46.9 41.7 4.1 7.429$200,000 to $249,999 4 533.......................... 41.4 53.5 5.1 14.5 24.1 7.9 53.5 49.8 42.0 3.3 4.930$250,000 to $499,999 9 029.......................... 42.3 54.6 3.1 19.7 20.3 5.5 54.6 45.1 44.8 3.8 6.231$500,000 to $999,999 3 823.......................... 50.9 44.9 4.2 23.3 23.5 8.3 44.9 46.7 42.9 5.1 5.232$1,000,000 or more 3 028............................ 43.9 50.8 5.3 21.0 19.7 8.5 50.8 44.2 37.7 7.7 10.433
Other minority ~owned businesses 606 426....... 43.3 52.5 4.2 17.7 23.1 6.7 52.5 40.7 39.6 6.0 13.734
Less than $5,000 132 493.............................. 40.5 54.2 5.2 14.2 24.4 7.2 54.2 39.8 40.6 5.5 14.035$5,000 to $9,999 80 435.............................. 37.1 58.6 4.3 14.1 21.1 6.2 58.6 32.2 43.9 5.9 18.036$10,000 to $24,999 108 195............................ 39.5 55.5 5.0 14.4 22.1 8.1 55.5 36.6 43.1 8.7 11.537$25,000 to $49,999 77 345............................ 43.8 53.3 2.8 19.6 22.6 4.5 53.3 35.8 44.3 3.6 16.338$50,000 to $99,999 70 360............................ 44.3 53.1 2.6 15.6 26.1 5.1 53.1 42.9 36.0 5.3 15.839
$100,000 to $199,999 58 620.......................... 42.9 52.6 4.5 18.2 22.7 6.4 52.6 44.8 35.7 6.2 13.340$200,000 to $249,999 15 740.......................... 54.3 42.9 2.8 28.0 23.8 5.4 42.9 43.9 40.6 6.2 9.341$250,000 to $499,999 34 266.......................... 47.6 49.8 2.6 19.8 24.4 6.0 49.8 49.8 34.0 4.7 11.542$500,000 to $999,999 16 467.......................... 48.4 45.7 5.9 26.0 18.9 9.5 45.7 45.3 36.4 8.2 10.043$1,000,000 or more 12 505............................ 50.4 41.4 8.2 24.1 22.1 12.4 41.4 45.1 36.8 9.8 8.444
Women ~owned businesses 5 888 883.............. 49.1 45.2 5.6 18.1 28.8 7.8 45.2 36.2 48.2 6.6 9.045
Less than $5,000 2 310 303.............................. 45.3 47.1 7.5 13.2 31.0 8.7 47.1 32.6 49.1 8.5 9.746$5,000 to $9,999 967 380.............................. 47.2 46.8 5.9 16.6 27.8 8.8 46.8 34.1 49.1 5.4 11.447$10,000 to $24,999 1 051 358............................ 46.4 48.8 4.7 15.0 29.7 6.5 48.8 33.2 51.8 7.5 7.548$25,000 to $49,999 538 885............................ 52.3 42.7 5.1 22.3 26.6 8.5 42.7 39.8 46.4 4.7 9.049$50,000 to $99,999 381 517............................ 51.0 44.3 4.7 21.7 26.9 7.0 44.3 43.8 42.9 6.4 6.950
$100,000 to $199,999 267 089.......................... 58.0 39.4 2.5 25.2 30.3 5.1 39.4 45.0 45.7 2.9 6.451$200,000 to $249,999 66 464.......................... 59.6 37.3 3.1 31.4 24.0 7.3 37.3 35.3 54.1 3.9 6.752$250,000 to $499,999 146 313.......................... 58.9 38.0 3.1 28.8 26.8 6.3 38.0 43.0 44.2 4.4 8.453$500,000 to $999,999 80 539.......................... 55.4 40.7 3.9 28.4 23.4 7.4 40.7 42.7 43.8 5.6 8.054$1,000,000 or more 79 037............................ 61.6 32.8 5.6 33.3 23.5 10.4 32.8 39.8 42.5 6.0 11.755
Nonminority male ~owned businesses 10 114 456.... 51.8 43.8 4.5 23.7 25.8 6.7 43.8 45.1 43.1 5.5 6.356
Less than $5,000 2 608 047.............................. 50.8 42.7 6.5 18.2 31.1 8.0 42.7 27.4 54.7 8.1 9.857$5,000 to $9,999 1 285 456.............................. 42.3 51.4 6.4 20.1 20.5 8.1 51.4 43.8 44.7 5.7 5.758$10,000 to $24,999 1 763 830............................ 50.1 47.6 2.4 24.1 23.4 4.8 47.6 49.1 41.5 3.7 5.859$25,000 to $49,999 1 248 482............................ 52.9 43.0 4.1 24.8 26.5 5.8 43.0 56.0 35.8 4.5 3.660$50,000 to $99,999 1 108 065............................ 53.3 44.2 2.5 22.9 28.6 4.3 44.2 52.4 40.0 3.4 4.261
$100,000 to $199,999 840 723.......................... 53.6 43.2 3.2 26.4 24.1 6.3 43.2 51.9 38.2 5.1 4.862$200,000 to $249,999 212 693.......................... 38.1 61.2 .7 18.4 18.0 2.4 61.2 44.3 38.9 .9 15.863$250,000 to $499,999 488 462.......................... 59.6 34.9 5.5 31.1 25.5 8.4 34.9 51.8 36.4 6.3 5.564$500,000 to $999,999 266 408.......................... 59.4 35.8 4.8 31.5 23.8 9.0 35.8 49.1 39.6 6.2 5.265$1,000,000 or more 292 290............................ 61.2 34.0 4.8 35.9 20.6 9.5 34.0 50.2 38.1 6.0 5.766
1Data represent percentage of owners reporting in the designated categories.2Includes owners who never had any close relatives who owned a business.3Includes owners who had no previous work experience prior to starting/acquiring their businesses.4For explanation of relative standard errors and standard errors, see Reliability of Estimates in the introductory text.5Relative standard errors are not applicable for lines 1 through 11 since these data are the result of censuses, not surveys.
88 CHARACTERISTICS OF BUSINESS OWNERS 1992 ECONOMIC CENSUS

Size of Firm: 1992
Years of work experience prior to starting/acquiring ownership of the business1
Standard error of estimate4 for columnm
None (didnot work)
Lessthan 2 2 to 5 6 to 9 10 to 19
20 ormore
Notreported
Relativestandard
error ofestimate4 5
M N O P Q R S A B C D E F G H I J K L M N O P Q R S
7.6 6.3 14.2 14.1 26.4 25.9 5.5 (X) 1.2 1.2 .2 .8 .9 .3 1.2 .7 .7 .3 .4 .4 .4 .5 .5 .6 .9 .3 1
9.9 7.1 12.2 10.7 23.9 28.3 7.9 (X) 2.2 2.0 .6 1.5 1.9 .8 2.0 1.5 2.0 .7 .8 .8 .7 .8 1.2 .8 1.5 .7 28.5 8.2 12.9 14.9 24.3 25.1 6.2 (X) 1.6 2.3 1.0 2.4 2.5 1.5 2.3 2.1 2.2 1.1 1.5 1.5 1.3 1.8 2.0 2.6 2.2 1.2 36.8 5.6 14.9 13.5 29.2 26.0 4.0 (X) 2.4 2.4 .5 2.3 1.5 .9 2.4 2.6 2.1 .9 .8 .8 .9 1.3 1.5 1.9 1.8 .7 45.9 7.7 15.1 17.2 25.1 24.4 4.6 (X) 3.4 2.8 .9 2.0 2.5 1.2 2.8 2.4 1.9 .8 1.2 1.2 .6 1.4 2.6 2.3 2.8 1.1 55.4 4.8 14.8 16.3 27.6 27.2 3.9 (X) 1.5 2.0 .7 .9 1.3 .8 2.0 1.5 1.4 .5 .9 .9 .7 1.6 1.4 1.1 2.2 .6 6
5.7 4.8 17.2 15.7 27.6 25.5 3.6 (X) 1.6 1.9 .7 1.7 1.5 .8 1.9 1.6 1.3 .7 .4 .4 .6 1.1 .9 1.6 1.5 .6 712.8 3.4 18.4 10.8 26.6 26.2 1.8 (X) 3.3 3.2 .4 1.6 2.9 .8 3.2 3.3 3.4 .4 4.6 4.6 .7 2.4 1.2 2.6 3.4 .4 8
6.5 5.3 15.9 16.0 28.8 21.8 5.6 (X) 1.5 1.0 1.0 1.6 1.4 .9 1.0 1.1 1.0 1.0 .8 .8 .5 .5 1.0 .7 1.0 1.0 96.1 4.9 14.4 16.0 29.7 23.4 5.4 (X) .8 .8 .5 .8 .6 .5 .8 1.8 1.9 .5 .5 .5 .4 .9 .7 1.0 .9 .4 106.9 4.4 14.6 15.3 31.1 22.0 5.7 (X) .7 .6 .3 .4 .7 .4 .6 .9 .9 .4 .4 .4 .3 .7 .6 .7 .7 .3 11
12.8 7.8 16.5 13.0 25.4 17.7 6.7 – 1.0 .9 .4 .8 .6 .6 .9 1.0 1.3 .5 .5 .5 .6 .7 .6 .9 .5 .5 12
17.7 9.0 15.9 8.2 22.5 17.5 9.2 1.0 1.9 1.8 1.3 1.5 1.5 1.4 1.8 1.4 2.6 1.4 1.5 1.5 2.0 1.4 .9 1.6 1.7 1.2 1315.0 6.5 17.3 12.8 23.5 14.4 10.4 1.0 3.1 3.1 1.2 2.0 1.8 1.4 3.1 3.1 3.4 2.0 1.9 1.9 1.2 2.1 2.0 2.8 2.8 1.5 1413.7 8.7 17.4 13.1 20.3 20.6 6.3 1.0 2.3 2.3 1.0 1.7 1.4 1.0 2.3 2.0 1.4 1.0 1.0 1.0 1.3 1.3 1.4 2.2 1.9 1.0 1511.8 8.5 15.9 13.3 29.2 15.9 5.4 1.0 3.3 2.9 1.1 2.2 2.5 2.1 2.9 3.9 2.7 1.3 1.6 1.6 1.8 2.9 2.1 2.8 2.2 1.3 16
8.7 6.5 15.3 17.3 30.3 17.3 4.5 1.0 4.1 3.5 1.1 2.4 2.5 1.5 3.5 2.9 2.1 1.1 1.4 1.4 1.2 2.3 1.8 2.3 1.7 1.2 17
7.9 7.6 17.3 15.5 31.4 16.9 3.4 1.0 2.6 2.3 .8 1.0 2.3 1.2 2.3 1.9 2.2 .8 1.1 1.1 .8 1.8 1.2 1.6 1.7 .8 1810.8 6.7 17.6 14.1 28.8 17.8 4.1 3.0 4.6 3.9 1.5 2.6 3.2 2.3 3.9 4.4 3.9 1.6 3.2 3.2 1.3 4.8 3.3 2.5 2.8 1.7 19
8.6 6.6 14.9 15.9 28.8 21.2 4.0 2.0 2.4 2.3 .6 1.7 1.5 1.1 2.3 1.9 1.5 .7 1.1 1.1 .9 1.4 1.6 1.1 2.3 .7 207.6 5.2 17.6 17.5 27.9 18.3 5.8 3.0 2.7 3.0 1.4 2.1 2.0 1.8 3.0 3.4 2.1 1.5 1.4 1.4 1.1 1.8 2.5 1.9 2.2 1.4 216.8 7.7 16.3 15.8 30.5 18.1 4.9 2.0 1.2 1.2 .7 1.6 1.0 .9 1.2 1.5 .8 .6 1.0 1.0 1.4 1.0 .9 1.0 1.0 .6 22
9.7 6.4 12.7 13.2 26.2 22.3 9.4 – .9 .8 .4 .5 .5 .4 .8 1.0 1.4 .5 .6 .6 .3 .5 .4 .6 .3 .4 23
10.7 7.4 12.4 11.2 23.9 22.0 12.4 – 1.4 1.5 .9 .8 .9 .9 1.5 1.6 1.7 1.1 .8 .8 .6 1.1 1.1 1.1 .9 1.1 2411.8 6.5 11.5 12.4 22.8 24.0 11.2 – .8 .7 .7 1.1 1.0 .6 .7 1.3 2.4 1.3 2.4 2.4 1.0 1.1 1.1 1.6 1.4 1.2 25
9.0 4.8 12.7 14.6 28.9 21.3 8.6 – 1.5 1.4 .8 1.0 1.2 1.1 1.4 2.7 2.8 .8 1.2 1.2 .7 .9 1.1 1.5 1.3 .9 268.5 7.1 14.0 16.4 27.9 21.3 4.9 – 2.3 2.3 1.1 1.2 2.0 1.5 2.3 2.0 2.6 1.7 1.3 1.3 1.5 1.9 1.9 2.2 1.2 1.5 276.5 6.9 14.0 14.2 29.6 24.5 4.3 1.0 2.8 3.2 .8 2.3 2.4 1.0 3.2 2.5 2.4 1.1 1.0 1.0 .9 1.4 1.9 1.9 1.6 .7 28
7.4 5.6 14.1 17.0 30.5 22.2 3.3 1.0 2.2 2.2 .8 2.0 2.0 1.7 2.2 2.7 2.4 .9 1.4 1.4 .4 .9 2.0 1.3 1.6 .8 294.9 6.7 17.2 19.9 31.0 16.8 3.4 3.0 4.2 3.8 1.9 4.1 4.6 2.2 3.8 5.5 5.7 1.1 1.2 1.2 2.2 3.4 3.5 6.6 3.0 1.2 306.2 6.0 16.8 15.4 29.3 22.3 4.0 3.0 2.6 2.5 .7 1.7 3.1 1.3 2.5 2.1 1.9 .9 .7 .7 .9 1.8 1.5 2.9 2.6 .9 315.2 4.0 12.1 12.7 34.3 27.5 4.2 4.0 2.3 2.7 2.3 2.5 3.4 2.6 2.7 3.7 4.1 2.7 2.4 2.4 .8 3.3 2.6 3.8 3.6 2.3 32
10.4 4.8 12.2 10.6 36.4 19.2 6.3 4.0 2.9 2.8 .9 2.3 2.9 1.1 2.8 2.6 2.2 1.4 3.3 3.3 1.2 2.0 1.3 2.1 1.6 .9 33
13.7 8.5 18.9 14.7 23.6 14.8 5.8 – 1.5 1.6 .5 1.3 1.4 .6 1.6 1.7 1.4 .5 .9 .9 .8 1.1 .8 .6 .6 .5 34
14.0 9.7 24.8 10.6 20.0 15.4 5.5 1.0 3.6 3.7 1.4 1.8 3.5 1.8 3.7 4.1 3.8 1.4 1.3 1.3 2.3 3.5 1.6 3.1 2.3 1.5 3518.0 10.6 13.2 9.2 26.0 13.9 8.9 1.0 3.0 4.2 1.7 3.3 2.9 1.7 4.2 3.8 4.6 2.0 3.8 3.8 2.4 3.2 1.6 3.6 1.7 2.6 3611.5 10.4 15.6 17.4 21.2 16.9 7.0 1.0 3.4 3.5 2.2 2.7 3.8 2.7 3.5 4.7 2.8 2.5 2.3 2.3 3.8 3.1 1.9 3.3 2.6 2.2 3716.3 6.6 19.5 15.3 26.6 12.0 3.8 1.0 4.2 4.9 1.3 3.9 2.7 2.2 4.9 2.9 4.0 1.3 3.8 3.8 1.8 3.0 2.6 3.6 2.7 2.0 3815.8 6.2 16.9 16.3 25.7 15.4 3.7 1.0 2.9 2.9 .9 2.1 3.0 1.4 2.9 3.6 2.1 .8 2.3 2.3 1.5 1.6 2.3 2.0 1.8 1.0 39
13.3 11.5 19.0 14.1 20.4 15.4 6.3 1.0 3.0 3.2 1.4 1.2 2.5 1.8 3.2 1.6 1.4 1.5 .8 .8 1.8 1.7 .9 1.3 2.2 2.0 409.3 5.4 21.2 19.7 27.2 13.1 4.1 2.0 4.3 3.9 .8 2.3 3.4 1.3 3.9 5.1 5.6 2.2 1.7 1.7 2.0 3.1 3.6 2.3 3.0 .8 41
11.5 7.5 20.8 18.6 23.3 13.5 4.7 1.0 1.7 1.5 .4 1.5 1.0 .7 1.5 2.3 1.8 .6 .8 .8 .9 1.8 1.3 1.3 .9 .7 4210.0 8.4 20.4 14.6 25.6 13.1 7.9 2.0 2.5 1.6 2.0 1.4 2.0 2.0 1.6 2.3 2.1 1.9 .7 .7 .7 1.6 1.4 1.7 .6 1.8 43
8.4 4.3 15.3 17.5 26.7 18.9 9.0 2.0 1.9 2.0 .7 1.5 1.3 1.0 2.0 1.4 1.6 .8 .8 .8 .4 1.2 .9 1.6 1.6 .8 44
9.0 6.9 13.8 13.4 27.6 23.3 6.0 – 1.1 .9 .3 1.1 1.1 .4 .9 .9 1.1 .6 .7 .7 .8 .5 .6 .8 1.2 .5 45
9.7 7.1 13.4 11.3 26.5 23.6 8.4 – 1.8 1.1 1.1 1.3 1.6 1.2 1.1 1.4 1.9 1.1 1.1 1.1 1.1 1.2 1.2 1.8 2.3 1.2 4611.4 9.2 10.9 15.8 25.3 21.9 5.7 – 1.9 2.5 1.3 2.6 2.6 2.2 2.5 2.3 2.5 1.4 2.5 2.5 2.1 1.9 2.4 3.1 2.2 1.3 47
7.5 5.8 14.9 14.2 29.5 23.2 4.9 – 3.3 3.4 .7 2.8 3.5 .8 3.4 2.8 3.0 1.5 .9 .9 1.5 1.9 2.7 2.3 2.7 .9 489.0 8.4 15.8 15.7 26.4 20.4 4.4 – 3.8 3.5 1.6 3.4 4.3 2.5 3.5 6.2 5.1 1.2 2.8 2.8 2.7 2.0 2.9 4.1 2.9 1.3 496.9 6.4 11.2 12.4 31.3 26.0 5.9 – 2.9 3.3 1.5 2.9 2.1 1.2 3.3 3.9 2.9 2.1 1.5 1.5 1.2 1.8 1.6 2.2 1.6 1.9 50
6.4 4.2 16.4 12.4 30.0 27.8 2.6 – 1.8 1.5 .6 3.1 2.5 .7 1.5 3.3 3.3 .7 .6 .6 .7 1.2 1.4 1.6 2.4 .6 516.7 2.6 16.6 15.0 25.6 30.0 3.6 1.0 5.6 5.4 1.5 4.8 2.4 2.8 5.4 5.0 5.5 1.5 2.1 2.1 1.1 3.0 3.3 5.0 3.8 1.4 528.4 5.1 15.9 14.2 29.1 23.3 4.0 1.0 2.1 2.1 .6 2.1 1.4 1.0 2.1 2.6 2.2 .7 1.3 1.3 .7 1.1 .9 1.1 1.5 .4 538.0 5.4 14.7 15.3 29.3 22.3 4.9 1.0 2.0 1.7 .7 1.6 1.5 1.0 1.7 2.3 2.7 .7 1.0 1.0 .9 .6 1.2 1.7 1.7 .6 54
11.7 5.8 15.6 14.8 27.9 18.5 5.7 1.0 .6 .8 .6 .9 .9 .9 .8 1.2 1.4 .5 .8 .8 .7 .8 .6 .9 .9 .5 55
6.3 5.7 14.1 14.5 26.0 28.3 5.0 – 1.6 1.7 .4 1.0 1.3 .5 1.7 1.3 1.2 .5 .5 .5 .5 .8 .9 1.0 1.6 .5 56
9.8 6.9 10.7 10.3 22.0 33.1 7.3 – 3.4 3.1 1.2 1.9 2.8 1.3 3.1 2.4 3.4 1.2 1.1 1.1 1.4 1.2 2.1 2.5 3.2 1.0 575.7 7.4 14.0 14.6 23.7 28.7 5.8 – 2.6 3.5 1.5 3.4 3.9 1.8 3.5 3.2 3.8 1.6 1.8 1.8 1.6 2.7 3.2 4.6 4.3 1.9 585.8 5.1 14.4 13.0 30.2 28.9 2.7 – 3.5 3.7 1.0 3.3 1.9 1.5 3.7 5.5 4.8 1.2 1.7 1.7 1.2 2.0 2.5 4.0 2.6 1.1 593.6 7.4 14.5 18.1 24.5 27.3 4.6 – 4.8 4.0 1.2 3.8 3.2 1.7 4.0 3.8 3.2 1.1 1.1 1.1 1.7 2.2 3.8 2.7 4.0 1.5 604.2 4.0 15.9 17.8 26.1 28.8 3.2 – 2.0 2.3 .6 1.6 1.7 .8 2.3 1.6 1.5 .4 1.0 1.0 1.0 2.5 2.1 2.0 2.9 .5 61
4.8 4.3 17.3 16.8 27.0 25.8 3.9 – 2.5 2.9 1.0 2.6 1.7 1.3 2.9 2.3 1.9 1.1 .6 .6 .9 1.7 1.2 2.2 1.9 1.0 6215.8 3.3 19.1 8.0 27.0 26.1 .7 – 4.9 4.9 .4 3.0 4.7 .7 4.9 4.9 4.0 .4 5.8 5.8 .8 3.5 1.8 3.8 4.7 .4 63
5.5 5.1 15.5 16.3 29.0 22.1 6.4 – 2.0 1.3 1.5 2.2 2.0 1.3 1.3 2.0 1.6 1.5 1.2 1.2 .8 .7 1.5 1.1 1.4 1.4 645.2 4.5 14.0 16.3 30.1 24.6 5.4 – 1.5 1.4 .6 1.3 1.1 .8 1.4 2.0 2.3 .6 .7 .7 .6 1.1 1.0 1.3 1.3 .6 655.7 3.9 14.3 15.4 32.1 23.1 5.5 – 1.0 .8 .4 .5 1.0 .5 .8 1.2 1.2 .5 .5 .5 .4 .9 1.0 .9 .8 .4 66
1992 ECONOMIC CENSUS CHARACTERISTICS OF BUSINESS OWNERS 89

Table 10c. Owner’s Work Experience Prior to Beginning/Acquiring the Business by[All data are shown as percents, except firms. For meaning of abbreviations and symbols, see introductory text. For explanation of terms, see appendix A]
Type of firm and employment size
Had a close relative who owneda business or was self~
employed1
Worked for a close relative who owned a business or was self~employed1
Previously worked for a businesswhose goods/services were similar to
those provided by the business1
Firms(number) Yes No
Notreported Yes No
Notreported
Notappli~
cable2 Yes NoNot
reported
Notappli~
cable3
A B C D E F G H I J K L
All businesses 17 253 143.......................... 49.9 45.2 4.9 21.3 26.4 7.1 45.2 42.0 44.4 6.0 7.61
With no paid employees 14 118 184........................ 48.4 46.3 5.3 19.4 27.0 7.2 46.3 39.4 46.2 6.4 8.12With paid employees 3 134 959........................... 54.8 41.4 3.8 27.5 24.3 6.8 41.4 50.5 38.7 4.8 6.03
No employees6 435 838.............................. 50.1 47.8 2.1 26.6 19.9 5.7 47.8 56.5 37.2 2.9 3.441 to 4 employees 1 716 076............................ 53.5 43.1 3.4 24.2 27.0 5.7 43.1 50.9 38.7 4.3 6.155 to 9 employees 503 808............................ 53.7 41.7 4.6 28.7 22.2 7.5 41.7 49.9 37.5 5.9 6.7610 to 19 employees 256 110.......................... 59.8 35.9 4.3 33.0 23.1 8.0 35.9 48.5 39.4 5.2 6.9720 to 49 employees 144 734.......................... 59.9 35.1 5.0 34.5 21.0 9.4 35.1 50.7 38.6 5.7 5.1850 to 99 employees 45 331.......................... 63.4 31.6 4.9 37.4 21.2 9.8 31.6 41.3 46.5 5.4 6.99100 employees or more 33 062...................... 63.2 29.6 7.1 32.5 24.6 13.3 29.6 38.8 43.9 8.8 8.410
Hispanic ~owned businesses 771 708............. 37.6 57.2 5.2 15.1 20.4 7.3 57.2 43.2 36.9 7.1 12.811
With no paid employees 656 343........................ 35.0 59.2 5.8 13.1 19.9 7.8 59.2 40.2 38.3 7.6 14.012With paid employees 115 364........................... 45.9 50.6 3.4 21.5 22.1 5.8 50.6 53.2 32.4 5.5 8.913
No employees6 19 569.............................. 54.2 42.4 3.5 27.2 25.9 4.5 42.4 58.8 28.0 7.2 5.9141 to 4 employees 64 631............................ 40.2 56.4 3.5 18.2 19.8 5.6 56.4 50.2 33.4 5.8 10.6155 to 9 employees 16 937............................ 49.8 46.7 3.6 22.2 24.7 6.5 46.7 55.7 33.1 4.6 6.51610 to 19 employees 8 553.......................... 49.7 46.7 3.6 24.4 21.8 7.1 46.7 53.1 33.6 3.8 9.41720 to 49 employees 4 050.......................... 51.3 46.1 2.6 22.3 26.1 5.6 46.1 55.1 30.9 4.1 10.01850 to 99 employees 948.......................... 61.0 36.8 2.2 36.8 19.6 6.8 36.8 55.2 32.7 3.4 8.719100 employees or more 676...................... 56.9 38.4 4.6 30.6 24.7 6.3 38.4 59.9 29.8 5.9 4.420
Black ~owned businesses 620 912................ 30.9 61.1 7.9 10.7 18.5 9.6 61.1 35.3 45.4 9.6 9.721
With no paid employees 556 434........................ 29.9 61.8 8.4 9.9 18.4 9.9 61.8 33.9 45.7 10.2 10.322With paid employees 64 478........................... 38.6 56.5 4.9 16.9 19.2 7.4 56.5 46.0 43.2 5.1 5.623
No employees6 13 725.............................. 33.4 58.2 8.5 10.5 21.9 9.4 58.2 46.0 43.5 8.4 2.1241 to 4 employees 37 587............................ 39.4 56.6 4.0 18.4 18.1 6.8 56.6 45.1 43.7 4.1 7.0255 to 9 employees 7 853............................ 41.3 54.7 4.1 19.1 19.3 6.9 54.7 52.2 38.6 3.9 5.32610 to 19 employees 2 839.......................... 37.5 59.7 2.8 15.1 18.9 6.3 59.7 44.9 45.2 3.4 6.42720 to 49 employees 1 700.......................... 47.9 46.5 5.6 21.6 23.0 9.0 46.5 42.7 42.8 9.8 4.72850 to 99 employees 432.......................... 33.2 65.0 1.8 16.3 14.7 4.1 65.0 41.6 53.9 1.5 3.029100 employees or more 342...................... 41.5 51.5 7.0 16.2 23.3 9.0 51.5 41.9 48.3 8.6 1.230
Other minority ~owned businesses 606 426....... 43.3 52.5 4.2 17.7 23.1 6.7 52.5 40.7 39.6 6.0 13.731
With no paid employees 470 075........................ 41.6 54.6 3.9 15.8 23.5 6.1 54.6 37.4 42.3 5.5 14.832With paid employees 136 351........................... 46.9 48.3 4.9 21.5 22.5 7.7 48.3 47.3 34.2 7.1 11.433
No employees6 19 989.............................. 48.1 50.5 1.4 20.3 26.3 2.8 50.5 52.8 27.7 4.2 15.2341 to 4 employees 76 636............................ 43.8 50.9 5.3 19.4 22.2 7.6 50.9 44.4 35.9 7.8 11.8355 to 9 employees 22 862............................ 47.9 47.6 4.4 25.0 19.5 7.9 47.6 51.3 31.4 5.8 11.53610 to 19 employees 10 051.......................... 52.6 44.4 3.0 21.1 26.8 7.7 44.4 50.2 35.5 5.2 9.23720 to 49 employees 5 034.......................... 55.4 37.7 7.0 31.8 18.8 11.8 37.7 48.4 36.6 8.3 6.73850 to 99 employees 1 075.......................... 49.6 34.2 16.2 22.8 24.0 19.0 34.2 44.6 32.0 16.9 6.539100 employees or more 705...................... 43.0 38.8 18.2 13.4 23.9 23.8 38.8 29.5 39.4 20.9 10.340
Women ~owned businesses 5 888 883.............. 49.1 45.2 5.6 18.1 28.8 7.8 45.2 36.2 48.2 6.6 9.041
With no paid employees 5 071 110........................ 47.7 46.0 6.2 16.2 29.7 8.1 46.0 34.0 49.3 7.3 9.442With paid employees 817 773........................... 55.0 41.8 3.2 26.2 25.3 6.8 41.8 45.3 43.7 3.8 7.243
No employees6 127 905.............................. 49.5 48.8 1.7 23.5 17.8 10.0 48.8 59.7 34.1 2.6 3.6441 to 4 employees 435 550............................ 53.1 43.6 3.3 22.9 27.8 5.7 43.6 43.5 45.6 3.6 7.2455 to 9 employees 134 476............................ 55.6 42.0 2.4 28.7 24.1 5.2 42.0 43.4 45.6 3.6 7.44610 to 19 employees 67 487.......................... 58.9 36.5 4.6 30.7 24.8 8.0 36.5 42.1 44.6 4.8 8.54720 to 49 employees 35 515.......................... 67.0 28.5 4.5 38.1 24.2 9.2 28.5 46.2 40.2 5.4 8.24850 to 99 employees 10 178.......................... 64.0 29.3 6.7 34.5 23.5 12.7 29.3 34.3 48.6 7.2 9.949100 employees or more 6 663...................... 68.9 26.2 4.9 39.5 22.7 11.7 26.2 38.8 39.6 6.0 15.650
Nonminority male ~owned businesses 10 114 456.... 51.8 43.8 4.5 23.7 25.8 6.7 43.8 45.1 43.1 5.5 6.351
With no paid employees 8 019 462........................ 50.4 45.0 4.6 22.0 26.3 6.7 45.0 42.6 45.0 5.6 6.852With paid employees 2 094 993........................... 56.0 40.1 3.9 28.9 24.3 6.8 40.1 52.8 37.3 4.9 5.053
No employees6 271 380.............................. 50.5 47.5 2.0 28.8 20.3 3.4 47.5 54.6 40.4 2.4 2.6541 to 4 employees 1 155 800............................ 55.4 41.4 3.2 25.6 27.5 5.5 41.4 54.7 36.1 4.3 4.9555 to 9 employees 334 483............................ 53.8 40.6 5.5 29.5 21.5 8.4 40.6 52.1 34.8 6.9 6.15610 to 19 employees 173 140.......................... 61.3 34.4 4.4 35.0 22.5 8.2 34.4 50.4 38.0 5.5 6.15720 to 49 employees 101 938.......................... 58.3 36.6 5.1 34.1 19.9 9.5 36.6 52.1 38.4 5.6 3.95850 to 99 employees 33 406.......................... 64.1 31.7 4.2 38.7 20.6 9.0 31.7 42.3 46.9 4.7 6.159100 employees or more 24 846...................... 62.6 29.9 7.5 31.3 25.2 13.6 29.9 38.6 45.6 9.4 6.460
1Data represent percentage of owners reporting in the designated categories.2Includes owners who never had any close relatives who owned a business.3Includes owners who had no previous work experience prior to starting/acquiring their businesses.4For explanation of relative standard errors and standard errors, see Reliability of Estimates in the introductory text.5Relative standard errors are not applicable for lines 1 through 10 since these data are the result of censuses, not surveys.6Firms reported annual payroll, but did not report any employees on their payroll during specified period in 1992.
90 CHARACTERISTICS OF BUSINESS OWNERS 1992 ECONOMIC CENSUS

Employment Size of Firm: 1992
Years of work experience prior to starting/acquiring ownership of the business1
Standard error of estimate4 for columnm
None (didnot work)
Lessthan 2 2 to 5 6 to 9 10 to 19
20 ormore
Notreported
Relativestandard
error ofestimate4 5
M N O P Q R S A B C D E F G H I J K L M N O P Q R S
7.6 6.3 14.2 14.1 26.4 25.9 5.5 (X) 1.2 1.2 .2 .8 .9 .3 1.2 .7 .7 .3 .4 .4 .4 .5 .5 .6 .9 .3 1
8.1 6.8 13.5 13.4 25.5 26.9 5.8 (X) 1.4 1.4 .3 1.0 1.2 .5 1.4 1.0 1.0 .4 .5 .5 .5 .6 .6 .7 1.2 .4 26.0 4.6 16.6 16.4 29.5 22.7 4.3 (X) .9 .9 .4 .5 .6 .4 .9 .8 .5 .5 .4 .4 .4 .5 .6 1.0 .5 .4 33.4 3.6 13.7 15.4 35.5 26.2 2.2 (X) 2.9 3.1 .9 2.8 2.4 2.3 3.1 2.3 2.0 .8 .5 .5 1.1 2.1 2.4 3.3 2.6 .7 46.1 4.5 17.6 17.4 27.7 22.9 3.8 (X) 1.2 1.3 .5 .5 .9 .6 1.3 1.1 .9 .6 .5 .5 .5 .9 .7 1.4 .9 .5 56.7 5.5 18.4 14.8 27.6 21.4 5.5 (X) 2.0 1.5 1.6 1.2 1.7 1.7 1.5 1.7 1.5 1.7 .9 .9 .7 1.3 1.3 1.1 1.0 1.6 66.9 4.5 15.7 15.6 31.3 21.5 4.5 (X) 1.4 1.3 .5 1.8 1.5 .6 1.3 1.9 1.6 .7 1.6 1.6 .5 1.0 1.2 1.5 .9 .6 75.1 3.9 13.8 17.0 32.7 22.2 5.3 (X) 1.9 1.8 .5 2.0 .9 1.0 1.8 1.3 1.7 .6 .7 .7 .6 1.1 .9 1.3 1.0 .5 86.9 6.7 13.3 14.6 31.5 21.5 5.4 (X) 1.1 .8 .6 1.6 2.1 .5 .8 1.9 1.9 .5 .8 .8 1.3 1.0 1.5 1.7 1.2 .5 98.4 3.7 11.7 14.9 31.9 20.2 9.1 (X) 3.1 2.8 1.7 1.1 2.5 2.1 2.8 3.0 2.6 1.5 1.7 1.7 .3 1.6 1.9 2.5 2.8 1.6 10
12.8 7.8 16.5 13.0 25.4 17.7 6.7 – 1.0 .9 .4 .8 .6 .6 .9 1.0 1.3 .5 .5 .5 .6 .7 .6 .9 .5 .5 11
14.0 7.9 16.2 12.2 24.6 17.7 7.5 – 1.3 1.2 .5 1.1 .5 .7 1.2 1.1 1.2 .6 .7 .7 .8 .8 1.0 1.2 .7 .6 128.9 7.6 17.5 15.9 28.1 17.7 4.3 1.0 1.3 1.4 .4 .7 1.5 .6 1.4 1.8 1.9 .6 .8 .8 .7 1.5 1.0 1.2 .8 .4 135.9 10.1 12.5 13.3 33.7 19.8 4.7 2.0 5.1 5.0 1.6 3.8 3.4 1.7 5.0 4.3 3.8 2.3 1.0 1.0 2.7 2.6 2.4 4.7 3.3 1.5 14
10.6 7.6 19.3 16.2 25.5 16.3 4.5 1.0 1.9 1.9 .9 1.5 1.8 1.1 1.9 2.0 2.5 1.0 1.7 1.7 .8 2.3 1.2 1.5 1.8 .8 156.5 6.6 17.9 18.0 27.2 19.7 4.1 2.0 2.8 2.6 .5 2.3 1.6 .9 2.6 2.3 2.2 .7 1.1 1.1 1.1 1.9 1.9 2.0 2.4 .7 169.4 5.7 18.1 15.7 30.0 17.8 3.3 3.0 2.8 2.5 .7 2.1 1.5 1.3 2.5 2.9 2.7 .9 1.2 1.2 1.3 2.2 1.9 1.7 1.7 .8 17
10.0 6.9 14.5 13.4 31.1 20.2 3.9 4.0 3.8 3.7 .8 2.6 3.3 1.1 3.7 4.1 2.5 .9 3.9 3.9 2.5 1.5 2.4 3.1 1.7 1.0 188.7 9.3 14.9 15.1 33.0 15.1 3.7 6.0 6.3 6.1 .5 4.0 2.6 1.7 6.1 3.1 2.7 .7 1.3 1.3 3.5 2.7 3.0 2.0 2.2 1.4 194.4 5.7 13.1 15.0 42.6 13.5 5.6 8.0 4.7 4.4 1.9 4.3 5.2 1.8 4.4 5.5 3.9 1.9 2.1 2.1 2.3 2.7 3.9 6.9 2.9 2.0 20
9.7 6.4 12.7 13.2 26.2 22.3 9.4 – .9 .8 .4 .5 .5 .4 .8 1.0 1.4 .5 .6 .6 .3 .5 .4 .6 .3 .4 21
10.3 6.3 12.3 13.0 25.7 22.3 10.1 – .9 1.0 .5 .5 .5 .6 1.0 1.1 1.5 .6 .7 .7 .3 .5 .4 .6 .5 .5 225.6 7.6 15.6 14.5 30.1 22.7 4.0 1.0 2.0 1.9 .8 1.4 1.6 1.1 1.9 1.8 2.2 .8 .8 .8 .8 .7 1.4 1.4 1.8 .5 232.1 7.5 15.7 12.1 30.4 25.6 6.6 2.0 5.4 4.8 3.2 2.8 4.3 3.2 4.8 3.8 4.0 3.0 .7 .7 2.0 2.7 3.0 3.7 3.2 2.7 247.0 8.6 15.6 15.9 28.6 21.2 3.1 1.0 1.9 1.7 .7 1.7 1.6 .9 1.7 2.6 2.5 .6 1.0 1.0 1.3 1.1 1.8 2.1 2.0 .5 255.3 5.5 15.8 14.5 31.4 23.7 3.8 3.0 3.1 2.6 1.3 1.6 2.5 1.4 2.6 3.9 3.4 1.4 1.0 1.0 1.3 2.0 2.0 2.2 2.2 1.4 266.4 4.7 13.0 13.2 35.1 24.8 2.8 4.0 3.9 4.1 .8 2.6 2.6 1.8 4.1 5.0 4.3 .7 2.0 2.0 1.8 1.6 2.4 4.9 4.4 .8 274.7 2.9 16.9 10.0 35.7 23.5 6.4 6.0 5.6 5.3 1.5 3.2 2.2 2.2 5.3 4.9 5.2 2.8 1.6 1.6 1.3 3.7 2.7 5.1 4.7 1.5 283.0 3.4 6.7 11.4 53.0 20.9 1.5 8.0 7.4 7.4 .8 6.3 4.6 1.1 7.4 5.0 5.1 .7 2.2 2.2 1.9 3.2 5.7 4.6 4.2 .7 291.2 11.9 21.7 6.5 29.3 20.7 8.7 10.0 5.7 4.7 2.2 4.3 5.7 2.2 4.7 5.4 6.5 2.6 .6 .6 6.1 5.3 2.6 4.8 2.9 2.2 30
13.7 8.5 18.9 14.7 23.6 14.8 5.8 – 1.5 1.6 .5 1.3 1.4 .6 1.6 1.7 1.4 .5 .9 .9 .8 1.1 .8 .6 .6 .5 31
14.8 8.6 18.3 14.2 24.0 14.5 5.7 – 1.8 2.0 .6 1.6 1.7 .6 2.0 2.0 2.3 .8 1.2 1.2 1.1 1.3 1.1 1.0 .6 .7 3211.4 8.4 20.1 15.8 22.7 15.4 6.2 1.0 1.6 1.3 1.2 .8 1.0 1.2 1.3 2.0 1.1 1.1 .7 .7 .8 1.1 .8 .9 1.1 1.0 3315.2 5.2 25.3 12.6 21.3 17.1 3.3 2.0 6.0 6.1 .6 4.7 5.1 .6 6.1 7.0 3.7 1.3 5.8 5.8 1.6 3.7 2.4 3.1 5.3 1.1 3411.8 10.4 19.8 15.4 20.5 15.2 6.9 1.0 1.9 1.5 1.8 1.3 1.1 1.8 1.5 2.5 1.9 1.6 1.2 1.2 1.5 1.3 1.4 1.7 1.8 1.7 3511.5 7.3 20.7 17.6 25.3 12.7 4.9 2.0 2.5 2.3 1.4 1.8 1.0 1.5 2.3 2.4 2.5 1.0 1.2 1.2 1.1 1.8 1.6 1.5 1.9 .9 36
9.2 6.9 19.3 16.9 28.9 14.7 4.1 2.0 3.9 3.7 1.1 1.5 3.2 2.7 3.7 3.1 2.6 1.0 1.3 1.3 1.3 2.5 2.3 2.7 1.5 1.0 376.7 5.5 16.8 18.9 24.6 19.1 8.3 4.0 2.5 3.1 1.8 2.3 2.2 2.6 3.1 3.4 3.5 1.7 1.7 1.7 1.3 2.0 1.5 2.0 2.2 1.5 386.5 3.3 12.1 15.2 23.1 24.5 15.3 6.0 3.4 5.0 4.2 2.1 2.6 4.0 5.0 4.2 3.4 4.5 2.2 2.2 .9 2.7 2.5 2.7 2.8 4.3 39
10.3 2.9 9.6 9.8 22.7 25.0 19.8 6.0 5.1 3.6 6.8 3.7 4.2 6.7 3.6 5.8 6.8 6.4 3.0 3.0 1.1 2.1 2.7 3.9 4.0 6.8 40
9.0 6.9 13.8 13.4 27.6 23.3 6.0 – 1.1 .9 .3 1.1 1.1 .4 .9 .9 1.1 .6 .7 .7 .8 .5 .6 .8 1.2 .5 41
9.4 7.3 13.4 13.1 27.2 23.0 6.6 – 1.4 1.2 .4 1.3 1.2 .5 1.2 .7 1.2 .7 .7 .7 1.0 .5 .7 1.1 1.5 .5 427.2 5.2 15.2 14.7 29.3 24.9 3.5 – 1.3 1.5 .3 .9 1.1 .9 1.5 2.1 2.0 .4 .6 .6 .6 .9 1.2 1.4 1.2 .4 433.6 4.8 9.7 19.6 26.5 33.6 2.1 1.0 5.9 5.9 .6 5.0 2.5 4.1 5.9 5.2 5.2 .7 .6 .6 1.0 1.7 5.0 5.6 5.9 .8 447.2 5.2 15.4 13.4 30.0 25.3 3.5 – 2.2 2.5 .7 1.9 1.6 .7 2.5 3.4 3.6 .8 1.3 1.3 1.1 1.9 1.2 2.8 2.6 .9 457.4 5.1 17.1 15.0 28.8 23.7 2.8 1.0 1.7 1.8 .5 2.0 2.1 .8 1.8 1.9 2.3 .6 .9 .9 .9 1.2 1.6 1.9 1.2 .4 468.5 5.5 16.9 15.2 28.0 21.7 4.2 1.0 2.6 2.3 1.0 2.3 1.5 1.4 2.3 2.2 3.0 .7 1.4 1.4 1.4 .9 1.7 1.3 2.2 .6 478.2 4.5 15.5 13.7 35.4 17.3 5.3 1.0 2.7 2.1 1.1 3.5 2.8 1.7 2.1 2.8 2.4 1.1 1.1 1.1 .9 1.9 1.7 4.3 2.1 1.1 489.9 7.7 16.5 14.0 27.8 16.9 7.2 2.0 2.7 3.2 2.1 3.3 2.7 2.3 3.2 2.9 4.1 2.3 1.9 1.9 1.4 3.5 2.8 4.1 2.1 2.1 49
15.6 8.0 14.7 13.3 25.7 16.0 6.6 2.0 3.2 3.2 1.3 3.0 2.7 1.6 3.2 5.1 3.5 1.7 3.3 3.3 1.9 2.0 2.5 2.5 2.4 1.5 50
6.3 5.7 14.1 14.5 26.0 28.3 5.0 – 1.6 1.7 .4 1.0 1.3 .5 1.7 1.3 1.2 .5 .5 .5 .5 .8 .9 1.0 1.6 .5 51
6.8 6.4 13.1 13.5 24.7 30.3 5.2 – 2.1 2.1 .5 1.4 1.7 .7 2.1 1.7 1.7 .7 .7 .7 .6 .9 1.1 1.3 2.1 .6 525.0 3.9 17.0 17.2 30.0 22.5 4.4 – 1.1 1.1 .6 .8 .9 .6 1.1 1.0 .8 .7 .5 .5 .4 .7 .7 1.2 .7 .6 532.6 2.3 14.7 13.9 41.6 23.4 1.6 – 3.3 3.5 1.6 3.8 3.7 1.7 3.5 3.0 3.1 1.3 .7 .7 2.0 3.7 3.5 4.9 2.7 1.1 544.9 3.5 18.5 19.5 27.3 22.8 3.7 – 1.6 1.7 .8 1.1 1.2 1.0 1.7 1.8 1.6 .9 .6 .6 .5 1.1 1.1 2.1 1.5 .7 556.1 5.4 18.8 14.3 27.3 21.2 6.8 – 2.7 1.9 2.1 1.9 2.0 2.2 1.9 2.2 1.7 2.2 1.3 1.3 .9 2.1 2.0 1.3 1.4 2.2 566.1 4.0 15.1 15.7 32.7 21.8 4.7 1.0 2.2 2.2 .8 2.7 2.1 1.1 2.2 2.5 1.9 1.0 1.9 1.9 .5 1.5 1.6 2.0 1.6 .9 573.9 3.7 13.3 18.0 32.1 23.9 5.1 1.0 2.1 2.1 .7 2.3 1.2 1.3 2.1 1.8 2.0 .8 .6 .6 .8 1.6 .9 1.4 1.2 .7 586.1 6.6 12.6 14.8 32.7 22.5 4.8 1.0 1.2 .9 .8 2.4 2.6 .9 .9 2.4 2.5 .7 1.0 1.0 1.7 1.4 1.9 1.8 1.9 .9 596.4 2.3 10.8 15.7 33.7 21.5 9.6 1.0 3.5 3.1 2.2 1.2 3.3 2.9 3.1 4.0 3.4 2.0 1.6 1.6 .5 2.3 3.3 3.3 3.6 2.3 60
1992 ECONOMIC CENSUS CHARACTERISTICS OF BUSINESS OWNERS 91
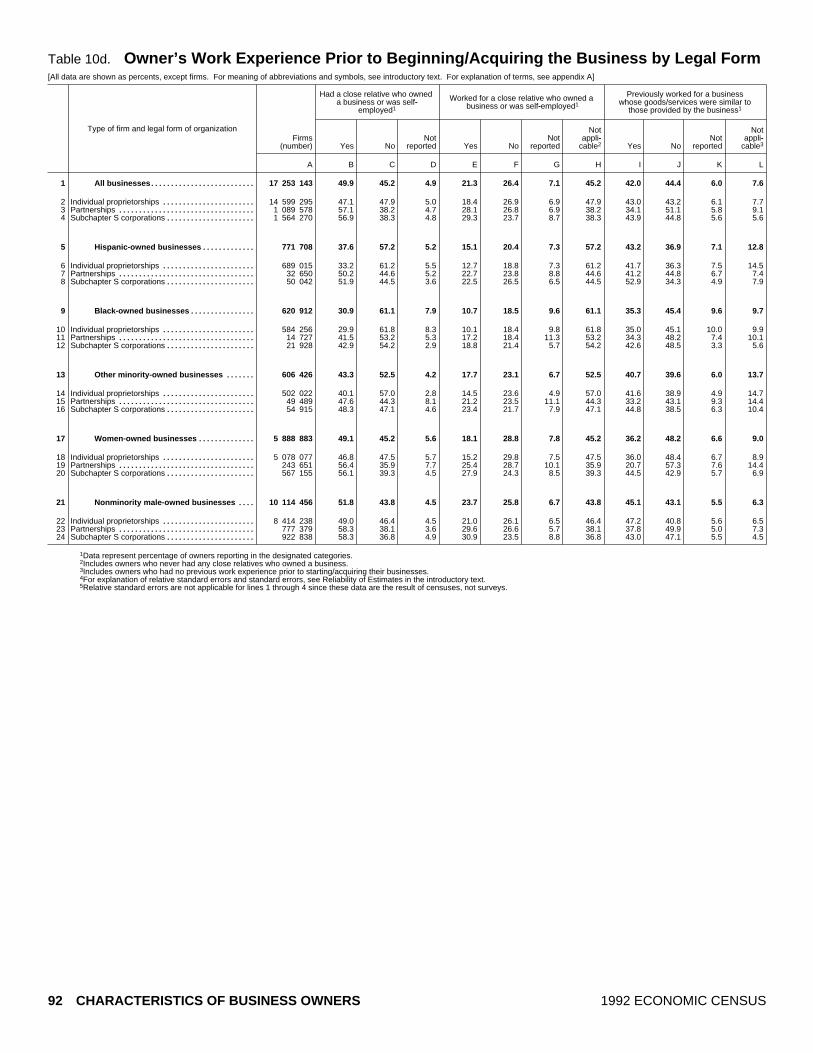
Table 10d. Owner’s Work Experience Prior to Beginning/Acquiring the Business by Legal Form[All data are shown as percents, except firms. For meaning of abbreviations and symbols, see introductory text. For explanation of terms, see appendix A]
Type of firm and legal form of organization
Had a close relative who owneda business or was self~
employed1
Worked for a close relative who owned a business or was self~employed1
Previously worked for a businesswhose goods/services were similar to
those provided by the business1
Firms(number) Yes No
Notreported Yes No
Notreported
Notappli~
cable2 Yes NoNot
reported
Notappli~
cable3
A B C D E F G H I J K L
All businesses 17 253 143.......................... 49.9 45.2 4.9 21.3 26.4 7.1 45.2 42.0 44.4 6.0 7.61
Individual proprietorships 14 599 295....................... 47.1 47.9 5.0 18.4 26.9 6.9 47.9 43.0 43.2 6.1 7.72Partnerships 1 089 578.................................. 57.1 38.2 4.7 28.1 26.8 6.9 38.2 34.1 51.1 5.8 9.13Subchapter S corporations 1 564 270...................... 56.9 38.3 4.8 29.3 23.7 8.7 38.3 43.9 44.8 5.6 5.64
Hispanic ~owned businesses 771 708............. 37.6 57.2 5.2 15.1 20.4 7.3 57.2 43.2 36.9 7.1 12.85
Individual proprietorships 689 015....................... 33.2 61.2 5.5 12.7 18.8 7.3 61.2 41.7 36.3 7.5 14.56Partnerships 32 650.................................. 50.2 44.6 5.2 22.7 23.8 8.8 44.6 41.2 44.8 6.7 7.47Subchapter S corporations 50 042...................... 51.9 44.5 3.6 22.5 26.5 6.5 44.5 52.9 34.3 4.9 7.98
Black ~owned businesses 620 912................ 30.9 61.1 7.9 10.7 18.5 9.6 61.1 35.3 45.4 9.6 9.79
Individual proprietorships 584 256....................... 29.9 61.8 8.3 10.1 18.4 9.8 61.8 35.0 45.1 10.0 9.910Partnerships 14 727.................................. 41.5 53.2 5.3 17.2 18.4 11.3 53.2 34.3 48.2 7.4 10.111Subchapter S corporations 21 928...................... 42.9 54.2 2.9 18.8 21.4 5.7 54.2 42.6 48.5 3.3 5.612
Other minority ~owned businesses 606 426....... 43.3 52.5 4.2 17.7 23.1 6.7 52.5 40.7 39.6 6.0 13.713
Individual proprietorships 502 022....................... 40.1 57.0 2.8 14.5 23.6 4.9 57.0 41.6 38.9 4.9 14.714Partnerships 49 489.................................. 47.6 44.3 8.1 21.2 23.5 11.1 44.3 33.2 43.1 9.3 14.415Subchapter S corporations 54 915...................... 48.3 47.1 4.6 23.4 21.7 7.9 47.1 44.8 38.5 6.3 10.416
Women ~owned businesses 5 888 883.............. 49.1 45.2 5.6 18.1 28.8 7.8 45.2 36.2 48.2 6.6 9.017
Individual proprietorships 5 078 077....................... 46.8 47.5 5.7 15.2 29.8 7.5 47.5 36.0 48.4 6.7 8.918Partnerships 243 651.................................. 56.4 35.9 7.7 25.4 28.7 10.1 35.9 20.7 57.3 7.6 14.419Subchapter S corporations 567 155...................... 56.1 39.3 4.5 27.9 24.3 8.5 39.3 44.5 42.9 5.7 6.920
Nonminority male ~owned businesses 10 114 456.... 51.8 43.8 4.5 23.7 25.8 6.7 43.8 45.1 43.1 5.5 6.321
Individual proprietorships 8 414 238....................... 49.0 46.4 4.5 21.0 26.1 6.5 46.4 47.2 40.8 5.6 6.522Partnerships 777 379.................................. 58.3 38.1 3.6 29.6 26.6 5.7 38.1 37.8 49.9 5.0 7.323Subchapter S corporations 922 838...................... 58.3 36.8 4.9 30.9 23.5 8.8 36.8 43.0 47.1 5.5 4.524
1Data represent percentage of owners reporting in the designated categories.2Includes owners who never had any close relatives who owned a business.3Includes owners who had no previous work experience prior to starting/acquiring their businesses.4For explanation of relative standard errors and standard errors, see Reliability of Estimates in the introductory text.5Relative standard errors are not applicable for lines 1 through 4 since these data are the result of censuses, not surveys.
92 CHARACTERISTICS OF BUSINESS OWNERS 1992 ECONOMIC CENSUS
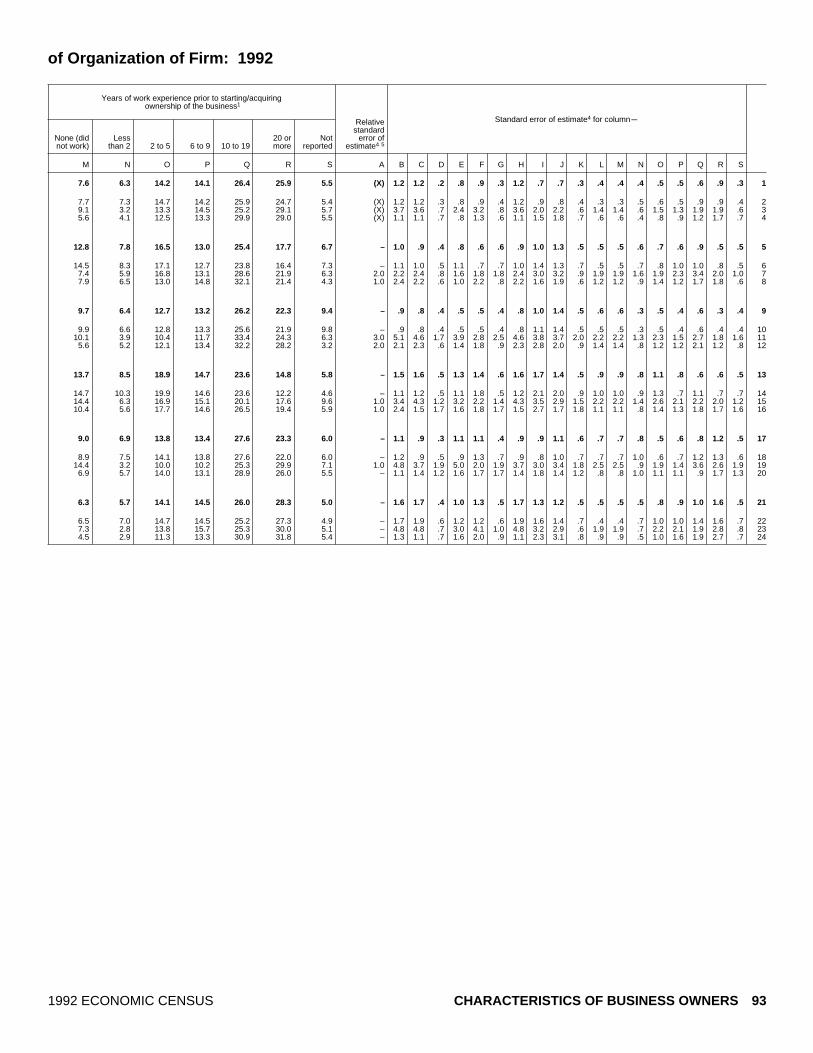
of Organization of Firm: 1992
Years of work experience prior to starting/acquiring ownership of the business1
Standard error of estimate4 for columnm
None (didnot work)
Lessthan 2 2 to 5 6 to 9 10 to 19
20 ormore
Notreported
Relativestandard
error ofestimate4 5
M N O P Q R S A B C D E F G H I J K L M N O P Q R S
7.6 6.3 14.2 14.1 26.4 25.9 5.5 (X) 1.2 1.2 .2 .8 .9 .3 1.2 .7 .7 .3 .4 .4 .4 .5 .5 .6 .9 .3 1
7.7 7.3 14.7 14.2 25.9 24.7 5.4 (X) 1.2 1.2 .3 .8 .9 .4 1.2 .9 .8 .4 .3 .3 .5 .6 .5 .9 .9 .4 29.1 3.2 13.3 14.5 25.2 29.1 5.7 (X) 3.7 3.6 .7 2.4 3.2 .8 3.6 2.0 2.2 .6 1.4 1.4 .6 1.5 1.3 1.9 1.9 .6 35.6 4.1 12.5 13.3 29.9 29.0 5.5 (X) 1.1 1.1 .7 .8 1.3 .6 1.1 1.5 1.8 .7 .6 .6 .4 .8 .9 1.2 1.7 .7 4
12.8 7.8 16.5 13.0 25.4 17.7 6.7 – 1.0 .9 .4 .8 .6 .6 .9 1.0 1.3 .5 .5 .5 .6 .7 .6 .9 .5 .5 5
14.5 8.3 17.1 12.7 23.8 16.4 7.3 – 1.1 1.0 .5 1.1 .7 .7 1.0 1.4 1.3 .7 .5 .5 .7 .8 1.0 1.0 .8 .5 67.4 5.9 16.8 13.1 28.6 21.9 6.3 2.0 2.2 2.4 .8 1.6 1.8 1.8 2.4 3.0 3.2 .9 1.9 1.9 1.6 1.9 2.3 3.4 2.0 1.0 77.9 6.5 13.0 14.8 32.1 21.4 4.3 1.0 2.4 2.2 .6 1.0 2.2 .8 2.2 1.6 1.9 .6 1.2 1.2 .9 1.4 1.2 1.7 1.8 .6 8
9.7 6.4 12.7 13.2 26.2 22.3 9.4 – .9 .8 .4 .5 .5 .4 .8 1.0 1.4 .5 .6 .6 .3 .5 .4 .6 .3 .4 9
9.9 6.6 12.8 13.3 25.6 21.9 9.8 – .9 .8 .4 .5 .5 .4 .8 1.1 1.4 .5 .5 .5 .3 .5 .4 .6 .4 .4 1010.1 3.9 10.4 11.7 33.4 24.3 6.3 3.0 5.1 4.6 1.7 3.9 2.8 2.5 4.6 3.8 3.7 2.0 2.2 2.2 1.3 2.3 1.5 2.7 1.8 1.6 11
5.6 5.2 12.1 13.4 32.2 28.2 3.2 2.0 2.1 2.3 .6 1.4 1.8 .9 2.3 2.8 2.0 .9 1.4 1.4 .8 1.2 1.2 2.1 1.2 .8 12
13.7 8.5 18.9 14.7 23.6 14.8 5.8 – 1.5 1.6 .5 1.3 1.4 .6 1.6 1.7 1.4 .5 .9 .9 .8 1.1 .8 .6 .6 .5 13
14.7 10.3 19.9 14.6 23.6 12.2 4.6 – 1.1 1.2 .5 1.1 1.8 .5 1.2 2.1 2.0 .9 1.0 1.0 .9 1.3 .7 1.1 .7 .7 1414.4 6.3 16.9 15.1 20.1 17.6 9.6 1.0 3.4 4.3 1.2 3.2 2.2 1.4 4.3 3.5 2.9 1.5 2.2 2.2 1.4 2.6 2.1 2.2 2.0 1.2 1510.4 5.6 17.7 14.6 26.5 19.4 5.9 1.0 2.4 1.5 1.7 1.6 1.8 1.7 1.5 2.7 1.7 1.8 1.1 1.1 .8 1.4 1.3 1.8 1.7 1.6 16
9.0 6.9 13.8 13.4 27.6 23.3 6.0 – 1.1 .9 .3 1.1 1.1 .4 .9 .9 1.1 .6 .7 .7 .8 .5 .6 .8 1.2 .5 17
8.9 7.5 14.1 13.8 27.6 22.0 6.0 – 1.2 .9 .5 .9 1.3 .7 .9 .8 1.0 .7 .7 .7 1.0 .6 .7 1.2 1.3 .6 1814.4 3.2 10.0 10.2 25.3 29.9 7.1 1.0 4.8 3.7 1.9 5.0 2.0 1.9 3.7 3.0 3.4 1.8 2.5 2.5 .9 1.9 1.4 3.6 2.6 1.9 19
6.9 5.7 14.0 13.1 28.9 26.0 5.5 – 1.1 1.4 1.2 1.6 1.7 1.7 1.4 1.8 1.4 1.2 .8 .8 1.0 1.1 1.1 .9 1.7 1.3 20
6.3 5.7 14.1 14.5 26.0 28.3 5.0 – 1.6 1.7 .4 1.0 1.3 .5 1.7 1.3 1.2 .5 .5 .5 .5 .8 .9 1.0 1.6 .5 21
6.5 7.0 14.7 14.5 25.2 27.3 4.9 – 1.7 1.9 .6 1.2 1.2 .6 1.9 1.6 1.4 .7 .4 .4 .7 1.0 1.0 1.4 1.6 .7 227.3 2.8 13.8 15.7 25.3 30.0 5.1 – 4.8 4.8 .7 3.0 4.1 1.0 4.8 3.2 2.9 .6 1.9 1.9 .7 2.2 2.1 1.9 2.8 .8 234.5 2.9 11.3 13.3 30.9 31.8 5.4 – 1.3 1.1 .7 1.6 2.0 .9 1.1 2.3 3.1 .8 .9 .9 .5 1.0 1.6 1.9 2.7 .7 24
1992 ECONOMIC CENSUS CHARACTERISTICS OF BUSINESS OWNERS 93

Table 11a. Owner’s Managerial Work Experience Prior to Beginning/Acquiring the Business by[All data are shown as percents, except firms. For meaning of abbreviations and symbols, see introductory text. For explanation of terms, see appendix A]
Type of firm and industry division
Years of experience working in a managerial capacity1
Firms(number) None
Lessthan 2 2 to 5 6 to 9 10 to 19
20 ormore
Notsure
Notreported
Notapplicable2
A B C D E F G H I J
All businesses 17 253 143............................. 33.9 8.0 13.8 9.0 11.4 8.2 2.4 5.7 7.61
Agricultural services, forestry, fishing, and mining 583 253..... 36.6 7.2 11.3 10.2 9.3 5.2 3.6 7.2 9.32Construction 1 829 620..................................... 45.0 7.9 16.8 6.5 7.0 6.3 2.6 3.5 4.43Manufacturing 517 714.................................... 36.4 5.9 10.6 10.5 14.5 8.7 2.9 4.6 6.04Transportation, communications, and utilities 698 903......... 40.7 7.5 10.9 6.0 8.7 7.9 2.6 7.9 7.85Wholesale trade 538 339.................................. 24.1 8.0 14.8 12.4 16.9 9.3 3.2 4.9 6.36
Retail trade 2 478 045...................................... 31.1 9.2 15.4 8.7 12.1 5.9 2.2 5.9 9.47Finance, insurance, and real estate 1 941 029................. 21.8 5.7 12.8 10.0 15.1 17.5 2.6 5.3 9.28Services 7 784 016......................................... 36.3 8.8 13.8 8.9 10.6 6.5 2.4 5.5 7.29Industries not classified 882 224............................ 35.6 7.3 11.7 9.6 10.9 4.4 1.2 11.4 7.810
Hispanic ~owned businesses 771 708................ 35.1 7.9 12.6 7.9 9.3 4.5 2.9 7.0 12.811
Agricultural services, forestry, fishing, and mining 32 927..... 45.4 4.2 9.7 6.9 4.9 3.3 3.9 7.9 13.812Construction 97 476..................................... 38.0 8.2 13.7 8.6 7.2 3.7 4.3 9.5 6.613Manufacturing 18 461.................................... 32.5 7.5 13.2 9.3 13.7 6.5 3.1 6.2 8.014Transportation, communications, and utilities 47 797......... 41.8 8.1 9.0 4.6 6.2 4.7 2.6 9.6 13.615Wholesale trade 17 727.................................. 26.2 8.3 16.1 11.8 15.6 6.9 2.2 4.5 8.416
Retail trade 107 846...................................... 28.6 9.7 13.6 8.9 9.6 2.9 2.3 4.7 19.717Finance, insurance, and real estate 49 231................. 20.8 9.2 13.4 11.9 15.4 9.8 3.0 4.6 11.918Services 347 297......................................... 38.3 7.6 12.6 7.1 8.9 4.0 2.5 6.7 12.219Industries not classified 52 945............................ 34.9 6.1 9.9 4.7 7.8 4.1 3.7 11.9 16.920
Black ~owned businesses 620 912................... 40.6 7.4 12.1 6.7 8.3 3.6 2.4 9.1 9.721
Agricultural services, forestry, fishing, and mining 10 309..... 42.2 6.0 11.8 5.2 6.4 4.9 2.0 9.0 12.422Construction 43 381..................................... 47.2 6.9 12.9 6.3 6.2 3.3 3.9 7.6 5.723Manufacturing 10 469.................................... 39.7 4.5 12.3 7.3 10.8 3.0 3.7 8.9 9.724Transportation, communications, and utilities 49 095........ 45.4 4.0 9.2 3.9 7.2 3.1 2.3 12.0 12.925Wholesale trade 7 550.................................. 31.3 11.1 15.1 10.4 12.3 4.4 2.1 5.5 7.726
Retail trade 86 840...................................... 38.8 7.4 12.7 7.3 8.2 2.8 1.6 8.2 13.027Finance, insurance, and real estate 40 924................. 28.8 8.4 16.6 8.8 14.8 7.0 .8 6.3 8.528Services 332 981......................................... 41.6 7.9 11.8 6.8 8.0 3.3 2.7 9.0 8.829Industries not classified 39 363............................ 36.5 6.7 11.4 6.1 7.9 4.6 1.7 14.1 11.130
Other minority ~owned businesses 606 426.......... 28.1 9.1 16.0 9.4 10.3 4.6 3.1 5.7 13.731
Agricultural services, forestry, fishing, and mining 15 218..... 33.6 8.1 9.4 4.8 10.4 5.4 3.6 9.3 15.432Construction 28 295..................................... 31.8 4.4 17.3 9.3 12.0 8.1 3.5 4.4 9.133Manufacturing 18 976.................................... 25.7 7.8 19.3 7.8 14.1 3.9 1.3 3.6 16.434Transportation, communications, and utilities 24 362......... 23.3 7.9 12.8 2.8 13.1 3.3 2.5 7.5 26.935Wholesale trade 20 043.................................. 22.6 8.6 18.2 13.6 14.2 4.8 .9 5.3 11.736
Retail trade 132 483...................................... 27.8 9.8 18.1 9.6 9.2 4.6 3.4 4.0 13.537Finance, insurance, and real estate 64 762................. 21.5 7.2 19.1 8.5 11.2 7.7 2.3 7.5 15.138Services 273 774......................................... 30.9 9.8 14.1 10.3 9.5 3.4 3.6 5.9 12.539Industries not classified 28 512............................ 32.1 14.1 12.2 8.0 8.9 2.3 3.0 6.3 13.140
Women ~owned businesses 5 888 883................. 36.0 7.9 13.2 9.0 10.2 5.8 2.5 6.5 9.041
Agricultural services, forestry, fishing, and mining 119 731..... 35.4 5.1 12.9 7.3 9.6 6.8 1.5 6.8 14.642Construction 183 695..................................... 33.8 8.2 15.0 11.4 7.5 5.7 4.3 6.4 7.643Manufacturing 152 346.................................... 34.5 7.0 11.8 10.2 11.9 5.5 1.7 5.4 12.044Transportation, communications, and utilities 141 623......... 38.5 9.5 12.3 8.5 10.5 5.0 3.4 5.3 7.045Wholesale trade 154 542.................................. 23.8 6.6 13.1 11.3 17.1 9.7 4.3 5.1 9.146
Retail trade 1 093 342...................................... 35.1 7.2 15.5 6.9 12.2 4.4 1.9 6.4 10.347Finance, insurance, and real estate 602 802................. 28.9 6.5 12.0 8.2 13.9 11.5 2.5 6.4 10.148Services 3 158 444......................................... 39.0 8.7 12.7 9.9 8.0 4.8 2.6 6.2 8.049Industries not classified 282 358............................ 38.1 7.1 12.5 6.6 10.6 2.3 2.2 11.9 8.650
Nonminority male ~owned businesses 10 114 456....... 32.7 7.9 14.2 9.0 12.3 10.0 2.3 5.1 6.351
Agricultural services, forestry, fishing, and mining 412 917..... 36.3 8.0 11.0 11.6 9.6 4.8 4.2 7.2 7.252Construction 1 496 056..................................... 47.1 7.9 17.4 5.7 6.9 6.6 2.2 2.6 3.753Manufacturing 333 485.................................... 37.7 5.2 9.4 10.8 15.7 10.5 3.5 4.2 3.154Transportation, communications, and utilities 458 400......... 41.5 7.1 10.8 5.7 8.4 9.8 2.4 8.3 6.155Wholesale trade 352 721.................................. 24.0 8.6 15.5 13.0 17.0 9.5 2.8 4.7 4.856
Retail trade 1 197 943...................................... 27.9 10.8 15.5 10.2 12.5 7.5 2.5 5.5 7.657Finance, insurance, and real estate 1 240 594................. 18.9 5.2 12.6 10.7 15.7 20.6 2.7 4.8 8.758Services 4 102 294......................................... 34.5 8.7 14.8 8.2 12.6 8.2 2.1 4.8 6.259Industries not classified 520 046............................ 34.4 7.2 11.4 11.8 11.5 5.7 .4 11.2 6.660
1Data represent percentage of owners reporting in the designated categories.2Includes owners who had no previous work experience prior to starting/acquiring their businesses.3For explanation of relative standard errors and standard errors, see Reliability of Estimates in the introductory text.4Relative standard errors are not applicable for lines 1 through 10 since these data are the result of censuses, not surveys.
94 CHARACTERISTICS OF BUSINESS OWNERS 1992 ECONOMIC CENSUS
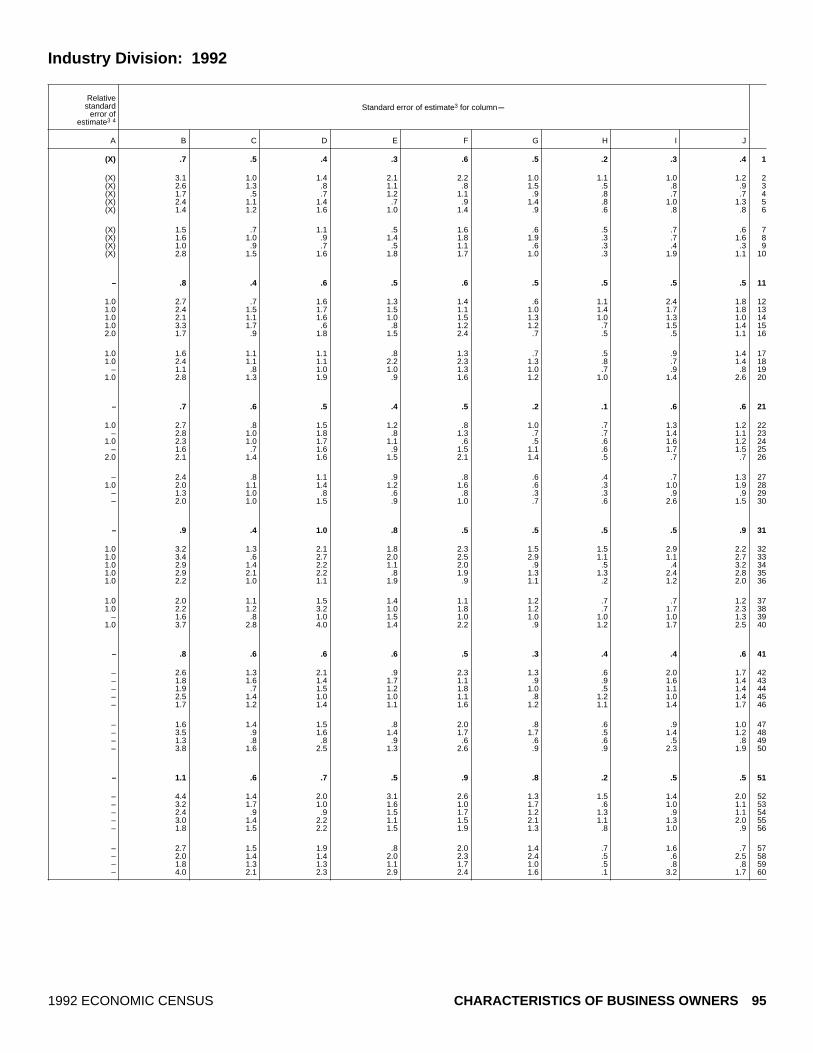
Industry Division: 1992
Standard error of estimate3 for columnmRelative
standarderror of
estimate3 4
A B C D E F G H I J
(X) .7 .5 .4 .3 .6 .5 .2 .3 .4 1
(X) 3.1 1.0 1.4 2.1 2.2 1.0 1.1 1.0 1.2 2(X) 2.6 1.3 .8 1.1 .8 1.5 .5 .8 .9 3(X) 1.7 .5 .7 1.2 1.1 .9 .8 .7 .7 4(X) 2.4 1.1 1.4 .7 .9 1.4 .8 1.0 1.3 5(X) 1.4 1.2 1.6 1.0 1.4 .9 .6 .8 .8 6
(X) 1.5 .7 1.1 .5 1.6 .6 .5 .7 .6 7(X) 1.6 1.0 .9 1.4 1.8 1.9 .3 .7 1.6 8(X) 1.0 .9 .7 .5 1.1 .6 .3 .4 .3 9(X) 2.8 1.5 1.6 1.8 1.7 1.0 .3 1.9 1.1 10
– .8 .4 .6 .5 .6 .5 .5 .5 .5 11
1.0 2.7 .7 1.6 1.3 1.4 .6 1.1 2.4 1.8 121.0 2.4 1.5 1.7 1.5 1.1 1.0 1.4 1.7 1.8 131.0 2.1 1.1 1.6 1.0 1.5 1.3 1.0 1.3 1.0 141.0 3.3 1.7 .6 .8 1.2 1.2 .7 1.5 1.4 152.0 1.7 .9 1.8 1.5 2.4 .7 .5 .5 1.1 16
1.0 1.6 1.1 1.1 .8 1.3 .7 .5 .9 1.4 171.0 2.4 1.1 1.1 2.2 2.3 1.3 .8 .7 1.4 18
– 1.1 .8 1.0 1.0 1.3 1.0 .7 .9 .8 191.0 2.8 1.3 1.9 .9 1.6 1.2 1.0 1.4 2.6 20
– .7 .6 .5 .4 .5 .2 .1 .6 .6 21
1.0 2.7 .8 1.5 1.2 .8 1.0 .7 1.3 1.2 22– 2.8 1.0 1.8 .8 1.3 .7 .7 1.4 1.1 23
1.0 2.3 1.0 1.7 1.1 .6 .5 .6 1.6 1.2 24– 1.6 .7 1.6 .9 1.5 1.1 .6 1.7 1.5 25
2.0 2.1 1.4 1.6 1.5 2.1 1.4 .5 .7 .7 26
– 2.4 .8 1.1 .9 .8 .6 .4 .7 1.3 271.0 2.0 1.1 1.4 1.2 1.6 .6 .3 1.0 1.9 28
– 1.3 1.0 .8 .6 .8 .3 .3 .9 .9 29– 2.0 1.0 1.5 .9 1.0 .7 .6 2.6 1.5 30
– .9 .4 1.0 .8 .5 .5 .5 .5 .9 31
1.0 3.2 1.3 2.1 1.8 2.3 1.5 1.5 2.9 2.2 321.0 3.4 .6 2.7 2.0 2.5 2.9 1.1 1.1 2.7 331.0 2.9 1.4 2.2 1.1 2.0 .9 .5 .4 3.2 341.0 2.9 2.1 2.2 .8 1.9 1.3 1.3 2.4 2.8 351.0 2.2 1.0 1.1 1.9 .9 1.1 .2 1.2 2.0 36
1.0 2.0 1.1 1.5 1.4 1.1 1.2 .7 .7 1.2 371.0 2.2 1.2 3.2 1.0 1.8 1.2 .7 1.7 2.3 38
– 1.6 .8 1.0 1.5 1.0 1.0 1.0 1.0 1.3 391.0 3.7 2.8 4.0 1.4 2.2 .9 1.2 1.7 2.5 40
– .8 .6 .6 .6 .5 .3 .4 .4 .6 41
– 2.6 1.3 2.1 .9 2.3 1.3 .6 2.0 1.7 42– 1.8 1.6 1.4 1.7 1.1 .9 .9 1.6 1.4 43– 1.9 .7 1.5 1.2 1.8 1.0 .5 1.1 1.4 44– 2.5 1.4 1.0 1.0 1.1 .8 1.2 1.0 1.4 45– 1.7 1.2 1.4 1.1 1.6 1.2 1.1 1.4 1.7 46
– 1.6 1.4 1.5 .8 2.0 .8 .6 .9 1.0 47– 3.5 .9 1.6 1.4 1.7 1.7 .5 1.4 1.2 48– 1.3 .8 .8 .9 .6 .6 .6 .5 .8 49– 3.8 1.6 2.5 1.3 2.6 .9 .9 2.3 1.9 50
– 1.1 .6 .7 .5 .9 .8 .2 .5 .5 51
– 4.4 1.4 2.0 3.1 2.6 1.3 1.5 1.4 2.0 52– 3.2 1.7 1.0 1.6 1.0 1.7 .6 1.0 1.1 53– 2.4 .9 .9 1.5 1.7 1.2 1.3 .9 1.1 54– 3.0 1.4 2.2 1.1 1.5 2.1 1.1 1.3 2.0 55– 1.8 1.5 2.2 1.5 1.9 1.3 .8 1.0 .9 56
– 2.7 1.5 1.9 .8 2.0 1.4 .7 1.6 .7 57– 2.0 1.4 1.4 2.0 2.3 2.4 .5 .6 2.5 58– 1.8 1.3 1.3 1.1 1.7 1.0 .5 .8 .8 59– 4.0 2.1 2.3 2.9 2.4 1.6 .1 3.2 1.7 60
1992 ECONOMIC CENSUS CHARACTERISTICS OF BUSINESS OWNERS 95

Table 11b. Owner’s Managerial Work Experience Prior to Beginning/Acquiring the Business by[All data are shown as percents, except firms. For meaning of abbreviations and symbols, see introductory text. For explanation of terms, see appendix A]
Type of firm and receipts size
Years of experience working in a managerial capacity1
Firms(number) None
Lessthan 2 2 to 5 6 to 9 10 to 19
20 ormore
Notsure
Notreported
Notapplicable2
A B C D E F G H I J
All businesses 17 253 143............................. 33.9 8.0 13.8 9.0 11.4 8.2 2.4 5.7 7.61
Less than $5,000 5 226 553................................. 37.1 8.9 11.3 6.4 9.5 6.7 2.1 7.9 9.92$5,000 to $9,999 2 443 946................................. 37.2 7.9 12.9 9.7 7.4 7.7 1.9 6.8 8.53$10,000 to $24,999 3 076 410............................... 36.7 7.8 15.2 8.3 10.5 7.0 3.3 4.4 6.84$25,000 to $49,999 1 945 806............................... 36.8 8.3 13.6 8.8 11.6 7.9 2.3 4.8 5.95$50,000 to $99,999 1 615 940............................... 33.3 6.7 15.7 10.2 13.2 9.1 2.2 4.2 5.46
$100,000 to $199,999 1 197 996............................. 29.0 7.5 15.5 11.0 14.1 10.9 2.2 4.0 5.77$200,000 to $249,999 301 794............................. 27.5 8.6 16.2 9.8 11.0 10.1 2.1 1.8 12.88$250,000 to $499,999 682 583............................. 26.4 7.7 15.5 11.3 15.6 9.2 2.6 5.3 6.59$500,000 to $999,999 372 078............................. 23.5 7.3 14.7 12.1 15.9 12.1 3.1 5.2 6.110$1,000,000 or more 390 037............................... 18.5 7.0 15.8 12.4 18.8 11.5 3.4 5.7 6.911
Hispanic ~owned businesses 771 708................ 35.1 7.9 12.6 7.9 9.3 4.5 2.9 7.0 12.812
Less than $5,000 219 226................................. 37.2 9.3 10.2 5.1 5.3 3.7 2.7 8.7 17.713$5,000 to $9,999 140 362................................. 35.1 8.3 11.4 8.1 6.7 3.2 1.8 10.6 15.014$10,000 to $24,999 165 667............................... 39.2 5.8 10.5 6.6 9.2 5.0 3.0 7.0 13.715$25,000 to $49,999 87 288............................... 37.8 6.1 14.4 7.7 10.3 3.0 2.8 6.0 11.816$50,000 to $99,999 64 742............................... 36.7 8.4 13.7 8.7 10.3 5.1 3.6 4.8 8.717
$100,000 to $199,999 41 578............................. 30.4 10.2 16.0 11.1 14.0 4.0 2.4 4.1 7.918$200,000 to $249,999 10 030............................. 32.8 8.3 13.4 11.2 10.7 5.6 3.2 4.0 10.819$250,000 to $499,999 22 301............................. 23.2 8.5 16.7 12.3 13.9 7.8 4.3 4.6 8.620$500,000 to $999,999 11 319............................. 24.0 9.0 17.4 10.8 13.1 7.4 4.6 6.2 7.621$1,000,000 or more 9 194............................... 21.2 8.6 16.3 12.9 18.6 8.2 2.4 5.2 6.822
Black ~owned businesses 620 912................... 40.6 7.4 12.1 6.7 8.3 3.6 2.4 9.1 9.723
Less than $5,000 236 722................................. 41.3 7.9 9.8 5.9 7.4 2.8 2.2 12.0 10.724$5,000 to $9,999 111 512................................. 38.7 6.5 13.8 6.7 6.9 3.2 1.1 11.4 11.825$10,000 to $24,999 129 901............................... 42.7 7.1 12.2 6.4 7.8 3.7 3.2 7.9 9.026$25,000 to $49,999 62 209............................... 42.4 7.7 14.0 7.0 10.3 3.8 1.6 4.7 8.527$50,000 to $99,999 39 218............................... 43.8 7.6 12.9 7.0 9.7 3.7 4.3 4.6 6.528
$100,000 to $199,999 20 936............................. 33.8 7.1 14.7 9.0 14.8 5.3 4.6 3.4 7.429$200,000 to $249,999 4 533............................. 41.1 6.1 18.1 9.1 6.1 7.3 2.0 5.5 4.930$250,000 to $499,999 9 029............................. 32.9 8.8 16.3 12.6 11.4 6.3 1.7 3.7 6.231$500,000 to $999,999 3 823............................. 25.3 7.4 14.7 11.1 16.1 12.7 3.5 4.0 5.232$1,000,000 or more 3 028............................... 17.3 8.0 11.1 13.6 20.4 8.2 3.7 7.4 10.433
Other minority ~owned businesses 606 426.......... 28.1 9.1 16.0 9.4 10.3 4.6 3.1 5.7 13.734
Less than $5,000 132 493................................. 37.7 9.4 15.6 6.5 8.2 2.5 1.6 4.6 14.035$5,000 to $9,999 80 435................................. 29.3 9.1 12.7 7.8 8.6 4.8 3.2 6.4 18.036$10,000 to $24,999 108 195............................... 25.9 7.9 16.8 9.9 11.3 2.7 5.1 8.9 11.537$25,000 to $49,999 77 345............................... 32.9 5.9 12.3 9.6 11.4 4.0 3.6 4.0 16.338$50,000 to $99,999 70 360............................... 23.2 9.6 17.4 13.0 8.2 4.9 3.1 4.7 15.839
$100,000 to $199,999 58 620............................. 26.4 11.2 18.7 6.6 9.0 5.4 3.3 6.1 13.340$200,000 to $249,999 15 740............................. 24.3 13.7 15.4 14.0 10.6 7.1 .6 4.9 9.341$250,000 to $499,999 34 266............................. 26.2 10.4 16.9 8.5 12.5 6.7 3.1 4.1 11.542$500,000 to $999,999 16 467............................. 21.1 9.6 17.9 11.3 13.9 5.8 2.9 7.4 10.043$1,000,000 or more 12 505............................... 16.3 6.9 19.4 12.9 15.3 9.2 2.7 9.0 8.444
Women ~owned businesses 5 888 883................. 36.0 7.9 13.2 9.0 10.2 5.8 2.5 6.5 9.045
Less than $5,000 2 310 303................................. 37.3 9.6 13.0 7.8 7.8 4.5 1.5 8.9 9.746$5,000 to $9,999 967 380................................. 39.9 6.7 12.3 10.4 6.0 5.8 1.6 6.0 11.447$10,000 to $24,999 1 051 358............................... 38.6 6.3 13.7 7.2 13.0 4.4 3.3 6.1 7.548$25,000 to $49,999 538 885............................... 39.1 8.7 10.3 8.2 10.6 5.1 4.4 4.5 9.049$50,000 to $99,999 381 517............................... 31.7 6.6 12.7 11.8 12.5 7.5 3.6 6.8 6.950
$100,000 to $199,999 267 089............................. 30.0 7.1 15.5 11.5 13.8 10.2 3.0 2.5 6.451$200,000 to $249,999 66 464............................. 26.6 7.6 14.2 14.5 11.0 12.5 3.2 3.8 6.752$250,000 to $499,999 146 313............................. 27.8 6.8 17.4 9.4 15.0 9.0 2.7 3.5 8.453$500,000 to $999,999 80 539............................. 25.6 8.6 15.9 12.4 15.0 7.5 3.0 4.1 8.054$1,000,000 or more 79 037............................... 22.0 7.6 15.1 11.3 15.3 8.2 2.9 5.9 11.755
Nonminority male ~owned businesses 10 114 456....... 32.7 7.9 14.2 9.0 12.3 10.0 2.3 5.1 6.356
Less than $5,000 2 608 047................................. 36.9 8.4 10.2 5.4 11.1 8.8 2.5 7.1 9.857$5,000 to $9,999 1 285 456................................. 35.8 8.7 13.6 9.1 8.2 9.8 2.3 6.9 5.758$10,000 to $24,999 1 763 830............................... 35.3 8.9 16.8 9.2 8.8 9.3 3.3 2.7 5.859$25,000 to $49,999 1 248 482............................... 35.9 8.2 14.9 9.2 12.2 9.8 1.3 4.9 3.660$50,000 to $99,999 1 108 065............................... 33.9 6.5 16.8 9.7 13.9 10.2 1.6 3.2 4.261
$100,000 to $199,999 840 723............................. 28.5 7.4 15.3 11.1 14.5 11.9 1.9 4.5 4.862$200,000 to $249,999 212 693............................. 27.7 8.5 17.1 7.7 11.2 9.5 1.8 .7 15.863$250,000 to $499,999 488 462............................. 25.9 7.7 14.6 12.1 16.3 9.5 2.4 6.0 5.564$500,000 to $999,999 266 408............................. 23.0 6.8 14.2 12.1 16.4 14.0 3.1 5.3 5.265$1,000,000 or more 292 290............................... 17.6 6.7 15.9 12.7 19.8 12.5 3.6 5.5 5.766
1Data represent percentage of owners reporting in the designated categories.2Includes owners who had no previous work experience prior to starting/acquiring their businesses.3For explanation of relative standard errors and standard errors, see Reliability of Estimates in the introductory text.4Relative standard errors are not applicable for lines 1 through 11 since these data are the result of censuses, not surveys.
96 CHARACTERISTICS OF BUSINESS OWNERS 1992 ECONOMIC CENSUS

Receipts Size of Firm: 1992
Standard error of estimate3 for columnmRelative
standarderror of
estimate3 4
A B C D E F G H I J
(X) .7 .5 .4 .3 .6 .5 .2 .3 .4 1
(X) 1.1 1.1 .8 .8 1.3 .9 .4 .8 .8 2(X) 2.4 1.7 1.6 1.4 1.9 1.8 .8 1.2 1.5 3(X) 2.6 1.2 1.2 1.0 1.6 1.5 .7 .4 .8 4(X) 2.1 1.7 1.8 1.5 1.6 1.3 .6 1.1 1.2 5(X) 1.8 .7 .7 1.2 1.0 1.6 .4 .8 .9 6
(X) 1.1 .9 1.3 .8 1.3 1.1 .4 .5 .4 7(X) 2.4 1.4 2.1 2.0 2.0 2.4 1.2 .4 4.6 8(X) 1.6 .7 1.0 1.0 1.1 .8 .2 1.0 .8 9(X) .9 .5 .7 .7 .9 .9 .3 .5 .5 10(X) .7 .4 .4 .5 .6 .7 .2 .4 .4 11
– .8 .4 .6 .5 .6 .5 .5 .5 .5 12
1.0 1.8 1.3 1.9 1.0 1.1 1.2 .8 1.4 1.5 131.0 2.4 1.5 1.9 1.7 1.8 2.0 .7 1.5 1.9 141.0 2.5 1.4 1.3 .8 1.5 1.3 1.2 1.0 1.0 151.0 3.2 1.6 2.8 2.7 1.5 1.0 .9 1.7 1.6 161.0 2.6 1.5 1.0 1.7 1.4 .6 1.1 1.0 1.4 17
1.0 2.1 1.6 1.1 1.0 1.6 .7 .6 .9 1.1 183.0 4.9 2.0 2.8 2.8 1.9 1.9 1.7 1.6 3.2 192.0 1.0 .9 1.3 1.6 1.2 1.6 1.1 .8 1.1 203.0 2.0 2.0 1.1 1.5 1.6 1.1 1.1 1.4 1.4 212.0 1.3 1.3 1.4 1.0 1.0 .9 .4 .8 1.0 22
– .7 .6 .5 .4 .5 .2 .1 .6 .6 23
– 1.6 .9 .8 .9 .6 .6 .3 1.3 .8 24– 2.0 1.1 .9 1.2 .9 .5 .3 1.2 2.4 25– 1.6 .9 1.7 .7 1.0 .6 .6 .8 1.2 26– 2.9 1.6 1.4 1.8 2.4 1.1 .5 1.5 1.3 27
1.0 2.4 1.0 1.6 1.3 1.2 1.0 1.0 .9 1.0 28
1.0 2.4 .8 2.0 1.2 2.0 1.0 .7 .7 1.4 293.0 3.8 2.0 3.2 2.3 1.3 2.0 1.4 1.0 1.2 303.0 3.0 1.3 2.6 1.2 1.3 1.6 .3 .8 .7 314.0 2.8 2.1 2.0 1.5 2.9 2.8 1.0 2.3 2.4 324.0 1.5 1.9 .9 1.2 2.7 1.3 .9 1.5 3.3 33
– .9 .4 1.0 .8 .5 .5 .5 .5 .9 34
1.0 3.7 1.9 4.1 1.2 2.4 .7 .6 1.4 1.3 351.0 4.5 2.6 2.8 2.4 2.1 1.3 1.4 2.2 3.8 361.0 2.9 1.8 2.0 2.6 1.4 1.2 1.8 2.7 2.3 371.0 4.6 1.8 2.3 2.5 2.6 1.7 1.3 1.3 3.8 381.0 2.6 1.5 1.4 1.5 1.2 1.5 .9 .8 2.3 39
1.0 2.0 1.2 1.2 .8 1.5 1.7 1.0 1.4 .8 402.0 3.1 3.4 2.3 2.3 2.0 2.8 .4 1.4 1.7 411.0 1.6 1.8 1.7 .9 1.2 .8 .4 .6 .8 422.0 1.8 .9 1.7 1.3 1.2 1.0 .7 1.8 .7 432.0 .9 .8 1.1 .8 .9 1.2 .5 .8 .8 44
– .8 .6 .6 .6 .5 .3 .4 .4 .6 45
– 2.2 1.1 .7 1.0 1.1 .7 .6 1.1 1.0 46– 2.3 1.1 1.7 1.5 1.8 1.1 1.0 1.0 2.3 47– 3.3 1.4 1.6 1.2 2.1 .7 1.2 .7 .9 48– 2.4 2.7 2.6 1.8 2.2 1.5 1.6 1.4 2.5 49– 2.0 .8 1.6 1.4 1.4 1.2 .7 1.9 1.3 50
– 2.8 .6 2.1 1.1 1.4 1.6 .9 .8 .7 511.0 4.2 2.7 2.0 5.4 2.0 3.0 1.5 1.2 2.0 521.0 1.0 1.0 1.4 .9 .6 .8 .4 .5 1.2 531.0 1.2 .6 .9 .9 1.2 1.0 .7 .7 .9 541.0 1.0 .8 .8 .4 .8 .4 .4 .5 .8 55
– 1.1 .6 .7 .5 .9 .8 .2 .5 .5 56
– 1.9 1.5 1.6 1.1 2.1 1.5 .4 1.1 1.1 57– 3.4 2.7 3.3 2.3 2.7 3.7 .8 1.9 1.8 58– 3.3 1.9 1.9 1.8 2.1 2.6 .8 .9 1.7 59– 3.5 2.5 2.6 1.9 2.3 2.0 .6 1.4 1.1 60– 3.0 1.0 1.1 1.4 1.7 2.3 .4 .8 1.0 61
– 1.3 1.4 1.7 1.2 1.7 1.3 .5 .9 .6 62– 3.5 2.4 3.1 2.1 2.7 3.7 1.6 .4 5.8 63– 2.2 .9 1.5 1.5 1.5 1.0 .3 1.4 1.2 64– 1.4 .7 .8 .8 1.2 1.2 .5 .7 .7 65– .9 .5 .4 .7 .9 .8 .2 .5 .5 66
1992 ECONOMIC CENSUS CHARACTERISTICS OF BUSINESS OWNERS 97

Table 11c. Owner’s Managerial Work Experience Prior to Beginning/Acquiring the Business by[All data are shown as percents, except firms. For meaning of abbreviations and symbols, see introductory text. For explanation of terms, see appendix A]
Type of firm and employment size
Years of experience working in a managerial capacity1
Firms(number) None
Lessthan 2 2 to 5 6 to 9 10 to 19
20 ormore
Notsure
Notreported
Notapplicable2
A B C D E F G H I J
All businesses 17 253 143............................. 33.9 8.0 13.8 9.0 11.4 8.2 2.4 5.7 7.61
With no paid employees 14 118 184........................... 35.6 7.8 13.0 8.3 10.7 8.1 2.4 6.0 8.12With paid employees 3 134 959.............................. 28.0 8.6 16.6 11.2 13.8 8.5 2.8 4.6 6.03
No employees5 435 838................................. 25.6 8.5 18.0 12.2 16.8 8.1 3.9 3.5 3.441 to 4 employees 1 716 076............................... 33.0 9.2 16.1 10.1 11.3 7.5 2.4 4.2 6.155 to 9 employees 503 808............................... 27.3 8.5 16.2 11.4 13.5 8.6 2.5 5.3 6.7610 to 19 employees 256 110............................. 22.5 8.3 17.5 12.3 15.3 9.6 3.1 4.4 6.9720 to 49 employees 144 734............................. 17.1 6.9 17.9 13.1 19.2 11.3 3.8 5.6 5.1850 to 99 employees 45 331............................. 15.0 7.5 16.1 13.4 21.9 12.2 1.7 5.2 6.99100 employees or more 33 062......................... 15.5 4.4 14.0 12.1 21.2 12.6 3.9 7.9 8.410
Hispanic ~owned businesses 771 708................ 35.1 7.9 12.6 7.9 9.3 4.5 2.9 7.0 12.811
With no paid employees 656 343........................... 37.4 7.7 11.6 6.8 8.1 4.2 2.5 7.6 14.012With paid employees 115 364.............................. 27.7 8.6 15.8 11.3 13.1 5.3 4.0 5.2 8.913
No employees5 19 569................................. 21.9 7.4 13.3 14.6 19.3 6.4 5.5 5.7 5.9141 to 4 employees 64 631............................... 30.8 9.2 16.5 9.3 9.6 4.7 3.5 5.8 10.6155 to 9 employees 16 937............................... 28.2 9.2 16.3 11.8 14.6 5.0 4.0 4.3 6.51610 to 19 employees 8 553............................. 27.7 7.0 14.8 12.5 13.2 5.9 5.6 3.9 9.41720 to 49 employees 4 050............................. 18.4 9.9 16.5 13.1 18.3 7.4 2.0 4.5 10.01850 to 99 employees 948............................. 18.6 6.2 15.6 16.4 24.4 6.1 1.4 2.7 8.719100 employees or more 676......................... 13.6 4.5 15.9 24.2 22.7 6.4 2.5 5.8 4.420
Black ~owned businesses 620 912................... 40.6 7.4 12.1 6.7 8.3 3.6 2.4 9.1 9.721
With no paid employees 556 434........................... 41.2 7.2 11.7 6.4 7.7 3.5 2.3 9.7 10.322With paid employees 64 478.............................. 36.8 8.9 14.7 9.2 12.9 4.1 3.0 4.8 5.623
No employees5 13 725................................. 37.2 12.8 16.0 8.2 7.5 4.3 4.7 7.1 2.1241 to 4 employees 37 587............................... 38.3 8.1 14.1 8.8 13.9 3.1 2.3 4.2 7.0255 to 9 employees 7 853............................... 36.7 6.5 16.8 10.6 12.5 4.9 2.9 3.8 5.32610 to 19 employees 2 839............................. 37.7 7.3 15.4 9.1 11.8 6.8 2.6 2.8 6.42720 to 49 employees 1 700............................. 17.8 8.8 10.0 13.1 22.7 9.3 5.7 8.0 4.72850 to 99 employees 432............................. 18.6 8.5 12.7 22.0 24.8 8.2 .7 1.5 3.029100 employees or more 342......................... 20.9 16.0 10.7 9.6 23.8 6.7 2.4 8.7 1.230
Other minority ~owned businesses 606 426.......... 28.1 9.1 16.0 9.4 10.3 4.6 3.1 5.7 13.731
With no paid employees 470 075........................... 30.7 8.3 15.0 9.1 9.5 4.0 3.3 5.3 14.832With paid employees 136 351.............................. 22.8 10.7 18.0 9.9 11.8 6.1 2.7 6.6 11.433
No employees5 19 989................................. 15.7 12.2 20.8 8.4 15.6 7.0 .9 4.3 15.2341 to 4 employees 76 636............................... 24.6 10.8 17.4 9.6 9.5 5.7 2.8 7.7 11.8355 to 9 employees 22 862............................... 24.8 12.7 17.2 9.2 11.9 4.5 3.4 4.8 11.53610 to 19 employees 10 051............................. 25.3 7.7 17.8 11.6 15.3 5.9 3.3 3.9 9.23720 to 49 employees 5 034............................. 14.4 9.9 21.8 13.4 15.0 9.4 1.8 7.6 6.73850 to 99 employees 1 075............................. 14.5 4.0 15.9 12.9 19.0 9.8 1.6 15.9 6.539100 employees or more 705......................... 12.3 2.0 14.5 11.2 14.8 13.5 1.7 19.8 10.340
Women ~owned businesses 5 888 883................. 36.0 7.9 13.2 9.0 10.2 5.8 2.5 6.5 9.041
With no paid employees 5 071 110........................... 37.8 7.7 12.7 8.3 9.5 5.3 2.2 7.2 9.442With paid employees 817 773.............................. 28.7 8.4 15.4 12.0 13.0 7.6 4.0 3.7 7.243
No employees5 127 905................................. 28.0 9.0 11.7 15.5 13.0 7.2 9.4 2.6 3.6441 to 4 employees 435 550............................... 30.3 8.5 14.3 12.1 12.9 7.3 3.6 3.8 7.2455 to 9 employees 134 476............................... 29.0 8.2 18.9 11.4 12.3 7.3 2.7 2.8 7.44610 to 19 employees 67 487............................. 30.0 8.4 15.2 8.9 11.8 11.1 2.3 3.8 8.54720 to 49 employees 35 515............................. 18.9 8.7 21.7 11.6 16.6 5.7 3.4 5.2 8.24850 to 99 employees 10 178............................. 20.1 8.9 13.2 12.9 18.5 7.5 1.7 7.3 9.949100 employees or more 6 663......................... 19.3 5.2 15.5 14.3 14.1 8.3 1.9 5.8 15.650
Nonminority male ~owned businesses 10 114 456....... 32.7 7.9 14.2 9.0 12.3 10.0 2.3 5.1 6.351
With no paid employees 8 019 462........................... 34.4 7.7 13.3 8.3 11.6 10.3 2.4 5.2 6.852With paid employees 2 094 993.............................. 27.9 8.5 17.0 10.9 14.4 9.3 2.2 4.7 5.053
No employees5 271 380................................. 25.0 7.8 21.1 10.5 19.3 9.1 .9 3.7 2.6541 to 4 employees 1 155 800............................... 34.7 9.5 16.8 9.5 11.0 8.0 1.7 4.0 4.9555 to 9 employees 334 483............................... 26.6 8.3 15.0 11.6 14.0 9.7 2.3 6.4 6.15610 to 19 employees 173 140............................. 19.3 8.4 18.5 13.6 16.7 9.4 3.2 4.8 6.15720 to 49 employees 101 938............................. 16.7 6.3 16.6 13.5 20.2 13.1 4.1 5.7 3.95850 to 99 employees 33 406............................. 13.7 7.4 16.8 13.6 22.8 13.5 1.7 4.5 6.159100 employees or more 24 846......................... 14.5 4.1 13.4 11.3 23.5 14.0 4.6 8.2 6.460
1Data represent percentage of owners reporting in the designated categories.2Includes owners who had no previous work experience prior to starting/acquiring their businesses.3For explanation of relative standard errors and standard errors, see Reliability of Estimates in the introductory text.4Relative standard errors are not applicable for lines 1 through 10 since these data are the result of censuses, not surveys.5Firms reported annual payroll, but did not report any employees on their payroll during specified period in 1992.
98 CHARACTERISTICS OF BUSINESS OWNERS 1992 ECONOMIC CENSUS
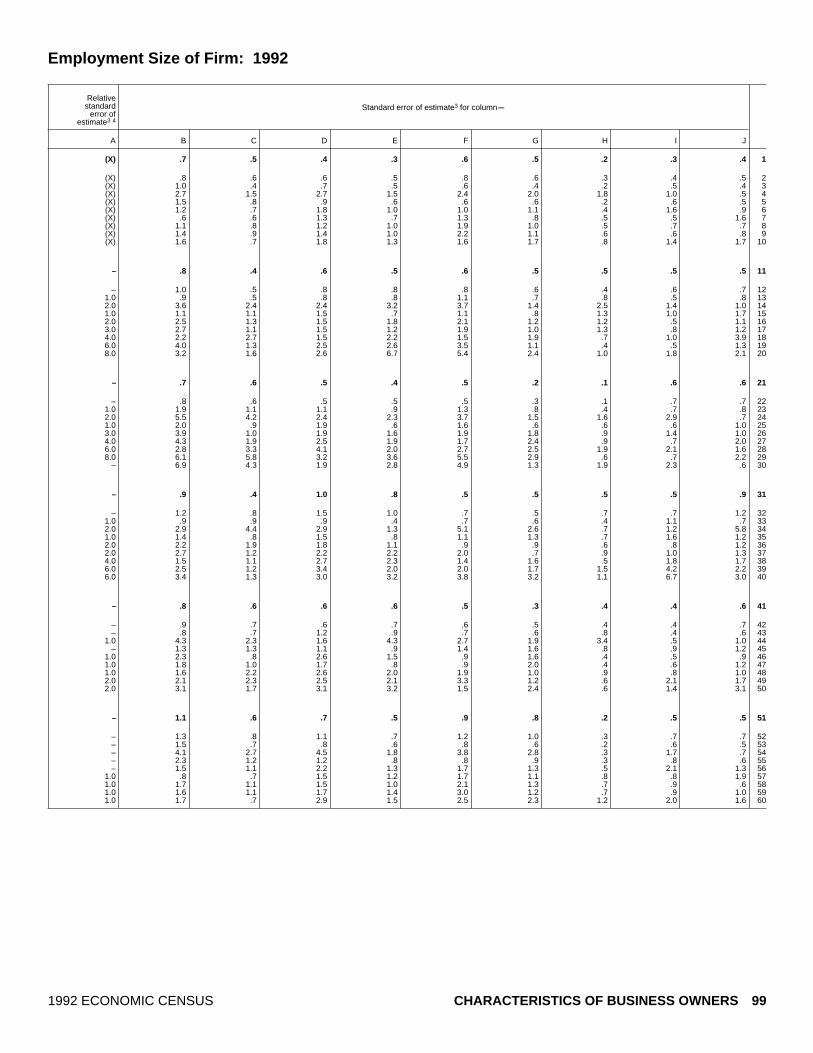
Employment Size of Firm: 1992
Standard error of estimate3 for columnmRelative
standarderror of
estimate3 4
A B C D E F G H I J
(X) .7 .5 .4 .3 .6 .5 .2 .3 .4 1
(X) .8 .6 .6 .5 .8 .6 .3 .4 .5 2(X) 1.0 .4 .7 .5 .6 .4 .2 .5 .4 3(X) 2.7 1.5 2.7 1.5 2.4 2.0 1.8 1.0 .5 4(X) 1.5 .8 .9 .6 .6 .6 .2 .6 .5 5(X) 1.2 .7 1.8 1.0 1.0 1.1 .4 1.6 .9 6(X) .6 .6 1.3 .7 1.3 .8 .5 .5 1.6 7(X) 1.1 .8 1.2 1.0 1.9 1.0 .5 .7 .7 8(X) 1.4 .9 1.4 1.0 2.2 1.1 .6 .6 .8 9(X) 1.6 .7 1.8 1.3 1.6 1.7 .8 1.4 1.7 10
– .8 .4 .6 .5 .6 .5 .5 .5 .5 11
– 1.0 .5 .8 .8 .8 .6 .4 .6 .7 121.0 .9 .5 .8 .8 1.1 .7 .8 .5 .8 132.0 3.6 2.4 2.4 3.2 3.7 1.4 2.5 1.4 1.0 141.0 1.1 1.1 1.5 .7 1.1 .8 1.3 1.0 1.7 152.0 2.5 1.3 1.5 1.8 2.1 1.2 1.2 .5 1.1 163.0 2.7 1.1 1.5 1.2 1.9 1.0 1.3 .8 1.2 174.0 2.2 2.7 1.5 2.2 1.5 1.9 .7 1.0 3.9 186.0 4.0 1.3 2.5 2.6 3.5 1.1 .4 .5 1.3 198.0 3.2 1.6 2.6 6.7 5.4 2.4 1.0 1.8 2.1 20
– .7 .6 .5 .4 .5 .2 .1 .6 .6 21
– .8 .6 .5 .5 .5 .3 .1 .7 .7 221.0 1.9 1.1 1.1 .9 1.3 .8 .4 .7 .8 232.0 5.5 4.2 2.4 2.3 3.7 1.5 1.6 2.9 .7 241.0 2.0 .9 1.9 .6 1.6 .6 .6 .6 1.0 253.0 3.9 1.0 1.9 1.6 1.9 1.8 .9 1.4 1.0 264.0 4.3 1.9 2.5 1.9 1.7 2.4 .9 .7 2.0 276.0 2.8 3.3 4.1 2.0 2.7 2.5 1.9 2.1 1.6 288.0 6.1 5.8 3.2 3.6 5.5 2.9 .6 .7 2.2 29
– 6.9 4.3 1.9 2.8 4.9 1.3 1.9 2.3 .6 30
– .9 .4 1.0 .8 .5 .5 .5 .5 .9 31
– 1.2 .8 1.5 1.0 .7 .5 .7 .7 1.2 321.0 .9 .9 .9 .4 .7 .6 .4 1.1 .7 332.0 2.9 4.4 2.9 1.3 5.1 2.6 .7 1.2 5.8 341.0 1.4 .8 1.5 .8 1.1 1.3 .7 1.6 1.2 352.0 2.2 1.9 1.8 1.1 .9 .9 .6 .8 1.2 362.0 2.7 1.2 2.2 2.2 2.0 .7 .9 1.0 1.3 374.0 1.5 1.1 2.7 2.3 1.4 1.6 .5 1.8 1.7 386.0 2.5 1.2 3.4 2.0 2.0 1.7 1.5 4.2 2.2 396.0 3.4 1.3 3.0 3.2 3.8 3.2 1.1 6.7 3.0 40
– .8 .6 .6 .6 .5 .3 .4 .4 .6 41
– .9 .7 .6 .7 .6 .5 .4 .4 .7 42– .8 .7 1.2 .9 .7 .6 .8 .4 .6 43
1.0 4.3 2.3 1.6 4.3 2.7 1.9 3.4 .5 1.0 44– 1.3 1.3 1.1 .9 1.4 1.6 .8 .9 1.2 45
1.0 2.3 .8 2.6 1.5 .9 1.6 .4 .5 .9 461.0 1.8 1.0 1.7 .8 .9 2.0 .4 .6 1.2 471.0 1.6 2.2 2.6 2.0 1.9 1.0 .9 .8 1.0 482.0 2.1 2.3 2.5 2.1 3.3 1.2 .6 2.1 1.7 492.0 3.1 1.7 3.1 3.2 1.5 2.4 .6 1.4 3.1 50
– 1.1 .6 .7 .5 .9 .8 .2 .5 .5 51
– 1.3 .8 1.1 .7 1.2 1.0 .3 .7 .7 52– 1.5 .7 .8 .6 .8 .6 .2 .6 .5 53– 4.1 2.7 4.5 1.8 3.8 2.8 .3 1.7 .7 54– 2.3 1.2 1.2 .8 .8 .9 .3 .8 .6 55– 1.5 1.1 2.2 1.3 1.7 1.3 .5 2.1 1.3 56
1.0 .8 .7 1.5 1.2 1.7 1.1 .8 .8 1.9 571.0 1.7 1.1 1.5 1.0 2.1 1.3 .7 .9 .6 581.0 1.6 1.1 1.7 1.4 3.0 1.2 .7 .9 1.0 591.0 1.7 .7 2.9 1.5 2.5 2.3 1.2 2.0 1.6 60
1992 ECONOMIC CENSUS CHARACTERISTICS OF BUSINESS OWNERS 99

Table 11d. Owner’s Managerial Work Experience Prior to Beginning/Acquiring the Business by[All data are shown as percents, except firms. For meaning of abbreviations and symbols, see introductory text. For explanation of terms, see appendix A]
Type of firm and legal form of organization
Years of experience working in a managerial capacity1
Firms(number) None
Lessthan 2 2 to 5 6 to 9 10 to 19
20 ormore
Notsure
Notreported
Notapplicable2
A B C D E F G H I J
All businesses 17 253 143............................. 33.9 8.0 13.8 9.0 11.4 8.2 2.4 5.7 7.61
Individual proprietorships 14 599 295.......................... 38.4 9.0 13.5 8.0 9.7 5.8 2.2 5.8 7.72Partnerships 1 089 578..................................... 21.7 4.6 13.8 11.2 15.0 16.2 2.9 5.6 9.13Subchapter S corporations 1 564 270......................... 22.4 6.1 15.6 11.5 16.6 13.4 3.4 5.3 5.64
Hispanic ~owned businesses 771 708................ 35.1 7.9 12.6 7.9 9.3 4.5 2.9 7.0 12.85
Individual proprietorships 689 015.......................... 38.5 7.6 12.2 6.4 7.4 3.2 2.6 7.5 14.56Partnerships 32 650..................................... 24.3 8.5 12.2 13.9 14.2 10.2 3.4 5.8 7.47Subchapter S corporations 50 042......................... 24.4 9.2 14.8 11.5 15.8 7.5 4.0 5.0 7.98
Black ~owned businesses 620 912................... 40.6 7.4 12.1 6.7 8.3 3.6 2.4 9.1 9.79
Individual proprietorships 584 256.......................... 41.8 7.4 12.0 6.4 7.6 3.1 2.2 9.5 9.910Partnerships 14 727..................................... 26.0 5.7 12.0 8.5 17.7 9.0 4.1 6.8 10.111Subchapter S corporations 21 928......................... 28.6 7.6 13.3 12.0 16.8 8.2 4.7 3.1 5.612
Other minority ~owned businesses 606 426.......... 28.1 9.1 16.0 9.4 10.3 4.6 3.1 5.7 13.713
Individual proprietorships 502 022.......................... 32.4 9.9 14.4 10.1 8.1 2.3 3.4 4.6 14.714Partnerships 49 489..................................... 22.8 6.0 17.8 6.3 12.5 8.4 2.6 9.2 14.415Subchapter S corporations 54 915......................... 20.7 9.3 18.9 9.8 14.5 7.9 2.6 5.8 10.416
Women ~owned businesses 5 888 883................. 36.0 7.9 13.2 9.0 10.2 5.8 2.5 6.5 9.017
Individual proprietorships 5 078 077.......................... 38.9 8.4 13.0 8.8 8.6 4.7 2.2 6.6 8.918Partnerships 243 651..................................... 27.4 5.6 11.0 8.0 12.6 10.1 2.7 8.2 14.419Subchapter S corporations 567 155......................... 26.7 6.8 15.3 10.6 16.3 8.8 3.7 5.0 6.920
Nonminority male ~owned businesses 10 114 456....... 32.7 7.9 14.2 9.0 12.3 10.0 2.3 5.1 6.321
Individual proprietorships 8 414 238.......................... 38.2 9.3 13.9 7.6 10.6 6.8 2.0 5.1 6.522Partnerships 777 379..................................... 19.8 4.0 14.5 12.4 15.7 18.7 3.0 4.7 7.323Subchapter S corporations 922 838......................... 19.9 5.4 15.7 12.2 17.0 16.8 3.2 5.4 4.524
1Data represent percentage of owners reporting in the designated categories.2Includes owners who had no previous work experience prior to starting/acquiring their businesses.3For explanation of relative standard errors and standard errors, see Reliability of Estimates in the introductory text.4Relative standard errors are not applicable for lines 1 through 4 since these data are the result of censuses, not surveys.
100 CHARACTERISTICS OF BUSINESS OWNERS 1992 ECONOMIC CENSUS

Legal Form of Organization of Firm: 1992
Standard error of estimate3 for columnmRelative
standarderror of
estimate3 4
A B C D E F G H I J
(X) .7 .5 .4 .3 .6 .5 .2 .3 .4 1
(X) .8 .6 .4 .3 .6 .4 .3 .4 .3 2(X) 1.4 .9 1.4 1.3 1.7 2.1 .6 .6 1.4 3(X) 1.7 .4 1.1 .5 .8 1.3 .6 .7 .6 4
– .8 .4 .6 .5 .6 .5 .5 .5 .5 5
– 1.1 .5 .9 .7 .8 .5 .6 .7 .5 62.0 2.8 1.5 1.2 2.0 1.9 1.4 1.0 1.1 1.9 71.0 2.7 .9 1.1 1.3 1.8 .7 .9 .9 1.2 8
– .7 .6 .5 .4 .5 .2 .1 .6 .6 9
– .7 .6 .4 .4 .5 .2 .1 .6 .5 103.0 3.1 1.1 2.1 1.3 2.1 1.6 1.7 2.0 2.2 112.0 3.2 1.1 1.8 2.3 1.8 1.2 1.1 .7 1.4 12
– .9 .4 1.0 .8 .5 .5 .5 .5 .9 13
– 1.4 .7 .8 1.3 .8 .4 .9 .8 1.0 141.0 2.3 1.0 2.9 1.1 1.3 .9 .4 1.4 2.2 151.0 1.3 1.2 1.5 .6 .9 1.0 .5 1.7 1.1 16
– .8 .6 .6 .6 .5 .3 .4 .4 .6 17
– .8 .7 .6 .8 .7 .4 .5 .5 .7 181.0 1.5 1.4 1.8 1.3 1.3 2.2 .9 1.9 2.3 19
– 1.6 .6 1.8 .6 1.2 .5 .8 1.1 .7 20
– 1.1 .6 .7 .5 .9 .8 .2 .5 .5 21
– 1.3 .9 .8 .5 .8 .6 .2 .7 .4 22– 2.1 1.2 2.2 1.8 2.5 2.4 .8 .7 1.9 23– 2.6 .6 1.3 .6 1.5 2.2 .6 .8 .9 24
1992 ECONOMIC CENSUS CHARACTERISTICS OF BUSINESS OWNERS 101

Table 12a. Owner’s Previous Experience as a Business Owner Prior to Beginning/Acquiring the[All data are shown as percents, except firms. For meaning of abbreviations and symbols, see introductory text. For explanation of terms, see appendix A]
Type of firm and industry division
Years of experience as the owner of another business1
Firms(number) None
Lessthan 2 2 to 5 6 to 9 10 to 19
20 ormore
Notsure
Notreported
Notapplicable2
A B C D E F G H I J
All businesses 17 253 143................................ 65.5 3.0 5.6 3.3 4.8 3.9 .8 5.4 7.61
Agricultural services, forestry, fishing, and mining 583 253........ 64.1 2.5 4.9 2.8 4.6 3.5 .9 7.5 9.32Construction 1 829 620........................................ 77.9 1.8 3.9 2.7 2.7 3.1 .5 2.9 4.43Manufacturing 517 714....................................... 67.9 3.4 4.4 4.2 5.2 3.7 1.1 4.1 6.04Transportation, communications, and utilities 698 903............ 62.2 3.6 5.9 4.0 3.9 4.3 .6 7.6 7.85Wholesale trade 538 339..................................... 64.2 3.1 5.8 4.3 6.6 3.6 1.3 4.9 6.36
Retail trade 2 478 045......................................... 63.6 3.6 6.0 3.1 4.7 3.2 1.0 5.5 9.47Finance, insurance, and real estate 1 941 029.................... 44.0 3.0 7.0 5.9 12.5 11.6 1.7 5.1 9.28Services 7 784 016............................................ 71.7 3.1 5.0 2.5 2.7 1.9 .6 5.3 7.29Industries not classified 882 224............................... 65.6 1.5 8.8 2.4 1.9 .7 .4 11.0 7.810
Hispanic ~owned businesses 771 708................... 65.5 2.6 4.8 2.4 2.9 1.6 1.0 6.3 12.811
Agricultural services, forestry, fishing, and mining 32 927........ 70.6 1.7 1.4 2.0 1.3 1.5 1.2 6.5 13.812Construction 97 476........................................ 71.5 2.9 4.1 3.4 2.4 1.3 .9 7.0 6.613Manufacturing 18 461....................................... 68.3 2.8 4.0 3.8 3.7 2.7 1.0 5.6 8.014Transportation, communications, and utilities 47 797............ 65.8 1.4 3.3 2.7 2.2 1.7 .9 8.4 13.615Wholesale trade 17 727..................................... 64.4 3.3 6.0 3.6 6.2 3.7 .7 3.9 8.416
Retail trade 107 846......................................... 59.7 2.8 5.1 2.6 3.6 1.4 .8 4.4 19.717Finance, insurance, and real estate 49 231.................... 49.1 4.0 8.5 5.3 7.4 5.7 2.6 5.5 11.918Services 347 297............................................ 69.2 2.5 5.0 1.5 1.9 .9 .7 6.1 12.219Industries not classified 52 945............................... 61.2 1.2 2.8 1.9 2.2 .9 1.5 11.4 16.920
Black ~owned businesses 620 912...................... 69.9 2.7 4.3 1.5 1.6 .8 .8 8.7 9.721
Agricultural services, forestry, fishing, and mining 10 309........ 68.1 1.7 4.9 .4 1.1 1.7 .7 9.0 12.422Construction 43 381........................................ 77.2 2.1 3.8 1.3 1.2 .7 .8 7.3 5.723Manufacturing 10 469....................................... 70.9 2.5 4.2 .6 1.7 .4 2.0 8.1 9.724Transportation, communications, and utilities 49 095........... 65.7 1.6 3.1 1.6 1.3 1.2 1.0 11.6 12.925Wholesale trade 7 550..................................... 66.6 3.8 6.5 3.3 3.2 1.9 1.3 5.7 7.726
Retail trade 86 840......................................... 66.1 3.6 5.7 1.1 1.7 .5 .8 7.5 13.027Finance, insurance, and real estate 40 924.................... 64.0 3.3 5.6 2.8 5.3 2.8 .9 6.7 8.528Services 332 981............................................ 71.8 2.8 4.0 1.4 1.3 .6 .6 8.6 8.829Industries not classified 39 363............................... 66.5 1.5 3.7 1.5 1.4 .3 .8 13.2 11.130
Other minority ~owned businesses 606 426............. 56.9 4.4 7.4 3.9 4.7 2.1 1.6 5.4 13.731
Agricultural services, forestry, fishing, and mining 15 218........ 56.1 2.3 5.3 4.7 4.2 1.8 .6 9.7 15.432Construction 28 295........................................ 59.7 5.9 4.7 3.9 4.5 5.6 1.5 5.0 9.133Manufacturing 18 976....................................... 62.4 2.4 6.4 3.5 4.5 .8 .9 2.6 16.434Transportation, communications, and utilities 24 362............ 46.8 4.6 6.9 1.9 2.2 1.5 1.9 7.4 26.935Wholesale trade 20 043..................................... 59.0 3.2 7.3 4.7 6.1 2.3 1.7 4.1 11.736
Retail trade 132 483......................................... 54.2 5.7 9.4 4.8 5.1 1.6 1.8 4.0 13.537Finance, insurance, and real estate 64 762.................... 41.5 3.6 12.6 5.0 8.5 4.6 2.2 7.0 15.138Services 273 774............................................ 64.0 4.0 4.9 3.1 3.1 1.4 1.4 5.5 12.539Industries not classified 28 512............................... 62.9 6.4 5.6 2.0 4.0 – .6 5.4 13.140
Women ~owned businesses 5 888 883.................... 67.8 3.3 4.9 2.4 3.2 2.3 .8 6.3 9.041
Agricultural services, forestry, fishing, and mining 119 731........ 60.5 1.8 4.1 2.2 5.8 3.0 .9 7.1 14.642Construction 183 695........................................ 67.3 3.3 4.8 4.4 3.0 2.3 1.2 6.1 7.643Manufacturing 152 346....................................... 67.1 2.2 3.0 3.0 4.7 3.0 .9 4.2 12.044Transportation, communications, and utilities 141 623............ 67.8 2.4 6.1 3.7 4.1 2.3 1.5 5.2 7.045Wholesale trade 154 542..................................... 63.6 3.5 5.5 3.9 4.7 3.4 1.2 5.2 9.146
Retail trade 1 093 342......................................... 66.0 4.1 5.5 2.2 4.0 1.5 .7 5.8 10.347Finance, insurance, and real estate 602 802.................... 54.2 2.8 7.3 3.4 7.1 7.4 1.9 5.9 10.148Services 3 158 444............................................ 72.9 3.5 4.1 1.9 1.7 1.2 .5 6.3 8.049Industries not classified 282 358............................... 66.1 1.2 5.7 3.2 2.5 .7 .8 11.2 8.650
Nonminority male ~owned businesses 10 114 456.......... 64.6 2.7 5.9 3.9 5.9 5.1 .9 4.8 6.351
Agricultural services, forestry, fishing, and mining 412 917........ 64.8 2.9 5.3 3.1 4.5 3.9 .9 7.5 7.252Construction 1 496 056........................................ 80.1 1.5 3.8 2.4 2.7 3.3 .4 2.0 3.753Manufacturing 333 485....................................... 68.3 4.0 4.9 4.8 5.5 4.2 1.2 4.0 3.154Transportation, communications, and utilities 458 400............ 60.4 4.3 6.3 4.5 4.3 5.7 .3 8.0 6.155Wholesale trade 352 721..................................... 64.6 2.9 5.9 4.4 7.5 3.7 1.3 4.9 4.856
Retail trade 1 197 943......................................... 62.6 2.9 6.4 3.8 5.3 4.9 1.2 5.3 7.657Finance, insurance, and real estate 1 240 594.................... 39.7 3.0 6.6 7.0 15.0 13.9 1.5 4.7 8.758Services 4 102 294............................................ 71.4 2.7 5.5 3.0 3.5 2.5 .7 4.5 6.259Industries not classified 520 046............................... 65.4 1.4 11.4 2.0 1.5 .8 .1 10.9 6.660
1Data represent percentage of owners reporting in the designated categories.2Includes owners who had no previous work experience prior to starting/acquiring their businesses.3For explanation of relative standard errors and standard errors, see Reliability of Estimates in the introductory text.4Relative standard errors are not applicable for lines 1 through 10 since these data are the result of censuses, not surveys.
102 CHARACTERISTICS OF BUSINESS OWNERS 1992 ECONOMIC CENSUS

Business by Industry Division: 1992
Standard error of estimate3 for columnmRelative
standarderror of
estimate3 4
A B C D E F G H I J
(X) .7 .2 .3 .2 .4 .5 .1 .3 .4 1
(X) 2.1 .7 1.7 .9 1.1 .7 .3 1.1 1.2 2(X) 2.3 .7 .5 .8 .7 1.0 .2 .5 .9 3(X) 1.9 .8 .8 .8 .5 .6 .3 .6 .7 4(X) 2.8 .7 1.2 .6 .9 1.0 .1 1.0 1.3 5(X) 1.6 .5 1.0 .4 .9 .4 .3 .8 .8 6
(X) 1.5 .9 .6 .3 .7 .5 .3 .8 .6 7(X) 1.9 .7 .6 1.2 1.6 1.3 .5 .8 1.6 8(X) 1.3 .4 .6 .3 .3 .5 .1 .4 .3 9(X) 3.1 .5 1.2 .6 .5 .3 .2 2.0 1.1 10
– 1.3 .2 .4 .2 .3 .2 .2 .6 .5 11
1.0 3.1 .7 .6 1.2 .4 .7 .5 2.2 1.8 121.0 2.0 .4 1.2 .7 .8 .5 .4 1.4 1.8 131.0 1.7 .6 .7 .9 .9 .6 .4 1.2 1.0 141.0 2.7 .6 1.0 .8 .8 .8 .3 2.0 1.4 152.0 2.7 1.0 1.2 1.1 1.2 .6 .2 .4 1.1 16
1.0 2.2 .5 1.2 .4 .7 .2 .4 .8 1.4 171.0 3.1 .8 1.1 .7 1.7 .8 .4 .8 1.4 18
– 1.9 .4 .5 .3 .3 .4 .3 1.0 .8 191.0 2.4 .6 .8 .8 .8 .6 .8 1.6 2.6 20
– 1.0 .3 .3 .2 .2 .2 .2 .5 .6 21
1.0 2.5 .6 1.2 .2 .4 .8 .6 1.3 1.2 22– 2.2 .8 .8 .5 .4 .4 .3 1.6 1.1 23
1.0 2.1 .9 1.2 .3 .5 .2 .7 1.3 1.2 24– 1.7 .5 .8 .6 .4 .4 .5 1.4 1.5 25
2.0 1.8 .9 1.3 1.0 .9 .9 .2 .8 .7 26
– 1.5 .6 1.2 .3 .4 .1 .3 .9 1.3 271.0 2.7 .5 1.0 .3 .9 .7 .3 1.1 1.9 28
– 1.7 .4 .3 .3 .3 .2 .3 .8 .9 29– 2.2 .6 .7 .5 .4 .2 .3 2.5 1.5 30
– .8 .4 .8 .4 .5 .2 .2 .4 .9 31
1.0 3.6 1.4 1.8 1.4 1.1 .6 .3 2.7 2.2 321.0 3.1 1.4 1.0 .9 1.4 2.2 .6 1.0 2.7 331.0 4.4 .9 1.1 1.0 1.1 .2 .4 .4 3.2 341.0 2.4 1.4 3.1 .5 .9 .4 1.1 2.4 2.8 351.0 3.0 .8 1.0 .6 1.6 .8 .5 1.0 2.0 36
1.0 1.6 .8 1.1 1.2 .8 .5 .5 .7 1.2 371.0 2.5 1.0 3.2 1.2 1.6 .4 .8 1.5 2.3 38
– 1.1 .8 .7 .6 .4 .2 .5 .8 1.3 391.0 5.0 1.2 2.0 1.1 2.0 – .3 1.8 2.5 40
– .5 .5 .4 .2 .3 .1 .1 .3 .6 41
– 3.0 .6 1.4 .8 1.3 .8 .5 1.7 1.7 42– 1.9 .7 .9 1.0 .6 .6 .5 1.5 1.4 43– 1.6 .7 .8 .7 1.1 .8 .4 .7 1.4 44– 2.5 .8 1.3 .6 .8 .6 .7 .9 1.4 45– 2.1 .9 1.1 .8 .8 .7 .4 1.0 1.7 46
– 2.1 1.2 1.1 .5 .7 .3 .2 .9 1.0 47– 2.3 .7 .9 .9 1.3 1.4 .5 1.9 1.2 48– .7 .7 .5 .4 .4 .3 .1 .4 .8 49– 2.7 .7 1.6 1.1 .9 .6 .5 2.2 1.9 50
– 1.2 .3 .4 .4 .5 .7 .2 .5 .5 51
– 3.3 1.0 2.4 1.3 1.4 1.1 .4 1.6 2.0 52– 2.8 1.0 .7 1.0 .8 1.2 .2 .5 1.1 53– 3.0 1.5 1.1 1.1 1.1 .9 .6 1.0 1.1 54– 3.7 1.0 1.8 .8 1.4 1.6 .1 1.4 2.0 55– 2.0 .6 1.2 .8 1.3 .8 .4 1.0 .9 56
– 2.5 .9 1.0 .6 1.4 .9 .7 1.5 .7 57– 2.8 .9 .8 2.0 2.3 1.8 .6 .6 2.5 58– 2.3 .8 1.0 .6 .4 .8 .2 .8 .8 59– 5.0 .8 1.9 .8 .7 .4 – 3.1 1.7 60
1992 ECONOMIC CENSUS CHARACTERISTICS OF BUSINESS OWNERS 103

Table 12b. Owner’s Previous Experience as a Business Owner Prior to Beginning/Acquiring the[All data are shown as percents, except firms. For meaning of abbreviations and symbols, see introductory text. For explanation of terms, see appendix A]
Type of firm and receipts size
Years of experience as the owner of another business1
Firms(number) None
Lessthan 2 2 to 5 6 to 9 10 to 19
20 ormore
Notsure
Notreported
Notapplicable2
A B C D E F G H I J
All businesses 17 253 143................................ 65.5 3.0 5.6 3.3 4.8 3.9 .8 5.4 7.61
Less than $5,000 5 226 553.................................... 67.6 3.1 4.6 1.7 2.1 2.4 .9 7.7 9.92$5,000 to $9,999 2 443 946.................................... 69.3 2.8 5.0 2.1 3.8 2.6 .2 5.8 8.53$10,000 to $24,999 3 076 410.................................. 69.6 2.3 6.0 3.6 4.0 3.2 .5 4.0 6.84$25,000 to $49,999 1 945 806.................................. 66.9 3.2 4.3 3.8 7.1 3.3 .8 4.8 5.95$50,000 to $99,999 1 615 940.................................. 64.4 3.3 7.2 3.8 5.1 5.7 1.2 3.9 5.46
$100,000 to $199,999 1 197 996................................ 61.8 2.9 6.8 4.6 7.0 6.2 1.0 3.9 5.77$200,000 to $249,999 301 794................................ 59.2 2.9 5.0 4.6 7.5 4.3 1.8 1.9 12.88$250,000 to $499,999 682 583................................ 58.6 3.2 5.9 5.8 7.3 5.9 1.1 5.6 6.59$500,000 to $999,999 372 078................................ 54.3 3.0 7.8 5.6 8.5 7.9 1.6 5.3 6.110$1,000,000 or more 390 037.................................. 54.6 3.0 6.6 5.2 8.7 7.3 1.8 5.9 6.911
Hispanic ~owned businesses 771 708................... 65.5 2.6 4.8 2.4 2.9 1.6 1.0 6.3 12.812
Less than $5,000 219 226.................................... 65.4 2.1 2.0 1.0 1.4 1.1 1.0 8.3 17.713$5,000 to $9,999 140 362.................................... 63.8 2.1 4.3 1.9 1.3 .9 1.4 9.3 15.014$10,000 to $24,999 165 667.................................. 67.6 1.8 6.2 1.9 1.1 .9 .3 6.5 13.715$25,000 to $49,999 87 288.................................. 71.8 1.5 4.2 1.5 2.2 1.2 1.3 4.5 11.816$50,000 to $99,999 64 742.................................. 64.6 4.5 5.5 4.6 5.5 2.1 .5 4.1 8.717
$100,000 to $199,999 41 578................................ 66.7 3.1 6.5 3.3 6.2 1.5 1.1 3.7 7.918$200,000 to $249,999 10 030................................ 59.9 3.7 6.8 5.0 3.9 3.7 1.5 4.6 10.819$250,000 to $499,999 22 301................................ 60.4 2.3 7.4 5.3 5.8 4.4 1.4 4.4 8.620$500,000 to $999,999 11 319................................ 60.2 4.9 5.8 3.8 5.6 4.1 2.5 5.4 7.621$1,000,000 or more 9 194.................................. 54.1 5.6 8.2 5.2 8.9 4.9 1.5 4.8 6.822
Black ~owned businesses 620 912...................... 69.9 2.7 4.3 1.5 1.6 .8 .8 8.7 9.723
Less than $5,000 236 722.................................... 68.6 2.7 4.3 .7 .7 .1 .8 11.5 10.724$5,000 to $9,999 111 512.................................... 70.0 2.3 2.6 1.0 .8 .6 .5 10.4 11.825$10,000 to $24,999 129 901.................................. 69.3 2.9 4.9 2.4 1.6 1.0 .9 8.0 9.026$25,000 to $49,999 62 209.................................. 73.9 3.3 4.4 1.1 2.0 1.9 .5 4.5 8.527$50,000 to $99,999 39 218.................................. 75.2 2.7 4.8 2.0 2.9 .9 1.0 4.2 6.528
$100,000 to $199,999 20 936................................ 68.9 2.9 6.2 3.1 6.7 1.2 .7 2.9 7.429$200,000 to $249,999 4 533................................ 78.7 2.4 3.6 2.1 2.1 1.2 1.2 3.8 4.930$250,000 to $499,999 9 029................................ 68.6 2.9 5.6 4.0 4.5 3.7 .8 3.6 6.231$500,000 to $999,999 3 823................................ 63.5 1.3 4.7 5.7 6.9 7.3 .5 4.8 5.232$1,000,000 or more 3 028.................................. 56.3 5.4 5.1 2.9 6.8 3.7 2.4 7.1 10.433
Other minority ~owned businesses 606 426............. 56.9 4.4 7.4 3.9 4.7 2.1 1.6 5.4 13.734
Less than $5,000 132 493.................................... 59.9 4.6 9.4 1.9 1.8 2.2 1.3 4.8 14.035$5,000 to $9,999 80 435.................................... 56.7 4.5 3.0 1.6 5.1 2.9 2.0 6.1 18.036$10,000 to $24,999 108 195.................................. 61.8 4.0 5.9 4.8 3.5 .3 .5 7.7 11.537$25,000 to $49,999 77 345.................................. 60.6 4.9 7.6 2.4 3.1 .7 1.3 3.0 16.338$50,000 to $99,999 70 360.................................. 53.4 4.4 8.5 5.8 4.7 1.9 1.6 3.9 15.839
$100,000 to $199,999 58 620................................ 56.0 5.1 6.4 3.7 5.7 1.7 2.2 5.9 13.340$200,000 to $249,999 15 740................................ 57.5 3.9 6.4 5.8 6.2 4.1 1.5 5.3 9.341$250,000 to $499,999 34 266................................ 53.4 3.5 8.2 5.2 7.9 3.7 2.0 4.6 11.542$500,000 to $999,999 16 467................................ 51.4 3.4 8.8 5.3 8.7 3.0 2.0 7.3 10.043$1,000,000 or more 12 505.................................. 47.2 4.0 9.9 6.5 6.9 5.4 2.6 9.1 8.444
Women ~owned businesses 5 888 883.................... 67.8 3.3 4.9 2.4 3.2 2.3 .8 6.3 9.045
Less than $5,000 2 310 303.................................... 69.0 3.5 4.1 1.8 1.9 .7 .8 8.5 9.746$5,000 to $9,999 967 380.................................... 70.4 3.0 4.8 1.7 2.1 .9 .3 5.5 11.447$10,000 to $24,999 1 051 358.................................. 71.0 2.2 4.9 2.8 2.6 2.9 .5 5.6 7.548$25,000 to $49,999 538 885.................................. 63.9 6.2 4.5 2.7 4.9 2.8 1.1 4.8 9.049$50,000 to $99,999 381 517.................................. 65.6 3.1 5.5 3.0 4.4 4.1 .9 6.5 6.950
$100,000 to $199,999 267 089................................ 66.0 2.9 6.0 3.1 6.6 4.7 1.8 2.4 6.451$200,000 to $249,999 66 464................................ 61.5 1.5 8.6 5.2 5.1 7.1 .5 3.8 6.752$250,000 to $499,999 146 313................................ 63.8 2.7 6.8 3.5 6.1 4.0 .9 3.8 8.453$500,000 to $999,999 80 539................................ 62.9 3.1 6.5 4.5 5.7 3.8 1.2 4.3 8.054$1,000,000 or more 79 037.................................. 55.4 3.0 7.0 3.4 6.5 5.1 2.0 5.9 11.755
Nonminority male ~owned businesses 10 114 456.......... 64.6 2.7 5.9 3.9 5.9 5.1 .9 4.8 6.356
Less than $5,000 2 608 047.................................... 66.8 2.8 4.9 1.7 2.3 3.8 .9 6.9 9.857$5,000 to $9,999 1 285 456.................................... 69.0 2.7 5.3 2.4 5.3 4.1 – 5.5 5.758$10,000 to $24,999 1 763 830.................................. 69.1 2.2 6.8 4.3 5.4 3.8 .5 2.2 5.859$25,000 to $49,999 1 248 482.................................. 68.2 1.8 4.0 4.5 8.5 3.8 .6 4.9 3.660$50,000 to $99,999 1 108 065.................................. 64.3 3.4 7.9 3.8 5.3 6.8 1.3 2.9 4.261
$100,000 to $199,999 840 723................................ 60.3 2.8 7.2 5.3 7.2 7.3 .7 4.4 4.862$200,000 to $249,999 212 693................................ 58.1 3.3 3.6 4.2 8.9 3.2 2.2 .7 15.863$250,000 to $499,999 488 462................................ 57.1 3.4 5.4 6.7 7.8 6.8 1.0 6.4 5.564$500,000 to $999,999 266 408................................ 51.8 2.8 8.3 6.0 9.4 9.5 1.7 5.4 5.265$1,000,000 or more 292 290.................................. 54.9 2.8 6.3 5.6 9.3 7.9 1.7 5.8 5.766
1Data represent percentage of owners reporting in the designated categories.2Includes owners who had no previous work experience prior to starting/acquiring their businesses.3For explanation of relative standard errors and standard errors, see Reliability of Estimates in the introductory text.4Relative standard errors are not applicable for lines 1 through 11 since these data are the result of censuses, not surveys.
104 CHARACTERISTICS OF BUSINESS OWNERS 1992 ECONOMIC CENSUS

Business by Receipts Size of Firm: 1992
Standard error of estimate3 for columnmRelative
standarderror of
estimate3 4
A B C D E F G H I J
(X) .7 .2 .3 .2 .4 .5 .1 .3 .4 1
(X) 1.7 .4 1.0 .4 .5 .8 .3 .7 .8 2(X) 1.9 .4 .9 .6 1.4 1.1 – 1.1 1.5 3(X) 1.2 .4 .8 .9 1.1 .6 .1 .5 .8 4(X) 2.7 .9 .8 1.5 1.7 1.4 .3 1.1 1.2 5(X) 2.5 .7 .8 .6 1.3 1.6 .3 .7 .9 6
(X) 1.6 .5 .6 .8 .5 1.0 .3 .6 .4 7(X) 3.6 .7 .9 1.0 2.4 1.3 1.2 .4 4.6 8(X) 1.8 .3 .4 .9 .5 .6 .2 .9 .8 9(X) .9 .3 .4 .6 .6 .8 .4 .6 .5 10(X) .8 .3 .3 .4 .7 .6 .2 .4 .4 11
– 1.3 .2 .4 .2 .3 .2 .2 .6 .5 12
1.0 2.9 .5 .7 .5 .5 .5 .5 1.4 1.5 131.0 2.3 .8 1.3 .7 .5 .9 .8 1.3 1.9 141.0 3.0 .7 1.7 .3 .4 .5 .2 1.0 1.0 151.0 2.5 .9 .8 .5 .6 .3 .7 1.4 1.6 161.0 2.0 1.0 .7 1.0 1.4 .6 .4 1.3 1.4 17
1.0 1.6 1.0 1.3 .6 1.4 .3 .3 .9 1.1 183.0 5.7 1.6 2.3 1.4 1.2 1.5 1.3 1.7 3.2 192.0 2.0 .5 1.2 .7 1.5 .8 .4 .7 1.1 203.0 2.9 1.3 .8 .7 1.4 .6 1.0 1.4 1.4 212.0 2.3 1.3 .8 .4 .7 .9 .4 .6 1.0 22
– 1.0 .3 .3 .2 .2 .2 .2 .5 .6 23
– 2.1 .5 .5 .2 .1 – .3 1.1 .8 24– 2.5 .5 .9 .3 .3 .3 .2 1.0 2.4 25– 1.0 .4 .6 .4 .3 .3 .6 .7 1.2 26– 2.7 1.2 .9 .6 .8 .8 .3 1.3 1.3 27
1.0 2.0 .6 .9 .6 .8 .3 .2 .9 1.0 28
1.0 2.0 .5 1.0 .4 1.9 .4 .3 .8 1.4 293.0 3.0 1.4 1.4 .7 1.5 1.7 .7 1.1 1.2 303.0 2.2 1.1 .9 .6 1.2 1.3 .5 .9 .7 314.0 3.2 .5 1.0 1.2 2.3 2.2 .4 2.3 2.4 324.0 2.5 1.6 .8 .5 1.4 .4 .8 1.5 3.3 33
– .8 .4 .8 .4 .5 .2 .2 .4 .9 34
1.0 3.5 1.2 2.8 1.0 .9 .8 .7 1.3 1.3 351.0 3.4 1.1 .9 .9 2.2 1.2 1.1 2.1 3.8 361.0 2.9 .9 1.3 1.8 1.0 .1 .4 2.1 2.3 371.0 5.9 1.3 2.2 1.0 1.0 .4 .9 1.3 3.8 381.0 3.6 1.6 1.2 1.1 .8 .9 .6 .8 2.3 39
1.0 2.1 .6 1.2 .9 1.6 .5 .9 1.4 .8 402.0 5.6 1.5 2.0 1.7 2.1 2.2 .6 2.3 1.7 411.0 1.8 .4 1.0 .9 1.2 .8 .4 .6 .8 422.0 2.6 .7 .5 .8 1.5 .7 .7 1.9 .7 432.0 2.0 .6 .6 .5 .7 1.1 .5 .8 .8 44
– .5 .5 .4 .2 .3 .1 .1 .3 .6 45
– 1.3 .6 .8 .3 .4 .2 .2 1.1 1.0 46– 3.4 .8 1.2 .6 .9 .5 .1 1.1 2.3 47– 1.4 .8 .6 1.1 .9 .8 .2 .8 .9 48– 4.7 2.8 1.4 1.4 1.8 1.9 .4 1.3 2.5 49– 2.7 .5 1.2 .5 .8 .6 .4 1.6 1.3 50
– 2.1 .5 .9 .8 .9 1.0 .8 .8 .7 511.0 3.8 .6 1.6 2.1 1.5 2.5 .4 1.3 2.0 521.0 1.6 .5 .9 .7 .8 .5 .2 .6 1.2 531.0 2.0 .4 .9 .4 .7 .7 .3 .6 .9 541.0 1.9 .5 .6 .3 .6 .5 .4 .5 .8 55
– 1.2 .3 .4 .4 .5 .7 .2 .5 .5 56
– 2.5 .8 1.4 .6 .8 1.4 .5 1.1 1.1 57– 3.2 .9 1.0 .9 2.4 2.1 – 1.6 1.8 58– 2.2 .7 1.3 1.6 1.5 .9 .2 1.0 1.7 59– 3.7 .6 1.0 1.8 2.8 1.7 .5 1.4 1.1 60– 3.6 1.0 1.1 .8 1.9 2.2 .5 .9 1.0 61
– 2.5 .9 1.1 1.2 .7 1.5 .3 1.0 .6 62– 4.7 1.1 .9 1.5 3.6 2.3 1.7 .4 5.8 63– 2.5 .4 .4 1.2 .8 .7 .3 1.3 1.2 64– 1.1 .3 .4 .8 .9 1.0 .5 .8 .7 65– 1.0 .3 .4 .5 .9 .7 .2 .6 .5 66
1992 ECONOMIC CENSUS CHARACTERISTICS OF BUSINESS OWNERS 105
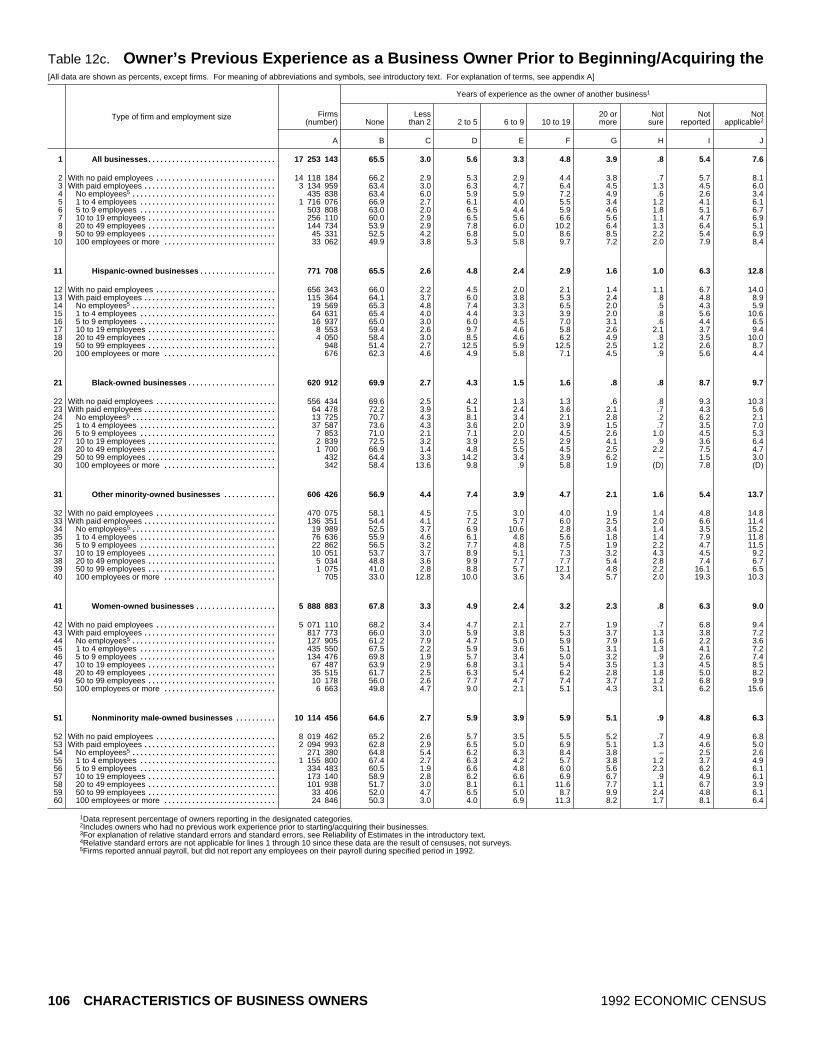
Table 12c. Owner’s Previous Experience as a Business Owner Prior to Beginning/Acquiring the[All data are shown as percents, except firms. For meaning of abbreviations and symbols, see introductory text. For explanation of terms, see appendix A]
Type of firm and employment size
Years of experience as the owner of another business1
Firms(number) None
Lessthan 2 2 to 5 6 to 9 10 to 19
20 ormore
Notsure
Notreported
Notapplicable2
A B C D E F G H I J
All businesses 17 253 143................................ 65.5 3.0 5.6 3.3 4.8 3.9 .8 5.4 7.61
With no paid employees 14 118 184.............................. 66.2 2.9 5.3 2.9 4.4 3.8 .7 5.7 8.12With paid employees 3 134 959................................. 63.4 3.0 6.3 4.7 6.4 4.5 1.3 4.5 6.03
No employees5 435 838.................................... 63.4 6.0 5.9 5.9 7.2 4.9 .6 2.6 3.441 to 4 employees 1 716 076.................................. 66.9 2.7 6.1 4.0 5.5 3.4 1.2 4.1 6.155 to 9 employees 503 808.................................. 63.0 2.0 6.5 4.4 5.9 4.6 1.8 5.1 6.7610 to 19 employees 256 110................................ 60.0 2.9 6.5 5.6 6.6 5.6 1.1 4.7 6.9720 to 49 employees 144 734................................ 53.9 2.9 7.8 6.0 10.2 6.4 1.3 6.4 5.1850 to 99 employees 45 331................................ 52.5 4.2 6.8 5.0 8.6 8.5 2.2 5.4 6.99100 employees or more 33 062............................ 49.9 3.8 5.3 5.8 9.7 7.2 2.0 7.9 8.410
Hispanic ~owned businesses 771 708................... 65.5 2.6 4.8 2.4 2.9 1.6 1.0 6.3 12.811
With no paid employees 656 343.............................. 66.0 2.2 4.5 2.0 2.1 1.4 1.1 6.7 14.012With paid employees 115 364................................. 64.1 3.7 6.0 3.8 5.3 2.4 .8 4.8 8.913
No employees5 19 569.................................... 65.3 4.8 7.4 3.3 6.5 2.0 .5 4.3 5.9141 to 4 employees 64 631.................................. 65.4 4.0 4.4 3.3 3.9 2.0 .8 5.6 10.6155 to 9 employees 16 937.................................. 65.0 3.0 6.0 4.5 7.0 3.1 .6 4.4 6.51610 to 19 employees 8 553................................ 59.4 2.6 9.7 4.6 5.8 2.6 2.1 3.7 9.41720 to 49 employees 4 050................................ 58.4 3.0 8.5 4.6 6.2 4.9 .8 3.5 10.01850 to 99 employees 948................................ 51.4 2.7 12.5 5.9 12.5 2.5 1.2 2.6 8.719100 employees or more 676............................ 62.3 4.6 4.9 5.8 7.1 4.5 .9 5.6 4.420
Black ~owned businesses 620 912...................... 69.9 2.7 4.3 1.5 1.6 .8 .8 8.7 9.721
With no paid employees 556 434.............................. 69.6 2.5 4.2 1.3 1.3 .6 .8 9.3 10.322With paid employees 64 478................................. 72.2 3.9 5.1 2.4 3.6 2.1 .7 4.3 5.623
No employees5 13 725.................................... 70.7 4.3 8.1 3.4 2.1 2.8 .2 6.2 2.1241 to 4 employees 37 587.................................. 73.6 4.3 3.6 2.0 3.9 1.5 .7 3.5 7.0255 to 9 employees 7 853.................................. 71.0 2.1 7.1 2.0 4.5 2.6 1.0 4.5 5.32610 to 19 employees 2 839................................ 72.5 3.2 3.9 2.5 2.9 4.1 .9 3.6 6.42720 to 49 employees 1 700................................ 66.9 1.4 4.8 5.5 4.5 2.5 2.2 7.5 4.72850 to 99 employees 432................................ 64.4 3.3 14.2 3.4 3.9 6.2 – 1.5 3.029100 employees or more 342............................ 58.4 13.6 9.8 .9 5.8 1.9 (D) 7.8 (D)30
Other minority ~owned businesses 606 426............. 56.9 4.4 7.4 3.9 4.7 2.1 1.6 5.4 13.731
With no paid employees 470 075.............................. 58.1 4.5 7.5 3.0 4.0 1.9 1.4 4.8 14.832With paid employees 136 351................................. 54.4 4.1 7.2 5.7 6.0 2.5 2.0 6.6 11.433
No employees5 19 989.................................... 52.5 3.7 6.9 10.6 2.8 3.4 1.4 3.5 15.2341 to 4 employees 76 636.................................. 55.9 4.6 6.1 4.8 5.6 1.8 1.4 7.9 11.8355 to 9 employees 22 862.................................. 56.5 3.2 7.7 4.8 7.5 1.9 2.2 4.7 11.53610 to 19 employees 10 051................................ 53.7 3.7 8.9 5.1 7.3 3.2 4.3 4.5 9.23720 to 49 employees 5 034................................ 48.8 3.6 9.9 7.7 7.7 5.4 2.8 7.4 6.73850 to 99 employees 1 075................................ 41.0 2.8 8.8 5.7 12.1 4.8 2.2 16.1 6.539100 employees or more 705............................ 33.0 12.8 10.0 3.6 3.4 5.7 2.0 19.3 10.340
Women ~owned businesses 5 888 883.................... 67.8 3.3 4.9 2.4 3.2 2.3 .8 6.3 9.041
With no paid employees 5 071 110.............................. 68.2 3.4 4.7 2.1 2.7 1.9 .7 6.8 9.442With paid employees 817 773................................. 66.0 3.0 5.9 3.8 5.3 3.7 1.3 3.8 7.243
No employees5 127 905.................................... 61.2 7.9 4.7 5.0 5.9 7.9 1.6 2.2 3.6441 to 4 employees 435 550.................................. 67.5 2.2 5.9 3.6 5.1 3.1 1.3 4.1 7.2455 to 9 employees 134 476.................................. 69.8 1.9 5.7 3.4 5.0 3.2 .9 2.6 7.44610 to 19 employees 67 487................................ 63.9 2.9 6.8 3.1 5.4 3.5 1.3 4.5 8.54720 to 49 employees 35 515................................ 61.7 2.5 6.3 5.4 6.2 2.8 1.8 5.0 8.24850 to 99 employees 10 178................................ 56.0 2.6 7.7 4.7 7.4 3.7 1.2 6.8 9.949100 employees or more 6 663............................ 49.8 4.7 9.0 2.1 5.1 4.3 3.1 6.2 15.650
Nonminority male ~owned businesses 10 114 456.......... 64.6 2.7 5.9 3.9 5.9 5.1 .9 4.8 6.351
With no paid employees 8 019 462.............................. 65.2 2.6 5.7 3.5 5.5 5.2 .7 4.9 6.852With paid employees 2 094 993................................. 62.8 2.9 6.5 5.0 6.9 5.1 1.3 4.6 5.053
No employees5 271 380.................................... 64.8 5.4 6.2 6.3 8.4 3.8 – 2.5 2.6541 to 4 employees 1 155 800.................................. 67.4 2.7 6.3 4.2 5.7 3.8 1.2 3.7 4.9555 to 9 employees 334 483.................................. 60.5 1.9 6.6 4.8 6.0 5.6 2.3 6.2 6.15610 to 19 employees 173 140................................ 58.9 2.8 6.2 6.6 6.9 6.7 .9 4.9 6.15720 to 49 employees 101 938................................ 51.7 3.0 8.1 6.1 11.6 7.7 1.1 6.7 3.95850 to 99 employees 33 406................................ 52.0 4.7 6.5 5.0 8.7 9.9 2.4 4.8 6.159100 employees or more 24 846............................ 50.3 3.0 4.0 6.9 11.3 8.2 1.7 8.1 6.460
1Data represent percentage of owners reporting in the designated categories.2Includes owners who had no previous work experience prior to starting/acquiring their businesses.3For explanation of relative standard errors and standard errors, see Reliability of Estimates in the introductory text.4Relative standard errors are not applicable for lines 1 through 10 since these data are the result of censuses, not surveys.5Firms reported annual payroll, but did not report any employees on their payroll during specified period in 1992.
106 CHARACTERISTICS OF BUSINESS OWNERS 1992 ECONOMIC CENSUS

Business by Employment Size of Firm: 1992
Standard error of estimate3 for columnmRelative
standarderror of
estimate3 4
A B C D E F G H I J
(X) .7 .2 .3 .2 .4 .5 .1 .3 .4 1
(X) 1.0 .2 .5 .3 .5 .6 .1 .4 .5 2(X) .9 .1 .3 .2 .4 .3 .2 .5 .4 3(X) 3.4 1.7 1.2 1.5 2.1 2.4 .2 1.0 .5 4(X) 1.3 .2 .5 .3 .3 .3 .3 .6 .5 5(X) 1.7 .3 .9 .4 .7 .5 .4 1.6 .9 6(X) 1.9 .4 .9 .8 1.0 .6 .2 .6 1.6 7(X) 1.2 .4 .9 .6 1.0 .9 .3 .7 .7 8(X) 1.8 .7 1.0 .9 1.7 1.0 .6 .7 .8 9(X) 2.8 .6 .9 1.1 1.9 1.0 .6 1.5 1.7 10
– 1.3 .2 .4 .2 .3 .2 .2 .6 .5 11
– 1.7 .2 .4 .3 .3 .3 .3 .6 .7 121.0 1.6 .5 .7 .3 1.0 .3 .2 .7 .8 132.0 4.2 3.0 3.1 1.0 1.8 .7 .2 1.6 1.0 141.0 2.3 .9 .7 .6 .9 .4 .2 1.3 1.7 152.0 2.6 .9 1.2 .7 1.6 1.1 .3 .9 1.1 163.0 3.3 .7 1.9 .7 1.7 .6 .9 .8 1.2 174.0 3.4 .5 2.0 .9 1.1 1.4 .4 .9 3.9 186.0 4.9 1.3 3.5 1.1 2.8 .9 .5 .7 1.3 198.0 5.6 2.4 1.4 3.6 1.9 2.1 .4 1.8 2.1 20
– 1.0 .3 .3 .2 .2 .2 .2 .5 .6 21
– 1.1 .3 .3 .2 .2 .2 .2 .6 .7 221.0 1.7 .6 .6 .5 .6 .7 .2 .6 .8 232.0 4.4 1.2 2.9 2.3 .7 1.3 .2 2.7 .7 241.0 2.2 1.2 .9 .6 .9 .7 .2 .6 1.0 253.0 2.3 .7 1.4 .5 1.0 1.4 .4 1.6 1.0 264.0 3.2 1.2 1.3 1.1 1.0 2.0 .4 1.6 2.0 276.0 5.0 .5 1.9 2.4 1.9 1.4 1.2 2.0 1.6 288.0 7.6 1.6 3.9 1.7 3.1 2.0 – .7 2.2 29
– 6.4 4.1 3.3 .5 2.7 1.9 (D) 2.3 (D) 30
– .8 .4 .8 .4 .5 .2 .2 .4 .9 31
– 1.1 .5 1.0 .5 .6 .3 .2 .6 1.2 321.0 .9 .5 .7 .7 .8 .3 .3 1.1 .7 332.0 5.7 1.1 2.4 4.7 1.4 1.5 .9 .8 5.8 341.0 1.6 .8 .8 .8 1.7 .4 .8 1.7 1.2 352.0 1.2 .9 1.3 .7 1.0 .7 .6 1.1 1.2 362.0 2.3 .7 1.5 .6 1.3 .6 1.8 1.1 1.3 374.0 2.9 1.2 1.5 2.5 1.6 1.7 .8 1.7 1.7 386.0 5.6 1.1 1.7 2.1 2.9 1.4 1.2 4.2 2.2 396.0 6.0 3.2 3.5 1.2 1.3 2.2 .8 6.7 3.0 40
– .5 .5 .4 .2 .3 .1 .1 .3 .6 41
– .7 .5 .4 .3 .3 .2 .1 .4 .7 42– 1.4 .7 .4 .5 .5 .7 .3 .4 .6 43
1.0 5.1 3.8 1.4 1.3 1.3 3.8 .7 .5 1.0 44– 1.6 .4 .6 .6 .9 .6 .5 .6 1.2 45
1.0 2.0 .5 .2 .5 .6 .5 .2 .4 .9 461.0 2.7 1.0 .9 1.0 1.2 .6 .7 .5 1.2 471.0 2.0 .6 .9 .8 1.5 .6 .3 .8 1.0 482.0 3.7 1.2 1.8 1.7 2.0 .7 .6 2.0 1.7 492.0 5.1 1.5 2.8 .4 1.4 1.0 1.2 1.7 3.1 50
– 1.2 .3 .4 .4 .5 .7 .2 .5 .5 51
– 1.6 .4 .5 .5 .8 1.0 .2 .6 .7 52– 1.2 .4 .5 .3 .6 .3 .3 .6 .5 53– 5.5 2.4 1.9 2.6 3.0 1.7 – 1.7 .7 54– 1.8 .4 .8 .5 .4 .5 .5 1.0 .6 55– 2.8 .5 1.3 .7 1.1 .8 .7 2.1 1.3 56
1.0 2.5 .6 1.3 1.1 1.4 1.0 .2 .9 1.9 571.0 1.9 .5 1.2 .8 1.4 1.2 .5 .9 .6 581.0 2.6 .8 1.2 1.3 2.0 1.2 .7 1.0 1.0 591.0 3.9 .7 .9 1.6 2.6 1.4 .8 2.0 1.6 60
1992 ECONOMIC CENSUS CHARACTERISTICS OF BUSINESS OWNERS 107
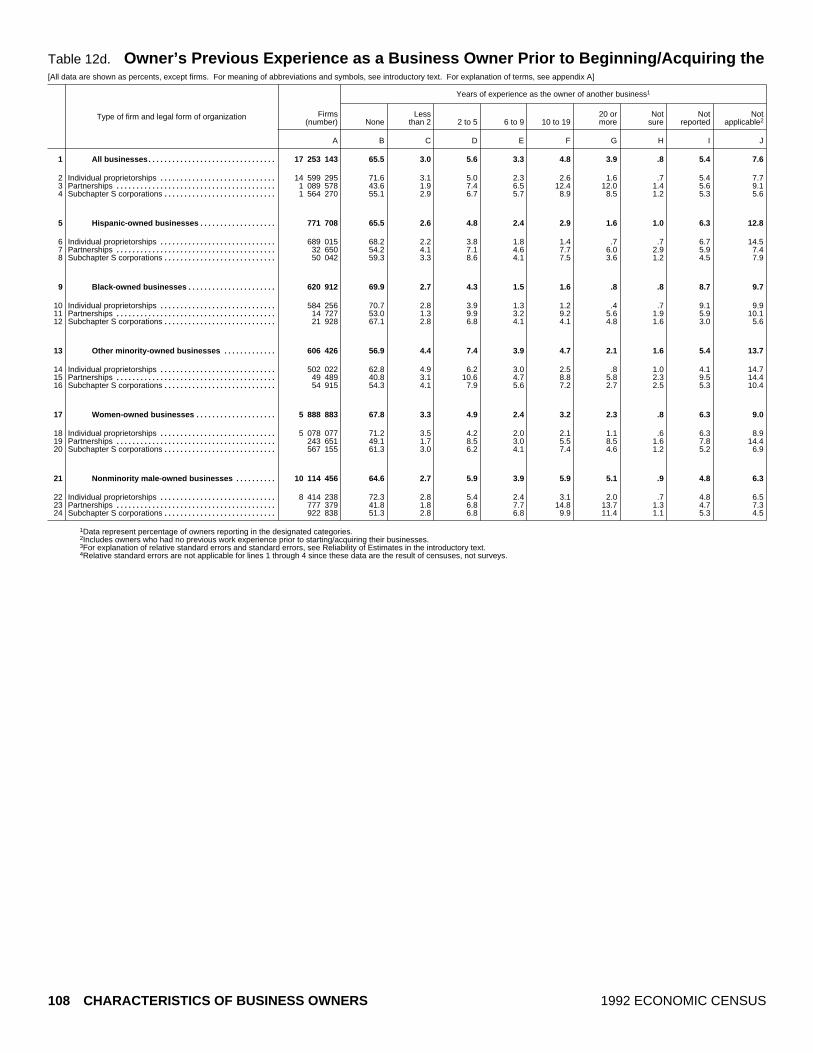
Table 12d. Owner’s Previous Experience as a Business Owner Prior to Beginning/Acquiring the[All data are shown as percents, except firms. For meaning of abbreviations and symbols, see introductory text. For explanation of terms, see appendix A]
Type of firm and legal form of organization
Years of experience as the owner of another business1
Firms(number) None
Lessthan 2 2 to 5 6 to 9 10 to 19
20 ormore
Notsure
Notreported
Notapplicable2
A B C D E F G H I J
All businesses 17 253 143................................ 65.5 3.0 5.6 3.3 4.8 3.9 .8 5.4 7.61
Individual proprietorships 14 599 295............................. 71.6 3.1 5.0 2.3 2.6 1.6 .7 5.4 7.72Partnerships 1 089 578........................................ 43.6 1.9 7.4 6.5 12.4 12.0 1.4 5.6 9.13Subchapter S corporations 1 564 270............................ 55.1 2.9 6.7 5.7 8.9 8.5 1.2 5.3 5.64
Hispanic ~owned businesses 771 708................... 65.5 2.6 4.8 2.4 2.9 1.6 1.0 6.3 12.85
Individual proprietorships 689 015............................. 68.2 2.2 3.8 1.8 1.4 .7 .7 6.7 14.56Partnerships 32 650........................................ 54.2 4.1 7.1 4.6 7.7 6.0 2.9 5.9 7.47Subchapter S corporations 50 042............................ 59.3 3.3 8.6 4.1 7.5 3.6 1.2 4.5 7.98
Black ~owned businesses 620 912...................... 69.9 2.7 4.3 1.5 1.6 .8 .8 8.7 9.79
Individual proprietorships 584 256............................. 70.7 2.8 3.9 1.3 1.2 .4 .7 9.1 9.910Partnerships 14 727........................................ 53.0 1.3 9.9 3.2 9.2 5.6 1.9 5.9 10.111Subchapter S corporations 21 928............................ 67.1 2.8 6.8 4.1 4.1 4.8 1.6 3.0 5.612
Other minority ~owned businesses 606 426............. 56.9 4.4 7.4 3.9 4.7 2.1 1.6 5.4 13.713
Individual proprietorships 502 022............................. 62.8 4.9 6.2 3.0 2.5 .8 1.0 4.1 14.714Partnerships 49 489........................................ 40.8 3.1 10.6 4.7 8.8 5.8 2.3 9.5 14.415Subchapter S corporations 54 915............................ 54.3 4.1 7.9 5.6 7.2 2.7 2.5 5.3 10.416
Women ~owned businesses 5 888 883.................... 67.8 3.3 4.9 2.4 3.2 2.3 .8 6.3 9.017
Individual proprietorships 5 078 077............................. 71.2 3.5 4.2 2.0 2.1 1.1 .6 6.3 8.918Partnerships 243 651........................................ 49.1 1.7 8.5 3.0 5.5 8.5 1.6 7.8 14.419Subchapter S corporations 567 155............................ 61.3 3.0 6.2 4.1 7.4 4.6 1.2 5.2 6.920
Nonminority male ~owned businesses 10 114 456.......... 64.6 2.7 5.9 3.9 5.9 5.1 .9 4.8 6.321
Individual proprietorships 8 414 238............................. 72.3 2.8 5.4 2.4 3.1 2.0 .7 4.8 6.522Partnerships 777 379........................................ 41.8 1.8 6.8 7.7 14.8 13.7 1.3 4.7 7.323Subchapter S corporations 922 838............................ 51.3 2.8 6.8 6.8 9.9 11.4 1.1 5.3 4.524
1Data represent percentage of owners reporting in the designated categories.2Includes owners who had no previous work experience prior to starting/acquiring their businesses.3For explanation of relative standard errors and standard errors, see Reliability of Estimates in the introductory text.4Relative standard errors are not applicable for lines 1 through 4 since these data are the result of censuses, not surveys.
108 CHARACTERISTICS OF BUSINESS OWNERS 1992 ECONOMIC CENSUS
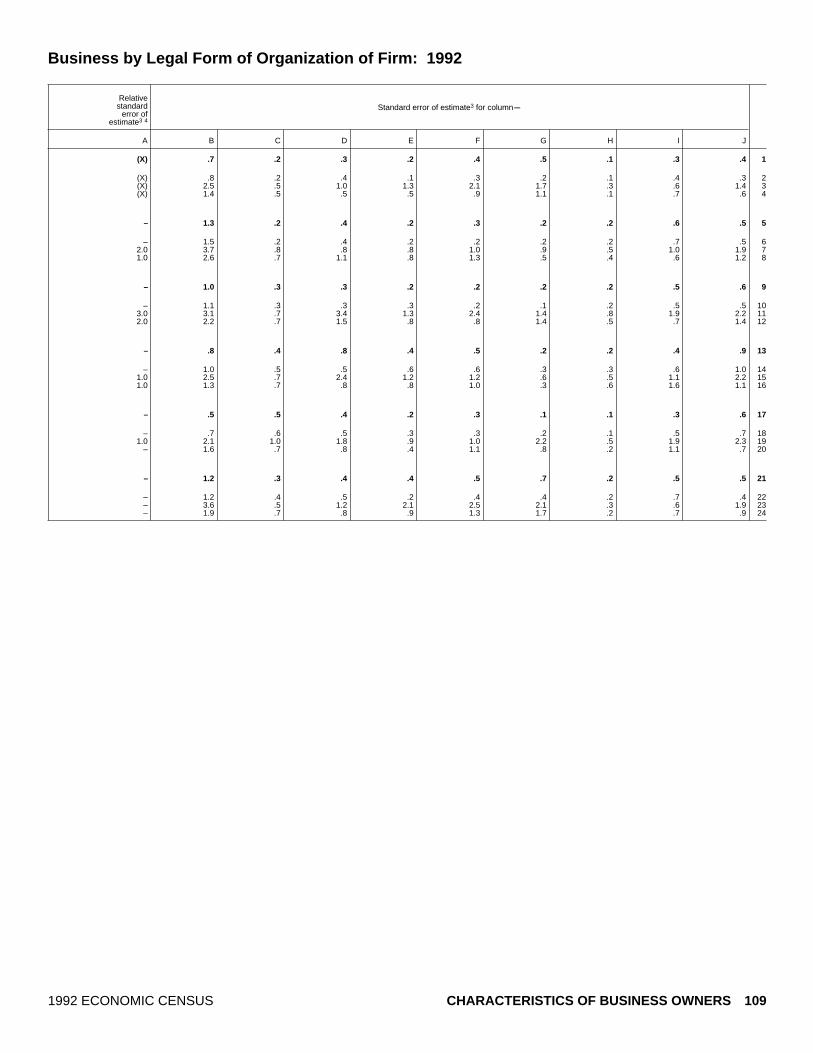
Business by Legal Form of Organization of Firm: 1992
Standard error of estimate3 for columnmRelative
standarderror of
estimate3 4
A B C D E F G H I J
(X) .7 .2 .3 .2 .4 .5 .1 .3 .4 1
(X) .8 .2 .4 .1 .3 .2 .1 .4 .3 2(X) 2.5 .5 1.0 1.3 2.1 1.7 .3 .6 1.4 3(X) 1.4 .5 .5 .5 .9 1.1 .1 .7 .6 4
– 1.3 .2 .4 .2 .3 .2 .2 .6 .5 5
– 1.5 .2 .4 .2 .2 .2 .2 .7 .5 62.0 3.7 .8 .8 .8 1.0 .9 .5 1.0 1.9 71.0 2.6 .7 1.1 .8 1.3 .5 .4 .6 1.2 8
– 1.0 .3 .3 .2 .2 .2 .2 .5 .6 9
– 1.1 .3 .3 .3 .2 .1 .2 .5 .5 103.0 3.1 .7 3.4 1.3 2.4 1.4 .8 1.9 2.2 112.0 2.2 .7 1.5 .8 .8 1.4 .5 .7 1.4 12
– .8 .4 .8 .4 .5 .2 .2 .4 .9 13
– 1.0 .5 .5 .6 .6 .3 .3 .6 1.0 141.0 2.5 .7 2.4 1.2 1.2 .6 .5 1.1 2.2 151.0 1.3 .7 .8 .8 1.0 .3 .6 1.6 1.1 16
– .5 .5 .4 .2 .3 .1 .1 .3 .6 17
– .7 .6 .5 .3 .3 .2 .1 .5 .7 181.0 2.1 1.0 1.8 .9 1.0 2.2 .5 1.9 2.3 19
– 1.6 .7 .8 .4 1.1 .8 .2 1.1 .7 20
– 1.2 .3 .4 .4 .5 .7 .2 .5 .5 21
– 1.2 .4 .5 .2 .4 .4 .2 .7 .4 22– 3.6 .5 1.2 2.1 2.5 2.1 .3 .6 1.9 23– 1.9 .7 .8 .9 1.3 1.7 .2 .7 .9 24
1992 ECONOMIC CENSUS CHARACTERISTICS OF BUSINESS OWNERS 109

Table 13a. When and How the Owner Acquired the Business by Industry Division: 1992[All data are shown as percents, except firms. For meaning of abbreviations and symbols, see introductory text. For explanation of terms, see appendix A]
Type of firm and industry division
Year that the owner acquired the business1
Firms(number) Before 1970
1970 to1979
1980 to1985
1986 to1988 1989 1990 1991 1992
Notreported
A B C D E F G H I J
All businesses 17 253 143............................ 6.8 13.5 17.8 16.3 7.5 7.7 8.3 12.8 9.31
Agricultural services, forestry, fishing, and mining 583 253..... 8.2 13.9 16.1 15.2 6.8 7.9 7.4 11.2 13.32Construction 1 829 620..................................... 7.0 16.2 15.2 12.4 8.8 8.8 8.9 16.6 6.03Manufacturing 517 714................................... 8.8 15.4 19.1 16.0 5.9 7.2 8.3 11.5 7.84Transportation, communications, and utilities 698 903......... 4.1 10.9 16.1 16.2 8.2 7.5 8.1 18.1 10.85Wholesale trade 538 339.................................. 8.7 13.5 17.3 17.4 6.9 8.5 9.7 9.6 8.56
Retail trade 2 478 045...................................... 6.6 13.8 16.9 15.4 7.1 8.0 9.6 14.7 8.07Finance, insurance, and real estate 1 941 029................. 8.8 17.5 22.4 18.9 6.0 4.6 7.2 5.6 9.08Services 7 784 016......................................... 6.0 11.8 17.9 16.9 8.2 8.7 8.2 12.9 9.49Industries not classified 882 224........................... 4.4 8.9 12.4 13.6 5.8 6.4 8.8 22.2 17.510
Hispanic ~owned businesses 771 708............... 4.1 10.0 16.0 14.2 6.8 9.0 9.8 18.4 11.811
Agricultural services, forestry, fishing, and mining 32 927..... 4.9 13.4 16.9 15.3 6.5 6.6 7.8 16.4 12.312Construction 97 476..................................... 4.9 12.7 14.4 15.4 7.0 8.1 8.8 16.0 12.613Manufacturing 18 461................................... 5.5 15.4 19.0 12.8 6.3 8.6 6.9 16.0 9.414Transportation, communications, and utilities 47 797......... 4.7 6.9 13.4 17.7 9.1 9.3 8.8 17.4 12.715Wholesale trade 17 727.................................. 6.1 13.6 19.5 14.6 11.2 11.4 7.4 9.3 7.016
Retail trade 107 846...................................... 4.0 12.2 17.4 11.5 7.3 10.3 11.1 18.3 7.917Finance, insurance, and real estate 49 231................. 6.1 15.0 23.4 14.0 7.0 8.9 6.1 9.9 9.818Services 347 297......................................... 3.2 7.7 15.7 14.5 6.2 8.9 11.3 20.4 12.219Industries not classified 52 945........................... 3.2 4.7 7.0 13.1 5.2 9.1 8.6 28.5 20.520
Black ~owned businesses 620 912.................. 6.7 10.2 14.5 13.0 6.7 7.4 9.0 16.5 16.021
Agricultural services, forestry, fishing, and mining 10 309..... 6.9 13.2 16.3 13.0 5.1 5.9 8.6 16.8 14.322Construction 43 381..................................... 10.9 15.7 19.1 11.4 7.7 5.0 5.3 11.7 13.223Manufacturing 10 469................................... 8.6 12.7 13.8 12.1 7.7 7.9 8.9 15.0 13.524Transportation, communications, and utilities 49 095........ 9.1 10.4 13.4 12.3 7.8 8.0 6.5 12.8 19.925Wholesale trade 7 550.................................. 3.5 8.3 15.6 17.9 5.8 8.0 10.4 19.8 10.726
Retail trade 86 840...................................... 5.0 10.7 11.9 15.4 7.1 7.3 10.2 19.4 12.927Finance, insurance, and real estate 40 924................. 3.9 12.1 19.2 16.7 9.9 6.3 7.7 10.7 13.528Services 332 981......................................... 6.8 9.1 14.6 12.6 6.2 7.7 9.6 17.1 16.229Industries not classified 39 363........................... 5.2 8.8 10.3 10.2 5.1 7.2 9.4 20.7 23.130
Other minority ~owned businesses 606 426.......... 3.7 10.6 17.3 15.2 8.5 9.6 10.9 16.7 7.531
Agricultural services, forestry, fishing, and mining 15 218..... 19.8 11.7 17.1 16.5 2.8 4.0 6.0 11.1 11.132Construction 28 295..................................... 5.3 11.6 20.1 15.6 12.2 8.8 6.3 14.8 5.233Manufacturing 18 976................................... 2.3 9.3 19.7 11.9 8.4 9.2 18.5 14.1 6.634Transportation, communications, and utilities 24 362......... 1.3 8.8 13.8 16.8 8.2 6.8 9.5 21.4 13.335Wholesale trade 20 043.................................. 2.0 8.4 17.3 19.3 7.8 11.6 12.8 15.4 5.536
Retail trade 132 483...................................... 2.3 9.7 16.7 15.9 10.1 10.4 13.1 16.9 4.937Finance, insurance, and real estate 64 762................. 7.0 14.9 19.5 15.4 5.3 6.9 7.9 12.1 10.938Services 273 774......................................... 2.5 10.3 17.4 14.7 8.8 10.9 10.5 17.3 7.539Industries not classified 28 512........................... 2.9 5.7 8.8 11.8 8.8 7.2 16.0 32.0 6.840
Women ~owned businesses 5 888 883................. 5.1 10.7 17.0 16.6 6.5 8.3 9.5 15.4 10.941
Agricultural services, forestry, fishing, and mining 119 731..... 9.6 15.9 13.9 14.3 4.7 8.5 6.7 12.4 14.142Construction 183 695..................................... 6.0 16.4 17.2 18.3 6.4 6.8 7.4 13.3 8.243Manufacturing 152 346................................... 7.7 17.2 17.2 17.4 5.6 6.7 8.9 11.2 8.144Transportation, communications, and utilities 141 623......... 3.6 11.4 19.1 14.4 8.8 9.6 9.1 14.9 9.145Wholesale trade 154 542.................................. 6.3 12.2 17.9 18.1 8.3 10.0 9.5 11.2 6.546
Retail trade 1 093 342...................................... 3.9 11.8 16.9 15.3 7.7 8.7 11.1 14.5 10.147Finance, insurance, and real estate 602 802................. 6.4 13.1 22.8 21.0 4.4 3.4 9.5 8.6 10.748Services 3 158 444......................................... 4.6 8.9 16.0 16.0 6.9 9.4 9.4 17.7 11.149Industries not classified 282 358........................... 7.0 5.8 10.2 14.8 3.7 8.3 8.0 23.6 18.650
Nonminority male ~owned businesses 10 114 456....... 7.9 15.3 18.4 16.4 8.1 7.3 7.5 10.9 8.251
Agricultural services, forestry, fishing, and mining 412 917..... 7.6 13.5 16.6 15.5 7.6 8.1 7.6 10.4 13.152Construction 1 496 056..................................... 7.2 16.5 14.8 11.4 9.2 9.3 9.2 17.2 5.153Manufacturing 333 485................................... 9.6 15.0 19.9 15.7 5.8 7.2 7.6 11.5 7.754Transportation, communications, and utilities 458 400......... 3.9 11.2 15.7 16.9 8.1 6.4 7.8 19.5 10.555Wholesale trade 352 721.................................. 10.2 14.3 17.0 17.1 6.0 7.6 9.7 8.6 9.656
Retail trade 1 197 943...................................... 9.5 15.9 16.9 15.5 6.4 7.2 7.8 14.5 6.257Finance, insurance, and real estate 1 240 594................. 9.9 19.4 22.5 18.3 6.8 4.8 6.2 3.8 8.358Services 4 102 294......................................... 7.3 14.1 19.3 18.0 9.5 8.0 7.0 8.9 8.059Industries not classified 520 046........................... 3.0 11.0 14.2 13.0 6.9 5.2 9.0 20.9 16.860
1Data represent percentage of owners reporting in the designated categories.2For explanation of relative standard errors and standard errors, see Reliability of Estimates in the introductory text.3Relative standard errors are not applicable for lines 1 through 10 since these data are the result of censuses, not surveys.
110 CHARACTERISTICS OF BUSINESS OWNERS 1992 ECONOMIC CENSUS

Method used to acquire the business1
Standard error of estimate2 for columnm
Founded
Receivedtransfer of
ownership/gift Purchased Inherited
Othermeans
Notreported
Relativestandard
error ofestimate2 3
K L M N O P A B C D E F G H I J K L M N O P
68.9 10.5 10.1 2.7 2.2 5.6 (X) .3 .4 .5 .5 .4 .4 .4 .5 .4 .8 .7 .7 .2 .2 .2 1
65.5 12.3 10.4 3.1 1.8 6.9 (X) 1.0 2.2 1.6 2.0 1.2 1.6 1.2 1.2 1.6 2.9 2.5 1.1 .9 .9 1.1 280.6 8.3 3.4 2.4 1.9 3.3 (X) 1.7 1.5 1.1 1.2 1.7 1.4 1.3 2.3 .8 2.2 2.8 1.1 .4 .9 .5 364.6 14.3 8.4 8.1 .6 4.0 (X) .8 1.4 2.3 1.3 1.0 .7 1.4 1.4 1.2 1.6 1.8 1.2 1.1 .2 .6 460.1 7.4 18.6 2.0 3.7 8.2 (X) .9 1.0 1.7 1.6 1.2 .7 1.4 1.7 1.2 2.7 1.1 1.8 .2 .8 1.4 563.7 13.5 10.0 5.9 .9 6.0 (X) 1.1 .8 1.1 .6 1.0 .8 1.1 1.0 1.4 1.2 .9 .7 .5 .2 1.0 6
53.7 15.3 20.1 3.0 3.0 4.9 (X) .8 .8 1.0 2.0 .4 .6 .9 .9 .9 1.5 1.2 1.2 .4 1.0 .7 760.7 19.1 9.2 4.1 2.1 4.8 (X) 1.8 1.7 2.0 2.3 1.7 .9 1.4 .8 1.5 2.4 1.6 1.8 1.0 .5 .9 876.2 6.5 8.0 1.6 1.8 5.9 (X) .4 .7 .9 .9 .8 .7 .6 .8 .7 1.1 1.0 1.0 .2 .2 .6 970.2 3.4 10.3 1.0 4.1 11.0 (X) 1.0 1.1 2.3 1.9 .8 1.1 1.7 2.4 2.1 2.8 1.0 1.9 .4 .9 1.3 10
67.4 8.9 9.1 2.1 5.5 7.0 – .5 .4 .5 .6 .2 .4 .6 1.0 .7 1.1 .2 .5 .3 .5 .5 11
68.8 7.9 8.5 3.0 4.2 7.6 1.0 .9 1.9 1.6 2.1 1.5 1.3 1.6 1.4 2.6 1.8 1.3 1.8 1.3 1.0 2.0 1276.3 4.9 2.8 2.2 5.4 8.4 1.0 1.7 1.4 1.7 1.3 1.2 1.8 1.2 2.1 1.4 2.2 1.5 .9 .6 1.4 .8 1368.5 13.0 6.3 5.1 1.4 5.7 1.0 .7 1.5 1.5 1.5 1.4 1.4 1.4 1.5 1.0 2.2 1.6 .9 1.7 .5 .8 1454.4 5.4 21.9 2.0 7.8 8.5 1.0 1.3 1.0 1.4 1.6 1.7 1.6 1.3 2.0 2.2 1.7 1.8 1.8 .8 1.5 1.7 1573.0 12.1 5.0 4.1 1.3 4.5 2.0 .8 1.1 1.8 1.7 .9 1.8 1.3 1.4 .6 1.6 1.0 .8 .7 .4 .7 16
55.4 15.7 17.9 2.8 3.4 4.8 1.0 .6 1.1 1.8 1.7 1.1 1.6 1.5 2.7 1.1 2.3 .9 1.3 .7 .8 1.0 1757.0 21.3 5.4 4.6 6.1 5.6 1.0 1.5 2.2 2.8 1.4 .8 1.8 .7 1.5 1.2 2.1 2.0 1.4 1.0 .8 1.2 1872.9 5.8 7.2 1.1 6.1 6.9 – .7 .5 1.2 1.2 .6 .8 1.2 1.7 1.6 2.1 1.0 .8 .4 1.2 1.0 1962.5 5.2 11.5 1.2 7.7 11.8 1.0 1.3 1.2 1.0 2.1 1.1 1.3 1.8 2.1 2.4 2.8 .9 1.7 .7 1.6 2.1 20
64.9 4.7 12.2 1.6 6.9 9.6 – .3 .5 .3 .4 .4 .3 .4 .6 .5 1.1 .3 .8 .2 .6 .4 21
68.8 5.2 9.8 2.2 5.6 8.4 1.0 1.6 1.8 2.8 1.1 1.1 1.0 1.6 1.7 1.9 1.5 1.1 1.2 .6 1.6 1.3 2278.9 3.5 4.5 1.7 4.0 7.3 – 1.7 1.1 2.0 1.2 1.7 1.0 1.0 1.1 1.5 2.5 .7 .9 .4 .8 1.5 2368.8 4.9 12.3 2.0 4.6 7.5 1.0 1.3 2.3 1.2 1.8 1.0 1.1 1.0 2.0 1.2 2.1 .8 1.4 .9 .6 1.2 2447.6 2.8 25.2 1.0 11.7 11.8 – .9 1.4 1.2 1.1 1.5 1.3 .8 1.7 2.2 2.4 .4 3.0 .3 1.1 1.8 2565.3 7.4 14.1 3.0 4.2 6.0 2.0 .4 .7 1.9 2.4 .8 .7 1.4 1.8 1.3 2.8 1.7 1.4 1.0 .8 1.3 26
51.0 7.3 24.3 2.2 7.1 8.2 – .8 1.0 .8 1.5 .9 .9 .8 1.0 1.3 .9 .6 1.3 .6 1.1 1.0 2761.7 12.2 8.5 2.8 6.4 8.4 1.0 .7 1.4 1.8 2.0 2.0 .8 .8 1.5 1.2 1.4 1.3 1.6 1.3 .9 .8 2870.0 3.7 8.5 1.3 6.9 9.6 – .6 .7 .5 .5 .8 .6 .6 .8 .8 1.7 .5 .9 .3 .9 .6 2959.7 3.8 14.4 1.5 6.5 14.1 – 1.0 1.7 1.8 1.5 1.0 .7 1.5 2.6 2.7 2.4 .7 1.6 .5 1.1 2.3 30
57.0 16.9 15.8 2.6 2.6 5.2 – .4 .9 .9 .8 .4 .7 .6 1.2 .5 1.1 1.1 .6 .2 .2 .5 31
57.8 9.8 17.3 3.6 3.6 7.9 1.0 3.0 2.2 3.2 2.3 .8 1.4 2.1 4.2 2.5 3.3 1.8 2.4 1.2 1.1 2.1 3275.4 11.0 5.1 2.1 .5 5.9 1.0 1.6 1.9 3.0 2.4 2.7 2.5 1.7 2.5 1.6 3.9 3.8 .9 .5 .3 1.3 3363.9 17.5 9.1 4.5 2.0 3.0 1.0 .4 1.2 3.9 2.0 1.9 1.7 4.6 2.9 1.1 3.0 2.6 2.4 1.2 1.0 .5 3460.8 6.8 19.9 1.3 4.6 6.5 1.0 .5 2.1 2.5 2.8 1.6 2.1 2.2 4.4 2.5 4.0 1.8 4.0 .8 2.0 2.0 3576.3 10.0 4.6 3.2 2.6 3.2 1.0 .3 1.2 1.8 1.3 1.2 1.6 2.4 2.1 1.5 2.6 1.5 1.1 .6 1.0 1.0 36
40.6 25.1 27.7 2.4 .4 3.7 1.0 .3 1.2 2.0 1.7 1.1 1.0 1.6 2.8 1.0 2.2 2.1 1.5 .4 .2 .8 3745.5 27.2 11.9 5.2 2.1 8.1 1.0 2.5 3.2 3.5 1.6 1.2 1.3 1.6 4.1 1.7 2.8 3.5 2.3 1.2 1.6 1.6 3865.2 11.5 12.9 1.7 3.8 5.0 – .5 1.2 1.2 1.1 .8 1.4 1.3 1.2 1.1 2.2 1.5 1.1 .4 .4 1.0 3963.5 7.3 18.4 .9 5.0 4.9 1.0 1.2 1.2 1.9 2.2 1.9 .9 2.6 3.7 1.8 2.0 2.3 2.2 .6 2.5 1.8 40
69.6 8.3 9.5 2.7 3.3 6.6 – .4 .8 .9 .9 .3 .4 .7 .7 .8 .6 .6 .4 .3 .3 .4 41
60.8 9.4 14.3 5.5 2.2 7.7 – 1.4 1.9 2.4 1.2 1.0 1.2 1.7 2.8 2.8 4.1 1.5 2.3 1.6 1.1 2.5 4278.8 5.9 3.2 4.2 1.4 6.6 – .7 2.7 1.8 1.7 1.4 1.4 1.4 2.3 1.3 1.7 .9 .7 .7 .9 1.4 4366.7 11.9 6.9 9.7 1.4 3.4 – 1.6 1.1 1.6 1.5 .6 1.4 1.4 1.5 1.2 2.5 1.6 .7 2.4 .7 .6 4462.0 9.7 15.2 3.2 2.9 7.0 – .7 1.9 1.9 2.0 1.3 2.9 2.1 1.9 .9 3.6 1.6 2.2 .7 .7 1.3 4566.1 12.9 8.4 6.2 1.9 4.5 – .9 1.1 1.1 1.7 1.3 1.6 1.4 1.2 .9 2.4 1.2 1.6 1.2 .8 .9 46
61.3 10.6 16.6 1.9 4.1 5.6 – .7 1.0 1.7 2.9 .9 .7 1.8 1.6 1.2 2.0 1.0 1.1 .4 1.4 .6 4760.0 13.7 9.2 6.7 4.0 6.4 – 1.7 1.6 3.4 2.5 1.5 .7 1.7 1.8 1.9 2.3 1.8 1.8 1.9 1.0 1.9 4876.4 6.0 6.8 1.0 3.1 6.8 – .7 1.3 1.9 1.0 .6 .6 1.5 .9 1.3 1.0 .4 .8 .2 .4 .8 4963.2 3.0 13.8 2.5 4.6 13.0 – 1.8 1.4 2.9 4.1 1.1 2.3 1.2 3.6 1.6 3.8 .8 2.6 .9 1.1 2.2 50
69.2 11.7 10.2 2.7 1.3 4.9 – .6 .8 .6 .8 .6 .5 .3 .6 .6 1.4 1.1 1.0 .3 .3 .4 51
66.9 13.6 9.1 2.4 1.5 6.5 – 1.5 3.1 2.1 2.9 1.8 2.1 1.9 1.3 2.3 4.0 3.4 1.4 1.1 1.0 1.4 5281.3 8.9 3.5 2.2 1.8 2.4 – 2.2 1.6 1.5 1.5 2.0 1.7 1.6 2.8 1.2 2.6 3.3 1.4 .5 1.2 .7 5363.3 15.3 9.1 7.7 .2 4.3 – 1.1 2.1 2.9 2.3 1.5 .7 2.0 1.8 1.9 3.0 2.5 1.9 .9 .1 1.1 5461.2 7.3 18.4 1.7 3.0 8.4 – 1.4 1.9 2.2 2.2 1.6 .8 2.1 2.6 1.7 3.4 1.4 2.2 .3 1.2 1.9 5561.7 14.1 11.0 6.0 .4 6.8 – 1.8 1.4 1.5 1.2 1.2 1.3 1.8 1.6 1.9 1.9 1.4 1.0 .5 .2 1.4 56
48.4 18.6 22.4 4.1 2.2 4.4 – 1.4 1.5 1.7 2.6 .9 1.2 2.2 1.5 1.7 2.1 1.7 2.2 .8 1.1 1.2 5761.6 20.8 9.3 3.0 1.3 4.0 – 2.8 2.6 2.7 3.3 2.1 1.3 1.7 .9 1.8 3.2 2.1 2.3 .8 .6 .7 5876.9 6.8 8.6 2.0 .5 5.2 – 1.0 1.1 1.3 1.7 1.4 1.2 .6 1.2 1.2 1.9 1.7 1.5 .4 .3 1.0 5975.0 3.3 7.9 .2 3.6 10.0 – 1.4 2.2 2.9 2.2 1.0 1.2 2.7 3.2 3.7 4.6 1.8 2.5 .1 1.8 2.2 60
1992 ECONOMIC CENSUS CHARACTERISTICS OF BUSINESS OWNERS 111

Table 13b. When and How the Owner Acquired the Business by Receipts Size of Firm: 1992[All data are shown as percents, except firms. For meaning of abbreviations and symbols, see introductory text. For explanation of terms, see appendix A]
Type of firm and receipts size
Year that the owner acquired the business1
Firms(number) Before 1970
1970 to1979
1980 to1985
1986 to1988 1989 1990 1991 1992
Notreported
A B C D E F G H I J
All businesses 17 253 143............................ 6.8 13.5 17.8 16.3 7.5 7.7 8.3 12.8 9.31
Less than $5,000 5 226 553................................. 4.4 8.6 11.8 12.3 8.1 7.9 11.1 21.6 14.12$5,000 to $9,999 2 443 946................................. 4.4 10.1 13.4 16.2 7.5 8.3 9.4 17.6 13.03$10,000 to $24,999 3 076 410............................... 6.5 12.5 18.3 17.0 6.9 9.9 8.0 12.8 8.04$25,000 to $49,999 1 945 806............................... 7.2 15.8 18.4 20.0 6.5 5.6 8.9 10.0 7.65$50,000 to $99,999 1 615 940............................... 9.1 14.5 22.9 17.7 9.6 8.6 5.8 6.1 5.56
$100,000 to $199,999 1 197 996............................. 7.9 18.7 23.7 18.8 7.3 7.8 6.0 5.5 4.37$200,000 to $249,999 301 794............................. 5.8 26.2 26.5 21.1 5.5 4.3 5.0 3.2 2.48$250,000 to $499,999 682 583............................. 10.6 18.1 24.1 17.2 6.9 6.3 6.2 4.5 6.19$500,000 to $999,999 372 078............................. 9.7 19.5 23.9 17.5 6.7 5.8 6.4 4.3 6.310$1,000,000 or more 390 037............................... 12.8 20.3 22.9 16.5 6.5 5.6 4.7 4.5 6.311
Hispanic ~owned businesses 771 708............... 4.1 10.0 16.0 14.2 6.8 9.0 9.8 18.4 11.812
Less than $5,000 219 226................................. 3.0 5.2 8.3 7.9 4.2 9.3 12.0 30.8 19.413$5,000 to $9,999 140 362................................. 2.9 4.3 12.5 9.2 6.8 9.5 10.9 24.8 19.114$10,000 to $24,999 165 667............................... 2.7 9.3 14.4 16.3 6.2 8.8 12.3 17.9 12.215$25,000 to $49,999 87 288............................... 5.9 12.2 18.0 17.3 6.8 9.9 8.2 15.9 5.916$50,000 to $99,999 64 742............................... 3.2 14.5 23.8 17.3 10.5 7.6 6.1 11.3 5.817
$100,000 to $199,999 41 578............................. 5.0 14.3 20.2 19.1 7.2 9.5 9.0 10.4 5.318$200,000 to $249,999 10 030............................. 7.1 13.6 23.9 17.7 8.7 9.1 10.6 4.3 5.019$250,000 to $499,999 22 301............................. 6.7 14.7 22.6 19.2 9.5 10.0 8.0 4.6 4.620$500,000 to $999,999 11 319............................. 6.1 15.6 27.8 17.6 9.5 7.7 4.9 4.2 6.521$1,000,000 or more 9 194............................... 11.4 20.5 23.3 19.0 6.6 5.9 3.3 5.3 4.822
Black ~owned businesses 620 912.................. 6.7 10.2 14.5 13.0 6.7 7.4 9.0 16.5 16.023
Less than $5,000 236 722................................. 4.2 6.4 9.3 10.3 6.4 6.6 9.3 24.8 22.624$5,000 to $9,999 111 512................................. 6.1 9.1 13.6 12.8 6.7 8.3 10.2 16.7 16.525$10,000 to $24,999 129 901............................... 8.3 10.9 14.2 14.3 6.1 8.0 10.4 13.3 14.526$25,000 to $49,999 62 209............................... 9.4 13.9 23.3 14.9 6.2 6.9 6.6 9.2 9.627$50,000 to $99,999 39 218............................... 9.0 15.3 21.5 15.2 9.5 8.1 6.9 8.5 6.128
$100,000 to $199,999 20 936............................. 9.1 18.4 22.3 17.3 8.1 8.4 6.4 4.5 5.429$200,000 to $249,999 4 533............................. 11.9 16.8 22.6 21.6 6.7 5.4 4.5 5.3 5.030$250,000 to $499,999 9 029............................. 8.9 19.3 24.9 17.7 10.5 5.2 5.9 2.5 5.131$500,000 to $999,999 3 823............................. 8.1 20.2 25.9 18.3 8.5 3.7 4.7 5.7 5.132$1,000,000 or more 3 028............................... 8.2 15.9 22.4 20.3 8.2 5.8 3.6 5.4 10.333
Other minority ~owned businesses 606 426.......... 3.7 10.6 17.3 15.2 8.5 9.6 10.9 16.7 7.534
Less than $5,000 132 493................................. 1.8 6.0 11.1 8.3 8.5 9.9 13.8 31.2 9.535$5,000 to $9,999 80 435................................. 3.5 9.4 5.9 10.7 6.4 8.8 14.8 29.6 10.936$10,000 to $24,999 108 195............................... 2.9 11.2 16.4 12.7 7.4 10.3 8.9 20.8 9.437$25,000 to $49,999 77 345............................... 3.9 5.9 21.4 15.4 8.0 8.5 12.1 18.7 6.238$50,000 to $99,999 70 360............................... 5.7 14.0 16.4 14.8 9.9 12.0 11.1 9.4 6.739
$100,000 to $199,999 58 620............................. 3.1 14.6 19.6 19.4 10.3 10.4 9.8 7.6 5.240$200,000 to $249,999 15 740............................. 7.7 10.1 22.7 29.6 6.5 7.2 7.1 5.7 3.441$250,000 to $499,999 34 266............................. 2.7 11.9 24.5 21.9 9.2 10.1 9.1 5.9 4.742$500,000 to $999,999 16 467............................. 4.3 13.9 26.8 16.6 8.8 6.7 8.6 6.8 7.643$1,000,000 or more 12 505............................... 5.6 16.7 22.0 18.8 8.4 6.8 6.8 5.7 9.444
Women ~owned businesses 5 888 883................. 5.1 10.7 17.0 16.6 6.5 8.3 9.5 15.4 10.945
Less than $5,000 2 310 303................................. 4.1 7.4 11.6 10.8 5.5 7.8 11.1 24.9 16.946$5,000 to $9,999 967 380................................. 3.6 8.3 11.9 18.4 6.0 10.6 9.7 20.5 11.047$10,000 to $24,999 1 051 358............................... 4.9 11.8 21.2 17.6 6.7 10.3 9.1 10.4 8.148$25,000 to $49,999 538 885............................... 7.1 8.4 20.3 25.1 8.2 4.2 9.1 9.6 8.049$50,000 to $99,999 381 517............................... 4.2 15.0 20.9 20.0 7.0 10.0 7.4 7.5 8.050
$100,000 to $199,999 267 089............................. 5.3 15.7 23.1 21.2 9.5 7.6 9.2 4.7 3.851$200,000 to $249,999 66 464............................. 5.2 16.5 29.6 22.8 4.6 4.1 8.7 4.2 4.352$250,000 to $499,999 146 313............................. 8.5 17.9 24.3 15.9 7.9 7.9 8.1 4.7 4.853$500,000 to $999,999 80 539............................. 8.0 19.3 25.3 17.8 7.9 5.4 7.3 3.8 5.154$1,000,000 or more 79 037............................... 14.6 20.9 21.8 16.4 5.6 5.7 4.3 4.1 6.855
Nonminority male ~owned businesses 10 114 456....... 7.9 15.3 18.4 16.4 8.1 7.3 7.5 10.9 8.256
Less than $5,000 2 608 047................................. 4.7 9.8 12.1 13.8 10.5 7.9 11.1 18.3 11.657$5,000 to $9,999 1 285 456................................. 5.0 11.7 14.9 15.2 8.8 6.6 8.7 14.9 14.058$10,000 to $24,999 1 763 830............................... 7.9 13.2 17.2 17.0 7.2 9.8 6.8 13.8 7.259$25,000 to $49,999 1 248 482............................... 7.3 19.6 17.5 18.6 5.6 5.8 8.7 9.5 7.560$50,000 to $99,999 1 108 065............................... 11.4 14.5 23.8 17.1 10.5 8.0 5.0 5.1 4.661
$100,000 to $199,999 840 723............................. 9.3 20.0 24.3 17.9 6.5 7.6 4.6 5.4 4.462$200,000 to $249,999 212 693............................. 5.6 31.9 25.8 19.9 5.5 4.2 3.3 2.4 1.463$250,000 to $499,999 488 462............................. 12.1 18.8 24.1 17.2 6.3 5.3 5.2 4.4 6.764$500,000 to $999,999 266 408............................. 10.7 20.1 23.3 17.4 6.0 5.8 6.0 4.2 6.565$1,000,000 or more 292 290............................... 12.6 20.5 23.2 16.2 6.6 5.6 4.8 4.5 6.166
1Data represent percentage of owners reporting in the designated categories.2For explanation of relative standard errors and standard errors, see Reliability of Estimates in the introductory text.3Relative standard errors are not applicable for lines 1 through 11 since these data are the result of censuses, not surveys.
112 CHARACTERISTICS OF BUSINESS OWNERS 1992 ECONOMIC CENSUS

Method used to acquire the business1
Standard error of estimate2 for columnm
Founded
Receivedtransfer of
ownership/gift Purchased Inherited
Othermeans
Notreported
Relativestandard
error ofestimate2 3
K L M N O P A B C D E F G H I J K L M N O P
68.9 10.5 10.1 2.7 2.2 5.6 (X) .3 .4 .5 .5 .4 .4 .4 .5 .4 .8 .7 .7 .2 .2 .2 1
72.7 5.4 9.0 .9 3.4 8.5 (X) .8 1.2 1.1 .8 1.2 .8 1.3 1.2 1.1 1.5 1.6 1.5 .4 .5 .9 271.1 9.4 6.8 2.0 3.5 7.2 (X) .8 1.4 1.6 2.3 1.1 1.3 1.1 2.2 1.5 2.7 2.5 1.0 .9 1.1 1.6 375.2 5.1 11.2 1.8 2.5 4.2 (X) 1.6 .7 2.1 1.1 .8 1.0 .8 1.3 .9 3.0 1.4 2.2 .6 .6 .4 475.6 7.6 9.6 1.4 1.5 4.3 (X) 1.8 1.5 1.5 3.1 1.6 1.3 1.2 1.0 1.3 2.5 1.3 1.7 .5 .3 1.0 570.1 11.6 12.2 2.0 .9 3.2 (X) 1.6 1.4 2.0 1.4 1.4 .8 .8 .7 .7 2.3 1.3 1.0 .4 .3 .6 6
66.4 13.3 13.4 3.2 .8 2.9 (X) .7 1.4 1.1 1.2 .9 .8 .9 .6 .6 2.0 1.3 .8 1.0 .2 .5 758.4 21.1 15.0 3.2 .8 1.5 (X) 1.4 4.8 4.9 2.6 1.3 1.3 1.4 .6 .3 3.8 4.3 3.4 .7 .4 .3 853.0 21.9 13.6 5.6 .6 5.3 (X) 1.3 .9 1.4 .9 .5 .6 .7 .7 1.2 1.3 1.2 1.2 1.0 .2 1.0 950.6 26.5 9.0 7.7 .8 5.4 (X) .6 1.3 1.3 1.0 .6 .5 .8 .5 .7 .9 1.6 .7 .7 .5 .6 1041.7 31.5 6.9 14.0 .5 5.4 (X) .3 1.0 .8 .8 .4 .4 .3 .2 .4 .9 .7 .3 .8 .1 .3 11
67.4 8.9 9.1 2.1 5.5 7.0 – .5 .4 .5 .6 .2 .4 .6 1.0 .7 1.1 .2 .5 .3 .5 .5 12
67.5 4.2 8.2 .7 8.8 10.6 1.0 .7 1.4 .8 .8 .6 1.8 1.3 1.5 2.6 2.1 .9 1.1 .3 1.4 1.4 1366.7 4.0 5.6 1.5 10.8 11.4 1.0 1.3 1.0 2.1 .9 1.3 1.1 1.9 2.6 1.3 3.2 .7 1.8 1.0 2.0 1.3 1471.5 4.3 9.5 1.9 5.9 6.9 1.0 .6 1.9 1.4 1.4 1.1 1.6 2.4 2.5 1.9 2.4 1.0 .9 .8 1.6 .7 1569.8 11.5 9.1 1.3 4.5 3.8 1.0 1.7 2.4 2.7 2.7 1.4 1.8 1.6 2.6 1.3 3.4 1.6 1.0 .7 1.9 1.3 1668.4 9.8 14.3 1.3 1.8 4.4 1.0 1.3 1.6 1.5 2.2 1.5 1.2 1.0 1.8 1.4 1.1 1.1 1.3 .3 .5 1.0 17
67.8 12.7 11.8 3.5 1.0 3.2 1.0 1.1 1.4 1.9 1.6 1.0 2.1 1.3 1.4 1.2 2.1 1.8 1.0 .5 .3 .9 1862.5 17.8 12.3 3.1 .4 3.9 3.0 1.7 2.2 3.9 3.4 1.8 2.7 2.4 1.4 1.3 4.1 3.9 1.9 .8 .3 1.3 1959.8 22.3 8.8 5.1 .6 3.5 2.0 1.0 1.6 1.5 2.3 1.7 1.7 1.3 .9 .8 2.8 2.2 .8 .8 .3 .6 2059.2 22.1 6.3 6.3 .4 5.7 3.0 .8 .9 2.2 2.5 1.8 1.4 1.0 1.0 1.4 3.3 1.8 .6 1.7 .1 1.5 2152.5 27.8 5.7 9.3 .4 4.3 2.0 1.9 1.3 .9 1.8 .6 .6 .5 .9 .4 1.8 1.3 .6 1.2 .1 .5 22
64.9 4.7 12.2 1.6 6.9 9.6 – .3 .5 .3 .4 .4 .3 .4 .6 .5 1.1 .3 .8 .2 .6 .4 23
62.4 2.9 10.1 1.2 9.7 13.7 – .4 .7 .7 .9 .5 .6 .5 .9 1.2 2.2 .4 1.1 .3 1.4 1.0 2468.7 3.8 9.7 .9 7.1 9.8 – 1.3 1.1 1.2 1.3 1.1 1.2 1.2 1.7 1.1 1.9 .9 1.4 .4 .9 1.0 2566.3 3.5 13.0 2.0 6.6 8.7 – .8 .8 1.3 1.6 .9 1.1 1.0 1.1 1.2 1.8 .7 1.7 .6 .8 .8 2666.0 6.2 16.6 .7 5.7 4.8 – .8 .5 3.0 1.3 1.3 1.6 1.4 1.4 1.6 1.6 .5 1.0 .4 1.1 1.1 2765.4 7.5 19.2 1.9 2.3 3.7 1.0 1.1 1.6 1.5 1.4 1.5 1.8 1.1 1.0 1.2 1.9 1.2 1.2 .6 .5 1.2 28
63.7 10.1 17.3 4.1 1.2 3.5 1.0 1.0 1.8 2.4 1.2 1.3 1.3 .8 .7 .9 2.0 2.1 1.9 .9 .5 .6 2962.6 13.8 17.1 2.3 .4 3.8 3.0 2.4 3.5 3.5 5.0 2.2 1.4 1.3 1.7 1.9 7.8 4.6 3.6 .8 .3 1.8 3062.4 17.7 11.0 4.6 .6 3.8 3.0 1.1 1.1 2.2 2.4 2.1 .6 .9 1.1 1.0 2.3 2.6 1.3 1.8 .3 1.0 3162.4 18.9 8.7 4.9 1.1 4.0 4.0 1.5 2.4 2.5 3.1 3.5 1.0 1.4 2.5 2.5 4.1 4.2 1.1 1.6 .7 2.4 3253.4 23.3 7.3 8.1 .3 7.6 4.0 1.5 1.9 1.8 2.5 1.6 1.3 1.1 1.5 1.6 2.1 1.4 1.1 1.3 .2 1.2 33
57.0 16.9 15.8 2.6 2.6 5.2 – .4 .9 .9 .8 .4 .7 .6 1.2 .5 1.1 1.1 .6 .2 .2 .5 34
67.1 9.3 11.2 1.9 4.7 5.8 1.0 .6 1.4 2.0 2.2 1.0 2.2 2.2 3.2 1.7 3.9 3.1 1.4 .7 1.4 1.9 3566.2 7.4 10.6 2.3 6.9 6.6 1.0 1.0 2.9 1.5 2.9 2.5 2.4 2.1 4.5 3.1 3.9 1.7 2.5 .9 1.7 2.4 3671.8 6.4 10.9 .6 4.3 6.0 1.0 1.2 1.7 3.8 2.7 2.0 1.8 1.8 3.6 2.0 3.3 2.6 2.0 .2 1.5 2.2 3749.6 18.0 24.9 2.7 1.8 3.1 1.0 1.3 1.9 3.4 1.9 1.5 2.1 2.3 3.5 1.6 4.4 3.4 3.7 1.5 .7 1.4 3852.0 15.4 24.0 1.5 1.3 5.8 1.0 2.0 2.4 1.5 2.4 1.8 1.8 1.5 1.4 1.4 4.3 3.5 3.2 .7 .5 1.3 39
49.8 21.9 20.3 3.2 .3 4.5 1.0 .5 1.8 1.7 1.8 1.6 1.3 .8 1.1 1.4 2.3 2.5 1.4 .9 .2 1.6 4051.8 26.2 15.5 2.9 1.0 2.6 2.0 2.3 2.0 3.0 4.5 1.4 2.3 1.9 1.5 .9 6.3 5.0 3.1 1.0 .7 .8 4149.5 29.7 12.5 4.0 .8 3.5 1.0 .4 1.4 1.6 1.6 1.0 1.6 1.1 1.2 .9 3.0 2.5 .8 .7 .2 .7 4249.0 28.8 11.3 3.8 .2 6.9 2.0 .6 1.2 1.8 1.8 1.3 1.1 1.6 1.8 2.1 2.2 1.8 .9 .8 .1 2.2 4343.3 33.3 6.7 7.8 .4 8.5 2.0 1.3 1.6 1.7 1.2 .9 .6 .6 .9 1.1 2.0 2.2 .6 .8 .1 1.0 44
69.6 8.3 9.5 2.7 3.3 6.6 – .4 .8 .9 .9 .3 .4 .7 .7 .8 .6 .6 .4 .3 .3 .4 45
74.1 2.8 7.1 .8 5.3 9.8 – .7 1.3 1.3 1.3 .5 1.1 1.6 1.5 1.6 2.0 .6 .8 .2 .9 1.4 4673.8 5.7 9.9 1.9 2.7 6.0 – 1.2 2.3 1.5 2.6 .9 1.5 1.4 2.2 1.9 2.3 1.7 1.9 .8 .6 1.1 4772.8 5.7 10.7 2.1 3.5 5.2 – 1.4 1.6 2.1 2.0 1.6 .9 1.4 1.2 1.3 2.1 1.6 1.7 1.0 1.4 .9 4871.0 6.2 12.6 3.6 2.4 4.2 – 1.8 1.3 3.7 3.7 1.6 1.3 3.5 1.8 1.5 3.0 1.7 1.8 1.6 .8 1.2 4963.6 13.8 12.5 2.8 1.5 5.8 – 1.2 2.1 2.0 2.1 1.0 1.2 .9 1.2 1.2 2.6 1.5 .8 .7 .7 1.5 50
64.8 17.1 10.8 3.2 .9 3.3 – 1.1 1.8 1.8 1.5 1.4 1.1 2.0 .9 1.1 2.2 2.0 .9 .5 .3 .9 5153.5 28.4 6.8 5.8 1.8 3.6 1.0 2.2 3.7 4.6 4.0 1.0 .9 3.0 1.3 1.3 3.2 4.7 1.7 1.8 1.0 1.4 5253.2 25.5 11.4 5.8 .3 3.8 1.0 1.1 2.2 1.8 .8 1.0 1.4 .9 1.1 .6 2.5 1.7 1.3 .7 .1 .5 5352.0 27.6 7.2 8.8 .1 4.3 1.0 .7 1.5 2.3 1.4 1.2 1.0 1.2 .9 .7 2.0 2.0 .5 1.3 – .7 5442.8 26.2 8.5 16.2 .6 5.8 1.0 .8 .8 .9 1.2 .6 .5 .6 .2 .6 1.1 1.0 1.1 .8 .3 .5 55
69.2 11.7 10.2 2.7 1.3 4.9 – .6 .8 .6 .8 .6 .5 .3 .6 .6 1.4 1.1 1.0 .3 .3 .4 56
72.3 7.2 10.6 1.0 1.6 7.2 – 1.3 1.8 2.3 1.4 2.0 1.6 1.7 1.9 1.5 3.2 2.8 2.7 .6 .8 1.4 5769.9 12.7 4.3 2.1 3.2 7.9 – 1.6 1.8 2.7 3.8 1.7 2.4 2.1 3.5 2.3 4.8 5.2 1.2 1.4 1.9 2.5 5877.7 4.8 11.7 1.6 1.3 3.0 – 2.2 1.5 2.5 1.6 1.4 1.5 1.1 2.3 1.9 4.8 1.7 3.0 .7 .9 .9 5979.2 7.7 7.5 .3 .8 4.5 – 2.4 2.3 1.8 3.9 2.2 2.5 1.5 1.7 1.6 3.5 1.7 2.5 .2 .4 1.4 6073.4 11.0 11.2 1.7 .6 2.0 – 2.2 2.2 2.7 1.9 2.2 1.4 .9 1.0 .9 2.7 1.9 1.4 .6 .3 .6 61
67.9 11.6 13.9 3.2 .7 2.7 – .9 2.0 1.5 1.8 1.0 1.3 .7 .8 1.0 2.8 1.8 1.3 1.3 .3 .8 6260.6 18.2 18.2 2.2 .3 .5 – 1.7 5.4 6.4 4.1 2.3 2.0 1.5 1.0 .5 5.8 6.1 4.7 .9 .5 .3 6352.8 20.1 14.5 5.8 .7 6.1 – 1.8 .8 1.8 1.2 .8 .9 .8 1.0 1.6 1.1 1.9 1.9 1.3 .3 1.4 6449.8 26.5 9.4 7.8 1.0 5.5 – 1.0 1.6 1.6 1.2 .9 .9 1.1 .7 .9 1.2 2.0 1.1 .9 .7 .8 6541.1 32.9 6.5 13.9 .6 5.1 – .3 1.3 .9 1.0 .6 .5 .5 .3 .5 .9 .8 .3 1.1 .2 .4 66
1992 ECONOMIC CENSUS CHARACTERISTICS OF BUSINESS OWNERS 113
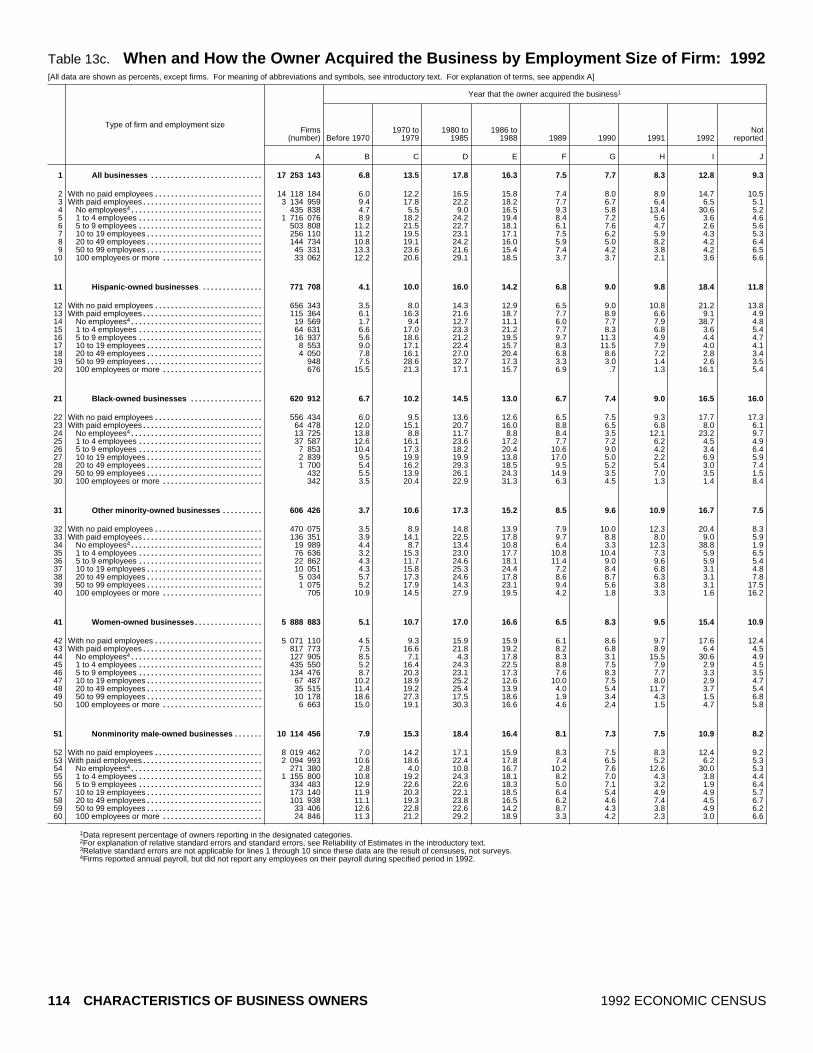
Table 13c. When and How the Owner Acquired the Business by Employment Size of Firm: 1992[All data are shown as percents, except firms. For meaning of abbreviations and symbols, see introductory text. For explanation of terms, see appendix A]
Type of firm and employment size
Year that the owner acquired the business1
Firms(number) Before 1970
1970 to1979
1980 to1985
1986 to1988 1989 1990 1991 1992
Notreported
A B C D E F G H I J
All businesses 17 253 143............................ 6.8 13.5 17.8 16.3 7.5 7.7 8.3 12.8 9.31
With no paid employees 14 118 184........................... 6.0 12.2 16.5 15.8 7.4 8.0 8.9 14.7 10.52With paid employees 3 134 959.............................. 9.4 17.8 22.2 18.2 7.7 6.7 6.4 6.5 5.13
No employees4 435 838................................. 4.7 5.5 9.0 16.5 9.3 5.8 13.4 30.6 5.241 to 4 employees 1 716 076............................... 8.9 18.2 24.2 19.4 8.4 7.2 5.6 3.6 4.655 to 9 employees 503 808............................... 11.2 21.5 22.7 18.1 6.1 7.6 4.7 2.6 5.6610 to 19 employees 256 110............................. 11.2 19.5 23.1 17.1 7.5 6.2 5.9 4.3 5.3720 to 49 employees 144 734............................. 10.8 19.1 24.2 16.0 5.9 5.0 8.2 4.2 6.4850 to 99 employees 45 331............................. 13.3 23.6 21.6 15.4 7.4 4.2 3.8 4.2 6.59100 employees or more 33 062......................... 12.2 20.6 29.1 18.5 3.7 3.7 2.1 3.6 6.610
Hispanic ~owned businesses 771 708............... 4.1 10.0 16.0 14.2 6.8 9.0 9.8 18.4 11.811
With no paid employees 656 343........................... 3.5 8.0 14.3 12.9 6.5 9.0 10.8 21.2 13.812With paid employees 115 364.............................. 6.1 16.3 21.6 18.7 7.7 8.9 6.6 9.1 4.913
No employees4 19 569................................. 1.7 9.4 12.7 11.1 6.0 7.7 7.9 38.7 4.8141 to 4 employees 64 631............................... 6.6 17.0 23.3 21.2 7.7 8.3 6.8 3.6 5.4155 to 9 employees 16 937............................... 5.6 18.6 21.2 19.5 9.7 11.3 4.9 4.4 4.71610 to 19 employees 8 553............................. 9.0 17.1 22.4 15.7 8.3 11.5 7.9 4.0 4.11720 to 49 employees 4 050............................. 7.8 16.1 27.0 20.4 6.8 8.6 7.2 2.8 3.41850 to 99 employees 948............................. 7.5 28.6 32.7 17.3 3.3 3.0 1.4 2.6 3.519100 employees or more 676......................... 15.5 21.3 17.1 15.7 6.9 .7 1.3 16.1 5.420
Black ~owned businesses 620 912.................. 6.7 10.2 14.5 13.0 6.7 7.4 9.0 16.5 16.021
With no paid employees 556 434........................... 6.0 9.5 13.6 12.6 6.5 7.5 9.3 17.7 17.322With paid employees 64 478.............................. 12.0 15.1 20.7 16.0 8.8 6.5 6.8 8.0 6.123
No employees4 13 725................................. 13.8 8.8 11.7 8.8 8.4 3.5 12.1 23.2 9.7241 to 4 employees 37 587............................... 12.6 16.1 23.6 17.2 7.7 7.2 6.2 4.5 4.9255 to 9 employees 7 853............................... 10.4 17.3 18.2 20.4 10.6 9.0 4.2 3.4 6.42610 to 19 employees 2 839............................. 9.5 19.9 19.9 13.8 17.0 5.0 2.2 6.9 5.92720 to 49 employees 1 700............................. 5.4 16.2 29.3 18.5 9.5 5.2 5.4 3.0 7.42850 to 99 employees 432............................. 5.5 13.9 26.1 24.3 14.9 3.5 7.0 3.5 1.529100 employees or more 342......................... 3.5 20.4 22.9 31.3 6.3 4.5 1.3 1.4 8.430
Other minority ~owned businesses 606 426.......... 3.7 10.6 17.3 15.2 8.5 9.6 10.9 16.7 7.531
With no paid employees 470 075........................... 3.5 8.9 14.8 13.9 7.9 10.0 12.3 20.4 8.332With paid employees 136 351.............................. 3.9 14.1 22.5 17.8 9.7 8.8 8.0 9.0 5.933
No employees4 19 989................................. 4.4 8.7 13.4 10.8 6.4 3.3 12.3 38.8 1.9341 to 4 employees 76 636............................... 3.2 15.3 23.0 17.7 10.8 10.4 7.3 5.9 6.5355 to 9 employees 22 862............................... 4.3 11.7 24.6 18.1 11.4 9.0 9.6 5.9 5.43610 to 19 employees 10 051............................. 4.3 15.8 25.3 24.4 7.2 8.4 6.8 3.1 4.83720 to 49 employees 5 034............................. 5.7 17.3 24.6 17.8 8.6 8.7 6.3 3.1 7.83850 to 99 employees 1 075............................. 5.2 17.9 14.3 23.1 9.4 5.6 3.8 3.1 17.539100 employees or more 705......................... 10.9 14.5 27.9 19.5 4.2 1.8 3.3 1.6 16.240
Women ~owned businesses 5 888 883................. 5.1 10.7 17.0 16.6 6.5 8.3 9.5 15.4 10.941
With no paid employees 5 071 110........................... 4.5 9.3 15.9 15.9 6.1 8.6 9.7 17.6 12.442With paid employees 817 773.............................. 7.5 16.6 21.8 19.2 8.2 6.8 8.9 6.4 4.543
No employees4 127 905................................. 8.5 7.1 4.3 17.8 8.3 3.1 15.5 30.6 4.9441 to 4 employees 435 550............................... 5.2 16.4 24.3 22.5 8.8 7.5 7.9 2.9 4.5455 to 9 employees 134 476............................... 8.7 20.3 23.1 17.3 7.6 8.3 7.7 3.3 3.54610 to 19 employees 67 487............................. 10.2 18.9 25.2 12.6 10.0 7.5 8.0 2.9 4.74720 to 49 employees 35 515............................. 11.4 19.2 25.4 13.9 4.0 5.4 11.7 3.7 5.44850 to 99 employees 10 178............................. 18.6 27.3 17.5 18.6 1.9 3.4 4.3 1.5 6.849100 employees or more 6 663......................... 15.0 19.1 30.3 16.6 4.6 2.4 1.5 4.7 5.850
Nonminority male ~owned businesses 10 114 456....... 7.9 15.3 18.4 16.4 8.1 7.3 7.5 10.9 8.251
With no paid employees 8 019 462........................... 7.0 14.2 17.1 15.9 8.3 7.5 8.3 12.4 9.252With paid employees 2 094 993.............................. 10.6 18.6 22.4 17.8 7.4 6.5 5.2 6.2 5.353
No employees4 271 380................................. 2.8 4.0 10.8 16.7 10.2 7.6 12.6 30.0 5.3541 to 4 employees 1 155 800............................... 10.8 19.2 24.3 18.1 8.2 7.0 4.3 3.8 4.4555 to 9 employees 334 483............................... 12.9 22.6 22.6 18.3 5.0 7.1 3.2 1.9 6.45610 to 19 employees 173 140............................. 11.9 20.3 22.1 18.5 6.4 5.4 4.9 4.9 5.75720 to 49 employees 101 938............................. 11.1 19.3 23.8 16.5 6.2 4.6 7.4 4.5 6.75850 to 99 employees 33 406............................. 12.6 22.8 22.6 14.2 8.7 4.3 3.8 4.9 6.259100 employees or more 24 846......................... 11.3 21.2 29.2 18.9 3.3 4.2 2.3 3.0 6.660
1Data represent percentage of owners reporting in the designated categories.2For explanation of relative standard errors and standard errors, see Reliability of Estimates in the introductory text.3Relative standard errors are not applicable for lines 1 through 10 since these data are the result of censuses, not surveys.4Firms reported annual payroll, but did not report any employees on their payroll during specified period in 1992.
114 CHARACTERISTICS OF BUSINESS OWNERS 1992 ECONOMIC CENSUS

Method used to acquire the business1
Standard error of estimate2 for columnm
Founded
Receivedtransfer of
ownership/gift Purchased Inherited
Othermeans
Notreported
Relativestandard
error ofestimate2 3
K L M N O P A B C D E F G H I J K L M N O P
68.9 10.5 10.1 2.7 2.2 5.6 (X) .3 .4 .5 .5 .4 .4 .4 .5 .4 .8 .7 .7 .2 .2 .2 1
72.5 7.6 9.5 1.6 2.6 6.1 (X) .4 .4 .6 .6 .4 .5 .4 .6 .6 .9 .8 .8 .2 .3 .4 257.0 20.0 12.3 6.2 .6 3.8 (X) .4 .5 .8 .6 .6 .4 .7 .4 .6 .9 .7 .6 .3 .1 .4 372.3 11.8 10.2 2.6 .7 2.3 (X) 2.2 1.5 1.7 2.0 2.7 1.7 3.0 1.8 1.6 2.3 2.1 2.1 .9 .4 .9 463.4 14.3 14.6 3.9 .6 3.3 (X) .6 1.0 1.2 1.1 1.2 .7 .6 .5 .6 1.6 1.2 .8 .5 .2 .5 551.1 24.7 13.0 6.1 .3 4.9 (X) 1.0 .9 1.3 1.2 .5 1.5 .6 .3 1.6 1.7 1.5 1.1 .8 .1 1.5 644.2 29.6 10.4 11.1 .4 4.3 (X) 1.5 1.6 1.4 1.1 .9 .8 1.0 .7 .6 2.1 1.6 1.2 1.2 .1 .4 742.7 33.1 6.9 10.0 1.7 5.6 (X) 1.0 1.1 1.7 1.5 .6 .6 1.9 .8 .9 1.6 1.1 .7 .8 .9 .6 831.7 35.9 4.7 21.2 1.0 5.4 (X) 1.4 2.4 1.9 1.7 1.9 .8 .7 1.2 .7 1.8 2.6 .9 3.1 .8 .6 928.1 39.0 5.9 21.2 .2 5.7 (X) 1.1 1.9 3.1 2.1 .9 1.0 .8 1.0 1.5 1.8 2.9 1.2 2.4 .1 1.2 10
67.4 8.9 9.1 2.1 5.5 7.0 – .5 .4 .5 .6 .2 .4 .6 1.0 .7 1.1 .2 .5 .3 .5 .5 11
68.7 6.6 8.5 1.4 6.9 8.0 – .5 .3 .7 .6 .3 .6 .7 1.1 1.0 1.4 .5 .5 .5 .6 .7 1263.2 16.4 11.1 4.6 1.0 3.7 1.0 .5 .8 1.5 1.5 .5 .5 .6 .7 .4 .9 .8 .6 .5 .3 .4 1372.8 12.6 6.6 2.4 1.7 3.9 2.0 .6 2.2 2.8 1.6 1.6 2.2 2.2 4.2 1.7 4.5 3.0 1.5 1.5 1.6 1.7 1465.4 12.0 14.0 3.8 1.1 3.8 1.0 1.0 1.5 2.1 2.2 1.2 .7 1.1 .6 1.0 1.9 1.2 1.7 .9 .3 .6 1559.6 18.6 10.7 6.8 .7 3.5 2.0 1.0 1.7 2.6 3.2 1.7 2.4 .9 .7 .7 2.4 2.3 1.9 1.3 .4 .7 1655.3 27.2 8.6 5.4 .3 3.2 3.0 1.7 2.1 3.1 2.2 1.9 2.0 2.3 1.1 1.0 2.4 1.9 1.8 1.0 .1 .8 1748.8 32.8 6.0 7.4 .5 4.5 4.0 1.4 2.3 1.7 2.8 1.8 1.6 1.7 .5 .9 3.8 3.6 1.4 1.4 .3 1.1 1851.3 32.9 4.1 8.5 .4 2.7 6.0 1.3 5.2 5.1 4.5 1.5 1.9 .7 1.1 1.4 5.5 5.8 .9 1.4 .3 1.2 1949.2 33.5 3.9 8.8 (D) (D) 8.0 3.8 3.4 2.4 3.6 2.9 .4 .4 6.5 2.0 5.0 6.2 1.1 2.2 (D) (D) 20
64.9 4.7 12.2 1.6 6.9 9.6 – .3 .5 .3 .4 .4 .3 .4 .6 .5 1.1 .3 .8 .2 .6 .4 21
64.5 4.1 12.0 1.4 7.7 10.3 – .4 .5 .2 .6 .4 .3 .4 .7 .6 1.4 .4 1.0 .2 .7 .5 2268.1 9.2 14.3 2.8 1.6 4.0 1.0 1.6 1.2 2.1 .9 1.1 1.1 .6 .9 .8 2.1 .6 1.0 .5 .5 .7 2371.3 5.3 15.3 .9 1.4 5.9 2.0 3.3 2.8 3.4 2.5 3.1 2.3 3.1 3.5 3.9 4.0 1.8 2.7 .5 1.2 2.5 2469.4 6.9 16.1 2.4 1.9 3.2 1.0 2.5 2.2 2.7 1.2 1.2 1.5 1.2 1.2 1.0 2.5 1.2 1.7 .8 .6 .6 2564.1 14.1 11.4 4.6 1.4 4.3 3.0 2.0 1.7 2.0 1.7 3.2 2.2 1.6 1.0 2.1 3.7 2.1 1.7 1.7 .9 1.8 2662.0 20.5 7.0 5.0 .7 4.7 4.0 1.5 3.7 2.3 2.5 4.1 1.1 .8 3.9 2.0 4.2 3.0 1.7 1.6 .7 1.8 2761.5 20.3 5.0 9.3 .3 3.6 6.0 1.1 3.2 4.6 2.9 3.4 2.0 2.3 .8 2.7 4.9 3.9 1.5 1.9 .4 .9 2841.7 46.4 6.1 3.9 (D) (D) 8.0 2.3 7.5 3.1 6.1 4.1 2.0 1.8 1.1 .7 7.4 8.1 1.6 2.1 (D) (D) 2962.0 21.6 2.2 6.6 (D) (D) 10.0 1.7 4.8 4.7 6.0 1.8 3.7 1.2 1.8 2.3 6.6 4.9 1.7 3.2 (D) (D) 30
57.0 16.9 15.8 2.6 2.6 5.2 – .4 .9 .9 .8 .4 .7 .6 1.2 .5 1.1 1.1 .6 .2 .2 .5 31
60.7 12.8 16.1 2.0 3.5 4.9 – .7 .9 1.4 1.3 .7 1.3 .8 1.6 .7 1.3 1.4 .9 .3 .3 .6 3249.3 25.1 15.1 3.9 .7 6.0 1.0 .5 1.2 1.0 1.4 .7 .7 .8 1.2 1.2 1.9 1.4 1.0 .4 .3 1.2 3361.6 13.2 16.8 1.5 .6 6.4 2.0 2.5 3.2 3.7 2.3 2.3 1.5 3.9 5.7 .8 6.7 1.5 5.9 1.1 .5 3.0 3448.4 22.1 19.2 3.2 .9 6.2 1.0 .4 2.1 1.7 2.0 1.0 1.3 .9 1.3 1.7 2.1 2.2 1.1 .5 .6 1.8 3551.2 27.8 11.5 4.5 .5 4.5 2.0 1.2 2.0 .9 2.5 1.3 1.8 2.1 1.7 1.1 2.8 2.2 1.4 1.1 .2 1.0 3644.9 37.4 7.9 5.4 .7 3.8 2.0 .7 3.2 2.7 2.8 1.3 1.2 2.1 .6 1.7 4.0 3.3 1.1 .9 .3 1.3 3743.5 35.1 7.3 6.4 .3 7.3 4.0 2.9 2.0 3.6 2.7 1.3 1.7 1.3 .6 1.6 4.1 3.3 1.8 1.3 .3 1.6 3831.5 35.3 5.7 10.2 .7 16.6 6.0 1.7 3.7 2.7 2.7 1.9 2.0 1.3 1.2 5.9 3.8 6.5 3.5 1.8 .3 5.0 3933.3 38.0 3.5 9.0 – 16.2 6.0 2.1 4.0 3.8 3.2 1.9 1.2 1.6 .9 4.8 5.8 7.3 1.6 2.7 – 4.8 40
69.6 8.3 9.5 2.7 3.3 6.6 – .4 .8 .9 .9 .3 .4 .7 .7 .8 .6 .6 .4 .3 .3 .4 41
72.4 5.1 9.3 2.0 3.9 7.3 – .5 .9 1.2 1.0 .3 .4 .7 .9 1.0 .8 .7 .6 .3 .4 .6 4258.0 21.7 10.6 5.6 .5 3.6 – .7 .5 1.4 1.3 .7 .5 1.5 .4 .4 .7 .9 .6 .2 .2 .5 4371.2 11.6 11.6 2.6 – 3.0 1.0 3.7 2.3 1.1 2.4 1.7 1.0 4.2 3.8 1.5 2.8 3.4 1.3 1.0 – .8 4463.4 18.4 10.8 3.2 .7 3.5 – .7 1.2 2.4 2.0 1.3 .9 1.5 .3 .7 1.7 1.8 1.2 .3 .4 .7 4548.8 30.0 10.1 7.5 .6 3.0 1.0 1.0 1.6 1.9 2.1 1.1 1.5 1.2 .4 .8 2.0 1.7 1.3 1.0 .3 .5 4649.0 27.0 11.2 8.4 .3 4.1 1.0 1.4 2.0 2.4 1.4 2.3 1.5 1.8 .6 .6 1.7 1.8 2.1 .8 .1 .6 4742.0 31.9 8.6 12.2 .4 4.8 1.0 1.4 1.8 1.9 2.0 .8 .9 3.2 1.0 .9 2.8 2.9 1.2 .6 .1 1.0 4835.7 29.1 7.9 20.2 .1 6.8 2.0 2.9 2.4 3.1 2.6 .4 .9 1.5 .4 2.0 2.1 2.2 1.6 1.9 .1 2.0 4934.9 26.5 7.4 26.0 – 5.1 2.0 3.0 3.3 4.4 4.7 2.4 .7 .4 1.5 1.5 5.3 5.3 2.5 4.6 – 1.6 50
69.2 11.7 10.2 2.7 1.3 4.9 – .6 .8 .6 .8 .6 .5 .3 .6 .6 1.4 1.1 1.0 .3 .3 .4 51
73.5 9.1 9.3 1.4 1.5 5.3 – .8 1.0 .7 1.1 .7 .8 .4 .7 .9 1.7 1.4 1.3 .3 .4 .6 5256.6 19.4 12.9 6.7 .6 3.8 – .6 .6 .9 1.1 1.0 .7 .6 .7 .8 1.5 .9 .8 .5 .2 .6 5373.6 12.0 9.1 2.7 1.0 1.6 – 1.6 1.4 2.9 4.0 3.5 2.6 3.3 3.1 2.8 4.0 3.1 3.3 1.2 .9 1.1 5464.1 12.4 15.8 4.3 .5 2.8 – 1.0 1.3 1.5 2.3 1.9 1.4 .7 .7 .8 2.4 1.5 1.3 .8 .3 .8 5551.7 22.4 14.3 5.6 .2 5.8 – 1.6 1.4 1.5 1.2 .4 2.1 .6 .4 2.0 2.7 2.1 2.0 .8 .1 2.1 5642.0 30.2 10.2 12.8 .4 4.5 1.0 2.1 2.2 1.9 2.2 .9 .9 .9 1.1 .9 2.9 2.3 1.3 1.7 .1 .7 5742.5 33.5 6.4 9.6 2.2 5.8 1.0 1.0 1.3 2.3 2.0 .7 .7 1.6 1.0 1.1 2.0 1.7 .9 1.1 1.5 .8 5830.2 37.6 3.9 22.3 1.3 4.7 1.0 1.7 3.2 2.6 2.0 2.3 1.1 .9 1.5 .9 2.1 3.0 .9 3.8 1.0 .8 5925.2 42.7 5.6 20.6 .2 5.6 1.0 1.1 2.4 3.9 2.6 1.1 1.3 1.2 1.1 1.9 2.3 4.3 1.1 3.1 .1 1.5 60
1992 ECONOMIC CENSUS CHARACTERISTICS OF BUSINESS OWNERS 115

Table 13d. When and How the Owner Acquired the Business by Legal Form of Organization of[All data are shown as percents, except firms. For meaning of abbreviations and symbols, see introductory text. For explanation of terms, see appendix A]
Type of firm and legal form of organization
Year that the owner acquired the business1
Firms(number) Before 1970
1970 to1979
1980 to1985
1986 to1988 1989 1990 1991 1992
Notreported
A B C D E F G H I J
All businesses 17 253 143............................ 6.8 13.5 17.8 16.3 7.5 7.7 8.3 12.8 9.31
Individual proprietorships 14 599 295.......................... 6.3 12.8 16.7 15.0 7.0 8.0 8.8 15.1 10.32Partnerships 1 089 578..................................... 8.9 17.9 23.6 21.0 7.8 3.7 6.1 4.8 6.23Subchapter S corporations 1 564 270........................ 7.3 13.2 18.5 18.8 9.9 9.5 8.0 8.1 6.84
Hispanic ~owned businesses 771 708............... 4.1 10.0 16.0 14.2 6.8 9.0 9.8 18.4 11.85
Individual proprietorships 689 015.......................... 3.8 9.3 14.0 13.2 6.2 9.2 10.7 20.0 13.76Partnerships 32 650..................................... 5.9 13.1 20.3 13.3 9.8 7.8 7.5 15.8 6.67Subchapter S corporations 50 042........................ 4.5 11.4 23.8 20.4 7.7 8.9 6.9 11.4 5.08
Black ~owned businesses 620 912.................. 6.7 10.2 14.5 13.0 6.7 7.4 9.0 16.5 16.09
Individual proprietorships 584 256.......................... 6.8 9.8 13.9 12.7 6.4 7.3 9.0 17.2 16.810Partnerships 14 727..................................... 8.3 15.0 21.0 16.5 10.9 8.1 5.4 8.2 6.611Subchapter S corporations 21 928........................ 3.5 13.5 21.2 18.3 10.7 7.7 11.4 8.3 5.512
Other minority ~owned businesses 606 426.......... 3.7 10.6 17.3 15.2 8.5 9.6 10.9 16.7 7.513
Individual proprietorships 502 022.......................... 2.7 8.7 14.8 14.3 8.2 10.3 12.3 21.3 7.314Partnerships 49 489..................................... 6.3 15.0 22.8 15.4 7.7 7.2 4.9 10.4 10.315Subchapter S corporations 54 915........................ 4.0 12.3 19.7 17.4 9.8 9.7 12.3 9.3 5.616
Women ~owned businesses 5 888 883................. 5.1 10.7 17.0 16.6 6.5 8.3 9.5 15.4 10.917
Individual proprietorships 5 078 077.......................... 4.5 9.4 15.3 15.1 6.4 8.9 9.8 18.3 12.418Partnerships 243 651..................................... 6.3 14.3 26.5 23.8 4.7 3.8 7.4 5.8 7.419Subchapter S corporations 567 155........................ 7.3 14.8 20.4 19.9 8.0 7.7 9.4 6.9 5.720
Nonminority male ~owned businesses 10 114 456....... 7.9 15.3 18.4 16.4 8.1 7.3 7.5 10.9 8.221
Individual proprietorships 8 414 238.......................... 7.5 15.1 17.7 15.1 7.3 7.4 8.1 12.9 8.922Partnerships 777 379..................................... 9.9 19.3 23.0 20.7 8.7 3.4 5.8 3.6 5.623Subchapter S corporations 922 838........................ 7.6 12.3 17.2 18.2 11.3 10.6 6.7 8.7 7.524
1Data represent percentage of owners reporting in the designated categories.2For explanation of relative standard errors and standard errors, see Reliability of Estimates in the introductory text.3Relative standard errors are not applicable for lines 1 through 4 since these data are the result of censuses, not surveys.
116 CHARACTERISTICS OF BUSINESS OWNERS 1992 ECONOMIC CENSUS

Firm: 1992
Method used to acquire the business1
Standard error of estimate2 for columnm
Founded
Receivedtransfer of
ownership/gift Purchased Inherited
Othermeans
Notreported
Relativestandard
error ofestimate2 3
K L M N O P A B C D E F G H I J K L M N O P
68.9 10.5 10.1 2.7 2.2 5.6 (X) .3 .4 .5 .5 .4 .4 .4 .5 .4 .8 .7 .7 .2 .2 .2 1
75.2 3.0 12.0 1.0 2.9 5.8 (X) .4 .5 .6 .4 .4 .4 .3 .6 .5 .8 .3 .7 .1 .3 .4 252.3 29.3 7.5 5.8 .2 4.9 (X) 1.8 .7 2.1 2.6 2.3 .6 1.8 .7 .9 3.7 2.5 1.8 1.3 .1 .7 352.6 30.6 3.2 7.8 .4 5.5 (X) .5 .7 .9 .9 1.6 .8 .9 .7 1.0 1.6 2.1 .5 .6 .1 .9 4
67.4 8.9 9.1 2.1 5.5 7.0 – .5 .4 .5 .6 .2 .4 .6 1.0 .7 1.1 .2 .5 .3 .5 .5 5
69.7 3.0 11.3 1.1 7.2 7.7 – .4 .5 .4 .8 .3 .6 .6 1.2 1.0 1.3 .2 .6 .4 .7 .7 650.2 35.1 3.7 5.0 .1 5.9 2.0 1.4 1.8 2.6 2.1 1.6 1.0 1.4 2.9 1.1 2.5 2.3 1.3 .9 .1 1.1 767.3 21.7 1.4 5.3 .2 4.2 1.0 .9 1.0 1.8 1.6 .8 .9 .9 1.3 .8 1.6 1.1 .4 .6 .1 .8 8
64.9 4.7 12.2 1.6 6.9 9.6 – .3 .5 .3 .4 .4 .3 .4 .6 .5 1.1 .3 .8 .2 .6 .4 9
65.2 3.1 12.9 1.3 7.5 10.0 – .3 .5 .4 .5 .3 .3 .4 .7 .5 1.2 .3 1.0 .2 .6 .4 1052.6 29.6 6.4 4.4 .3 6.7 3.0 2.8 3.2 2.5 2.1 2.8 2.4 1.7 1.7 1.6 4.0 3.4 2.2 1.8 .2 1.4 1168.5 18.7 3.0 5.7 – 4.0 2.0 .7 2.0 2.4 1.5 2.2 1.9 2.7 1.1 1.2 1.8 .9 1.6 1.2 – .8 12
57.0 16.9 15.8 2.6 2.6 5.2 – .4 .9 .9 .8 .4 .7 .6 1.2 .5 1.1 1.1 .6 .2 .2 .5 13
63.7 3.9 23.5 .9 4.2 3.8 – .3 .7 .9 1.0 .6 1.0 .6 1.2 .8 1.3 .6 .7 .3 .4 .6 1438.0 40.8 5.5 5.2 .2 10.3 1.0 1.5 3.1 3.5 1.8 1.5 1.5 1.2 3.3 1.5 3.1 3.6 1.9 1.0 .1 1.7 1554.6 31.9 3.3 5.1 .1 4.9 1.0 .7 .8 1.0 1.5 .9 .5 1.6 1.2 1.7 2.4 2.6 1.2 .6 .1 1.7 16
69.6 8.3 9.5 2.7 3.3 6.6 – .4 .8 .9 .9 .3 .4 .7 .7 .8 .6 .6 .4 .3 .3 .4 17
74.4 2.7 10.8 1.0 4.2 6.9 – .5 .9 1.1 .9 .3 .5 .7 .8 1.1 .9 .3 .6 .2 .4 .6 1848.4 25.6 9.8 9.1 – 7.1 1.0 1.4 2.5 3.8 3.9 .8 1.2 1.3 1.9 2.0 3.9 3.9 1.8 3.7 – 2.0 1958.0 25.5 3.7 7.2 .4 5.3 – .9 .7 1.2 1.2 .8 .9 1.1 1.0 1.1 1.0 1.7 .8 .7 .1 1.1 20
69.2 11.7 10.2 2.7 1.3 4.9 – .6 .8 .6 .8 .6 .5 .3 .6 .6 1.4 1.1 1.0 .3 .3 .4 21
76.7 3.2 12.3 1.1 1.7 5.0 – .8 1.0 .8 .7 .7 .5 .5 .8 .6 1.2 .5 1.1 .2 .4 .7 2254.2 29.5 7.3 4.9 .3 3.8 – 2.5 1.1 2.5 3.6 3.3 .7 2.3 .5 1.4 4.2 3.1 2.3 1.0 .1 .8 2348.7 34.0 2.8 8.5 .4 5.6 – 1.0 1.5 1.5 1.1 2.4 1.5 1.2 1.2 1.2 2.7 3.5 .7 1.0 .2 1.0 24
1992 ECONOMIC CENSUS CHARACTERISTICS OF BUSINESS OWNERS 117

Table 14a. Total Capital Needed by Owner to Start/Acquire the Business by Industry Division:[All data are shown as percents, except firms. For meaning of abbreviations and symbols, see introductory text. For explanation of terms, see appendix A]
Type of firm and industry division
Total capital needed to start/acquire the business1
Firms(number) None
Lessthan
$5,000
$5,000to
$9,999
$10,000to
$24,999
$25,000to
$49,999
$50,000to
$99,999
$100,000to
$249,999
$250,000to
$999,999$1,000,000
or moreNot
reported
A B C D E F G H I J K
All businesses 17 253 143....................... 25.0 32.0 9.6 11.4 5.7 4.6 3.0 1.4 .5 6.81
Agricultural services, forestry, fishing, andmining 583 253.................................... 20.4 30.4 14.1 10.4 6.6 3.5 3.2 1.6 .2 9.5
2
Construction 1 829 620................................ 26.4 39.8 10.6 11.8 3.1 2.1 .8 .4 .3 4.83Manufacturing 517 714.............................. 21.0 28.0 11.6 15.4 7.0 6.2 3.8 1.9 .8 4.34Transportation, communications, and utilities 698 903.... 25.3 19.5 10.8 18.4 9.9 4.7 1.9 .8 .4 8.35Wholesale trade 538 339............................. 22.4 26.6 10.1 12.0 8.8 6.2 5.1 2.0 .6 6.36
Retail trade 2 478 045................................. 14.7 33.4 8.5 13.4 8.1 8.0 5.1 1.8 .4 6.57Finance, insurance, and real estate 1 941 029............ 23.7 25.3 8.4 10.3 8.7 5.3 5.5 3.7 1.7 7.48Services 7 784 016.................................... 29.0 34.3 9.8 10.3 3.8 3.8 1.8 .7 .2 6.39Industries not classified 882 224...................... 31.1 31.5 6.5 8.4 3.9 1.8 2.1 .4 .1 14.210
Hispanic ~owned businesses 771 708.......... 27.5 31.1 11.3 10.5 4.8 3.7 2.0 .8 .2 8.111
Agricultural services, forestry, fishing, andmining 32 927.................................... 25.8 42.0 8.3 7.3 3.0 2.5 1.0 .4 .3 9.5
12
Construction 97 476................................ 31.1 33.7 10.9 8.6 3.2 2.1 .8 .2 .1 9.213Manufacturing 18 461.............................. 18.8 32.3 11.5 14.4 6.4 6.1 3.4 1.5 .6 4.814Transportation, communications, and utilities 47 797.... 22.5 22.2 17.9 18.2 5.8 1.3 1.4 .5 .1 10.015Wholesale trade 17 727............................. 18.0 30.9 12.6 13.9 8.8 5.3 4.4 1.2 .4 4.516
Retail trade 107 846................................. 17.2 30.3 11.4 14.3 7.8 6.7 3.4 1.3 .2 7.417Finance, insurance, and real estate 49 231............ 20.1 28.4 11.6 11.1 7.9 6.2 4.0 2.6 1.1 7.018Services 347 297.................................... 31.9 32.0 10.5 8.7 3.9 3.1 1.6 .5 .1 7.619Industries not classified 52 945...................... 38.7 25.9 11.2 7.6 .8 2.1 .6 .1 – 13.020
Black ~owned businesses 620 912............. 32.2 34.3 8.8 7.3 3.2 1.6 .9 .3 .1 11.221
Agricultural services, forestry, fishing, andmining 10 309.................................... 26.0 42.0 8.9 7.8 3.3 .6 .3 .9 .1 10.1
22
Construction 43 381................................ 39.0 34.5 8.9 5.6 1.9 .5 .3 .1 – 9.223Manufacturing 10 469.............................. 24.1 36.0 12.0 10.6 2.5 1.8 1.8 .7 .2 10.424Transportation, communications, and utilities 49 095... 25.4 25.7 14.8 12.6 5.1 2.0 .6 .5 .1 13.025Wholesale trade 7 550............................. 24.0 34.9 10.5 9.2 7.7 4.1 1.9 .6 .8 6.426
Retail trade 86 840................................. 20.4 41.5 9.0 11.0 4.1 2.6 .7 .5 .2 10.027Finance, insurance, and real estate 40 924............ 26.3 36.8 8.6 8.9 4.8 3.3 1.2 1.1 .6 8.428Services 332 981.................................... 36.3 33.8 7.8 5.6 2.7 1.3 1.0 .2 – 11.329Industries not classified 39 363...................... 35.9 29.1 7.5 5.7 2.3 1.2 .9 – .3 17.030
Other minority ~owned businesses 606 426..... 18.0 20.7 10.6 14.7 11.6 9.2 6.3 2.5 .8 5.731
Agricultural services, forestry, fishing, andmining 15 218.................................... 21.1 30.3 11.2 11.7 4.9 4.4 4.2 3.6 .4 8.0
32
Construction 28 295................................ 24.8 31.8 10.7 13.0 4.4 3.5 2.1 1.8 2.3 5.733Manufacturing 18 976.............................. 19.1 26.0 8.9 15.3 12.8 6.6 3.8 2.9 1.1 3.534Transportation, communications, and utilities 24 362.... 15.8 21.8 19.2 15.6 8.6 6.9 3.5 2.4 .5 5.635Wholesale trade 20 043............................. 14.7 22.7 11.2 16.1 12.5 9.2 5.6 2.4 .6 5.236
Retail trade 132 483................................. 6.6 12.8 9.2 19.7 18.9 17.4 9.6 1.8 .2 3.737Finance, insurance, and real estate 64 762............ 22.9 13.4 13.4 9.9 9.7 7.5 8.3 4.1 2.5 8.338Services 273 774.................................... 20.8 25.5 9.6 14.0 9.8 6.7 5.2 2.3 .3 5.839Industries not classified 28 512...................... 27.8 19.9 10.7 13.9 9.7 8.2 2.0 .9 – 7.040
Women ~owned businesses 5 888 883............ 29.9 34.2 7.7 8.5 4.5 4.2 2.6 .9 .4 7.341
Agricultural services, forestry, fishing, andmining 119 731.................................... 27.4 23.7 12.8 8.9 4.4 6.7 4.4 1.6 .4 9.7
42
Construction 183 695................................ 25.5 35.8 9.1 9.7 4.3 3.6 2.1 1.0 .2 8.743Manufacturing 152 346.............................. 26.1 28.6 10.0 13.5 4.9 6.2 3.5 1.4 .4 5.344Transportation, communications, and utilities 141 623.... 31.7 20.0 6.6 17.5 9.2 6.3 2.5 .6 .2 5.345Wholesale trade 154 542............................. 25.7 27.0 9.7 11.0 9.4 5.4 3.3 1.9 .4 6.146
Retail trade 1 093 342................................. 17.0 39.7 8.0 11.6 5.6 6.2 3.7 1.3 .2 6.747Finance, insurance, and real estate 602 802............ 27.6 30.5 6.2 9.1 5.2 4.9 4.9 1.8 1.6 8.248Services 3 158 444.................................... 35.7 35.2 7.5 6.2 3.5 3.0 1.5 .4 .1 6.849Industries not classified 282 358...................... 35.0 31.6 5.7 7.4 2.5 1.8 2.0 .3 – 13.750
Nonminority male ~owned businesses 10 114 456.. 22.6 31.3 10.5 12.9 6.3 4.7 3.2 1.7 .5 6.451
Agricultural services, forestry, fishing, andmining 412 917.................................... 17.9 31.3 15.1 11.0 7.6 2.7 3.0 1.7 .2 9.5
52
Construction 1 496 056................................ 25.9 40.9 10.8 12.4 3.0 1.9 .6 .3 .2 3.853Manufacturing 333 485.............................. 18.9 27.6 12.4 16.3 7.8 6.2 4.0 2.1 1.0 3.854Transportation, communications, and utilities 458 400.... 24.0 18.7 10.6 19.1 11.0 4.7 1.7 .8 .6 8.955Wholesale trade 352 721............................. 21.3 26.3 10.1 12.3 8.6 6.5 5.9 2.0 .6 6.556
Retail trade 1 197 943................................. 13.3 30.3 8.6 14.1 9.4 8.9 6.1 2.3 .6 6.557Finance, insurance, and real estate 1 240 594............ 22.2 23.6 9.0 10.7 10.1 5.4 5.8 4.5 1.7 7.058Services 4 102 294.................................... 24.5 34.1 11.4 13.4 3.7 4.3 1.8 .8 .2 5.859Industries not classified 520 046...................... 28.8 32.0 6.2 8.7 4.8 1.6 2.4 .5 .1 14.860
1Data represent percentage of owners reporting in the designated categories.2For explanation of relative standard errors and standard errors, see Reliability of Estimates in the introductory text.3Relative standard errors are not applicable for lines 1 through 10 since these data are the result of censuses, not surveys.
118 CHARACTERISTICS OF BUSINESS OWNERS 1992 ECONOMIC CENSUS

1992
Standard error of estimate2 for columnmRelative
standarderror of
estimate2 3
A B C D E F G H I J K
(X) .9 1.0 .5 .6 .4 .2 .3 .1 – .3 1
(X) 2.2 2.4 1.7 1.6 1.0 .5 .3 .7 – 1.02
(X) 2.8 2.4 2.0 2.6 .5 .3 .1 .1 .1 .8 3(X) 1.8 2.7 1.4 1.2 .8 .7 .6 .1 .1 .4 4(X) 2.3 1.1 1.7 1.9 1.6 .7 .4 .1 .1 .8 5(X) 1.5 1.7 1.3 1.2 .5 .8 .5 .2 .1 1.1 6
(X) .9 1.6 .9 .8 .6 .9 .7 .2 .1 .8 7(X) 2.1 1.8 1.7 1.0 1.9 1.0 1.3 .5 .3 1.1 8(X) 1.4 1.4 .6 1.2 .3 .4 .1 .1 – .6 9(X) 2.6 3.5 .8 1.8 1.1 .7 .7 .1 .1 2.1 10
– .7 1.1 .7 .5 .4 .3 .2 .1 .1 .6 11
1.0 3.1 3.6 1.6 1.2 .9 .6 .4 .2 .2 3.412
1.0 2.4 1.8 1.6 1.3 1.0 .9 .3 .1 .1 1.6 131.0 1.8 2.1 1.2 1.5 1.0 .8 .9 .5 .3 .9 141.0 2.6 2.7 2.2 1.5 .7 .4 .6 .3 .1 1.6 152.0 1.9 2.7 1.7 2.6 1.2 1.0 1.0 .3 .1 .7 16
1.0 1.5 1.8 1.0 .7 .9 .8 .7 .3 .1 1.4 171.0 1.9 1.6 1.8 1.4 1.5 1.0 .5 .5 .4 1.2 18
– 1.6 2.1 1.2 .7 .5 .5 .5 .1 – 1.2 191.0 2.2 1.9 2.2 1.3 .5 1.0 .3 .2 – 2.2 20
– .9 .6 .4 .4 .2 .1 .1 .1 – .4 21
1.0 1.7 2.5 1.3 1.4 .9 .1 .1 .5 .1 1.622
– 2.6 1.7 1.2 1.3 .4 .3 .1 .1 – 1.5 231.0 1.3 2.0 1.4 .9 .5 .4 .7 .3 .1 1.4 24
– 2.0 2.4 .7 1.7 .9 .7 .4 .4 .1 1.1 252.0 2.2 3.2 1.3 1.8 1.9 1.0 .7 .2 .5 .9 26
– 1.4 1.5 .9 .7 .6 .3 .1 .2 .2 1.2 271.0 1.8 2.2 .8 .9 .5 .7 .3 .3 .2 1.0 28
– 1.1 1.1 .6 .6 .5 .1 .2 .1 – .6 29– 2.7 1.8 1.1 1.3 .7 .6 .5 – .3 2.7 30
– .5 1.1 1.2 1.0 .5 .7 .5 .2 .2 .6 31
1.0 2.5 3.4 1.7 1.9 1.1 1.1 1.4 .9 .2 2.432
1.0 4.0 4.1 1.7 2.5 .7 .9 .6 .6 1.7 1.3 331.0 2.2 3.6 1.8 2.0 1.2 1.3 .8 1.0 .5 .8 341.0 2.3 2.3 3.8 3.2 1.9 1.7 1.6 1.4 .2 2.3 351.0 1.7 2.8 1.6 1.4 1.7 1.4 1.1 .4 .2 1.7 36
1.0 1.0 1.8 1.5 1.5 2.0 1.6 1.0 .3 .1 .7 371.0 3.6 2.7 4.0 1.5 1.1 1.4 1.6 .7 1.0 1.5 38
– 1.4 1.3 1.4 1.8 .8 .7 .9 .4 .1 1.1 391.0 3.2 2.1 3.0 2.8 2.8 1.5 1.0 .7 – 1.6 40
– 1.1 1.3 .6 .4 .4 .4 .2 .1 .1 .4 41
– 2.2 2.7 2.6 1.6 1.0 1.3 1.1 .4 .1 2.742
– 2.4 2.0 1.4 .9 .6 .7 .5 .2 .1 1.2 43– 2.5 2.7 1.6 1.4 .8 .9 .6 .3 .1 1.1 44– 2.8 2.2 .9 3.0 .9 1.2 .6 .2 .1 1.1 45– 2.6 2.1 1.5 1.4 1.5 .8 .4 .4 .1 1.0 46
– .8 1.8 1.1 1.3 .9 .7 .5 .3 – .9 47– 1.9 2.4 1.4 1.4 .9 1.3 1.3 .6 .4 1.7 48– 2.0 2.1 .9 .6 .5 .5 .2 .1 .1 .6 49– 2.8 2.7 1.3 1.8 1.2 .7 1.1 .1 – 2.7 50
– 1.1 1.1 .7 1.0 .7 .3 .4 .2 .1 .5 51
– 3.2 3.2 2.1 2.1 1.5 .6 .4 1.0 .1 1.752
– 3.6 3.0 2.4 3.1 .8 .4 .2 .1 .1 .9 53– 1.8 3.2 1.9 1.7 1.2 1.0 .7 .3 .1 .6 54– 3.2 2.1 2.8 2.9 2.3 1.0 .5 .2 .2 1.1 55– 2.3 2.3 1.7 1.6 .8 1.2 .6 .2 .1 1.4 56
– 1.9 2.5 1.3 1.4 1.2 2.0 1.4 .4 .2 1.4 57– 2.7 1.8 2.5 1.6 2.7 1.1 1.6 .8 .5 1.4 58– 1.4 1.9 .9 2.2 .6 .7 .3 .1 – .9 59– 4.0 4.9 1.3 2.9 1.6 1.5 .8 .2 .1 2.9 60
1992 ECONOMIC CENSUS CHARACTERISTICS OF BUSINESS OWNERS 119
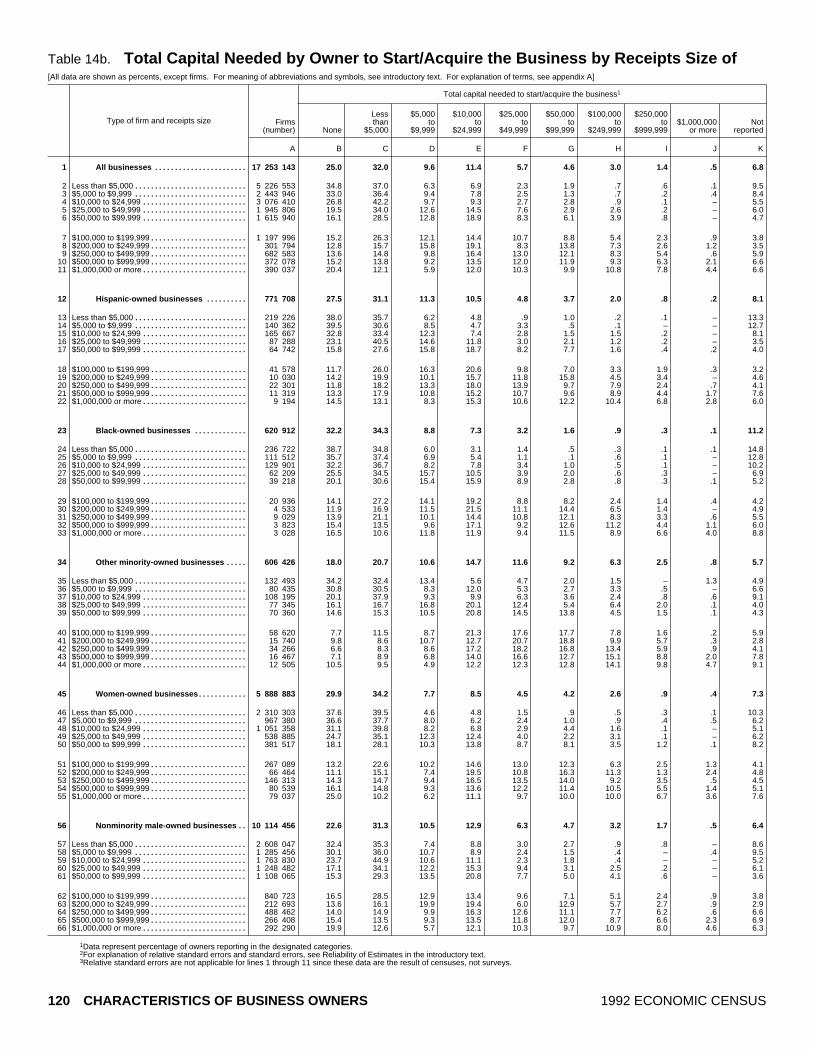
Table 14b. Total Capital Needed by Owner to Start/Acquire the Business by Receipts Size of[All data are shown as percents, except firms. For meaning of abbreviations and symbols, see introductory text. For explanation of terms, see appendix A]
Type of firm and receipts size
Total capital needed to start/acquire the business1
Firms(number) None
Lessthan
$5,000
$5,000to
$9,999
$10,000to
$24,999
$25,000to
$49,999
$50,000to
$99,999
$100,000to
$249,999
$250,000to
$999,999$1,000,000
or moreNot
reported
A B C D E F G H I J K
All businesses 17 253 143....................... 25.0 32.0 9.6 11.4 5.7 4.6 3.0 1.4 .5 6.81
Less than $5,000 5 226 553............................ 34.8 37.0 6.3 6.9 2.3 1.9 .7 .6 .1 9.52$5,000 to $9,999 2 443 946............................ 33.0 36.4 9.4 7.8 2.5 1.3 .7 .2 .4 8.43$10,000 to $24,999 3 076 410.......................... 26.8 42.2 9.7 9.3 2.7 2.8 .9 .1 – 5.54$25,000 to $49,999 1 945 806.......................... 19.5 34.0 12.6 14.5 7.6 2.9 2.6 .2 – 6.05$50,000 to $99,999 1 615 940.......................... 16.1 28.5 12.8 18.9 8.3 6.1 3.9 .8 – 4.76
$100,000 to $199,999 1 197 996........................ 15.2 26.3 12.1 14.4 10.7 8.8 5.4 2.3 .9 3.87$200,000 to $249,999 301 794........................ 12.8 15.7 15.8 19.1 8.3 13.8 7.3 2.6 1.2 3.58$250,000 to $499,999 682 583........................ 13.6 14.8 9.8 16.4 13.0 12.1 8.3 5.4 .6 5.99$500,000 to $999,999 372 078........................ 15.2 13.8 9.2 13.5 12.0 11.9 9.3 6.3 2.1 6.610$1,000,000 or more 390 037.......................... 20.4 12.1 5.9 12.0 10.3 9.9 10.8 7.8 4.4 6.611
Hispanic ~owned businesses 771 708.......... 27.5 31.1 11.3 10.5 4.8 3.7 2.0 .8 .2 8.112
Less than $5,000 219 226............................ 38.0 35.7 6.2 4.8 .9 1.0 .2 .1 – 13.313$5,000 to $9,999 140 362............................ 39.5 30.6 8.5 4.7 3.3 .5 .1 – – 12.714$10,000 to $24,999 165 667.......................... 32.8 33.4 12.3 7.4 2.8 1.5 1.5 .2 – 8.115$25,000 to $49,999 87 288.......................... 23.1 40.5 14.6 11.8 3.0 2.1 1.2 .2 – 3.516$50,000 to $99,999 64 742.......................... 15.8 27.6 15.8 18.7 8.2 7.7 1.6 .4 .2 4.017
$100,000 to $199,999 41 578........................ 11.7 26.0 16.3 20.6 9.8 7.0 3.3 1.9 .3 3.218$200,000 to $249,999 10 030........................ 14.2 19.9 10.1 15.7 11.8 15.8 4.5 3.4 – 4.619$250,000 to $499,999 22 301........................ 11.8 18.2 13.3 18.0 13.9 9.7 7.9 2.4 .7 4.120$500,000 to $999,999 11 319........................ 13.3 17.9 10.8 15.2 10.7 9.6 8.9 4.4 1.7 7.621$1,000,000 or more 9 194.......................... 14.5 13.1 8.3 15.3 10.6 12.2 10.4 6.8 2.8 6.022
Black ~owned businesses 620 912............. 32.2 34.3 8.8 7.3 3.2 1.6 .9 .3 .1 11.223
Less than $5,000 236 722............................ 38.7 34.8 6.0 3.1 1.4 .5 .3 .1 .1 14.824$5,000 to $9,999 111 512............................ 35.7 37.4 6.9 5.4 1.1 .1 .6 .1 – 12.825$10,000 to $24,999 129 901.......................... 32.2 36.7 8.2 7.8 3.4 1.0 .5 .1 – 10.226$25,000 to $49,999 62 209.......................... 25.5 34.5 15.7 10.5 3.9 2.0 .6 .3 – 6.927$50,000 to $99,999 39 218.......................... 20.1 30.6 15.4 15.9 8.9 2.8 .8 .3 .1 5.228
$100,000 to $199,999 20 936........................ 14.1 27.2 14.1 19.2 8.8 8.2 2.4 1.4 .4 4.229$200,000 to $249,999 4 533........................ 11.9 16.9 11.5 21.5 11.1 14.4 6.5 1.4 – 4.930$250,000 to $499,999 9 029........................ 13.9 21.1 10.1 14.4 10.8 12.1 8.3 3.3 .6 5.531$500,000 to $999,999 3 823........................ 15.4 13.5 9.6 17.1 9.2 12.6 11.2 4.4 1.1 6.032$1,000,000 or more 3 028.......................... 16.5 10.6 11.8 11.9 9.4 11.5 8.9 6.6 4.0 8.833
Other minority ~owned businesses 606 426..... 18.0 20.7 10.6 14.7 11.6 9.2 6.3 2.5 .8 5.734
Less than $5,000 132 493............................ 34.2 32.4 13.4 5.6 4.7 2.0 1.5 – 1.3 4.935$5,000 to $9,999 80 435............................ 30.8 30.5 8.3 12.0 5.3 2.7 3.3 .5 – 6.636$10,000 to $24,999 108 195.......................... 20.1 37.9 9.3 9.9 6.3 3.6 2.4 .8 .6 9.137$25,000 to $49,999 77 345.......................... 16.1 16.7 16.8 20.1 12.4 5.4 6.4 2.0 .1 4.038$50,000 to $99,999 70 360.......................... 14.6 15.3 10.5 20.8 14.5 13.8 4.5 1.5 .1 4.339
$100,000 to $199,999 58 620........................ 7.7 11.5 8.7 21.3 17.6 17.7 7.8 1.6 .2 5.940$200,000 to $249,999 15 740........................ 9.8 8.6 10.7 12.7 20.7 18.8 9.9 5.7 .3 2.841$250,000 to $499,999 34 266........................ 6.6 8.3 8.6 17.2 18.2 16.8 13.4 5.9 .9 4.142$500,000 to $999,999 16 467........................ 7.1 8.9 6.8 14.0 16.6 12.7 15.1 8.8 2.0 7.843$1,000,000 or more 12 505.......................... 10.5 9.5 4.9 12.2 12.3 12.8 14.1 9.8 4.7 9.144
Women ~owned businesses 5 888 883............ 29.9 34.2 7.7 8.5 4.5 4.2 2.6 .9 .4 7.345
Less than $5,000 2 310 303............................ 37.6 39.5 4.6 4.8 1.5 .9 .5 .3 .1 10.346$5,000 to $9,999 967 380............................ 36.6 37.7 8.0 6.2 2.4 1.0 .9 .4 .5 6.247$10,000 to $24,999 1 051 358.......................... 31.1 39.8 8.2 6.8 2.9 4.4 1.6 .1 – 5.148$25,000 to $49,999 538 885.......................... 24.7 35.1 12.3 12.4 4.0 2.2 3.1 .1 – 6.249$50,000 to $99,999 381 517.......................... 18.1 28.1 10.3 13.8 8.7 8.1 3.5 1.2 .1 8.250
$100,000 to $199,999 267 089........................ 13.2 22.6 10.2 14.6 13.0 12.3 6.3 2.5 1.3 4.151$200,000 to $249,999 66 464........................ 11.1 15.1 7.4 19.5 10.8 16.3 11.3 1.3 2.4 4.852$250,000 to $499,999 146 313........................ 14.3 14.7 9.4 16.5 13.5 14.0 9.2 3.5 .5 4.553$500,000 to $999,999 80 539........................ 16.1 14.8 9.3 13.6 12.2 11.4 10.5 5.5 1.4 5.154$1,000,000 or more 79 037.......................... 25.0 10.2 6.2 11.1 9.7 10.0 10.0 6.7 3.6 7.655
Nonminority male ~owned businesses 10 114 456.. 22.6 31.3 10.5 12.9 6.3 4.7 3.2 1.7 .5 6.456
Less than $5,000 2 608 047............................ 32.4 35.3 7.4 8.8 3.0 2.7 .9 .8 – 8.657$5,000 to $9,999 1 285 456............................ 30.1 36.0 10.7 8.9 2.4 1.5 .4 – .4 9.558$10,000 to $24,999 1 763 830.......................... 23.7 44.9 10.6 11.1 2.3 1.8 .4 – – 5.259$25,000 to $49,999 1 248 482.......................... 17.1 34.1 12.2 15.3 9.4 3.1 2.5 .2 – 6.160$50,000 to $99,999 1 108 065.......................... 15.3 29.3 13.5 20.8 7.7 5.0 4.1 .6 – 3.661
$100,000 to $199,999 840 723........................ 16.5 28.5 12.9 13.4 9.6 7.1 5.1 2.4 .9 3.862$200,000 to $249,999 212 693........................ 13.6 16.1 19.9 19.4 6.0 12.9 5.7 2.7 .9 2.963$250,000 to $499,999 488 462........................ 14.0 14.9 9.9 16.3 12.6 11.1 7.7 6.2 .6 6.664$500,000 to $999,999 266 408........................ 15.4 13.5 9.3 13.5 11.8 12.0 8.7 6.6 2.3 6.965$1,000,000 or more 292 290.......................... 19.9 12.6 5.7 12.1 10.3 9.7 10.9 8.0 4.6 6.366
1Data represent percentage of owners reporting in the designated categories.2For explanation of relative standard errors and standard errors, see Reliability of Estimates in the introductory text.3Relative standard errors are not applicable for lines 1 through 11 since these data are the result of censuses, not surveys.
120 CHARACTERISTICS OF BUSINESS OWNERS 1992 ECONOMIC CENSUS
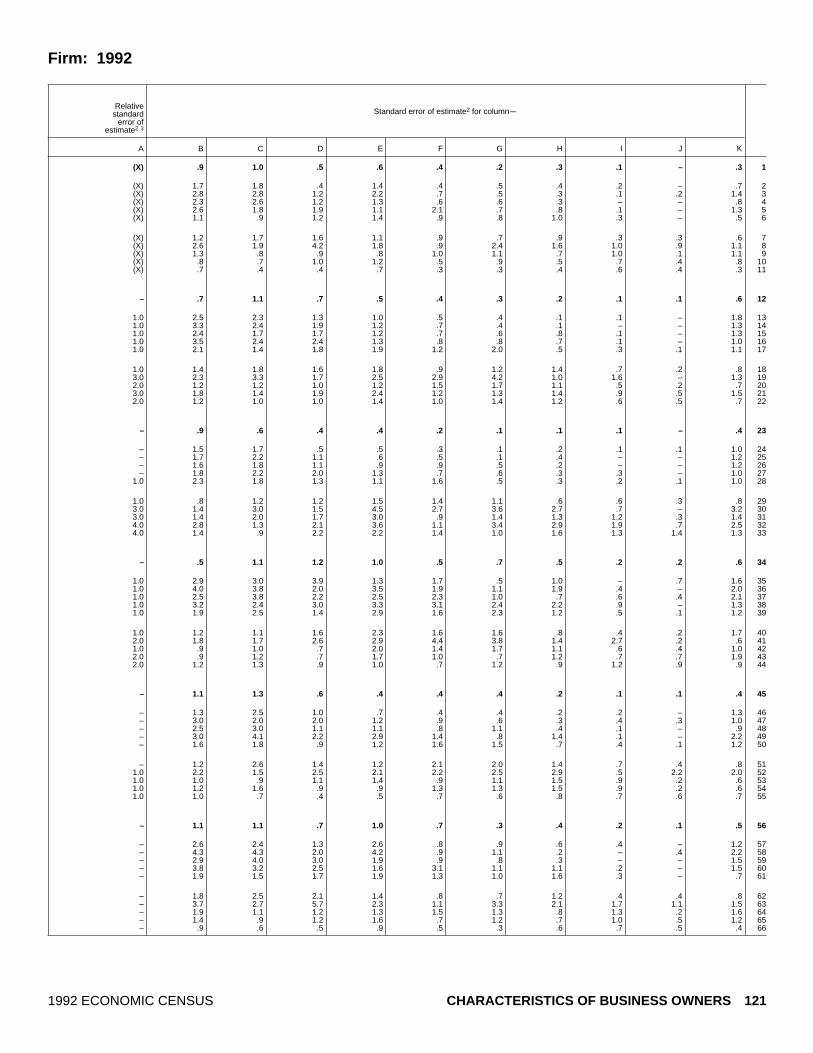
Firm: 1992
Standard error of estimate2 for columnmRelative
standarderror of
estimate2 3
A B C D E F G H I J K
(X) .9 1.0 .5 .6 .4 .2 .3 .1 – .3 1
(X) 1.7 1.8 .4 1.4 .4 .5 .4 .2 – .7 2(X) 2.8 2.8 1.2 2.2 .7 .5 .3 .1 .2 1.4 3(X) 2.3 2.6 1.2 1.3 .6 .6 .3 – – .8 4(X) 2.6 1.8 1.9 1.1 2.1 .7 .8 .1 – 1.3 5(X) 1.1 .9 1.2 1.4 .9 .8 1.0 .3 – .5 6
(X) 1.2 1.7 1.6 1.1 .9 .7 .9 .3 .3 .6 7(X) 2.6 1.9 4.2 1.8 .9 2.4 1.6 1.0 .9 1.1 8(X) 1.3 .8 .9 .8 1.0 1.1 .7 1.0 .1 1.1 9(X) .8 .7 1.0 1.2 .5 .9 .5 .7 .4 .8 10(X) .7 .4 .4 .7 .3 .3 .4 .6 .4 .3 11
– .7 1.1 .7 .5 .4 .3 .2 .1 .1 .6 12
1.0 2.5 2.3 1.3 1.0 .5 .4 .1 .1 – 1.8 131.0 3.3 2.4 1.9 1.2 .7 .4 .1 – – 1.3 141.0 2.4 1.7 1.7 1.2 .7 .6 .8 .1 – 1.3 151.0 3.5 2.4 2.4 1.3 .8 .8 .7 .1 – 1.0 161.0 2.1 1.4 1.8 1.9 1.2 2.0 .5 .3 .1 1.1 17
1.0 1.4 1.8 1.6 1.8 .9 1.2 1.4 .7 .2 .8 183.0 2.3 3.3 1.7 2.5 2.9 4.2 1.0 1.6 – 1.3 192.0 1.2 1.2 1.0 1.2 1.5 1.7 1.1 .5 .2 .7 203.0 1.8 1.4 1.9 2.4 1.2 1.3 1.4 .9 .5 1.5 212.0 1.2 1.0 1.0 1.4 1.0 1.4 1.2 .6 .5 .7 22
– .9 .6 .4 .4 .2 .1 .1 .1 – .4 23
– 1.5 1.7 .5 .5 .3 .1 .2 .1 .1 1.0 24– 1.7 2.2 1.1 .6 .5 .1 .4 – – 1.2 25– 1.6 1.8 1.1 .9 .9 .5 .2 – – 1.2 26– 1.8 2.2 2.0 1.3 .7 .6 .3 .3 – 1.0 27
1.0 2.3 1.8 1.3 1.1 1.6 .5 .3 .2 .1 1.0 28
1.0 .8 1.2 1.2 1.5 1.4 1.1 .6 .6 .3 .8 293.0 1.4 3.0 1.5 4.5 2.7 3.6 2.7 .7 – 3.2 303.0 1.4 2.0 1.7 3.0 .9 1.4 1.3 1.2 .3 1.4 314.0 2.8 1.3 2.1 3.6 1.1 3.4 2.9 1.9 .7 2.5 324.0 1.4 .9 2.2 2.2 1.4 1.0 1.6 1.3 1.4 1.3 33
– .5 1.1 1.2 1.0 .5 .7 .5 .2 .2 .6 34
1.0 2.9 3.0 3.9 1.3 1.7 .5 1.0 – .7 1.6 351.0 4.0 3.8 2.0 3.5 1.9 1.1 1.9 .4 – 2.0 361.0 2.5 3.8 2.2 2.5 2.3 1.0 .7 .6 .4 2.1 371.0 3.2 2.4 3.0 3.3 3.1 2.4 2.2 .9 – 1.3 381.0 1.9 2.5 1.4 2.9 1.6 2.3 1.2 .5 .1 1.2 39
1.0 1.2 1.1 1.6 2.3 1.6 1.6 .8 .4 .2 1.7 402.0 1.8 1.7 2.6 2.9 4.4 3.8 1.4 2.7 .2 .6 411.0 .9 1.0 .7 2.0 1.4 1.7 1.1 .6 .4 1.0 422.0 .9 1.2 .7 1.7 1.0 .7 1.2 .7 .7 1.9 432.0 1.2 1.3 .9 1.0 .7 1.2 .9 1.2 .9 .9 44
– 1.1 1.3 .6 .4 .4 .4 .2 .1 .1 .4 45
– 1.3 2.5 1.0 .7 .4 .4 .2 .2 – 1.3 46– 3.0 2.0 2.0 1.2 .9 .6 .3 .4 .3 1.0 47– 2.5 3.0 1.1 1.1 .8 1.1 .4 .1 – .9 48– 3.0 4.1 2.2 2.9 1.4 .8 1.4 .1 – 2.2 49– 1.6 1.8 .9 1.2 1.6 1.5 .7 .4 .1 1.2 50
– 1.2 2.6 1.4 1.2 2.1 2.0 1.4 .7 .4 .8 511.0 2.2 1.5 2.5 2.1 2.2 2.5 2.9 .5 2.2 2.0 521.0 1.0 .9 1.1 1.4 .9 1.1 1.5 .9 .2 .6 531.0 1.2 1.6 .9 .9 1.3 1.3 1.5 .9 .2 .6 541.0 1.0 .7 .4 .5 .7 .6 .8 .7 .6 .7 55
– 1.1 1.1 .7 1.0 .7 .3 .4 .2 .1 .5 56
– 2.6 2.4 1.3 2.6 .8 .9 .6 .4 – 1.2 57– 4.3 4.3 2.0 4.2 .9 1.1 .2 – .4 2.2 58– 2.9 4.0 3.0 1.9 .9 .8 .3 – – 1.5 59– 3.8 3.2 2.5 1.6 3.1 1.1 1.1 .2 – 1.5 60– 1.9 1.5 1.7 1.9 1.3 1.0 1.6 .3 – .7 61
– 1.8 2.5 2.1 1.4 .8 .7 1.2 .4 .4 .8 62– 3.7 2.7 5.7 2.3 1.1 3.3 2.1 1.7 1.1 1.5 63– 1.9 1.1 1.2 1.3 1.5 1.3 .8 1.3 .2 1.6 64– 1.4 .9 1.2 1.6 .7 1.2 .7 1.0 .5 1.2 65– .9 .6 .5 .9 .5 .3 .6 .7 .5 .4 66
1992 ECONOMIC CENSUS CHARACTERISTICS OF BUSINESS OWNERS 121

Table 14c. Total Capital Needed by Owner to Start/Acquire the Business by Employment Size of
Type of firm and employment size
Total capital needed to start/acquire the business1
Firms(number) None
Lessthan
$5,000
$5,000to
$9,999
$10,000to
$24,999
$25,000to
$49,999
$50,000to
$99,999
$100,000to
$249,999
$250,000to
$999,999$1,000,000
or moreNot
reported
A B C D E F G H I J K
All businesses 17 253 143....................... 25.0 32.0 9.6 11.4 5.7 4.6 3.0 1.4 .5 6.81
With no paid employees 14 118 184...................... 28.2 35.6 9.3 9.9 4.1 2.8 1.6 .8 .3 7.42With paid employees 3 134 959......................... 14.7 20.1 10.5 16.2 11.1 10.5 7.4 3.5 1.1 4.83
No employees4 435 838............................ 13.0 31.7 11.6 14.5 8.2 8.1 7.3 2.7 .3 2.741 to 4 employees 1 716 076.......................... 13.9 23.2 12.2 18.0 11.2 10.4 5.0 1.6 .3 4.355 to 9 employees 503 808.......................... 12.8 16.2 9.7 15.9 12.4 11.8 10.6 3.7 1.1 5.8610 to 19 employees 256 110........................ 18.2 11.6 8.8 14.3 12.1 11.5 10.5 5.7 1.8 5.4720 to 49 employees 144 734........................ 17.6 11.8 6.5 13.1 11.5 11.2 10.3 8.3 3.3 6.4850 to 99 employees 45 331........................ 22.3 9.3 3.3 9.1 9.2 10.0 9.8 12.8 5.2 9.09100 employees or more 33 062.................... 21.1 12.0 6.5 13.9 7.6 8.0 8.0 7.3 9.2 6.410
Hispanic ~owned businesses 771 708.......... 27.5 31.1 11.3 10.5 4.8 3.7 2.0 .8 .2 8.111
With no paid employees 656 343...................... 31.3 34.1 10.2 8.5 3.2 2.2 .9 .3 .1 9.212With paid employees 115 364......................... 15.1 21.2 14.7 16.8 10.3 8.7 5.8 2.3 .6 4.413
No employees4 19 569............................ 17.1 21.3 20.0 14.6 7.3 6.6 5.6 2.0 .6 4.9141 to 4 employees 64 631.......................... 16.7 24.4 16.5 17.0 8.7 8.2 2.9 1.4 .1 4.1155 to 9 employees 16 937.......................... 11.3 18.5 10.3 18.7 12.7 9.2 11.8 1.9 .5 5.01610 to 19 employees 8 553........................ 13.2 17.2 9.6 16.7 16.4 10.3 8.4 3.0 .9 4.31720 to 49 employees 4 050........................ 11.5 11.0 11.0 13.6 14.7 12.8 10.1 8.5 2.6 4.31850 to 99 employees 948........................ 14.3 11.2 7.4 20.2 9.3 13.5 9.3 8.5 2.4 3.919100 employees or more 676.................... 12.3 15.9 4.7 17.9 10.3 14.5 3.8 7.4 6.9 6.320
Black ~owned businesses 620 912............. 32.2 34.3 8.8 7.3 3.2 1.6 .9 .3 .1 11.221
With no paid employees 556 434...................... 34.6 34.8 8.3 6.3 2.4 .9 .6 .1 .1 11.922With paid employees 64 478......................... 15.3 30.8 12.1 14.7 9.2 6.7 3.2 1.7 .4 5.923
No employees4 13 725............................ 21.4 34.4 11.8 13.4 6.0 4.1 1.7 1.1 – 6.0241 to 4 employees 37 587.......................... 13.8 34.0 13.5 14.4 10.1 6.1 2.3 .6 .2 5.2255 to 9 employees 7 853.......................... 13.6 24.3 8.4 17.8 8.3 12.0 4.3 2.4 .1 8.92610 to 19 employees 2 839........................ 17.3 17.0 9.9 14.6 13.9 5.6 7.9 6.8 .9 6.12720 to 49 employees 1 700........................ 13.7 12.1 8.8 17.3 9.7 10.1 12.4 5.4 4.1 6.42850 to 99 employees 432........................ 10.0 9.1 6.6 10.3 4.8 15.1 15.7 20.2 6.1 2.129100 employees or more 342.................... 11.8 15.0 16.8 11.5 13.2 7.6 7.3 6.7 2.6 7.530
Other minority ~owned businesses 606 426..... 18.0 20.7 10.6 14.7 11.6 9.2 6.3 2.5 .8 5.731
With no paid employees 470 075...................... 23.2 25.4 12.0 13.4 9.0 6.0 3.7 1.4 .5 5.432With paid employees 136 351......................... 7.2 11.2 7.9 17.2 17.0 15.6 11.6 4.7 1.2 6.433
No employees4 19 989............................ 8.2 14.0 6.6 26.3 13.1 13.1 9.7 1.8 1.6 5.6341 to 4 employees 76 636.......................... 6.4 13.3 9.5 17.1 17.4 15.3 10.6 3.8 .3 6.6355 to 9 employees 22 862.......................... 8.7 7.7 6.0 14.4 19.4 19.6 13.1 3.9 1.3 5.83610 to 19 employees 10 051........................ 5.7 7.1 6.9 16.4 20.2 14.8 14.3 8.7 1.8 4.13720 to 49 employees 5 034........................ 8.9 7.5 7.1 14.1 12.5 15.2 13.6 9.9 3.6 7.53850 to 99 employees 1 075........................ 10.1 10.0 3.1 9.5 9.1 9.2 12.8 13.2 5.7 17.339100 employees or more 705.................... 11.8 8.4 4.7 13.7 7.4 8.2 9.3 5.6 13.9 17.140
Women ~owned businesses 5 888 883............ 29.9 34.2 7.7 8.5 4.5 4.2 2.6 .9 .4 7.341
With no paid employees 5 071 110...................... 33.3 37.5 7.1 6.8 2.9 2.4 1.4 .4 .3 8.142With paid employees 817 773......................... 15.7 20.7 10.2 15.5 11.2 11.5 7.7 2.7 .7 4.243
No employees4 127 905............................ 12.0 34.2 12.0 14.5 6.4 10.1 5.5 2.8 – 2.4441 to 4 employees 435 550.......................... 16.3 22.9 12.1 15.7 10.3 11.0 6.1 1.3 .2 4.1455 to 9 employees 134 476.......................... 12.7 16.9 7.0 16.5 13.8 14.2 10.9 3.3 .8 3.94610 to 19 employees 67 487........................ 16.4 10.2 6.6 17.9 14.2 12.7 11.0 5.1 .8 5.14720 to 49 employees 35 515........................ 20.1 10.6 8.5 10.7 16.3 9.3 8.5 7.0 2.6 6.54850 to 99 employees 10 178........................ 25.3 11.4 4.9 10.0 8.2 8.9 12.2 5.9 4.9 8.549100 employees or more 6 663.................... 30.4 9.0 7.2 10.1 6.8 5.8 8.7 7.1 8.5 6.350
Nonminority male ~owned businesses 10 114 456.. 22.6 31.3 10.5 12.9 6.3 4.7 3.2 1.7 .5 6.451
With no paid employees 8 019 462...................... 25.2 35.1 10.4 11.7 4.7 2.9 1.8 1.0 .3 6.952With paid employees 2 094 993......................... 14.7 20.1 10.6 16.4 10.8 10.0 7.3 3.8 1.3 4.953
No employees4 271 380............................ 13.4 32.1 11.2 13.8 8.9 6.9 8.3 2.9 .2 2.2541 to 4 employees 1 155 800.......................... 13.1 23.6 12.2 19.2 11.3 10.1 4.4 1.7 .3 4.2555 to 9 employees 334 483.......................... 13.2 16.1 11.1 15.6 11.5 10.3 10.5 3.9 1.3 6.65610 to 19 employees 173 140........................ 19.9 11.9 9.7 12.8 10.7 10.8 10.2 6.0 2.3 5.65720 to 49 employees 101 938........................ 17.4 12.4 5.8 13.9 9.8 11.7 10.6 8.6 3.5 6.45850 to 99 employees 33 406........................ 22.2 8.7 2.8 8.6 9.5 10.3 9.1 14.4 5.4 9.059100 employees or more 24 846.................... 19.0 12.8 6.3 14.8 7.7 8.6 7.9 7.4 9.5 6.160
1Data represent percentage of owners reporting in the designated categories.2For explanation of relative standard errors and standard errors, see Reliability of Estimates in the introductory text.3Relative standard errors are not applicable for lines 1 through 10 since these data are the result of censuses, not surveys.4Firms reported annual payroll, but did not report any employees on their payroll during specified period in 1992.
122 CHARACTERISTICS OF BUSINESS OWNERS 1992 ECONOMIC CENSUS

Firm: 1992
Standard error of estimate2 for columnmRelative
standarderror of
estimate2 3
A B C D E F G H I J K
(X) .7 .6 .4 .3 .3 .2 .1 .1 – .4 1
(X) .9 .7 .5 .4 .3 .2 .2 .1 – .5 2(X) .6 .7 .5 .5 .5 .3 .3 .2 .1 .3 3(X) 1.6 3.5 1.8 1.8 1.8 1.9 2.0 .5 .1 .5 4(X) 1.1 .7 1.1 .6 1.0 .5 .6 .2 .1 .6 5(X) 1.2 1.0 .7 1.2 .4 .7 .8 .4 .2 .3 6(X) .8 .5 .7 1.0 1.0 .7 .8 .8 .3 .3 7(X) 1.0 .4 .9 1.0 1.2 .8 .6 .6 .3 .4 8(X) 1.3 .8 .6 .8 1.0 .9 1.1 1.0 1.1 1.0 9(X) .9 1.6 1.2 1.5 1.0 1.0 .6 .9 1.2 .8 10
– .7 .9 .7 .7 .3 .1 .2 – – .4 11
– .9 1.1 .7 .8 .3 .2 .2 – – .6 121.0 .9 1.1 1.2 1.1 .5 .5 .5 .2 .1 .5 132.0 3.7 3.1 3.5 2.9 1.6 2.1 1.6 .9 .3 1.5 141.0 1.8 1.9 2.4 1.9 1.0 .6 .4 .3 .1 .9 152.0 1.1 2.6 1.5 2.1 1.4 1.3 1.9 .5 .3 .6 163.0 1.6 1.1 1.3 1.3 2.2 1.6 .8 .8 .3 .9 174.0 1.4 1.3 1.7 1.3 1.8 2.3 1.5 1.1 .6 .5 186.0 2.6 2.3 3.0 2.1 1.1 3.3 1.3 2.0 .5 .8 198.0 1.9 4.7 1.8 4.2 2.3 3.3 1.2 2.2 1.7 1.0 20
– .9 .6 .3 .2 .2 .1 .1 – – .5 21
– 1.0 .6 .4 .2 .2 .1 .1 – – .6 221.0 1.0 1.9 .6 1.4 .9 .8 .4 .2 .1 .8 232.0 3.1 4.2 2.6 2.0 1.5 1.6 .9 .6 – 1.5 241.0 .8 2.2 1.2 1.5 .9 1.1 .5 .2 .1 1.0 253.0 1.6 3.1 1.0 2.3 1.4 1.9 .6 .6 .2 1.9 264.0 2.5 1.9 1.4 3.9 5.2 .7 2.1 2.5 .3 1.5 276.0 2.6 3.0 1.9 3.5 2.0 2.2 2.9 1.6 2.3 1.9 288.0 3.4 3.5 2.3 2.5 1.2 5.3 3.7 4.9 1.6 1.8 29
– 2.7 3.4 6.5 2.5 5.7 2.2 1.4 3.0 1.0 2.0 30
– .7 .9 .8 .7 .4 .6 .4 .2 .1 .4 31
– 1.2 1.2 1.3 1.0 .5 .7 .3 .2 .1 .5 321.0 .4 .7 .5 .8 .7 .6 .8 .2 .2 .7 332.0 2.4 3.2 .9 4.7 2.7 2.6 2.2 .4 .9 2.1 341.0 .9 1.2 .9 1.1 1.3 1.4 1.1 .2 .1 1.5 352.0 .9 1.1 .7 1.5 1.7 1.3 1.5 .7 .3 1.0 362.0 .3 .8 1.2 1.8 1.9 2.0 1.2 .8 .5 .6 374.0 .6 1.0 1.1 1.7 1.3 1.3 1.6 1.2 .7 1.1 386.0 2.3 1.7 1.2 1.9 2.2 2.0 2.3 1.8 2.5 3.3 396.0 3.1 1.6 1.6 2.9 1.2 2.4 1.1 1.7 2.9 1.7 40
– 1.1 1.0 .8 .3 .2 .4 .2 .1 .1 .8 41
– 1.2 1.2 .9 .4 .3 .5 .1 .1 .1 1.0 42– .9 1.0 .7 .8 .6 .5 .7 .2 .1 .4 43
1.0 2.6 4.8 2.4 2.3 .5 2.0 1.2 .7 – .6 44– 2.1 1.3 1.4 1.3 1.1 1.1 1.3 .2 – .6 45
1.0 1.2 1.9 .6 1.4 1.3 .5 1.2 .5 .2 .4 461.0 1.4 1.2 .4 2.0 1.2 1.4 .9 .7 .3 .6 471.0 1.1 1.2 1.2 1.0 3.7 1.2 .9 1.2 .5 .7 482.0 1.2 2.2 1.3 1.8 1.3 1.8 1.6 1.3 1.2 1.0 492.0 2.4 1.3 1.6 1.5 .7 1.2 1.7 1.5 1.4 1.2 50
– .9 .7 .5 .4 .4 .3 .2 .2 .1 .5 51
– 1.2 .8 .6 .6 .4 .4 .3 .2 .1 .7 52– .8 .8 .7 .7 .6 .3 .4 .2 .1 .4 53– 2.7 5.0 2.3 2.7 3.3 2.3 3.8 .9 .1 .9 54– 1.3 1.0 1.4 1.0 1.2 .4 .7 .4 .1 .8 55– 1.6 1.0 1.1 1.6 .5 1.2 1.2 .5 .2 .5 56
1.0 1.0 .6 1.1 1.5 1.3 1.2 1.0 1.1 .4 .5 571.0 1.2 .4 .9 1.1 1.1 .9 .7 .7 .4 .5 581.0 1.5 1.3 .5 1.2 1.1 1.3 1.1 1.3 1.2 1.5 591.0 1.2 2.1 1.6 2.3 1.5 1.3 1.0 1.2 1.7 1.0 60
1992 ECONOMIC CENSUS CHARACTERISTICS OF BUSINESS OWNERS 123

Table 14d. Total Capital Needed by Owner to Start/Acquire the Business by Legal Form of[All data are shown as percents, except firms. For meaning of abbreviations and symbols, see introductory text. For explanation of terms, see appendix A]
Type of firm and legal form of organization
Total capital needed to start/acquire the business1
Firms(number) None
Lessthan
$5,000
$5,000to
$9,999
$10,000to
$24,999
$25,000to
$49,999
$50,000to
$99,999
$100,000to
$249,999
$250,000to
$999,999$1,000,000
or moreNot
reported
A B C D E F G H I J K
All businesses 17 253 143....................... 25.0 32.0 9.6 11.4 5.7 4.6 3.0 1.4 .5 6.81
Individual proprietorships 14 599 295..................... 27.8 36.9 9.3 9.7 4.1 3.3 1.3 .5 .1 7.02Partnerships 1 089 578................................ 19.7 18.5 12.3 13.9 10.1 7.1 6.7 3.8 1.9 6.03Subchapter S corporations 1 564 270................... 16.3 20.1 8.6 17.4 9.8 8.5 7.9 3.8 1.1 6.54
Hispanic ~owned businesses 771 708.......... 27.5 31.1 11.3 10.5 4.8 3.7 2.0 .8 .2 8.15
Individual proprietorships 689 015..................... 31.7 33.7 10.7 9.1 3.1 1.7 .8 .2 .1 9.06Partnerships 32 650................................ 14.0 25.7 13.4 14.0 9.1 9.9 4.5 2.3 1.2 6.07Subchapter S corporations 50 042................... 15.1 21.1 12.5 15.2 11.0 10.2 6.7 3.0 .5 4.78
Black ~owned businesses 620 912............. 32.2 34.3 8.8 7.3 3.2 1.6 .9 .3 .1 11.29
Individual proprietorships 584 256..................... 33.6 35.1 8.6 6.4 2.7 1.2 .6 .1 .1 11.710Partnerships 14 727................................ 18.5 30.0 11.8 14.1 9.0 4.2 1.6 2.0 .9 8.011Subchapter S corporations 21 928................... 16.0 21.7 9.8 21.1 9.8 8.0 5.5 2.8 .9 4.412
Other minority ~owned businesses 606 426..... 18.0 20.7 10.6 14.7 11.6 9.2 6.3 2.5 .8 5.713
Individual proprietorships 502 022..................... 21.6 26.1 10.1 14.5 9.3 7.9 4.8 1.1 .1 4.714Partnerships 49 489................................ 13.0 11.9 14.6 12.3 12.4 10.6 7.8 5.0 3.1 9.415Subchapter S corporations 54 915................... 12.3 13.5 8.7 17.3 17.3 11.5 9.1 4.1 .7 5.516
Women ~owned businesses 5 888 883............ 29.9 34.2 7.7 8.5 4.5 4.2 2.6 .9 .4 7.317
Individual proprietorships 5 078 077..................... 33.5 38.7 7.1 6.9 2.6 2.5 1.0 .3 – 7.318Partnerships 243 651................................ 20.2 24.4 9.4 12.0 8.6 7.4 5.2 2.2 2.2 8.419Subchapter S corporations 567 155................... 17.6 18.6 9.3 13.9 11.1 10.2 8.7 2.8 1.0 6.820
Nonminority male ~owned businesses 10 114 456.. 22.6 31.3 10.5 12.9 6.3 4.7 3.2 1.7 .5 6.421
Individual proprietorships 8 414 238..................... 24.5 36.5 10.4 11.1 4.9 3.7 1.4 .6 .1 6.822Partnerships 777 379................................ 20.2 17.0 12.8 14.6 10.4 6.6 7.2 4.2 1.9 5.023Subchapter S corporations 922 838................... 15.6 21.3 8.0 19.6 8.5 7.3 7.5 4.5 1.3 6.324
1Data represent percentage of owners reporting in the designated categories.2For explanation of relative standard errors and standard errors, see Reliability of Estimates in the introductory text.3Relative standard errors are not applicable for lines 1 through 4 since these data are the result of censuses, not surveys.
124 CHARACTERISTICS OF BUSINESS OWNERS 1992 ECONOMIC CENSUS
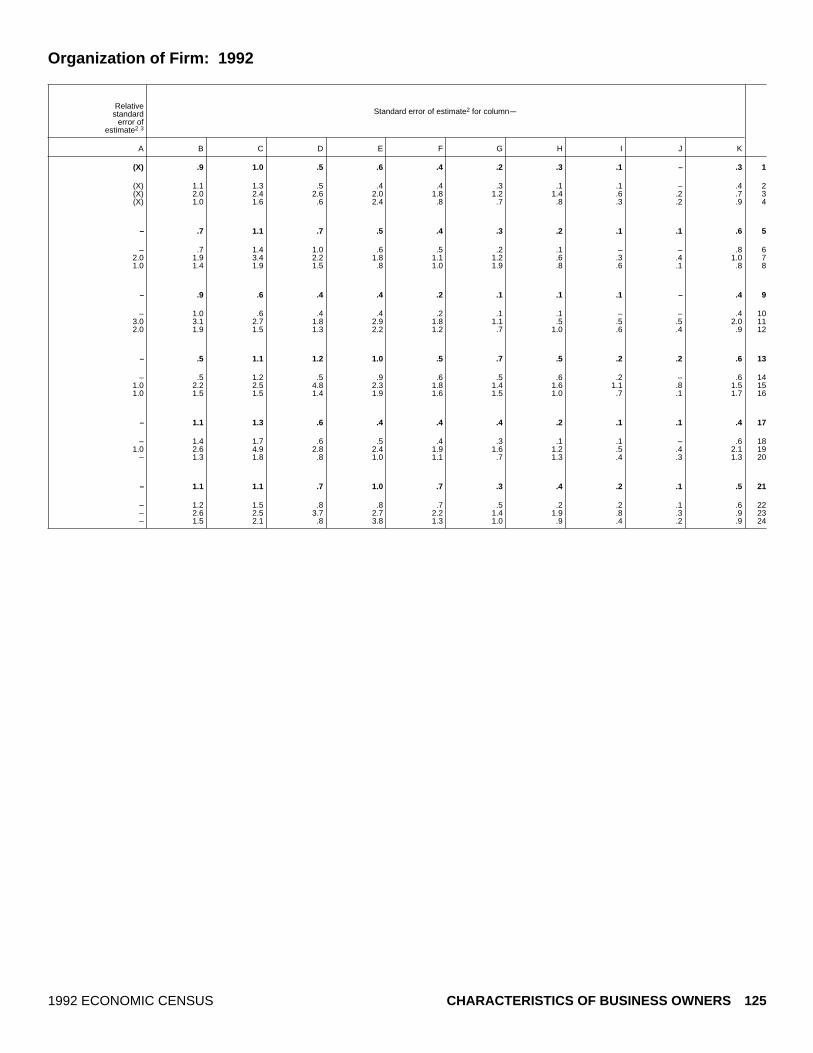
Organization of Firm: 1992
Standard error of estimate2 for columnmRelative
standarderror of
estimate2 3
A B C D E F G H I J K
(X) .9 1.0 .5 .6 .4 .2 .3 .1 – .3 1
(X) 1.1 1.3 .5 .4 .4 .3 .1 .1 – .4 2(X) 2.0 2.4 2.6 2.0 1.8 1.2 1.4 .6 .2 .7 3(X) 1.0 1.6 .6 2.4 .8 .7 .8 .3 .2 .9 4
– .7 1.1 .7 .5 .4 .3 .2 .1 .1 .6 5
– .7 1.4 1.0 .6 .5 .2 .1 – – .8 62.0 1.9 3.4 2.2 1.8 1.1 1.2 .6 .3 .4 1.0 71.0 1.4 1.9 1.5 .8 1.0 1.9 .8 .6 .1 .8 8
– .9 .6 .4 .4 .2 .1 .1 .1 – .4 9
– 1.0 .6 .4 .4 .2 .1 .1 – – .4 103.0 3.1 2.7 1.8 2.9 1.8 1.1 .5 .5 .5 2.0 112.0 1.9 1.5 1.3 2.2 1.2 .7 1.0 .6 .4 .9 12
– .5 1.1 1.2 1.0 .5 .7 .5 .2 .2 .6 13
– .5 1.2 .5 .9 .6 .5 .6 .2 – .6 141.0 2.2 2.5 4.8 2.3 1.8 1.4 1.6 1.1 .8 1.5 151.0 1.5 1.5 1.4 1.9 1.6 1.5 1.0 .7 .1 1.7 16
– 1.1 1.3 .6 .4 .4 .4 .2 .1 .1 .4 17
– 1.4 1.7 .6 .5 .4 .3 .1 .1 – .6 181.0 2.6 4.9 2.8 2.4 1.9 1.6 1.2 .5 .4 2.1 19
– 1.3 1.8 .8 1.0 1.1 .7 1.3 .4 .3 1.3 20
– 1.1 1.1 .7 1.0 .7 .3 .4 .2 .1 .5 21
– 1.2 1.5 .8 .8 .7 .5 .2 .2 .1 .6 22– 2.6 2.5 3.7 2.7 2.2 1.4 1.9 .8 .3 .9 23– 1.5 2.1 .8 3.8 1.3 1.0 .9 .4 .2 .9 24
1992 ECONOMIC CENSUS CHARACTERISTICS OF BUSINESS OWNERS 125

Table 15a. Percent of Total Capital Borrowed by Owner to Start/Acquire the Business by[All data are shown as percents, except firms. For meaning of abbreviations and symbols, see introductory text. For explanation of terms, see appendix A]
Type of firm and industry division
Percent of total capital borrowed to start/acquire the business1
Firms(number) None
Lessthan
10 10 to 24 25 to 49 50 to 74 75 to 99 100Not
reportedNot
applicable2
A B C D E F G H I J
All businesses 17 253 143......................... 44.0 2.5 2.3 3.2 4.4 5.3 5.9 7.3 25.01
Agricultural services, forestry, fishing, and mining 583 253. 44.8 4.5 2.5 4.4 4.7 5.0 4.6 9.0 20.42Construction 1 829 620.................................. 50.9 2.7 2.0 3.0 3.6 3.1 4.4 4.0 26.43Manufacturing 517 714................................ 46.1 3.4 2.8 3.9 6.5 5.1 6.8 4.6 21.04Transportation, communications, and utilities 698 903..... 31.3 3.5 2.5 4.1 7.0 7.6 9.3 9.3 25.35Wholesale trade 538 339.............................. 44.1 2.5 3.3 3.3 5.7 5.5 6.6 6.6 22.46
Retail trade 2 478 045................................... 43.6 2.5 3.2 5.0 6.7 8.6 7.6 8.1 14.77Finance, insurance, and real estate 1 941 029.............. 49.8 2.2 2.0 2.5 3.4 3.9 4.7 7.8 23.78Services 7 784 016..................................... 41.8 2.3 2.1 2.8 3.8 5.4 6.0 6.7 29.09Industries not classified 882 224........................ 39.1 2.0 1.6 2.7 3.5 2.2 2.9 15.0 31.110
Hispanic ~owned businesses 771 708............ 42.7 3.0 2.8 3.3 4.0 3.9 4.5 8.4 27.511
Agricultural services, forestry, fishing, and mining 32 927. 41.6 4.1 3.1 2.5 3.7 3.3 4.4 11.5 25.812Construction 97 476.................................. 46.5 2.4 2.8 2.4 2.3 1.0 3.2 8.3 31.113Manufacturing 18 461................................ 45.8 3.0 3.8 4.8 5.4 5.3 7.6 5.6 18.814Transportation, communications, and utilities 47 797..... 33.2 3.3 4.6 4.4 5.6 9.0 6.0 11.5 22.515Wholesale trade 17 727.............................. 50.5 3.2 3.2 3.3 6.5 3.5 6.3 5.6 18.016
Retail trade 107 846................................... 43.9 3.6 3.7 4.6 6.4 6.6 6.1 8.0 17.217Finance, insurance, and real estate 49 231.............. 49.1 3.4 3.2 3.0 3.5 5.5 5.0 7.1 20.118Services 347 297..................................... 42.0 2.8 2.3 3.0 3.4 3.0 3.9 7.8 31.919Industries not classified 52 945........................ 33.0 2.0 1.5 3.1 3.2 2.2 3.4 12.9 38.720
Black ~owned businesses 620 912............... 37.9 3.2 2.6 2.5 2.9 3.3 3.8 11.5 32.221
Agricultural services, forestry, fishing, and mining 10 309. 39.3 5.5 3.7 3.7 3.9 3.0 3.7 11.2 26.022Construction 43 381.................................. 39.3 2.0 3.1 2.1 1.6 1.3 3.1 8.5 39.023Manufacturing 10 469................................ 33.7 5.0 6.3 4.0 5.7 3.6 5.4 12.1 24.124Transportation, communications, and utilities 49 095..... 31.7 3.5 3.9 3.7 5.9 6.6 5.5 13.7 25.425Wholesale trade 7 550.............................. 44.7 3.9 2.8 3.2 4.8 4.7 5.5 6.4 24.026
Retail trade 86 840................................... 46.3 4.6 2.7 2.7 3.7 3.6 5.5 10.6 20.427Finance, insurance, and real estate 40 924.............. 47.6 2.7 3.6 1.7 3.9 3.7 2.0 8.6 26.328Services 332 981..................................... 35.9 2.9 2.1 2.5 2.3 3.1 3.4 11.6 36.329Industries not classified 39 363........................ 32.2 3.7 1.8 1.7 2.4 1.8 4.2 16.2 35.930
Other minority ~owned businesses 606 426....... 41.7 3.6 4.2 7.0 8.8 6.0 4.4 6.5 18.031
Agricultural services, forestry, fishing, and mining 15 218. 41.1 5.0 5.0 4.6 5.2 5.2 3.5 9.4 21.132Construction 28 295.................................. 50.1 4.4 1.6 3.3 2.3 3.2 4.5 5.9 24.833Manufacturing 18 976................................ 48.2 2.8 3.9 4.8 7.5 4.2 3.8 5.8 19.134Transportation, communications, and utilities 24 362..... 39.8 1.8 2.6 8.7 8.7 9.5 4.4 8.7 15.835Wholesale trade 20 043.............................. 47.4 2.8 4.9 5.6 7.9 4.0 6.2 6.5 14.736
Retail trade 132 483................................... 39.9 4.7 6.7 12.0 14.5 6.5 4.2 4.8 6.637Finance, insurance, and real estate 64 762.............. 41.3 1.9 2.9 4.9 5.8 9.0 3.5 7.7 22.938Services 273 774..................................... 41.7 3.7 3.7 5.6 7.9 5.1 4.7 6.7 20.839Industries not classified 28 512........................ 34.7 3.9 3.4 7.2 8.1 2.8 4.7 7.4 27.840
Women ~owned businesses 5 888 883............. 42.3 2.4 2.2 2.2 3.8 4.3 5.1 7.9 29.941
Agricultural services, forestry, fishing, and mining 119 731. 38.9 5.0 1.5 3.2 6.8 2.7 5.3 9.3 27.442Construction 183 695.................................. 44.8 2.8 3.9 2.8 3.8 2.9 6.7 6.8 25.543Manufacturing 152 346................................ 43.0 3.1 3.3 3.5 5.4 4.6 5.6 5.4 26.144Transportation, communications, and utilities 141 623..... 34.9 1.4 4.0 2.9 3.5 5.8 9.2 6.5 31.745Wholesale trade 154 542.............................. 44.2 1.8 2.0 5.0 4.6 4.5 6.1 6.2 25.746
Retail trade 1 093 342................................... 47.6 2.7 3.1 3.0 5.1 5.2 8.2 8.1 17.047Finance, insurance, and real estate 602 802.............. 47.5 2.5 1.9 1.5 3.8 4.0 2.0 9.2 27.648Services 3 158 444..................................... 39.5 2.1 1.7 1.7 3.1 4.4 4.5 7.2 35.749Industries not classified 282 358........................ 37.6 2.4 1.8 1.8 2.3 1.5 3.4 14.2 35.050
Nonminority male ~owned businesses 10 114 456.... 45.3 2.4 2.2 3.7 4.6 5.9 6.4 6.9 22.651
Agricultural services, forestry, fishing, and mining 412 917. 46.9 4.4 2.7 5.0 4.2 5.8 4.5 8.7 17.952Construction 1 496 056.................................. 52.2 2.7 1.6 3.1 3.7 3.3 4.2 3.2 25.953Manufacturing 333 485................................ 47.6 3.5 2.3 3.9 6.9 5.4 7.4 4.1 18.954Transportation, communications, and utilities 458 400..... 29.7 4.2 1.7 4.3 8.2 8.0 10.2 9.7 24.055Wholesale trade 352 721.............................. 43.6 2.8 3.9 2.6 6.1 6.2 6.9 6.8 21.356
Retail trade 1 197 943................................... 40.5 2.1 2.9 6.1 7.5 11.9 7.4 8.2 13.357Finance, insurance, and real estate 1 240 594.............. 51.3 2.1 1.9 2.7 3.1 3.5 5.8 7.3 22.258Services 4 102 294..................................... 43.6 2.1 2.3 3.5 4.1 6.3 7.3 6.2 24.559Industries not classified 520 046........................ 40.5 1.5 1.3 3.1 4.0 2.6 2.4 15.8 28.860
1Data represent percentage of owners reporting in the designated categories.2Includes owners who did not require capital to start/acquire their businesses.3For explanation of relative standard errors and standard errors, see Reliability of Estimates in the introductory text.4Relative standard errors are not applicable for lines 1 through 10 since these data are the result of censuses, not surveys.
126 CHARACTERISTICS OF BUSINESS OWNERS 1992 ECONOMIC CENSUS

Industry Division: 1992
Standard error of estimate3 for columnmRelative
standarderror of
estimate3 4
A B C D E F G H I J
(X) .7 .3 .1 .2 .2 .3 .4 .3 .9 1
(X) 1.8 .8 .6 1.0 .8 .8 .8 .7 2.2 2(X) 2.1 .7 .6 1.1 .8 .8 .6 .7 2.8 3(X) 1.7 .8 .7 .5 .8 .6 .8 .5 1.8 4(X) 1.4 .9 .4 .9 1.6 1.2 1.0 .8 2.3 5(X) 1.8 .4 .7 .5 .7 .6 1.2 1.1 1.5 6
(X) 1.5 .4 .4 .5 .5 1.0 1.1 .8 .9 7(X) 2.0 .6 .5 .5 .7 .7 1.2 1.2 2.1 8(X) 1.1 .4 .2 .4 .3 .6 .4 .5 1.4 9(X) 2.9 .6 .4 .6 .9 .8 1.0 2.4 2.6 10
– 1.0 .2 .2 .4 .3 .2 .3 .5 .7 11
1.0 4.0 1.1 1.2 .9 1.0 .8 1.0 3.5 3.1 121.0 1.7 .6 1.0 .8 .7 .4 .6 1.7 2.4 131.0 2.5 .6 1.0 .8 .7 1.0 1.0 1.0 1.8 141.0 3.0 .9 1.1 1.1 .7 1.1 1.2 1.6 2.6 152.0 2.7 1.1 .5 .7 .9 .8 1.1 1.0 1.9 16
1.0 1.7 .7 .7 .7 .9 .9 .8 1.0 1.5 171.0 2.3 .6 .8 1.1 .8 .9 1.3 1.2 1.9 18
– 1.8 .3 .5 .7 .5 .5 .6 .9 1.6 191.0 2.3 1.1 .5 .5 1.6 1.0 1.2 2.1 2.2 20
– .6 .3 .3 .3 .2 .3 .4 .5 .9 21
1.0 3.0 1.2 1.0 1.1 .7 .8 .8 1.6 1.7 22– 2.1 .9 .6 .6 .4 .4 .9 1.6 2.6 23
1.0 2.0 1.0 1.4 1.0 .7 .8 .7 1.8 1.3 24– 2.2 .9 .7 .9 .4 .8 1.1 1.5 2.0 25
2.0 3.1 .4 .8 .8 1.1 .7 1.1 .8 2.2 26
– 1.9 .7 .5 .5 .5 .6 .9 .9 1.4 271.0 1.6 .5 .8 .4 .7 .7 .6 1.1 1.8 28
– .9 .3 .4 .5 .2 .3 .6 .9 1.1 29– 1.5 .5 .5 .6 .7 .5 1.0 2.7 2.7 30
– 1.1 .4 .5 .2 .5 .6 .2 .6 .5 31
1.0 4.2 1.2 1.7 .8 1.1 1.2 .9 3.2 2.5 321.0 4.7 1.4 .4 .7 .6 .9 1.4 1.5 4.0 331.0 2.1 .8 1.2 1.9 2.2 1.4 1.0 1.0 2.2 341.0 3.2 1.0 .8 3.0 2.4 2.2 1.2 2.0 2.3 351.0 2.2 .7 .9 .8 1.9 .8 1.0 1.5 1.7 36
1.0 1.9 1.7 .8 1.1 1.4 1.2 .8 .8 1.0 371.0 3.3 .5 .8 .9 1.5 3.6 1.0 1.4 3.6 38
– 2.0 .9 .9 .6 1.0 .5 .6 1.1 1.4 391.0 2.7 1.9 1.0 1.9 2.0 1.2 1.8 1.5 3.2 40
– 1.1 .3 .3 .2 .2 .3 .6 .4 1.1 41
– 2.8 1.5 .8 .7 1.4 .6 1.1 2.7 2.2 42– 2.5 .9 .7 .7 1.0 .8 1.2 1.2 2.4 43– 1.6 1.0 1.0 .9 1.0 .6 1.0 .9 2.5 44– 3.2 .3 1.4 .9 1.0 1.0 2.1 1.5 2.8 45– 2.6 .3 .5 1.2 .7 1.2 1.3 .9 2.6 46
– 2.4 .8 .7 .2 .8 .8 1.4 .9 .8 47– 3.1 .5 1.0 .4 .8 .8 .6 1.6 1.9 48– 1.6 .4 .3 .2 .3 .5 .7 .5 2.0 49– 4.1 .8 .7 .7 1.0 .8 1.2 2.7 2.8 50
– .9 .4 .2 .4 .2 .4 .5 .5 1.1 51
– 2.7 1.1 .7 1.6 .9 1.1 .9 1.1 3.2 52– 2.7 .8 .7 1.4 .9 1.0 .6 .9 3.6 53– 2.6 1.1 .7 .8 1.3 .8 1.0 .6 1.8 54– 1.8 1.3 .6 1.3 2.4 1.8 1.2 1.0 3.2 55– 2.5 .6 1.0 .7 1.2 1.0 1.6 1.5 2.3 56
– 2.5 .6 .6 1.0 .8 1.8 1.1 1.7 1.9 57– 2.3 .7 .8 .7 1.1 1.0 1.8 1.3 2.7 58– 1.5 .5 .3 .7 .6 1.0 .6 1.0 1.4 59– 4.3 .7 .6 1.1 1.3 1.0 1.1 3.1 4.0 60
1992 ECONOMIC CENSUS CHARACTERISTICS OF BUSINESS OWNERS 127
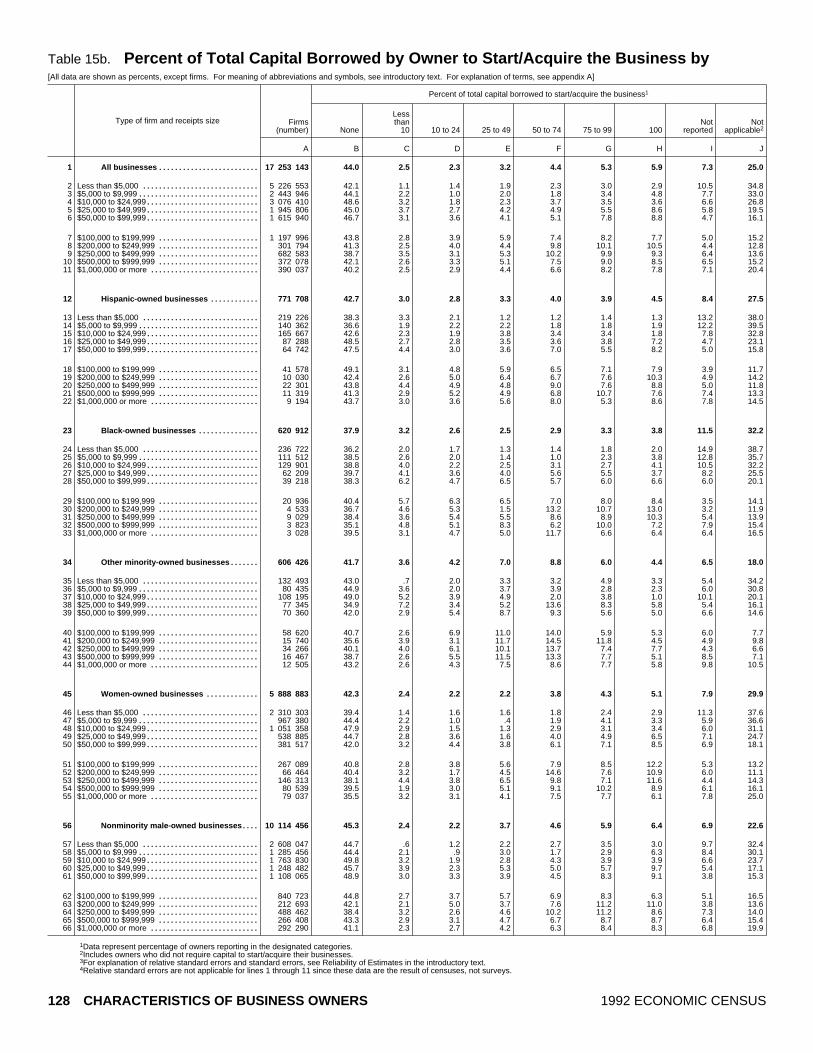
Table 15b. Percent of Total Capital Borrowed by Owner to Start/Acquire the Business by[All data are shown as percents, except firms. For meaning of abbreviations and symbols, see introductory text. For explanation of terms, see appendix A]
Type of firm and receipts size
Percent of total capital borrowed to start/acquire the business1
Firms(number) None
Lessthan
10 10 to 24 25 to 49 50 to 74 75 to 99 100Not
reportedNot
applicable2
A B C D E F G H I J
All businesses 17 253 143......................... 44.0 2.5 2.3 3.2 4.4 5.3 5.9 7.3 25.01
Less than $5,000 5 226 553............................. 42.1 1.1 1.4 1.9 2.3 3.0 2.9 10.5 34.82$5,000 to $9,999 2 443 946.............................. 44.1 2.2 1.0 2.0 1.8 3.4 4.8 7.7 33.03$10,000 to $24,999 3 076 410............................ 48.6 3.2 1.8 2.3 3.7 3.5 3.6 6.6 26.84$25,000 to $49,999 1 945 806............................ 45.0 3.7 2.7 4.2 4.9 5.5 8.6 5.8 19.55$50,000 to $99,999 1 615 940............................ 46.7 3.1 3.6 4.1 5.1 7.8 8.8 4.7 16.16
$100,000 to $199,999 1 197 996......................... 43.8 2.8 3.9 5.9 7.4 8.2 7.7 5.0 15.27$200,000 to $249,999 301 794......................... 41.3 2.5 4.0 4.4 9.8 10.1 10.5 4.4 12.88$250,000 to $499,999 682 583......................... 38.7 3.5 3.1 5.3 10.2 9.9 9.3 6.4 13.69$500,000 to $999,999 372 078......................... 42.1 2.6 3.3 5.1 7.5 9.0 8.5 6.5 15.210$1,000,000 or more 390 037........................... 40.2 2.5 2.9 4.4 6.6 8.2 7.8 7.1 20.411
Hispanic ~owned businesses 771 708............ 42.7 3.0 2.8 3.3 4.0 3.9 4.5 8.4 27.512
Less than $5,000 219 226............................. 38.3 3.3 2.1 1.2 1.2 1.4 1.3 13.2 38.013$5,000 to $9,999 140 362.............................. 36.6 1.9 2.2 2.2 1.8 1.8 1.9 12.2 39.514$10,000 to $24,999 165 667............................ 42.6 2.3 1.9 3.8 3.4 3.4 1.8 7.8 32.815$25,000 to $49,999 87 288............................ 48.5 2.7 2.8 3.5 3.6 3.8 7.2 4.7 23.116$50,000 to $99,999 64 742............................ 47.5 4.4 3.0 3.6 7.0 5.5 8.2 5.0 15.817
$100,000 to $199,999 41 578......................... 49.1 3.1 4.8 5.9 6.5 7.1 7.9 3.9 11.718$200,000 to $249,999 10 030......................... 42.4 2.6 5.0 6.4 6.7 7.6 10.3 4.9 14.219$250,000 to $499,999 22 301......................... 43.8 4.4 4.9 4.8 9.0 7.6 8.8 5.0 11.820$500,000 to $999,999 11 319......................... 41.3 2.9 5.2 4.9 6.8 10.7 7.6 7.4 13.321$1,000,000 or more 9 194........................... 43.7 3.0 3.6 5.6 8.0 5.3 8.6 7.8 14.522
Black ~owned businesses 620 912............... 37.9 3.2 2.6 2.5 2.9 3.3 3.8 11.5 32.223
Less than $5,000 236 722............................. 36.2 2.0 1.7 1.3 1.4 1.8 2.0 14.9 38.724$5,000 to $9,999 111 512.............................. 38.5 2.6 2.0 1.4 1.0 2.3 3.8 12.8 35.725$10,000 to $24,999 129 901............................ 38.8 4.0 2.2 2.5 3.1 2.7 4.1 10.5 32.226$25,000 to $49,999 62 209............................ 39.7 4.1 3.6 4.0 5.6 5.5 3.7 8.2 25.527$50,000 to $99,999 39 218............................ 38.3 6.2 4.7 6.5 5.7 6.0 6.6 6.0 20.128
$100,000 to $199,999 20 936......................... 40.4 5.7 6.3 6.5 7.0 8.0 8.4 3.5 14.129$200,000 to $249,999 4 533......................... 36.7 4.6 5.3 1.5 13.2 10.7 13.0 3.2 11.930$250,000 to $499,999 9 029......................... 38.4 3.6 5.4 5.5 8.6 8.9 10.3 5.4 13.931$500,000 to $999,999 3 823......................... 35.1 4.8 5.1 8.3 6.2 10.0 7.2 7.9 15.432$1,000,000 or more 3 028........................... 39.5 3.1 4.7 5.0 11.7 6.6 6.4 6.4 16.533
Other minority ~owned businesses 606 426....... 41.7 3.6 4.2 7.0 8.8 6.0 4.4 6.5 18.034
Less than $5,000 132 493............................. 43.0 .7 2.0 3.3 3.2 4.9 3.3 5.4 34.235$5,000 to $9,999 80 435.............................. 44.9 3.6 2.0 3.7 3.9 2.8 2.3 6.0 30.836$10,000 to $24,999 108 195............................ 49.0 5.2 3.9 4.9 2.0 3.8 1.0 10.1 20.137$25,000 to $49,999 77 345............................ 34.9 7.2 3.4 5.2 13.6 8.3 5.8 5.4 16.138$50,000 to $99,999 70 360............................ 42.0 2.9 5.4 8.7 9.3 5.6 5.0 6.6 14.639
$100,000 to $199,999 58 620......................... 40.7 2.6 6.9 11.0 14.0 5.9 5.3 6.0 7.740$200,000 to $249,999 15 740......................... 35.6 3.9 3.1 11.7 14.5 11.8 4.5 4.9 9.841$250,000 to $499,999 34 266......................... 40.1 4.0 6.1 10.1 13.7 7.4 7.7 4.3 6.642$500,000 to $999,999 16 467......................... 38.7 2.6 5.5 11.5 13.3 7.7 5.1 8.5 7.143$1,000,000 or more 12 505........................... 43.2 2.6 4.3 7.5 8.6 7.7 5.8 9.8 10.544
Women ~owned businesses 5 888 883............. 42.3 2.4 2.2 2.2 3.8 4.3 5.1 7.9 29.945
Less than $5,000 2 310 303............................. 39.4 1.4 1.6 1.6 1.8 2.4 2.9 11.3 37.646$5,000 to $9,999 967 380.............................. 44.4 2.2 1.0 .4 1.9 4.1 3.3 5.9 36.647$10,000 to $24,999 1 051 358............................ 47.9 2.9 1.5 1.3 2.9 3.1 3.4 6.0 31.148$25,000 to $49,999 538 885............................ 44.7 2.8 3.6 1.6 4.0 4.9 6.5 7.1 24.749$50,000 to $99,999 381 517............................ 42.0 3.2 4.4 3.8 6.1 7.1 8.5 6.9 18.150
$100,000 to $199,999 267 089......................... 40.8 2.8 3.8 5.6 7.9 8.5 12.2 5.3 13.251$200,000 to $249,999 66 464......................... 40.4 3.2 1.7 4.5 14.6 7.6 10.9 6.0 11.152$250,000 to $499,999 146 313......................... 38.1 4.4 3.8 6.5 9.8 7.1 11.6 4.4 14.353$500,000 to $999,999 80 539......................... 39.5 1.9 3.0 5.1 9.1 10.2 8.9 6.1 16.154$1,000,000 or more 79 037........................... 35.5 3.2 3.1 4.1 7.5 7.7 6.1 7.8 25.055
Nonminority male ~owned businesses 10 114 456.... 45.3 2.4 2.2 3.7 4.6 5.9 6.4 6.9 22.656
Less than $5,000 2 608 047............................. 44.7 .6 1.2 2.2 2.7 3.5 3.0 9.7 32.457$5,000 to $9,999 1 285 456.............................. 44.4 2.1 .9 3.0 1.7 2.9 6.3 8.4 30.158$10,000 to $24,999 1 763 830............................ 49.8 3.2 1.9 2.8 4.3 3.9 3.9 6.6 23.759$25,000 to $49,999 1 248 482............................ 45.7 3.9 2.3 5.3 5.0 5.7 9.7 5.4 17.160$50,000 to $99,999 1 108 065............................ 48.9 3.0 3.3 3.9 4.5 8.3 9.1 3.8 15.361
$100,000 to $199,999 840 723......................... 44.8 2.7 3.7 5.7 6.9 8.3 6.3 5.1 16.562$200,000 to $249,999 212 693......................... 42.1 2.1 5.0 3.7 7.6 11.2 11.0 3.8 13.663$250,000 to $499,999 488 462......................... 38.4 3.2 2.6 4.6 10.2 11.2 8.6 7.3 14.064$500,000 to $999,999 266 408......................... 43.3 2.9 3.1 4.7 6.7 8.7 8.7 6.4 15.465$1,000,000 or more 292 290........................... 41.1 2.3 2.7 4.2 6.3 8.4 8.3 6.8 19.966
1Data represent percentage of owners reporting in the designated categories.2Includes owners who did not require capital to start/acquire their businesses.3For explanation of relative standard errors and standard errors, see Reliability of Estimates in the introductory text.4Relative standard errors are not applicable for lines 1 through 11 since these data are the result of censuses, not surveys.
128 CHARACTERISTICS OF BUSINESS OWNERS 1992 ECONOMIC CENSUS
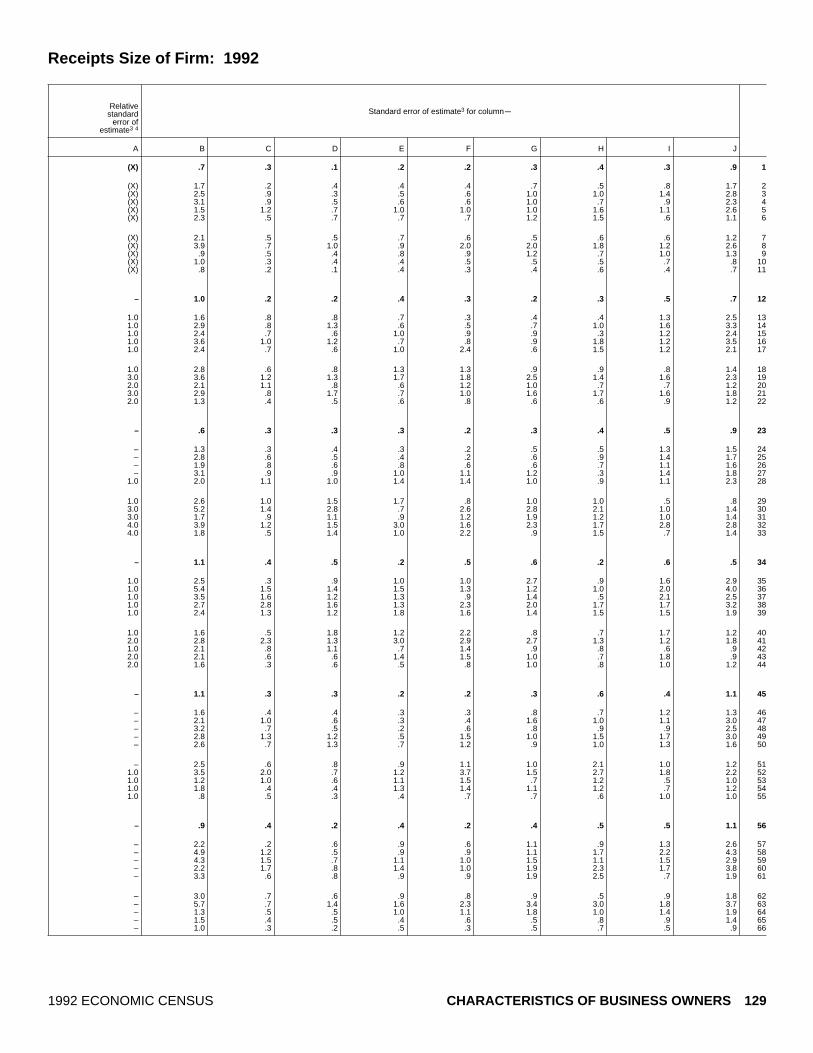
Receipts Size of Firm: 1992
Standard error of estimate3 for columnmRelative
standarderror of
estimate3 4
A B C D E F G H I J
(X) .7 .3 .1 .2 .2 .3 .4 .3 .9 1
(X) 1.7 .2 .4 .4 .4 .7 .5 .8 1.7 2(X) 2.5 .9 .3 .5 .6 1.0 1.0 1.4 2.8 3(X) 3.1 .9 .5 .6 .6 1.0 .7 .9 2.3 4(X) 1.5 1.2 .7 1.0 1.0 1.0 1.6 1.1 2.6 5(X) 2.3 .5 .7 .7 .7 1.2 1.5 .6 1.1 6
(X) 2.1 .5 .5 .7 .6 .5 .6 .6 1.2 7(X) 3.9 .7 1.0 .9 2.0 2.0 1.8 1.2 2.6 8(X) .9 .5 .4 .8 .9 1.2 .7 1.0 1.3 9(X) 1.0 .3 .4 .4 .5 .5 .5 .7 .8 10(X) .8 .2 .1 .4 .3 .4 .6 .4 .7 11
– 1.0 .2 .2 .4 .3 .2 .3 .5 .7 12
1.0 1.6 .8 .8 .7 .3 .4 .4 1.3 2.5 131.0 2.9 .8 1.3 .6 .5 .7 1.0 1.6 3.3 141.0 2.4 .7 .6 1.0 .9 .9 .3 1.2 2.4 151.0 3.6 1.0 1.2 .7 .8 .9 1.8 1.2 3.5 161.0 2.4 .7 .6 1.0 2.4 .6 1.5 1.2 2.1 17
1.0 2.8 .6 .8 1.3 1.3 .9 .9 .8 1.4 183.0 3.6 1.2 1.3 1.7 1.8 2.5 1.4 1.6 2.3 192.0 2.1 1.1 .8 .6 1.2 1.0 .7 .7 1.2 203.0 2.9 .8 1.7 .7 1.0 1.6 1.7 1.6 1.8 212.0 1.3 .4 .5 .6 .8 .6 .6 .9 1.2 22
– .6 .3 .3 .3 .2 .3 .4 .5 .9 23
– 1.3 .3 .4 .3 .2 .5 .5 1.3 1.5 24– 2.8 .6 .5 .4 .2 .6 .9 1.4 1.7 25– 1.9 .8 .6 .8 .6 .6 .7 1.1 1.6 26– 3.1 .9 .9 1.0 1.1 1.2 .3 1.4 1.8 27
1.0 2.0 1.1 1.0 1.4 1.4 1.0 .9 1.1 2.3 28
1.0 2.6 1.0 1.5 1.7 .8 1.0 1.0 .5 .8 293.0 5.2 1.4 2.8 .7 2.6 2.8 2.1 1.0 1.4 303.0 1.7 .9 1.1 .9 1.2 1.9 1.2 1.0 1.4 314.0 3.9 1.2 1.5 3.0 1.6 2.3 1.7 2.8 2.8 324.0 1.8 .5 1.4 1.0 2.2 .9 1.5 .7 1.4 33
– 1.1 .4 .5 .2 .5 .6 .2 .6 .5 34
1.0 2.5 .3 .9 1.0 1.0 2.7 .9 1.6 2.9 351.0 5.4 1.5 1.4 1.5 1.3 1.2 1.0 2.0 4.0 361.0 3.5 1.6 1.2 1.3 .9 1.4 .5 2.1 2.5 371.0 2.7 2.8 1.6 1.3 2.3 2.0 1.7 1.7 3.2 381.0 2.4 1.3 1.2 1.8 1.6 1.4 1.5 1.5 1.9 39
1.0 1.6 .5 1.8 1.2 2.2 .8 .7 1.7 1.2 402.0 2.8 2.3 1.3 3.0 2.9 2.7 1.3 1.2 1.8 411.0 2.1 .8 1.1 .7 1.4 .9 .8 .6 .9 422.0 2.1 .6 .6 1.4 1.5 1.0 .7 1.8 .9 432.0 1.6 .3 .6 .5 .8 1.0 .8 1.0 1.2 44
– 1.1 .3 .3 .2 .2 .3 .6 .4 1.1 45
– 1.6 .4 .4 .3 .3 .8 .7 1.2 1.3 46– 2.1 1.0 .6 .3 .4 1.6 1.0 1.1 3.0 47– 3.2 .7 .5 .2 .6 .8 .9 .9 2.5 48– 2.8 1.3 1.2 .5 1.5 1.0 1.5 1.7 3.0 49– 2.6 .7 1.3 .7 1.2 .9 1.0 1.3 1.6 50
– 2.5 .6 .8 .9 1.1 1.0 2.1 1.0 1.2 511.0 3.5 2.0 .7 1.2 3.7 1.5 2.7 1.8 2.2 521.0 1.2 1.0 .6 1.1 1.5 .7 1.2 .5 1.0 531.0 1.8 .4 .4 1.3 1.4 1.1 1.2 .7 1.2 541.0 .8 .5 .3 .4 .7 .7 .6 1.0 1.0 55
– .9 .4 .2 .4 .2 .4 .5 .5 1.1 56
– 2.2 .2 .6 .9 .6 1.1 .9 1.3 2.6 57– 4.9 1.2 .5 .9 .9 1.1 1.7 2.2 4.3 58– 4.3 1.5 .7 1.1 1.0 1.5 1.1 1.5 2.9 59– 2.2 1.7 .8 1.4 1.0 1.9 2.3 1.7 3.8 60– 3.3 .6 .8 .9 .9 1.9 2.5 .7 1.9 61
– 3.0 .7 .6 .9 .8 .9 .5 .9 1.8 62– 5.7 .7 1.4 1.6 2.3 3.4 3.0 1.8 3.7 63– 1.3 .5 .5 1.0 1.1 1.8 1.0 1.4 1.9 64– 1.5 .4 .5 .4 .6 .5 .8 .9 1.4 65– 1.0 .3 .2 .5 .3 .5 .7 .5 .9 66
1992 ECONOMIC CENSUS CHARACTERISTICS OF BUSINESS OWNERS 129
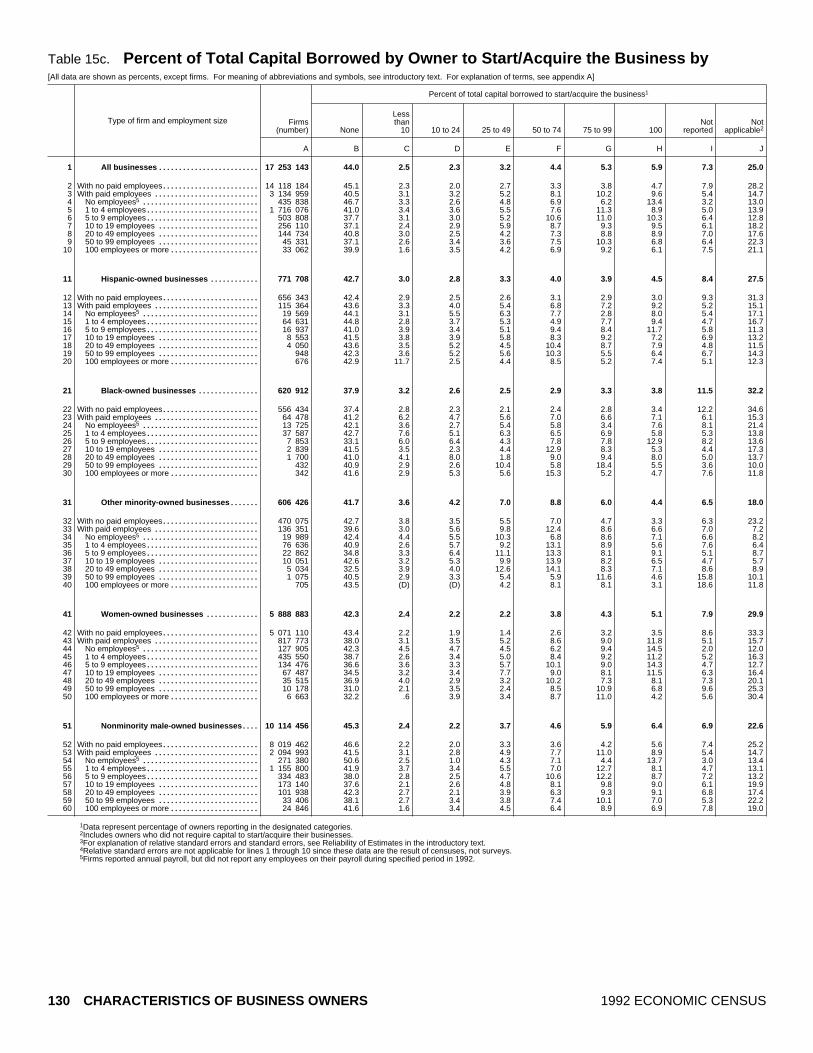
Table 15c. Percent of Total Capital Borrowed by Owner to Start/Acquire the Business by[All data are shown as percents, except firms. For meaning of abbreviations and symbols, see introductory text. For explanation of terms, see appendix A]
Type of firm and employment size
Percent of total capital borrowed to start/acquire the business1
Firms(number) None
Lessthan
10 10 to 24 25 to 49 50 to 74 75 to 99 100Not
reportedNot
applicable2
A B C D E F G H I J
All businesses 17 253 143......................... 44.0 2.5 2.3 3.2 4.4 5.3 5.9 7.3 25.01
With no paid employees 14 118 184........................ 45.1 2.3 2.0 2.7 3.3 3.8 4.7 7.9 28.22With paid employees 3 134 959.......................... 40.5 3.1 3.2 5.2 8.1 10.2 9.6 5.4 14.73
No employees5 435 838............................. 46.7 3.3 2.6 4.8 6.9 6.2 13.4 3.2 13.041 to 4 employees 1 716 076............................ 41.0 3.4 3.6 5.5 7.6 11.3 8.9 5.0 13.955 to 9 employees 503 808............................ 37.7 3.1 3.0 5.2 10.6 11.0 10.3 6.4 12.8610 to 19 employees 256 110......................... 37.1 2.4 2.9 5.9 8.7 9.3 9.5 6.1 18.2720 to 49 employees 144 734......................... 40.8 3.0 2.5 4.2 7.3 8.8 8.9 7.0 17.6850 to 99 employees 45 331......................... 37.1 2.6 3.4 3.6 7.5 10.3 6.8 6.4 22.39100 employees or more 33 062...................... 39.9 1.6 3.5 4.2 6.9 9.2 6.1 7.5 21.110
Hispanic ~owned businesses 771 708............ 42.7 3.0 2.8 3.3 4.0 3.9 4.5 8.4 27.511
With no paid employees 656 343........................ 42.4 2.9 2.5 2.6 3.1 2.9 3.0 9.3 31.312With paid employees 115 364.......................... 43.6 3.3 4.0 5.4 6.8 7.2 9.2 5.2 15.113
No employees5 19 569............................. 44.1 3.1 5.5 6.3 7.7 2.8 8.0 5.4 17.1141 to 4 employees 64 631............................ 44.8 2.8 3.7 5.3 4.9 7.7 9.4 4.7 16.7155 to 9 employees 16 937............................ 41.0 3.9 3.4 5.1 9.4 8.4 11.7 5.8 11.31610 to 19 employees 8 553......................... 41.5 3.8 3.9 5.8 8.3 9.2 7.2 6.9 13.21720 to 49 employees 4 050......................... 43.6 3.5 5.2 4.5 10.4 8.7 7.9 4.8 11.51850 to 99 employees 948......................... 42.3 3.6 5.2 5.6 10.3 5.5 6.4 6.7 14.319100 employees or more 676...................... 42.9 11.7 2.5 4.4 8.5 5.2 7.4 5.1 12.320
Black ~owned businesses 620 912............... 37.9 3.2 2.6 2.5 2.9 3.3 3.8 11.5 32.221
With no paid employees 556 434........................ 37.4 2.8 2.3 2.1 2.4 2.8 3.4 12.2 34.622With paid employees 64 478.......................... 41.2 6.2 4.7 5.6 7.0 6.6 7.1 6.1 15.323
No employees5 13 725............................. 42.1 3.6 2.7 5.4 5.8 3.4 7.6 8.1 21.4241 to 4 employees 37 587............................ 42.7 7.6 5.1 6.3 6.5 6.9 5.8 5.3 13.8255 to 9 employees 7 853............................ 33.1 6.0 6.4 4.3 7.8 7.8 12.9 8.2 13.62610 to 19 employees 2 839......................... 41.5 3.5 2.3 4.4 12.9 8.3 5.3 4.4 17.32720 to 49 employees 1 700......................... 41.0 4.1 8.0 1.8 9.0 9.4 8.0 5.0 13.72850 to 99 employees 432......................... 40.9 2.9 2.6 10.4 5.8 18.4 5.5 3.6 10.029100 employees or more 342...................... 41.6 2.9 5.3 5.6 15.3 5.2 4.7 7.6 11.830
Other minority ~owned businesses 606 426....... 41.7 3.6 4.2 7.0 8.8 6.0 4.4 6.5 18.031
With no paid employees 470 075........................ 42.7 3.8 3.5 5.5 7.0 4.7 3.3 6.3 23.232With paid employees 136 351.......................... 39.6 3.0 5.6 9.8 12.4 8.6 6.6 7.0 7.233
No employees5 19 989............................. 42.4 4.4 5.5 10.3 6.8 8.6 7.1 6.6 8.2341 to 4 employees 76 636............................ 40.9 2.6 5.7 9.2 13.1 8.9 5.6 7.6 6.4355 to 9 employees 22 862............................ 34.8 3.3 6.4 11.1 13.3 8.1 9.1 5.1 8.73610 to 19 employees 10 051......................... 42.6 3.2 5.3 9.9 13.9 8.2 6.5 4.7 5.73720 to 49 employees 5 034......................... 32.5 3.9 4.0 12.6 14.1 8.3 7.1 8.6 8.93850 to 99 employees 1 075......................... 40.5 2.9 3.3 5.4 5.9 11.6 4.6 15.8 10.139100 employees or more 705...................... 43.5 (D) (D) 4.2 8.1 8.1 3.1 18.6 11.840
Women ~owned businesses 5 888 883............. 42.3 2.4 2.2 2.2 3.8 4.3 5.1 7.9 29.941
With no paid employees 5 071 110........................ 43.4 2.2 1.9 1.4 2.6 3.2 3.5 8.6 33.342With paid employees 817 773.......................... 38.0 3.1 3.5 5.2 8.6 9.0 11.8 5.1 15.743
No employees5 127 905............................. 42.3 4.5 4.7 4.5 6.2 9.4 14.5 2.0 12.0441 to 4 employees 435 550............................ 38.7 2.6 3.4 5.0 8.4 9.2 11.2 5.2 16.3455 to 9 employees 134 476............................ 36.6 3.6 3.3 5.7 10.1 9.0 14.3 4.7 12.74610 to 19 employees 67 487......................... 34.5 3.2 3.4 7.7 9.0 8.1 11.5 6.3 16.44720 to 49 employees 35 515......................... 36.9 4.0 2.9 3.2 10.2 7.3 8.1 7.3 20.14850 to 99 employees 10 178......................... 31.0 2.1 3.5 2.4 8.5 10.9 6.8 9.6 25.349100 employees or more 6 663...................... 32.2 .6 3.9 3.4 8.7 11.0 4.2 5.6 30.450
Nonminority male ~owned businesses 10 114 456.... 45.3 2.4 2.2 3.7 4.6 5.9 6.4 6.9 22.651
With no paid employees 8 019 462........................ 46.6 2.2 2.0 3.3 3.6 4.2 5.6 7.4 25.252With paid employees 2 094 993.......................... 41.5 3.1 2.8 4.9 7.7 11.0 8.9 5.4 14.753
No employees5 271 380............................. 50.6 2.5 1.0 4.3 7.1 4.4 13.7 3.0 13.4541 to 4 employees 1 155 800............................ 41.9 3.7 3.4 5.5 7.0 12.7 8.1 4.7 13.1555 to 9 employees 334 483............................ 38.0 2.8 2.5 4.7 10.6 12.2 8.7 7.2 13.25610 to 19 employees 173 140......................... 37.6 2.1 2.6 4.8 8.1 9.8 9.0 6.1 19.95720 to 49 employees 101 938......................... 42.3 2.7 2.1 3.9 6.3 9.3 9.1 6.8 17.45850 to 99 employees 33 406......................... 38.1 2.7 3.4 3.8 7.4 10.1 7.0 5.3 22.259100 employees or more 24 846...................... 41.6 1.6 3.4 4.5 6.4 8.9 6.9 7.8 19.060
1Data represent percentage of owners reporting in the designated categories.2Includes owners who did not require capital to start/acquire their businesses.3For explanation of relative standard errors and standard errors, see Reliability of Estimates in the introductory text.4Relative standard errors are not applicable for lines 1 through 10 since these data are the result of censuses, not surveys.5Firms reported annual payroll, but did not report any employees on their payroll during specified period in 1992.
130 CHARACTERISTICS OF BUSINESS OWNERS 1992 ECONOMIC CENSUS

Employment Size of Firm: 1992
Standard error of estimate3 for columnmRelative
standarderror of
estimate3 4
A B C D E F G H I J
(X) .7 .3 .1 .2 .2 .3 .4 .3 .9 1
(X) .9 .3 .2 .3 .2 .4 .4 .4 1.2 2(X) .8 .4 .3 .3 .5 .5 .6 .5 .6 3(X) 3.3 1.1 .5 .8 1.4 .9 2.7 .8 2.6 4(X) 1.5 .8 .6 .4 1.1 1.1 .8 .7 1.2 5(X) 1.6 .3 .4 .5 1.0 .7 1.0 1.7 1.3 6(X) 1.1 .4 .3 1.0 1.1 1.2 .9 .6 2.0 7(X) 1.9 .6 .2 .5 .6 .6 1.0 .6 1.4 8(X) 2.2 .7 .6 .9 1.1 2.1 .8 .7 3.1 9(X) 3.6 .7 1.1 1.3 1.4 1.2 1.3 1.4 2.1 10
– 1.0 .2 .2 .4 .3 .2 .3 .5 .7 11
– 1.1 .3 .3 .4 .4 .2 .3 .6 .7 121.0 .9 .4 .8 .6 .4 .8 1.1 .5 1.0 132.0 5.1 1.3 4.2 2.3 2.0 1.1 3.8 1.6 2.9 141.0 2.5 .5 1.0 .6 .6 1.3 2.3 .9 1.6 152.0 3.7 .8 .7 .9 1.6 1.1 2.0 .9 1.2 163.0 2.7 .6 .8 .7 1.5 1.2 .9 1.6 1.4 174.0 3.2 1.2 1.4 1.1 1.7 2.0 1.6 1.2 1.9 186.0 4.2 .9 2.3 1.7 3.1 1.0 1.8 1.2 2.1 198.0 6.0 6.2 .8 2.6 2.7 2.5 4.8 1.9 2.0 20
– .6 .3 .3 .3 .2 .3 .4 .5 .9 21
– .7 .2 .3 .4 .2 .3 .4 .5 1.0 221.0 1.4 .9 .9 .7 1.0 .7 .5 .7 1.6 232.0 3.5 1.7 1.3 2.0 2.2 1.2 2.4 2.4 3.9 241.0 2.2 1.2 1.3 .8 1.0 1.0 .5 .7 1.6 253.0 2.8 1.7 1.1 1.5 1.6 1.9 2.1 2.4 1.0 264.0 2.9 .8 .9 1.0 3.8 2.9 1.5 1.5 2.5 276.0 4.6 1.6 3.0 .9 2.3 2.8 3.2 1.3 2.0 288.0 6.4 1.1 1.8 6.8 1.8 4.1 3.0 1.7 2.5 29
10.0 4.4 1.3 4.6 2.1 4.1 2.0 2.7 2.4 3.1 30
– 1.1 .4 .5 .2 .5 .6 .2 .6 .5 31
– 1.6 .7 .7 .5 .6 .8 .4 .7 .9 321.0 1.3 .4 .7 .9 .5 .6 .6 1.0 .3 332.0 5.6 3.0 2.1 5.3 1.5 3.6 3.0 3.4 1.6 341.0 2.0 .4 1.5 1.7 1.0 .8 1.0 1.7 .9 352.0 2.2 .7 1.7 1.9 1.5 .9 1.3 .9 1.4 362.0 2.6 1.0 1.5 1.9 1.7 1.3 1.7 1.4 1.1 374.0 1.5 1.1 .9 1.4 1.8 1.6 1.8 1.8 1.9 386.0 5.6 1.5 1.2 1.7 1.5 3.1 1.8 4.5 2.8 396.0 4.2 (D) (D) 2.5 2.9 2.2 1.7 5.6 2.4 40
– 1.1 .3 .3 .2 .2 .3 .6 .4 1.1 41
– 1.3 .3 .3 .2 .2 .3 .5 .5 1.5 42– 1.7 .4 .4 .5 .7 .8 1.4 .5 1.0 43
1.0 4.1 1.9 1.5 2.3 1.7 2.3 4.5 .5 2.5 44– 2.5 .5 .8 .8 1.3 1.4 2.0 .8 1.6 45
1.0 2.9 .8 .6 .6 1.4 .9 2.1 .6 1.0 461.0 2.0 .7 1.0 1.3 1.2 1.1 1.8 .5 1.8 471.0 2.7 .4 .5 .9 1.8 .9 1.2 1.1 1.3 482.0 1.9 1.1 1.5 .9 2.1 2.4 2.0 2.3 3.3 492.0 3.4 .3 1.1 2.0 3.1 4.0 1.8 1.4 4.4 50
– .9 .4 .2 .4 .2 .4 .5 .5 1.1 51
– 1.3 .4 .2 .5 .3 .5 .6 .7 1.4 52– .9 .6 .4 .4 .8 .7 .8 .6 .8 53– 5.9 1.1 .4 1.4 2.1 1.5 4.5 1.4 4.3 54– 2.2 1.2 .7 .5 1.4 1.6 1.0 .8 1.5 55– 2.8 .4 .6 .7 1.4 .9 1.6 2.3 1.8 56
1.0 1.5 .4 .4 1.5 1.4 1.6 1.1 .9 2.9 571.0 2.1 .8 .2 .6 .6 .6 1.4 .6 1.8 581.0 2.7 .8 .8 1.1 1.4 2.5 1.1 .9 3.8 591.0 4.6 .7 1.6 1.8 1.4 1.1 1.4 1.9 2.8 60
1992 ECONOMIC CENSUS CHARACTERISTICS OF BUSINESS OWNERS 131

Table 15d. Percent of Total Capital Borrowed by Owner to Start/Acquire the Business by Legal[All data are shown as percents, except firms. For meaning of abbreviations and symbols, see introductory text. For explanation of terms, see appendix A]
Type of firm and legal form of organization
Percent of total capital borrowed to start/acquire the business1
Firms(number) None
Lessthan
10 10 to 24 25 to 49 50 to 74 75 to 99 100Not
reportedNot
applicable2
A B C D E F G H I J
All businesses 17 253 143......................... 44.0 2.5 2.3 3.2 4.4 5.3 5.9 7.3 25.01
Individual proprietorships 14 599 295....................... 42.7 2.6 2.2 3.2 3.9 4.7 5.2 7.6 27.82Partnerships 1 089 578.................................. 48.1 1.9 2.3 2.7 4.3 7.8 6.7 6.5 19.73Subchapter S corporations 1 564 270..................... 46.9 2.3 2.9 3.8 6.9 6.2 8.4 6.3 16.34
Hispanic ~owned businesses 771 708............ 42.7 3.0 2.8 3.3 4.0 3.9 4.5 8.4 27.55
Individual proprietorships 689 015....................... 40.5 3.2 2.5 3.1 3.1 3.0 3.7 9.2 31.76Partnerships 32 650.................................. 53.8 1.6 3.4 3.9 5.3 5.6 6.0 6.3 14.07Subchapter S corporations 50 042..................... 46.1 2.7 4.2 4.0 7.9 7.3 7.3 5.4 15.18
Black ~owned businesses 620 912............... 37.9 3.2 2.6 2.5 2.9 3.3 3.8 11.5 32.29
Individual proprietorships 584 256....................... 37.3 3.1 2.4 2.2 2.6 3.1 3.9 12.0 33.610Partnerships 14 727.................................. 49.8 3.1 2.1 5.3 5.8 5.5 2.0 7.8 18.511Subchapter S corporations 21 928..................... 40.6 6.6 7.0 6.5 7.5 6.4 4.9 4.5 16.012
Other minority ~owned businesses 606 426....... 41.7 3.6 4.2 7.0 8.8 6.0 4.4 6.5 18.013
Individual proprietorships 502 022....................... 42.0 3.5 3.7 6.9 7.8 5.2 3.7 5.7 21.614Partnerships 49 489.................................. 40.3 4.9 4.1 5.8 8.9 8.9 5.0 9.1 13.015Subchapter S corporations 54 915..................... 42.2 2.7 5.4 8.1 11.3 5.7 5.7 6.7 12.316
Women ~owned businesses 5 888 883............. 42.3 2.4 2.2 2.2 3.8 4.3 5.1 7.9 29.917
Individual proprietorships 5 078 077....................... 41.8 2.4 2.0 1.7 2.6 3.7 4.3 8.0 33.518Partnerships 243 651.................................. 48.0 1.7 2.4 2.3 7.3 5.2 3.1 9.9 20.219Subchapter S corporations 567 155..................... 41.8 2.7 3.1 4.1 7.4 6.9 10.0 6.3 17.620
Nonminority male ~owned businesses 10 114 456.... 45.3 2.4 2.2 3.7 4.6 5.9 6.4 6.9 22.621
Individual proprietorships 8 414 238....................... 43.5 2.7 2.2 4.0 4.6 5.3 5.8 7.3 24.522Partnerships 777 379.................................. 48.6 1.7 2.1 2.5 3.0 8.5 7.9 5.4 20.223Subchapter S corporations 922 838..................... 50.3 1.9 2.4 3.4 6.4 5.9 7.7 6.2 15.624
1Data represent percentage of owners reporting in the designated categories.2Includes owners who did not require capital to start/acquire their businesses.3For explanation of relative standard errors and standard errors, see Reliability of Estimates in the introductory text.4Relative standard errors are not applicable for lines 1 through 4 since these data are the result of censuses, not surveys.
132 CHARACTERISTICS OF BUSINESS OWNERS 1992 ECONOMIC CENSUS

Form of Organization of Firm: 1992
Standard error of estimate3 for columnmRelative
standarderror of
estimate3 4
A B C D E F G H I J
(X) .7 .3 .1 .2 .2 .3 .4 .3 .9 1
(X) .9 .4 .2 .3 .2 .4 .3 .3 1.1 2(X) 2.0 .4 .6 .7 .6 1.0 1.7 .9 2.0 3(X) 2.2 .3 .5 .3 .6 .5 .8 .7 1.0 4
– 1.0 .2 .2 .4 .3 .2 .3 .5 .7 5
– .8 .3 .2 .5 .3 .2 .4 .7 .7 62.0 3.1 .6 .7 1.0 1.2 .6 1.1 1.0 1.9 71.0 1.0 .5 1.0 .4 1.5 1.0 .8 .6 1.4 8
– .6 .3 .3 .3 .2 .3 .4 .5 .9 9
– .7 .3 .3 .3 .2 .3 .4 .5 1.0 103.0 3.3 .9 .5 1.0 1.0 1.6 .8 1.7 3.1 112.0 2.4 2.2 1.7 .9 1.2 .8 .6 .8 1.9 12
– 1.1 .4 .5 .2 .5 .6 .2 .6 .5 13
– 1.4 .5 .6 .6 .7 .5 .3 .7 .5 141.0 3.7 1.6 1.1 .9 1.6 2.7 1.2 1.5 2.2 151.0 2.0 .4 .9 1.0 1.0 .6 .8 1.5 1.5 16
– 1.1 .3 .3 .2 .2 .3 .6 .4 1.1 17
– 1.2 .3 .3 .2 .3 .4 .5 .5 1.4 181.0 4.4 .4 1.0 .8 2.3 1.6 .5 2.0 2.6 19
– 2.2 .2 .8 .5 .9 .7 1.1 1.1 1.3 20
– .9 .4 .2 .4 .2 .4 .5 .5 1.1 21
– 1.1 .6 .2 .5 .3 .5 .4 .6 1.2 22– 2.2 .6 .7 .8 .6 1.5 2.1 .8 2.6 23– 3.0 .4 .7 .5 .7 .8 .9 .8 1.5 24
1992 ECONOMIC CENSUS CHARACTERISTICS OF BUSINESS OWNERS 133

Table 16a. Sources of Borrowed Capital for Owner by Industry Division: 1992[All data are shown as percents, except firms. For meaning of abbreviations and symbols, see introductory text. For explanation of terms, see appendix A]
Type of firm and industry division
Sources of borrowed capital obtained1
Firms(number)
Personalloan using
homemortgage/equity line
of creditPersonal credit
cardPersonal loan
from spousePersonal loan
from familyOther personal
loanNot
reportedNot
applicable2
A B C D E F G H
All businesses 17 253 143................................. 4.3 2.6 1.0 5.2 6.1 14.4 69.11
Agricultural services, forestry, fishing, and mining 583 253......... 3.7 2.5 .7 5.9 7.0 18.1 65.22Construction 1 829 620......................................... 3.4 2.5 .6 3.8 5.9 9.6 77.23Manufacturing 517 714........................................ 6.4 1.3 .4 7.4 8.8 11.5 67.14Transportation, communications, and utilities 698 903............. 5.8 2.4 1.1 7.1 7.0 23.7 56.75Wholesale trade 538 339...................................... 7.3 2.7 1.0 7.7 6.7 11.9 66.66
Retail trade 2 478 045.......................................... 8.0 4.2 1.6 8.1 7.7 17.0 58.37Finance, insurance, and real estate 1 941 029..................... 4.1 1.3 .4 3.6 7.9 11.3 73.58Services 7 784 016............................................. 3.0 2.7 1.2 4.5 5.0 14.5 70.99Industries not classified 882 224................................ 2.1 1.8 .5 5.0 2.3 19.7 70.210
Hispanic ~owned businesses 771 708.................... 4.4 3.2 .9 6.2 5.7 13.1 70.211
Agricultural services, forestry, fishing, and mining 32 927......... 3.1 3.3 .5 5.3 6.1 17.6 67.412Construction 97 476......................................... 3.3 .5 .5 4.5 3.5 11.3 77.613Manufacturing 18 461........................................ 8.2 2.4 1.7 9.0 6.3 11.5 64.614Transportation, communications, and utilities 47 797............. 5.8 3.8 1.3 9.4 7.3 20.8 55.715Wholesale trade 17 727...................................... 9.6 2.4 1.0 6.4 6.4 10.3 68.516
Retail trade 107 846.......................................... 7.2 4.9 1.2 8.2 8.6 14.4 61.017Finance, insurance, and real estate 49 231..................... 3.8 2.9 .7 5.4 11.6 8.9 69.218Services 347 297............................................. 3.7 3.4 .8 5.7 4.3 12.2 73.819Industries not classified 52 945................................ 2.0 3.3 .7 5.4 1.8 18.2 71.720
Black ~owned businesses 620 912....................... 2.9 3.1 1.2 3.8 4.6 17.5 70.121
Agricultural services, forestry, fishing, and mining 10 309......... 3.7 5.6 2.2 2.5 5.7 19.2 65.322Construction 43 381......................................... 3.1 2.3 1.2 2.2 3.4 12.2 78.223Manufacturing 10 469........................................ 5.0 4.0 1.4 5.1 7.8 23.8 57.824Transportation, communications, and utilities 49 095............ 6.1 3.4 2.3 6.2 5.1 24.6 57.125Wholesale trade 7 550...................................... 5.6 4.6 1.4 5.9 5.9 12.4 68.726
Retail trade 86 840.......................................... 4.2 4.0 1.6 4.2 6.0 16.9 66.727Finance, insurance, and real estate 40 924..................... 3.4 3.0 1.2 3.2 5.5 13.5 73.928Services 332 981............................................. 2.0 2.7 .8 3.6 4.2 17.1 72.229Industries not classified 39 363................................ 1.5 3.2 1.6 3.2 3.3 21.4 68.130
Other minority ~owned businesses 606 426.............. 6.8 4.1 1.4 12.0 9.4 12.8 59.631
Agricultural services, forestry, fishing, and mining 15 218......... 3.9 2.1 .8 9.4 7.5 19.1 62.232Construction 28 295......................................... 4.2 2.4 .3 5.7 5.2 8.9 74.933Manufacturing 18 976........................................ 7.0 2.7 1.1 8.5 9.8 8.5 67.334Transportation, communications, and utilities 24 362............. 5.5 3.5 .8 8.6 9.8 19.6 55.635Wholesale trade 20 043...................................... 9.8 4.4 1.1 10.5 9.6 9.9 62.236
Retail trade 132 483.......................................... 10.2 4.8 2.2 21.2 12.3 13.5 46.537Finance, insurance, and real estate 64 762..................... 7.7 2.8 1.3 9.4 8.8 10.5 64.238Services 273 774............................................. 5.1 4.6 1.0 9.6 8.6 13.5 62.539Industries not classified 28 512................................ 3.3 5.9 3.8 13.5 9.4 11.7 62.540
Women ~owned businesses 5 888 883..................... 4.1 2.6 1.3 4.8 4.9 13.0 72.241
Agricultural services, forestry, fishing, and mining 119 731......... 4.8 1.9 .8 7.1 7.9 15.5 66.242Construction 183 695......................................... 7.4 2.4 1.4 4.9 6.9 11.5 70.343Manufacturing 152 346........................................ 6.1 2.3 .7 8.5 7.0 11.0 69.044Transportation, communications, and utilities 141 623............. 6.1 2.8 .7 5.1 7.5 14.6 66.645Wholesale trade 154 542...................................... 8.2 3.7 1.2 5.3 7.0 9.9 69.946
Retail trade 1 093 342.......................................... 6.4 4.4 1.5 6.1 6.5 14.8 64.647Finance, insurance, and real estate 602 802..................... 3.4 1.1 .9 3.6 6.1 12.1 75.148Services 3 158 444............................................. 2.8 2.4 1.6 4.5 3.6 12.2 75.249Industries not classified 282 358................................ 1.8 1.3 1.1 2.9 1.7 19.8 72.650
Nonminority male ~owned businesses 10 114 456........... 4.4 2.5 .8 5.0 6.8 15.2 67.951
Agricultural services, forestry, fishing, and mining 412 917......... 3.4 2.6 .6 5.5 6.8 18.8 64.852Construction 1 496 056......................................... 2.9 2.6 .5 3.6 6.0 9.2 78.153Manufacturing 333 485........................................ 6.5 .7 .2 6.6 9.6 11.7 66.454Transportation, communications, and utilities 458 400............. 5.9 2.0 1.1 7.6 6.8 26.8 53.755Wholesale trade 352 721...................................... 7.0 2.2 .8 8.7 6.6 12.9 64.956
Retail trade 1 197 943.......................................... 9.4 4.2 1.6 8.6 8.1 19.2 53.857Finance, insurance, and real estate 1 240 594..................... 4.1 1.3 .1 3.2 8.5 11.1 73.558Services 4 102 294............................................. 3.1 2.8 1.1 4.2 6.0 16.3 68.159Industries not classified 520 046................................ 2.3 1.8 .1 5.8 2.5 19.7 69.460
1Data represent percentage of owners reporting in the designated categories. Sum of percents in categories will not equal 100 since multiple responses were allowed.2Includes owners who did not require capital to start/acquire their businesses or who did not borrow capital.3For explanation of relative standard errors and standard errors, see Reliability of Estimates in the introductory text.4Relative standard errors are not applicable for lines 1 through 10 since these data are the result of censuses, not surveys.
134 CHARACTERISTICS OF BUSINESS OWNERS 1992 ECONOMIC CENSUS

Standard error of estimate3 for columnmRelative
standarderror of
estimate3 4
A B C D E F G H
(X) .2 .3 .2 .2 .4 .4 .7 1
(X) .6 1.1 .3 1.3 1.1 1.3 2.6 2(X) .4 1.1 .3 .8 1.1 1.0 2.3 3(X) .8 .2 .1 1.2 .7 1.1 2.1 4(X) 1.1 .8 .4 1.0 .8 2.2 2.1 5(X) .6 .4 .3 .9 .9 1.4 1.4 6
(X) .7 1.0 .4 .8 .6 .7 1.8 7(X) .6 .4 .1 .6 1.6 1.6 2.1 8(X) .3 .5 .4 .4 .5 .7 1.0 9(X) .6 .6 .2 1.1 .4 2.3 2.3 10
– .4 .3 .1 .5 .2 .5 .8 11
1.0 .7 .7 .4 1.6 1.3 3.0 2.9 121.0 .3 .3 .3 1.2 .7 1.8 2.1 131.0 1.2 .5 .7 1.1 1.2 1.6 2.0 141.0 1.4 .8 .6 .9 1.7 1.4 2.8 152.0 1.8 .8 .3 .8 .8 1.4 2.3 16
1.0 1.1 1.7 .6 1.1 .9 1.3 1.8 171.0 .9 .8 .3 .9 .7 1.1 1.3 18
– .6 .7 .3 .7 .5 1.1 1.3 191.0 .8 1.2 .3 1.5 .5 2.6 3.0 20
– .2 .2 .2 .2 .3 .6 .8 21
1.0 .9 1.5 .9 .5 1.0 1.7 2.1 22– .9 .7 .8 .6 .6 2.0 2.8 23
1.0 .8 1.1 .4 1.0 1.1 1.7 1.8 24– .7 .5 .6 .9 .9 2.1 2.3 25
2.0 1.3 1.3 .7 1.4 1.2 1.6 2.6 26
– .9 .8 .4 .7 .5 1.0 1.6 271.0 .7 .7 .4 .5 .9 1.1 1.5 28
– .3 .4 .2 .5 .3 1.0 1.2 29– .5 .8 .5 .7 .8 2.3 2.1 30
– .6 .6 .3 1.0 .6 .7 1.2 31
1.0 1.0 .9 .5 .8 1.7 3.6 3.8 321.0 1.0 1.3 .1 1.1 1.5 1.7 3.4 331.0 1.7 1.7 .6 1.3 2.0 1.4 2.5 341.0 1.7 1.6 .4 1.6 2.3 2.4 3.5 351.0 1.2 1.0 .4 1.1 1.6 1.6 2.4 36
1.0 1.8 1.0 .6 2.2 1.2 1.3 1.6 371.0 1.2 1.0 .6 3.3 .9 1.4 3.3 38
– .7 1.0 .5 1.1 1.1 1.3 2.2 391.0 .9 1.3 1.3 3.1 1.4 2.4 2.9 40
– .3 .3 .3 .4 .2 .3 .5 41
– 1.1 .6 .5 1.7 1.3 3.2 2.2 42– .8 .8 .6 1.3 .8 1.1 2.2 43– 1.0 .6 .2 1.3 1.1 1.1 1.2 44– 1.2 1.0 .2 1.4 1.4 2.8 4.2 45– 1.2 .6 .4 1.0 1.0 1.0 1.6 46
– .4 1.0 .8 1.1 .6 1.2 2.1 47– .8 .5 .5 .9 1.0 1.9 2.7 48– .4 .5 .5 .6 .4 .3 .8 49– .8 .5 .5 1.2 .6 3.9 4.0 50
– .4 .4 .2 .4 .7 .5 1.1 51
– .8 1.4 .4 1.5 1.6 1.8 3.6 52– .5 1.3 .3 1.0 1.4 1.2 2.7 53– 1.0 .1 .1 1.7 1.4 1.5 2.9 54– 1.7 1.0 .7 1.6 1.3 2.7 2.7 55– .8 .6 .6 1.3 1.1 1.9 2.2 56
– 1.3 1.7 .7 1.6 1.0 1.6 2.5 57– .9 .5 .1 1.0 2.4 1.8 2.8 58– .5 .7 .4 .8 .9 1.0 1.4 59– 1.1 .9 .1 1.5 .9 2.8 2.7 60
1992 ECONOMIC CENSUS CHARACTERISTICS OF BUSINESS OWNERS 135

Table 16b. Sources of Borrowed Capital for Owner by Receipts Size of Firm: 1992[All data are shown as percents, except firms. For meaning of abbreviations and symbols, see introductory text. For explanation of terms, see appendix A]
Type of firm and receipts size
Sources of borrowed capital obtained1
Firms(number)
Personalloan using
homemortgage/equity line
of creditPersonal credit
cardPersonal loan
from spousePersonal loan
from familyOther personal
loanNot
reportedNot
applicable2
A B C D E F G H
All businesses 17 253 143................................. 4.3 2.6 1.0 5.2 6.1 14.4 69.11
Less than $5,000 5 226 553..................................... 2.4 2.6 .9 1.8 2.5 14.6 76.92$5,000 to $9,999 2 443 946..................................... 2.0 1.8 .7 3.1 2.5 14.0 77.03$10,000 to $24,999 3 076 410................................... 2.6 3.5 1.4 4.0 3.4 11.4 75.44$25,000 to $49,999 1 945 806................................... 3.7 2.9 1.1 6.6 9.2 14.1 64.65$50,000 to $99,999 1 615 940................................... 5.9 3.3 1.1 8.6 8.5 15.1 62.76
$100,000 to $199,999 1 197 996................................. 7.0 2.6 1.4 8.8 8.5 17.2 59.07$200,000 to $249,999 301 794................................. 6.0 2.6 .4 9.0 11.0 21.3 54.18$250,000 to $499,999 682 583................................. 9.7 1.9 1.0 10.2 11.9 17.4 52.39$500,000 to $999,999 372 078................................. 9.4 1.4 .2 7.9 12.5 15.5 57.310$1,000,000 or more 390 037................................... 9.2 .7 .4 6.5 14.8 10.8 60.611
Hispanic ~owned businesses 771 708.................... 4.4 3.2 .9 6.2 5.7 13.1 70.212
Less than $5,000 219 226..................................... 2.0 3.4 .3 3.3 2.5 15.0 76.313$5,000 to $9,999 140 362..................................... 1.8 2.0 .6 3.1 3.1 15.0 76.114$10,000 to $24,999 165 667................................... 3.9 3.3 1.2 4.2 4.0 11.9 75.415$25,000 to $49,999 87 288................................... 4.6 4.4 .9 6.7 4.6 10.7 71.716$50,000 to $99,999 64 742................................... 4.8 2.6 1.2 9.5 8.3 13.9 63.417
$100,000 to $199,999 41 578................................. 6.6 3.7 1.0 10.6 10.3 11.7 60.818$200,000 to $249,999 10 030................................. 8.8 6.4 1.2 10.6 10.1 13.6 56.619$250,000 to $499,999 22 301................................. 10.2 2.3 1.6 12.8 11.7 12.0 55.620$500,000 to $999,999 11 319................................. 10.8 3.3 1.0 11.0 12.7 13.0 54.621$1,000,000 or more 9 194................................... 10.6 1.5 .5 9.0 13.0 11.3 58.122
Black ~owned businesses 620 912....................... 2.9 3.1 1.2 3.8 4.6 17.5 70.123
Less than $5,000 236 722..................................... 1.2 2.6 .7 2.2 2.5 17.6 74.924$5,000 to $9,999 111 512..................................... 1.6 2.6 1.5 2.7 4.9 16.1 74.125$10,000 to $24,999 129 901................................... 2.4 3.0 .9 3.5 4.6 17.0 71.026$25,000 to $49,999 62 209................................... 3.8 3.4 1.8 6.9 4.2 17.9 65.227$50,000 to $99,999 39 218................................... 6.1 5.5 2.0 6.9 7.9 19.7 58.428
$100,000 to $199,999 20 936................................. 10.1 4.7 1.9 6.4 9.0 19.6 54.529$200,000 to $249,999 4 533................................. 10.4 4.5 3.1 7.9 11.1 24.0 48.630$250,000 to $499,999 9 029................................. 11.1 4.0 .9 8.9 11.6 18.5 52.331$500,000 to $999,999 3 823................................. 11.3 3.8 .8 7.7 12.5 16.9 50.532$1,000,000 or more 3 028................................... 14.4 2.4 .8 7.6 13.9 10.9 56.133
Other minority ~owned businesses 606 426.............. 6.8 4.1 1.4 12.0 9.4 12.8 59.634
Less than $5,000 132 493..................................... 1.4 4.5 .5 6.6 3.6 7.7 77.235$5,000 to $9,999 80 435..................................... 1.5 6.6 3.9 3.7 6.1 9.8 75.736$10,000 to $24,999 108 195................................... 2.9 4.9 1.6 4.9 7.3 15.4 69.137$25,000 to $49,999 77 345................................... 9.7 3.6 .7 20.4 8.1 12.4 51.038$50,000 to $99,999 70 360................................... 6.4 3.6 1.5 13.1 11.2 14.6 56.639
$100,000 to $199,999 58 620................................. 11.8 4.6 1.7 16.5 10.7 15.0 48.440$200,000 to $249,999 15 740................................. 9.7 4.7 1.7 17.1 19.3 11.6 45.441$250,000 to $499,999 34 266................................. 10.5 2.3 1.1 17.8 16.1 14.2 46.742$500,000 to $999,999 16 467................................. 11.8 3.0 .4 15.9 13.1 17.1 45.943$1,000,000 or more 12 505................................... 12.0 1.9 1.1 9.7 14.3 13.0 53.844
Women ~owned businesses 5 888 883..................... 4.1 2.6 1.3 4.8 4.9 13.0 72.245
Less than $5,000 2 310 303..................................... 1.5 3.2 .9 2.1 1.6 15.3 76.946$5,000 to $9,999 967 380..................................... 1.5 1.3 .9 4.0 2.7 10.3 81.147$10,000 to $24,999 1 051 358................................... 2.0 1.6 2.2 4.0 2.9 10.5 78.948$25,000 to $49,999 538 885................................... 4.1 2.2 1.7 5.7 4.5 14.6 69.449$50,000 to $99,999 381 517................................... 7.2 4.1 1.9 8.3 9.2 15.2 60.150
$100,000 to $199,999 267 089................................. 12.6 4.7 2.2 9.9 11.8 12.7 54.151$200,000 to $249,999 66 464................................. 9.4 4.7 1.1 10.1 18.6 11.6 51.552$250,000 to $499,999 146 313................................. 13.2 2.8 1.2 12.0 14.7 10.6 52.453$500,000 to $999,999 80 539................................. 13.0 1.1 .3 9.0 14.8 10.9 55.654$1,000,000 or more 79 037................................... 10.7 .9 .7 7.0 13.6 10.0 60.555
Nonminority male ~owned businesses 10 114 456........... 4.4 2.5 .8 5.0 6.8 15.2 67.956
Less than $5,000 2 608 047..................................... 3.2 2.1 .9 1.2 3.2 14.1 77.157$5,000 to $9,999 1 285 456..................................... 2.5 2.0 .5 2.5 2.0 16.5 74.658$10,000 to $24,999 1 763 830................................... 3.0 4.9 .9 4.1 3.5 11.4 73.559$25,000 to $49,999 1 248 482................................... 3.2 3.0 .9 6.2 11.8 14.2 62.860$50,000 to $99,999 1 108 065................................... 5.4 3.1 .8 8.4 8.3 15.1 64.261
$100,000 to $199,999 840 723................................. 4.7 1.6 1.2 7.8 7.1 19.3 61.362$200,000 to $249,999 212 693................................. 4.1 1.4 – 7.6 7.2 26.2 55.863$250,000 to $499,999 488 462................................. 8.6 1.6 .9 9.1 10.7 20.0 52.464$500,000 to $999,999 266 408................................. 8.2 1.3 .2 6.9 11.7 16.8 58.765$1,000,000 or more 292 290................................... 8.7 .6 .3 6.1 15.2 10.9 60.966
1Data represent percentage of owners reporting in the designated categories. Sum of percents in categories will not equal 100 since multiple responses were allowed.2Includes owners who did not require capital to start/acquire their businesses or who did not borrow capital.3For explanation of relative standard errors and standard errors, see Reliability of Estimates in the introductory text.4Relative standard errors are not applicable for lines 1 through 11 since these data are the result of censuses, not surveys.
136 CHARACTERISTICS OF BUSINESS OWNERS 1992 ECONOMIC CENSUS
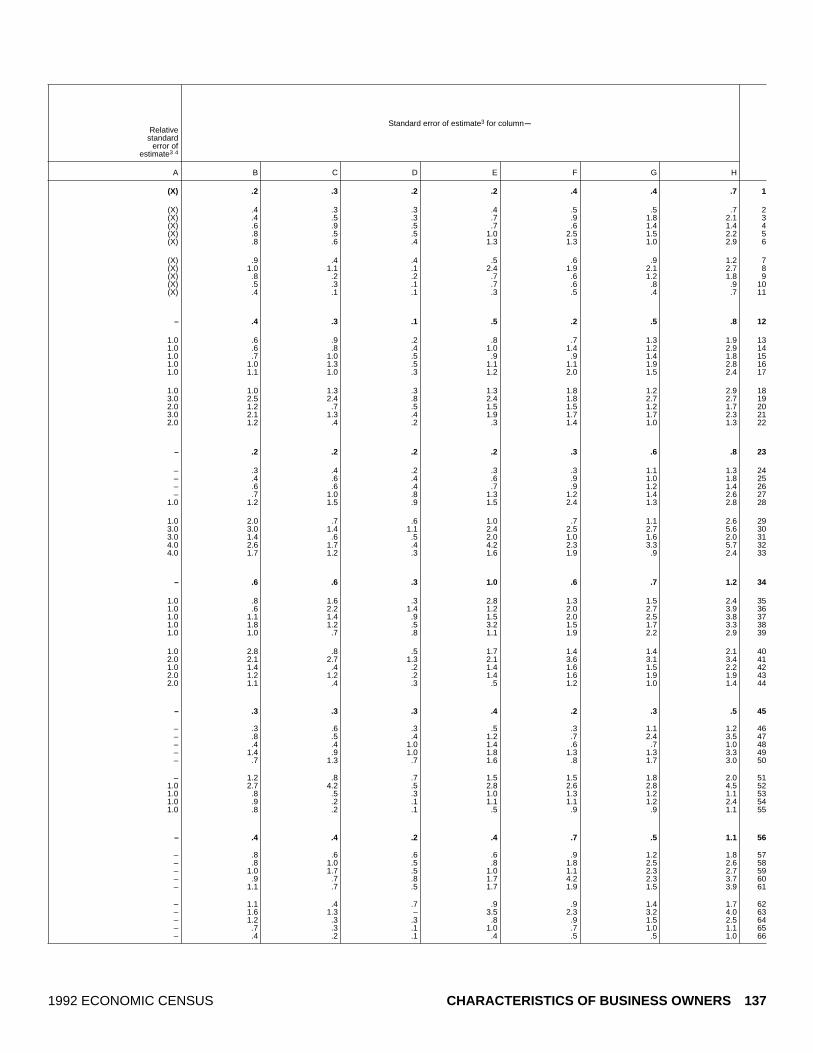
Standard error of estimate3 for columnmRelative
standarderror of
estimate3 4
A B C D E F G H
(X) .2 .3 .2 .2 .4 .4 .7 1
(X) .4 .3 .3 .4 .5 .5 .7 2(X) .4 .5 .3 .7 .9 1.8 2.1 3(X) .6 .9 .5 .7 .6 1.4 1.4 4(X) .8 .5 .5 1.0 2.5 1.5 2.2 5(X) .8 .6 .4 1.3 1.3 1.0 2.9 6
(X) .9 .4 .4 .5 .6 .9 1.2 7(X) 1.0 1.1 .1 2.4 1.9 2.1 2.7 8(X) .8 .2 .2 .7 .6 1.2 1.8 9(X) .5 .3 .1 .7 .6 .8 .9 10(X) .4 .1 .1 .3 .5 .4 .7 11
– .4 .3 .1 .5 .2 .5 .8 12
1.0 .6 .9 .2 .8 .7 1.3 1.9 131.0 .6 .8 .4 1.0 1.4 1.2 2.9 141.0 .7 1.0 .5 .9 .9 1.4 1.8 151.0 1.0 1.3 .5 1.1 1.1 1.9 2.8 161.0 1.1 1.0 .3 1.2 2.0 1.5 2.4 17
1.0 1.0 1.3 .3 1.3 1.8 1.2 2.9 183.0 2.5 2.4 .8 2.4 1.8 2.7 2.7 192.0 1.2 .7 .5 1.5 1.5 1.2 1.7 203.0 2.1 1.3 .4 1.9 1.7 1.7 2.3 212.0 1.2 .4 .2 .3 1.4 1.0 1.3 22
– .2 .2 .2 .2 .3 .6 .8 23
– .3 .4 .2 .3 .3 1.1 1.3 24– .4 .6 .4 .6 .9 1.0 1.8 25– .6 .6 .4 .7 .9 1.2 1.4 26– .7 1.0 .8 1.3 1.2 1.4 2.6 27
1.0 1.2 1.5 .9 1.5 2.4 1.3 2.8 28
1.0 2.0 .7 .6 1.0 .7 1.1 2.6 293.0 3.0 1.4 1.1 2.4 2.5 2.7 5.6 303.0 1.4 .6 .5 2.0 1.0 1.6 2.0 314.0 2.6 1.7 .4 4.2 2.3 3.3 5.7 324.0 1.7 1.2 .3 1.6 1.9 .9 2.4 33
– .6 .6 .3 1.0 .6 .7 1.2 34
1.0 .8 1.6 .3 2.8 1.3 1.5 2.4 351.0 .6 2.2 1.4 1.2 2.0 2.7 3.9 361.0 1.1 1.4 .9 1.5 2.0 2.5 3.8 371.0 1.8 1.2 .5 3.2 1.5 1.7 3.3 381.0 1.0 .7 .8 1.1 1.9 2.2 2.9 39
1.0 2.8 .8 .5 1.7 1.4 1.4 2.1 402.0 2.1 2.7 1.3 2.1 3.6 3.1 3.4 411.0 1.4 .4 .2 1.4 1.6 1.5 2.2 422.0 1.2 1.2 .2 1.4 1.6 1.9 1.9 432.0 1.1 .4 .3 .5 1.2 1.0 1.4 44
– .3 .3 .3 .4 .2 .3 .5 45
– .3 .6 .3 .5 .3 1.1 1.2 46– .8 .5 .4 1.2 .7 2.4 3.5 47– .4 .4 1.0 1.4 .6 .7 1.0 48– 1.4 .9 1.0 1.8 1.3 1.3 3.3 49– .7 1.3 .7 1.6 .8 1.7 3.0 50
– 1.2 .8 .7 1.5 1.5 1.8 2.0 511.0 2.7 4.2 .5 2.8 2.6 2.8 4.5 521.0 .8 .5 .3 1.0 1.3 1.2 1.1 531.0 .9 .2 .1 1.1 1.1 1.2 2.4 541.0 .8 .2 .1 .5 .9 .9 1.1 55
– .4 .4 .2 .4 .7 .5 1.1 56
– .8 .6 .6 .6 .9 1.2 1.8 57– .8 1.0 .5 .8 1.8 2.5 2.6 58– 1.0 1.7 .5 1.0 1.1 2.3 2.7 59– .9 .7 .8 1.7 4.2 2.3 3.7 60– 1.1 .7 .5 1.7 1.9 1.5 3.9 61
– 1.1 .4 .7 .9 .9 1.4 1.7 62– 1.6 1.3 – 3.5 2.3 3.2 4.0 63– 1.2 .3 .3 .8 .9 1.5 2.5 64– .7 .3 .1 1.0 .7 1.0 1.1 65– .4 .2 .1 .4 .5 .5 1.0 66
1992 ECONOMIC CENSUS CHARACTERISTICS OF BUSINESS OWNERS 137

Table 16c. Sources of Borrowed Capital for Owner by Employment Size of Firm: 1992[All data are shown as percents, except firms. For meaning of abbreviations and symbols, see introductory text. For explanation of terms, see appendix A]
Type of firm and employment size
Sources of borrowed capital obtained1
Firms(number)
Personalloan using
homemortgage/equity line
of creditPersonal credit
cardPersonal loan
from spousePersonal loan
from familyOther personal
loanNot
reportedNot
applicable2
A B C D E F G H
All businesses 17 253 143................................. 4.3 2.6 1.0 5.2 6.1 14.4 69.11
With no paid employees 14 118 184............................... 3.0 2.5 .8 3.9 4.6 13.9 73.32With paid employees 3 134 959.................................. 8.7 2.8 1.6 9.3 11.2 16.1 55.23
No employees5 435 838..................................... 8.0 5.0 2.6 10.0 10.6 9.9 59.741 to 4 employees 1 716 076................................... 6.9 3.4 2.0 10.5 8.8 18.9 54.955 to 9 employees 503 808................................... 11.5 1.5 1.1 7.9 13.9 18.2 50.5610 to 19 employees 256 110................................. 12.2 1.9 .5 8.4 12.6 12.9 55.3720 to 49 employees 144 734................................. 9.8 1.6 .5 7.8 14.4 11.4 58.4850 to 99 employees 45 331................................. 9.1 .3 .1 5.6 19.2 9.1 59.39100 employees or more 33 062............................. 6.9 .1 .6 4.3 18.5 9.9 61.010
Hispanic ~owned businesses 771 708.................... 4.4 3.2 .9 6.2 5.7 13.1 70.211
With no paid employees 656 343............................... 3.0 3.3 .8 4.9 4.2 13.3 73.712With paid employees 115 364.................................. 9.1 2.7 .9 10.2 10.4 12.7 58.813
No employees5 19 569..................................... 8.6 4.6 .7 5.7 13.6 9.2 61.2141 to 4 employees 64 631................................... 7.9 2.0 .9 9.4 8.0 14.3 61.5155 to 9 employees 16 937................................... 9.4 3.6 1.4 16.2 12.6 12.8 52.31610 to 19 employees 8 553................................. 11.9 2.9 .5 10.6 12.8 12.4 54.81720 to 49 employees 4 050................................. 13.1 1.7 1.4 11.1 12.8 9.0 55.11850 to 99 employees 948................................. 14.1 .8 – 8.2 12.7 10.7 56.619100 employees or more 676............................. 11.4 1.4 .7 15.9 12.2 6.9 55.320
Black ~owned businesses 620 912....................... 2.9 3.1 1.2 3.8 4.6 17.5 70.121
With no paid employees 556 434............................... 2.3 2.8 1.0 3.4 4.0 17.1 72.022With paid employees 64 478.................................. 7.5 5.3 2.2 6.8 8.9 19.7 56.623
No employees5 13 725..................................... 2.7 4.6 2.4 6.2 7.8 18.7 63.5241 to 4 employees 37 587................................... 7.0 6.3 2.5 5.9 8.5 20.4 56.5255 to 9 employees 7 853................................... 12.7 3.9 1.4 10.7 9.5 23.0 46.72610 to 19 employees 2 839................................. 9.7 1.3 1.3 6.8 8.5 16.5 58.82720 to 49 employees 1 700................................. 13.2 6.0 .4 9.8 15.6 9.8 54.72850 to 99 employees 432................................. 16.5 1.5 – 2.8 20.5 10.1 50.929100 employees or more 342............................. 17.9 1.1 2.5 7.8 12.6 10.5 53.330
Other minority ~owned businesses 606 426.............. 6.8 4.1 1.4 12.0 9.4 12.8 59.631
With no paid employees 470 075............................... 4.9 4.1 1.4 9.8 7.5 11.6 65.932With paid employees 136 351.................................. 10.7 4.2 1.4 16.7 13.3 15.2 46.933
No employees5 19 989..................................... 7.1 11.8 .3 13.0 10.6 12.8 50.6341 to 4 employees 76 636................................... 9.4 3.3 1.8 16.7 12.3 17.6 47.4355 to 9 employees 22 862................................... 12.5 4.4 1.4 18.2 16.4 13.1 43.53610 to 19 employees 10 051................................. 15.6 1.6 .9 19.5 11.9 9.8 48.33720 to 49 employees 5 034................................. 13.7 3.3 1.1 16.9 19.5 13.8 41.53850 to 99 employees 1 075................................. 9.9 (D) (D) 6.8 18.6 17.7 50.539100 employees or more 705............................. 8.6 (D) (D) 7.1 9.7 22.6 55.240
Women ~owned businesses 5 888 883..................... 4.1 2.6 1.3 4.8 4.9 13.0 72.241
With no paid employees 5 071 110............................... 2.3 2.2 1.1 3.4 3.1 13.1 76.642With paid employees 817 773.................................. 11.5 4.1 2.5 10.7 12.3 12.3 53.743
No employees5 127 905..................................... 8.9 9.6 5.2 12.3 11.0 9.6 54.3441 to 4 employees 435 550................................... 10.4 4.2 2.9 10.6 10.5 13.9 55.0455 to 9 employees 134 476................................... 14.5 1.6 1.5 10.5 16.0 12.7 49.34610 to 19 employees 67 487................................. 15.1 4.2 .6 11.3 13.6 9.7 50.94720 to 49 employees 35 515................................. 11.4 .9 1.0 10.2 14.3 9.6 57.04850 to 99 employees 10 178................................. 11.0 .6 .6 4.3 18.4 12.3 56.349100 employees or more 6 663............................. 11.0 .2 .7 4.1 17.3 6.8 62.650
Nonminority male ~owned businesses 10 114 456........... 4.4 2.5 .8 5.0 6.8 15.2 67.951
With no paid employees 8 019 462............................... 3.3 2.6 .6 3.8 5.5 14.3 71.852With paid employees 2 094 993.................................. 7.5 2.1 1.2 8.3 10.6 17.7 56.253
No employees5 271 380..................................... 7.8 1.6 1.5 8.8 10.1 9.3 64.1541 to 4 employees 1 155 800................................... 5.3 3.1 1.7 10.2 7.8 21.1 55.0555 to 9 employees 334 483................................... 10.5 1.3 .9 5.9 13.0 20.9 51.25610 to 19 employees 173 140................................. 10.9 .9 .4 6.7 12.2 14.2 57.55720 to 49 employees 101 938................................. 9.1 1.8 .3 6.7 14.1 11.7 59.75850 to 99 employees 33 406................................. 8.7 .1 – 5.8 19.5 8.0 60.359100 employees or more 24 846............................. 5.6 – .6 3.8 19.6 10.5 60.660
1Data represent percentage of owners reporting in the designated categories. Sum of percents in categories will not equal 100 since multiple responses were allowed.2Includes owners who did not require capital to start/acquire their businesses or who did not borrow capital.3For explanation of relative standard errors and standard errors, see Reliability of Estimates in the introductory text.4Relative standard errors are not applicable for lines 1 through 10 since these data are the result of censuses, not surveys.5Firms reported annual payroll, but did not report any employees on their payroll during specified period in 1992.
138 CHARACTERISTICS OF BUSINESS OWNERS 1992 ECONOMIC CENSUS
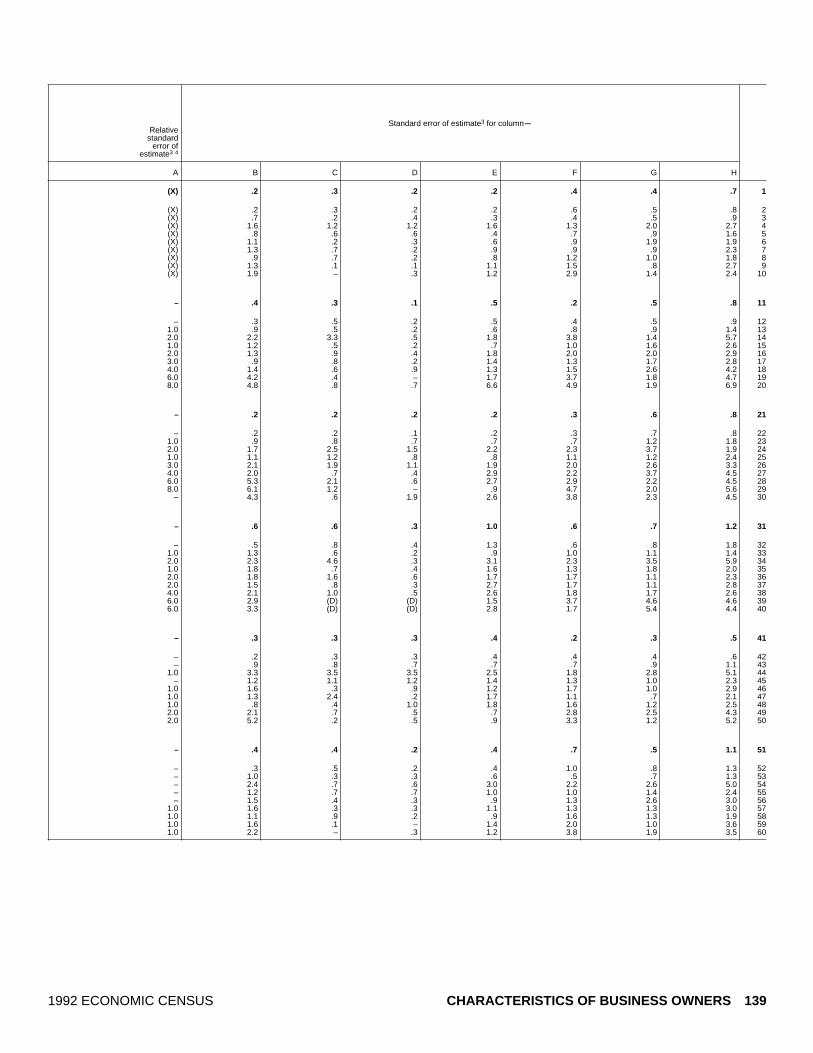
Standard error of estimate3 for columnmRelative
standarderror of
estimate3 4
A B C D E F G H
(X) .2 .3 .2 .2 .4 .4 .7 1
(X) .2 .3 .2 .2 .6 .5 .8 2(X) .7 .2 .4 .3 .4 .5 .9 3(X) 1.6 1.2 1.2 1.6 1.3 2.0 2.7 4(X) .8 .6 .6 .4 .7 .9 1.6 5(X) 1.1 .2 .3 .6 .9 1.9 1.9 6(X) 1.3 .7 .2 .9 .9 .9 2.3 7(X) .9 .7 .2 .8 1.2 1.0 1.8 8(X) 1.3 .1 .1 1.1 1.5 .8 2.7 9(X) 1.9 – .3 1.2 2.9 1.4 2.4 10
– .4 .3 .1 .5 .2 .5 .8 11
– .3 .5 .2 .5 .4 .5 .9 121.0 .9 .5 .2 .6 .8 .9 1.4 132.0 2.2 3.3 .5 1.8 3.8 1.4 5.7 141.0 1.2 .5 .2 .7 1.0 1.6 2.6 152.0 1.3 .9 .4 1.8 2.0 2.0 2.9 163.0 .9 .8 .2 1.4 1.3 1.7 2.8 174.0 1.4 .6 .9 1.3 1.5 2.6 4.2 186.0 4.2 .4 – 1.7 3.7 1.8 4.7 198.0 4.8 .8 .7 6.6 4.9 1.9 6.9 20
– .2 .2 .2 .2 .3 .6 .8 21
– .2 .2 .1 .2 .3 .7 .8 221.0 .9 .8 .7 .7 .7 1.2 1.8 232.0 1.7 2.5 1.5 2.2 2.3 3.7 1.9 241.0 1.1 1.2 .8 .8 1.1 1.2 2.4 253.0 2.1 1.9 1.1 1.9 2.0 2.6 3.3 264.0 2.0 .7 .4 2.9 2.2 3.7 4.5 276.0 5.3 2.1 .6 2.7 2.9 2.2 4.5 288.0 6.1 1.2 – .9 4.7 2.0 5.6 29
– 4.3 .6 1.9 2.6 3.8 2.3 4.5 30
– .6 .6 .3 1.0 .6 .7 1.2 31
– .5 .8 .4 1.3 .6 .8 1.8 321.0 1.3 .6 .2 .9 1.0 1.1 1.4 332.0 2.3 4.6 .3 3.1 2.3 3.5 5.9 341.0 1.8 .7 .4 1.6 1.3 1.8 2.0 352.0 1.8 1.6 .6 1.7 1.7 1.1 2.3 362.0 1.5 .8 .3 2.7 1.7 1.1 2.8 374.0 2.1 1.0 .5 2.6 1.8 1.7 2.6 386.0 2.9 (D) (D) 1.5 3.7 4.6 4.6 396.0 3.3 (D) (D) 2.8 1.7 5.4 4.4 40
– .3 .3 .3 .4 .2 .3 .5 41
– .2 .3 .3 .4 .4 .4 .6 42– .9 .8 .7 .7 .7 .9 1.1 43
1.0 3.3 3.5 3.5 2.5 1.8 2.8 5.1 44– 1.2 1.1 1.2 1.4 1.3 1.0 2.3 45
1.0 1.6 .3 .9 1.2 1.7 1.0 2.9 461.0 1.3 2.4 .2 1.7 1.1 .7 2.1 471.0 .8 .4 1.0 1.8 1.6 1.2 2.5 482.0 2.1 .7 .5 .7 2.8 2.5 4.3 492.0 5.2 .2 .5 .9 3.3 1.2 5.2 50
– .4 .4 .2 .4 .7 .5 1.1 51
– .3 .5 .2 .4 1.0 .8 1.3 52– 1.0 .3 .3 .6 .5 .7 1.3 53– 2.4 .7 .6 3.0 2.2 2.6 5.0 54– 1.2 .7 .7 1.0 1.0 1.4 2.4 55– 1.5 .4 .3 .9 1.3 2.6 3.0 56
1.0 1.6 .3 .3 1.1 1.3 1.3 3.0 571.0 1.1 .9 .2 .9 1.6 1.3 1.9 581.0 1.6 .1 – 1.4 2.0 1.0 3.6 591.0 2.2 – .3 1.2 3.8 1.9 3.5 60
1992 ECONOMIC CENSUS CHARACTERISTICS OF BUSINESS OWNERS 139

Table 16d. Sources of Borrowed Capital for Owner by Legal Form of Organization of Firm:[All data are shown as percents, except firms. For meaning of abbreviations and symbols, see introductory text. For explanation of terms, see appendix A]
Type of firm and legal form of organization
Sources of borrowed capital obtained1
Firms(number)
Personalloan using
homemortgage/equity line
of creditPersonal credit
cardPersonal loan
from spousePersonal loan
from familyOther personal
loanNot
reportedNot
applicable2
A B C D E F G H
All businesses 17 253 143................................. 4.3 2.6 1.0 5.2 6.1 14.4 69.11
Individual proprietorships 14 599 295.............................. 2.7 2.8 1.1 4.9 3.5 17.0 70.52Partnerships 1 089 578......................................... 6.1 1.4 .5 4.3 13.2 8.2 67.93Subchapter S corporations 1 564 270............................. 10.7 2.4 .8 7.2 13.0 7.0 63.24
Hispanic ~owned businesses 771 708.................... 4.4 3.2 .9 6.2 5.7 13.1 70.25
Individual proprietorships 689 015.............................. 3.1 3.4 .9 5.5 3.1 15.2 72.26Partnerships 32 650......................................... 7.6 2.1 .2 5.7 12.0 7.2 67.87Subchapter S corporations 50 042............................. 9.2 2.9 1.2 10.0 14.5 6.2 61.28
Black ~owned businesses 620 912....................... 2.9 3.1 1.2 3.8 4.6 17.5 70.19
Individual proprietorships 584 256.............................. 2.2 2.9 1.2 3.5 3.8 18.3 70.910Partnerships 14 727......................................... 6.5 3.1 .5 3.8 12.2 9.6 68.211Subchapter S corporations 21 928............................. 13.8 5.6 1.3 8.9 15.5 5.5 56.612
Other minority ~owned businesses 606 426.............. 6.8 4.1 1.4 12.0 9.4 12.8 59.613
Individual proprietorships 502 022.............................. 3.7 5.7 1.7 10.7 6.3 15.4 63.514Partnerships 49 489......................................... 8.6 1.0 .3 15.8 13.2 10.8 53.215Subchapter S corporations 54 915............................. 13.7 2.7 1.6 12.6 14.8 7.4 54.516
Women ~owned businesses 5 888 883..................... 4.1 2.6 1.3 4.8 4.9 13.0 72.217
Individual proprietorships 5 078 077.............................. 2.1 2.7 1.3 4.0 2.5 14.3 75.418Partnerships 243 651......................................... 4.7 .5 1.9 4.0 10.4 12.6 68.219Subchapter S corporations 567 155............................. 12.9 3.1 1.3 9.3 13.2 7.2 59.520
Nonminority male ~owned businesses 10 114 456........... 4.4 2.5 .8 5.0 6.8 15.2 67.921
Individual proprietorships 8 414 238.............................. 2.9 2.8 1.0 5.2 3.9 18.7 68.022Partnerships 777 379......................................... 6.2 1.6 .1 3.5 14.1 6.9 68.923Subchapter S corporations 922 838............................. 9.2 2.0 .5 5.5 12.9 6.9 66.024
1Data represent percentage of owners reporting in the designated categories. Sum of percents in categories will not equal 100 since multiple responses were allowed.2Includes owners who did not require capital to start/acquire their businesses or who did not borrow capital.3For explanation of relative standard errors and standard errors, see Reliability of Estimates in the introductory text.4Relative standard errors are not applicable for lines 1 through 4 since these data are the result of censuses, not surveys.
140 CHARACTERISTICS OF BUSINESS OWNERS 1992 ECONOMIC CENSUS
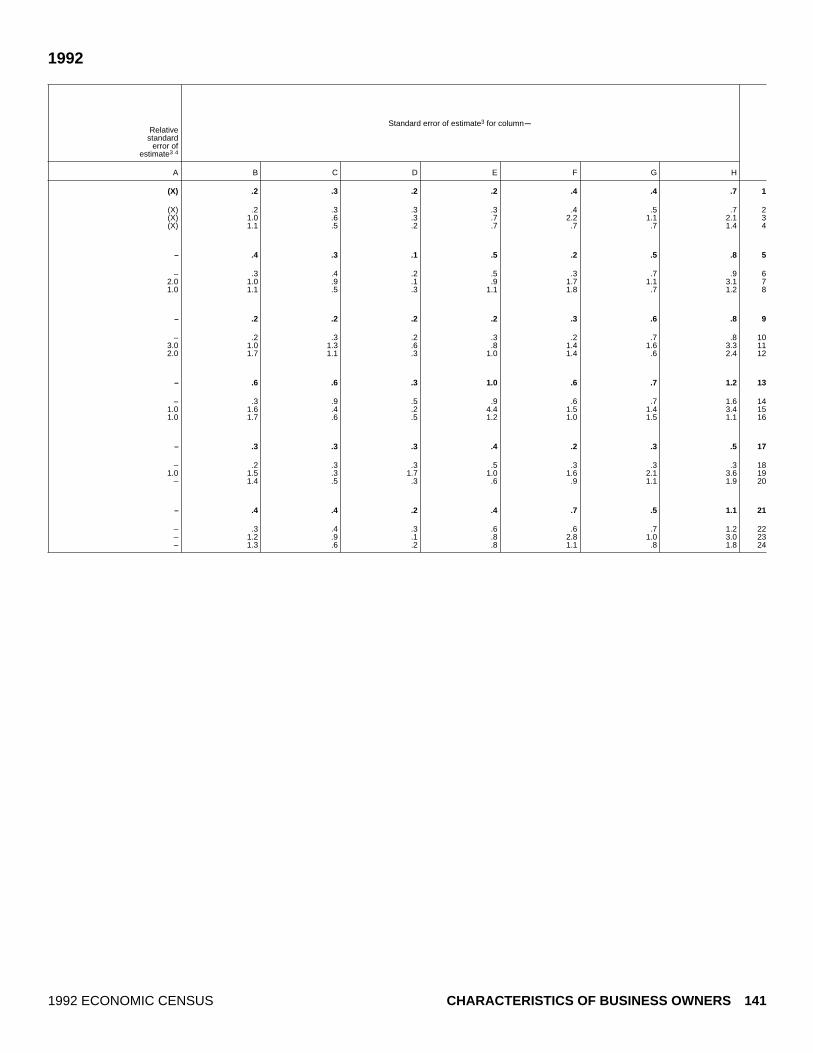
1992
Standard error of estimate3 for columnmRelative
standarderror of
estimate3 4
A B C D E F G H
(X) .2 .3 .2 .2 .4 .4 .7 1
(X) .2 .3 .3 .3 .4 .5 .7 2(X) 1.0 .6 .3 .7 2.2 1.1 2.1 3(X) 1.1 .5 .2 .7 .7 .7 1.4 4
– .4 .3 .1 .5 .2 .5 .8 5
– .3 .4 .2 .5 .3 .7 .9 62.0 1.0 .9 .1 .9 1.7 1.1 3.1 71.0 1.1 .5 .3 1.1 1.8 .7 1.2 8
– .2 .2 .2 .2 .3 .6 .8 9
– .2 .3 .2 .3 .2 .7 .8 103.0 1.0 1.3 .6 .8 1.4 1.6 3.3 112.0 1.7 1.1 .3 1.0 1.4 .6 2.4 12
– .6 .6 .3 1.0 .6 .7 1.2 13
– .3 .9 .5 .9 .6 .7 1.6 141.0 1.6 .4 .2 4.4 1.5 1.4 3.4 151.0 1.7 .6 .5 1.2 1.0 1.5 1.1 16
– .3 .3 .3 .4 .2 .3 .5 17
– .2 .3 .3 .5 .3 .3 .3 181.0 1.5 .3 1.7 1.0 1.6 2.1 3.6 19
– 1.4 .5 .3 .6 .9 1.1 1.9 20
– .4 .4 .2 .4 .7 .5 1.1 21
– .3 .4 .3 .6 .6 .7 1.2 22– 1.2 .9 .1 .8 2.8 1.0 3.0 23– 1.3 .6 .2 .8 1.1 .8 1.8 24
1992 ECONOMIC CENSUS CHARACTERISTICS OF BUSINESS OWNERS 141
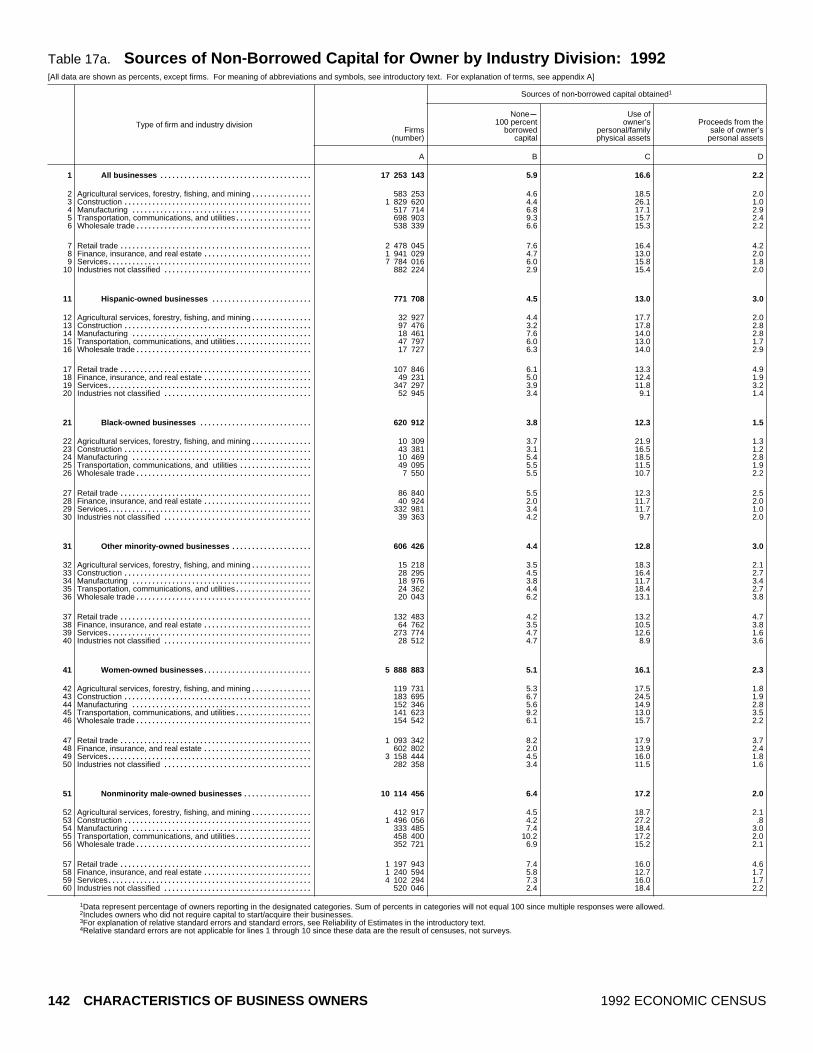
Table 17a. Sources of Non ~Borrowed Capital for Owner by Industry Division: 1992[All data are shown as percents, except firms. For meaning of abbreviations and symbols, see introductory text. For explanation of terms, see appendix A]
Type of firm and industry division
Sources of non~borrowed capital obtained1
Firms(number)
Nonem100 percent
borrowedcapital
Use ofowner’s
personal/familyphysical assets
Proceeds from thesale of owner’s
personal assets
A B C D
All businesses 17 253 143...................................... 5.9 16.6 2.21
Agricultural services, forestry, fishing, and mining 583 253............... 4.6 18.5 2.02Construction 1 829 620............................................... 4.4 26.1 1.03Manufacturing 517 714............................................. 6.8 17.1 2.94Transportation, communications, and utilities 698 903................... 9.3 15.7 2.45Wholesale trade 538 339............................................ 6.6 15.3 2.26
Retail trade 2 478 045................................................ 7.6 16.4 4.27Finance, insurance, and real estate 1 941 029........................... 4.7 13.0 2.08Services 7 784 016................................................... 6.0 15.8 1.89Industries not classified 882 224..................................... 2.9 15.4 2.010
Hispanic ~owned businesses 771 708......................... 4.5 13.0 3.011
Agricultural services, forestry, fishing, and mining 32 927............... 4.4 17.7 2.012Construction 97 476............................................... 3.2 17.8 2.813Manufacturing 18 461............................................. 7.6 14.0 2.814Transportation, communications, and utilities 47 797................... 6.0 13.0 1.715Wholesale trade 17 727............................................ 6.3 14.0 2.916
Retail trade 107 846................................................ 6.1 13.3 4.917Finance, insurance, and real estate 49 231........................... 5.0 12.4 1.918Services 347 297................................................... 3.9 11.8 3.219Industries not classified 52 945..................................... 3.4 9.1 1.420
Black ~owned businesses 620 912............................ 3.8 12.3 1.521
Agricultural services, forestry, fishing, and mining 10 309............... 3.7 21.9 1.322Construction 43 381............................................... 3.1 16.5 1.223Manufacturing 10 469............................................. 5.4 18.5 2.824Transportation, communications, and utilities 49 095.................. 5.5 11.5 1.925Wholesale trade 7 550............................................ 5.5 10.7 2.226
Retail trade 86 840................................................ 5.5 12.3 2.527Finance, insurance, and real estate 40 924........................... 2.0 11.7 2.028Services 332 981................................................... 3.4 11.7 1.029Industries not classified 39 363..................................... 4.2 9.7 2.030
Other minority ~owned businesses 606 426.................... 4.4 12.8 3.031
Agricultural services, forestry, fishing, and mining 15 218............... 3.5 18.3 2.132Construction 28 295............................................... 4.5 16.4 2.733Manufacturing 18 976............................................. 3.8 11.7 3.434Transportation, communications, and utilities 24 362................... 4.4 18.4 2.735Wholesale trade 20 043............................................ 6.2 13.1 3.836
Retail trade 132 483................................................ 4.2 13.2 4.737Finance, insurance, and real estate 64 762........................... 3.5 10.5 3.838Services 273 774................................................... 4.7 12.6 1.639Industries not classified 28 512..................................... 4.7 8.9 3.640
Women ~owned businesses 5 888 883........................... 5.1 16.1 2.341
Agricultural services, forestry, fishing, and mining 119 731............... 5.3 17.5 1.842Construction 183 695............................................... 6.7 24.5 1.943Manufacturing 152 346............................................. 5.6 14.9 2.844Transportation, communications, and utilities 141 623................... 9.2 13.0 3.545Wholesale trade 154 542............................................ 6.1 15.7 2.246
Retail trade 1 093 342................................................ 8.2 17.9 3.747Finance, insurance, and real estate 602 802........................... 2.0 13.9 2.448Services 3 158 444................................................... 4.5 16.0 1.849Industries not classified 282 358..................................... 3.4 11.5 1.650
Nonminority male ~owned businesses 10 114 456................. 6.4 17.2 2.051
Agricultural services, forestry, fishing, and mining 412 917............... 4.5 18.7 2.152Construction 1 496 056............................................... 4.2 27.2 .853Manufacturing 333 485............................................. 7.4 18.4 3.054Transportation, communications, and utilities 458 400................... 10.2 17.2 2.055Wholesale trade 352 721............................................ 6.9 15.2 2.156
Retail trade 1 197 943................................................ 7.4 16.0 4.657Finance, insurance, and real estate 1 240 594........................... 5.8 12.7 1.758Services 4 102 294................................................... 7.3 16.0 1.759Industries not classified 520 046..................................... 2.4 18.4 2.260
1Data represent percentage of owners reporting in the designated categories. Sum of percents in categories will not equal 100 since multiple responses were allowed.2Includes owners who did not require capital to start/acquire their businesses.3For explanation of relative standard errors and standard errors, see Reliability of Estimates in the introductory text.4Relative standard errors are not applicable for lines 1 through 10 since these data are the result of censuses, not surveys.
142 CHARACTERISTICS OF BUSINESS OWNERS 1992 ECONOMIC CENSUS

Sources of non~borrowed capital obtained1mCon.
Standard error of estimate3 for columnm
Owner’s personal/family savings
Otherpersonal sources
Notreported Not applicable2
Relativestandard
error ofestimate3 4
E F G H A B C D E F G H
36.5 3.5 10.4 25.0 (X) .4 .9 .2 .6 .3 .2 .9 1
39.0 3.4 12.2 20.4 (X) .8 1.5 .7 1.7 1.0 1.7 2.2 230.8 2.6 8.7 26.4 (X) .6 2.0 .2 1.9 .8 1.6 2.8 339.8 3.2 9.2 21.0 (X) .8 1.4 .7 1.4 .6 .6 1.8 431.3 4.0 12.0 25.3 (X) 1.0 2.1 .6 2.2 .8 1.4 2.3 539.4 3.6 10.5 22.4 (X) 1.2 1.7 .2 1.9 .8 1.2 1.5 6
40.4 4.2 12.5 14.7 (X) 1.1 .9 .4 1.2 .6 .7 .9 740.5 4.0 12.1 23.7 (X) 1.2 2.1 .4 2.6 .7 1.1 2.1 835.5 3.0 8.8 29.0 (X) .4 .9 .4 1.1 .5 .6 1.4 929.2 6.3 13.2 31.1 (X) 1.0 2.0 .8 2.8 1.5 1.7 2.6 10
35.0 5.2 11.7 27.5 – .3 .5 .5 .9 .6 .7 .7 11
31.3 3.7 15.2 25.8 1.0 1.0 1.6 1.0 2.7 1.2 3.1 3.1 1229.2 6.7 9.3 31.1 1.0 .6 2.3 .8 2.8 1.8 1.2 2.4 1340.9 2.3 13.6 18.8 1.0 1.0 1.2 .7 2.7 .5 1.5 1.8 1433.9 7.9 15.0 22.5 1.0 1.2 2.3 .5 3.8 1.4 1.7 2.6 1543.2 3.0 12.6 18.0 2.0 1.1 1.8 .7 2.9 .6 1.8 1.9 16
42.8 3.8 11.9 17.2 1.0 .8 1.3 .5 2.4 1.0 1.0 1.5 1745.3 5.0 10.3 20.1 1.0 1.3 1.2 .7 2.5 .9 1.2 1.9 1832.6 5.3 11.3 31.9 – .6 .8 1.2 1.8 1.1 1.1 1.6 1926.7 6.1 14.6 38.7 1.0 1.2 1.2 .6 3.6 1.3 1.5 2.2 20
30.5 6.7 13.0 32.2 – .4 .4 .2 .8 .6 .6 .9 21
25.6 6.0 15.4 26.0 1.0 .8 2.4 .4 1.9 1.2 1.7 1.7 2223.5 6.4 10.3 39.0 – .9 2.0 .4 1.9 1.5 1.4 2.6 2328.2 5.8 15.2 24.1 1.0 .7 1.8 .6 2.9 .9 1.6 1.3 2430.6 7.8 17.3 25.4 – 1.1 2.1 .6 2.6 1.3 2.3 2.0 2540.0 4.1 13.4 24.0 2.0 1.1 1.6 .5 2.6 1.0 1.6 2.2 26
39.4 7.8 12.0 20.4 – .9 1.2 .7 2.2 1.7 1.4 1.4 2739.9 6.7 11.4 26.3 1.0 .6 1.7 .5 1.9 1.0 1.4 1.8 2828.8 6.3 12.6 36.3 – .6 .6 .2 1.2 .6 1.1 1.1 2924.2 7.9 16.0 35.9 – 1.0 1.8 .5 1.9 .9 2.4 2.7 30
47.2 3.4 11.3 18.0 – .2 .9 .2 1.5 .4 .8 .5 31
38.2 2.5 14.3 21.1 1.0 .9 2.5 .9 3.4 1.4 2.3 2.5 3238.6 2.5 10.6 24.8 1.0 1.4 2.1 .9 4.6 .8 1.7 4.0 3348.7 3.3 10.0 19.1 1.0 1.0 1.8 .9 2.7 1.0 1.0 2.2 3435.6 9.4 13.8 15.8 1.0 1.2 3.1 1.5 4.1 2.4 3.8 2.3 3548.3 3.4 10.5 14.7 1.0 1.0 1.2 .7 2.1 1.3 1.6 1.7 36
58.2 2.2 10.9 6.6 1.0 .8 1.9 .6 2.8 .5 1.3 1.0 3743.1 2.4 13.8 22.9 1.0 1.0 2.4 .8 4.6 1.2 1.0 3.6 3846.0 3.7 10.6 20.8 – .6 1.2 .4 1.7 .8 1.1 1.4 3937.7 7.8 9.4 27.8 1.0 1.8 1.9 1.2 3.6 2.6 2.6 3.2 40
33.2 3.6 9.9 29.9 – .6 1.0 .3 1.2 .3 .4 1.1 41
36.5 1.0 10.6 27.4 – 1.1 2.2 .5 3.2 .5 2.3 2.2 4227.7 3.5 10.2 25.5 – 1.2 2.0 .5 1.6 1.1 1.1 2.4 4338.0 4.5 8.2 26.1 – 1.0 1.2 .9 2.3 1.1 1.1 2.5 4429.8 2.8 9.8 31.7 – 2.1 1.6 1.3 2.0 .7 1.5 2.8 4537.5 3.5 9.4 25.7 – 1.3 2.5 .5 2.5 .7 1.3 2.6 46
38.3 3.8 11.1 17.0 – 1.4 1.6 .8 1.9 .5 1.0 .8 4736.1 5.6 12.5 27.6 – .6 1.5 .6 2.4 1.2 1.2 1.9 4830.7 2.9 8.4 35.7 – .7 1.6 .5 1.7 .5 .8 2.0 4928.7 5.7 14.0 35.0 – 1.2 1.9 .6 2.5 1.4 2.5 2.8 50
38.0 3.3 10.4 22.6 – .5 1.0 .3 .8 .4 .5 1.1 51
40.4 4.0 12.4 17.9 – .9 2.3 .9 2.3 1.3 2.8 3.2 5231.3 2.2 8.4 25.9 – .6 2.5 .2 2.3 1.0 2.1 3.6 5340.3 2.6 9.4 18.9 – 1.0 2.0 .8 1.5 .7 1.1 1.8 5431.4 3.4 11.9 24.0 – 1.2 2.9 .6 3.1 1.2 1.8 3.2 5539.9 3.7 10.9 21.3 – 1.6 1.7 .3 2.4 1.2 1.6 2.3 56
40.3 4.7 13.8 13.3 – 1.1 1.4 .6 2.2 .9 1.6 1.9 5742.2 3.4 12.0 22.2 – 1.8 2.7 .5 3.1 .9 1.6 2.7 5838.8 2.8 8.8 24.5 – .6 1.3 .6 1.7 .7 .9 1.4 5929.1 6.5 12.5 28.8 – 1.1 2.7 1.3 4.4 2.1 2.7 4.0 60
1992 ECONOMIC CENSUS CHARACTERISTICS OF BUSINESS OWNERS 143
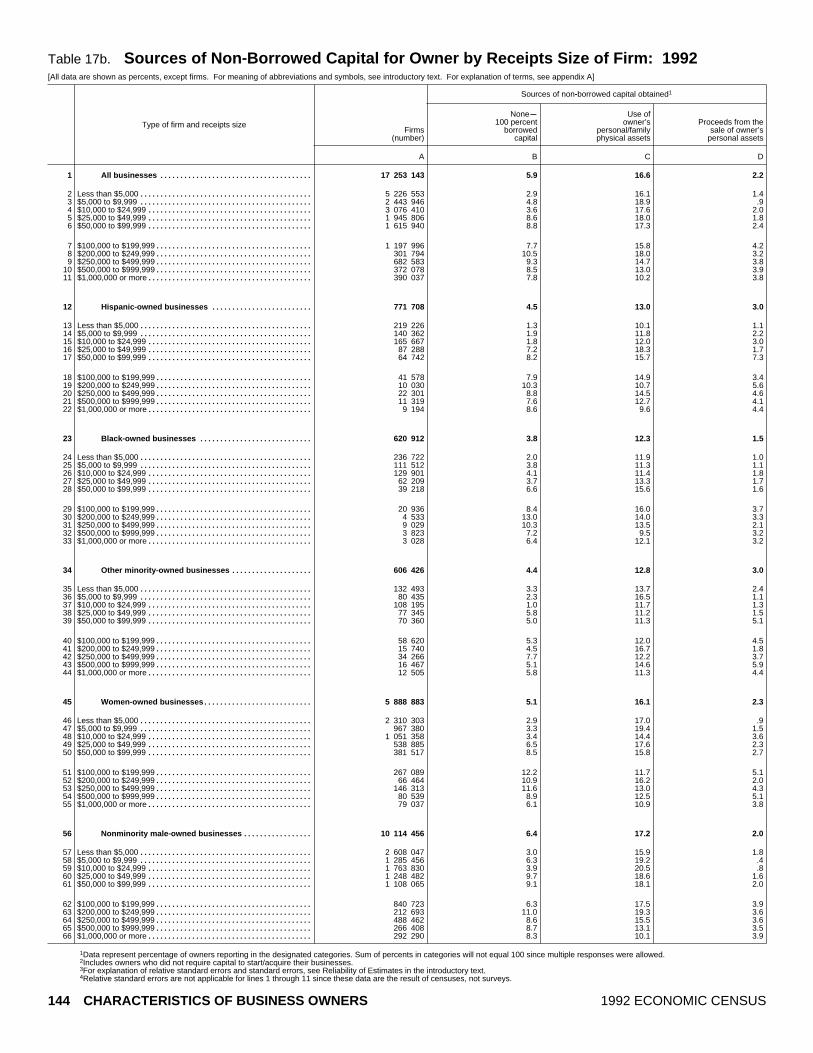
Table 17b. Sources of Non ~Borrowed Capital for Owner by Receipts Size of Firm: 1992[All data are shown as percents, except firms. For meaning of abbreviations and symbols, see introductory text. For explanation of terms, see appendix A]
Type of firm and receipts size
Sources of non~borrowed capital obtained1
Firms(number)
Nonem100 percent
borrowedcapital
Use ofowner’s
personal/familyphysical assets
Proceeds from thesale of owner’s
personal assets
A B C D
All businesses 17 253 143...................................... 5.9 16.6 2.21
Less than $5,000 5 226 553........................................... 2.9 16.1 1.42$5,000 to $9,999 2 443 946........................................... 4.8 18.9 .93$10,000 to $24,999 3 076 410......................................... 3.6 17.6 2.04$25,000 to $49,999 1 945 806......................................... 8.6 18.0 1.85$50,000 to $99,999 1 615 940......................................... 8.8 17.3 2.46
$100,000 to $199,999 1 197 996....................................... 7.7 15.8 4.27$200,000 to $249,999 301 794....................................... 10.5 18.0 3.28$250,000 to $499,999 682 583....................................... 9.3 14.7 3.89$500,000 to $999,999 372 078....................................... 8.5 13.0 3.910$1,000,000 or more 390 037......................................... 7.8 10.2 3.811
Hispanic ~owned businesses 771 708......................... 4.5 13.0 3.012
Less than $5,000 219 226........................................... 1.3 10.1 1.113$5,000 to $9,999 140 362........................................... 1.9 11.8 2.214$10,000 to $24,999 165 667......................................... 1.8 12.0 3.015$25,000 to $49,999 87 288......................................... 7.2 18.3 1.716$50,000 to $99,999 64 742......................................... 8.2 15.7 7.317
$100,000 to $199,999 41 578....................................... 7.9 14.9 3.418$200,000 to $249,999 10 030....................................... 10.3 10.7 5.619$250,000 to $499,999 22 301....................................... 8.8 14.5 4.620$500,000 to $999,999 11 319....................................... 7.6 12.7 4.121$1,000,000 or more 9 194......................................... 8.6 9.6 4.422
Black ~owned businesses 620 912............................ 3.8 12.3 1.523
Less than $5,000 236 722........................................... 2.0 11.9 1.024$5,000 to $9,999 111 512........................................... 3.8 11.3 1.125$10,000 to $24,999 129 901......................................... 4.1 11.4 1.826$25,000 to $49,999 62 209......................................... 3.7 13.3 1.727$50,000 to $99,999 39 218......................................... 6.6 15.6 1.628
$100,000 to $199,999 20 936....................................... 8.4 16.0 3.729$200,000 to $249,999 4 533....................................... 13.0 14.0 3.330$250,000 to $499,999 9 029....................................... 10.3 13.5 2.131$500,000 to $999,999 3 823....................................... 7.2 9.5 3.232$1,000,000 or more 3 028......................................... 6.4 12.1 3.233
Other minority ~owned businesses 606 426.................... 4.4 12.8 3.034
Less than $5,000 132 493........................................... 3.3 13.7 2.435$5,000 to $9,999 80 435........................................... 2.3 16.5 1.136$10,000 to $24,999 108 195......................................... 1.0 11.7 1.337$25,000 to $49,999 77 345......................................... 5.8 11.2 1.538$50,000 to $99,999 70 360......................................... 5.0 11.3 5.139
$100,000 to $199,999 58 620....................................... 5.3 12.0 4.540$200,000 to $249,999 15 740....................................... 4.5 16.7 1.841$250,000 to $499,999 34 266....................................... 7.7 12.2 3.742$500,000 to $999,999 16 467....................................... 5.1 14.6 5.943$1,000,000 or more 12 505......................................... 5.8 11.3 4.444
Women ~owned businesses 5 888 883........................... 5.1 16.1 2.345
Less than $5,000 2 310 303........................................... 2.9 17.0 .946$5,000 to $9,999 967 380........................................... 3.3 19.4 1.547$10,000 to $24,999 1 051 358......................................... 3.4 14.4 3.648$25,000 to $49,999 538 885......................................... 6.5 17.6 2.349$50,000 to $99,999 381 517......................................... 8.5 15.8 2.750
$100,000 to $199,999 267 089....................................... 12.2 11.7 5.151$200,000 to $249,999 66 464....................................... 10.9 16.2 2.052$250,000 to $499,999 146 313....................................... 11.6 13.0 4.353$500,000 to $999,999 80 539....................................... 8.9 12.5 5.154$1,000,000 or more 79 037......................................... 6.1 10.9 3.855
Nonminority male ~owned businesses 10 114 456................. 6.4 17.2 2.056
Less than $5,000 2 608 047........................................... 3.0 15.9 1.857$5,000 to $9,999 1 285 456........................................... 6.3 19.2 .458$10,000 to $24,999 1 763 830......................................... 3.9 20.5 .859$25,000 to $49,999 1 248 482......................................... 9.7 18.6 1.660$50,000 to $99,999 1 108 065......................................... 9.1 18.1 2.061
$100,000 to $199,999 840 723....................................... 6.3 17.5 3.962$200,000 to $249,999 212 693....................................... 11.0 19.3 3.663$250,000 to $499,999 488 462....................................... 8.6 15.5 3.664$500,000 to $999,999 266 408....................................... 8.7 13.1 3.565$1,000,000 or more 292 290......................................... 8.3 10.1 3.966
1Data represent percentage of owners reporting in the designated categories. Sum of percents in categories will not equal 100 since multiple responses were allowed.2Includes owners who did not require capital to start/acquire their businesses.3For explanation of relative standard errors and standard errors, see Reliability of Estimates in the introductory text.4Relative standard errors are not applicable for lines 1 through 11 since these data are the result of censuses, not surveys.
144 CHARACTERISTICS OF BUSINESS OWNERS 1992 ECONOMIC CENSUS

Sources of non~borrowed capital obtained1mCon.
Standard error of estimate3 for columnm
Owner’s personal/family savings
Otherpersonal sources
Notreported Not applicable2
Relativestandard
error ofestimate3 4
E F G H A B C D E F G H
36.5 3.5 10.4 25.0 (X) .4 .9 .2 .6 .3 .2 .9 1
31.0 4.2 9.7 34.8 (X) .5 1.7 .3 1.8 .8 .6 1.7 229.4 4.0 9.1 33.0 (X) 1.0 1.8 .3 2.6 1.1 1.0 2.8 336.5 4.7 8.8 26.8 (X) .7 2.1 .5 2.3 .8 .9 2.3 439.6 2.8 9.7 19.5 (X) 1.6 1.7 .7 3.5 .4 2.1 2.6 542.3 3.1 10.0 16.1 (X) 1.5 1.4 .3 2.1 .3 .8 1.1 6
44.4 2.6 10.2 15.2 (X) .6 1.4 .8 2.0 .4 .6 1.2 738.6 1.7 15.2 12.8 (X) 1.8 2.1 1.1 2.9 .8 4.6 2.6 841.8 2.4 14.4 13.6 (X) .7 .9 .5 .9 .4 1.0 1.3 941.3 2.1 15.9 15.2 (X) .5 .7 .3 1.1 .5 1.3 .8 1040.8 1.9 15.1 20.4 (X) .6 .3 .3 1.0 .2 .4 .7 11
35.0 5.2 11.7 27.5 – .3 .5 .5 .9 .6 .7 .7 12
29.3 7.1 13.1 38.0 1.0 .4 1.5 .6 1.4 1.6 2.0 2.5 1324.9 6.1 13.6 39.5 1.0 1.0 1.7 1.2 2.7 1.0 2.0 3.3 1434.3 6.6 9.5 32.8 1.0 .3 1.3 .9 3.0 1.8 .7 2.4 1536.6 4.4 8.6 23.1 1.0 1.8 2.8 .5 3.1 1.9 1.8 3.5 1638.4 4.4 10.1 15.8 1.0 1.5 1.1 2.4 1.9 .8 1.5 2.1 17
47.3 2.7 12.1 11.7 1.0 .9 .9 .8 2.0 .4 1.5 1.4 1845.0 2.4 11.8 14.2 3.0 1.4 2.2 1.4 2.6 .9 2.1 2.3 1944.1 2.3 13.9 11.8 2.0 .7 1.2 1.0 2.3 .5 1.1 1.2 2042.0 1.4 18.9 13.3 3.0 1.7 1.9 .7 2.6 .3 2.2 1.8 2145.6 1.4 15.9 14.5 2.0 .6 .9 1.0 1.1 .2 .9 1.2 22
30.5 6.7 13.0 32.2 – .4 .4 .2 .8 .6 .6 .9 23
25.1 6.5 14.8 38.7 – .5 .8 .2 1.5 .6 .8 1.5 2427.8 8.4 11.9 35.7 – .9 .6 .4 2.3 .9 1.0 1.7 2531.6 7.1 11.8 32.2 – .7 1.3 .4 2.0 .9 1.1 1.6 2637.9 8.4 9.5 25.5 – .3 1.1 .7 2.2 2.3 2.2 1.8 2738.5 4.3 13.3 20.1 1.0 .9 1.4 .4 3.3 1.2 1.2 2.3 28
40.3 3.1 14.4 14.1 1.0 1.0 1.3 .6 1.0 .8 1.5 .8 2940.9 3.2 13.7 11.9 3.0 2.1 2.5 1.7 5.5 1.2 3.1 1.4 3042.9 5.0 12.3 13.9 3.0 1.2 .8 .3 2.7 .8 1.8 1.4 3146.9 2.1 15.8 15.4 4.0 1.7 2.1 .9 3.0 .5 2.6 2.8 3239.4 1.7 20.6 16.5 4.0 1.5 2.5 .5 3.7 .6 3.3 1.4 33
47.2 3.4 11.3 18.0 – .2 .9 .2 1.5 .4 .8 .5 34
35.5 2.6 8.2 34.2 1.0 .9 2.1 .7 3.8 .9 1.4 2.9 3536.3 5.6 7.3 30.8 1.0 1.0 4.1 .8 4.0 1.5 2.6 4.0 3647.4 5.9 12.6 20.1 1.0 .5 1.3 .8 3.0 1.9 3.3 2.5 3754.0 4.4 7.1 16.1 1.0 1.7 2.2 1.5 4.5 1.4 1.6 3.2 3849.0 3.3 11.8 14.6 1.0 1.5 1.6 1.8 2.5 .7 2.0 1.9 39
55.2 2.1 13.2 7.7 1.0 .7 1.3 1.1 2.7 .3 1.8 1.2 4048.8 2.5 15.9 9.8 2.0 1.3 2.2 .8 2.4 1.3 2.9 1.8 4153.4 1.9 14.7 6.6 1.0 .8 1.1 .7 2.2 .4 1.4 .9 4250.3 1.0 16.1 7.1 2.0 .7 1.7 1.0 2.2 .4 1.9 .9 4348.1 1.7 18.2 10.5 2.0 .8 .4 .7 1.2 .3 1.5 1.2 44
33.2 3.6 9.9 29.9 – .6 1.0 .3 1.2 .3 .4 1.1 45
27.3 4.7 9.6 37.6 – .7 1.9 .3 1.6 .9 1.0 1.3 4629.9 3.2 6.2 36.6 – 1.0 1.7 .5 3.6 .7 .8 3.0 4735.1 3.4 9.1 31.1 – .9 1.3 1.6 2.6 .5 1.1 2.5 4832.6 3.4 13.0 24.7 – 1.5 1.9 .9 4.5 1.5 2.9 3.0 4940.2 3.2 11.5 18.1 – 1.0 2.0 .8 1.7 .8 1.4 1.6 50
45.5 2.8 9.5 13.2 – 2.1 1.5 .9 2.7 .5 1.1 1.2 5147.5 2.4 9.9 11.1 1.0 2.7 3.9 .8 4.9 1.1 2.3 2.2 5242.1 2.2 12.6 14.3 1.0 1.2 1.5 .8 1.7 .5 .9 1.0 5342.1 1.4 13.8 16.1 1.0 1.2 1.7 1.1 1.8 .3 .8 1.2 5436.7 2.3 15.2 25.0 1.0 .6 .6 .4 .9 .5 1.3 1.0 55
38.0 3.3 10.4 22.6 – .5 1.0 .3 .8 .4 .5 1.1 56
34.0 3.6 9.2 32.4 – .9 2.1 .6 2.7 .9 1.0 2.6 5729.0 4.3 10.8 30.1 – 1.7 2.5 .2 4.4 2.0 1.9 4.3 5837.4 5.5 8.2 23.7 – 1.1 3.5 .5 3.2 1.4 1.6 2.9 5942.3 2.3 8.4 17.1 – 2.3 2.3 .8 4.3 .6 2.7 3.8 6043.2 2.9 9.3 15.3 – 2.5 2.1 .6 3.5 .7 .8 1.9 61
43.1 2.5 10.2 16.5 – .5 2.0 .9 2.4 .5 .9 1.8 6233.5 1.3 17.6 13.6 – 3.0 3.2 1.9 3.6 .8 6.2 3.7 6340.8 2.5 15.0 14.0 – 1.0 1.2 .5 1.7 .5 1.3 1.9 6440.5 2.4 16.3 15.4 – .8 .9 .5 1.3 .7 1.8 1.4 6541.4 1.8 14.8 19.9 – .7 .4 .4 1.3 .3 .6 .9 66
1992 ECONOMIC CENSUS CHARACTERISTICS OF BUSINESS OWNERS 145

Table 17c. Sources of Non ~Borrowed Capital for Owner by Employment Size of Firm: 1992[All data are shown as percents, except firms. For meaning of abbreviations and symbols, see introductory text. For explanation of terms, see appendix A]
Type of firm and employment size
Sources of non~borrowed capital obtained1
Firms(number)
Nonem100 percent
borrowedcapital
Use ofowner’s
personal/familyphysical assets
Proceeds from thesale of owner’s
personal assets
A B C D
All businesses 17 253 143...................................... 5.9 16.6 2.21
With no paid employees 14 118 184..................................... 4.7 17.0 1.72With paid employees 3 134 959........................................ 9.6 15.2 3.73
No employees5 435 838........................................... 13.4 18.4 3.141 to 4 employees 1 716 076......................................... 8.9 16.7 3.555 to 9 employees 503 808......................................... 10.3 15.1 4.3610 to 19 employees 256 110....................................... 9.5 12.6 3.9720 to 49 employees 144 734....................................... 8.9 10.0 4.5850 to 99 employees 45 331....................................... 6.8 7.7 5.29100 employees or more 33 062................................... 6.1 8.8 1.610
Hispanic ~owned businesses 771 708......................... 4.5 13.0 3.011
With no paid employees 656 343..................................... 3.0 12.6 2.912With paid employees 115 364........................................ 9.2 14.5 3.413
No employees5 19 569........................................... 8.0 19.3 .8141 to 4 employees 64 631......................................... 9.4 14.4 3.5155 to 9 employees 16 937......................................... 11.7 14.8 4.01610 to 19 employees 8 553....................................... 7.2 11.3 3.71720 to 49 employees 4 050....................................... 7.9 9.5 7.11850 to 99 employees 948....................................... 6.4 9.2 6.019100 employees or more 676................................... 7.4 6.8 3.420
Black ~owned businesses 620 912............................ 3.8 12.3 1.521
With no paid employees 556 434..................................... 3.4 11.7 1.322With paid employees 64 478........................................ 7.1 16.4 2.723
No employees5 13 725........................................... 7.6 22.5 1.9241 to 4 employees 37 587......................................... 5.8 15.9 2.8255 to 9 employees 7 853......................................... 12.9 12.8 3.42610 to 19 employees 2 839....................................... 5.3 9.7 2.32720 to 49 employees 1 700....................................... 8.0 15.3 3.32850 to 99 employees 432....................................... 5.5 5.3 9.429100 employees or more 342................................... 4.7 22.1 3.130
Other minority ~owned businesses 606 426.................... 4.4 12.8 3.031
With no paid employees 470 075..................................... 3.3 13.3 2.332With paid employees 136 351........................................ 6.6 11.7 4.233
No employees5 19 989........................................... 7.1 8.3 5.5341 to 4 employees 76 636......................................... 5.6 12.9 3.7355 to 9 employees 22 862......................................... 9.1 10.2 3.53610 to 19 employees 10 051....................................... 6.5 13.2 5.03720 to 49 employees 5 034....................................... 7.1 11.0 6.13850 to 99 employees 1 075....................................... 4.6 10.2 6.539100 employees or more 705................................... 3.1 10.3 5.040
Women ~owned businesses 5 888 883........................... 5.1 16.1 2.341
With no paid employees 5 071 110..................................... 3.5 16.7 1.842With paid employees 817 773........................................ 11.8 13.5 4.243
No employees5 127 905........................................... 14.5 14.4 4.1441 to 4 employees 435 550......................................... 11.2 14.0 4.1455 to 9 employees 134 476......................................... 14.3 13.0 5.54610 to 19 employees 67 487....................................... 11.5 12.9 3.14720 to 49 employees 35 515....................................... 8.1 11.7 3.74850 to 99 employees 10 178....................................... 6.8 11.4 4.149100 employees or more 6 663................................... 4.2 6.2 2.850
Nonminority male ~owned businesses 10 114 456................. 6.4 17.2 2.051
With no paid employees 8 019 462..................................... 5.6 17.6 1.552With paid employees 2 094 993........................................ 8.9 16.2 3.653
No employees5 271 380........................................... 13.7 20.6 2.7541 to 4 employees 1 155 800......................................... 8.1 18.2 3.3555 to 9 employees 334 483......................................... 8.7 16.3 3.85610 to 19 employees 173 140....................................... 9.0 12.6 4.25720 to 49 employees 101 938....................................... 9.1 9.4 4.65850 to 99 employees 33 406....................................... 7.0 6.7 5.459100 employees or more 24 846................................... 6.9 9.3 1.160
1Data represent percentage of owners reporting in the designated categories. Sum of percents in categories will not equal 100 since multiple responses were allowed.2Includes owners who did not require capital to start/acquire their businesses.3For explanation of relative standard errors and standard errors, see Reliability of Estimates in the introductory text.4Relative standard errors are not applicable for lines 1 through 10 since these data are the result of censuses, not surveys.5Firms reported annual payroll, but did not report any employees on their payroll during specified period in 1992.
146 CHARACTERISTICS OF BUSINESS OWNERS 1992 ECONOMIC CENSUS

Sources of non~borrowed capital obtained1mCon.
Standard error of estimate3 for columnm
Owner’s personal/family savings
Otherpersonal sources
Notreported Not applicable2
Relativestandard
error ofestimate3 4
E F G H A B C D E F G H
36.5 3.5 10.4 25.0 (X) .4 .9 .2 .6 .3 .2 .9 1
34.9 3.9 9.7 28.2 (X) .4 1.0 .2 .9 .4 .4 1.2 241.9 2.3 12.6 14.7 (X) .6 .7 .4 .4 .2 .3 .6 340.7 1.7 9.6 13.0 (X) 2.7 2.6 .7 3.2 .8 2.0 2.6 443.0 2.5 11.6 13.9 (X) .8 1.1 .6 1.0 .5 .7 1.2 540.6 2.6 14.3 12.8 (X) 1.0 1.1 .7 1.9 .4 1.8 1.3 639.8 1.4 14.6 18.2 (X) .9 .8 .7 1.6 .4 1.1 2.0 742.4 1.9 14.9 17.6 (X) 1.0 1.1 .5 1.9 .4 1.3 1.4 841.7 2.0 14.4 22.3 (X) .8 .9 .8 2.2 .6 1.6 3.1 943.5 3.3 15.6 21.1 (X) 1.3 1.9 .5 2.5 1.4 1.3 2.1 10
35.0 5.2 11.7 27.5 – .3 .5 .5 .9 .6 .7 .7 11
32.3 6.3 11.5 31.3 – .3 .6 .6 1.1 .8 .8 .7 1243.6 1.6 12.6 15.1 1.0 1.1 1.0 .5 1.3 .2 .5 1.0 1344.9 1.6 8.3 17.1 2.0 3.8 3.0 .4 3.6 1.0 1.7 2.9 1443.0 1.4 11.6 16.7 1.0 2.3 1.8 .9 1.9 .3 1.0 1.6 1541.3 1.8 15.0 11.3 2.0 2.0 1.7 .7 3.3 .5 1.1 1.2 1643.3 2.1 19.2 13.2 3.0 .9 2.1 .6 2.9 .5 1.3 1.4 1749.1 1.4 13.5 11.5 4.0 1.6 1.6 2.2 2.8 .7 1.8 1.9 1845.7 1.4 16.9 14.3 6.0 1.8 2.1 2.8 5.0 .6 2.5 2.1 1958.2 2.3 9.5 12.3 8.0 4.8 2.3 1.1 4.1 1.0 2.0 2.0 20
30.5 6.7 13.0 32.2 – .4 .4 .2 .8 .6 .6 .9 21
29.0 7.0 13.1 34.6 – .4 .4 .2 .8 .6 .6 1.0 2241.2 5.2 12.0 15.3 1.0 .5 1.3 .8 2.0 .8 .8 1.6 2334.5 2.6 9.4 21.4 2.0 2.4 5.2 1.4 4.4 1.5 2.1 3.9 2443.9 5.8 12.0 13.8 1.0 .5 1.2 .9 2.1 .9 1.1 1.6 2536.2 8.7 12.4 13.6 3.0 2.1 2.1 .9 3.4 2.5 2.8 1.0 2649.6 2.2 13.6 17.3 4.0 1.5 1.9 1.1 3.9 .9 1.5 2.5 2737.9 1.0 20.8 13.7 6.0 3.2 4.7 .8 4.4 .5 4.5 2.0 2854.8 3.3 11.8 10.0 8.0 3.0 1.4 2.4 7.8 1.3 3.6 2.5 2935.7 (D) 22.2 11.8 10.0 2.7 5.0 2.1 4.3 (D) 4.7 3.1 30
47.2 3.4 11.3 18.0 – .2 .9 .2 1.5 .4 .8 .5 31
44.1 4.2 9.6 23.2 – .4 1.1 .3 2.0 .5 .7 .9 3253.6 1.7 14.9 7.2 1.0 .6 .6 .6 1.7 .4 1.4 .3 3356.0 3.9 10.9 8.2 2.0 3.0 1.6 1.8 4.4 2.9 4.4 1.6 3455.5 1.7 14.2 6.4 1.0 1.0 1.1 .9 2.1 .3 2.1 .9 3549.8 1.4 17.2 8.7 2.0 1.3 1.0 1.0 1.9 .5 2.6 1.4 3656.4 .4 12.7 5.7 2.0 1.7 1.9 1.9 3.1 .2 1.1 1.1 3746.8 1.7 18.5 8.9 4.0 1.8 1.3 1.5 1.5 .4 2.0 1.9 3836.5 2.6 29.5 10.1 6.0 1.8 2.4 1.9 5.7 .9 4.0 2.8 3940.5 .8 28.6 11.8 6.0 1.7 2.3 2.6 4.9 .9 4.9 2.4 40
33.2 3.6 9.9 29.9 – .6 1.0 .3 1.2 .3 .4 1.1 41
31.6 4.0 9.1 33.3 – .5 1.1 .3 1.5 .4 .5 1.5 4239.8 2.2 12.8 15.7 – 1.4 1.1 .7 1.2 .3 .9 1.0 4340.9 1.3 12.8 12.0 1.0 4.5 4.6 1.2 4.6 1.4 3.2 2.5 4439.9 2.1 12.4 16.3 – 2.0 1.5 1.0 1.5 .6 1.3 1.6 4539.4 3.0 12.1 12.7 1.0 2.1 1.3 1.0 2.1 1.0 1.1 1.0 4640.8 1.0 14.4 16.4 1.0 1.8 1.5 .8 3.5 .3 1.7 1.8 4738.7 3.1 14.6 20.1 1.0 1.2 1.1 1.1 2.2 .9 1.8 1.3 4833.5 2.1 16.8 25.3 2.0 2.0 2.0 1.3 2.5 .9 3.1 3.3 4938.2 5.1 13.1 30.4 2.0 1.8 1.8 1.8 3.8 2.2 2.5 4.4 50
38.0 3.3 10.4 22.6 – .5 1.0 .3 .8 .4 .5 1.1 51
36.7 3.6 9.7 25.2 – .6 1.3 .3 1.2 .5 .6 1.4 5242.0 2.3 12.4 14.7 – .8 .8 .3 .7 .4 .3 .8 5340.1 1.7 7.7 13.4 – 4.5 3.2 .9 6.5 1.1 2.8 4.3 5443.5 2.7 11.1 13.1 – 1.0 1.1 .5 1.6 .7 .8 1.5 5540.5 2.4 15.0 13.2 – 1.6 2.0 1.0 2.4 .5 2.2 1.8 5638.0 1.6 14.7 19.9 1.0 1.1 .9 1.1 1.9 .5 1.6 2.9 5743.2 1.5 14.7 17.4 1.0 1.4 1.3 .9 2.4 .4 1.8 1.8 5843.4 1.9 13.4 22.2 1.0 1.1 1.1 1.1 2.8 .6 2.1 3.8 5944.9 2.9 16.0 19.0 1.0 1.4 2.4 .5 3.1 1.9 1.9 2.8 60
1992 ECONOMIC CENSUS CHARACTERISTICS OF BUSINESS OWNERS 147
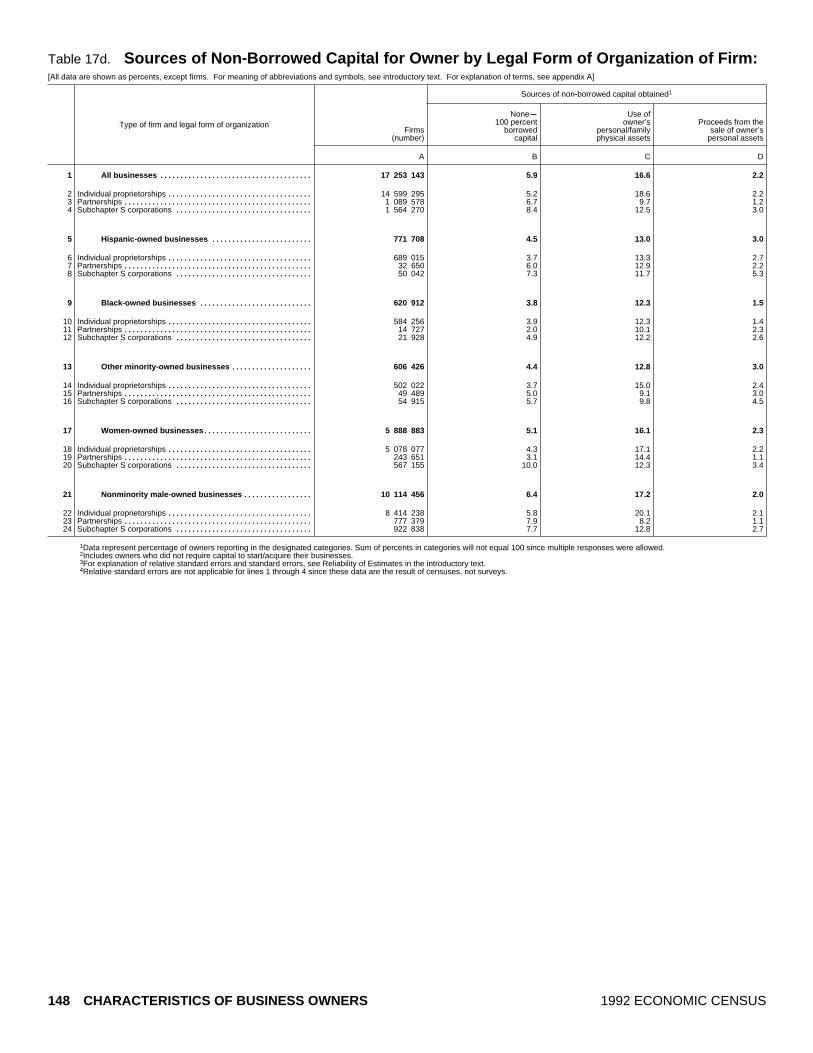
Table 17d. Sources of Non ~Borrowed Capital for Owner by Legal Form of Organization of Firm:[All data are shown as percents, except firms. For meaning of abbreviations and symbols, see introductory text. For explanation of terms, see appendix A]
Type of firm and legal form of organization
Sources of non~borrowed capital obtained1
Firms(number)
Nonem100 percent
borrowedcapital
Use ofowner’s
personal/familyphysical assets
Proceeds from thesale of owner’s
personal assets
A B C D
All businesses 17 253 143...................................... 5.9 16.6 2.21
Individual proprietorships 14 599 295.................................... 5.2 18.6 2.22Partnerships 1 089 578............................................... 6.7 9.7 1.23Subchapter S corporations 1 564 270.................................. 8.4 12.5 3.04
Hispanic ~owned businesses 771 708......................... 4.5 13.0 3.05
Individual proprietorships 689 015.................................... 3.7 13.3 2.76Partnerships 32 650............................................... 6.0 12.9 2.27Subchapter S corporations 50 042.................................. 7.3 11.7 5.38
Black ~owned businesses 620 912............................ 3.8 12.3 1.59
Individual proprietorships 584 256.................................... 3.9 12.3 1.410Partnerships 14 727............................................... 2.0 10.1 2.311Subchapter S corporations 21 928.................................. 4.9 12.2 2.612
Other minority ~owned businesses 606 426.................... 4.4 12.8 3.013
Individual proprietorships 502 022.................................... 3.7 15.0 2.414Partnerships 49 489............................................... 5.0 9.1 3.015Subchapter S corporations 54 915.................................. 5.7 9.8 4.516
Women ~owned businesses 5 888 883........................... 5.1 16.1 2.317
Individual proprietorships 5 078 077.................................... 4.3 17.1 2.218Partnerships 243 651............................................... 3.1 14.4 1.119Subchapter S corporations 567 155.................................. 10.0 12.3 3.420
Nonminority male ~owned businesses 10 114 456................. 6.4 17.2 2.021
Individual proprietorships 8 414 238.................................... 5.8 20.1 2.122Partnerships 777 379............................................... 7.9 8.2 1.123Subchapter S corporations 922 838.................................. 7.7 12.8 2.724
1Data represent percentage of owners reporting in the designated categories. Sum of percents in categories will not equal 100 since multiple responses were allowed.2Includes owners who did not require capital to start/acquire their businesses.3For explanation of relative standard errors and standard errors, see Reliability of Estimates in the introductory text.4Relative standard errors are not applicable for lines 1 through 4 since these data are the result of censuses, not surveys.
148 CHARACTERISTICS OF BUSINESS OWNERS 1992 ECONOMIC CENSUS

1992
Sources of non~borrowed capital obtained1mCon.
Standard error of estimate3 for columnm
Owner’s personal/family savings
Otherpersonal sources
Notreported Not applicable2
Relativestandard
error ofestimate3 4
E F G H A B C D E F G H
36.5 3.5 10.4 25.0 (X) .4 .9 .2 .6 .3 .2 .9 1
33.4 4.2 8.7 27.8 (X) .3 1.1 .3 1.1 .4 .4 1.1 244.4 1.8 16.5 19.7 (X) 1.7 1.9 .2 2.6 .5 1.7 2.0 344.8 1.6 13.4 16.3 (X) .8 .8 .2 1.5 .3 .4 1.0 4
35.0 5.2 11.7 27.5 – .3 .5 .5 .9 .6 .7 .7 5
30.9 6.4 11.3 31.7 – .4 .6 .4 1.1 .9 .8 .7 649.9 2.6 12.4 14.0 2.0 1.1 2.1 .8 3.1 .8 1.1 1.9 745.9 .9 13.8 15.1 1.0 .8 1.4 1.6 1.4 .3 1.2 1.4 8
30.5 6.7 13.0 32.2 – .4 .4 .2 .8 .6 .6 .9 9
29.0 7.2 12.6 33.6 – .4 .4 .2 .9 .6 .6 1.0 1044.2 1.4 21.4 18.5 3.0 .8 2.0 .9 3.1 .8 1.8 3.1 1149.2 2.0 13.2 16.0 2.0 .6 2.2 .5 2.2 .8 1.2 1.9 12
47.2 3.4 11.3 18.0 – .2 .9 .2 1.5 .4 .8 .5 13
44.5 5.2 7.7 21.6 – .3 1.1 .3 1.4 .5 .7 .5 1449.8 .9 19.2 13.0 1.0 1.2 2.4 .6 3.6 .5 2.3 2.2 1552.6 .5 14.6 12.3 1.0 .8 1.0 .8 2.7 .1 1.8 1.5 16
33.2 3.6 9.9 29.9 – .6 1.0 .3 1.2 .3 .4 1.1 17
30.4 4.4 8.2 33.5 – .5 1.4 .3 1.4 .4 .5 1.4 1841.9 2.1 17.3 20.2 1.0 .5 2.6 .3 3.9 .8 2.3 2.6 1941.7 .9 14.0 17.6 – 1.1 .8 .6 2.8 .1 1.2 1.3 20
38.0 3.3 10.4 22.6 – .5 1.0 .3 .8 .4 .5 1.1 21
34.9 3.9 8.7 24.5 – .4 1.2 .4 1.3 .6 .6 1.2 2244.6 1.7 16.2 20.2 – 2.1 2.2 .3 3.1 .6 2.6 2.6 2346.3 2.1 12.8 15.6 – .9 1.2 .4 1.7 .5 .7 1.5 24
1992 ECONOMIC CENSUS CHARACTERISTICS OF BUSINESS OWNERS 149

Table 18a. Weeks and Hours Owner Spent Managing or Working by Industry Division: 1992[All data are shown as percents, except firms. For meaning of abbreviations and symbols, see introductory text. For explanation of terms, see appendix A]
Type of firm and industry division
Number of weeks spent managing or working in the business1 Average number of hours per week spentmanaging or working in the business1
Firms(number) None
Lessthan
12 12 to 23 24 to 35 36 to 4748 ormore
Notreported None
Lessthan
10 10 to 19 20 to 29
A B C D E F G H I J K L
All businesses 17 253 143............................ 8.4 12.4 6.2 6.4 7.1 51.3 8.3 8.4 17.1 10.5 8.91
Agricultural services, forestry, fishing, and mining 583 253..... 14.2 9.9 7.7 9.1 6.9 41.4 10.9 13.5 13.8 10.2 9.42Construction 1 829 620..................................... 8.6 8.6 5.4 7.1 8.1 56.8 5.5 8.5 9.4 6.3 8.93Manufacturing 517 714................................... 10.6 11.2 5.6 6.6 4.7 55.7 5.6 10.8 12.6 10.1 7.94Transportation, communications, and utilities 698 903......... 5.6 7.3 6.9 6.7 9.4 54.3 9.8 5.5 13.1 8.1 6.35Wholesale trade 538 339.................................. 6.3 8.7 5.0 3.7 4.4 64.7 7.1 6.4 11.9 8.3 5.56
Retail trade 2 478 045...................................... 5.3 9.1 6.6 6.6 6.7 57.1 8.6 5.8 14.2 11.2 9.27Finance, insurance, and real estate 1 941 029................. 20.7 19.7 3.2 3.3 4.5 41.4 7.2 20.7 29.1 5.2 5.38Services 7 784 016......................................... 4.6 12.6 7.1 7.4 8.1 52.1 8.2 4.6 16.9 13.9 10.79Industries not classified 882 224........................... 7.4 12.7 8.9 6.0 7.7 39.9 17.3 7.4 17.5 8.6 8.610
Hispanic ~owned businesses 771 708............... 9.6 7.5 5.3 8.1 8.0 51.3 10.2 9.2 10.5 10.3 9.411
Agricultural services, forestry, fishing, and mining 32 927..... 8.2 8.1 5.7 9.5 9.5 46.5 12.4 8.7 7.8 8.7 9.512Construction 97 476..................................... 14.1 3.5 5.4 7.3 9.4 50.5 9.9 12.0 5.1 6.6 6.313Manufacturing 18 461................................... 6.7 7.6 7.3 5.3 4.4 61.2 7.5 6.7 9.7 8.2 7.814Transportation, communications, and utilities 47 797......... 6.6 5.5 5.0 8.3 9.3 52.2 13.1 6.3 11.3 9.4 6.815Wholesale trade 17 727.................................. 5.4 6.6 5.2 3.3 7.3 65.7 6.5 5.1 11.1 7.0 5.616
Retail trade 107 846...................................... 6.3 8.6 6.4 6.6 6.4 56.8 8.9 6.4 10.1 13.5 7.217Finance, insurance, and real estate 49 231................. 18.3 13.2 6.5 4.4 4.7 44.0 8.9 18.3 20.9 10.0 6.018Services 347 297......................................... 8.7 7.1 4.3 9.9 8.7 51.4 10.0 8.5 10.2 10.5 12.319Industries not classified 52 945........................... 8.4 9.3 8.0 7.7 9.0 41.8 15.8 8.7 11.1 12.3 9.820
Black ~owned businesses 620 912.................. 6.8 7.9 7.3 8.9 9.2 46.3 13.6 6.7 14.0 13.9 12.121
Agricultural services, forestry, fishing, and mining 10 309..... 6.6 9.1 8.5 15.4 11.4 36.5 12.5 6.1 10.7 11.0 15.122Construction 43 381..................................... 8.5 8.7 6.3 8.6 9.0 44.1 14.8 8.4 9.5 7.8 8.123Manufacturing 10 469................................... 6.1 8.6 7.6 10.7 6.5 49.1 11.5 5.8 9.6 11.6 12.324Transportation, communications, and utilities 49 095........ 7.5 4.3 5.5 8.4 9.4 49.8 15.1 7.4 8.3 9.9 8.625Wholesale trade 7 550.................................. 5.7 7.5 8.9 12.0 6.0 51.9 7.9 5.8 12.3 18.0 11.926
Retail trade 86 840...................................... 5.4 8.1 6.3 11.6 8.4 47.8 12.4 5.0 16.7 16.5 13.327Finance, insurance, and real estate 40 924................. 7.7 11.5 6.3 8.3 10.4 46.5 9.2 7.8 17.5 12.3 13.328Services 332 981......................................... 7.0 7.8 8.1 7.9 9.5 46.3 13.4 6.8 14.5 14.9 12.329Industries not classified 39 363........................... 5.7 7.0 6.4 11.3 7.8 41.2 20.7 5.5 14.3 12.6 13.830
Other minority ~owned businesses 606 426.......... 8.8 13.1 5.7 6.3 6.8 51.3 7.9 8.6 15.8 8.5 7.831
Agricultural services, forestry, fishing, and mining 15 218..... 11.7 10.5 4.3 9.1 10.9 41.5 11.9 10.8 9.8 9.7 6.632Construction 28 295..................................... 9.9 12.3 7.9 7.0 9.8 46.0 7.1 9.9 15.7 5.2 9.733Manufacturing 18 976................................... 12.9 7.7 7.4 5.1 6.5 54.0 6.4 14.0 7.1 11.1 5.634Transportation, communications, and utilities 24 362......... 6.8 4.6 3.6 3.4 14.3 54.2 13.1 6.8 7.9 7.9 6.035Wholesale trade 20 043.................................. 5.9 6.8 5.4 6.9 9.4 58.5 7.1 5.9 8.2 7.7 8.536
Retail trade 132 483...................................... 4.3 9.2 3.7 4.4 5.5 66.3 6.6 4.3 8.2 7.3 3.937Finance, insurance, and real estate 64 762................. 21.9 24.0 6.5 5.5 4.5 29.3 8.2 21.2 32.2 7.7 6.038Services 273 774......................................... 5.9 12.3 6.6 7.8 6.9 52.4 8.0 5.7 15.7 9.7 10.839Industries not classified 28 512........................... 7.1 19.7 4.9 6.0 8.1 44.2 9.9 7.1 16.7 7.6 7.340
Women ~owned businesses 5 888 883................. 6.1 12.3 7.7 7.9 8.2 48.1 9.7 6.1 18.0 13.0 11.241
Agricultural services, forestry, fishing, and mining 119 731..... 12.5 10.5 5.6 7.4 6.7 48.0 9.3 12.4 10.8 11.4 13.242Construction 183 695..................................... 6.1 12.2 5.2 7.2 7.5 53.4 8.5 6.0 13.6 8.8 10.543Manufacturing 152 346................................... 11.6 9.2 6.5 9.1 5.6 51.9 6.1 11.9 12.9 11.7 9.744Transportation, communications, and utilities 141 623......... 7.6 7.9 6.4 3.9 6.9 60.0 7.3 7.6 14.0 12.2 8.345Wholesale trade 154 542.................................. 6.5 6.7 6.5 7.0 5.2 59.1 8.9 6.7 12.6 12.6 8.646
Retail trade 1 093 342...................................... 4.3 10.7 9.0 8.6 7.9 50.1 9.5 4.7 18.5 13.8 10.847Finance, insurance, and real estate 602 802................. 13.9 18.6 4.8 4.5 6.0 43.2 8.9 14.0 25.5 6.8 8.048Services 3 158 444......................................... 3.9 11.8 8.6 8.8 9.2 47.9 9.8 3.6 17.3 15.1 12.549Industries not classified 282 358........................... 8.5 14.8 6.6 7.0 9.7 35.8 17.6 8.5 18.1 11.3 13.050
Nonminority male ~owned businesses 10 114 456....... 9.6 12.7 5.4 5.5 6.4 53.2 7.2 9.7 17.3 9.1 7.651
Agricultural services, forestry, fishing, and mining 412 917..... 15.3 9.8 8.5 9.4 6.5 39.3 11.2 14.4 15.1 10.0 8.352Construction 1 496 056..................................... 8.6 8.3 5.3 7.1 8.0 58.1 4.6 8.6 9.0 5.9 8.953Manufacturing 333 485................................... 10.2 12.4 5.1 5.5 4.2 57.4 5.2 10.3 12.8 9.3 7.154Transportation, communications, and utilities 458 400......... 4.7 7.7 7.6 7.5 9.9 52.8 9.8 4.6 13.7 6.6 5.755Wholesale trade 352 721.................................. 6.3 9.8 4.2 2.0 3.8 67.5 6.3 6.3 11.8 6.3 4.156
Retail trade 1 197 943...................................... 6.3 7.7 4.7 5.0 5.7 62.7 7.8 7.0 11.3 9.1 8.357Finance, insurance, and real estate 1 240 594................. 23.7 20.1 2.2 2.7 3.8 41.0 6.4 23.6 30.7 4.2 4.258Services 4 102 294......................................... 4.7 13.7 6.0 6.2 7.3 55.3 6.8 5.0 17.2 13.4 9.259Industries not classified 520 046........................... 6.8 12.2 10.6 5.1 6.6 41.4 17.3 6.8 18.0 7.0 6.060
1Data represent percentage of owners reporting in the designated categories.2For explanation of relative standard errors and standard errors, see Reliability of Estimates in the introductory text.3Relative standard errors are not applicable for lines 1 through 10 since these data are the result of censuses, not surveys.
150 CHARACTERISTICS OF BUSINESS OWNERS 1992 ECONOMIC CENSUS

Average number of hours per week spent managingor working in the business1
mCon.
Standard error of estimate2 for columnm
30 to39 40
41 to49
50 to59
60 ormore
Notreported
Relativestandard
error ofestimate2 3
M N O P Q R A B C D E F G H I J K L M N O P Q R
6.9 6.4 10.6 10.3 13.6 7.2 (X) .7 .5 .3 .3 .4 .6 .2 .7 .8 .5 .3 .2 .4 .5 .4 .2 .4 1
4.2 6.4 7.3 7.7 17.7 9.9 (X) 2.7 1.7 1.1 1.5 1.4 1.8 .8 2.4 1.8 2.3 1.0 .8 1.2 1.1 .8 1.9 .8 28.5 9.6 16.2 12.8 15.5 4.3 (X) 1.9 .9 1.0 1.3 1.0 2.9 1.1 1.9 1.4 1.3 1.4 1.4 1.5 2.2 1.4 1.1 .7 36.1 7.6 11.4 12.3 17.1 4.2 (X) 2.2 .8 .7 1.0 .6 2.5 .8 2.2 1.4 .5 1.2 1.1 1.0 1.3 1.0 .8 .4 47.3 5.4 8.0 11.9 24.8 9.6 (X) .8 1.6 1.7 1.7 1.6 1.9 1.0 .8 2.5 1.3 .9 1.4 .9 1.2 1.5 1.9 .8 57.5 7.2 13.6 14.3 18.6 6.7 (X) .8 1.1 .7 .6 .4 1.2 1.1 .8 1.9 .7 .7 1.3 .4 1.5 1.1 1.3 1.1 6
6.6 4.2 9.0 13.0 20.2 6.6 (X) 1.0 .6 .8 .8 1.1 2.2 .7 .9 1.0 1.4 .8 .9 .6 .7 1.0 1.3 .6 74.7 4.5 8.1 6.9 8.7 6.8 (X) 2.6 2.1 .5 .4 .4 1.6 .8 2.5 2.5 .8 1.0 .9 .6 1.0 .6 1.5 1.1 87.6 7.1 11.4 9.9 11.0 7.0 (X) .7 1.0 .6 .6 .9 .6 .6 .7 1.2 1.0 .8 .5 .7 .7 .9 .6 .7 97.6 6.8 7.6 8.0 11.1 16.7 (X) 1.3 1.7 1.0 .8 1.5 2.9 2.5 1.5 1.9 1.2 1.8 1.3 1.1 1.3 1.3 1.8 2.9 10
6.4 10.4 10.5 10.2 14.5 8.6 – .6 .8 .3 .7 .4 .9 .6 .5 .5 .5 .6 .3 .4 .5 .4 .7 .7 11
9.1 13.0 10.1 8.0 14.4 10.9 1.0 1.9 1.4 1.4 1.9 1.1 2.3 2.9 1.9 1.8 1.6 1.5 1.4 1.9 1.7 1.6 2.2 2.9 128.7 12.1 12.6 12.1 14.9 9.5 1.0 1.8 1.0 1.6 1.2 1.4 2.5 1.1 1.7 1.1 1.4 1.3 1.4 1.5 1.7 1.7 1.3 1.9 136.5 9.5 12.1 15.3 18.3 6.1 1.0 1.4 1.3 1.1 .6 .7 2.8 1.1 1.4 1.1 1.5 1.9 1.3 1.5 1.7 1.8 2.3 1.2 146.2 6.9 11.8 11.3 19.5 10.6 1.0 1.8 1.1 .7 1.0 1.7 2.5 1.7 1.9 2.2 1.3 1.5 1.1 .9 1.8 1.3 1.3 1.7 159.9 6.7 12.4 18.6 18.0 5.5 2.0 .8 1.1 1.5 .5 1.2 2.1 .9 .6 1.4 .9 1.5 2.1 1.1 .9 2.0 1.3 .9 16
4.9 5.6 9.7 13.5 22.7 6.5 1.0 1.2 1.0 1.8 1.3 .9 1.7 1.3 1.2 1.9 .7 1.2 .7 1.3 1.5 1.6 1.1 1.0 174.7 6.7 7.7 8.3 9.6 7.8 1.0 2.6 2.2 1.3 .7 1.0 2.3 1.1 2.6 2.5 1.0 1.0 .9 1.6 .7 1.3 .9 1.1 185.7 12.9 11.0 8.5 11.8 8.6 – 1.1 1.8 .6 1.4 .6 1.7 1.0 1.1 1.0 1.2 1.3 .8 .9 .9 .8 1.3 1.0 199.1 10.5 6.3 7.3 12.0 12.8 1.0 1.7 1.8 1.9 1.7 1.7 4.0 2.0 1.6 1.9 1.7 1.5 2.1 1.9 1.9 1.7 1.5 1.9 20
6.7 7.3 8.2 7.6 12.4 11.2 – .4 .4 .4 .4 .4 1.0 .4 .4 .7 .9 .6 .2 .4 .6 .6 .5 .5 21
7.4 8.4 10.0 7.5 12.6 11.2 1.0 1.1 1.1 1.9 1.9 2.1 3.0 1.7 1.0 1.0 1.3 1.5 1.1 1.6 1.8 1.3 1.6 1.6 2211.1 9.0 11.0 10.5 13.6 11.1 – .8 .9 .8 1.3 1.0 2.5 1.4 .7 1.7 1.5 .9 1.3 1.4 1.8 1.1 2.0 1.3 23
6.6 9.7 8.3 12.9 13.3 9.8 1.0 .9 .8 1.3 1.2 1.0 1.7 1.7 .8 1.1 1.6 1.2 1.0 1.4 .7 1.4 .8 1.2 247.6 7.2 9.2 7.9 20.8 13.1 – .8 .8 1.2 1.5 1.3 2.2 1.6 .8 1.9 1.1 1.2 1.1 .6 1.5 1.5 1.1 1.4 255.8 5.3 8.4 9.9 16.8 5.8 2.0 1.0 .9 1.4 1.4 .9 1.3 1.1 1.0 1.8 1.3 1.2 1.0 .7 1.5 1.8 .8 .9 26
5.1 6.3 8.3 6.8 12.7 9.3 – .7 .9 .8 1.1 .6 1.9 .9 .8 1.4 1.4 1.7 .6 .8 .9 .7 1.1 1.0 277.8 5.4 9.4 6.6 12.1 7.8 1.0 1.7 1.3 1.6 1.3 1.2 2.5 1.0 1.6 2.2 1.4 1.8 .8 .6 .9 1.0 1.2 1.2 286.1 7.5 7.8 7.6 11.3 11.1 – .6 .8 .6 .5 .7 1.4 .6 .6 1.0 1.4 .7 .4 .6 .9 .9 .8 .7 298.9 7.0 6.0 5.3 8.6 17.8 – 1.3 1.0 1.2 1.5 1.7 2.7 2.0 1.3 1.1 1.8 1.4 .9 1.0 .9 1.0 1.0 2.6 30
5.5 6.0 9.2 11.3 20.7 6.6 – .5 .7 .4 .6 .5 .9 .6 .5 .8 .6 .6 .3 .6 .5 .4 .8 .5 31
5.1 10.7 7.8 9.7 19.2 10.5 1.0 2.2 2.0 1.8 3.0 1.7 3.5 2.8 2.3 2.4 3.0 2.3 1.4 2.2 1.8 2.0 3.4 3.5 3210.6 8.8 7.9 10.5 15.6 6.1 1.0 2.6 3.0 2.5 2.3 2.7 4.3 1.9 2.6 3.8 1.3 2.0 2.0 2.2 1.4 2.3 3.2 1.2 33
6.1 7.5 11.1 10.3 23.7 3.5 1.0 4.2 2.3 2.4 1.1 1.7 4.1 1.0 4.9 1.9 2.4 1.5 1.2 1.5 2.1 1.8 3.2 .7 348.4 6.3 14.7 11.1 21.6 9.4 1.0 1.7 1.6 1.4 1.2 3.5 4.0 2.5 1.7 1.3 2.2 1.7 2.5 1.2 3.4 1.9 3.0 1.8 356.9 11.8 12.9 13.2 19.8 5.0 1.0 1.1 1.3 1.4 1.2 2.7 1.1 1.3 1.1 1.7 1.5 2.0 1.5 1.2 1.5 1.6 1.8 1.3 36
4.3 3.6 10.5 17.1 36.1 4.6 1.0 .5 1.1 .5 1.2 .7 1.7 1.1 .5 .8 1.2 .6 .6 .9 1.1 1.4 1.2 1.1 372.0 4.7 4.7 5.9 7.1 8.5 1.0 3.1 2.4 1.6 1.6 .8 2.5 1.5 2.7 2.8 1.3 1.3 .7 1.3 1.0 .9 1.5 1.6 386.3 6.4 9.7 10.4 18.2 7.0 – .7 1.9 .6 .9 1.3 2.1 1.0 .5 1.8 1.3 1.2 .9 1.0 .7 .8 1.4 .9 398.7 8.1 8.0 11.1 18.6 6.7 1.0 1.7 3.5 1.3 2.8 1.5 3.8 2.3 1.7 3.2 2.1 1.4 3.4 1.4 2.0 1.6 3.2 1.6 40
7.8 6.8 8.7 8.9 11.6 7.7 – .7 .8 .8 .5 .8 1.5 .8 .7 1.3 .9 .9 .5 .7 .6 .3 .7 .5 41
5.8 6.5 7.1 7.7 16.5 8.6 – 3.1 2.5 1.2 1.1 1.2 4.4 2.3 3.1 2.1 2.4 3.0 1.3 1.4 1.5 1.3 2.9 2.1 426.4 8.4 10.7 12.8 16.2 6.6 – 1.4 1.6 1.2 2.6 1.0 3.9 1.9 1.5 2.6 1.4 1.9 1.1 1.6 1.4 1.6 1.8 1.6 437.9 6.8 8.9 12.2 13.3 4.6 – 2.9 1.8 1.3 1.5 1.3 3.0 .9 3.1 1.4 .8 1.8 1.4 1.1 1.3 1.2 1.3 .8 446.8 7.6 9.0 10.6 18.8 5.1 – 1.1 1.7 2.8 1.2 1.9 3.3 1.3 1.0 3.2 1.9 1.3 2.2 2.1 1.3 1.5 2.3 1.1 458.8 6.9 10.2 10.9 15.8 7.1 – 1.1 1.2 1.3 .9 1.0 2.0 1.1 1.0 2.0 1.6 1.2 1.2 1.1 1.1 1.2 1.6 1.0 46
6.3 4.6 9.2 10.3 15.2 6.4 – .7 1.9 1.8 1.6 1.7 2.2 1.4 .6 2.7 1.6 2.0 1.2 .8 1.0 1.3 1.5 1.0 479.2 5.6 8.7 7.5 7.3 7.5 – 1.7 2.4 1.2 1.0 1.7 2.9 1.8 1.7 2.3 1.4 1.9 2.3 .9 1.2 1.5 1.6 2.0 488.2 8.1 8.9 8.1 10.3 7.9 – .7 1.1 1.6 .8 1.5 2.1 .9 .7 1.8 1.9 1.0 1.0 1.3 1.1 .7 .9 .7 497.2 4.5 3.3 8.7 9.4 16.0 – 1.8 2.5 1.9 2.9 2.1 5.5 3.3 1.9 3.4 1.6 2.2 3.2 1.2 1.2 1.4 1.8 2.9 50
6.5 6.0 11.8 11.1 14.3 6.7 – 1.2 .8 .6 .4 .7 1.2 .5 1.2 .9 .8 .6 .4 .5 .9 .7 .2 .6 51
3.3 5.8 7.1 7.6 18.3 10.2 – 3.6 2.8 1.9 2.3 1.8 2.9 1.3 3.3 2.3 2.9 1.1 1.2 1.8 1.5 1.3 3.0 1.3 528.7 9.7 17.4 12.9 15.5 3.5 – 2.4 1.1 1.1 1.4 1.2 3.4 1.3 2.4 1.8 1.6 1.7 1.8 1.9 2.6 1.7 1.4 .9 535.4 7.9 12.7 12.2 18.4 3.9 – 2.4 1.2 .8 1.3 1.2 3.4 1.1 2.4 2.5 .9 2.0 1.4 1.4 1.7 1.3 1.2 .5 547.5 4.4 6.8 12.7 27.3 10.7 – 1.1 2.4 2.8 2.4 2.2 2.3 1.4 1.1 3.4 1.8 1.2 1.8 1.2 1.7 2.2 3.0 1.0 556.9 7.1 15.2 15.7 19.8 6.8 – 1.1 1.5 1.4 .7 .6 2.0 1.5 1.1 2.4 1.1 1.1 1.9 .9 2.5 1.6 1.6 1.8 56
7.3 3.8 8.6 14.9 22.9 6.8 – 1.7 1.3 1.6 1.8 1.5 3.1 1.7 1.6 1.9 1.9 1.9 1.6 1.0 1.3 1.3 2.2 1.4 572.9 3.9 8.0 6.6 9.3 6.4 – 4.1 2.4 .7 .7 .7 2.8 1.0 4.0 3.4 1.2 1.4 1.1 1.0 1.4 .8 1.8 1.3 587.4 6.1 13.3 11.3 10.9 6.1 – 1.1 2.1 1.1 .7 1.4 2.4 1.2 1.1 1.8 1.3 1.2 .9 .8 1.4 1.6 1.1 1.3 597.5 7.6 9.9 7.6 11.7 17.7 – 1.8 2.8 1.5 1.3 1.7 4.3 3.9 2.1 2.4 2.1 2.4 1.7 1.7 2.2 1.9 3.4 4.7 60
1992 ECONOMIC CENSUS CHARACTERISTICS OF BUSINESS OWNERS 151

Table 18b. Weeks and Hours Owner Spent Managing or Working by Receipts Size of Firm:[All data are shown as percents, except firms. For meaning of abbreviations and symbols, see introductory text. For explanation of terms, see appendix A]
Type of firm and receipts size
Number of weeks spent managing or working in the business1 Average number of hours per week spentmanaging or working in the business1
Firms(number) None
Lessthan
12 12 to 23 24 to 35 36 to 4748 ormore
Notreported None
Lessthan
10 10 to 19 20 to 29
A B C D E F G H I J K L
All businesses 17 253 143............................ 8.4 12.4 6.2 6.4 7.1 51.3 8.3 8.4 17.1 10.5 8.91
Less than $5,000 5 226 553................................. 8.1 23.5 11.8 9.7 8.3 27.3 11.4 8.0 31.3 17.3 11.92$5,000 to $9,999 2 443 946................................. 8.8 11.0 9.0 8.5 8.2 44.6 9.9 9.1 18.5 15.6 12.83$10,000 to $24,999 3 076 410............................... 7.1 9.9 5.6 8.3 7.4 54.4 7.3 7.0 11.9 10.7 10.84$25,000 to $49,999 1 945 806............................... 6.8 7.6 3.1 4.8 10.4 59.9 7.3 6.8 13.6 6.9 10.35$50,000 to $99,999 1 615 940............................... 8.1 8.4 1.9 4.0 5.2 66.5 5.9 8.3 10.6 5.9 4.16
$100,000 to $199,999 1 197 996............................. 8.0 6.1 2.6 2.6 4.0 72.0 4.7 8.0 8.8 3.8 3.77$200,000 to $249,999 301 794............................. 12.4 4.4 2.3 2.0 5.6 67.9 5.4 13.4 6.2 2.3 2.28$250,000 to $499,999 682 583............................. 9.4 6.9 2.2 2.7 4.2 67.6 6.9 9.5 9.2 3.9 4.09$500,000 to $999,999 372 078............................. 11.7 7.5 2.0 1.6 3.8 66.4 7.0 11.8 9.7 5.0 4.210$1,000,000 or more 390 037............................... 12.9 6.8 2.0 2.1 3.5 65.6 7.2 12.9 8.8 4.0 3.311
Hispanic ~owned businesses 771 708............... 9.6 7.5 5.3 8.1 8.0 51.3 10.2 9.2 10.5 10.3 9.412
Less than $5,000 219 226................................. 15.2 14.3 10.4 12.0 10.0 22.4 15.8 15.5 21.4 17.4 11.013$5,000 to $9,999 140 362................................. 9.7 10.4 7.0 11.5 7.4 38.9 15.2 9.3 8.9 12.5 14.314$10,000 to $24,999 165 667............................... 8.8 4.7 4.8 8.8 8.7 55.0 9.3 7.5 9.0 11.0 12.815$25,000 to $49,999 87 288............................... 8.4 4.2 3.1 8.4 10.6 59.8 5.6 8.2 7.0 6.3 6.916$50,000 to $99,999 64 742............................... 5.2 4.9 2.9 4.7 7.0 68.4 7.0 4.8 7.4 6.2 5.117
$100,000 to $199,999 41 578............................. 6.2 5.4 3.2 3.7 5.5 70.3 5.7 6.3 5.4 6.8 6.618$200,000 to $249,999 10 030............................. 11.6 3.4 .7 2.1 3.7 71.8 6.8 11.6 4.5 2.9 3.719$250,000 to $499,999 22 301............................. 5.8 4.5 2.4 2.4 5.4 72.9 6.6 5.6 6.0 4.6 5.420$500,000 to $999,999 11 319............................. 7.1 4.7 1.2 1.4 2.5 76.0 7.0 7.1 5.0 4.5 4.321$1,000,000 or more 9 194............................... 8.9 3.5 1.6 1.4 4.8 73.3 6.6 8.4 4.4 3.7 2.622
Black ~owned businesses 620 912.................. 6.8 7.9 7.3 8.9 9.2 46.3 13.6 6.7 14.0 13.9 12.123
Less than $5,000 236 722................................. 7.8 13.5 11.5 11.8 9.2 29.4 16.8 7.6 25.6 18.0 13.424$5,000 to $9,999 111 512................................. 6.2 7.4 7.7 10.3 10.9 41.2 16.3 6.0 13.1 16.3 15.525$10,000 to $24,999 129 901............................... 7.2 4.1 4.9 8.2 10.3 52.5 12.9 7.0 5.6 12.0 12.826$25,000 to $49,999 62 209............................... 5.8 2.8 4.7 5.4 8.2 63.4 9.6 5.8 4.8 10.4 8.627$50,000 to $99,999 39 218............................... 4.5 4.2 2.8 5.2 7.7 68.7 6.8 4.3 6.2 7.3 7.028
$100,000 to $199,999 20 936............................. 6.6 2.3 .9 3.3 6.0 76.1 4.9 6.3 6.4 4.7 4.929$200,000 to $249,999 4 533............................. 7.6 4.1 2.0 1.2 4.6 73.6 6.8 7.6 4.0 4.5 4.930$250,000 to $499,999 9 029............................. 6.0 3.1 2.3 2.0 4.1 77.5 4.9 6.0 4.0 4.6 5.131$500,000 to $999,999 3 823............................. 7.8 7.9 2.4 3.4 3.0 69.1 6.5 7.1 7.3 8.0 5.932$1,000,000 or more 3 028............................... 6.8 2.5 1.6 1.8 3.2 76.0 8.1 6.9 2.8 3.0 2.933
Other minority ~owned businesses 606 426.......... 8.8 13.1 5.7 6.3 6.8 51.3 7.9 8.6 15.8 8.5 7.834
Less than $5,000 132 493................................. 9.9 28.2 11.4 10.6 8.0 23.6 8.2 9.8 37.0 12.6 12.535$5,000 to $9,999 80 435................................. 10.5 21.4 11.5 9.7 6.8 31.1 9.1 9.5 22.1 16.0 8.936$10,000 to $24,999 108 195............................... 7.6 12.2 6.0 11.3 11.9 42.7 8.2 7.5 17.0 11.5 11.137$25,000 to $49,999 77 345............................... 10.3 8.9 3.8 5.1 5.8 58.1 8.0 9.9 9.9 6.2 11.038$50,000 to $99,999 70 360............................... 8.2 10.0 3.2 4.6 6.5 60.2 7.3 8.1 9.1 7.7 4.639
$100,000 to $199,999 58 620............................. 6.4 6.8 3.7 3.0 5.8 66.2 8.1 6.3 8.9 5.2 4.240$200,000 to $249,999 15 740............................. 4.0 5.5 4.2 2.7 3.8 73.4 6.4 4.2 7.8 3.1 3.941$250,000 to $499,999 34 266............................. 10.7 6.5 2.8 1.9 4.8 68.0 5.3 10.9 7.6 4.8 4.042$500,000 to $999,999 16 467............................. 6.5 7.6 2.4 3.5 5.2 66.1 8.7 6.6 8.2 3.8 4.243$1,000,000 or more 12 505............................... 9.9 8.1 1.9 2.7 3.9 62.9 10.5 10.0 9.0 4.0 3.144
Women ~owned businesses 5 888 883................. 6.1 12.3 7.7 7.9 8.2 48.1 9.7 6.1 18.0 13.0 11.245
Less than $5,000 2 310 303................................. 4.7 19.8 13.5 11.4 9.3 28.2 13.1 4.4 30.1 19.2 12.746$5,000 to $9,999 967 380................................. 6.0 10.7 9.5 8.3 8.8 47.6 9.1 6.6 16.8 17.8 14.847$10,000 to $24,999 1 051 358............................... 8.1 11.6 7.1 6.7 8.6 49.7 8.1 8.1 14.4 12.1 12.748$25,000 to $49,999 538 885............................... 4.8 5.2 1.0 7.9 10.9 60.2 10.0 4.8 12.1 6.1 12.549$50,000 to $99,999 381 517............................... 5.8 6.7 2.0 4.5 6.4 66.5 8.1 5.8 7.6 7.5 5.850
$100,000 to $199,999 267 089............................. 5.7 6.6 2.0 3.6 4.6 72.2 5.3 6.0 7.7 4.7 6.051$200,000 to $249,999 66 464............................. 5.2 7.8 1.3 2.7 3.6 73.2 6.1 5.4 10.4 3.3 4.652$250,000 to $499,999 146 313............................. 7.8 5.4 2.8 3.4 3.3 72.2 5.1 7.6 6.1 4.1 4.853$500,000 to $999,999 80 539............................. 9.1 5.2 1.9 2.1 3.3 72.2 6.2 9.1 6.3 4.3 4.854$1,000,000 or more 79 037............................... 14.5 5.7 1.7 2.4 4.3 64.2 7.2 14.9 6.8 3.0 4.855
Nonminority male ~owned businesses 10 114 456....... 9.6 12.7 5.4 5.5 6.4 53.2 7.2 9.7 17.3 9.1 7.656
Less than $5,000 2 608 047................................. 10.4 26.7 10.5 8.2 7.4 27.2 9.6 10.5 32.8 16.0 11.257$5,000 to $9,999 1 285 456................................. 10.9 11.3 8.6 8.4 7.7 43.3 9.8 11.1 20.5 14.2 11.158$10,000 to $24,999 1 763 830............................... 6.3 9.2 4.7 9.1 6.2 58.5 6.1 6.2 10.6 9.6 9.359$25,000 to $49,999 1 248 482............................... 7.3 8.8 3.9 3.3 10.4 60.0 6.3 7.3 15.0 7.1 9.660$50,000 to $99,999 1 108 065............................... 9.1 9.2 1.7 3.7 4.6 66.6 5.1 9.5 12.0 5.1 3.461
$100,000 to $199,999 840 723............................. 9.1 5.9 2.7 2.2 3.5 72.2 4.4 9.0 9.3 3.2 2.762$200,000 to $249,999 212 693............................. 16.1 3.0 2.8 1.7 6.6 64.8 4.9 17.6 4.7 1.7 1.063$250,000 to $499,999 488 462............................. 10.0 7.5 2.0 2.6 4.5 65.8 7.6 10.2 10.4 3.8 3.764$500,000 to $999,999 266 408............................. 12.9 8.3 2.0 1.4 3.9 64.3 7.1 13.2 11.1 5.4 4.065$1,000,000 or more 292 290............................... 12.6 7.1 2.0 2.0 3.2 65.8 7.1 12.7 9.5 4.3 2.966
1Data represent percentage of owners reporting in the designated categories.2For explanation of relative standard errors and standard errors, see Reliability of Estimates in the introductory text.3Relative standard errors are not applicable for lines 1 through 11 since these data are the result of censuses, not surveys.
152 CHARACTERISTICS OF BUSINESS OWNERS 1992 ECONOMIC CENSUS

1992
Average number of hours per week spent managingor working in the business1
mCon.
Standard error of estimate2 for columnm
30 to39 40
41 to49
50 to59
60 ormore
Notreported
Relativestandard
error ofestimate2 3
M N O P Q R A B C D E F G H I J K L M N O P Q R
6.9 6.4 10.6 10.3 13.6 7.2 (X) .7 .5 .3 .3 .4 .6 .2 .7 .8 .5 .3 .2 .4 .5 .4 .2 .4 1
5.7 4.2 2.9 3.1 5.4 10.3 (X) 1.7 1.9 1.0 .7 .7 1.5 .9 1.7 1.5 .9 .7 .4 .7 .4 .4 .8 .9 28.3 7.5 7.9 6.6 5.1 8.7 (X) 1.8 2.1 1.2 .8 1.2 1.8 1.5 1.8 2.3 1.3 1.1 1.1 1.0 .6 1.1 1.0 1.6 3
11.4 9.2 13.3 9.3 9.3 7.1 (X) 2.3 1.7 1.0 1.3 .9 1.9 1.1 1.9 1.8 1.2 1.4 1.4 1.6 2.3 .6 1.2 1.3 46.9 6.9 16.2 10.3 16.3 5.9 (X) 1.1 1.2 1.2 .9 2.0 3.0 1.2 1.1 2.6 2.1 1.8 1.6 .8 2.8 1.2 1.9 1.1 56.5 6.8 15.3 16.8 21.1 4.7 (X) 1.4 1.0 .5 .6 .7 2.1 .4 1.5 1.0 1.2 .8 .7 .6 1.3 1.3 1.3 .6 6
5.1 6.2 16.3 19.5 24.7 4.0 (X) 1.0 .6 .6 .3 .6 1.4 .7 1.0 .8 .4 .6 .6 .7 1.8 1.8 1.1 .6 78.4 8.4 12.4 17.2 26.6 2.8 (X) 3.7 .8 1.3 .8 1.2 4.3 1.2 3.8 1.1 .4 .4 1.6 1.7 1.7 2.0 2.7 .8 85.0 5.8 13.6 17.5 26.2 5.3 (X) 1.1 .6 .4 .5 .7 1.5 1.1 1.1 .8 .8 .5 .4 .4 .9 1.0 1.2 1.0 94.0 5.5 11.7 16.8 26.1 5.2 (X) .7 .6 .3 .1 .5 1.1 .7 .7 .8 .7 .3 .5 .5 1.1 1.2 1.3 .6 103.6 6.2 13.0 18.2 24.4 5.6 (X) .8 .5 .2 .2 .2 .7 .4 .8 .4 .4 .4 .3 .2 .3 .5 .5 .2 11
6.4 10.4 10.5 10.2 14.5 8.6 – .6 .8 .3 .7 .4 .9 .6 .5 .5 .5 .6 .3 .4 .5 .4 .7 .7 12
5.5 5.7 3.7 3.5 3.5 12.8 1.0 1.7 1.5 .8 1.4 1.6 2.2 2.2 1.6 1.1 1.5 1.3 .8 1.2 1.0 .8 .6 1.8 138.0 13.0 8.1 4.7 8.2 12.9 1.0 1.5 1.2 1.4 1.5 1.1 2.7 1.5 1.5 1.1 2.3 2.5 1.1 2.1 1.2 .9 1.3 1.5 147.0 13.6 11.5 8.4 10.3 8.8 1.0 1.7 2.1 1.1 1.8 1.3 2.9 1.7 1.6 1.6 .9 1.5 .8 2.0 1.9 1.4 2.2 1.4 158.9 15.7 12.6 12.9 16.1 5.4 1.0 1.3 1.3 1.0 2.5 2.5 3.0 .8 1.3 1.7 1.3 1.6 2.3 2.2 .8 1.8 2.8 1.2 165.2 11.1 16.8 13.1 24.4 5.9 1.0 .9 1.0 .9 1.2 1.4 1.5 1.0 .9 1.5 1.1 1.1 1.1 1.1 1.3 1.5 2.3 1.4 17
4.7 7.3 13.0 20.6 24.9 4.3 1.0 .9 1.6 .8 .7 .7 2.9 1.3 .9 1.0 .9 .9 .8 1.1 .9 1.6 1.8 1.1 185.4 10.8 13.7 16.1 26.8 4.5 3.0 3.1 1.3 .5 .9 1.7 2.0 2.1 3.1 1.2 1.1 1.0 2.2 3.1 3.1 3.2 3.9 1.3 195.1 6.9 13.9 17.5 29.9 5.1 2.0 1.2 .8 .7 .7 1.1 1.9 .8 1.1 1.2 .9 1.0 .6 .8 1.6 1.2 1.7 .5 202.5 7.0 13.7 20.2 30.1 5.7 3.0 1.7 1.0 .4 .4 .5 2.8 1.4 1.8 .7 .6 .9 .6 1.4 1.8 2.9 2.3 1.6 214.6 6.3 14.0 20.6 30.2 5.2 2.0 1.9 .4 .4 .4 .9 2.5 .7 1.3 .5 .7 .4 .8 1.0 1.0 1.1 2.1 .8 22
6.7 7.3 8.2 7.6 12.4 11.2 – .4 .4 .4 .4 .4 1.0 .4 .4 .7 .9 .6 .2 .4 .6 .6 .5 .5 23
5.4 4.7 3.6 3.2 4.1 14.3 – .6 1.0 .8 .8 .5 1.3 .9 .6 1.3 1.5 .7 .4 .6 .4 .4 .4 1.2 247.2 7.5 7.7 5.8 7.7 13.3 – .9 .8 .8 1.4 1.3 2.0 1.3 .8 1.4 1.5 1.3 1.0 1.2 1.6 1.2 .8 1.4 258.1 9.7 11.5 9.4 13.6 10.4 – 1.0 .6 .9 1.2 1.0 2.0 .6 1.0 1.0 1.6 1.8 .5 1.2 1.1 1.1 1.2 .8 269.0 11.0 12.7 11.7 19.3 6.7 – 1.0 .9 1.0 1.2 1.6 2.5 1.2 1.0 .9 .9 1.7 1.6 .7 1.7 1.3 1.5 1.3 275.7 7.8 13.7 13.5 28.4 5.9 1.0 .8 .7 .6 1.0 .9 2.1 .9 .7 1.0 1.2 1.1 1.2 .8 1.8 2.1 3.7 .9 28
7.1 6.3 10.4 17.0 33.1 3.9 1.0 1.5 .4 .3 .8 .7 2.2 .5 1.5 1.6 .9 1.2 1.3 .9 .9 2.1 2.1 .5 292.8 6.2 12.3 20.8 33.1 3.9 3.0 2.9 1.7 .9 1.1 1.3 4.8 2.0 2.9 1.7 1.2 1.7 1.8 1.4 1.9 3.9 3.4 1.8 305.0 6.3 11.0 17.5 36.2 4.4 3.0 2.0 .7 .7 .7 .9 2.7 .9 2.0 .7 1.0 1.2 1.0 1.3 1.3 1.6 3.6 .8 314.4 7.8 9.4 10.3 34.3 5.5 4.0 1.8 2.8 .7 .7 1.3 4.5 2.6 1.9 2.2 1.8 1.2 1.1 1.9 1.7 1.2 3.7 2.2 324.9 8.1 10.4 16.4 38.0 6.8 4.0 1.6 .6 .5 .5 1.1 2.7 1.0 1.7 .6 1.0 .5 1.3 1.4 1.9 1.7 2.9 1.1 33
5.5 6.0 9.2 11.3 20.7 6.6 – .5 .7 .4 .6 .5 .9 .6 .5 .8 .6 .6 .3 .6 .5 .4 .8 .5 34
5.7 4.0 2.1 3.8 6.1 6.5 1.0 1.4 3.8 1.8 2.4 1.6 2.9 1.6 1.7 3.4 1.4 1.8 1.8 1.1 .7 1.0 1.4 1.3 355.4 9.8 6.1 4.3 8.7 9.2 1.0 2.4 1.9 2.3 2.6 1.9 4.2 2.7 2.4 2.5 3.2 2.6 1.9 2.7 1.6 2.6 2.5 3.0 366.7 7.0 10.2 6.4 13.9 8.5 1.0 1.9 1.9 2.2 2.1 2.1 2.9 2.3 1.8 3.7 2.0 2.2 1.4 1.8 2.2 1.5 2.6 2.0 376.9 3.8 11.6 16.0 18.7 5.9 1.0 2.8 2.6 1.1 1.3 2.0 3.8 1.6 2.5 2.6 1.6 2.7 1.7 1.1 2.0 2.7 3.3 1.6 385.9 7.4 12.4 13.3 26.0 5.5 1.0 1.5 1.5 .6 1.2 .7 2.9 1.8 1.5 1.3 1.3 2.3 .8 1.7 1.6 1.7 2.5 1.5 39
4.4 5.2 11.8 15.9 31.9 6.2 1.0 1.0 1.0 .7 .8 1.1 2.5 1.8 1.0 1.1 .6 .5 1.0 .7 .9 2.5 2.0 1.3 405.3 6.2 9.3 16.2 39.7 4.4 2.0 1.6 1.7 1.3 1.6 1.4 1.8 .6 1.6 3.3 1.4 1.9 1.2 1.2 2.0 2.5 3.2 .6 413.5 5.5 11.1 15.1 33.4 4.1 1.0 1.6 .9 .6 .4 .6 2.4 .6 1.7 .7 .7 .8 .6 .8 1.6 1.3 1.5 .5 425.5 6.1 10.7 16.9 30.7 7.2 2.0 1.4 1.5 .5 .7 .7 2.5 1.9 1.4 1.3 .7 1.0 .8 .9 1.2 2.3 3.0 1.9 433.8 7.4 10.7 16.4 27.1 8.5 2.0 .8 1.0 .3 .4 .5 1.7 .9 .8 1.1 .6 .6 .5 .7 1.3 1.5 1.4 .8 44
7.8 6.8 8.7 8.9 11.6 7.7 – .7 .8 .8 .5 .8 1.5 .8 .7 1.3 .9 .9 .5 .7 .6 .3 .7 .5 45
7.6 4.6 3.3 2.8 4.3 11.1 – .9 1.8 1.5 1.3 1.3 1.7 1.7 1.0 1.8 1.6 1.1 .9 .7 .7 .5 .9 1.6 469.5 6.9 8.0 6.2 6.2 7.2 – 1.2 2.6 2.1 1.6 2.2 3.0 1.5 1.1 3.0 2.9 2.5 2.5 1.3 1.8 1.2 1.7 1.2 478.8 7.5 10.4 10.9 9.2 5.8 – 1.9 2.8 1.9 1.5 1.5 4.0 1.7 1.9 2.8 1.5 2.5 1.9 2.2 1.7 1.5 2.3 1.6 488.5 6.9 12.6 11.0 18.6 7.0 – 1.3 1.7 .5 2.3 2.9 2.6 1.9 1.2 2.7 1.7 2.3 1.7 2.6 2.2 1.5 3.8 1.7 495.1 12.7 15.1 17.0 16.9 6.6 – 1.1 1.4 .5 .8 1.3 2.8 1.7 1.1 1.0 2.1 1.4 .5 1.9 2.1 1.8 1.4 1.7 50
7.5 8.6 13.4 15.3 26.9 3.9 – 1.0 1.5 .7 .7 1.4 1.7 .7 1.2 1.6 1.0 1.1 1.1 1.2 2.6 1.2 3.1 .8 517.4 6.6 12.9 20.2 25.6 3.5 1.0 1.4 2.4 .3 .8 1.5 3.3 2.0 1.3 2.5 .9 2.0 2.6 2.8 3.3 3.6 4.4 1.7 526.1 7.4 14.3 16.3 29.5 3.7 1.0 1.4 .8 .4 1.0 .4 1.7 .5 1.5 .9 1.1 .6 .9 1.0 1.3 1.3 1.5 .6 535.2 6.6 13.2 18.1 27.7 4.7 1.0 .8 .6 .6 .5 .8 1.3 .5 .8 .5 1.0 .8 .6 .9 1.6 1.5 1.9 .7 546.4 8.5 12.2 14.8 23.2 5.4 1.0 1.3 .9 .2 .4 .5 1.2 .8 1.4 .8 .2 .3 .7 .9 .4 .6 .9 .5 55
6.5 6.0 11.8 11.1 14.3 6.7 – 1.2 .8 .6 .4 .7 1.2 .5 1.2 .9 .8 .6 .4 .5 .9 .7 .2 .6 56
4.2 3.8 2.7 3.2 6.3 9.4 – 3.0 3.0 2.2 .6 .8 2.4 1.7 3.1 2.6 2.1 1.2 1.1 .9 .8 .7 1.3 1.2 577.6 7.5 7.9 7.2 3.6 9.2 – 3.1 2.8 1.6 1.5 2.1 4.5 2.7 3.1 3.2 1.8 2.1 1.8 2.1 1.5 1.9 1.3 2.6 58
13.7 9.9 15.7 8.2 9.2 7.6 – 3.5 1.5 1.2 2.3 1.4 3.4 1.5 2.9 1.9 2.8 1.5 2.4 2.1 4.0 1.4 1.8 2.3 596.2 6.5 18.1 9.6 15.1 5.5 – 1.8 1.8 2.3 1.2 2.9 4.4 1.4 1.8 4.0 3.0 2.5 1.9 1.1 3.7 2.2 3.7 1.4 607.1 4.6 15.4 17.2 21.9 3.9 – 2.1 1.5 .8 .8 1.0 2.4 .4 2.2 1.6 1.4 .8 1.1 .8 1.8 1.6 1.7 .4 61
4.2 5.3 17.8 21.2 23.3 4.0 – 1.4 .7 .7 .4 .9 2.1 1.0 1.4 1.2 .5 .8 .8 .8 2.1 2.8 1.8 .8 629.4 9.2 12.4 16.2 25.5 2.4 – 5.0 1.3 1.9 1.3 2.0 6.0 1.8 5.3 1.5 .5 .6 2.8 2.4 2.4 2.5 3.5 1.0 634.8 5.3 13.6 18.0 24.3 5.9 – 1.8 .9 .5 .6 1.1 2.3 1.5 1.8 1.2 .9 .7 .5 .4 1.3 1.3 1.5 1.5 643.7 5.1 11.1 16.3 25.0 5.1 – 1.1 .9 .4 .2 .7 1.7 1.1 1.1 1.1 1.0 .5 .7 .7 1.2 1.4 1.6 .8 652.9 5.5 13.3 19.1 24.3 5.5 – 1.0 .6 .2 .3 .3 .7 .5 1.0 .6 .5 .4 .4 .4 .4 .7 .6 .3 66
1992 ECONOMIC CENSUS CHARACTERISTICS OF BUSINESS OWNERS 153

Table 18c. Weeks and Hours Owner Spent Managing or Working by Employment Size of Firm:[All data are shown as percents, except firms. For meaning of abbreviations and symbols, see introductory text. For explanation of terms, see appendix A]
Type of firm and employment size
Number of weeks spent managing or working in the business1 Average number of hours per week spentmanaging or working in the business1
Firms(number) None
Lessthan
12 12 to 23 24 to 35 36 to 4748 ormore
Notreported None
Lessthan
10 10 to 19 20 to 29
A B C D E F G H I J K L
All businesses 17 253 143............................ 8.4 12.4 6.2 6.4 7.1 51.3 8.3 8.4 17.1 10.5 8.91
With no paid employees 14 118 184........................... 8.8 14.5 7.4 7.4 7.7 45.2 9.0 8.8 20.3 12.5 10.32With paid employees 3 134 959.............................. 7.0 5.2 2.2 3.3 4.9 71.6 5.9 7.0 6.6 3.8 4.33
No employees4 435 838................................. 3.9 6.9 3.8 9.2 7.0 63.4 5.9 3.9 6.9 3.6 8.541 to 4 employees 1 716 076............................... 4.8 4.6 2.2 3.0 5.1 75.2 5.1 4.9 6.4 3.7 3.955 to 9 employees 503 808............................... 7.9 4.3 1.4 1.5 5.1 73.1 6.8 7.7 5.4 2.9 4.0610 to 19 employees 256 110............................. 11.4 5.8 1.9 2.6 3.1 68.4 6.6 11.7 7.7 5.0 3.5720 to 49 employees 144 734............................. 11.5 6.3 2.0 2.5 3.7 67.7 6.4 11.5 7.8 5.2 3.3850 to 99 employees 45 331............................. 16.4 7.2 2.2 2.5 3.1 61.9 6.7 16.4 10.3 3.8 4.69100 employees or more 33 062......................... 15.4 7.6 2.4 2.2 3.8 59.4 9.4 15.4 7.5 4.9 2.810
Hispanic ~owned businesses 771 708............... 9.6 7.5 5.3 8.1 8.0 51.3 10.2 9.2 10.5 10.3 9.411
With no paid employees 656 343........................... 10.6 8.6 6.2 9.6 8.9 44.8 11.3 10.3 12.2 11.9 10.612With paid employees 115 364.............................. 6.0 4.0 2.5 3.1 5.3 72.8 6.4 5.7 5.2 5.0 5.613
No employees4 19 569................................. 6.1 6.0 6.7 6.8 4.6 63.5 6.3 6.0 8.9 3.4 5.1141 to 4 employees 64 631............................... 5.5 3.6 1.7 3.0 6.8 72.9 6.5 4.8 4.9 5.7 6.3155 to 9 employees 16 937............................... 6.4 3.2 1.4 .8 2.7 79.0 6.6 6.4 3.1 4.5 5.01610 to 19 employees 8 553............................. 6.3 3.9 2.6 2.0 4.6 73.3 7.2 6.5 4.5 6.0 4.91720 to 49 employees 4 050............................. 6.4 3.9 2.3 3.3 2.5 77.4 4.2 6.4 4.8 4.0 3.61850 to 99 employees 948............................. 12.8 6.7 .7 1.8 2.7 69.0 6.4 15.7 6.9 2.1 2.319100 employees or more 676......................... 6.0 2.4 .5 .6 7.9 77.2 5.4 6.3 4.1 1.6 8.420
Black ~owned businesses 620 912.................. 6.8 7.9 7.3 8.9 9.2 46.3 13.6 6.7 14.0 13.9 12.121
With no paid employees 556 434........................... 7.0 8.4 8.0 9.6 9.7 43.0 14.3 6.8 15.1 14.9 12.622With paid employees 64 478.............................. 5.6 3.8 1.9 4.5 5.9 69.8 8.4 5.5 5.5 6.5 8.023
No employees4 13 725................................. 3.8 8.2 2.7 11.0 5.6 55.9 12.8 3.7 11.2 8.2 10.9241 to 4 employees 37 587............................... 6.1 2.6 1.9 3.5 6.7 71.3 8.0 6.1 4.3 5.8 7.9255 to 9 employees 7 853............................... 5.6 2.9 1.1 1.2 4.4 79.6 5.2 5.3 4.2 7.8 7.12610 to 19 employees 2 839............................. 4.1 3.1 2.4 2.4 4.8 78.0 5.2 4.0 3.4 7.0 2.82720 to 49 employees 1 700............................. 9.4 5.9 .5 3.0 5.2 67.9 8.2 9.2 5.0 4.1 6.82850 to 99 employees 432............................. 3.4 2.3 (D) (D) 2.3 83.0 6.3 3.4 3.4 3.3 1.329100 employees or more 342......................... 6.8 1.0 1.9 3.0 1.4 77.5 8.5 6.4 1.2 2.5 2.730
Other minority ~owned businesses 606 426.......... 8.8 13.1 5.7 6.3 6.8 51.3 7.9 8.6 15.8 8.5 7.831
With no paid employees 470 075........................... 10.0 16.6 7.4 8.1 8.1 42.0 7.9 9.7 20.3 10.4 9.132With paid employees 136 351.............................. 6.2 6.1 2.4 2.8 4.2 70.1 8.0 6.3 6.5 4.6 5.133
No employees4 19 989................................. 3.2 6.0 3.2 6.9 3.1 69.9 7.6 3.4 9.1 5.3 9.6341 to 4 employees 76 636............................... 4.8 6.1 2.1 2.4 4.3 71.8 8.5 4.9 5.4 5.2 5.0355 to 9 employees 22 862............................... 7.5 5.5 2.9 2.2 3.8 70.6 7.5 7.6 5.1 3.7 5.03610 to 19 employees 10 051............................. 9.1 7.8 2.2 2.4 5.4 68.5 4.7 8.9 10.3 3.1 2.93720 to 49 employees 5 034............................. 10.9 6.2 1.7 2.2 5.1 65.1 8.8 11.0 8.2 4.6 3.43850 to 99 employees 1 075............................. 10.9 4.1 3.7 1.7 3.7 59.7 16.3 11.3 4.7 3.0 4.639100 employees or more 705......................... 18.3 4.4 (D) (D) 4.4 53.3 18.4 18.5 4.6 1.2 2.740
Women ~owned businesses 5 888 883................. 6.1 12.3 7.7 7.9 8.2 48.1 9.7 6.1 18.0 13.0 11.241
With no paid employees 5 071 110........................... 6.0 14.0 8.9 8.7 9.2 42.5 10.7 6.0 20.7 15.2 12.442With paid employees 817 773.............................. 6.6 5.2 2.8 4.4 3.8 71.5 5.6 6.6 6.7 4.1 6.543
No employees4 127 905................................. 5.8 11.3 2.9 8.1 6.2 59.6 6.0 5.9 7.1 6.0 10.4441 to 4 employees 435 550............................... 4.3 4.4 3.7 5.2 2.9 74.4 5.1 4.4 7.9 4.1 7.0455 to 9 employees 134 476............................... 8.6 3.8 1.5 1.7 4.4 75.2 4.9 8.4 4.5 3.4 4.64610 to 19 employees 67 487............................. 8.2 4.8 1.8 3.2 2.8 71.6 7.6 8.5 5.7 3.3 4.94720 to 49 employees 35 515............................. 12.5 4.8 1.3 2.8 6.2 66.2 6.2 11.7 4.8 4.1 5.24850 to 99 employees 10 178............................. 16.7 4.4 .8 2.2 6.3 60.8 8.7 17.0 5.5 1.6 5.149100 employees or more 6 663......................... 20.6 6.7 2.3 .8 2.1 61.3 6.3 20.5 9.0 2.8 3.850
Nonminority male ~owned businesses 10 114 456....... 9.6 12.7 5.4 5.5 6.4 53.2 7.2 9.7 17.3 9.1 7.651
With no paid employees 8 019 462........................... 10.3 15.3 6.5 6.4 6.7 46.9 7.8 10.5 20.8 11.0 9.152With paid employees 2 094 993.............................. 7.2 5.1 1.9 2.8 5.4 71.9 5.7 7.3 6.7 3.6 3.253
No employees4 271 380................................. 2.8 4.5 4.0 9.9 7.9 65.8 5.1 2.8 6.4 1.9 7.6541 to 4 employees 1 155 800............................... 4.9 4.6 1.6 2.1 6.0 76.2 4.6 5.0 6.0 3.4 2.3555 to 9 employees 334 483............................... 7.6 4.4 1.3 1.3 5.7 72.2 7.5 7.5 5.9 2.5 3.55610 to 19 employees 173 140............................. 13.0 6.2 1.8 2.5 3.1 66.9 6.4 13.2 8.6 5.6 3.05720 to 49 employees 101 938............................. 11.4 6.8 2.2 2.4 2.9 68.1 6.3 11.6 8.8 5.7 2.75850 to 99 employees 33 406............................. 16.6 8.0 2.5 2.6 2.4 61.9 5.9 16.6 11.7 4.4 4.659100 employees or more 24 846......................... 13.9 8.1 2.5 2.6 4.1 58.7 10.1 13.9 7.2 5.8 2.560
1Data represent percentage of owners reporting in the designated categories.2For explanation of relative standard errors and standard errors, see Reliability of Estimates in the introductory text.3Relative standard errors are not applicable for lines 1 through 10 since these data are the result of censuses, not surveys.4Firms reported annual payroll, but did not report any employees on their payroll during specified period in 1992.
154 CHARACTERISTICS OF BUSINESS OWNERS 1992 ECONOMIC CENSUS
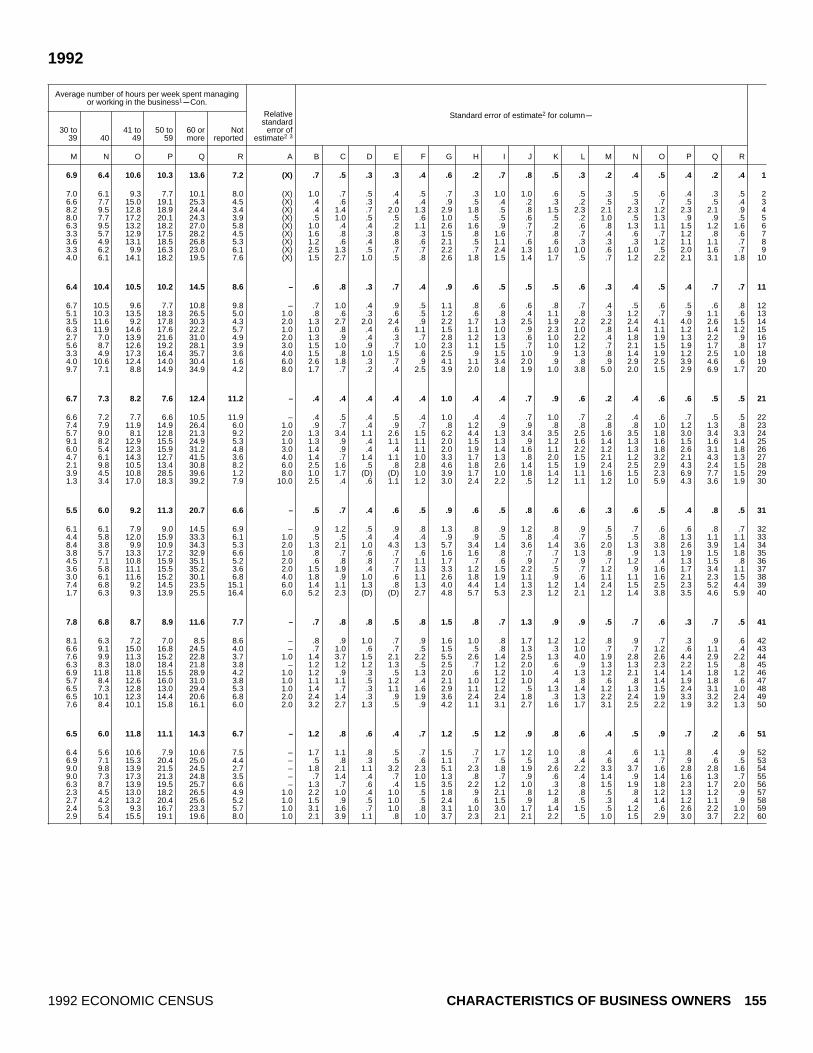
1992
Average number of hours per week spent managingor working in the business1
mCon.
Standard error of estimate2 for columnm
30 to39 40
41 to49
50 to59
60 ormore
Notreported
Relativestandard
error ofestimate2 3
M N O P Q R A B C D E F G H I J K L M N O P Q R
6.9 6.4 10.6 10.3 13.6 7.2 (X) .7 .5 .3 .3 .4 .6 .2 .7 .8 .5 .3 .2 .4 .5 .4 .2 .4 1
7.0 6.1 9.3 7.7 10.1 8.0 (X) 1.0 .7 .5 .4 .5 .7 .3 1.0 1.0 .6 .5 .3 .5 .6 .4 .3 .5 26.6 7.7 15.0 19.1 25.3 4.5 (X) .4 .6 .3 .4 .4 .9 .5 .4 .2 .3 .2 .5 .3 .7 .5 .5 .4 38.2 9.5 12.8 18.9 24.4 3.4 (X) .4 1.4 .7 2.0 1.3 2.9 1.8 .5 .8 1.5 2.3 2.1 2.3 1.2 2.3 2.1 .9 48.0 7.7 17.2 20.1 24.3 3.9 (X) .5 1.0 .5 .5 .6 1.0 .5 .5 .6 .5 .2 1.0 .5 1.3 .9 .9 .5 56.3 9.5 13.2 18.2 27.0 5.8 (X) 1.0 .4 .4 .2 1.1 2.6 1.6 .9 .7 .2 .6 .8 1.3 1.1 1.5 1.2 1.6 63.3 5.7 12.9 17.5 28.2 4.5 (X) 1.6 .8 .3 .8 .3 1.5 .8 1.6 .7 .8 .7 .4 .6 .7 1.2 .8 .6 73.6 4.9 13.1 18.5 26.8 5.3 (X) 1.2 .6 .4 .8 .6 2.1 .5 1.1 .6 .6 .3 .3 .3 1.2 1.1 1.1 .7 83.3 6.2 9.9 16.3 23.0 6.1 (X) 2.5 1.3 .5 .7 .7 2.2 .7 2.4 1.3 1.0 1.0 .6 1.0 .5 2.0 1.6 .7 94.0 6.1 14.1 18.2 19.5 7.6 (X) 1.5 2.7 1.0 .5 .8 2.6 1.8 1.5 1.4 1.7 .5 .7 1.2 2.2 2.1 3.1 1.8 10
6.4 10.4 10.5 10.2 14.5 8.6 – .6 .8 .3 .7 .4 .9 .6 .5 .5 .5 .6 .3 .4 .5 .4 .7 .7 11
6.7 10.5 9.6 7.7 10.8 9.8 – .7 1.0 .4 .9 .5 1.1 .8 .6 .6 .8 .7 .4 .5 .6 .5 .6 .8 125.1 10.3 13.5 18.3 26.5 5.0 1.0 .8 .6 .3 .6 .5 1.2 .6 .8 .4 1.1 .8 .3 1.2 .7 .9 1.1 .6 133.5 11.6 9.2 17.8 30.3 4.3 2.0 1.3 2.7 2.0 2.4 .9 2.2 1.7 1.3 2.5 1.9 2.2 2.2 2.4 4.1 4.0 2.6 1.5 146.3 11.9 14.6 17.6 22.2 5.7 1.0 1.0 .8 .4 .6 1.1 1.5 1.1 1.0 .9 2.3 1.0 .8 1.4 1.1 1.2 1.4 1.2 152.7 7.0 13.9 21.6 31.0 4.9 2.0 1.3 .9 .4 .3 .7 2.8 1.2 1.3 .6 1.0 2.2 .4 1.8 1.9 1.3 2.2 .9 165.6 8.7 12.6 19.2 28.1 3.9 3.0 1.5 1.0 .9 .7 1.0 2.3 1.1 1.5 .7 1.0 1.2 .7 2.1 1.5 1.9 1.7 .8 173.3 4.9 17.3 16.4 35.7 3.6 4.0 1.5 .8 1.0 1.5 .6 2.5 .9 1.5 1.0 .9 1.3 .8 1.4 1.9 1.2 2.5 1.0 184.0 10.6 12.4 14.0 30.4 1.6 6.0 2.6 1.8 .3 .7 .9 4.1 1.1 3.4 2.0 .9 .8 .9 2.9 2.5 3.9 4.6 .6 199.7 7.1 8.8 14.9 34.9 4.2 8.0 1.7 .7 .2 .4 2.5 3.9 2.0 1.8 1.9 1.0 3.8 5.0 2.0 1.5 2.9 6.9 1.7 20
6.7 7.3 8.2 7.6 12.4 11.2 – .4 .4 .4 .4 .4 1.0 .4 .4 .7 .9 .6 .2 .4 .6 .6 .5 .5 21
6.6 7.2 7.7 6.6 10.5 11.9 – .4 .5 .4 .5 .4 1.0 .4 .4 .7 1.0 .7 .2 .4 .6 .7 .5 .5 227.4 7.9 11.9 14.9 26.4 6.0 1.0 .9 .7 .4 .9 .7 .8 1.2 .9 .9 .8 .8 .8 .8 1.0 1.2 1.3 .8 235.7 9.0 8.1 12.8 21.3 9.2 2.0 1.3 3.4 1.1 2.6 1.5 6.2 4.4 1.3 3.4 3.5 2.5 1.6 3.5 1.8 3.0 3.4 3.3 249.1 8.2 12.9 15.5 24.9 5.3 1.0 1.3 .9 .4 1.1 1.1 2.0 1.5 1.3 .9 1.2 1.6 1.4 1.3 1.6 1.5 1.6 1.4 256.0 5.4 12.3 15.9 31.2 4.8 3.0 1.4 .9 .4 .4 1.1 2.0 1.9 1.4 1.6 1.1 2.2 1.2 1.3 1.8 2.6 3.1 1.8 264.7 6.1 14.3 12.7 41.5 3.6 4.0 1.4 .7 1.4 1.1 1.0 3.3 1.7 1.3 .8 2.0 1.5 2.1 1.2 3.2 2.1 4.3 1.3 272.1 9.8 10.5 13.4 30.8 8.2 6.0 2.5 1.6 .5 .8 2.8 4.6 1.8 2.6 1.4 1.5 1.9 2.4 2.5 2.9 4.3 2.4 1.5 283.9 4.5 10.8 28.5 39.6 1.2 8.0 1.0 1.7 (D) (D) 1.0 3.9 1.7 1.0 1.8 1.4 1.1 1.6 1.5 2.3 6.9 7.7 1.5 291.3 3.4 17.0 18.3 39.2 7.9 10.0 2.5 .4 .6 1.1 1.2 3.0 2.4 2.2 .5 1.2 1.1 1.2 1.0 5.9 4.3 3.6 1.9 30
5.5 6.0 9.2 11.3 20.7 6.6 – .5 .7 .4 .6 .5 .9 .6 .5 .8 .6 .6 .3 .6 .5 .4 .8 .5 31
6.1 6.1 7.9 9.0 14.5 6.9 – .9 1.2 .5 .9 .8 1.3 .8 .9 1.2 .8 .9 .5 .7 .6 .6 .8 .7 324.4 5.8 12.0 15.9 33.3 6.1 1.0 .5 .5 .4 .4 .4 .9 .9 .5 .8 .4 .7 .5 .5 .8 1.3 1.1 1.1 338.4 3.8 9.9 10.9 34.3 5.3 2.0 1.3 2.1 1.0 4.3 1.3 5.7 3.4 1.4 3.6 1.4 3.6 2.0 1.3 3.8 2.6 3.9 1.4 343.8 5.7 13.3 17.2 32.9 6.6 1.0 .8 .7 .6 .7 .6 1.6 1.6 .8 .7 .7 1.3 .8 .9 1.3 1.9 1.5 1.8 354.5 7.1 10.8 15.9 35.1 5.2 2.0 .6 .8 .8 .7 1.1 1.7 .7 .6 .9 .7 .9 .7 1.2 .4 1.3 1.5 .8 363.6 5.8 11.1 15.5 35.2 3.6 2.0 1.5 1.9 .4 .7 1.3 3.3 1.2 1.5 2.2 .5 .7 1.2 .9 1.6 1.7 3.4 1.1 373.0 6.1 11.6 15.2 30.1 6.8 4.0 1.8 .9 1.0 .6 1.1 2.6 1.8 1.9 1.1 .9 .6 1.1 1.1 1.6 2.1 2.3 1.5 387.4 6.8 9.2 14.5 23.5 15.1 6.0 1.4 1.1 1.3 .8 1.3 4.0 4.4 1.4 1.3 1.2 1.4 2.4 1.5 2.5 2.3 5.2 4.4 391.7 6.3 9.3 13.9 25.5 16.4 6.0 5.2 2.3 (D) (D) 2.7 4.8 5.7 5.3 2.3 1.2 2.1 1.2 1.4 3.8 3.5 4.6 5.9 40
7.8 6.8 8.7 8.9 11.6 7.7 – .7 .8 .8 .5 .8 1.5 .8 .7 1.3 .9 .9 .5 .7 .6 .3 .7 .5 41
8.1 6.3 7.2 7.0 8.5 8.6 – .8 .9 1.0 .7 .9 1.6 1.0 .8 1.7 1.2 1.2 .8 .9 .7 .3 .9 .6 426.6 9.1 15.0 16.8 24.5 4.0 – .7 1.0 .6 .7 .5 1.5 .5 .8 1.3 .3 1.0 .7 .7 1.2 .6 1.1 .4 437.6 9.9 11.3 15.2 22.8 3.7 1.0 1.4 3.7 1.5 2.1 2.2 5.5 2.6 1.4 2.5 1.3 4.0 1.9 2.8 2.6 4.4 2.9 2.2 446.3 8.3 18.0 18.4 21.8 3.8 – 1.2 1.2 1.2 1.3 .5 2.5 .7 1.2 2.0 .6 .9 1.3 1.3 2.3 2.2 1.5 .8 456.9 11.8 11.8 15.5 28.9 4.2 1.0 1.2 .9 .3 .5 1.3 2.0 .6 1.2 1.0 .4 1.3 1.2 2.1 1.4 1.4 1.8 1.2 465.7 8.4 12.6 16.0 31.0 3.8 1.0 1.1 1.1 .5 1.2 .4 2.1 1.0 1.2 1.0 .4 .8 .6 .8 1.4 1.9 1.8 .6 476.5 7.3 12.8 13.0 29.4 5.3 1.0 1.4 .7 .3 1.1 1.6 2.9 1.1 1.2 .5 1.3 1.4 1.2 1.3 1.5 2.4 3.1 1.0 486.5 10.1 12.3 14.4 20.6 6.8 2.0 2.4 1.4 .3 .9 1.9 3.6 2.4 2.4 1.8 .3 1.3 2.2 2.4 1.9 3.3 3.2 2.4 497.6 8.4 10.1 15.8 16.1 6.0 2.0 3.2 2.7 1.3 .5 .9 4.2 1.1 3.1 2.7 1.6 1.7 3.1 2.5 2.2 1.9 3.2 1.3 50
6.5 6.0 11.8 11.1 14.3 6.7 – 1.2 .8 .6 .4 .7 1.2 .5 1.2 .9 .8 .6 .4 .5 .9 .7 .2 .6 51
6.4 5.6 10.6 7.9 10.6 7.5 – 1.7 1.1 .8 .5 .7 1.5 .7 1.7 1.2 1.0 .8 .4 .6 1.1 .8 .4 .9 526.9 7.1 15.3 20.4 25.0 4.4 – .5 .8 .3 .5 .6 1.1 .7 .5 .5 .3 .4 .6 .4 .7 .9 .6 .5 539.0 9.8 13.9 21.5 24.5 2.7 – 1.8 2.1 1.1 3.2 2.3 5.1 2.3 1.8 1.9 2.6 2.2 3.3 3.7 1.6 2.8 2.8 1.6 549.0 7.3 17.3 21.3 24.8 3.5 – .7 1.4 .4 .7 1.0 1.3 .8 .7 .9 .6 .4 1.4 .9 1.4 1.6 1.3 .7 556.3 8.7 13.9 19.5 25.7 6.6 – 1.3 .7 .6 .4 1.5 3.5 2.2 1.2 1.0 .3 .8 1.5 1.9 1.8 2.3 1.7 2.0 562.3 4.5 13.0 18.2 26.5 4.9 1.0 2.2 1.0 .4 1.0 .5 1.8 .9 2.1 .8 1.2 .8 .5 .8 1.2 1.3 1.2 .9 572.7 4.2 13.2 20.4 25.6 5.2 1.0 1.5 .9 .5 1.0 .5 2.4 .6 1.5 .9 .8 .5 .3 .4 1.4 1.2 1.1 .9 582.4 5.3 9.3 16.7 23.3 5.7 1.0 3.1 1.6 .7 1.0 .8 3.1 1.0 3.0 1.7 1.4 1.5 .5 1.2 .6 2.6 2.2 1.0 592.9 5.4 15.5 19.1 19.6 8.0 1.0 2.1 3.9 1.1 .8 1.0 3.7 2.3 2.1 2.1 2.2 .5 1.0 1.5 2.9 3.0 3.7 2.2 60
1992 ECONOMIC CENSUS CHARACTERISTICS OF BUSINESS OWNERS 155

Table 18d. Weeks and Hours Owner Spent Managing or Working by Legal Form of Organization[All data are shown as percents, except firms. For meaning of abbreviations and symbols, see introductory text. For explanation of terms, see appendix A]
Type of firm and legal form of organization
Number of weeks spent managing or working in the business1 Average number of hours per week spentmanaging or working in the business1
Firms(number) None
Lessthan
12 12 to 23 24 to 35 36 to 4748 ormore
Notreported None
Lessthan
10 10 to 19 20 to 29
A B C D E F G H I J K L
All businesses 17 253 143............................ 8.4 12.4 6.2 6.4 7.1 51.3 8.3 8.4 17.1 10.5 8.91
Individual proprietorships 14 599 295.......................... 4.5 11.2 7.3 7.7 8.4 52.1 8.8 4.4 15.4 12.7 10.42Partnerships 1 089 578..................................... 22.9 21.7 3.6 2.8 3.0 39.3 6.8 23.3 31.9 4.9 5.13Subchapter S corporations 1 564 270........................ 14.9 10.0 3.0 3.3 4.2 57.9 6.7 15.0 13.1 4.6 4.94
Hispanic ~owned businesses 771 708............... 9.6 7.5 5.3 8.1 8.0 51.3 10.2 9.2 10.5 10.3 9.45
Individual proprietorships 689 015.......................... 8.9 7.1 5.6 8.8 9.0 49.3 11.3 8.5 10.0 11.6 10.56Partnerships 32 650..................................... 14.4 11.7 6.5 7.8 4.8 47.3 7.5 14.1 15.6 9.6 5.37Subchapter S corporations 50 042........................ 9.8 6.5 3.1 4.4 5.1 65.0 6.1 9.4 9.9 3.7 6.68
Black ~owned businesses 620 912.................. 6.8 7.9 7.3 8.9 9.2 46.3 13.6 6.7 14.0 13.9 12.19
Individual proprietorships 584 256.......................... 6.4 7.8 7.7 9.4 9.7 45.0 14.2 6.2 13.9 14.5 12.310Partnerships 14 727..................................... 14.3 15.1 2.9 4.8 2.6 51.5 8.8 14.4 21.3 5.0 12.211Subchapter S corporations 21 928........................ 10.7 4.1 3.2 3.6 4.6 68.0 5.8 10.7 9.7 6.9 7.912
Other minority ~owned businesses 606 426.......... 8.8 13.1 5.7 6.3 6.8 51.3 7.9 8.6 15.8 8.5 7.813
Individual proprietorships 502 022.......................... 5.2 12.1 6.4 8.3 9.1 51.3 7.6 4.8 14.8 9.9 8.914Partnerships 49 489..................................... 17.4 22.0 5.4 3.7 2.7 38.9 9.9 17.5 25.3 6.8 8.015Subchapter S corporations 54 915........................ 11.3 8.3 4.2 3.3 4.1 61.6 7.2 11.3 10.4 5.9 4.716
Women ~owned businesses 5 888 883................. 6.1 12.3 7.7 7.9 8.2 48.1 9.7 6.1 18.0 13.0 11.217
Individual proprietorships 5 078 077.......................... 4.0 11.6 9.3 9.0 9.7 46.0 10.4 3.9 17.6 15.3 12.818Partnerships 243 651..................................... 21.1 27.2 2.0 3.1 2.6 34.8 9.2 21.4 35.3 7.2 5.119Subchapter S corporations 567 155........................ 8.7 7.9 3.4 4.8 4.1 64.4 6.8 8.8 11.3 5.4 6.920
Nonminority male ~owned businesses 10 114 456....... 9.6 12.7 5.4 5.5 6.4 53.2 7.2 9.7 17.3 9.1 7.621
Individual proprietorships 8 414 238.......................... 4.5 11.3 6.3 6.8 7.6 55.9 7.6 4.5 14.7 11.3 9.022Partnerships 777 379..................................... 24.1 20.4 3.7 2.6 3.0 40.2 6.0 24.5 31.8 4.0 4.923Subchapter S corporations 922 838........................ 18.9 11.5 2.7 2.3 4.2 53.6 6.6 19.2 14.6 4.1 3.624
1Data represent percentage of owners reporting in the designated categories.2For explanation of relative standard errors and standard errors, see Reliability of Estimates in the introductory text.3Relative standard errors are not applicable for lines 1 through 4 since these data are the result of censuses, not surveys.
156 CHARACTERISTICS OF BUSINESS OWNERS 1992 ECONOMIC CENSUS
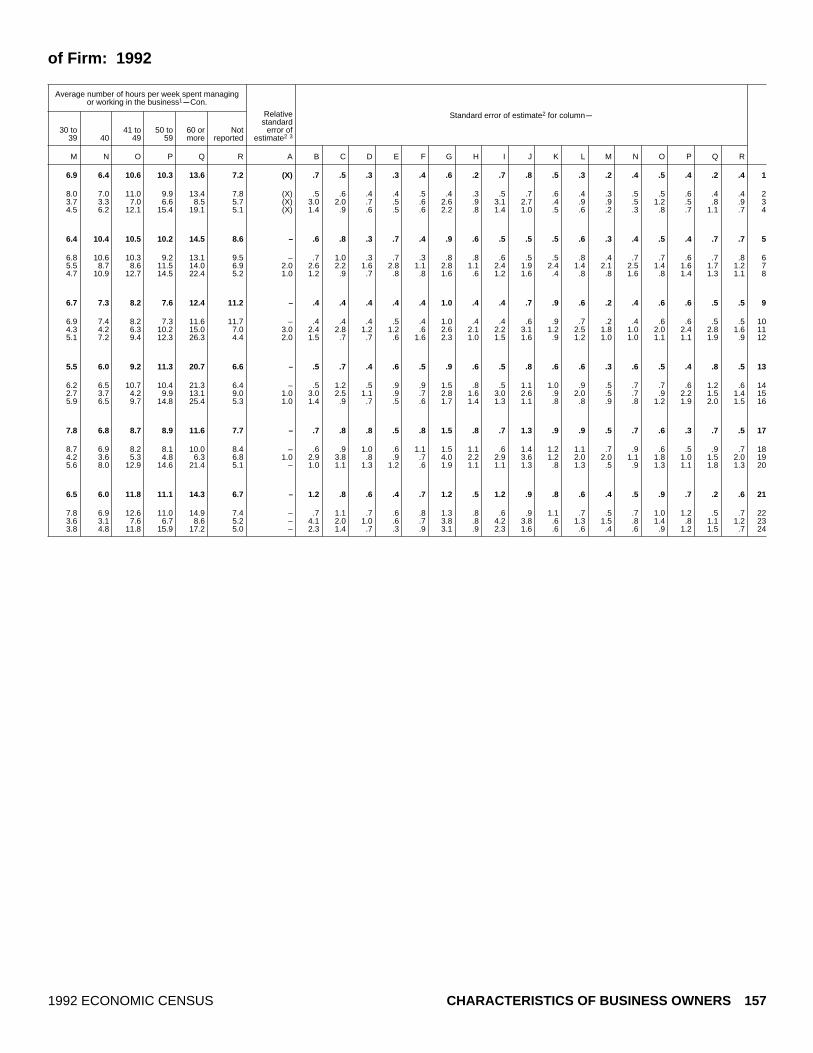
of Firm: 1992
Average number of hours per week spent managingor working in the business1
mCon.
Standard error of estimate2 for columnm
30 to39 40
41 to49
50 to59
60 ormore
Notreported
Relativestandard
error ofestimate2 3
M N O P Q R A B C D E F G H I J K L M N O P Q R
6.9 6.4 10.6 10.3 13.6 7.2 (X) .7 .5 .3 .3 .4 .6 .2 .7 .8 .5 .3 .2 .4 .5 .4 .2 .4 1
8.0 7.0 11.0 9.9 13.4 7.8 (X) .5 .6 .4 .4 .5 .4 .3 .5 .7 .6 .4 .3 .5 .5 .6 .4 .4 23.7 3.3 7.0 6.6 8.5 5.7 (X) 3.0 2.0 .7 .5 .6 2.6 .9 3.1 2.7 .4 .9 .9 .5 1.2 .5 .8 .9 34.5 6.2 12.1 15.4 19.1 5.1 (X) 1.4 .9 .6 .5 .6 2.2 .8 1.4 1.0 .5 .6 .2 .3 .8 .7 1.1 .7 4
6.4 10.4 10.5 10.2 14.5 8.6 – .6 .8 .3 .7 .4 .9 .6 .5 .5 .5 .6 .3 .4 .5 .4 .7 .7 5
6.8 10.6 10.3 9.2 13.1 9.5 – .7 1.0 .3 .7 .3 .8 .8 .6 .5 .5 .8 .4 .7 .7 .6 .7 .8 65.5 8.7 8.6 11.5 14.0 6.9 2.0 2.6 2.2 1.6 2.8 1.1 2.8 1.1 2.4 1.9 2.4 1.4 2.1 2.5 1.4 1.6 1.7 1.2 74.7 10.9 12.7 14.5 22.4 5.2 1.0 1.2 .9 .7 .8 .8 1.6 .6 1.2 1.6 .4 .8 .8 1.6 .8 1.4 1.3 1.1 8
6.7 7.3 8.2 7.6 12.4 11.2 – .4 .4 .4 .4 .4 1.0 .4 .4 .7 .9 .6 .2 .4 .6 .6 .5 .5 9
6.9 7.4 8.2 7.3 11.6 11.7 – .4 .4 .4 .5 .4 1.0 .4 .4 .6 .9 .7 .2 .4 .6 .6 .5 .5 104.3 4.2 6.3 10.2 15.0 7.0 3.0 2.4 2.8 1.2 1.2 .6 2.6 2.1 2.2 3.1 1.2 2.5 1.8 1.0 2.0 2.4 2.8 1.6 115.1 7.2 9.4 12.3 26.3 4.4 2.0 1.5 .7 .7 .6 1.6 2.3 1.0 1.5 1.6 .9 1.2 1.0 1.0 1.1 1.1 1.9 .9 12
5.5 6.0 9.2 11.3 20.7 6.6 – .5 .7 .4 .6 .5 .9 .6 .5 .8 .6 .6 .3 .6 .5 .4 .8 .5 13
6.2 6.5 10.7 10.4 21.3 6.4 – .5 1.2 .5 .9 .9 1.5 .8 .5 1.1 1.0 .9 .5 .7 .7 .6 1.2 .6 142.7 3.7 4.2 9.9 13.1 9.0 1.0 3.0 2.5 1.1 .9 .7 2.8 1.6 3.0 2.6 .9 2.0 .5 .7 .9 2.2 1.5 1.4 155.9 6.5 9.7 14.8 25.4 5.3 1.0 1.4 .9 .7 .5 .6 1.7 1.4 1.3 1.1 .8 .8 .9 .8 1.2 1.9 2.0 1.5 16
7.8 6.8 8.7 8.9 11.6 7.7 – .7 .8 .8 .5 .8 1.5 .8 .7 1.3 .9 .9 .5 .7 .6 .3 .7 .5 17
8.7 6.9 8.2 8.1 10.0 8.4 – .6 .9 1.0 .6 1.1 1.5 1.1 .6 1.4 1.2 1.1 .7 .9 .6 .5 .9 .7 184.2 3.6 5.3 4.8 6.3 6.8 1.0 2.9 3.8 .8 .9 .7 4.0 2.2 2.9 3.6 1.2 2.0 2.0 1.1 1.8 1.0 1.5 2.0 195.6 8.0 12.9 14.6 21.4 5.1 – 1.0 1.1 1.3 1.2 .6 1.9 1.1 1.1 1.3 .8 1.3 .5 .9 1.3 1.1 1.8 1.3 20
6.5 6.0 11.8 11.1 14.3 6.7 – 1.2 .8 .6 .4 .7 1.2 .5 1.2 .9 .8 .6 .4 .5 .9 .7 .2 .6 21
7.8 6.9 12.6 11.0 14.9 7.4 – .7 1.1 .7 .6 .8 1.3 .8 .6 .9 1.1 .7 .5 .7 1.0 1.2 .5 .7 223.6 3.1 7.6 6.7 8.6 5.2 – 4.1 2.0 1.0 .6 .7 3.8 .8 4.2 3.8 .6 1.3 1.5 .8 1.4 .8 1.1 1.2 233.8 4.8 11.8 15.9 17.2 5.0 – 2.3 1.4 .7 .3 .9 3.1 .9 2.3 1.6 .6 .6 .4 .6 .9 1.2 1.5 .7 24
1992 ECONOMIC CENSUS CHARACTERISTICS OF BUSINESS OWNERS 157

Table 19a. Total Personal Income of Owner by Industry Division: 1992[All data are shown as percents, except firms. For meaning of abbreviations and symbols, see introductory text. For explanation of terms, see appendix A]
Type of firm and industry division
Owner’s total personal income1
Firms(number)
Under$5,000
$5,000 to$9,999
$10,000 to$14,999
$15,000 to$24,999
$25,000 to$34,999
$35,000 to$49,999
$50,000 to$74,999
A B C D E F G H
All businesses 17 253 143.......................................... 14.2 9.8 9.0 14.8 10.6 11.0 8.31
Agricultural services, forestry, fishing, and mining 583 253.................. 13.7 9.1 9.9 14.7 12.2 10.1 7.52Construction 1 829 620.................................................. 13.4 11.4 12.9 20.9 10.5 12.0 5.73Manufacturing 517 714................................................. 14.1 6.8 7.5 15.9 9.5 12.5 9.94Transportation, communications, and utilities 698 903...................... 10.1 9.4 12.5 17.4 13.1 10.1 7.95Wholesale trade 538 339............................................... 11.2 5.3 7.2 13.8 12.1 12.8 12.36
Retail trade 2 478 045................................................... 20.9 11.3 9.9 17.5 9.3 8.0 7.37Finance, insurance, and real estate 1 941 029.............................. 5.7 5.0 5.8 8.6 11.0 12.3 11.28Services 7 784 016...................................................... 16.0 10.9 8.9 14.4 10.5 11.1 8.29Industries not classified 882 224......................................... 14.2 14.5 8.7 15.3 11.3 12.0 5.410
Hispanic ~owned businesses 771 708............................. 14.3 13.0 13.7 16.1 11.2 8.5 6.411
Agricultural services, forestry, fishing, and mining 32 927.................. 15.7 16.5 20.0 15.3 10.3 5.3 2.312Construction 97 476.................................................. 8.8 14.2 16.8 18.8 11.4 8.2 5.413Manufacturing 18 461................................................. 13.0 13.5 9.2 18.5 12.3 9.3 6.814Transportation, communications, and utilities 47 797...................... 9.9 9.9 13.8 16.8 14.6 11.1 7.815Wholesale trade 17 727............................................... 8.9 7.3 9.1 17.4 13.3 9.7 10.616
Retail trade 107 846................................................... 20.3 13.0 15.1 15.4 11.3 5.9 5.017Finance, insurance, and real estate 49 231.............................. 7.1 3.9 7.5 13.3 12.6 13.2 12.918Services 347 297...................................................... 15.5 14.8 13.7 15.9 10.2 8.7 6.119Industries not classified 52 945......................................... 19.4 15.0 13.2 16.8 11.6 5.2 4.220
Black ~owned businesses 620 912................................ 17.8 11.6 11.8 15.6 10.9 9.4 5.321
Agricultural services, forestry, fishing, and mining 10 309.................. 19.3 14.7 15.0 12.9 12.0 7.1 3.222Construction 43 381.................................................. 14.1 16.7 15.6 18.8 11.0 5.9 3.823Manufacturing 10 469................................................. 20.4 11.0 11.1 16.6 12.0 7.5 4.924Transportation, communications, and utilities 49 095..................... 13.9 12.8 15.4 14.3 11.6 7.7 7.525Wholesale trade 7 550............................................... 16.0 7.8 9.8 15.8 13.4 12.5 8.626
Retail trade 86 840................................................... 23.7 10.1 10.6 16.4 12.4 9.0 3.127Finance, insurance, and real estate 40 924.............................. 10.0 6.7 9.1 19.6 12.7 14.8 7.828Services 332 981...................................................... 18.1 11.7 11.4 15.0 10.1 9.8 5.529Industries not classified 39 363......................................... 18.5 12.2 10.9 14.3 9.7 8.8 4.430
Other minority ~owned businesses 606 426....................... 11.4 9.0 9.8 15.9 11.7 11.3 9.831
Agricultural services, forestry, fishing, and mining 15 218.................. 11.5 11.7 17.7 19.4 11.3 8.7 3.532Construction 28 295.................................................. 7.2 8.6 12.7 18.8 13.4 13.6 9.133Manufacturing 18 976................................................. 18.8 8.5 6.8 13.2 13.3 14.1 8.134Transportation, communications, and utilities 24 362...................... 9.9 13.7 10.0 24.1 9.9 9.7 7.235Wholesale trade 20 043............................................... 12.1 6.6 7.5 13.2 11.2 14.8 12.836
Retail trade 132 483................................................... 11.1 11.0 16.5 19.9 15.3 10.8 5.837Finance, insurance, and real estate 64 762.............................. 8.8 3.6 3.3 10.2 10.9 13.2 18.838Services 273 774...................................................... 11.6 9.5 8.3 14.9 10.1 10.6 9.239Industries not classified 28 512......................................... 20.1 11.9 10.8 20.6 11.2 8.2 5.840
Women ~owned businesses 5 888 883.............................. 21.0 12.2 9.9 14.3 10.4 9.8 5.841
Agricultural services, forestry, fishing, and mining 119 731.................. 19.0 8.0 7.7 17.8 13.2 6.6 4.942Construction 183 695.................................................. 15.5 8.1 9.1 20.1 13.1 11.8 7.143Manufacturing 152 346................................................. 20.7 8.2 9.2 13.0 11.5 12.3 6.644Transportation, communications, and utilities 141 623...................... 16.3 10.0 8.4 19.3 14.0 8.7 6.545Wholesale trade 154 542............................................... 19.1 6.1 9.6 13.1 11.3 13.1 10.446
Retail trade 1 093 342................................................... 28.3 13.4 10.0 14.2 8.3 8.0 4.347Finance, insurance, and real estate 602 802.............................. 8.6 7.3 8.5 13.1 16.0 11.8 11.248Services 3 158 444...................................................... 22.6 14.2 10.7 13.8 9.3 9.6 4.649Industries not classified 282 358......................................... 19.5 13.6 8.7 16.2 8.2 10.2 4.350
Nonminority male ~owned businesses 10 114 456.................... 10.8 8.4 8.0 14.9 10.6 11.9 9.751
Agricultural services, forestry, fishing, and mining 412 917.................. 12.1 8.7 9.4 13.5 12.2 11.6 8.952Construction 1 496 056.................................................. 13.5 11.5 13.0 21.3 10.1 12.3 5.653Manufacturing 333 485................................................. 10.9 5.9 6.6 17.2 8.2 12.7 11.654Transportation, communications, and utilities 458 400...................... 8.0 8.5 13.4 16.7 13.1 10.7 8.555Wholesale trade 352 721............................................... 7.8 4.8 6.0 13.8 12.4 12.7 13.156
Retail trade 1 197 943................................................... 15.6 9.4 8.7 20.4 9.5 7.8 10.257Finance, insurance, and real estate 1 240 594.............................. 4.3 4.2 4.6 6.3 9.0 12.5 10.758Services 4 102 294...................................................... 11.7 8.6 7.2 14.7 11.3 12.4 10.859Industries not classified 520 046......................................... 10.6 15.2 8.1 14.6 12.9 13.9 6.060
1Data represent percentage of owners reporting in the designated categories.2For explanation of relative standard errors and standard errors, see Reliability of Estimates in the introductory text.3Relative standard errors are not applicable for lines 1 through 10 since these data are the result of censuses, not surveys.
158 CHARACTERISTICS OF BUSINESS OWNERS 1992 ECONOMIC CENSUS

Owner’s total personal income1mCon.
Standard error of estimate2 for columnm$75,000 to
$99,999$100,000 to
$149,999$150,000
or moreNot
reported
Relativestandard
error ofestimate2 3
I J K L A B C D E F G H I J K L
3.8 3.7 5.3 9.5 (X) .2 .5 .4 .6 .4 .5 .3 .2 .3 .3 .4 1
5.4 3.1 4.7 9.6 (X) 2.1 1.7 1.7 1.9 1.9 .6 1.5 1.3 .9 1.0 1.0 22.3 1.4 2.2 7.3 (X) 1.7 1.3 .9 2.0 1.6 1.7 .7 .6 .4 .3 .9 34.6 4.4 6.5 8.4 (X) .9 1.1 1.1 2.0 .9 1.4 1.3 .5 .4 .5 1.1 42.8 1.7 3.4 11.7 (X) 1.5 1.6 1.8 1.8 1.9 1.3 1.6 .5 .3 .6 1.5 54.7 5.0 7.6 8.1 (X) 1.2 .8 1.2 1.4 1.0 1.1 1.0 .4 .3 .8 1.2 6
2.0 1.5 2.7 9.6 (X) 1.6 1.1 .8 .9 .7 .7 .7 .3 .1 .3 .9 77.5 8.6 14.7 9.6 (X) .5 1.0 1.4 1.2 1.5 1.3 .9 1.0 1.4 1.6 1.1 83.5 3.4 3.7 9.4 (X) .8 .9 .6 .9 .9 .7 .6 .2 .3 .4 .7 91.5 1.6 1.2 14.2 (X) 2.0 2.3 1.3 2.0 1.6 2.6 1.2 .5 .6 .5 2.2 10
2.7 2.0 2.8 9.2 – .9 .7 .6 .6 .4 .6 .3 .2 .1 .2 .4 11
.6 .7 1.9 11.5 1.0 1.8 2.2 2.2 2.3 1.9 1.2 .4 .3 .2 .5 3.0 122.1 1.3 .8 12.2 1.0 2.0 1.7 2.7 2.8 .7 1.3 1.6 .5 .4 .2 1.4 132.6 3.1 5.6 6.1 1.0 2.1 2.0 1.1 .9 2.4 1.6 1.2 .8 .6 .9 .9 143.1 1.5 1.8 9.8 1.0 1.3 1.9 2.5 2.4 1.4 1.6 1.5 .8 .4 .6 1.8 154.9 4.2 6.1 8.5 2.0 1.3 1.1 1.8 1.4 1.9 1.0 2.1 .8 .7 1.3 .8 16
1.7 1.2 2.3 8.8 1.0 1.6 2.5 2.3 1.6 .9 1.0 .8 .5 .2 .5 .4 176.1 5.3 8.9 9.2 1.0 1.3 1.3 1.5 1.1 1.2 1.7 1.0 1.2 1.1 .8 1.6 182.8 2.0 2.3 8.1 – 1.5 1.2 1.0 1.1 .9 .9 .7 .2 .2 .2 .8 19.5 1.0 .8 12.4 1.0 2.9 1.7 2.0 2.2 2.4 1.4 .8 .3 .4 .3 2.5 20
1.9 1.0 1.4 13.3 – .6 .6 .5 .7 .4 .4 .2 .2 .1 .2 .6 21
1.3 .4 1.1 13.1 1.0 1.7 2.1 1.7 1.4 2.0 .8 .8 .6 .3 .5 1.8 221.6 .3 .7 11.6 – 1.5 1.4 1.1 1.9 1.2 .6 .8 .3 .1 .2 1.1 23.8 .8 1.4 13.3 1.0 1.2 1.1 1.4 1.9 1.5 1.5 1.1 .2 .3 .5 1.5 24
1.4 .8 .7 13.8 – 1.4 1.3 1.1 .9 1.3 1.3 1.0 .3 .2 .3 1.9 254.6 2.7 1.3 7.5 2.0 1.8 1.0 1.2 2.1 1.3 2.4 1.9 1.1 1.0 .1 1.0 26
2.0 .4 .3 11.9 – 1.4 1.3 1.4 1.3 1.6 .7 .6 .4 .1 .1 1.1 273.4 1.6 4.4 9.8 1.0 1.2 1.0 1.1 1.6 1.3 1.4 .9 .6 .2 .9 1.0 281.9 1.2 1.7 13.5 – .7 1.0 1.0 1.1 .4 .8 .4 .3 .2 .4 1.2 291.0 .7 – 19.6 – 1.7 1.7 1.4 2.1 1.3 .9 .8 .4 .3 – 2.1 30
4.2 4.0 4.7 8.2 – .9 .5 .5 .9 .4 .7 1.2 .3 .4 .2 .7 31
2.2 1.1 1.7 11.3 1.0 2.7 1.7 2.7 2.4 2.3 1.9 .9 .5 .4 .6 2.1 322.6 1.9 3.3 8.8 1.0 2.4 1.6 2.0 2.5 1.7 2.4 2.2 .5 .6 1.2 2.4 333.6 3.7 4.3 5.7 1.0 2.4 1.7 1.8 2.7 1.7 2.2 1.6 .7 .7 .6 1.1 341.9 1.4 2.5 9.8 1.0 2.4 4.3 2.3 3.8 1.5 2.6 2.6 .6 .4 1.5 3.0 355.8 4.0 5.1 7.0 1.0 2.2 1.7 1.3 1.9 2.3 1.8 2.1 .9 .4 .6 1.5 36
1.6 1.3 1.4 5.4 1.0 1.6 1.7 1.3 2.8 1.8 1.5 1.1 .3 .2 .2 1.1 376.8 7.1 8.6 8.6 1.0 2.0 1.4 .9 1.4 1.9 1.7 4.0 1.3 1.5 1.1 1.6 384.9 5.3 5.7 9.8 – 1.0 1.2 1.1 1.5 1.5 1.1 1.8 .7 .8 .5 .9 394.6 .2 1.1 5.6 1.0 2.2 2.6 1.3 3.6 2.0 2.0 1.8 2.1 .1 .5 1.4 40
2.0 1.9 2.6 10.0 – .4 .7 .5 .4 .5 .6 .5 .1 .2 .4 .8 41
3.8 1.7 5.5 11.8 – 2.3 1.6 1.7 3.0 1.1 1.0 .5 .8 .7 1.4 1.4 422.0 1.7 2.0 9.6 – 1.7 1.3 1.4 1.9 .8 1.5 .9 .4 .3 .3 1.5 433.7 3.4 4.9 6.5 – 1.7 1.7 1.3 1.9 1.4 1.8 1.1 .7 .7 .6 1.0 443.8 1.3 2.4 9.3 – 1.8 1.9 1.5 1.3 2.1 1.9 1.3 .9 .3 .6 1.4 453.5 3.1 3.6 7.0 – 2.4 1.2 1.4 1.4 2.0 1.2 1.3 .4 .5 .2 1.4 46
1.4 .7 1.3 10.2 – 2.3 1.2 1.6 1.3 .8 1.4 .9 .3 .1 .2 2.0 472.9 3.5 6.8 10.3 – 1.1 1.9 1.3 2.5 2.3 1.9 1.8 .5 .9 1.4 2.6 481.8 1.9 1.9 9.6 – 1.1 1.1 .4 1.0 .8 .9 .7 .2 .5 .6 .6 491.5 .4 1.0 16.3 – 1.0 2.4 1.5 3.0 1.4 2.2 1.6 .8 .1 .7 2.3 50
4.9 4.8 7.0 9.2 – .3 .8 .5 1.0 .7 .8 .6 .3 .5 .5 .6 51
6.4 3.7 4.8 8.8 – 2.7 2.1 2.5 2.1 2.5 .9 2.1 1.9 1.2 1.3 1.4 522.3 1.4 2.4 6.5 – 2.3 1.5 1.1 2.3 2.1 2.1 .8 .7 .5 .3 1.1 535.2 5.0 7.4 9.4 – 1.7 1.7 1.5 2.9 1.2 1.9 1.7 .7 .5 .9 1.9 542.5 1.9 4.2 12.5 – 2.2 2.1 2.5 2.6 2.8 2.0 2.4 .5 .6 .9 2.1 555.1 5.9 9.6 8.7 – 1.5 1.4 1.9 1.7 1.3 1.6 1.5 .5 .5 1.2 1.4 56
2.7 2.1 4.2 9.4 – 2.8 2.1 1.3 2.5 1.3 1.0 1.4 .4 .3 .6 1.6 579.4 10.9 18.5 9.4 – .8 1.7 1.9 1.5 1.9 2.0 1.0 1.4 2.1 2.2 1.2 584.7 4.4 5.0 9.2 – 1.0 1.7 .9 1.6 1.2 1.2 1.1 .4 .7 .4 1.3 591.6 2.3 1.5 13.4 – 2.9 3.6 2.1 2.6 2.4 4.0 1.8 1.3 .9 .8 4.2 60
1992 ECONOMIC CENSUS CHARACTERISTICS OF BUSINESS OWNERS 159

Table 19b. Total Personal Income of Owner by Receipts Size of Firm: 1992[All data are shown as percents, except firms. For meaning of abbreviations and symbols, see introductory text. For explanation of terms, see appendix A]
Type of firm and receipts size
Owner’s total personal income1
Firms(number)
Under$5,000
$5,000 to$9,999
$10,000 to$14,999
$15,000 to$24,999
$25,000 to$34,999
$35,000 to$49,999
$50,000 to$74,999
A B C D E F G H
All businesses 17 253 143.......................................... 14.2 9.8 9.0 14.8 10.6 11.0 8.31
Less than $5,000 5 226 553.............................................. 28.1 8.5 6.2 12.9 10.0 11.4 6.52$5,000 to $9,999 2 443 946.............................................. 18.8 22.0 8.8 11.6 10.2 9.0 4.13$10,000 to $24,999 3 076 410............................................ 11.3 14.4 18.9 20.6 9.0 7.5 6.14$25,000 to $49,999 1 945 806............................................ 9.5 9.6 8.3 17.5 12.2 15.5 7.45$50,000 to $99,999 1 615 940............................................ 6.2 7.3 10.1 15.8 12.6 12.6 12.96
$100,000 to $199,999 1 197 996.......................................... 5.1 4.4 8.8 18.6 12.0 11.4 11.27$200,000 to $249,999 301 794.......................................... 5.7 3.8 5.5 19.6 12.5 6.5 11.98$250,000 to $499,999 682 583.......................................... 4.1 2.9 4.9 11.7 13.5 14.0 13.29$500,000 to $999,999 372 078.......................................... 2.7 2.1 4.1 8.6 9.6 11.4 13.310$1,000,000 or more 390 037............................................ 2.5 1.1 1.5 4.5 6.2 8.7 13.011
Hispanic ~owned businesses 771 708............................. 14.3 13.0 13.7 16.1 11.2 8.5 6.412
Less than $5,000 219 226.............................................. 30.6 10.5 8.1 14.4 11.5 7.4 3.313$5,000 to $9,999 140 362.............................................. 17.1 30.9 15.7 9.4 6.7 5.5 3.214$10,000 to $24,999 165 667............................................ 11.8 17.1 22.7 18.4 7.9 6.5 4.215$25,000 to $49,999 87 288............................................ 8.0 11.2 15.6 23.3 15.7 9.6 5.516$50,000 to $99,999 64 742............................................ 7.7 8.1 14.3 18.3 12.4 10.2 11.917
$100,000 to $199,999 41 578.......................................... 7.0 5.2 12.8 18.0 14.7 11.0 10.718$200,000 to $249,999 10 030.......................................... 7.2 5.5 10.4 16.0 12.1 7.9 9.619$250,000 to $499,999 22 301.......................................... 4.0 5.0 7.3 16.3 15.9 13.5 10.320$500,000 to $999,999 11 319.......................................... 2.7 2.6 5.9 12.9 13.5 15.2 12.521$1,000,000 or more 9 194............................................ 2.2 1.3 1.7 4.6 8.1 9.8 16.722
Black ~owned businesses 620 912................................ 17.8 11.6 11.8 15.6 10.9 9.4 5.323
Less than $5,000 236 722.............................................. 27.0 9.0 7.0 13.9 12.1 9.9 4.424$5,000 to $9,999 111 512.............................................. 20.9 18.1 10.7 11.2 10.1 8.0 4.525$10,000 to $24,999 129 901............................................ 11.0 14.2 21.6 19.0 7.5 8.5 3.626$25,000 to $49,999 62 209............................................ 10.0 10.0 12.7 22.0 14.7 9.5 6.427$50,000 to $99,999 39 218............................................ 9.3 9.8 10.5 17.2 11.3 12.3 10.828
$100,000 to $199,999 20 936.......................................... 6.3 6.4 11.0 16.6 11.7 10.2 6.829$200,000 to $249,999 4 533.......................................... 9.8 5.9 4.5 16.7 10.8 10.6 4.830$250,000 to $499,999 9 029.......................................... 5.6 5.0 6.7 16.1 13.3 9.9 10.131$500,000 to $999,999 3 823.......................................... 3.6 4.3 4.7 11.4 8.9 13.2 17.932$1,000,000 or more 3 028............................................ 1.8 .6 1.7 6.1 6.8 10.4 16.133
Other minority ~owned businesses 606 426....................... 11.4 9.0 9.8 15.9 11.7 11.3 9.834
Less than $5,000 132 493.............................................. 27.0 8.2 5.8 10.6 11.3 12.5 11.835$5,000 to $9,999 80 435.............................................. 16.0 21.4 11.0 14.2 9.3 5.7 8.636$10,000 to $24,999 108 195............................................ 10.4 12.6 17.3 16.9 8.9 8.0 6.837$25,000 to $49,999 77 345............................................ 9.2 8.9 9.3 25.5 12.3 11.1 10.238$50,000 to $99,999 70 360............................................ 8.3 10.5 14.0 15.3 14.9 12.7 9.739
$100,000 to $199,999 58 620.......................................... 7.9 6.6 9.7 19.8 12.4 13.6 6.340$200,000 to $249,999 15 740.......................................... 4.3 2.4 10.7 16.6 14.9 9.9 9.941$250,000 to $499,999 34 266.......................................... 4.6 3.5 7.3 15.7 13.2 14.7 11.842$500,000 to $999,999 16 467.......................................... 2.6 2.3 3.4 10.5 12.8 13.4 12.543$1,000,000 or more 12 505............................................ 2.4 1.3 1.8 5.5 8.1 11.2 14.144
Women ~owned businesses 5 888 883.............................. 21.0 12.2 9.9 14.3 10.4 9.8 5.845
Less than $5,000 2 310 303.............................................. 33.6 9.1 7.5 11.5 10.2 10.2 3.346$5,000 to $9,999 967 380.............................................. 25.5 23.6 9.3 10.1 9.1 7.3 2.747$10,000 to $24,999 1 051 358............................................ 13.6 16.2 19.8 18.2 8.1 6.8 5.448$25,000 to $49,999 538 885............................................ 15.7 12.8 7.0 18.5 13.0 12.1 5.649$50,000 to $99,999 381 517............................................ 11.8 8.0 8.4 16.0 10.7 11.9 11.650
$100,000 to $199,999 267 089.......................................... 8.9 8.4 8.8 20.7 13.2 10.4 8.951$200,000 to $249,999 66 464.......................................... 11.0 3.6 7.2 23.3 13.9 9.0 8.852$250,000 to $499,999 146 313.......................................... 7.1 5.3 8.2 14.7 16.7 13.7 12.753$500,000 to $999,999 80 539.......................................... 4.6 3.6 5.6 11.2 12.3 16.5 13.854$1,000,000 or more 79 037............................................ 4.2 2.2 3.2 7.4 7.7 10.5 14.055
Nonminority male ~owned businesses 10 114 456.................... 10.8 8.4 8.0 14.9 10.6 11.9 9.756
Less than $5,000 2 608 047.............................................. 24.0 7.8 5.0 13.9 9.7 12.4 9.057$5,000 to $9,999 1 285 456.............................................. 14.4 20.6 7.7 12.8 11.4 10.7 4.958$10,000 to $24,999 1 763 830............................................ 10.0 13.2 17.6 22.5 10.0 7.9 6.659$25,000 to $49,999 1 248 482............................................ 7.0 8.4 8.2 16.1 11.3 17.8 8.360$50,000 to $99,999 1 108 065............................................ 4.2 6.9 10.2 15.6 13.1 13.0 13.661
$100,000 to $199,999 840 723.......................................... 3.6 2.9 8.5 17.9 11.4 11.6 12.462$200,000 to $249,999 212 693.......................................... 3.7 3.9 4.1 18.4 12.1 5.0 13.763$250,000 to $499,999 488 462.......................................... 3.2 1.9 3.5 10.3 12.4 14.0 13.564$500,000 to $999,999 266 408.......................................... 2.1 1.6 3.6 7.6 8.4 9.5 13.365$1,000,000 or more 292 290............................................ 2.1 .8 1.1 3.7 5.7 8.1 12.766
1Data represent percentage of owners reporting in the designated categories.2For explanation of relative standard errors and standard errors, see Reliability of Estimates in the introductory text.3Relative standard errors are not applicable for lines 1 through 11 since these data are the result of censuses, not surveys.
160 CHARACTERISTICS OF BUSINESS OWNERS 1992 ECONOMIC CENSUS

Owner’s total personal income1mCon.
Standard error of estimate2 for columnm$75,000 to
$99,999$100,000 to
$149,999$150,000
or moreNot
reported
Relativestandard
error ofestimate2 3
I J K L A B C D E F G H I J K L
3.8 3.7 5.3 9.5 (X) .2 .5 .4 .6 .4 .5 .3 .2 .3 .3 .4 1
1.5 1.3 1.5 12.0 (X) 1.0 .7 .5 1.1 .7 1.2 .6 .4 .5 .6 1.0 21.5 1.9 1.0 11.1 (X) 1.6 3.1 1.1 1.7 2.2 1.5 .5 .5 .7 .4 1.7 31.9 1.1 1.9 7.3 (X) 1.3 2.1 1.1 2.1 1.0 1.1 1.1 .5 .5 .6 .9 43.5 3.5 3.0 10.1 (X) .9 1.5 1.2 1.9 1.3 1.5 1.1 1.2 1.3 1.1 1.6 56.4 3.8 5.4 6.8 (X) .9 1.1 1.2 1.0 1.0 1.5 1.2 .9 .6 1.0 .7 6
6.2 7.0 7.4 7.8 (X) .5 .4 1.0 1.2 .9 .9 1.2 .7 .7 .6 .8 710.4 7.8 9.5 6.8 (X) 1.6 1.3 1.1 2.8 2.7 1.4 2.8 4.8 1.4 2.9 1.5 8
7.7 7.9 10.8 9.2 (X) .3 .3 .3 .9 1.0 1.2 .6 .6 .7 1.1 1.1 99.5 9.8 20.3 8.6 (X) .2 .2 .4 .6 .3 .7 .9 .7 .7 1.4 .9 109.1 13.1 32.3 8.0 (X) .3 .1 .2 .3 .2 .3 .5 .2 .3 .9 .3 11
2.7 2.0 2.8 9.2 – .9 .7 .6 .6 .4 .6 .3 .2 .1 .2 .4 12
.9 .3 .9 12.1 1.0 1.9 2.0 1.2 1.7 1.3 1.4 .8 .4 .2 .3 1.7 131.1 .2 .1 10.1 1.0 2.6 2.5 1.8 1.9 1.4 1.3 1.0 .6 .2 .1 1.1 141.0 .7 .5 9.3 1.0 1.7 2.6 1.8 1.1 1.1 1.4 1.3 .4 .3 .2 1.2 152.5 .8 1.0 6.8 1.0 1.9 1.9 2.3 1.9 1.8 1.1 1.7 .7 .3 .4 1.4 163.4 3.2 2.2 8.2 1.0 1.6 2.0 1.4 1.7 1.4 1.2 1.3 .8 .7 .6 1.2 17
5.5 4.2 3.8 7.1 1.0 1.0 .9 1.6 1.9 .8 1.5 1.6 1.7 .7 .9 1.4 188.7 7.1 6.8 8.8 3.0 1.9 1.6 2.8 2.8 3.1 2.1 2.2 2.0 2.6 1.2 2.0 196.4 4.9 8.9 7.6 2.0 1.0 .8 1.0 1.3 1.7 1.8 1.2 1.1 .8 1.1 .8 204.8 7.4 13.2 9.1 3.0 .4 .6 1.4 1.9 1.2 2.1 1.6 .5 1.0 1.7 1.7 21
11.1 11.9 26.1 6.6 2.0 .3 .3 .7 .9 .6 .8 1.1 .8 .9 1.8 .6 22
1.9 1.0 1.4 13.3 – .6 .6 .5 .7 .4 .4 .2 .2 .1 .2 .6 23
1.2 .2 .3 14.9 – 1.1 .7 .9 1.6 .6 .8 .7 .3 .1 .2 1.1 241.2 .3 .1 14.9 – 1.5 1.6 .8 1.0 1.7 1.2 1.0 .4 .2 .1 .9 251.0 .4 .7 12.5 – .9 .9 1.3 1.4 .7 .7 .7 .3 .2 .3 .8 262.9 .6 1.4 9.7 – 1.3 1.7 1.1 1.8 1.6 1.7 1.2 .8 .4 .6 2.3 273.0 2.9 1.2 11.7 1.0 1.5 1.4 1.5 1.6 1.0 1.5 1.6 .7 .8 .5 1.3 28
7.4 6.5 6.6 10.3 1.0 .9 1.6 1.7 1.4 1.0 1.6 .9 .4 1.1 2.2 1.2 295.7 7.3 10.1 13.8 3.0 2.4 2.1 1.1 2.7 2.8 2.7 1.6 2.7 1.7 2.9 4.5 305.7 6.7 12.5 8.5 3.0 1.2 .7 1.3 1.6 1.7 1.6 1.5 1.4 1.0 1.6 1.4 316.7 4.3 16.4 8.5 4.0 .8 1.1 .9 2.2 2.4 1.8 2.7 1.5 1.2 2.7 2.4 32
10.5 9.0 29.1 7.8 4.0 .3 .3 .6 .6 .8 1.8 1.4 1.8 1.0 2.4 .8 33
4.2 4.0 4.7 8.2 – .9 .5 .5 .9 .4 .7 1.2 .3 .4 .2 .7 34
.5 1.6 1.3 9.5 1.0 2.6 2.2 1.4 1.8 1.9 1.8 2.8 .3 .7 .7 2.0 353.4 1.4 .3 8.7 1.0 2.4 4.5 3.0 2.6 1.7 2.1 2.3 1.2 1.1 .5 2.4 366.5 2.8 .4 9.5 1.0 1.7 3.0 2.9 3.1 1.8 2.2 2.8 1.6 1.0 .3 2.2 372.0 2.6 1.5 7.4 1.0 2.2 2.2 1.2 5.9 1.8 2.3 2.4 1.2 .9 .7 2.2 384.7 1.2 2.9 5.9 1.0 2.6 2.6 1.5 1.9 1.5 2.1 2.4 .9 .6 .5 1.2 39
4.5 6.3 4.5 8.3 1.0 1.4 1.0 1.2 1.4 2.1 1.8 1.2 .7 .7 .6 1.7 404.0 8.0 11.9 7.4 2.0 1.6 .8 3.2 3.0 3.0 2.2 3.0 1.7 1.4 2.8 .9 415.7 7.4 10.3 5.8 1.0 .7 .5 1.1 1.6 1.2 1.6 .9 .8 1.3 1.2 .9 428.6 9.0 14.6 10.3 2.0 .5 .7 .6 1.2 1.2 1.3 1.3 .7 1.1 1.4 1.8 438.9 12.3 23.7 10.6 2.0 .7 .3 .5 .6 .7 1.3 1.1 .8 1.3 2.0 .6 44
2.0 1.9 2.6 10.0 – .4 .7 .5 .4 .5 .6 .5 .1 .2 .4 .8 45
.6 .9 .9 12.1 – 1.6 .8 .9 1.2 1.5 1.1 .8 .2 .4 .4 1.6 461.3 .5 .7 10.0 – 2.3 3.0 .9 1.2 1.9 1.0 .8 .5 .4 .4 2.2 471.2 1.0 1.1 8.5 – 1.4 2.0 1.7 2.3 1.5 1.3 1.5 .4 .5 .4 1.2 481.3 2.1 2.5 9.5 – 1.8 3.1 1.6 2.6 2.2 3.2 1.8 .5 1.5 1.6 2.5 494.0 3.8 3.7 10.1 – 1.4 .7 .9 1.8 1.6 1.0 1.4 .8 1.4 .9 1.9 50
4.5 3.6 5.1 7.5 – .9 1.5 .8 2.0 1.3 1.5 1.2 1.3 .8 1.0 1.1 514.9 3.3 8.1 6.9 1.0 2.5 .8 2.2 3.1 3.1 1.8 3.0 1.9 1.9 2.1 1.1 525.8 3.4 5.6 6.9 1.0 .6 .8 1.0 .7 1.6 .9 .9 .9 .5 .6 .5 537.5 7.1 10.5 7.3 1.0 .8 .6 .4 .8 .8 1.5 1.5 1.1 .9 1.3 .9 549.5 9.9 22.5 8.9 1.0 .5 .2 .4 .6 .4 .3 .6 .6 .7 1.0 .5 55
4.9 4.8 7.0 9.2 – .3 .8 .5 1.0 .7 .8 .6 .3 .5 .5 .6 56
2.3 1.7 2.1 11.9 – 2.5 1.2 .7 1.5 1.0 1.7 1.0 .8 1.0 1.1 1.4 571.5 3.0 1.3 11.7 – 2.7 5.0 1.9 2.9 3.8 2.6 1.2 1.1 1.1 .7 3.1 582.3 1.3 2.7 6.0 – 1.9 2.8 1.5 3.4 2.1 1.9 1.9 .8 1.1 1.2 1.5 594.5 4.4 3.4 10.6 – 1.5 1.5 1.5 3.3 1.8 1.8 1.8 1.9 2.0 1.2 2.2 607.5 4.0 6.4 5.5 – 1.1 1.9 1.8 1.4 1.6 2.0 1.8 1.1 .9 1.6 .8 61
6.8 8.4 8.5 8.0 – .6 .4 1.3 1.6 1.0 .9 1.9 1.0 1.0 1.0 1.1 6213.1 9.5 9.9 6.5 – 1.8 2.0 1.5 4.2 4.0 2.0 4.3 5.7 2.5 4.8 2.1 63
8.6 9.6 12.6 10.4 – .4 .4 .3 1.4 1.4 1.7 .8 .7 1.2 1.5 1.6 6410.4 10.7 24.0 8.8 – .4 .3 .5 .9 .4 .8 1.0 1.1 1.0 2.0 1.3 65
9.1 13.9 35.2 7.7 – .4 .1 .2 .4 .4 .4 .7 .3 .3 1.2 .4 66
1992 ECONOMIC CENSUS CHARACTERISTICS OF BUSINESS OWNERS 161

Table 19c. Total Personal Income of Owner by Employment Size of Firm: 1992[All data are shown as percents, except firms. For meaning of abbreviations and symbols, see introductory text. For explanation of terms, see appendix A]
Type of firm and employment size
Owner’s total personal income1
Firms(number)
Under$5,000
$5,000 to$9,999
$10,000 to$14,999
$15,000 to$24,999
$25,000 to$34,999
$35,000 to$49,999
$50,000 to$74,999
A B C D E F G H
All businesses 17 253 143.......................................... 14.2 9.8 9.0 14.8 10.6 11.0 8.31
With no paid employees 14 118 184........................................ 17.0 11.1 9.4 14.9 10.3 10.5 7.22With paid employees 3 134 959........................................... 5.0 5.3 7.5 14.3 11.8 12.6 11.93
No employees4 435 838.............................................. 7.4 12.4 14.1 16.0 11.9 14.5 6.941 to 4 employees 1 716 076............................................ 6.0 5.6 9.0 17.9 12.8 13.5 11.555 to 9 employees 503 808............................................ 3.8 4.1 5.6 13.3 12.5 11.3 14.5610 to 19 employees 256 110.......................................... 3.0 3.3 4.2 9.9 11.9 12.9 12.6720 to 49 employees 144 734.......................................... 2.4 1.2 2.0 4.8 7.8 9.9 15.8850 to 99 employees 45 331.......................................... 2.7 .4 .8 3.3 3.5 8.2 11.89100 employees or more 33 062...................................... 3.7 .8 .4 2.9 3.0 6.3 7.010
Hispanic ~owned businesses 771 708............................. 14.3 13.0 13.7 16.1 11.2 8.5 6.411
With no paid employees 656 343........................................ 16.6 14.9 14.6 16.3 10.8 7.5 5.212With paid employees 115 364........................................... 6.7 6.9 10.8 15.6 12.7 11.6 10.413
No employees4 19 569.............................................. 6.8 12.2 14.9 17.7 9.3 10.3 11.4141 to 4 employees 64 631............................................ 8.9 7.1 12.5 17.5 12.8 11.0 8.6155 to 9 employees 16 937............................................ 4.1 5.3 8.3 13.9 15.2 16.3 11.11610 to 19 employees 8 553.......................................... 2.8 4.8 5.3 12.9 16.5 9.6 12.51720 to 49 employees 4 050.......................................... 3.0 2.6 6.5 7.7 11.6 12.7 14.21850 to 99 employees 948.......................................... 2.3 .5 .6 2.1 2.6 8.2 23.419100 employees or more 676...................................... 1.2 (D) (D) 10.8 2.4 4.7 12.920
Black ~owned businesses 620 912................................ 17.8 11.6 11.8 15.6 10.9 9.4 5.321
With no paid employees 556 434........................................ 19.2 12.1 11.9 15.4 10.7 9.1 4.922With paid employees 64 478........................................... 8.1 8.1 10.5 17.6 12.1 12.0 7.723
No employees4 13 725.............................................. 13.7 12.1 15.8 15.3 11.0 9.7 4.3241 to 4 employees 37 587............................................ 7.7 7.4 10.8 20.4 12.2 12.0 6.7255 to 9 employees 7 853............................................ 5.6 8.9 7.3 13.5 13.5 15.3 10.22610 to 19 employees 2 839.......................................... 5.7 2.9 5.8 13.9 13.7 11.9 12.12720 to 49 employees 1 700.......................................... 1.6 4.3 1.7 8.5 10.1 13.4 22.82850 to 99 employees 432.......................................... (D) – (D) 7.1 9.2 12.5 17.929100 employees or more 342...................................... 1.6 3.7 – 3.7 5.9 3.5 17.430
Other minority ~owned businesses 606 426....................... 11.4 9.0 9.8 15.9 11.7 11.3 9.831
With no paid employees 470 075........................................ 14.1 11.0 10.7 16.4 10.9 10.2 9.632With paid employees 136 351........................................... 5.8 5.0 7.9 15.0 13.4 13.5 10.233
No employees4 19 989.............................................. 8.3 6.5 7.0 13.2 20.3 15.0 8.2341 to 4 employees 76 636............................................ 6.7 6.0 8.6 15.8 12.1 14.9 9.6355 to 9 employees 22 862............................................ 4.5 4.0 8.2 17.6 14.5 11.4 9.63610 to 19 employees 10 051.......................................... 3.5 3.7 9.5 14.4 12.7 12.4 13.03720 to 49 employees 5 034.......................................... 2.9 1.6 2.8 11.1 13.2 10.1 14.33850 to 99 employees 1 075.......................................... 1.5 .4 1.2 1.9 3.4 14.9 10.339100 employees or more 705...................................... 1.6 (D) (D) .7 2.6 5.0 12.940
Women ~owned businesses 5 888 883.............................. 21.0 12.2 9.9 14.3 10.4 9.8 5.841
With no paid employees 5 071 110........................................ 24.0 13.1 10.1 13.7 9.8 9.1 4.842With paid employees 817 773........................................... 8.9 8.6 9.0 16.7 12.9 12.7 10.143
No employees4 127 905.............................................. 14.3 16.5 10.1 12.5 11.2 13.2 8.2441 to 4 employees 435 550............................................ 9.6 9.6 10.2 19.0 13.5 12.9 8.3455 to 9 employees 134 476............................................ 8.2 6.3 10.5 16.8 14.0 11.9 10.74610 to 19 employees 67 487.......................................... 4.6 4.2 4.7 17.7 14.0 14.5 13.24720 to 49 employees 35 515.......................................... 4.3 2.2 4.2 9.8 9.9 12.2 19.34850 to 99 employees 10 178.......................................... 2.8 1.5 2.6 4.1 4.5 8.5 17.149100 employees or more 6 663...................................... 5.2 3.0 1.8 7.5 5.1 7.6 9.050
Nonminority male ~owned businesses 10 114 456.................... 10.8 8.4 8.0 14.9 10.6 11.9 9.751
With no paid employees 8 019 462........................................ 13.3 9.9 8.5 15.4 10.5 11.6 8.752With paid employees 2 094 993........................................... 3.3 3.9 6.6 13.3 11.1 12.6 12.953
No employees4 271 380.............................................. 3.5 11.2 16.1 17.7 11.6 16.0 5.7541 to 4 employees 1 155 800............................................ 4.3 3.8 8.3 17.6 12.6 13.8 13.2555 to 9 employees 334 483............................................ 1.8 3.3 3.3 11.5 11.7 10.6 16.75610 to 19 employees 173 140.......................................... 2.4 3.0 3.8 6.8 10.9 12.3 12.35720 to 49 employees 101 938.......................................... 1.8 .9 1.3 3.0 6.7 9.1 14.85850 to 99 employees 33 406.......................................... 2.7 .2 .4 3.2 3.3 7.8 10.559100 employees or more 24 846...................................... 3.4 .2 – 1.4 2.5 6.0 6.260
1Data represent percentage of owners reporting in the designated categories.2For explanation of relative standard errors and standard errors, see Reliability of Estimates in the introductory text.3Relative standard errors are not applicable for lines 1 through 10 since these data are the result of censuses, not surveys.4Firms reported annual payroll, but did not report any employees on their payroll during specified period in 1992.
162 CHARACTERISTICS OF BUSINESS OWNERS 1992 ECONOMIC CENSUS

Owner’s total personal income1mCon.
Standard error of estimate2 for columnm$75,000 to
$99,999$100,000 to
$149,999$150,000
or moreNot
reported
Relativestandard
error ofestimate2 3
I J K L A B C D E F G H I J K L
3.8 3.7 5.3 9.5 (X) .2 .5 .4 .6 .4 .5 .3 .2 .3 .3 .4 1
3.2 2.8 3.5 10.0 (X) .3 .7 .5 .8 .5 .6 .3 .3 .4 .4 .5 26.0 6.6 11.3 7.7 (X) .3 .5 .6 .6 .7 .7 .6 .1 .3 .4 .4 33.8 2.2 5.0 5.9 (X) 2.1 2.8 3.5 1.3 1.8 2.5 1.0 .7 .5 1.3 1.4 44.6 5.1 6.4 7.6 (X) .5 .7 .7 .9 1.0 1.6 1.1 .3 .6 .3 .5 58.4 7.1 10.4 8.9 (X) .4 1.2 .7 1.3 1.3 .8 1.2 .9 .5 .8 1.6 67.1 10.2 17.5 7.4 (X) .4 .8 .6 1.2 1.0 .8 .9 .5 .9 .8 .8 78.9 11.8 27.7 7.7 (X) .3 .3 .3 .5 .8 1.4 1.2 .8 .8 1.3 .6 89.7 14.0 36.1 9.5 (X) .8 .1 .2 .8 .7 1.0 1.1 1.2 1.5 2.2 2.1 97.4 13.0 48.1 7.4 (X) 1.5 .4 .1 .6 .4 1.6 1.1 .8 1.2 2.9 1.3 10
2.7 2.0 2.8 9.2 – .9 .7 .6 .6 .4 .6 .3 .2 .1 .2 .4 11
1.9 1.1 1.4 9.6 – 1.0 .9 .7 .6 .5 .7 .2 .2 .2 .2 .4 125.2 5.0 7.2 7.9 1.0 .7 .9 .8 1.1 .7 .9 .7 .4 .4 .5 .7 132.3 3.7 3.7 7.8 2.0 2.0 3.8 2.4 3.0 2.5 3.2 2.7 .7 1.7 1.0 1.6 144.8 4.0 4.4 8.3 1.0 1.3 1.3 1.3 1.7 1.3 1.4 1.0 .7 .4 .6 1.3 155.5 4.5 8.0 7.9 2.0 .7 1.4 1.8 2.5 1.4 2.2 1.2 .9 .9 1.2 1.0 167.6 9.4 11.2 7.4 3.0 .8 .8 1.3 3.0 2.0 1.4 2.1 2.3 1.4 1.2 1.2 17
10.4 8.6 16.9 5.7 4.0 1.0 1.5 3.5 1.4 2.6 1.7 2.6 2.0 1.5 1.9 1.6 186.1 9.3 37.7 7.2 6.0 .7 .4 .4 .9 .6 2.1 5.2 1.2 1.6 5.4 1.4 19
11.4 10.5 38.3 7.2 8.0 .8 (D) (D) 6.2 1.0 1.1 4.9 3.2 2.4 4.6 2.9 20
1.9 1.0 1.4 13.3 – .6 .6 .5 .7 .4 .4 .2 .2 .1 .2 .6 21
1.5 .7 .9 13.6 – .6 .6 .6 .8 .4 .5 .3 .2 .1 .3 .6 224.7 3.2 4.9 11.1 1.0 .7 1.1 1.1 1.3 1.0 .7 .5 .4 .3 .4 1.2 233.2 .3 2.5 12.1 2.0 2.6 2.7 3.5 5.9 2.1 1.9 1.7 1.1 .2 1.2 3.1 244.6 3.6 3.6 11.0 1.0 1.0 .9 1.7 1.9 1.7 1.4 1.1 .7 .7 .4 1.4 255.0 3.9 5.5 11.3 3.0 1.9 2.3 1.6 2.3 2.0 2.2 2.2 .8 .7 2.0 2.9 264.5 2.9 14.7 11.9 4.0 1.4 1.2 1.9 2.9 1.9 2.7 3.3 1.1 .8 3.0 3.6 279.8 6.5 14.2 7.1 6.0 1.1 1.3 .4 2.3 3.8 3.0 3.5 2.6 2.3 2.9 1.5 28
15.0 17.5 16.1 3.7 8.0 (D) – (D) 4.4 2.6 3.9 4.1 7.1 6.4 7.0 1.6 2917.0 9.6 28.9 8.6 – .6 2.3 – 1.9 2.2 2.1 4.5 5.5 3.3 4.1 2.2 30
4.2 4.0 4.7 8.2 – .9 .5 .5 .9 .4 .7 1.2 .3 .4 .2 .7 31
3.2 2.9 2.7 8.3 – 1.1 .9 .7 1.1 .6 .9 1.5 .4 .5 .2 1.0 326.2 6.4 8.6 7.9 1.0 .5 .5 .5 1.0 1.1 .9 .8 .6 .6 .6 1.0 338.9 5.3 3.8 3.5 2.0 3.2 1.7 2.3 4.3 4.0 3.2 1.5 3.0 2.0 1.1 .9 345.2 5.8 6.5 8.7 1.0 .9 .9 .9 1.2 1.5 1.8 1.4 .8 .6 1.0 1.7 356.7 5.4 10.4 7.8 2.0 1.1 .8 1.8 2.0 1.9 1.5 .9 .9 1.0 1.9 1.5 365.5 9.3 9.9 6.0 2.0 .8 1.8 2.2 1.3 1.4 1.4 1.4 .6 2.1 1.2 1.3 378.8 9.7 15.7 9.7 4.0 .7 .5 .7 2.4 3.0 1.5 1.0 1.2 1.2 1.7 1.6 385.8 11.9 32.4 16.3 6.0 .9 .2 .6 .6 .9 4.3 3.7 1.2 3.2 5.1 4.8 398.3 7.8 39.3 21.0 6.0 .8 (D) (D) .5 .7 2.0 4.7 2.9 2.1 6.1 5.6 40
2.0 1.9 2.6 10.0 – .4 .7 .5 .4 .5 .6 .5 .1 .2 .4 .8 41
1.4 1.4 1.8 10.9 – .6 .8 .7 .6 .7 .7 .6 .2 .3 .4 1.0 424.7 3.8 6.3 6.2 – .6 1.0 .6 1.1 .5 1.0 .5 .4 .5 .6 .5 433.4 2.2 3.2 5.2 1.0 3.4 4.1 2.3 3.2 2.2 3.5 1.6 1.3 1.0 1.5 1.3 443.7 2.7 4.2 6.2 – 1.2 1.4 1.3 1.6 .7 2.3 .9 .8 .8 .8 1.1 455.6 5.1 5.3 5.5 1.0 1.1 .8 1.0 1.3 1.0 1.7 1.1 .8 .8 .8 .7 466.5 5.3 8.3 7.1 1.0 .8 1.0 .7 2.5 1.5 1.6 1.1 .8 1.0 .9 1.2 477.3 6.3 16.4 8.0 1.0 1.1 .8 .7 2.1 1.3 1.7 3.1 1.1 .9 1.2 1.4 48
12.1 11.4 26.4 8.9 2.0 .6 .6 .8 .8 .9 1.7 3.1 2.2 1.5 3.3 2.0 497.3 10.2 36.7 6.7 2.0 1.6 1.4 .6 2.0 1.3 1.6 1.7 2.4 1.5 3.5 1.4 50
4.9 4.8 7.0 9.2 – .3 .8 .5 1.0 .7 .8 .6 .3 .5 .5 .6 51
4.3 3.7 4.7 9.5 – .5 1.1 .5 1.3 .8 1.0 .6 .5 .7 .6 .7 526.5 7.8 13.8 8.1 – .4 .6 .8 1.0 .9 .9 1.0 .2 .4 .7 .6 534.0 1.9 6.2 6.1 – 2.6 3.5 5.0 2.5 2.7 3.4 1.3 1.1 .5 2.2 2.1 544.9 6.1 7.4 7.9 – .8 .8 1.0 1.4 1.3 2.0 1.7 .5 .8 .4 .5 559.8 8.2 12.6 10.4 – .4 1.8 .9 2.0 2.0 .9 1.9 1.2 .9 1.2 2.2 567.3 12.2 21.6 7.6 1.0 .6 1.1 .8 1.4 1.4 1.0 1.1 .6 1.0 1.1 1.2 579.4 13.6 31.9 7.5 1.0 .4 .3 .5 .6 .8 1.5 1.8 1.0 .8 2.2 .8 589.3 14.7 38.4 9.5 1.0 1.0 .1 .2 1.1 .8 1.1 1.7 1.4 2.0 2.9 2.3 597.4 14.0 51.8 7.2 1.0 1.7 .2 – .8 .3 2.1 1.5 .9 1.9 3.4 1.9 60
1992 ECONOMIC CENSUS CHARACTERISTICS OF BUSINESS OWNERS 163

Table 19d. Total Personal Income of Owner by Legal Form of Organization of Firm: 1992[All data are shown as percents, except firms. For meaning of abbreviations and symbols, see introductory text. For explanation of terms, see appendix A]
Type of firm and legal form of organization
Owner’s total personal income1
Firms(number)
Under$5,000
$5,000 to$9,999
$10,000 to$14,999
$15,000 to$24,999
$25,000 to$34,999
$35,000 to$49,999
$50,000 to$74,999
A B C D E F G H
All businesses 17 253 143.......................................... 14.2 9.8 9.0 14.8 10.6 11.0 8.31
Individual proprietorships 14 599 295....................................... 17.5 11.8 10.5 15.9 11.0 10.5 6.52Partnerships 1 089 578.................................................. 5.3 4.8 5.0 10.9 9.4 9.7 11.53Subchapter S corporations 1 564 270...................................... 5.9 4.2 5.0 12.6 9.6 14.7 14.24
Hispanic ~owned businesses 771 708............................. 14.3 13.0 13.7 16.1 11.2 8.5 6.45
Individual proprietorships 689 015....................................... 15.4 14.8 15.5 17.3 10.5 8.0 4.96Partnerships 32 650.................................................. 9.8 8.9 10.5 12.8 11.6 9.8 11.07Subchapter S corporations 50 042...................................... 11.7 6.5 6.4 12.2 14.6 9.7 11.38
Black ~owned businesses 620 912................................ 17.8 11.6 11.8 15.6 10.9 9.4 5.39
Individual proprietorships 584 256....................................... 18.6 12.0 12.2 15.3 10.8 9.1 4.910Partnerships 14 727.................................................. 8.3 9.5 6.2 16.9 10.8 14.4 8.011Subchapter S corporations 21 928...................................... 9.7 6.5 7.6 20.4 11.7 13.0 9.712
Other minority ~owned businesses 606 426....................... 11.4 9.0 9.8 15.9 11.7 11.3 9.813
Individual proprietorships 502 022....................................... 14.6 11.9 11.8 15.7 12.0 10.5 7.414Partnerships 49 489.................................................. 7.0 4.4 6.8 14.4 8.2 10.9 14.915Subchapter S corporations 54 915...................................... 6.3 4.9 6.9 17.9 14.1 14.0 11.916
Women ~owned businesses 5 888 883.............................. 21.0 12.2 9.9 14.3 10.4 9.8 5.817
Individual proprietorships 5 078 077....................................... 24.2 14.0 11.0 13.8 9.9 8.9 4.218Partnerships 243 651.................................................. 14.7 9.8 5.9 12.8 13.0 9.4 11.919Subchapter S corporations 567 155...................................... 9.8 5.3 7.2 17.1 11.8 14.2 10.220
Nonminority male ~owned businesses 10 114 456.................... 10.8 8.4 8.0 14.9 10.6 11.9 9.721
Individual proprietorships 8 414 238....................................... 14.1 10.5 9.7 17.0 11.7 11.6 8.022Partnerships 777 379.................................................. 2.4 3.4 4.4 9.8 8.3 9.8 11.123Subchapter S corporations 922 838...................................... 3.4 3.5 3.6 9.7 7.8 15.3 16.924
1Data represent percentage of owners reporting in the designated categories.2For explanation of relative standard errors and standard errors, see Reliability of Estimates in the introductory text.3Relative standard errors are not applicable for lines 1 through 4 since these data are the result of censuses, not surveys.
164 CHARACTERISTICS OF BUSINESS OWNERS 1992 ECONOMIC CENSUS

Owner’s total personal income1mCon.
Standard error of estimate2 for columnm$75,000 to
$99,999$100,000 to
$149,999$150,000
or moreNot
reported
Relativestandard
error ofestimate2 3
I J K L A B C D E F G H I J K L
3.8 3.7 5.3 9.5 (X) .2 .5 .4 .6 .4 .5 .3 .2 .3 .3 .4 1
2.5 2.1 1.4 10.3 (X) .3 .6 .5 .7 .5 .6 .3 .2 .2 .2 .4 29.0 9.5 16.6 8.3 (X) .8 1.1 1.2 1.4 .9 1.3 1.4 1.3 2.1 1.3 .9 36.1 6.4 14.3 6.9 (X) .4 .5 .4 .9 .4 .9 .8 .5 .6 .9 .7 4
2.7 2.0 2.8 9.2 – .9 .7 .6 .6 .4 .6 .3 .2 .1 .2 .4 5
1.6 .9 .9 10.1 – 1.0 1.0 .9 .6 .5 .5 .3 .1 .1 .1 .5 64.2 4.9 7.7 8.6 2.0 2.4 3.0 1.9 1.5 1.3 1.6 1.5 .6 1.0 .7 1.3 77.3 5.9 9.4 5.1 1.0 2.0 .8 .9 .9 1.2 .9 .7 1.0 .9 .9 .7 8
1.9 1.0 1.4 13.3 – .6 .6 .5 .7 .4 .4 .2 .2 .1 .2 .6 9
1.7 .9 .7 13.8 – .6 .5 .6 .8 .5 .4 .3 .2 .1 .1 .7 104.2 2.3 10.9 8.4 3.0 2.1 2.5 .9 2.5 2.2 2.3 1.8 1.0 .6 3.1 2.0 114.9 3.2 8.0 5.3 2.0 1.1 1.5 2.5 1.9 1.4 1.9 1.4 .6 .3 1.1 .6 12
4.2 4.0 4.7 8.2 – .9 .5 .5 .9 .4 .7 1.2 .3 .4 .2 .7 13
2.8 2.9 2.4 8.1 – .9 1.1 .9 .8 .4 .8 .9 .4 .4 .3 1.0 146.4 6.7 9.6 10.6 1.0 1.5 .7 1.1 2.1 1.6 1.4 2.9 1.3 .9 .9 1.5 156.0 4.9 6.5 6.6 1.0 .9 1.0 .7 2.0 1.4 1.6 1.8 .7 .9 .3 1.7 16
2.0 1.9 2.6 10.0 – .4 .7 .5 .4 .5 .6 .5 .1 .2 .4 .8 17
1.4 1.3 1.0 10.6 – .6 .9 .5 .6 .6 .6 .4 .1 .3 .3 .9 183.0 3.4 6.7 9.4 1.0 2.5 1.8 1.1 2.0 2.2 2.5 1.4 1.0 1.3 .7 2.4 194.7 4.0 8.3 7.5 – 1.0 .6 .8 1.4 .6 .9 .6 .4 .6 .9 1.1 20
4.9 4.8 7.0 9.2 – .3 .8 .5 1.0 .7 .8 .6 .3 .5 .5 .6 21
3.1 2.6 1.7 10.0 – .4 1.0 .6 1.0 .8 .9 .6 .3 .4 .2 .7 2211.0 11.7 20.3 7.8 – .5 1.4 1.6 2.2 1.5 1.9 1.8 1.8 2.6 1.9 1.0 23
6.9 7.9 18.5 6.5 – .5 1.1 .5 1.0 .7 1.6 1.4 .7 .9 1.2 .8 24
1992 ECONOMIC CENSUS CHARACTERISTICS OF BUSINESS OWNERS 165
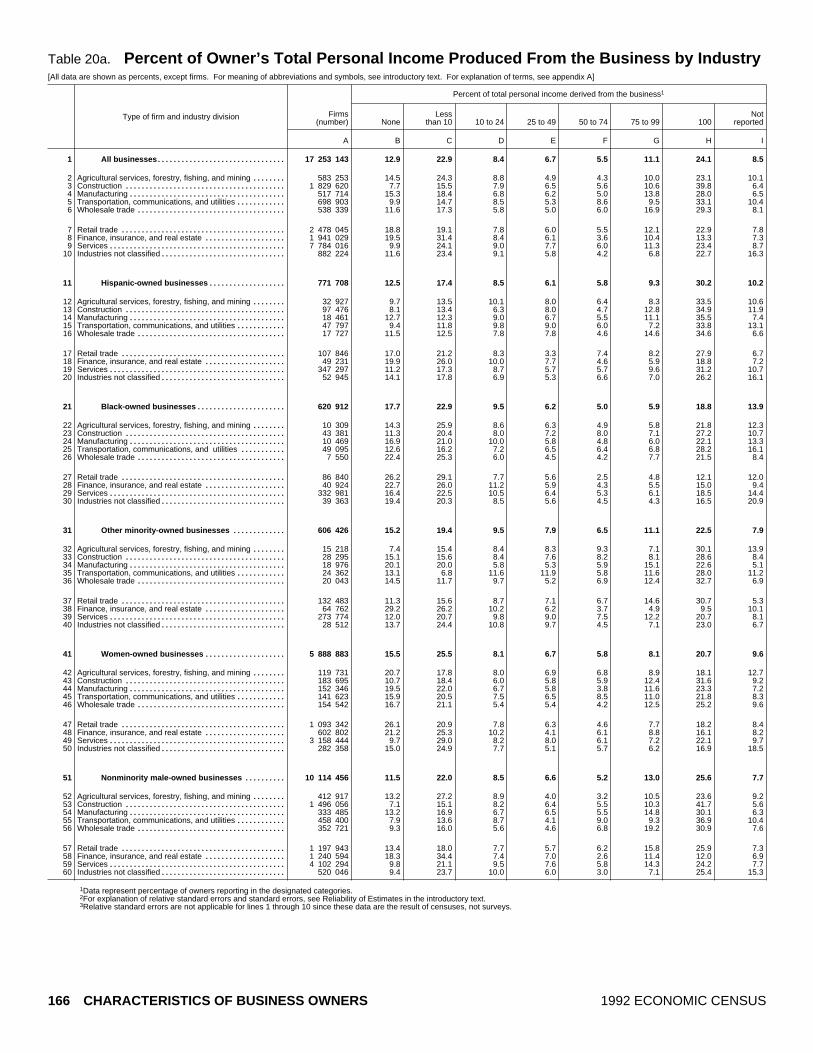
Table 20a. Percent of Owner’s Total Personal Income Produced From the Business by Industry[All data are shown as percents, except firms. For meaning of abbreviations and symbols, see introductory text. For explanation of terms, see appendix A]
Type of firm and industry division
Percent of total personal income derived from the business1
Firms(number) None
Lessthan 10 10 to 24 25 to 49 50 to 74 75 to 99 100
Notreported
A B C D E F G H I
All businesses 17 253 143................................ 12.9 22.9 8.4 6.7 5.5 11.1 24.1 8.51
Agricultural services, forestry, fishing, and mining 583 253........ 14.5 24.3 8.8 4.9 4.3 10.0 23.1 10.12Construction 1 829 620........................................ 7.7 15.5 7.9 6.5 5.6 10.6 39.8 6.43Manufacturing 517 714....................................... 15.3 18.4 6.8 6.2 5.0 13.8 28.0 6.54Transportation, communications, and utilities 698 903............ 9.9 14.7 8.5 5.3 8.6 9.5 33.1 10.45Wholesale trade 538 339..................................... 11.6 17.3 5.8 5.0 6.0 16.9 29.3 8.16
Retail trade 2 478 045......................................... 18.8 19.1 7.8 6.0 5.5 12.1 22.9 7.87Finance, insurance, and real estate 1 941 029.................... 19.5 31.4 8.4 6.1 3.6 10.4 13.3 7.38Services 7 784 016............................................ 9.9 24.1 9.0 7.7 6.0 11.3 23.4 8.79Industries not classified 882 224............................... 11.6 23.4 9.1 5.8 4.2 6.8 22.7 16.310
Hispanic ~owned businesses 771 708................... 12.5 17.4 8.5 6.1 5.8 9.3 30.2 10.211
Agricultural services, forestry, fishing, and mining 32 927........ 9.7 13.5 10.1 8.0 6.4 8.3 33.5 10.612Construction 97 476........................................ 8.1 13.4 6.3 8.0 4.7 12.8 34.9 11.913Manufacturing 18 461....................................... 12.7 12.3 9.0 6.7 5.5 11.1 35.5 7.414Transportation, communications, and utilities 47 797............ 9.4 11.8 9.8 9.0 6.0 7.2 33.8 13.115Wholesale trade 17 727..................................... 11.5 12.5 7.8 7.8 4.6 14.6 34.6 6.616
Retail trade 107 846......................................... 17.0 21.2 8.3 3.3 7.4 8.2 27.9 6.717Finance, insurance, and real estate 49 231.................... 19.9 26.0 10.0 7.7 4.6 5.9 18.8 7.218Services 347 297............................................ 11.2 17.3 8.7 5.7 5.7 9.6 31.2 10.719Industries not classified 52 945............................... 14.1 17.8 6.9 5.3 6.6 7.0 26.2 16.120
Black ~owned businesses 620 912...................... 17.7 22.9 9.5 6.2 5.0 5.9 18.8 13.921
Agricultural services, forestry, fishing, and mining 10 309........ 14.3 25.9 8.6 6.3 4.9 5.8 21.8 12.322Construction 43 381........................................ 11.3 20.4 8.0 7.2 8.0 7.1 27.2 10.723Manufacturing 10 469....................................... 16.9 21.0 10.0 5.8 4.8 6.0 22.1 13.324Transportation, communications, and utilities 49 095........... 12.6 16.2 7.2 6.5 6.4 6.8 28.2 16.125Wholesale trade 7 550..................................... 22.4 25.3 6.0 4.5 4.2 7.7 21.5 8.426
Retail trade 86 840......................................... 26.2 29.1 7.7 5.6 2.5 4.8 12.1 12.027Finance, insurance, and real estate 40 924.................... 22.7 26.0 11.2 5.9 4.3 5.5 15.0 9.428Services 332 981............................................ 16.4 22.5 10.5 6.4 5.3 6.1 18.5 14.429Industries not classified 39 363............................... 19.4 20.3 8.5 5.6 4.5 4.3 16.5 20.930
Other minority ~owned businesses 606 426............. 15.2 19.4 9.5 7.9 6.5 11.1 22.5 7.931
Agricultural services, forestry, fishing, and mining 15 218........ 7.4 15.4 8.4 8.3 9.3 7.1 30.1 13.932Construction 28 295........................................ 15.1 15.6 8.4 7.6 8.2 8.1 28.6 8.433Manufacturing 18 976....................................... 20.1 20.0 5.8 5.3 5.9 15.1 22.6 5.134Transportation, communications, and utilities 24 362............ 13.1 6.8 11.6 11.9 5.8 11.6 28.0 11.235Wholesale trade 20 043..................................... 14.5 11.7 9.7 5.2 6.9 12.4 32.7 6.936
Retail trade 132 483......................................... 11.3 15.6 8.7 7.1 6.7 14.6 30.7 5.337Finance, insurance, and real estate 64 762.................... 29.2 26.2 10.2 6.2 3.7 4.9 9.5 10.138Services 273 774............................................ 12.0 20.7 9.8 9.0 7.5 12.2 20.7 8.139Industries not classified 28 512............................... 13.7 24.4 10.8 9.7 4.5 7.1 23.0 6.740
Women ~owned businesses 5 888 883.................... 15.5 25.5 8.1 6.7 5.8 8.1 20.7 9.641
Agricultural services, forestry, fishing, and mining 119 731........ 20.7 17.8 8.0 6.9 6.8 8.9 18.1 12.742Construction 183 695........................................ 10.7 18.4 6.0 5.8 5.9 12.4 31.6 9.243Manufacturing 152 346....................................... 19.5 22.0 6.7 5.8 3.8 11.6 23.3 7.244Transportation, communications, and utilities 141 623............ 15.9 20.5 7.5 6.5 8.5 11.0 21.8 8.345Wholesale trade 154 542..................................... 16.7 21.1 5.4 5.4 4.2 12.5 25.2 9.646
Retail trade 1 093 342......................................... 26.1 20.9 7.8 6.3 4.6 7.7 18.2 8.447Finance, insurance, and real estate 602 802.................... 21.2 25.3 10.2 4.1 6.1 8.8 16.1 8.248Services 3 158 444............................................ 9.7 29.0 8.2 8.0 6.1 7.2 22.1 9.749Industries not classified 282 358............................... 15.0 24.9 7.7 5.1 5.7 6.2 16.9 18.550
Nonminority male ~owned businesses 10 114 456.......... 11.5 22.0 8.5 6.6 5.2 13.0 25.6 7.751
Agricultural services, forestry, fishing, and mining 412 917........ 13.2 27.2 8.9 4.0 3.2 10.5 23.6 9.252Construction 1 496 056........................................ 7.1 15.1 8.2 6.4 5.5 10.3 41.7 5.653Manufacturing 333 485....................................... 13.2 16.9 6.7 6.5 5.5 14.8 30.1 6.354Transportation, communications, and utilities 458 400............ 7.9 13.6 8.7 4.1 9.0 9.3 36.9 10.455Wholesale trade 352 721..................................... 9.3 16.0 5.6 4.6 6.8 19.2 30.9 7.656
Retail trade 1 197 943......................................... 13.4 18.0 7.7 5.7 6.2 15.8 25.9 7.357Finance, insurance, and real estate 1 240 594.................... 18.3 34.4 7.4 7.0 2.6 11.4 12.0 6.958Services 4 102 294............................................ 9.8 21.1 9.5 7.6 5.8 14.3 24.2 7.759Industries not classified 520 046............................... 9.4 23.7 10.0 6.0 3.0 7.1 25.4 15.360
1Data represent percentage of owners reporting in the designated categories.2For explanation of relative standard errors and standard errors, see Reliability of Estimates in the introductory text.3Relative standard errors are not applicable for lines 1 through 10 since these data are the result of censuses, not surveys.
166 CHARACTERISTICS OF BUSINESS OWNERS 1992 ECONOMIC CENSUS

Division: 1992
Standard error of estimate2 for columnmRelative
standarderror of
estimate2 3
A B C D E F G H I
(X) .8 .8 .4 .4 .2 .4 .5 .3 1
(X) 2.1 1.9 1.5 .9 .8 1.5 2.3 1.6 2(X) 1.8 1.5 1.2 1.7 .7 1.3 2.8 .6 3(X) 2.6 1.9 .9 1.0 .6 .7 1.5 .6 4(X) 1.5 2.0 1.1 .7 1.0 .9 1.5 1.0 5(X) 1.1 1.8 1.1 .9 .6 1.3 1.6 1.2 6
(X) 1.8 1.1 1.2 .8 .7 .9 1.5 .9 7(X) 2.4 1.9 1.2 .9 .5 1.1 .9 1.2 8(X) 1.0 1.7 1.0 1.0 .5 .8 .8 .6 9(X) 1.6 1.6 1.4 1.1 .7 1.3 2.4 2.4 10
– .7 1.1 .5 .5 .5 .4 .8 .6 11
1.0 1.6 2.5 1.2 2.5 1.7 1.4 2.7 2.4 121.0 1.3 1.5 1.5 .9 1.1 1.5 2.5 1.9 131.0 2.1 2.6 1.2 .9 .9 1.4 2.3 1.1 141.0 1.2 1.8 1.6 1.4 1.3 1.0 1.4 1.6 152.0 1.8 1.5 .6 1.6 .9 1.9 2.9 .7 16
1.0 1.5 2.2 1.5 .7 1.1 .8 1.6 1.0 171.0 2.5 1.6 1.3 1.2 .7 .8 2.6 1.2 18
– 1.4 1.7 1.1 .9 .9 .7 1.6 1.5 191.0 1.9 2.3 1.9 1.2 1.5 1.7 3.3 2.3 20
– .4 .5 .6 .4 .4 .5 .5 .5 21
1.0 1.4 1.8 1.6 1.3 .9 1.0 2.0 1.5 22– 1.2 1.6 1.3 1.1 1.2 .8 2.0 1.5 23
1.0 2.3 1.8 1.8 .7 .7 .7 1.1 1.4 24– 1.5 2.6 .8 1.0 1.0 .9 2.6 2.4 25
2.0 1.3 1.7 1.0 1.1 1.3 1.6 1.7 1.0 26
– 1.6 1.9 1.1 .5 .6 .6 .9 1.0 271.0 1.8 1.3 1.0 .7 1.1 .6 1.3 1.0 28
– .8 .6 .9 .7 .6 .8 .9 .8 29– 2.8 1.5 1.0 1.2 1.0 .6 1.4 3.0 30
– 1.0 .9 .8 .6 .6 .5 .8 .5 31
1.0 1.5 3.1 2.4 1.7 2.3 1.4 4.4 3.1 321.0 2.5 3.0 2.0 1.6 2.4 1.1 3.1 1.8 331.0 4.8 2.4 1.4 1.3 1.6 2.0 3.0 1.3 341.0 2.5 2.3 2.4 2.3 1.3 1.7 2.3 2.4 351.0 1.8 2.0 1.0 .8 1.0 1.1 2.1 1.8 36
1.0 1.6 1.1 1.4 .9 .7 1.4 1.7 1.0 371.0 3.7 3.0 2.0 1.2 .8 .6 1.9 1.4 38
– 1.8 2.2 1.6 1.4 1.2 1.0 1.2 .9 391.0 2.3 2.7 2.5 1.8 1.8 1.6 3.0 1.4 40
– 1.4 .6 .4 .4 .4 .4 .9 .4 41
– 1.3 3.0 1.4 1.6 1.7 2.2 2.0 3.5 42– 1.1 1.1 1.1 1.1 .9 1.4 2.6 1.5 43– 2.3 3.2 1.0 1.1 .7 1.4 2.0 .9 44– 2.2 2.4 1.9 1.0 1.6 1.1 2.5 1.0 45– 1.9 1.9 1.1 1.1 .5 1.1 1.7 1.3 46
– 2.5 1.5 1.3 1.1 .8 1.0 1.7 1.4 47– 2.8 2.0 1.1 .9 .8 1.3 1.3 1.9 48– 1.2 1.4 .9 .8 .7 .8 1.5 .8 49– 2.6 3.5 1.6 1.4 1.1 1.6 2.2 2.9 50
– .9 1.2 .6 .5 .3 .6 .9 .5 51
– 2.9 2.7 2.2 1.0 .7 2.0 3.3 1.9 52– 2.2 1.8 1.5 2.1 .9 1.7 3.4 .9 53– 3.5 1.8 1.2 1.3 .9 1.0 1.9 .9 54– 2.2 2.9 1.7 1.0 1.6 1.3 2.6 1.5 55– 1.6 2.6 1.5 1.1 .8 1.8 2.3 1.6 56
– 1.8 1.5 2.0 1.5 1.0 1.4 2.0 1.6 57– 3.0 2.7 1.7 1.5 .7 1.6 1.3 1.4 58– 2.0 2.6 1.6 1.4 .8 1.1 1.9 1.1 59– 2.2 3.0 2.4 1.9 1.1 2.3 3.7 3.2 60
1992 ECONOMIC CENSUS CHARACTERISTICS OF BUSINESS OWNERS 167

Table 20b. Percent of Owner’s Total Personal Income Produced From the Business by Receipts[All data are shown as percents, except firms. For meaning of abbreviations and symbols, see introductory text. For explanation of terms, see appendix A]
Type of firm and receipts size
Percent of total personal income derived from the business1
Firms(number) None
Lessthan 10 10 to 24 25 to 49 50 to 74 75 to 99 100
Notreported
A B C D E F G H I
All businesses 17 253 143................................ 12.9 22.9 8.4 6.7 5.5 11.1 24.1 8.51
Less than $5,000 5 226 553.................................... 20.4 41.3 7.8 5.1 2.9 3.7 8.4 10.52$5,000 to $9,999 2 443 946.................................... 10.5 27.6 14.0 7.6 3.1 5.5 20.9 10.83$10,000 to $24,999 3 076 410.................................. 13.1 17.5 9.8 8.9 5.6 11.1 25.2 8.74$25,000 to $49,999 1 945 806.................................. 10.0 15.7 9.2 10.0 7.0 11.4 28.8 7.95$50,000 to $99,999 1 615 940.................................. 9.1 13.4 7.6 5.9 7.3 16.0 34.6 6.06
$100,000 to $199,999 1 197 996................................ 7.9 12.0 5.4 5.5 8.9 15.3 39.4 5.57$200,000 to $249,999 301 794................................ 8.0 13.2 4.4 4.1 9.8 16.8 40.7 3.08$250,000 to $499,999 682 583................................ 10.5 10.2 4.9 4.4 6.1 20.6 36.3 7.09$500,000 to $999,999 372 078................................ 10.1 11.2 6.0 5.3 7.2 21.6 31.5 7.110$1,000,000 or more 390 037.................................. 7.9 9.4 5.5 5.6 7.8 29.0 27.6 7.411
Hispanic ~owned businesses 771 708................... 12.5 17.4 8.5 6.1 5.8 9.3 30.2 10.212
Less than $5,000 219 226.................................... 20.8 35.2 7.7 4.1 2.9 2.3 12.4 14.513$5,000 to $9,999 140 362.................................... 12.9 19.8 7.8 5.9 5.9 6.4 28.6 12.714$10,000 to $24,999 165 667.................................. 11.5 12.6 12.1 7.1 6.3 8.6 31.4 10.415$25,000 to $49,999 87 288.................................. 9.9 11.4 10.2 7.3 6.7 10.2 33.4 10.916$50,000 to $99,999 64 742.................................. 9.1 11.2 6.4 8.1 5.5 12.4 41.4 5.817
$100,000 to $199,999 41 578................................ 8.0 9.7 7.8 6.1 8.7 13.2 41.2 5.218$200,000 to $249,999 10 030................................ 8.2 11.3 4.5 5.9 8.9 14.2 42.2 4.819$250,000 to $499,999 22 301................................ 10.0 6.8 5.5 5.5 7.3 17.3 42.5 5.020$500,000 to $999,999 11 319................................ 6.0 7.3 5.4 6.2 6.7 20.4 40.3 7.721$1,000,000 or more 9 194.................................. 4.0 8.3 5.1 5.1 7.1 23.7 38.9 7.722
Black ~owned businesses 620 912...................... 17.7 22.9 9.5 6.2 5.0 5.9 18.8 13.923
Less than $5,000 236 722.................................... 23.6 36.0 7.4 3.4 2.2 2.0 7.3 18.124$5,000 to $9,999 111 512.................................... 16.5 24.9 12.1 6.3 4.9 4.9 15.9 14.425$10,000 to $24,999 129 901.................................. 14.3 16.1 11.4 8.9 6.2 6.6 22.9 13.626$25,000 to $49,999 62 209.................................. 13.2 10.5 9.3 10.3 9.0 8.2 30.2 9.327$50,000 to $99,999 39 218.................................. 14.4 7.4 10.8 6.4 8.2 10.8 34.4 7.628
$100,000 to $199,999 20 936................................ 14.1 7.7 6.9 6.6 6.0 15.8 36.1 7.029$200,000 to $249,999 4 533................................ 11.1 9.3 6.0 5.0 4.2 19.0 41.3 4.030$250,000 to $499,999 9 029................................ 12.3 8.7 5.7 4.2 6.7 16.6 40.3 5.431$500,000 to $999,999 3 823................................ 12.7 7.0 7.9 9.6 9.3 13.5 34.4 5.632$1,000,000 or more 3 028.................................. 6.7 4.9 5.6 3.2 8.0 21.7 39.8 10.033
Other minority ~owned businesses 606 426............. 15.2 19.4 9.5 7.9 6.5 11.1 22.5 7.934
Less than $5,000 132 493.................................... 23.3 47.2 6.3 6.6 2.2 2.7 6.1 5.435$5,000 to $9,999 80 435.................................... 22.4 22.5 11.4 8.9 8.0 3.7 11.9 11.236$10,000 to $24,999 108 195.................................. 16.4 13.9 12.3 10.6 4.5 10.3 19.7 12.237$25,000 to $49,999 77 345.................................. 17.2 20.0 11.5 7.8 7.9 7.3 20.4 7.938$50,000 to $99,999 70 360.................................. 8.6 12.9 9.3 10.7 8.0 16.1 28.0 6.539
$100,000 to $199,999 58 620................................ 12.6 9.7 11.3 7.3 8.0 12.3 32.0 6.840$200,000 to $249,999 15 740................................ 11.6 6.2 7.0 4.6 9.5 18.5 37.7 4.941$250,000 to $499,999 34 266................................ 11.0 11.8 7.8 5.9 7.0 17.7 33.9 5.042$500,000 to $999,999 16 467................................ 7.1 7.5 7.4 6.6 7.4 20.7 34.0 9.343$1,000,000 or more 12 505.................................. 6.8 10.0 6.1 5.3 7.7 24.0 29.8 10.344
Women ~owned businesses 5 888 883.................... 15.5 25.5 8.1 6.7 5.8 8.1 20.7 9.645
Less than $5,000 2 310 303.................................... 19.1 42.0 7.0 4.9 3.7 3.4 8.4 11.446$5,000 to $9,999 967 380.................................... 15.4 26.8 12.9 7.2 4.9 3.8 19.3 9.647$10,000 to $24,999 1 051 358.................................. 17.0 19.3 8.8 8.1 7.1 8.3 21.9 9.548$25,000 to $49,999 538 885.................................. 11.9 18.3 9.0 9.3 6.1 10.0 25.3 10.249$50,000 to $99,999 381 517.................................. 12.0 12.5 6.9 8.8 8.2 12.2 31.1 8.250
$100,000 to $199,999 267 089................................ 12.7 10.4 5.5 6.4 6.9 12.2 40.1 5.951$200,000 to $249,999 66 464................................ 12.6 8.1 5.2 4.6 10.5 14.2 38.9 5.952$250,000 to $499,999 146 313................................ 11.3 6.8 6.2 6.3 6.0 18.7 39.7 5.053$500,000 to $999,999 80 539................................ 7.3 7.9 4.6 5.5 9.3 24.5 34.9 5.954$1,000,000 or more 79 037.................................. 5.7 6.3 5.3 5.8 9.6 27.2 31.1 9.055
Nonminority male ~owned businesses 10 114 456.......... 11.5 22.0 8.5 6.6 5.2 13.0 25.6 7.756
Less than $5,000 2 608 047.................................... 21.2 41.3 8.3 5.2 2.2 4.0 8.2 9.457$5,000 to $9,999 1 285 456.................................... 6.2 28.8 15.5 7.9 1.4 6.7 22.2 11.358$10,000 to $24,999 1 763 830.................................. 10.8 16.6 10.2 9.5 4.4 13.5 27.3 7.759$25,000 to $49,999 1 248 482.................................. 9.1 15.1 8.9 10.5 7.2 12.2 30.3 6.760$50,000 to $99,999 1 108 065.................................. 8.2 14.0 7.8 4.6 6.9 17.6 35.7 5.261
$100,000 to $199,999 840 723................................ 5.9 12.9 4.6 5.2 9.6 16.6 39.7 5.462$200,000 to $249,999 212 693................................ 5.7 16.1 3.8 3.7 9.8 17.8 41.3 1.763$250,000 to $499,999 488 462................................ 10.3 11.4 4.2 3.6 6.1 21.6 35.0 7.964$500,000 to $999,999 266 408................................ 11.3 12.6 6.5 5.1 6.5 20.8 29.9 7.365$1,000,000 or more 292 290.................................. 8.5 10.1 5.5 5.6 7.4 29.8 26.3 6.866
1Data represent percentage of owners reporting in the designated categories.2For explanation of relative standard errors and standard errors, see Reliability of Estimates in the introductory text.3Relative standard errors are not applicable for lines 1 through 11 since these data are the result of censuses, not surveys.
168 CHARACTERISTICS OF BUSINESS OWNERS 1992 ECONOMIC CENSUS
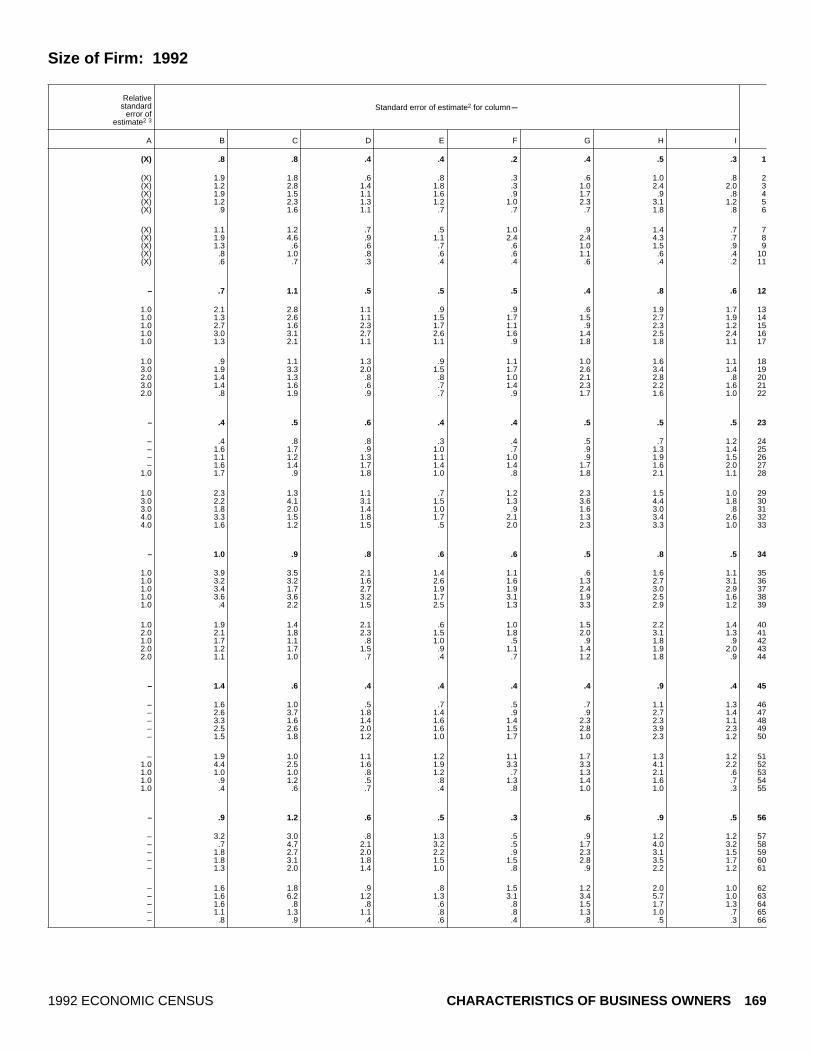
Size of Firm: 1992
Standard error of estimate2 for columnmRelative
standarderror of
estimate2 3
A B C D E F G H I
(X) .8 .8 .4 .4 .2 .4 .5 .3 1
(X) 1.9 1.8 .6 .8 .3 .6 1.0 .8 2(X) 1.2 2.8 1.4 1.8 .3 1.0 2.4 2.0 3(X) 1.9 1.5 1.1 1.6 .9 1.7 .9 .8 4(X) 1.2 2.3 1.3 1.2 1.0 2.3 3.1 1.2 5(X) .9 1.6 1.1 .7 .7 .7 1.8 .8 6
(X) 1.1 1.2 .7 .5 1.0 .9 1.4 .7 7(X) 1.9 4.6 .9 1.1 2.4 2.4 4.3 .7 8(X) 1.3 .6 .6 .7 .6 1.0 1.5 .9 9(X) .8 1.0 .8 .6 .6 1.1 .6 .4 10(X) .6 .7 .3 .4 .4 .6 .4 .2 11
– .7 1.1 .5 .5 .5 .4 .8 .6 12
1.0 2.1 2.8 1.1 .9 .9 .6 1.9 1.7 131.0 1.3 2.6 1.1 1.5 1.7 1.5 2.7 1.9 141.0 2.7 1.6 2.3 1.7 1.1 .9 2.3 1.2 151.0 3.0 3.1 2.7 2.6 1.6 1.4 2.5 2.4 161.0 1.3 2.1 1.1 1.1 .9 1.8 1.8 1.1 17
1.0 .9 1.1 1.3 .9 1.1 1.0 1.6 1.1 183.0 1.9 3.3 2.0 1.5 1.7 2.6 3.4 1.4 192.0 1.4 1.3 .8 .8 1.0 2.1 2.8 .8 203.0 1.4 1.6 .6 .7 1.4 2.3 2.2 1.6 212.0 .8 1.9 .9 .7 .9 1.7 1.6 1.0 22
– .4 .5 .6 .4 .4 .5 .5 .5 23
– .4 .8 .8 .3 .4 .5 .7 1.2 24– 1.6 1.7 .9 1.0 .7 .9 1.3 1.4 25– 1.1 1.2 1.3 1.1 1.0 .9 1.9 1.5 26– 1.6 1.4 1.7 1.4 1.4 1.7 1.6 2.0 27
1.0 1.7 .9 1.8 1.0 .8 1.8 2.1 1.1 28
1.0 2.3 1.3 1.1 .7 1.2 2.3 1.5 1.0 293.0 2.2 4.1 3.1 1.5 1.3 3.6 4.4 1.8 303.0 1.8 2.0 1.4 1.0 .9 1.6 3.0 .8 314.0 3.3 1.5 1.8 1.7 2.1 1.3 3.4 2.6 324.0 1.6 1.2 1.5 .5 2.0 2.3 3.3 1.0 33
– 1.0 .9 .8 .6 .6 .5 .8 .5 34
1.0 3.9 3.5 2.1 1.4 1.1 .6 1.6 1.1 351.0 3.2 3.2 1.6 2.6 1.6 1.3 2.7 3.1 361.0 3.4 1.7 2.7 1.9 1.9 2.4 3.0 2.9 371.0 3.6 3.6 3.2 1.7 3.1 1.9 2.5 1.6 381.0 .4 2.2 1.5 2.5 1.3 3.3 2.9 1.2 39
1.0 1.9 1.4 2.1 .6 1.0 1.5 2.2 1.4 402.0 2.1 1.8 2.3 1.5 1.8 2.0 3.1 1.3 411.0 1.7 1.1 .8 1.0 .5 .9 1.8 .9 422.0 1.2 1.7 1.5 .9 1.1 1.4 1.9 2.0 432.0 1.1 1.0 .7 .4 .7 1.2 1.8 .9 44
– 1.4 .6 .4 .4 .4 .4 .9 .4 45
– 1.6 1.0 .5 .7 .5 .7 1.1 1.3 46– 2.6 3.7 1.8 1.4 .9 .9 2.7 1.4 47– 3.3 1.6 1.4 1.6 1.4 2.3 2.3 1.1 48– 2.5 2.6 2.0 1.6 1.5 2.8 3.9 2.3 49– 1.5 1.8 1.2 1.0 1.7 1.0 2.3 1.2 50
– 1.9 1.0 1.1 1.2 1.1 1.7 1.3 1.2 511.0 4.4 2.5 1.6 1.9 3.3 3.3 4.1 2.2 521.0 1.0 1.0 .8 1.2 .7 1.3 2.1 .6 531.0 .9 1.2 .5 .8 1.3 1.4 1.6 .7 541.0 .4 .6 .7 .4 .8 1.0 1.0 .3 55
– .9 1.2 .6 .5 .3 .6 .9 .5 56
– 3.2 3.0 .8 1.3 .5 .9 1.2 1.2 57– .7 4.7 2.1 3.2 .5 1.7 4.0 3.2 58– 1.8 2.7 2.0 2.2 .9 2.3 3.1 1.5 59– 1.8 3.1 1.8 1.5 1.5 2.8 3.5 1.7 60– 1.3 2.0 1.4 1.0 .8 .9 2.2 1.2 61
– 1.6 1.8 .9 .8 1.5 1.2 2.0 1.0 62– 1.6 6.2 1.2 1.3 3.1 3.4 5.7 1.0 63– 1.6 .8 .8 .6 .8 1.5 1.7 1.3 64– 1.1 1.3 1.1 .8 .8 1.3 1.0 .7 65– .8 .9 .4 .6 .4 .8 .5 .3 66
1992 ECONOMIC CENSUS CHARACTERISTICS OF BUSINESS OWNERS 169

Table 20c. Percent of Owner’s Total Personal Income Produced From the Business by[All data are shown as percents, except firms. For meaning of abbreviations and symbols, see introductory text. For explanation of terms, see appendix A]
Type of firm and employment size
Percent of total personal income derived from the business1
Firms(number) None
Lessthan 10 10 to 24 25 to 49 50 to 74 75 to 99 100
Notreported
A B C D E F G H I
All businesses 17 253 143................................ 12.9 22.9 8.4 6.7 5.5 11.1 24.1 8.51
With no paid employees 14 118 184.............................. 14.2 27.4 9.3 6.8 4.7 8.0 20.3 9.32With paid employees 3 134 959................................. 8.8 7.8 5.5 6.2 7.8 21.6 36.5 5.73
No employees4 435 838.................................... 10.5 8.0 7.1 10.2 8.2 15.2 36.8 4.041 to 4 employees 1 716 076.................................. 8.4 7.6 5.5 6.6 7.5 20.1 39.0 5.455 to 9 employees 503 808.................................. 7.7 7.4 4.1 4.3 8.6 23.1 38.5 6.3610 to 19 employees 256 110................................ 9.7 8.2 5.4 4.8 7.5 24.0 33.9 6.5720 to 49 employees 144 734................................ 10.6 9.1 4.8 4.8 7.5 27.9 28.3 7.0850 to 99 employees 45 331................................ 9.2 9.3 9.1 6.3 9.0 27.8 22.3 7.09100 employees or more 33 062............................ 8.3 6.9 6.8 5.3 8.3 36.1 20.2 8.110
Hispanic ~owned businesses 771 708................... 12.5 17.4 8.5 6.1 5.8 9.3 30.2 10.211
With no paid employees 656 343.............................. 13.8 20.0 9.1 6.1 5.1 7.3 27.1 11.612With paid employees 115 364................................. 8.1 9.1 6.4 6.2 8.2 15.8 40.4 5.713
No employees4 19 569.................................... 14.0 16.7 5.7 5.0 6.8 12.2 33.5 6.1141 to 4 employees 64 631.................................. 6.9 9.0 7.2 7.4 8.8 14.3 41.1 5.3155 to 9 employees 16 937.................................. 7.8 5.8 6.0 4.4 10.2 19.1 41.7 5.01610 to 19 employees 8 553................................ 6.9 5.5 5.7 5.8 5.2 16.8 47.5 6.71720 to 49 employees 4 050................................ 8.8 7.7 4.2 3.2 4.8 22.3 43.2 5.71850 to 99 employees 948................................ 4.4 9.0 6.0 12.0 9.2 22.0 26.4 11.019100 employees or more 676............................ 4.0 2.8 3.2 2.4 14.9 39.8 24.8 8.120
Black ~owned businesses 620 912...................... 17.7 22.9 9.5 6.2 5.0 5.9 18.8 13.921
With no paid employees 556 434.............................. 18.3 24.6 9.6 6.1 4.6 4.9 17.0 14.822With paid employees 64 478................................. 13.4 10.6 8.4 7.0 8.0 12.8 32.1 7.723
No employees4 13 725.................................... 12.9 20.8 11.0 7.0 8.3 7.3 24.8 7.9241 to 4 employees 37 587.................................. 14.5 8.2 7.5 7.4 8.2 13.9 32.6 7.6255 to 9 employees 7 853.................................. 10.0 9.5 10.1 6.7 6.0 14.4 34.2 9.22610 to 19 employees 2 839................................ 15.2 8.1 5.5 4.5 10.0 13.0 37.2 6.42720 to 49 employees 1 700................................ 12.6 4.6 8.5 4.7 7.0 12.4 43.2 7.02850 to 99 employees 432................................ 4.4 2.8 7.4 5.3 6.5 27.6 42.1 3.929100 employees or more 342............................ 3.9 9.1 1.5 3.2 3.3 30.3 41.4 7.330
Other minority ~owned businesses 606 426............. 15.2 19.4 9.5 7.9 6.5 11.1 22.5 7.931
With no paid employees 470 075.............................. 17.8 24.1 10.4 8.4 6.5 7.4 17.2 8.232With paid employees 136 351................................. 9.7 9.8 7.6 6.9 6.6 18.8 33.4 7.233
No employees4 19 989.................................... 12.6 13.2 9.5 9.0 4.6 17.8 26.4 6.8341 to 4 employees 76 636.................................. 9.5 9.3 8.5 6.1 7.0 17.2 35.1 7.2355 to 9 employees 22 862.................................. 9.5 9.3 5.5 7.0 5.9 21.9 34.6 6.33610 to 19 employees 10 051................................ 9.6 10.0 5.5 8.5 7.6 17.9 35.2 5.83720 to 49 employees 5 034................................ 9.0 10.0 7.4 6.4 8.5 22.0 28.9 7.93850 to 99 employees 1 075................................ 7.3 7.8 6.6 5.8 5.3 24.3 25.6 17.339100 employees or more 705............................ 4.3 9.3 3.6 3.4 5.4 29.0 22.8 22.340
Women ~owned businesses 5 888 883.................... 15.5 25.5 8.1 6.7 5.8 8.1 20.7 9.641
With no paid employees 5 071 110.............................. 16.3 29.8 8.8 6.7 5.2 6.1 16.7 10.642With paid employees 817 773................................. 12.1 8.0 5.5 6.9 8.2 16.5 37.4 5.443
No employees4 127 905.................................... 15.0 12.7 5.7 9.4 12.5 11.3 28.6 4.7441 to 4 employees 435 550.................................. 13.8 7.8 5.7 7.5 6.6 14.8 38.5 5.3455 to 9 employees 134 476.................................. 8.6 7.9 5.3 4.7 8.9 18.0 42.3 4.34610 to 19 employees 67 487................................ 8.3 5.7 3.9 5.6 8.9 19.5 41.2 6.84720 to 49 employees 35 515................................ 13.4 6.7 6.5 5.6 8.3 22.8 29.6 7.24850 to 99 employees 10 178................................ 5.4 5.6 5.2 7.1 9.2 30.6 27.7 9.349100 employees or more 6 663............................ 5.1 3.2 7.2 6.1 10.8 33.8 25.9 7.950
Nonminority male ~owned businesses 10 114 456.......... 11.5 22.0 8.5 6.6 5.2 13.0 25.6 7.751
With no paid employees 8 019 462.............................. 12.9 26.9 9.5 6.8 4.3 9.2 22.1 8.352With paid employees 2 094 993................................. 7.4 7.5 5.2 5.9 7.7 24.3 36.2 5.753
No employees4 271 380.................................... 7.9 3.9 8.0 11.1 6.2 17.4 42.3 3.3541 to 4 employees 1 155 800.................................. 5.9 7.3 5.0 6.3 7.8 23.1 39.4 5.2555 to 9 employees 334 483.................................. 7.4 7.2 3.4 3.9 8.6 25.5 37.0 7.15610 to 19 employees 173 140................................ 10.3 9.2 6.0 4.3 7.1 26.2 30.4 6.55720 to 49 employees 101 938................................ 10.0 9.9 4.2 4.5 7.4 29.9 27.4 6.85850 to 99 employees 33 406................................ 10.3 10.2 10.1 6.1 9.0 27.3 20.9 6.159100 employees or more 24 846............................ 9.5 7.9 6.9 5.1 7.7 36.8 18.3 7.860
1Data represent percentage of owners reporting in the designated categories.2For explanation of relative standard errors and standard errors, see Reliability of Estimates in the introductory text.3Relative standard errors are not applicable for lines 1 through 10 since these data are the result of censuses, not surveys.4Firms reported annual payroll, but did not report any employees on their payroll during specified period in 1992.
170 CHARACTERISTICS OF BUSINESS OWNERS 1992 ECONOMIC CENSUS

Employment Size of Firm: 1992
Standard error of estimate2 for columnmRelative
standarderror of
estimate2 3
A B C D E F G H I
(X) .8 .8 .4 .4 .2 .4 .5 .3 1
(X) .9 .9 .5 .5 .3 .4 .7 .4 2(X) .6 .5 .3 .6 .4 .6 .8 .5 3(X) 1.8 1.4 1.8 2.6 1.4 2.0 2.2 .8 4(X) 1.0 .7 .6 .7 .7 1.0 1.4 .8 5(X) 1.0 .6 .4 .6 1.0 1.8 1.3 1.6 6(X) 1.0 .5 .8 .8 .8 .8 1.3 .5 7(X) 2.1 1.0 .4 .6 .6 1.5 1.5 .6 8(X) 2.7 2.5 1.0 1.4 1.0 2.3 1.5 .7 9(X) 2.7 1.6 2.1 1.2 1.2 3.4 1.2 1.3 10
– .7 1.1 .5 .5 .5 .4 .8 .6 11
– .9 1.5 .7 .6 .5 .4 .8 .7 121.0 .9 .8 1.1 1.0 .7 .9 1.5 .5 132.0 3.6 4.1 2.2 2.9 1.7 3.3 3.3 1.7 141.0 .9 .9 1.1 1.8 1.2 1.0 1.8 .8 152.0 1.4 1.3 1.7 .9 1.9 1.7 3.8 1.0 163.0 1.3 1.4 1.0 .7 2.2 2.4 3.7 1.2 174.0 2.4 1.9 1.0 .7 .9 2.1 3.5 1.3 186.0 .9 3.0 1.5 3.5 2.0 3.4 2.6 3.8 198.0 2.0 .8 1.8 1.0 3.7 5.9 4.4 2.5 20
– .4 .5 .6 .4 .4 .5 .5 .5 21
– .4 .4 .7 .4 .5 .5 .5 .6 221.0 1.2 1.2 .9 1.0 .6 1.1 1.5 1.5 232.0 2.3 4.3 3.1 1.6 2.4 1.7 3.5 3.7 241.0 2.1 1.0 1.0 1.3 1.3 2.1 2.3 1.6 253.0 3.0 2.0 1.9 1.3 1.1 2.1 2.7 2.6 264.0 4.1 2.6 1.8 1.6 3.0 1.9 3.0 2.2 276.0 3.7 1.3 2.0 1.3 2.7 3.4 4.7 1.7 288.0 1.8 2.1 3.2 2.4 1.6 6.0 7.0 2.9 29
– 2.1 3.3 .6 2.0 1.5 6.3 4.9 2.2 30
– 1.0 .9 .8 .6 .6 .5 .8 .5 31
– 1.6 1.2 1.2 .6 .9 .7 .9 .7 321.0 .8 1.1 .7 .8 .6 1.2 .9 1.2 332.0 3.1 4.6 2.7 3.0 2.0 5.5 2.6 3.7 341.0 1.4 1.2 1.6 1.4 1.1 1.1 1.9 1.7 352.0 1.9 1.8 1.2 1.3 1.5 1.3 2.0 1.5 362.0 1.7 1.9 1.2 2.1 1.5 2.0 2.7 1.5 374.0 2.2 2.2 1.3 2.2 1.4 2.2 2.0 1.7 386.0 1.2 2.5 1.8 1.9 1.2 4.1 2.5 5.1 396.0 1.7 4.7 1.5 1.1 1.8 4.7 4.7 5.5 40
– 1.4 .6 .4 .4 .4 .4 .9 .4 41
– 1.6 .9 .4 .4 .5 .5 .9 .5 42– 1.3 .9 .5 .8 .6 .7 1.6 .8 43
1.0 3.2 1.9 2.3 3.4 3.3 1.7 2.3 1.8 44– 2.0 1.3 .6 .9 .8 1.1 2.5 1.7 45
1.0 1.1 1.6 .8 .7 1.7 1.8 1.3 .5 461.0 1.4 1.2 .6 1.0 1.4 1.1 1.9 1.0 471.0 3.3 .9 1.2 1.0 .6 1.9 2.1 1.4 482.0 1.3 1.2 1.1 1.0 2.1 2.5 4.1 1.8 492.0 1.3 .8 2.5 1.3 2.5 3.2 3.2 1.1 50
– .9 1.2 .6 .5 .3 .6 .9 .5 51
– 1.2 1.5 .7 .6 .5 .5 1.2 .7 52– .6 .6 .5 .7 .6 .9 .8 .6 53– 2.8 1.5 2.6 2.8 1.7 3.1 3.5 1.5 54– .9 1.0 1.0 1.0 1.0 1.3 1.8 .7 55– 1.4 .8 .6 .9 1.7 2.7 1.9 2.1 56
1.0 1.4 .9 1.0 1.1 1.1 .8 1.6 .8 571.0 1.9 1.3 .4 .7 .7 1.6 1.6 .8 581.0 3.4 3.2 1.2 1.8 1.2 3.5 2.0 1.1 591.0 3.2 2.0 3.2 1.7 1.4 4.7 1.8 1.8 60
1992 ECONOMIC CENSUS CHARACTERISTICS OF BUSINESS OWNERS 171

Table 20d. Percent of Owner’s Total Personal Income Produced From the Business by Legal[All data are shown as percents, except firms. For meaning of abbreviations and symbols, see introductory text. For explanation of terms, see appendix A]
Type of firm and legal form of organization
Percent of total personal income derived from the business1
Firms(number) None
Lessthan 10 10 to 24 25 to 49 50 to 74 75 to 99 100
Notreported
A B C D E F G H I
All businesses 17 253 143................................ 12.9 22.9 8.4 6.7 5.5 11.1 24.1 8.51
Individual proprietorships 14 599 295............................. 10.4 23.2 8.8 7.2 5.6 10.4 25.3 9.22Partnerships 1 089 578........................................ 21.3 33.4 7.7 5.4 4.0 8.5 13.3 6.33Subchapter S corporations 1 564 270............................ 18.1 12.3 7.2 5.5 6.1 16.8 27.1 6.84
Hispanic ~owned businesses 771 708................... 12.5 17.4 8.5 6.1 5.8 9.3 30.2 10.25
Individual proprietorships 689 015............................. 10.2 18.2 9.0 6.2 5.9 8.4 30.7 11.36Partnerships 32 650........................................ 25.0 19.9 8.9 5.2 4.9 7.4 20.9 7.97Subchapter S corporations 50 042............................ 15.8 11.5 5.0 6.3 5.6 15.4 34.4 6.18
Black ~owned businesses 620 912...................... 17.7 22.9 9.5 6.2 5.0 5.9 18.8 13.99
Individual proprietorships 584 256............................. 16.7 23.8 9.6 6.3 4.9 5.6 18.5 14.610Partnerships 14 727........................................ 32.9 21.0 6.1 3.5 4.8 6.6 18.0 7.111Subchapter S corporations 21 928............................ 26.0 7.3 10.3 5.9 7.8 11.6 25.4 5.712
Other minority ~owned businesses 606 426............. 15.2 19.4 9.5 7.9 6.5 11.1 22.5 7.913
Individual proprietorships 502 022............................. 11.3 21.4 10.1 9.5 7.0 10.2 23.1 7.514Partnerships 49 489........................................ 28.1 19.8 7.7 3.8 6.8 7.6 15.3 10.815Subchapter S corporations 54 915............................ 14.7 13.4 9.3 7.1 5.1 16.9 27.3 6.416
Women ~owned businesses 5 888 883.................... 15.5 25.5 8.1 6.7 5.8 8.1 20.7 9.617
Individual proprietorships 5 078 077............................. 13.8 28.6 8.2 7.2 5.8 6.8 19.2 10.318Partnerships 243 651........................................ 30.6 25.4 10.2 4.7 4.0 6.6 10.3 8.219Subchapter S corporations 567 155............................ 15.6 11.2 6.9 5.6 6.2 14.7 32.9 6.920
Nonminority male ~owned businesses 10 114 456.......... 11.5 22.0 8.5 6.6 5.2 13.0 25.6 7.721
Individual proprietorships 8 414 238............................. 8.3 20.6 9.0 7.0 5.3 12.7 28.7 8.322Partnerships 777 379........................................ 18.1 37.3 6.9 5.8 3.8 9.1 13.7 5.423Subchapter S corporations 922 838............................ 19.9 12.9 7.4 5.2 6.1 18.1 23.6 6.824
1Data represent percentage of owners reporting in the designated categories.2For explanation of relative standard errors and standard errors, see Reliability of Estimates in the introductory text.3Relative standard errors are not applicable for lines 1 through 4 since these data are the result of censuses, not surveys.
172 CHARACTERISTICS OF BUSINESS OWNERS 1992 ECONOMIC CENSUS
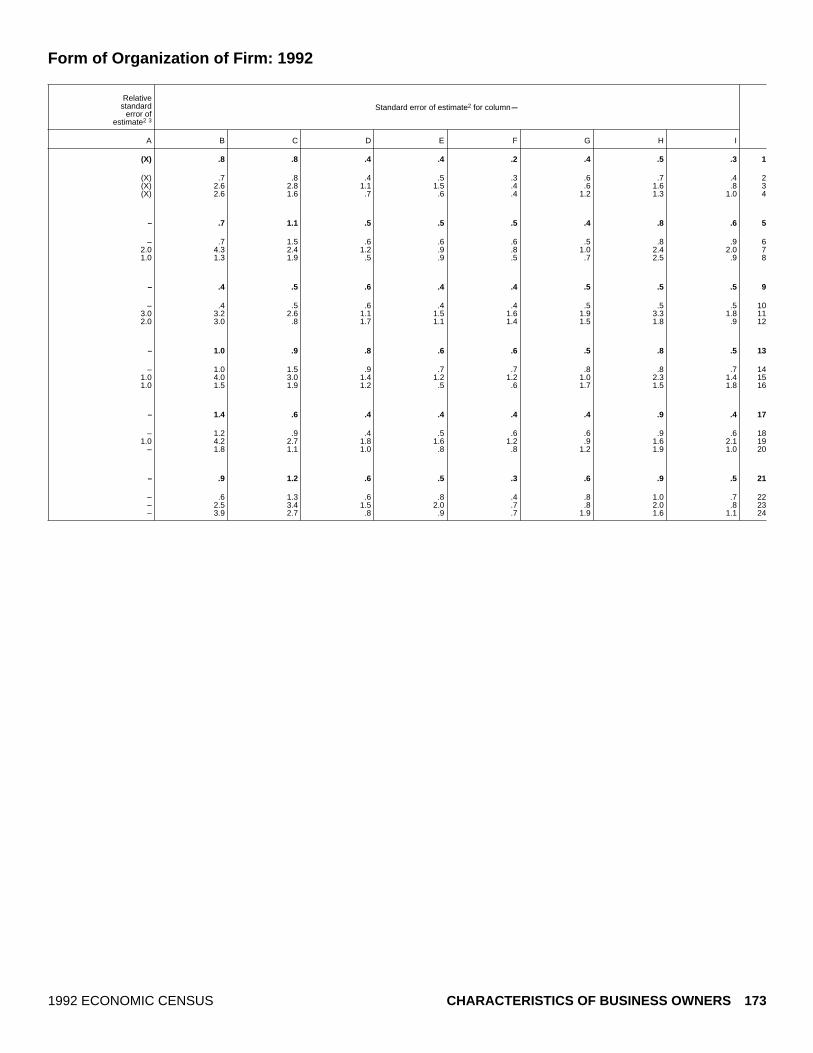
Form of Organization of Firm: 1992
Standard error of estimate2 for columnmRelative
standarderror of
estimate2 3
A B C D E F G H I
(X) .8 .8 .4 .4 .2 .4 .5 .3 1
(X) .7 .8 .4 .5 .3 .6 .7 .4 2(X) 2.6 2.8 1.1 1.5 .4 .6 1.6 .8 3(X) 2.6 1.6 .7 .6 .4 1.2 1.3 1.0 4
– .7 1.1 .5 .5 .5 .4 .8 .6 5
– .7 1.5 .6 .6 .6 .5 .8 .9 62.0 4.3 2.4 1.2 .9 .8 1.0 2.4 2.0 71.0 1.3 1.9 .5 .9 .5 .7 2.5 .9 8
– .4 .5 .6 .4 .4 .5 .5 .5 9
– .4 .5 .6 .4 .4 .5 .5 .5 103.0 3.2 2.6 1.1 1.5 1.6 1.9 3.3 1.8 112.0 3.0 .8 1.7 1.1 1.4 1.5 1.8 .9 12
– 1.0 .9 .8 .6 .6 .5 .8 .5 13
– 1.0 1.5 .9 .7 .7 .8 .8 .7 141.0 4.0 3.0 1.4 1.2 1.2 1.0 2.3 1.4 151.0 1.5 1.9 1.2 .5 .6 1.7 1.5 1.8 16
– 1.4 .6 .4 .4 .4 .4 .9 .4 17
– 1.2 .9 .4 .5 .6 .6 .9 .6 181.0 4.2 2.7 1.8 1.6 1.2 .9 1.6 2.1 19
– 1.8 1.1 1.0 .8 .8 1.2 1.9 1.0 20
– .9 1.2 .6 .5 .3 .6 .9 .5 21
– .6 1.3 .6 .8 .4 .8 1.0 .7 22– 2.5 3.4 1.5 2.0 .7 .8 2.0 .8 23– 3.9 2.7 .8 .9 .7 1.9 1.6 1.1 24
1992 ECONOMIC CENSUS CHARACTERISTICS OF BUSINESS OWNERS 173

Table 21a. Total Capital Needed by Firm to Start/Acquire the Business by Industry Division:[All data are shown as percents, except firms. For meaning of abbreviations and symbols, see introductory text. For explanation of terms, see appendix A]
Type of firm and industry division
Total capital needed to start/acquire the business1
Firms(number) None
Lessthan
$5,000
$5,000to
$9,999
$10,000to
$24,999
$25,000to
$49,999
$50,000to
$99,999
$100,000to
$249,999
$250,000to
$999,999$1,000,000
or moreNot
reported
A B C D E F G H I J K
All businesses 17 253 143............................. 25.6 34.3 9.0 10.0 5.2 4.3 2.9 1.6 .8 6.41
Agricultural services, forestry, fishing, and mining 583 253...... 21.0 30.0 14.3 10.0 6.7 3.2 2.7 2.7 .5 9.02Construction 1 829 620...................................... 26.4 43.2 10.5 8.8 3.0 2.5 .8 .3 .3 4.23Manufacturing 517 714.................................... 17.5 30.5 12.4 16.4 6.9 5.8 3.9 1.9 1.1 3.64Transportation, communications, and utilities 698 903.......... 25.7 19.0 10.8 18.7 9.6 4.6 1.7 .6 .6 8.65Wholesale trade 538 339................................... 21.1 28.4 10.6 12.0 7.9 6.6 5.2 2.1 .7 5.66
Retail trade 2 478 045....................................... 13.4 36.6 8.0 12.9 7.7 7.9 4.7 2.0 .3 6.57Finance, insurance, and real estate 1 941 029.................. 22.7 29.6 4.7 6.9 7.2 5.0 6.8 6.8 4.2 6.18Services 7 784 016.......................................... 30.6 35.4 9.6 8.9 3.6 3.5 1.7 .6 .2 5.99Industries not classified 882 224............................ 31.1 31.7 5.9 8.8 3.9 1.7 1.9 .4 .1 14.310
Hispanic ~owned businesses 771 708................ 28.8 32.0 10.9 9.7 4.1 3.0 1.9 .9 .3 8.411
Agricultural services, forestry, fishing, and mining 32 927...... 25.9 43.3 8.7 6.9 2.3 1.7 1.4 .5 .4 8.912Construction 97 476...................................... 32.7 33.8 10.4 8.3 2.7 1.4 .6 .7 .2 9.313Manufacturing 18 461.................................... 16.7 34.8 12.6 12.9 6.0 6.0 3.5 1.0 .8 5.814Transportation, communications, and utilities 47 797.......... 22.7 21.7 17.2 18.6 5.8 1.5 1.3 .4 .4 10.315Wholesale trade 17 727................................... 16.0 36.3 12.1 13.1 7.6 6.0 3.2 1.4 .3 3.816
Retail trade 107 846....................................... 17.3 32.9 12.0 12.5 8.2 4.6 4.2 1.4 .2 6.817Finance, insurance, and real estate 49 231.................. 20.1 32.4 7.6 10.2 5.7 6.3 4.6 4.6 2.4 6.018Services 347 297.......................................... 33.4 31.9 10.4 8.1 3.2 2.6 1.4 .4 .1 8.419Industries not classified 52 945............................ 38.6 26.5 10.4 7.8 .9 1.9 .6 .2 – 13.120
Black ~owned businesses 620 912................... 32.7 34.5 8.8 6.9 2.9 1.5 .8 .3 .2 11.421
Agricultural services, forestry, fishing, and mining 10 309...... 26.2 42.1 9.0 8.0 2.5 .6 .3 .6 .1 10.622Construction 43 381...................................... 39.1 34.9 8.5 5.7 1.7 .5 .5 – – 9.223Manufacturing 10 469.................................... 23.7 36.4 12.6 10.3 3.1 1.6 1.1 .3 .2 10.724Transportation, communications, and utilities 49 095......... 25.4 25.5 15.1 12.6 5.3 1.9 .5 .5 .1 13.225Wholesale trade 7 550................................... 24.2 38.4 11.3 7.6 6.1 4.1 1.1 .3 .2 6.526
Retail trade 86 840....................................... 20.7 42.3 9.6 9.6 4.1 2.3 .6 .5 .3 10.027Finance, insurance, and real estate 40 924.................. 25.6 38.2 8.7 8.4 3.7 2.9 1.5 1.1 1.4 8.428Services 332 981.......................................... 36.9 33.7 7.8 5.3 2.4 1.3 .9 .2 – 11.529Industries not classified 39 363............................ 36.3 28.8 7.5 5.8 2.2 1.2 .9 – .3 16.930
Other minority ~owned businesses 606 426........... 18.5 22.7 9.9 13.9 10.4 9.0 6.8 3.0 1.5 4.431
Agricultural services, forestry, fishing, and mining 15 218...... 20.1 31.2 11.8 12.8 5.2 4.9 4.2 3.0 2.3 4.632Construction 28 295...................................... 21.5 35.7 11.0 11.6 5.3 4.0 2.8 1.1 2.5 4.533Manufacturing 18 976.................................... 20.1 22.2 11.4 16.6 11.1 6.1 4.9 2.6 1.9 3.134Transportation, communications, and utilities 24 362.......... 15.9 24.2 21.7 16.2 8.2 5.7 3.1 .7 .6 3.735Wholesale trade 20 043................................... 16.8 21.9 11.9 15.4 11.5 8.0 6.4 2.3 .7 5.236
Retail trade 132 483....................................... 6.9 14.6 8.7 18.1 15.4 18.3 12.3 2.4 .2 3.137Finance, insurance, and real estate 64 762.................. 20.3 14.4 8.9 11.0 9.0 4.9 7.8 9.9 8.1 5.738Services 273 774.......................................... 22.5 27.1 9.1 12.3 9.2 6.9 5.4 2.3 .6 4.639Industries not classified 28 512............................ 28.7 19.8 10.8 13.5 9.5 8.1 1.3 1.0 – 7.340
Women ~owned businesses 5 888 883.................. 30.8 36.0 7.4 8.0 3.6 3.8 2.3 1.0 .4 6.841
Agricultural services, forestry, fishing, and mining 119 731...... 24.7 25.8 11.8 10.1 5.1 5.9 3.3 2.0 .5 10.942Construction 183 695...................................... 24.6 38.3 8.6 9.7 4.4 2.6 2.6 .8 .8 7.643Manufacturing 152 346.................................... 19.2 34.7 10.7 14.8 4.4 5.4 3.4 1.3 .5 5.644Transportation, communications, and utilities 141 623.......... 33.5 20.1 6.1 16.1 9.1 6.1 2.5 1.0 .2 5.245Wholesale trade 154 542................................... 23.0 31.3 10.2 11.2 7.3 5.7 3.4 2.5 .4 5.346
Retail trade 1 093 342....................................... 17.5 41.9 7.4 11.1 4.8 6.2 3.2 1.4 .1 6.447Finance, insurance, and real estate 602 802.................. 26.9 34.1 6.1 7.4 3.1 4.7 5.0 3.0 1.9 8.048Services 3 158 444.......................................... 37.3 36.0 7.3 6.1 2.8 2.6 1.4 .3 .1 6.149Industries not classified 282 358............................ 34.9 31.7 5.1 7.9 2.5 1.7 2.1 .2 – 13.850
Nonminority male ~owned businesses 10 114 456........ 22.8 34.0 9.8 10.9 5.9 4.5 3.1 2.0 1.0 6.051
Agricultural services, forestry, fishing, and mining 412 917...... 19.6 29.8 15.6 10.1 7.6 2.5 2.6 3.1 .5 8.652Construction 1 496 056...................................... 25.9 44.6 10.8 8.8 2.9 2.6 .6 .3 .2 3.453Manufacturing 333 485.................................... 16.7 28.8 13.2 17.3 7.9 6.0 4.2 2.1 1.3 2.554Transportation, communications, and utilities 458 400.......... 24.2 18.0 10.7 19.8 10.6 4.6 1.5 .5 .8 9.355Wholesale trade 352 721................................... 20.5 27.1 10.6 12.2 8.0 6.9 6.1 1.9 .8 5.956
Retail trade 1 197 943....................................... 10.1 34.2 8.2 13.8 9.7 8.9 5.5 2.6 .4 6.657Finance, insurance, and real estate 1 240 594.................. 20.8 28.1 3.8 6.3 9.2 5.1 7.8 8.5 5.1 5.458Services 4 102 294.......................................... 26.0 35.4 11.2 11.0 4.0 4.0 1.8 .7 .3 5.659Industries not classified 520 046............................ 29.0 32.3 5.7 9.2 4.8 1.5 2.0 .5 .1 14.960
1Data represent percentage of firms reporting in the designated categories.2For explanation of relative standard errors and standard errors, see Reliability of Estimates in the introductory text.3Relative standard errors are not applicable for lines 1 through 10 since these data are the result of censuses, not surveys.
174 CHARACTERISTICS OF BUSINESS OWNERS 1992 ECONOMIC CENSUS

1992
Standard error of estimate2 for columnmRelative
standarderror of
estimate2 3
A B C D E F G H I J K
(X) .9 1.2 .5 .4 .3 .3 .2 .1 .1 .3 1
(X) 2.9 2.5 1.6 1.7 1.0 .7 .3 1.5 .1 1.6 2(X) 2.8 2.5 2.2 1.5 .6 .6 .1 .1 .1 .9 3(X) 1.8 2.7 1.6 1.5 1.0 .7 .6 .2 .1 .4 4(X) 2.3 1.1 1.9 1.9 1.6 .8 .3 .1 .1 .8 5(X) 1.7 1.7 1.3 1.2 .8 1.0 .6 .2 .1 1.2 6
(X) .7 1.4 1.0 .9 .7 1.0 .8 .2 .1 .9 7(X) 2.0 1.8 .8 1.1 1.3 .9 1.0 .9 .5 .8 8(X) 1.3 1.5 .8 .5 .4 .4 .2 .1 – .6 9(X) 2.9 3.5 1.0 1.9 1.1 .7 .7 .1 .1 2.1 10
– .7 1.1 .9 .4 .4 .2 .1 .1 .1 .8 11
1.0 2.9 3.6 1.7 1.1 .8 .4 .5 .3 .2 3.2 121.0 2.4 1.5 1.4 1.2 1.1 .4 .2 .4 .1 1.8 131.0 2.1 2.4 1.7 1.5 1.2 1.0 .7 .2 .4 1.0 141.0 2.5 3.1 2.4 1.8 .9 .6 .5 .3 .3 1.9 152.0 2.1 2.8 1.7 2.2 .7 .8 .7 .4 .1 1.2 16
1.0 1.6 2.4 1.4 1.0 1.0 .5 .7 .3 .1 1.2 171.0 1.8 2.9 1.4 2.1 1.1 1.3 .9 .8 .4 1.2 18
– 1.6 2.2 1.5 .7 .5 .3 .3 .1 – 1.4 191.0 2.8 2.1 2.2 1.4 .6 .9 .3 .2 – 2.3 20
– .9 .7 .4 .4 .2 .1 .1 – – .4 21
1.0 1.7 2.1 1.2 1.3 .7 .2 .1 .4 .1 1.7 22– 2.8 1.9 1.1 1.3 .4 .3 .2 – – 1.6 23
1.0 1.6 2.0 1.4 1.0 .8 .5 .4 .1 .1 1.7 24– 2.1 2.2 .8 1.8 .9 .7 .5 .3 .1 1.1 25
2.0 2.2 3.1 1.0 1.2 1.7 1.1 .4 .1 .1 .9 26
– 1.3 1.6 1.1 .9 .6 .3 .1 .2 .2 1.3 271.0 1.7 2.0 1.1 .7 .5 .5 .4 .3 .3 1.0 28
– 1.2 1.2 .6 .6 .4 .1 .2 .1 – .5 29– 2.7 1.7 1.1 1.1 .7 .6 .5 – .3 2.6 30
– .5 1.0 .5 .8 .5 .5 .4 .2 .2 .5 31
1.0 2.5 3.1 1.9 2.2 1.5 1.3 1.5 .8 1.0 1.9 321.0 2.8 3.4 1.3 2.1 1.4 1.1 1.3 .3 1.0 1.7 331.0 3.1 2.5 2.3 2.7 1.8 1.2 1.0 .7 .6 1.0 341.0 2.7 3.2 4.6 3.9 1.9 1.6 1.8 .3 .2 2.6 351.0 2.3 2.3 1.9 1.3 1.7 1.3 1.1 .4 .2 2.3 36
1.0 1.6 2.6 1.5 1.3 1.5 1.4 1.2 .3 .1 .7 371.0 3.1 2.0 2.5 1.6 2.2 1.0 1.5 1.2 1.2 1.7 38
– 1.7 1.6 1.0 1.5 1.1 .7 .8 .4 .1 .8 391.0 3.4 2.1 2.9 2.8 2.7 1.6 .8 .8 – 1.7 40
– 1.1 1.5 .6 .6 .4 .4 .2 .1 .1 .6 41
– 2.8 2.7 2.0 2.1 1.6 1.3 .8 .6 .2 3.1 42– 3.1 2.5 1.2 1.0 .7 .5 .5 .1 .6 1.3 43– 1.8 3.0 1.4 1.3 .6 .8 .5 .2 .1 1.4 44– 2.7 2.9 .8 3.2 1.2 1.5 .7 .3 .1 1.4 45– 2.6 2.2 1.4 1.6 1.3 1.3 .6 .6 .1 1.0 46
– .7 1.4 1.3 1.6 .8 .9 .3 .3 .1 1.0 47– 1.7 1.5 1.4 1.2 .6 1.1 1.2 .7 .4 1.6 48– 2.0 2.2 .9 .7 .5 .5 .2 .1 – .5 49– 3.3 2.8 1.1 2.2 1.2 .8 1.1 .1 – 2.8 50
– 1.0 1.4 .8 .7 .6 .4 .3 .1 .1 .5 51
– 3.8 3.4 2.0 2.1 1.6 .8 .4 2.4 .2 2.1 52– 3.4 3.2 2.6 1.7 .8 .7 .2 .1 .1 1.0 53– 2.3 3.1 2.2 2.0 1.6 1.0 .8 .3 .2 .6 54– 3.1 2.2 2.9 3.0 2.2 1.1 .4 .1 .2 1.3 55– 2.4 2.5 1.8 1.6 1.1 1.2 .9 .2 .2 1.6 56
– 1.8 2.8 1.6 1.8 1.5 1.9 1.4 .3 .1 1.5 57– 3.4 2.8 1.1 1.7 1.9 1.3 1.5 1.3 .8 1.3 58– 1.3 1.9 1.1 1.1 .8 .8 .3 .2 .1 1.0 59– 4.2 4.9 1.4 2.9 1.6 1.5 .8 .2 .1 2.9 60
1992 ECONOMIC CENSUS CHARACTERISTICS OF BUSINESS OWNERS 175

Table 21b. Total Capital Needed by Firm to Start/Acquire the Business by Receipts Size of[All data are shown as percents, except firms. For meaning of abbreviations and symbols, see introductory text. For explanation of terms, see appendix A]
Type of firm and receipts size
Total capital needed to start/acquire the business1
Firms(number) None
Lessthan
$5,000
$5,000to
$9,999
$10,000to
$24,999
$25,000to
$49,999
$50,000to
$99,999
$100,000to
$249,999
$250,000to
$999,999$1,000,000
or moreNot
reported
A B C D E F G H I J K
All businesses 17 253 143............................. 25.6 34.3 9.0 10.0 5.2 4.3 2.9 1.6 .8 6.41
Less than $5,000 5 226 553.................................. 36.0 38.0 5.6 5.0 2.1 1.8 .9 .7 – 9.92$5,000 to $9,999 2 443 946.................................. 34.6 37.1 8.3 6.2 2.5 1.8 .7 .3 .5 8.03$10,000 to $24,999 3 076 410................................ 26.3 42.8 10.3 9.0 2.6 2.6 .9 .2 .1 5.44$25,000 to $49,999 1 945 806................................ 18.3 35.9 12.1 14.1 6.9 3.8 3.6 .3 .3 4.65$50,000 to $99,999 1 615 940................................ 16.3 30.5 13.4 16.8 8.2 5.9 3.4 2.2 .1 3.16
$100,000 to $199,999 1 197 996.............................. 13.7 25.8 10.9 15.2 11.6 9.6 4.9 3.7 1.3 3.27$200,000 to $249,999 301 794.............................. 12.4 15.6 6.3 19.7 14.0 15.9 8.3 5.0 .4 2.58$250,000 to $499,999 682 583.............................. 9.3 15.7 10.1 17.9 12.4 12.2 10.6 5.4 2.9 3.49$500,000 to $999,999 372 078.............................. 7.7 13.9 9.0 12.7 11.0 13.0 14.1 8.0 6.1 4.410$1,000,000 or more 390 037................................ 9.7 11.6 5.7 10.6 9.1 11.2 13.2 13.3 10.7 4.811
Hispanic ~owned businesses 771 708................ 28.8 32.0 10.9 9.7 4.1 3.0 1.9 .9 .3 8.412
Less than $5,000 219 226.................................. 38.4 35.4 6.0 4.4 1.0 .8 .3 .3 – 13.513$5,000 to $9,999 140 362.................................. 40.5 30.7 7.3 4.9 2.7 .8 .1 – – 12.914$10,000 to $24,999 165 667................................ 34.1 33.5 11.5 7.2 2.4 1.3 1.0 .4 – 8.515$25,000 to $49,999 87 288................................ 24.0 36.9 16.9 11.5 2.5 1.9 1.5 .4 – 4.416$50,000 to $99,999 64 742................................ 13.8 30.8 15.6 18.7 8.1 5.9 2.2 1.1 .2 3.617
$100,000 to $199,999 41 578.............................. 10.1 27.9 15.4 21.2 10.8 6.7 3.2 2.0 1.0 1.918$200,000 to $249,999 10 030.............................. 11.0 22.6 9.5 16.8 12.9 13.4 7.4 2.5 1.0 2.919$250,000 to $499,999 22 301.............................. 9.3 19.3 14.0 17.8 11.2 10.8 10.6 2.7 1.0 3.120$500,000 to $999,999 11 319.............................. 9.7 16.8 11.5 14.9 12.9 11.3 10.6 5.9 2.6 3.821$1,000,000 or more 9 194................................ 6.5 14.8 7.7 14.4 10.4 12.6 12.5 10.5 7.0 3.622
Black ~owned businesses 620 912................... 32.7 34.5 8.8 6.9 2.9 1.5 .8 .3 .2 11.423
Less than $5,000 236 722.................................. 38.8 34.7 6.1 3.2 1.4 .5 .3 .1 .1 14.924$5,000 to $9,999 111 512.................................. 35.6 37.3 6.9 5.3 1.0 .2 .7 – – 13.025$10,000 to $24,999 129 901................................ 32.6 36.5 8.7 7.4 3.4 1.0 .5 .1 – 9.826$25,000 to $49,999 62 209................................ 25.9 34.3 16.2 9.8 3.6 2.0 .8 .2 – 7.027$50,000 to $99,999 39 218................................ 19.8 30.2 15.6 16.7 7.3 3.0 1.1 .3 .1 5.828
$100,000 to $199,999 20 936.............................. 13.3 26.4 14.1 18.6 9.4 9.8 2.7 1.5 .4 3.729$200,000 to $249,999 4 533.............................. 12.4 17.3 11.0 19.5 11.6 16.9 7.0 1.5 .9 2.030$250,000 to $499,999 9 029.............................. 13.0 19.8 10.8 14.2 13.0 11.0 8.2 3.2 1.7 5.231$500,000 to $999,999 3 823.............................. 12.2 14.7 10.5 15.3 10.0 10.7 9.7 6.9 4.3 5.732$1,000,000 or more 3 028................................ 13.8 10.7 11.0 8.6 7.9 15.4 9.1 11.7 7.6 4.333
Other minority ~owned businesses 606 426........... 18.5 22.7 9.9 13.9 10.4 9.0 6.8 3.0 1.5 4.434
Less than $5,000 132 493.................................. 35.2 34.4 9.6 6.1 4.8 2.3 1.7 .2 .8 5.135$5,000 to $9,999 80 435.................................. 33.6 29.7 8.2 13.2 5.1 1.9 1.1 1.3 .6 5.336$10,000 to $24,999 108 195................................ 21.7 38.8 10.5 9.4 5.8 4.6 2.3 .1 .9 5.937$25,000 to $49,999 77 345................................ 10.5 19.1 13.4 22.5 13.8 8.1 6.3 3.4 – 3.038$50,000 to $99,999 70 360................................ 12.3 15.9 12.9 18.4 13.1 13.4 5.9 3.0 .8 4.339
$100,000 to $199,999 58 620.............................. 7.1 10.2 7.2 18.0 17.9 18.0 12.2 3.7 1.7 4.140$200,000 to $249,999 15 740.............................. 7.7 8.0 8.9 14.5 20.9 16.0 13.6 7.3 .8 2.441$250,000 to $499,999 34 266.............................. 5.0 7.6 7.7 15.1 13.0 17.4 20.0 7.1 3.4 3.842$500,000 to $999,999 16 467.............................. 6.3 6.5 6.8 12.2 13.4 16.1 16.1 12.6 6.3 3.743$1,000,000 or more 12 505................................ 5.1 6.9 5.9 10.3 9.5 14.8 18.2 11.9 13.1 4.144
Women ~owned businesses 5 888 883.................. 30.8 36.0 7.4 8.0 3.6 3.8 2.3 1.0 .4 6.845
Less than $5,000 2 310 303.................................. 37.8 39.5 4.6 4.7 1.5 .9 .6 .3 – 10.146$5,000 to $9,999 967 380.................................. 38.0 38.0 6.5 7.2 2.3 1.4 1.0 .5 .5 4.747$10,000 to $24,999 1 051 358................................ 30.9 40.0 9.3 6.8 2.0 3.7 1.5 .4 .1 5.348$25,000 to $49,999 538 885................................ 24.7 35.2 10.8 13.5 4.2 3.9 2.5 .2 – 5.049$50,000 to $99,999 381 517................................ 17.3 32.1 11.3 12.3 7.7 8.0 3.5 1.8 .3 5.850
$100,000 to $199,999 267 089.............................. 11.7 22.4 10.0 14.9 13.2 14.1 7.4 2.1 1.4 2.851$200,000 to $249,999 66 464.............................. 10.1 18.0 6.1 18.7 9.9 17.2 9.2 5.0 .6 5.252$250,000 to $499,999 146 313.............................. 8.2 15.5 11.0 15.0 13.2 14.4 12.8 4.8 1.3 3.953$500,000 to $999,999 80 539.............................. 7.6 15.0 8.4 13.9 11.5 13.2 14.8 9.1 2.9 3.654$1,000,000 or more 79 037................................ 9.4 11.6 7.5 11.8 9.0 13.0 14.7 11.4 7.1 4.455
Nonminority male ~owned businesses 10 114 456........ 22.8 34.0 9.8 10.9 5.9 4.5 3.1 2.0 1.0 6.056
Less than $5,000 2 608 047.................................. 34.3 37.0 6.2 5.4 2.6 2.5 1.1 1.2 – 9.457$5,000 to $9,999 1 285 456.................................. 31.8 37.2 10.0 5.1 2.6 2.2 .5 .2 .5 9.958$10,000 to $24,999 1 763 830................................ 22.9 45.7 10.9 10.4 2.8 1.9 .4 – – 5.059$25,000 to $49,999 1 248 482................................ 15.6 36.8 12.0 14.1 8.3 3.7 4.2 .2 .5 4.660$50,000 to $99,999 1 108 065................................ 16.0 30.7 14.0 18.1 8.1 5.0 3.3 2.4 – 2.261
$100,000 to $199,999 840 723.............................. 14.9 27.5 11.1 14.7 11.0 8.1 3.9 4.2 1.3 3.462$200,000 to $249,999 212 693.............................. 13.7 14.7 5.9 20.3 14.9 15.9 7.8 4.8 .3 1.663$250,000 to $499,999 488 462.............................. 9.8 15.9 9.8 19.1 12.2 11.4 9.4 5.6 3.5 3.364$500,000 to $999,999 266 408.............................. 7.6 13.8 9.3 12.3 10.7 12.9 14.1 7.6 7.2 4.665$1,000,000 or more 292 290................................ 10.1 11.8 5.2 10.1 9.1 10.5 12.7 13.9 11.6 5.066
1Data represent percentage of firms reporting in the designated categories.2For explanation of relative standard errors and standard errors, see Reliability of Estimates in the introductory text.3Relative standard errors are not applicable for lines 1 through 11 since these data are the result of censuses, not surveys.
176 CHARACTERISTICS OF BUSINESS OWNERS 1992 ECONOMIC CENSUS

Firm: 1992
Standard error of estimate2 for columnmRelative
standarderror of
estimate2 3
A B C D E F G H I J K
(X) .9 1.2 .5 .4 .3 .3 .2 .1 .1 .3 1
(X) 1.5 1.9 .5 .6 .5 .5 .3 .3 – .8 2(X) 2.7 2.5 1.3 1.0 .8 .6 .2 .2 .2 1.3 3(X) 2.3 2.7 1.6 1.2 .4 .5 .3 .1 – .8 4(X) 3.0 1.4 2.0 .9 1.7 1.0 1.1 .1 .3 1.4 5(X) 1.3 1.6 1.4 1.1 .8 .8 .7 .4 – .5 6
(X) 1.2 1.7 1.1 1.0 .9 .7 .5 .4 .3 .5 7(X) 1.8 1.1 1.2 2.1 2.1 2.5 2.0 1.9 .2 .8 8(X) .8 1.2 1.2 .7 1.3 1.2 1.0 .6 .5 .5 9(X) .5 .6 .9 .9 .7 .8 .6 .5 .6 .4 10(X) .3 .6 .3 .6 .5 .4 .4 .8 .4 .3 11
– .7 1.1 .9 .4 .4 .2 .1 .1 – .8 12
1.0 2.5 2.1 1.4 1.1 .5 .4 .2 .2 – 2.0 131.0 3.4 2.5 1.6 1.2 .7 .5 – – .1 1.4 141.0 2.2 1.7 1.5 1.2 .6 .4 .6 .2 – 1.6 151.0 3.4 3.2 3.2 1.4 .7 .6 .8 .2 – 1.2 161.0 1.5 1.7 1.6 2.1 1.1 .9 .5 .3 .1 .9 17
1.0 1.0 2.1 1.8 1.9 1.7 1.0 .5 .4 .4 .4 183.0 1.8 3.2 2.2 2.6 3.0 3.7 1.7 1.2 .5 .9 192.0 .7 1.3 1.3 1.9 .9 1.5 1.3 .7 .3 .5 203.0 1.4 1.5 1.6 1.7 1.6 1.6 1.8 1.0 .7 1.0 212.0 1.1 1.2 1.3 1.4 1.0 1.2 1.3 .7 .9 .5 22
– .9 .7 .4 .4 .2 .1 .1 – – .4 23
– 1.6 1.7 .5 .5 .3 .1 .2 .1 .1 1.0 24– 1.8 2.3 1.1 .6 .5 .1 .4 – – 1.1 25– 1.7 1.8 1.2 .8 .9 .4 .2 – – 1.1 26– 1.9 2.3 2.1 1.5 .7 .7 .3 .2 – 1.1 27
1.0 2.1 2.1 1.4 .8 1.3 .5 .3 .2 .1 1.2 28
1.0 1.3 1.7 1.2 1.8 1.5 1.3 .7 .6 .2 .9 293.0 2.4 2.9 2.0 3.6 2.9 3.6 4.2 1.0 1.3 .8 303.0 1.5 1.7 2.2 2.6 1.5 .9 1.4 1.1 .7 .8 314.0 2.1 1.9 1.8 3.6 1.2 1.4 1.8 1.9 1.4 1.3 324.0 2.0 1.3 1.9 1.3 .7 2.1 1.4 1.5 2.0 .6 33
– .5 1.0 .5 .8 .5 .5 .4 .2 .2 .5 34
1.0 2.6 2.5 2.6 1.4 1.5 .6 1.0 .1 .4 1.2 351.0 3.7 3.0 2.1 3.6 2.5 1.1 .6 .9 .7 1.9 361.0 2.8 3.2 2.3 2.3 2.2 1.1 .7 .1 .5 1.4 371.0 1.8 3.4 2.5 2.7 3.1 3.2 2.2 1.6 – 1.1 381.0 2.1 2.1 2.4 2.6 1.2 1.9 1.6 .9 .4 1.3 39
1.0 1.5 .7 1.0 1.3 1.5 1.9 .9 .8 .7 .9 402.0 2.3 1.8 1.8 3.5 3.3 3.3 2.6 2.7 .4 .9 411.0 .7 1.3 1.0 1.9 1.0 1.5 1.2 1.1 .5 .6 422.0 1.1 .8 .7 1.5 1.6 1.6 1.3 .9 1.0 .7 432.0 .3 .8 1.0 .9 .8 1.1 .9 1.2 1.8 .6 44
– 1.1 1.5 .6 .6 .4 .4 .2 .1 .1 .6 45
– 1.3 2.5 1.0 .7 .4 .4 .2 .2 – 1.3 46– 3.0 2.1 1.6 1.3 1.0 .6 .3 .4 .3 .6 47– 2.5 2.9 1.1 1.1 .7 .9 .4 .3 .1 .6 48– 3.5 4.0 1.9 2.4 1.5 1.4 1.1 .1 – 1.3 49– 1.4 1.8 1.1 1.4 1.4 1.0 .6 .5 .1 1.2 50
– 1.7 2.8 2.1 1.4 2.0 1.4 1.5 .5 .2 .7 511.0 1.9 2.7 2.5 3.4 2.4 4.0 1.7 2.6 .3 1.9 521.0 1.2 1.1 1.8 1.2 .9 1.8 1.7 .6 .2 .7 531.0 .4 1.6 .8 1.2 1.1 1.2 1.5 1.5 .2 .9 541.0 .4 .5 .4 .7 .4 1.3 .8 .7 .5 .7 55
– 1.0 1.4 .8 .7 .6 .4 .3 .1 .1 .5 56
– 2.1 2.6 1.3 1.1 1.0 .8 .6 .5 .1 1.1 57– 3.8 3.9 2.1 1.4 1.0 1.5 .2 .2 .4 2.3 58– 2.8 3.9 3.0 2.0 .9 .8 .3 – – 1.5 59– 3.9 3.0 2.6 1.5 2.0 1.6 1.5 .2 .6 2.1 60– 2.2 2.6 1.9 1.6 1.1 1.0 .8 .5 – .7 61
– 1.5 1.9 1.4 1.3 .9 .9 .6 .7 .5 .8 62– 2.6 1.3 1.5 2.8 2.6 3.5 3.0 2.1 .2 1.2 63– 1.1 1.5 1.4 1.1 1.9 1.3 1.2 .7 .8 .8 64– .7 .8 1.2 1.3 .9 .9 .8 .6 .9 .7 65– .5 .8 .4 .7 .6 .4 .5 1.2 .5 .4 66
1992 ECONOMIC CENSUS CHARACTERISTICS OF BUSINESS OWNERS 177

Table 21c. Total Capital Needed by Firm to Start/Acquire the Business by Employment Size of[All data are shown as percents, except firms. For meaning of abbreviations and symbols, see introductory text. For explanation of terms, see appendix A]
Type of firm and employment size
Total capital needed to start/acquire the business1
Firms(number) None
Lessthan
$5,000
$5,000to
$9,999
$10,000to
$24,999
$25,000to
$49,999
$50,000to
$99,999
$100,000to
$249,999
$250,000to
$999,999$1,000,000
or moreNot
reported
A B C D E F G H I J K
All businesses 17 253 143............................. 25.6 34.3 9.0 10.0 5.2 4.3 2.9 1.6 .8 6.41
With no paid employees 14 118 184............................ 28.9 37.2 8.7 8.5 3.6 2.8 1.6 1.0 .5 7.22With paid employees 3 134 959............................... 11.2 21.7 10.5 16.4 11.8 11.0 8.2 4.1 2.0 3.13
No employees4 435 838.................................. 12.0 33.2 11.0 15.4 7.0 7.4 8.4 2.7 .6 2.141 to 4 employees 1 716 076................................ 12.1 23.8 12.4 17.5 13.1 10.3 5.3 2.0 .7 2.955 to 9 employees 503 808................................ 9.1 16.3 8.2 17.6 11.4 14.0 13.3 4.6 2.1 3.5610 to 19 employees 256 110.............................. 11.0 10.9 6.9 14.7 12.5 14.4 12.3 8.7 4.2 4.4720 to 49 employees 144 734.............................. 8.3 10.7 4.9 9.4 11.1 12.4 14.8 16.3 7.0 5.2850 to 99 employees 45 331.............................. 6.7 11.1 4.1 6.1 5.8 11.1 13.0 19.9 19.0 3.29100 employees or more 33 062.......................... 7.0 10.5 3.4 8.6 4.5 10.2 11.6 15.6 24.7 3.810
Hispanic ~owned businesses 771 708................ 28.8 32.0 10.9 9.7 4.1 3.0 1.9 .9 .3 8.411
With no paid employees 656 343............................ 32.5 34.1 9.7 8.1 2.8 1.6 .8 .5 .2 9.812With paid employees 115 364............................... 13.0 22.9 16.0 16.5 9.7 8.8 6.7 2.6 1.0 2.613
No employees4 19 569.................................. 18.9 24.7 17.3 15.3 4.3 7.2 7.6 1.4 1.0 2.3141 to 4 employees 64 631................................ 14.3 25.3 18.3 16.8 9.6 7.2 4.1 1.4 .4 2.6155 to 9 employees 16 937................................ 7.4 18.8 11.9 18.5 12.5 12.0 11.6 3.8 .8 2.81610 to 19 employees 8 553.............................. 7.5 19.3 9.1 17.1 14.8 14.1 10.7 3.1 1.5 2.71720 to 49 employees 4 050.............................. 7.1 10.8 12.3 9.6 10.4 15.4 13.9 13.3 4.7 2.71850 to 99 employees 948.............................. 6.2 8.2 7.1 17.8 11.9 5.8 12.8 16.2 8.0 6.019100 employees or more 676.......................... 7.2 18.0 4.4 7.1 6.6 18.4 4.1 16.1 16.8 1.320
Black ~owned businesses 620 912................... 32.7 34.5 8.8 6.9 2.9 1.5 .8 .3 .2 11.421
With no paid employees 556 434............................ 34.9 34.8 8.4 6.0 2.3 .9 .6 .1 .1 12.022With paid employees 64 478............................... 14.7 32.1 12.6 14.3 8.5 6.7 2.9 1.6 .6 6.023
No employees4 13 725.................................. 23.6 31.3 12.0 15.0 4.0 3.8 1.9 .6 .3 7.6241 to 4 employees 37 587................................ 12.7 36.1 13.6 14.3 9.3 5.8 1.9 .7 .2 5.3255 to 9 employees 7 853................................ 9.3 22.6 9.8 17.1 8.9 14.3 6.4 1.9 1.7 7.92610 to 19 employees 2 839.............................. 16.7 21.0 8.5 8.8 17.4 7.9 9.2 5.7 .5 4.32720 to 49 employees 1 700.............................. 9.1 10.2 11.7 11.2 11.1 16.1 9.1 13.8 4.4 3.52850 to 99 employees 432.............................. 8.3 3.5 6.1 2.0 6.2 16.8 12.5 29.4 9.3 6.029100 employees or more 342.......................... 13.9 18.7 14.9 7.0 5.9 6.6 8.1 13.6 8.6 2.630
Other minority ~owned businesses 606 426........... 18.5 22.7 9.9 13.9 10.4 9.0 6.8 3.0 1.5 4.431
With no paid employees 470 075............................ 23.3 27.3 10.5 13.2 8.7 5.8 3.3 2.2 1.0 4.732With paid employees 136 351............................... 5.5 10.1 8.2 15.7 14.8 17.5 16.1 5.3 2.9 3.833
No employees4 19 989.................................. 5.0 11.1 7.3 24.9 8.9 13.8 14.0 3.3 2.8 8.8341 to 4 employees 76 636................................ 6.1 12.2 9.5 16.3 16.8 17.1 14.4 3.6 1.0 2.9355 to 9 employees 22 862................................ 5.2 5.8 6.3 11.9 15.4 22.8 20.3 5.6 2.9 3.73610 to 19 employees 10 051.............................. 4.1 7.3 8.2 10.5 12.6 18.1 20.1 10.8 5.7 2.73720 to 49 employees 5 034.............................. 3.3 4.9 4.6 9.8 11.6 15.6 21.0 16.6 9.8 2.83850 to 99 employees 1 075.............................. 4.7 7.9 3.7 7.1 5.0 11.9 11.4 17.4 27.4 3.539100 employees or more 705.......................... 6.2 2.9 .7 6.3 7.0 9.7 10.5 9.7 38.3 8.740
Women ~owned businesses 5 888 883.................. 30.8 36.0 7.4 8.0 3.6 3.8 2.3 1.0 .4 6.841
With no paid employees 5 071 110............................ 34.0 38.2 6.9 6.7 2.4 2.4 1.2 .5 .2 7.442With paid employees 817 773............................... 11.3 23.2 9.9 15.9 10.8 12.1 9.0 3.4 1.0 3.443
No employees4 127 905.................................. 9.1 35.7 12.9 16.4 5.6 8.8 8.1 1.9 .2 1.5441 to 4 employees 435 550................................ 14.4 24.4 10.4 16.1 11.3 11.5 6.5 1.3 .4 3.8455 to 9 employees 134 476................................ 5.4 17.7 9.4 17.1 11.3 16.4 13.4 5.8 1.0 2.64610 to 19 employees 67 487.............................. 9.3 13.3 6.4 16.0 14.1 13.9 13.7 7.1 1.6 4.84720 to 49 employees 35 515.............................. 6.8 13.2 5.6 8.4 15.2 11.3 14.6 15.4 4.1 5.34850 to 99 employees 10 178.............................. 8.7 12.3 7.6 10.0 5.9 11.4 14.7 13.1 12.3 3.849100 employees or more 6 663.......................... 3.2 9.2 7.6 11.5 9.4 11.0 11.9 10.6 22.1 3.550
Nonminority male ~owned businesses 10 114 456........ 22.8 34.0 9.8 10.9 5.9 4.5 3.1 2.0 1.0 6.051
With no paid employees 8 019 462............................ 25.8 37.3 9.6 9.4 4.3 3.0 1.9 1.4 .6 6.952With paid employees 2 094 993............................... 11.3 21.5 10.5 16.7 12.1 10.5 7.7 4.4 2.3 2.953
No employees4 271 380.................................. 13.2 33.7 10.1 14.7 7.7 6.7 8.5 3.3 .7 1.5541 to 4 employees 1 155 800................................ 11.4 23.8 12.9 18.2 13.9 9.8 4.5 2.2 .8 2.5555 to 9 employees 334 483................................ 10.7 16.0 7.7 18.1 11.1 12.9 13.2 4.1 2.5 3.85610 to 19 employees 173 140.............................. 12.1 9.7 7.1 14.2 11.7 14.5 11.5 9.4 5.3 4.55720 to 49 employees 101 938.............................. 9.0 10.1 4.4 9.7 9.7 12.6 14.6 16.6 7.9 5.45850 to 99 employees 33 406.............................. 6.2 11.1 3.2 4.8 5.5 11.0 12.8 21.5 20.7 3.059100 employees or more 24 846.......................... 8.1 10.7 2.0 7.8 2.9 10.2 11.8 17.3 25.3 3.860
1Data represent percentage of firms reporting in the designated categories.2For explanation of relative standard errors and standard errors, see Reliability of Estimates in the introductory text.3Relative standard errors are not applicable for lines 1 through 10 since these data are the result of censuses, not surveys.4Firms reported annual payroll, but did not report any employees on their payroll during specified period in 1992.
178 CHARACTERISTICS OF BUSINESS OWNERS 1992 ECONOMIC CENSUS

Firm: 1992
Standard error of estimate2 for columnmRelative
standarderror of
estimate2 3
A B C D E F G H I J K
(X) .9 1.2 .5 .4 .3 .3 .2 .1 .1 .3 1
(X) 1.2 1.4 .6 .5 .3 .3 .2 .1 .1 .4 2(X) .7 1.2 .6 .5 .5 .7 .6 .2 .2 .2 3(X) 2.8 4.1 2.5 2.0 1.9 2.7 1.9 .9 .3 .5 4(X) 1.1 1.4 .7 .9 .9 .8 .6 .3 .1 .3 5(X) 1.7 1.3 1.3 1.8 .9 1.6 1.0 .6 .4 .6 6(X) 1.4 1.3 1.0 1.1 1.4 1.7 .7 .9 .4 .5 7(X) 1.0 1.1 .9 .8 1.8 1.7 1.4 1.8 .7 .8 8(X) 1.3 2.2 .8 1.5 1.3 1.7 1.4 2.3 2.4 .6 9(X) 1.6 2.2 .8 2.5 .8 2.8 2.8 2.3 2.0 1.1 10
– .7 1.1 .9 .4 .4 .2 .1 .1 – .8 11
– .8 1.2 1.0 .6 .4 .2 .2 .1 – 1.0 121.0 1.6 1.4 1.7 1.0 1.2 .8 .7 .3 .1 .3 132.0 4.7 5.2 5.4 3.5 1.4 2.8 2.5 1.2 .5 .9 141.0 2.1 2.3 1.6 1.3 1.5 1.0 .6 .4 .2 .5 152.0 1.5 2.7 2.1 2.3 2.0 1.8 2.1 1.0 .3 .3 163.0 1.6 2.8 2.1 1.6 1.9 1.7 1.5 .5 .5 .9 174.0 2.9 1.4 2.9 1.0 2.7 2.3 2.3 1.3 1.2 .7 186.0 3.0 2.2 1.9 2.4 3.1 1.7 4.0 3.7 1.9 2.0 198.0 2.2 5.0 1.8 2.8 3.5 4.0 1.4 4.3 3.4 .6 20
– .9 .7 .4 .4 .2 .1 .1 – – .4 21
– 1.0 .8 .4 .4 .2 .1 .1 – – .4 221.0 1.3 1.2 1.0 1.2 1.1 .4 .5 .3 .1 .8 232.0 3.9 3.9 4.2 2.6 1.3 1.3 .6 .5 .2 2.7 241.0 1.1 1.9 1.2 1.3 1.4 .6 .4 .3 .1 1.0 253.0 1.2 4.1 2.4 2.8 1.8 2.7 2.4 .6 .7 2.8 264.0 3.0 2.1 1.6 2.3 4.5 2.0 2.7 2.3 .3 1.8 276.0 3.1 2.1 2.8 2.9 2.1 4.3 2.6 2.5 1.7 1.4 288.0 2.4 2.0 3.5 1.2 3.6 5.7 3.3 6.9 3.1 2.6 29
– 3.4 4.7 4.9 3.9 3.2 2.1 3.7 4.1 3.6 1.0 30
– .5 1.0 .5 .8 .5 .5 .4 .2 .2 .5 31
– .7 1.4 .7 1.2 1.0 .6 .7 .2 .2 .6 321.0 .6 .9 1.0 1.3 1.1 .9 1.1 .3 .4 .7 332.0 1.5 3.7 1.6 6.9 2.0 4.1 3.6 1.0 1.2 4.4 341.0 .9 1.0 1.5 .9 2.2 1.2 1.4 .6 .4 .6 352.0 .8 1.1 1.1 1.4 1.8 2.8 2.1 .5 .6 .7 362.0 1.1 1.9 3.2 1.5 1.8 2.2 2.0 1.7 1.0 1.3 374.0 .9 1.2 1.6 1.9 1.8 2.5 2.8 1.7 1.4 .9 386.0 3.2 3.0 2.4 1.8 1.2 1.3 3.3 3.6 6.3 1.8 396.0 2.2 .9 .4 3.3 2.7 4.3 2.4 3.0 7.3 2.7 40
– 1.1 1.5 .6 .6 .4 .4 .2 .1 .1 .6 41
– 1.3 1.6 .7 .5 .4 .4 .1 .1 .1 .7 42– 1.4 1.2 1.0 1.2 .8 .8 .8 .2 .1 .6 43
1.0 1.9 5.5 4.0 4.0 2.3 3.6 2.4 .6 .1 .3 44– 1.8 1.8 1.4 2.0 1.5 1.0 1.0 .3 .2 1.1 45
1.0 .7 1.7 1.1 2.4 1.5 1.7 1.4 1.3 .2 .5 461.0 1.7 1.8 1.2 2.6 1.1 2.4 .9 .9 .3 1.2 471.0 .9 2.9 1.4 1.6 2.7 2.1 2.6 1.6 .6 1.1 482.0 1.6 2.5 3.1 1.6 1.8 3.0 3.7 1.9 3.2 .7 492.0 1.0 1.7 2.7 4.1 2.4 3.3 2.9 3.7 4.2 1.5 50
– 1.0 1.4 .8 .7 .6 .4 .3 .1 .1 .5 51
– 1.4 1.6 1.0 .9 .5 .6 .3 .1 .1 .6 52– 1.1 1.5 .8 .5 .8 .8 .7 .3 .2 .3 53– 5.0 5.7 3.8 2.7 2.7 5.0 2.4 1.6 .4 .5 54– 1.8 1.6 1.1 1.3 1.3 .9 .6 .4 .2 .5 55– 2.3 2.0 1.7 2.1 1.5 1.9 1.2 .9 .6 1.1 56
1.0 2.2 1.4 1.2 1.8 1.9 2.0 1.0 1.3 .8 .6 571.0 1.1 1.1 .9 1.2 1.7 2.0 2.0 2.3 .7 1.0 581.0 1.9 2.6 .9 1.9 1.6 1.7 1.3 2.8 2.5 1.0 591.0 2.2 2.7 1.0 2.9 .8 3.7 3.6 2.9 2.4 1.8 60
1992 ECONOMIC CENSUS CHARACTERISTICS OF BUSINESS OWNERS 179
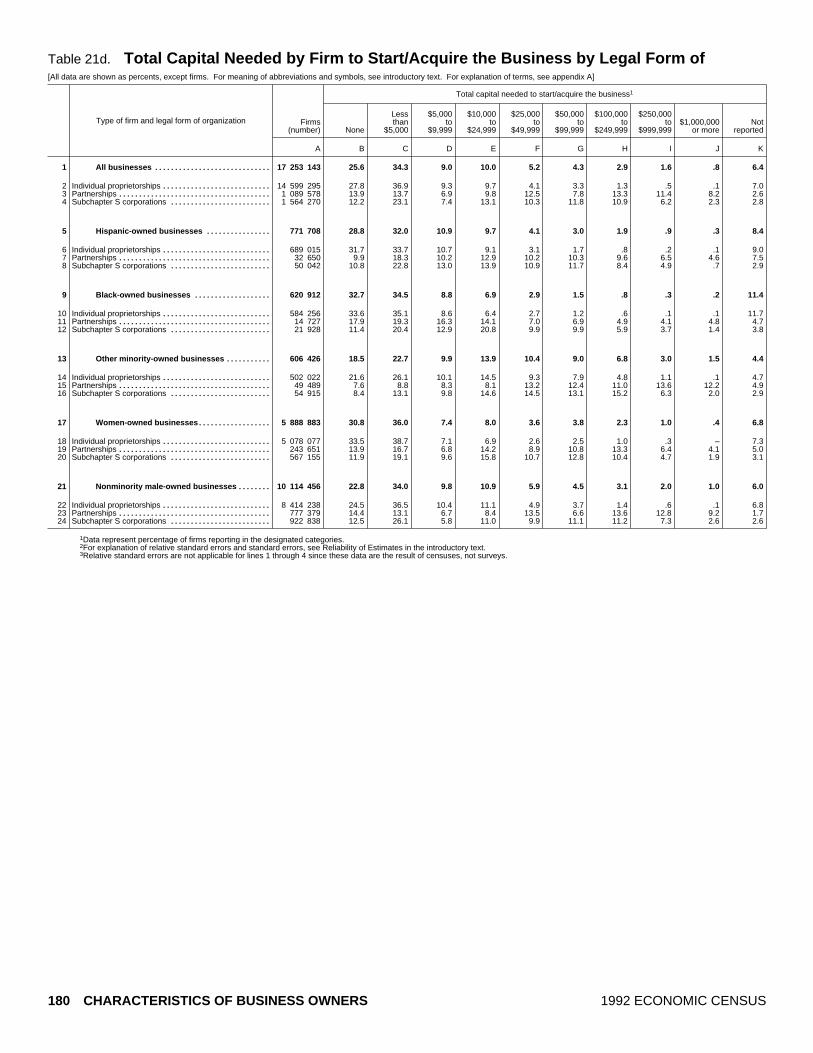
Table 21d. Total Capital Needed by Firm to Start/Acquire the Business by Legal Form of[All data are shown as percents, except firms. For meaning of abbreviations and symbols, see introductory text. For explanation of terms, see appendix A]
Type of firm and legal form of organization
Total capital needed to start/acquire the business1
Firms(number) None
Lessthan
$5,000
$5,000to
$9,999
$10,000to
$24,999
$25,000to
$49,999
$50,000to
$99,999
$100,000to
$249,999
$250,000to
$999,999$1,000,000
or moreNot
reported
A B C D E F G H I J K
All businesses 17 253 143............................. 25.6 34.3 9.0 10.0 5.2 4.3 2.9 1.6 .8 6.41
Individual proprietorships 14 599 295........................... 27.8 36.9 9.3 9.7 4.1 3.3 1.3 .5 .1 7.02Partnerships 1 089 578...................................... 13.9 13.7 6.9 9.8 12.5 7.8 13.3 11.4 8.2 2.63Subchapter S corporations 1 564 270......................... 12.2 23.1 7.4 13.1 10.3 11.8 10.9 6.2 2.3 2.84
Hispanic ~owned businesses 771 708................ 28.8 32.0 10.9 9.7 4.1 3.0 1.9 .9 .3 8.45
Individual proprietorships 689 015........................... 31.7 33.7 10.7 9.1 3.1 1.7 .8 .2 .1 9.06Partnerships 32 650...................................... 9.9 18.3 10.2 12.9 10.2 10.3 9.6 6.5 4.6 7.57Subchapter S corporations 50 042......................... 10.8 22.8 13.0 13.9 10.9 11.7 8.4 4.9 .7 2.98
Black ~owned businesses 620 912................... 32.7 34.5 8.8 6.9 2.9 1.5 .8 .3 .2 11.49
Individual proprietorships 584 256........................... 33.6 35.1 8.6 6.4 2.7 1.2 .6 .1 .1 11.710Partnerships 14 727...................................... 17.9 19.3 16.3 14.1 7.0 6.9 4.9 4.1 4.8 4.711Subchapter S corporations 21 928......................... 11.4 20.4 12.9 20.8 9.9 9.9 5.9 3.7 1.4 3.812
Other minority ~owned businesses 606 426........... 18.5 22.7 9.9 13.9 10.4 9.0 6.8 3.0 1.5 4.413
Individual proprietorships 502 022........................... 21.6 26.1 10.1 14.5 9.3 7.9 4.8 1.1 .1 4.714Partnerships 49 489...................................... 7.6 8.8 8.3 8.1 13.2 12.4 11.0 13.6 12.2 4.915Subchapter S corporations 54 915......................... 8.4 13.1 9.8 14.6 14.5 13.1 15.2 6.3 2.0 2.916
Women ~owned businesses 5 888 883.................. 30.8 36.0 7.4 8.0 3.6 3.8 2.3 1.0 .4 6.817
Individual proprietorships 5 078 077........................... 33.5 38.7 7.1 6.9 2.6 2.5 1.0 .3 – 7.318Partnerships 243 651...................................... 13.9 16.7 6.8 14.2 8.9 10.8 13.3 6.4 4.1 5.019Subchapter S corporations 567 155......................... 11.9 19.1 9.6 15.8 10.7 12.8 10.4 4.7 1.9 3.120
Nonminority male ~owned businesses 10 114 456........ 22.8 34.0 9.8 10.9 5.9 4.5 3.1 2.0 1.0 6.021
Individual proprietorships 8 414 238........................... 24.5 36.5 10.4 11.1 4.9 3.7 1.4 .6 .1 6.822Partnerships 777 379...................................... 14.4 13.1 6.7 8.4 13.5 6.6 13.6 12.8 9.2 1.723Subchapter S corporations 922 838......................... 12.5 26.1 5.8 11.0 9.9 11.1 11.2 7.3 2.6 2.624
1Data represent percentage of firms reporting in the designated categories.2For explanation of relative standard errors and standard errors, see Reliability of Estimates in the introductory text.3Relative standard errors are not applicable for lines 1 through 4 since these data are the result of censuses, not surveys.
180 CHARACTERISTICS OF BUSINESS OWNERS 1992 ECONOMIC CENSUS

Organization of Firm: 1992
Standard error of estimate2 for columnmRelative
standarderror of
estimate2 3
A B C D E F G H I J K
(X) .9 1.2 .5 .4 .3 .3 .2 .1 .1 .3 1
(X) 1.1 1.3 .5 .4 .4 .3 .1 .1 – .4 2(X) 1.5 2.1 1.5 1.0 2.4 1.5 2.6 1.0 .7 .6 3(X) 1.1 1.9 .8 .8 .8 1.4 .9 .5 .3 .3 4
– .7 1.1 .9 .4 .4 .2 .1 .1 – .8 5
– .7 1.4 1.0 .6 .5 .2 .1 – – .8 62.0 1.5 2.7 2.3 2.2 1.6 1.9 2.1 1.4 .8 2.2 71.0 1.9 2.1 2.3 1.1 1.2 1.1 .7 .7 .2 .7 8
– .9 .7 .4 .4 .2 .1 .1 – – .4 9
– 1.0 .6 .4 .4 .2 .1 .1 – – .4 103.0 4.0 3.0 4.3 2.9 2.0 1.8 1.7 .8 1.3 1.1 112.0 1.0 2.6 2.6 2.3 1.3 .9 .9 .3 .5 1.3 12
– .5 1.0 .5 .8 .5 .5 .4 .2 .2 .5 13
– .5 1.2 .5 .9 .6 .5 .6 .2 – .6 141.0 1.0 1.9 3.1 2.2 2.4 1.9 1.6 1.8 1.4 1.2 151.0 1.1 1.4 1.4 1.7 2.0 1.4 1.2 .7 .2 .6 16
– 1.1 1.5 .6 .6 .4 .4 .2 .1 .1 .6 17
– 1.4 1.7 .6 .5 .4 .3 .1 .1 – .6 181.0 3.1 3.4 1.6 3.3 2.1 1.6 1.9 1.1 .6 1.8 19
– 1.4 1.6 .8 1.6 1.3 1.7 1.4 .4 .6 .4 20
– 1.0 1.4 .8 .7 .6 .4 .3 .1 .1 .5 21
– 1.2 1.5 .8 .8 .7 .5 .2 .2 .1 .6 22– 2.0 2.6 1.7 1.1 3.6 2.3 3.5 1.4 .9 .4 23– 1.5 2.8 1.3 1.1 1.0 2.1 1.1 .6 .3 .5 24
1992 ECONOMIC CENSUS CHARACTERISTICS OF BUSINESS OWNERS 181

Table 22a. Percent of Total Capital Borrowed by Firm to Start/Acquire the Business by Industry[All data are shown as percents, except firms. For meaning of abbreviations and symbols, see introductory text. For explanation of terms, see appendix A]
Type of firm and industry division
Percent of total capital borrowed to start/acquire the business1
Firms(number) None
Lessthan
10 10 to 24 25 to 49 50 to 74 75 to 99 100Not
reportedNot
applicable2
A B C D E F G H I J
All businesses 17 253 143................................ 43.0 2.6 2.3 3.4 4.7 5.7 5.6 7.0 25.61
Agricultural services, forestry, fishing, and mining 583 253........ 44.2 4.4 2.2 4.2 5.4 4.9 5.0 8.5 21.02Construction 1 829 620........................................ 51.1 2.9 2.1 3.1 3.6 3.1 3.9 3.9 26.43Manufacturing 517 714....................................... 46.6 4.0 3.3 4.1 7.2 5.9 7.6 4.0 17.54Transportation, communications, and utilities 698 903............ 29.9 3.5 2.6 4.4 6.5 8.5 9.4 9.5 25.85Wholesale trade 538 339..................................... 45.4 2.6 3.7 3.2 6.3 6.1 6.3 5.5 21.16
Retail trade 2 478 045......................................... 44.9 2.8 3.2 5.1 6.7 8.2 7.5 8.0 13.47Finance, insurance, and real estate 1 941 029.................... 45.6 2.1 2.6 3.0 5.9 7.5 4.2 6.4 22.78Services 7 784 016............................................ 40.9 2.3 2.0 2.9 3.8 5.2 5.6 6.7 30.69Industries not classified 882 224............................... 39.1 2.0 1.6 2.8 3.4 2.2 2.9 14.9 31.110
Hispanic ~owned businesses 771 708................... 41.8 3.2 2.6 3.2 3.8 3.8 4.1 8.5 28.811
Agricultural services, forestry, fishing, and mining 32 927........ 43.0 4.7 1.8 2.9 3.2 3.9 4.1 10.6 25.912Construction 97 476........................................ 45.7 2.6 2.3 2.4 2.4 .8 2.6 8.4 32.713Manufacturing 18 461....................................... 46.8 3.1 3.6 5.5 4.4 7.4 7.0 5.7 16.714Transportation, communications, and utilities 47 797............ 32.8 3.4 5.6 4.4 5.5 8.4 5.7 11.6 22.715Wholesale trade 17 727..................................... 53.4 2.9 4.2 3.6 4.9 4.0 6.2 4.6 16.016
Retail trade 107 846......................................... 43.6 4.0 4.1 4.2 6.8 6.0 6.1 7.9 17.317Finance, insurance, and real estate 49 231.................... 46.7 4.1 1.8 2.4 6.4 7.6 4.7 6.3 20.118Services 347 297............................................ 41.2 3.1 2.0 3.0 2.8 2.8 3.6 8.1 33.519Industries not classified 52 945............................... 33.0 2.0 1.6 2.9 3.3 2.6 3.0 13.1 38.620
Black ~owned businesses 620 912...................... 37.6 3.1 2.5 2.3 2.9 3.3 4.0 11.6 32.721
Agricultural services, forestry, fishing, and mining 10 309........ 39.8 5.1 2.9 3.3 4.2 2.7 3.8 11.8 26.222Construction 43 381........................................ 38.8 2.3 3.0 2.2 1.6 1.4 3.3 8.4 39.123Manufacturing 10 469....................................... 34.5 5.7 5.8 3.8 4.6 4.0 5.7 12.1 23.724Transportation, communications, and utilities 49 095........... 31.5 3.5 4.0 3.4 6.1 6.8 5.7 13.6 25.425Wholesale trade 7 550..................................... 44.7 3.9 2.8 3.9 4.6 4.6 4.7 6.5 24.226
Retail trade 86 840......................................... 47.5 4.1 2.3 2.2 3.3 3.4 5.7 10.7 20.727Finance, insurance, and real estate 40 924.................... 48.1 2.8 3.0 1.2 3.4 5.0 2.7 8.2 25.628Services 332 981............................................ 35.4 2.8 2.2 2.3 2.3 3.0 3.4 11.8 36.929Industries not classified 39 363............................... 31.7 3.7 1.7 2.0 2.3 1.6 4.4 16.3 36.330
Other minority ~owned businesses 606 426............. 41.3 3.3 3.7 7.4 9.2 6.7 4.3 5.4 18.531
Agricultural services, forestry, fishing, and mining 15 218........ 44.5 5.2 4.6 4.5 6.0 5.1 3.5 6.5 20.132Construction 28 295........................................ 49.6 5.9 1.8 3.4 3.2 3.3 5.4 5.8 21.533Manufacturing 18 976....................................... 45.9 3.9 2.8 4.9 9.5 4.4 4.6 4.1 20.134Transportation, communications, and utilities 24 362............ 40.6 2.1 2.3 9.6 6.3 10.7 4.0 8.4 15.935Wholesale trade 20 043..................................... 48.0 2.5 6.2 5.7 7.8 4.5 3.3 5.2 16.836
Retail trade 132 483......................................... 41.4 5.0 5.1 12.7 12.6 7.9 4.3 4.0 6.937Finance, insurance, and real estate 64 762.................... 36.6 1.2 2.5 6.2 10.6 10.9 5.9 5.7 20.338Services 273 774............................................ 41.6 2.8 3.6 5.8 8.5 5.8 3.9 5.6 22.539Industries not classified 28 512............................... 32.9 3.8 3.2 7.4 7.9 2.9 5.6 7.7 28.740
Women ~owned businesses 5 888 883.................... 42.1 2.5 2.2 2.0 3.5 4.5 4.8 7.6 30.841
Agricultural services, forestry, fishing, and mining 119 731........ 39.5 4.4 2.3 3.3 6.9 3.0 5.0 10.9 24.742Construction 183 695........................................ 45.8 3.2 4.7 2.4 4.1 3.1 5.9 6.2 24.643Manufacturing 152 346....................................... 48.3 3.4 3.2 3.9 5.4 5.5 5.8 5.4 19.244Transportation, communications, and utilities 141 623............ 31.7 1.2 4.5 3.0 3.3 7.1 8.7 6.9 33.545Wholesale trade 154 542..................................... 48.6 1.3 2.3 4.1 5.1 4.9 5.5 5.2 23.046
Retail trade 1 093 342......................................... 47.9 3.1 3.3 2.9 4.3 5.5 7.8 7.7 17.547Finance, insurance, and real estate 602 802.................... 46.3 2.6 1.5 1.3 4.6 5.9 2.3 8.5 26.948Services 3 158 444............................................ 39.3 2.2 1.7 1.6 2.8 4.2 4.0 7.1 37.349Industries not classified 282 358............................... 37.8 2.5 1.8 1.9 2.3 1.2 3.2 14.4 34.950
Nonminority male ~owned businesses 10 114 456.......... 43.7 2.5 2.4 4.0 5.3 6.5 6.3 6.6 22.851
Agricultural services, forestry, fishing, and mining 412 917........ 45.7 4.3 2.1 4.6 5.2 5.6 5.1 7.7 19.652Construction 1 496 056........................................ 52.4 2.8 1.7 3.2 3.7 3.3 3.7 3.2 25.953Manufacturing 333 485....................................... 46.0 4.2 3.3 4.0 8.0 6.1 8.5 3.2 16.754Transportation, communications, and utilities 458 400............ 28.6 4.3 1.6 4.7 7.6 8.8 10.5 9.7 24.355Wholesale trade 352 721..................................... 43.6 3.1 4.3 2.7 6.8 6.7 6.7 5.7 20.556
Retail trade 1 197 943......................................... 42.8 2.3 2.9 6.6 8.4 10.9 7.5 8.5 10.157Finance, insurance, and real estate 1 240 594.................... 45.7 1.9 3.0 3.7 6.3 8.1 4.9 5.6 20.858Services 4 102 294............................................ 42.1 2.2 2.2 3.7 4.3 6.1 7.1 6.3 26.059Industries not classified 520 046............................... 40.3 1.5 1.3 3.1 3.9 2.7 2.5 15.6 29.060
1Data represent percentage of firms reporting in the designated categories.2Includes firms that did not require capital to start/acquire their businesses.3For explanation of relative standard errors and standard errors, see Reliability of Estimates in the introductory text.4Relative standard errors are not applicable for lines 1 through 10 since these data are the result of censuses, not surveys.
182 CHARACTERISTICS OF BUSINESS OWNERS 1992 ECONOMIC CENSUS
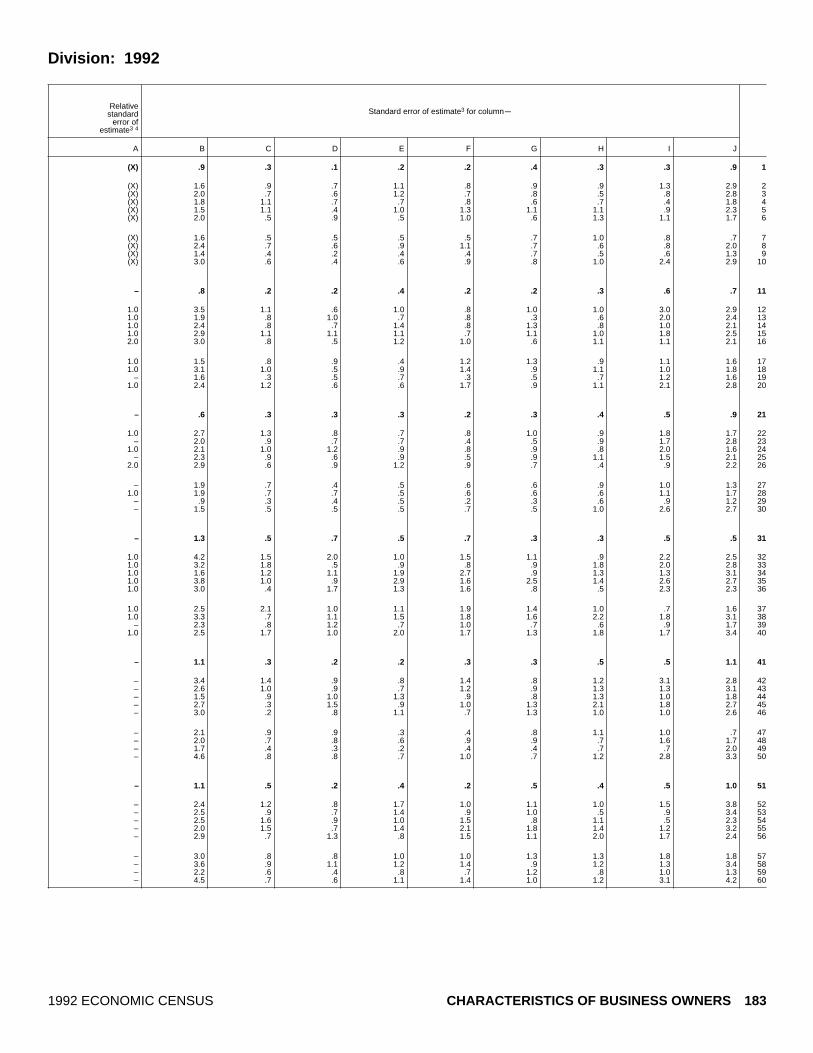
Division: 1992
Standard error of estimate3 for columnmRelative
standarderror of
estimate3 4
A B C D E F G H I J
(X) .9 .3 .1 .2 .2 .4 .3 .3 .9 1
(X) 1.6 .9 .7 1.1 .8 .9 .9 1.3 2.9 2(X) 2.0 .7 .6 1.2 .7 .8 .5 .8 2.8 3(X) 1.8 1.1 .7 .7 .8 .6 .7 .4 1.8 4(X) 1.5 1.1 .4 1.0 1.3 1.1 1.1 .9 2.3 5(X) 2.0 .5 .9 .5 1.0 .6 1.3 1.1 1.7 6
(X) 1.6 .5 .5 .5 .5 .7 1.0 .8 .7 7(X) 2.4 .7 .6 .9 1.1 .7 .6 .8 2.0 8(X) 1.4 .4 .2 .4 .4 .7 .5 .6 1.3 9(X) 3.0 .6 .4 .6 .9 .8 1.0 2.4 2.9 10
– .8 .2 .2 .4 .2 .2 .3 .6 .7 11
1.0 3.5 1.1 .6 1.0 .8 1.0 1.0 3.0 2.9 121.0 1.9 .8 1.0 .7 .8 .3 .6 2.0 2.4 131.0 2.4 .8 .7 1.4 .8 1.3 .8 1.0 2.1 141.0 2.9 1.1 1.1 1.1 .7 1.1 1.0 1.8 2.5 152.0 3.0 .8 .5 1.2 1.0 .6 1.1 1.1 2.1 16
1.0 1.5 .8 .9 .4 1.2 1.3 .9 1.1 1.6 171.0 3.1 1.0 .5 .9 1.4 .9 1.1 1.0 1.8 18
– 1.6 .3 .5 .7 .3 .5 .7 1.2 1.6 191.0 2.4 1.2 .6 .6 1.7 .9 1.1 2.1 2.8 20
– .6 .3 .3 .3 .2 .3 .4 .5 .9 21
1.0 2.7 1.3 .8 .7 .8 1.0 .9 1.8 1.7 22– 2.0 .9 .7 .7 .4 .5 .9 1.7 2.8 23
1.0 2.1 1.0 1.2 .9 .8 .9 .8 2.0 1.6 24– 2.3 .9 .6 .9 .5 .9 1.1 1.5 2.1 25
2.0 2.9 .6 .9 1.2 .9 .7 .4 .9 2.2 26
– 1.9 .7 .4 .5 .6 .6 .9 1.0 1.3 271.0 1.9 .7 .7 .5 .6 .6 .6 1.1 1.7 28
– .9 .3 .4 .5 .2 .3 .6 .9 1.2 29– 1.5 .5 .5 .5 .7 .5 1.0 2.6 2.7 30
– 1.3 .5 .7 .5 .7 .3 .3 .5 .5 31
1.0 4.2 1.5 2.0 1.0 1.5 1.1 .9 2.2 2.5 321.0 3.2 1.8 .5 .9 .8 .9 1.8 2.0 2.8 331.0 1.6 1.2 1.1 1.9 2.7 .9 1.3 1.3 3.1 341.0 3.8 1.0 .9 2.9 1.6 2.5 1.4 2.6 2.7 351.0 3.0 .4 1.7 1.3 1.6 .8 .5 2.3 2.3 36
1.0 2.5 2.1 1.0 1.1 1.9 1.4 1.0 .7 1.6 371.0 3.3 .7 1.1 1.5 1.8 1.6 2.2 1.8 3.1 38
– 2.3 .8 1.2 .7 1.0 .7 .6 .9 1.7 391.0 2.5 1.7 1.0 2.0 1.7 1.3 1.8 1.7 3.4 40
– 1.1 .3 .2 .2 .3 .3 .5 .5 1.1 41
– 3.4 1.4 .9 .8 1.4 .8 1.2 3.1 2.8 42– 2.6 1.0 .9 .7 1.2 .9 1.3 1.3 3.1 43– 1.5 .9 1.0 1.3 .9 .8 1.3 1.0 1.8 44– 2.7 .3 1.5 .9 1.0 1.3 2.1 1.8 2.7 45– 3.0 .2 .8 1.1 .7 1.3 1.0 1.0 2.6 46
– 2.1 .9 .9 .3 .4 .8 1.1 1.0 .7 47– 2.0 .7 .8 .6 .9 .9 .7 1.6 1.7 48– 1.7 .4 .3 .2 .4 .4 .7 .7 2.0 49– 4.6 .8 .8 .7 1.0 .7 1.2 2.8 3.3 50
– 1.1 .5 .2 .4 .2 .5 .4 .5 1.0 51
– 2.4 1.2 .8 1.7 1.0 1.1 1.0 1.5 3.8 52– 2.5 .9 .7 1.4 .9 1.0 .5 .9 3.4 53– 2.5 1.6 .9 1.0 1.5 .8 1.1 .5 2.3 54– 2.0 1.5 .7 1.4 2.1 1.8 1.4 1.2 3.2 55– 2.9 .7 1.3 .8 1.5 1.1 2.0 1.7 2.4 56
– 3.0 .8 .8 1.0 1.0 1.3 1.3 1.8 1.8 57– 3.6 .9 1.1 1.2 1.4 .9 1.2 1.3 3.4 58– 2.2 .6 .4 .8 .7 1.2 .8 1.0 1.3 59– 4.5 .7 .6 1.1 1.4 1.0 1.2 3.1 4.2 60
1992 ECONOMIC CENSUS CHARACTERISTICS OF BUSINESS OWNERS 183
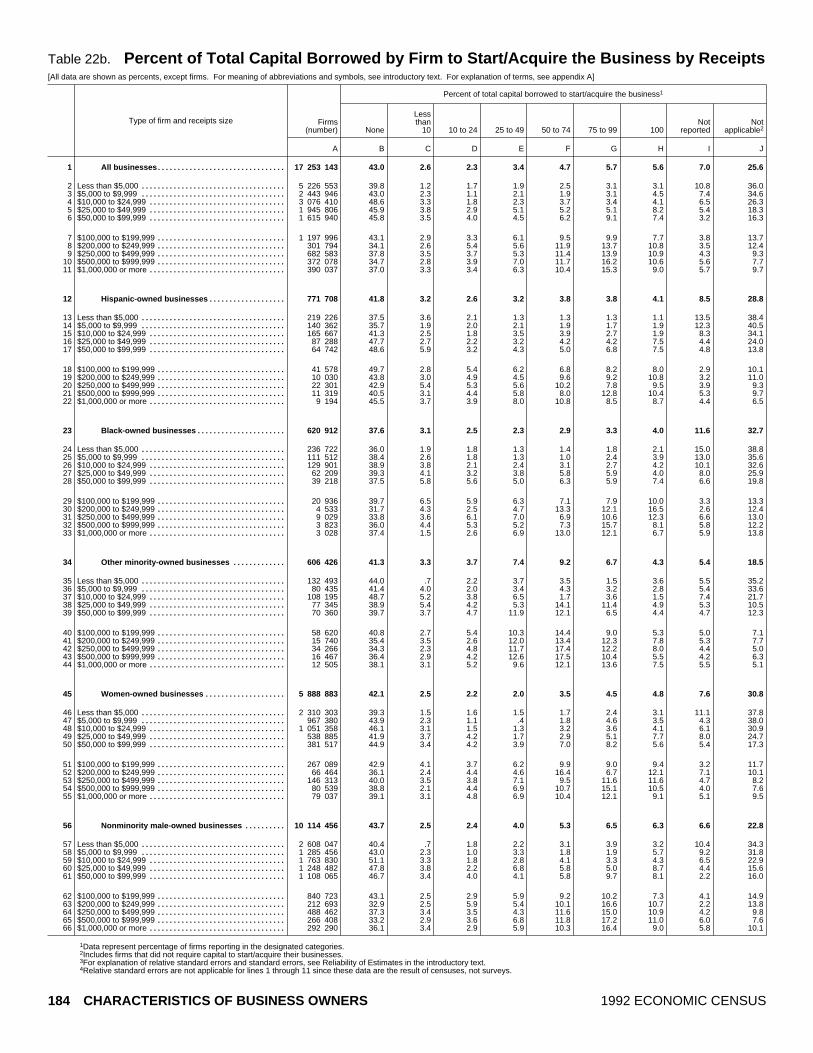
Table 22b. Percent of Total Capital Borrowed by Firm to Start/Acquire the Business by Receipts[All data are shown as percents, except firms. For meaning of abbreviations and symbols, see introductory text. For explanation of terms, see appendix A]
Type of firm and receipts size
Percent of total capital borrowed to start/acquire the business1
Firms(number) None
Lessthan
10 10 to 24 25 to 49 50 to 74 75 to 99 100Not
reportedNot
applicable2
A B C D E F G H I J
All businesses 17 253 143................................ 43.0 2.6 2.3 3.4 4.7 5.7 5.6 7.0 25.61
Less than $5,000 5 226 553.................................... 39.8 1.2 1.7 1.9 2.5 3.1 3.1 10.8 36.02$5,000 to $9,999 2 443 946.................................... 43.0 2.3 1.1 2.1 1.9 3.1 4.5 7.4 34.63$10,000 to $24,999 3 076 410.................................. 48.6 3.3 1.8 2.3 3.7 3.4 4.1 6.5 26.34$25,000 to $49,999 1 945 806.................................. 45.9 3.8 2.9 5.1 5.2 5.1 8.2 5.4 18.35$50,000 to $99,999 1 615 940.................................. 45.8 3.5 4.0 4.5 6.2 9.1 7.4 3.2 16.36
$100,000 to $199,999 1 197 996................................ 43.1 2.9 3.3 6.1 9.5 9.9 7.7 3.8 13.77$200,000 to $249,999 301 794................................ 34.1 2.6 5.4 5.6 11.9 13.7 10.8 3.5 12.48$250,000 to $499,999 682 583................................ 37.8 3.5 3.7 5.3 11.4 13.9 10.9 4.3 9.39$500,000 to $999,999 372 078................................ 34.7 2.8 3.9 7.0 11.7 16.2 10.6 5.6 7.710$1,000,000 or more 390 037.................................. 37.0 3.3 3.4 6.3 10.4 15.3 9.0 5.7 9.711
Hispanic ~owned businesses 771 708................... 41.8 3.2 2.6 3.2 3.8 3.8 4.1 8.5 28.812
Less than $5,000 219 226.................................... 37.5 3.6 2.1 1.3 1.3 1.3 1.1 13.5 38.413$5,000 to $9,999 140 362.................................... 35.7 1.9 2.0 2.1 1.9 1.7 1.9 12.3 40.514$10,000 to $24,999 165 667.................................. 41.3 2.5 1.8 3.5 3.9 2.7 1.9 8.3 34.115$25,000 to $49,999 87 288.................................. 47.7 2.7 2.2 3.2 4.2 4.2 7.5 4.4 24.016$50,000 to $99,999 64 742.................................. 48.6 5.9 3.2 4.3 5.0 6.8 7.5 4.8 13.817
$100,000 to $199,999 41 578................................ 49.7 2.8 5.4 6.2 6.8 8.2 8.0 2.9 10.118$200,000 to $249,999 10 030................................ 43.8 3.0 4.9 4.5 9.6 9.2 10.8 3.2 11.019$250,000 to $499,999 22 301................................ 42.9 5.4 5.3 5.6 10.2 7.8 9.5 3.9 9.320$500,000 to $999,999 11 319................................ 40.5 3.1 4.4 5.8 8.0 12.8 10.4 5.3 9.721$1,000,000 or more 9 194.................................. 45.5 3.7 3.9 8.0 10.8 8.5 8.7 4.4 6.522
Black ~owned businesses 620 912...................... 37.6 3.1 2.5 2.3 2.9 3.3 4.0 11.6 32.723
Less than $5,000 236 722.................................... 36.0 1.9 1.8 1.3 1.4 1.8 2.1 15.0 38.824$5,000 to $9,999 111 512.................................... 38.4 2.6 1.8 1.3 1.0 2.4 3.9 13.0 35.625$10,000 to $24,999 129 901.................................. 38.9 3.8 2.1 2.4 3.1 2.7 4.2 10.1 32.626$25,000 to $49,999 62 209.................................. 39.3 4.1 3.2 3.8 5.8 5.9 4.0 8.0 25.927$50,000 to $99,999 39 218.................................. 37.5 5.8 5.6 5.0 6.3 5.9 7.4 6.6 19.828
$100,000 to $199,999 20 936................................ 39.7 6.5 5.9 6.3 7.1 7.9 10.0 3.3 13.329$200,000 to $249,999 4 533................................ 31.7 4.3 2.5 4.7 13.3 12.1 16.5 2.6 12.430$250,000 to $499,999 9 029................................ 33.8 3.6 6.1 7.0 6.9 10.6 12.3 6.6 13.031$500,000 to $999,999 3 823................................ 36.0 4.4 5.3 5.2 7.3 15.7 8.1 5.8 12.232$1,000,000 or more 3 028.................................. 37.4 1.5 2.6 6.9 13.0 12.1 6.7 5.9 13.833
Other minority ~owned businesses 606 426............. 41.3 3.3 3.7 7.4 9.2 6.7 4.3 5.4 18.534
Less than $5,000 132 493.................................... 44.0 .7 2.2 3.7 3.5 1.5 3.6 5.5 35.235$5,000 to $9,999 80 435.................................... 41.4 4.0 2.0 3.4 4.3 3.2 2.8 5.4 33.636$10,000 to $24,999 108 195.................................. 48.7 5.2 3.8 6.5 1.7 3.6 1.5 7.4 21.737$25,000 to $49,999 77 345.................................. 38.9 5.4 4.2 5.3 14.1 11.4 4.9 5.3 10.538$50,000 to $99,999 70 360.................................. 39.7 3.7 4.7 11.9 12.1 6.5 4.4 4.7 12.339
$100,000 to $199,999 58 620................................ 40.8 2.7 5.4 10.3 14.4 9.0 5.3 5.0 7.140$200,000 to $249,999 15 740................................ 35.4 3.5 2.6 12.0 13.4 12.3 7.8 5.3 7.741$250,000 to $499,999 34 266................................ 34.3 2.3 4.8 11.7 17.4 12.2 8.0 4.4 5.042$500,000 to $999,999 16 467................................ 36.4 2.9 4.2 12.6 17.5 10.4 5.5 4.2 6.343$1,000,000 or more 12 505.................................. 38.1 3.1 5.2 9.6 12.1 13.6 7.5 5.5 5.144
Women ~owned businesses 5 888 883.................... 42.1 2.5 2.2 2.0 3.5 4.5 4.8 7.6 30.845
Less than $5,000 2 310 303.................................... 39.3 1.5 1.6 1.5 1.7 2.4 3.1 11.1 37.846$5,000 to $9,999 967 380.................................... 43.9 2.3 1.1 .4 1.8 4.6 3.5 4.3 38.047$10,000 to $24,999 1 051 358.................................. 46.1 3.1 1.5 1.3 3.2 3.6 4.1 6.1 30.948$25,000 to $49,999 538 885.................................. 41.9 3.7 4.2 1.7 2.9 5.1 7.7 8.0 24.749$50,000 to $99,999 381 517.................................. 44.9 3.4 4.2 3.9 7.0 8.2 5.6 5.4 17.350
$100,000 to $199,999 267 089................................ 42.9 4.1 3.7 6.2 9.9 9.0 9.4 3.2 11.751$200,000 to $249,999 66 464................................ 36.1 2.4 4.4 4.6 16.4 6.7 12.1 7.1 10.152$250,000 to $499,999 146 313................................ 40.0 3.5 3.8 7.1 9.5 11.6 11.6 4.7 8.253$500,000 to $999,999 80 539................................ 38.8 2.1 4.4 6.9 10.7 15.1 10.5 4.0 7.654$1,000,000 or more 79 037.................................. 39.1 3.1 4.8 6.9 10.4 12.1 9.1 5.1 9.555
Nonminority male ~owned businesses 10 114 456.......... 43.7 2.5 2.4 4.0 5.3 6.5 6.3 6.6 22.856
Less than $5,000 2 608 047.................................... 40.4 .7 1.8 2.2 3.1 3.9 3.2 10.4 34.357$5,000 to $9,999 1 285 456.................................... 43.0 2.3 1.0 3.3 1.8 1.9 5.7 9.2 31.858$10,000 to $24,999 1 763 830.................................. 51.1 3.3 1.8 2.8 4.1 3.3 4.3 6.5 22.959$25,000 to $49,999 1 248 482.................................. 47.8 3.8 2.2 6.8 5.8 5.0 8.7 4.4 15.660$50,000 to $99,999 1 108 065.................................. 46.7 3.4 4.0 4.1 5.8 9.7 8.1 2.2 16.061
$100,000 to $199,999 840 723................................ 43.1 2.5 2.9 5.9 9.2 10.2 7.3 4.1 14.962$200,000 to $249,999 212 693................................ 32.9 2.5 5.9 5.4 10.1 16.6 10.7 2.2 13.863$250,000 to $499,999 488 462................................ 37.3 3.4 3.5 4.3 11.6 15.0 10.9 4.2 9.864$500,000 to $999,999 266 408................................ 33.2 2.9 3.6 6.8 11.8 17.2 11.0 6.0 7.665$1,000,000 or more 292 290.................................. 36.1 3.4 2.9 5.9 10.3 16.4 9.0 5.8 10.166
1Data represent percentage of firms reporting in the designated categories.2Includes firms that did not require capital to start/acquire their businesses.3For explanation of relative standard errors and standard errors, see Reliability of Estimates in the introductory text.4Relative standard errors are not applicable for lines 1 through 11 since these data are the result of censuses, not surveys.
184 CHARACTERISTICS OF BUSINESS OWNERS 1992 ECONOMIC CENSUS

Size of Firm: 1992
Standard error of estimate3 for columnmRelative
standarderror of
estimate3 4
A B C D E F G H I J
(X) .9 .3 .1 .2 .2 .4 .3 .3 .9 1
(X) 1.6 .2 .4 .4 .5 .7 .5 .8 1.5 2(X) 2.3 .9 .3 .6 .6 .7 .9 1.3 2.7 3(X) 3.1 1.0 .5 .6 .6 .8 .7 .8 2.3 4(X) 1.8 1.0 .7 1.0 1.0 .9 1.4 1.6 3.0 5(X) 2.6 .5 .9 .8 .9 1.2 1.4 .5 1.3 6
(X) 1.8 .4 .6 .5 .9 .5 .8 .6 1.2 7(X) 2.3 .6 1.4 1.1 2.4 2.3 1.9 .8 1.8 8(X) 1.1 .4 .7 .7 .7 1.0 .9 .5 .8 9(X) 1.1 .4 .5 .7 .7 1.3 .9 .5 .5 10(X) .8 .3 .3 .6 .6 .6 .5 .3 .3 11
– .8 .2 .2 .4 .2 .2 .3 .6 .7 12
1.0 1.3 .8 .8 .7 .3 .4 .4 1.5 2.5 131.0 2.7 .8 1.1 .5 .7 .7 1.0 1.7 3.4 141.0 2.0 .7 .5 1.0 1.0 .6 .3 1.6 2.2 151.0 3.6 1.0 .7 .7 .5 .7 1.8 1.3 3.4 161.0 1.6 .7 .8 1.0 1.2 1.3 1.4 .9 1.5 17
1.0 2.8 .7 .6 1.1 1.0 1.5 1.0 .5 1.0 183.0 4.1 1.0 1.4 1.1 2.4 1.6 3.5 1.0 1.8 192.0 2.1 1.1 .9 .8 1.2 .8 1.0 .6 .7 203.0 1.5 .7 .9 1.1 1.5 1.7 1.5 1.2 1.4 212.0 1.9 .6 .7 .8 1.4 1.0 .8 .5 1.1 22
– .6 .3 .3 .3 .2 .3 .4 .5 .9 23
– 1.3 .4 .4 .3 .2 .5 .5 1.3 1.6 24– 2.9 .6 .4 .5 .2 .6 .9 1.3 1.8 25– 2.0 .8 .6 .9 .6 .6 .7 1.2 1.7 26– 3.1 .8 .6 1.0 1.1 1.2 .3 1.4 1.9 27
1.0 1.6 .9 .8 1.1 1.4 1.1 .9 1.1 2.1 28
1.0 2.7 1.2 1.3 1.3 .9 .7 1.3 .6 1.3 293.0 2.6 2.4 1.2 1.8 2.9 2.6 2.5 1.4 2.4 303.0 2.0 1.0 1.5 1.3 1.3 2.0 1.2 .6 1.5 314.0 2.6 .8 1.8 1.6 2.3 2.0 1.7 1.2 2.1 324.0 2.6 .5 .5 1.3 1.8 1.2 1.4 .5 2.0 33
– 1.3 .5 .7 .5 .7 .3 .3 .5 .5 34
1.0 2.5 .3 1.0 1.1 1.1 .5 .9 1.3 2.6 351.0 4.9 1.6 1.4 1.6 1.2 1.7 .9 2.1 3.7 361.0 3.1 1.5 1.5 1.4 .6 1.5 .5 1.6 2.8 371.0 3.1 2.4 2.2 1.4 2.2 2.4 1.6 1.6 1.8 381.0 2.6 1.6 1.1 2.2 2.0 1.8 1.3 1.3 2.1 39
1.0 1.6 .5 1.1 1.3 1.6 1.1 .5 .8 1.5 402.0 2.6 2.0 1.0 3.7 3.5 3.3 1.9 2.1 2.3 411.0 2.0 .7 .7 1.5 1.5 1.3 1.0 .7 .7 422.0 1.2 .8 .7 1.0 1.7 .8 .6 .8 1.1 432.0 2.0 .5 .9 .9 1.1 1.2 1.0 1.0 .3 44
– 1.1 .3 .2 .2 .3 .3 .5 .5 1.1 45
– 1.6 .4 .4 .3 .3 .9 .7 1.3 1.3 46– 2.1 1.0 .6 .4 .4 1.7 1.0 .8 3.0 47– 2.9 .7 .5 .2 .7 .9 1.0 .7 2.5 48– 2.8 1.3 1.3 .5 1.4 1.0 2.0 2.3 3.5 49– 2.6 .9 1.0 .8 1.1 .7 1.2 1.5 1.4 50
– 2.7 1.2 .7 1.2 1.7 1.7 1.3 .8 1.7 511.0 2.8 .6 2.9 1.9 3.4 1.7 3.6 1.9 1.9 521.0 2.1 .6 .9 1.0 1.4 .8 1.0 .8 1.2 531.0 1.8 .5 .9 1.1 .6 1.4 1.6 .8 .4 541.0 1.1 .5 .3 .5 .7 1.0 .7 .6 .4 55
– 1.1 .5 .2 .4 .2 .5 .4 .5 1.0 56
– 2.3 .2 .7 .8 1.1 1.2 1.2 1.2 2.1 57– 4.4 1.2 .5 .9 1.0 1.1 1.5 2.3 3.8 58– 4.0 1.5 .9 1.2 .9 1.2 1.1 1.4 2.8 59– 2.8 1.6 1.0 1.5 1.2 1.4 1.8 2.1 3.9 60– 3.5 .6 1.2 1.0 1.2 1.8 1.9 .6 2.2 61
– 2.3 .4 .6 .8 1.0 .7 .9 .7 1.5 62– 3.0 .9 1.8 1.6 3.1 3.8 2.5 1.4 2.5 63– 1.7 .5 .9 .7 1.1 1.5 1.1 .8 1.1 64– 1.6 .7 .7 .9 .9 1.7 1.1 .7 .7 65– 1.0 .3 .4 .7 .7 .6 .6 .4 .5 66
1992 ECONOMIC CENSUS CHARACTERISTICS OF BUSINESS OWNERS 185

Table 22c. Percent of Total Capital Borrowed by Firm to Start/Acquire the Business by[All data are shown as percents, except firms. For meaning of abbreviations and symbols, see introductory text. For explanation of terms, see appendix A]
Type of firm and employment size
Percent of total capital borrowed to start/acquire the business1
Firms(number) None
Lessthan
10 10 to 24 25 to 49 50 to 74 75 to 99 100Not
reportedNot
applicable2
A B C D E F G H I J
All businesses 17 253 143................................ 43.0 2.6 2.3 3.4 4.7 5.7 5.6 7.0 25.61
With no paid employees 14 118 184.............................. 43.7 2.4 2.1 2.8 3.6 4.1 4.7 7.8 28.92With paid employees 3 134 959................................. 39.8 3.6 3.4 5.9 9.7 12.8 9.8 3.8 11.23
No employees5 435 838.................................... 47.0 3.5 2.5 3.2 8.9 6.4 14.5 1.8 12.041 to 4 employees 1 716 076.................................. 40.8 4.0 3.9 5.9 8.4 13.1 8.2 3.7 12.155 to 9 employees 503 808.................................. 35.9 2.4 2.7 7.5 12.8 13.8 11.9 4.1 9.1610 to 19 employees 256 110................................ 34.6 2.3 3.1 6.5 11.5 14.1 10.9 5.9 11.0720 to 49 employees 144 734................................ 34.3 5.1 2.9 5.3 11.8 17.9 8.8 5.6 8.3850 to 99 employees 45 331................................ 33.3 3.2 3.8 7.1 14.4 19.5 6.7 5.2 6.79100 employees or more 33 062............................ 35.1 4.2 3.6 8.3 8.8 19.9 8.3 4.8 7.010
Hispanic ~owned businesses 771 708................... 41.8 3.2 2.6 3.2 3.8 3.8 4.1 8.5 28.811
With no paid employees 656 343.............................. 41.2 3.2 2.2 2.6 2.9 2.9 2.8 9.7 32.512With paid employees 115 364................................. 44.6 3.5 4.5 5.7 7.8 7.5 9.7 3.6 13.013
No employees5 19 569.................................... 43.5 4.0 3.8 6.4 6.7 3.7 9.7 3.2 18.9141 to 4 employees 64 631.................................. 46.6 2.7 4.7 5.4 6.7 6.8 9.2 3.5 14.3155 to 9 employees 16 937.................................. 40.1 5.5 4.5 5.0 10.8 10.5 12.4 3.7 7.41610 to 19 employees 8 553................................ 44.1 3.9 4.1 7.8 9.6 9.3 9.0 4.7 7.51720 to 49 employees 4 050................................ 40.1 4.4 5.0 5.2 10.8 14.1 9.7 3.6 7.21850 to 99 employees 948................................ 42.2 6.3 2.9 12.7 8.0 10.5 4.5 6.8 6.219100 employees or more 676............................ 40.8 3.0 2.7 3.2 21.5 12.5 6.9 2.2 7.220
Black ~owned businesses 620 912...................... 37.6 3.1 2.5 2.3 2.9 3.3 4.0 11.6 32.721
With no paid employees 556 434.............................. 37.2 2.8 2.1 2.1 2.4 2.8 3.5 12.3 34.922With paid employees 64 478................................. 41.1 6.0 5.4 4.7 6.8 6.9 8.1 6.3 14.723
No employees5 13 725.................................... 37.3 4.1 4.3 3.5 6.0 3.1 8.4 9.7 23.6241 to 4 employees 37 587.................................. 44.5 7.4 5.1 5.0 6.3 7.1 7.1 4.8 12.7255 to 9 employees 7 853.................................. 32.0 4.1 10.1 5.3 7.3 8.5 14.3 9.2 9.32610 to 19 employees 2 839................................ 37.3 3.7 3.3 4.1 14.0 11.2 4.7 5.0 16.72720 to 49 employees 1 700................................ 42.5 2.4 4.6 1.4 10.0 16.4 8.6 4.9 9.12850 to 99 employees 432................................ 27.8 (D) (D) 14.3 5.6 22.3 2.5 10.8 8.329100 employees or more 342............................ 37.3 1.4 3.4 5.3 17.2 12.6 5.7 3.2 13.930
Other minority ~owned businesses 606 426............. 41.3 3.3 3.7 7.4 9.2 6.7 4.3 5.4 18.531
With no paid employees 470 075.............................. 42.6 3.4 3.5 6.0 7.5 4.7 3.3 5.7 23.332With paid employees 136 351................................. 38.0 3.1 4.5 11.4 13.7 12.1 7.0 4.7 5.533
No employees5 19 989.................................... 38.3 4.9 2.5 13.8 7.5 11.8 6.4 9.7 5.0341 to 4 employees 76 636.................................. 39.8 2.8 4.7 10.5 13.5 11.8 7.0 3.8 6.1355 to 9 employees 22 862.................................. 34.0 3.2 4.4 12.2 16.9 10.7 9.2 4.3 5.23610 to 19 employees 10 051................................ 37.5 2.4 5.7 11.5 16.1 14.3 4.7 3.8 4.13720 to 49 employees 5 034................................ 32.1 3.1 5.0 13.4 17.5 16.6 5.6 3.5 3.33850 to 99 employees 1 075................................ 35.9 3.1 2.0 10.6 16.0 16.4 5.6 5.7 4.739100 employees or more 705............................ 34.1 .8 2.6 7.9 12.6 17.2 5.2 13.3 6.240
Women ~owned businesses 5 888 883.................... 42.1 2.5 2.2 2.0 3.5 4.5 4.8 7.6 30.841
With no paid employees 5 071 110.............................. 42.6 2.3 1.8 1.4 2.5 3.4 3.7 8.2 34.042With paid employees 817 773................................. 38.6 3.6 4.5 5.6 9.5 11.1 11.4 4.4 11.343
No employees5 127 905.................................... 42.4 4.7 4.6 3.2 7.0 10.8 16.4 1.7 9.1441 to 4 employees 435 550.................................. 38.3 3.3 4.7 5.2 9.4 10.7 8.8 5.3 14.4455 to 9 employees 134 476.................................. 40.5 3.2 3.6 6.4 12.1 10.4 15.6 2.9 5.44610 to 19 employees 67 487................................ 34.5 1.6 5.5 9.9 8.1 12.4 12.7 5.9 9.34720 to 49 employees 35 515................................ 34.6 8.6 3.8 7.7 12.1 12.4 9.0 4.9 6.94850 to 99 employees 10 178................................ 33.4 3.9 5.8 4.6 9.1 19.2 9.1 6.1 8.749100 employees or more 6 663............................ 30.2 3.7 3.7 8.2 10.0 23.6 13.0 4.5 3.250
Nonminority male ~owned businesses 10 114 456.......... 43.7 2.5 2.4 4.0 5.3 6.5 6.3 6.6 22.851
With no paid employees 8 019 462.............................. 44.7 2.2 2.2 3.5 4.2 4.5 5.4 7.4 25.852With paid employees 2 094 993................................. 40.2 3.5 2.8 5.7 9.7 13.9 9.4 3.4 11.353
No employees5 271 380.................................... 50.9 2.6 1.4 2.3 10.2 4.1 14.4 .8 13.2541 to 4 employees 1 155 800.................................. 41.5 4.3 3.5 5.9 7.8 14.6 8.0 3.0 11.4555 to 9 employees 334 483.................................. 34.3 1.8 2.1 7.8 12.9 15.4 10.6 4.4 10.75610 to 19 employees 173 140................................ 34.3 2.5 2.0 4.8 12.4 15.0 10.7 6.1 12.15720 to 49 employees 101 938................................ 33.9 4.2 2.3 4.2 11.7 20.0 8.8 6.0 9.05850 to 99 employees 33 406................................ 32.9 2.8 3.5 7.5 16.0 19.8 6.3 4.9 6.359100 employees or more 24 846............................ 36.2 4.5 3.5 8.6 7.9 19.3 7.2 4.6 8.160
1Data represent percentage of firms reporting in the designated categories.2Includes firms that did not require capital to start/acquire their businesses.3For explanation of relative standard errors and standard errors, see Reliability of Estimates in the introductory text.4Relative standard errors are not applicable for lines 1 through 10 since these data are the result of censuses, not surveys.5Firms reported annual payroll, but did not report any employees on their payroll during specified period in 1992.
186 CHARACTERISTICS OF BUSINESS OWNERS 1992 ECONOMIC CENSUS
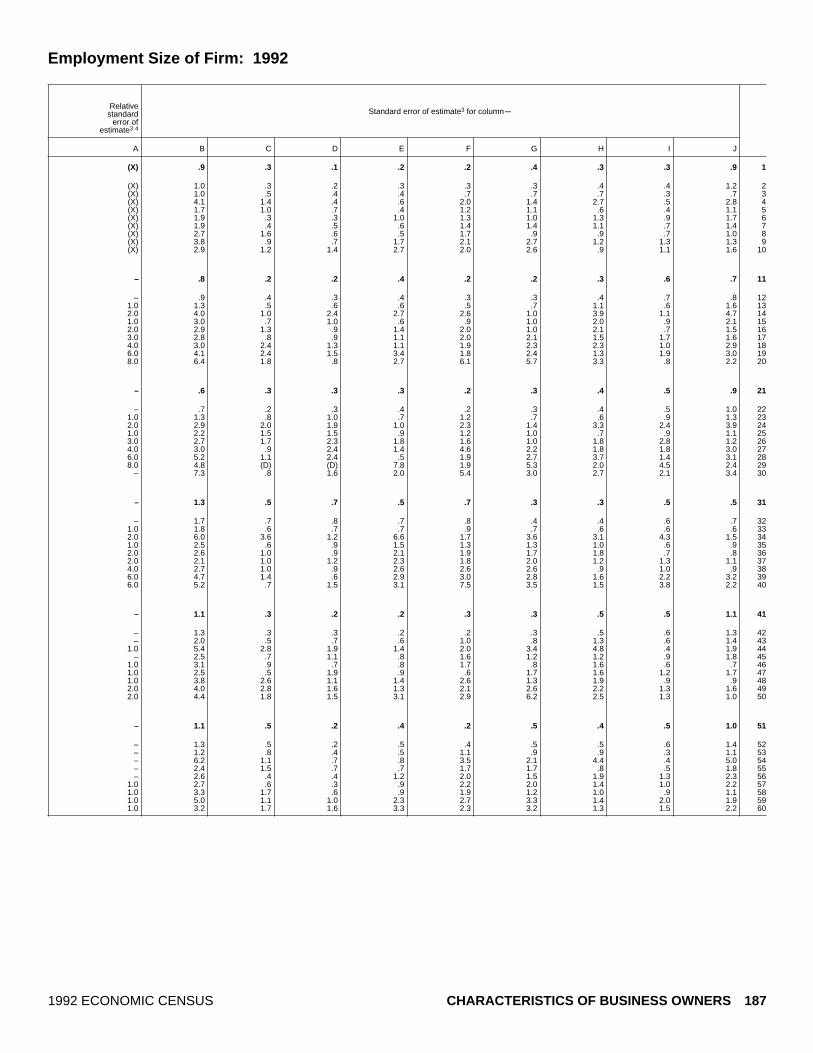
Employment Size of Firm: 1992
Standard error of estimate3 for columnmRelative
standarderror of
estimate3 4
A B C D E F G H I J
(X) .9 .3 .1 .2 .2 .4 .3 .3 .9 1
(X) 1.0 .3 .2 .3 .3 .3 .4 .4 1.2 2(X) 1.0 .5 .4 .4 .7 .7 .7 .3 .7 3(X) 4.1 1.4 .4 .6 2.0 1.4 2.7 .5 2.8 4(X) 1.7 1.0 .7 .4 1.2 1.1 .6 .4 1.1 5(X) 1.9 .3 .3 1.0 1.3 1.0 1.3 .9 1.7 6(X) 1.9 .4 .5 .6 1.4 1.4 1.1 .7 1.4 7(X) 2.7 1.6 .6 .5 1.7 .9 .9 .7 1.0 8(X) 3.8 .9 .7 1.7 2.1 2.7 1.2 1.3 1.3 9(X) 2.9 1.2 1.4 2.7 2.0 2.6 .9 1.1 1.6 10
– .8 .2 .2 .4 .2 .2 .3 .6 .7 11
– .9 .4 .3 .4 .3 .3 .4 .7 .8 121.0 1.3 .5 .6 .6 .5 .7 1.1 .6 1.6 132.0 4.0 1.0 2.4 2.7 2.6 1.0 3.9 1.1 4.7 141.0 3.0 .7 1.0 .6 .9 1.0 2.0 .9 2.1 152.0 2.9 1.3 .9 1.4 2.0 1.0 2.1 .7 1.5 163.0 2.8 .8 .9 1.1 2.0 2.1 1.5 1.7 1.6 174.0 3.0 2.4 1.3 1.1 1.9 2.3 2.3 1.0 2.9 186.0 4.1 2.4 1.5 3.4 1.8 2.4 1.3 1.9 3.0 198.0 6.4 1.8 .8 2.7 6.1 5.7 3.3 .8 2.2 20
– .6 .3 .3 .3 .2 .3 .4 .5 .9 21
– .7 .2 .3 .4 .2 .3 .4 .5 1.0 221.0 1.3 .8 1.0 .7 1.2 .7 .6 .9 1.3 232.0 2.9 2.0 1.9 1.0 2.3 1.4 3.3 2.4 3.9 241.0 2.2 1.5 1.5 .9 1.2 1.0 .7 .9 1.1 253.0 2.7 1.7 2.3 1.8 1.6 1.0 1.8 2.8 1.2 264.0 3.0 .9 2.4 1.4 4.6 2.2 1.8 1.8 3.0 276.0 5.2 1.1 2.4 .5 1.9 2.7 3.7 1.4 3.1 288.0 4.8 (D) (D) 7.8 1.9 5.3 2.0 4.5 2.4 29
– 7.3 .8 1.6 2.0 5.4 3.0 2.7 2.1 3.4 30
– 1.3 .5 .7 .5 .7 .3 .3 .5 .5 31
– 1.7 .7 .8 .7 .8 .4 .4 .6 .7 321.0 1.8 .6 .7 .7 .9 .7 .6 .6 .6 332.0 6.0 3.6 1.2 6.6 1.7 3.6 3.1 4.3 1.5 341.0 2.5 .6 .9 1.5 1.3 1.3 1.0 .6 .9 352.0 2.6 1.0 .9 2.1 1.9 1.7 1.8 .7 .8 362.0 2.1 1.0 1.2 2.3 1.8 2.0 1.2 1.3 1.1 374.0 2.7 1.0 .9 2.6 2.6 2.6 .9 1.0 .9 386.0 4.7 1.4 .6 2.9 3.0 2.8 1.6 2.2 3.2 396.0 5.2 .7 1.5 3.1 7.5 3.5 1.5 3.8 2.2 40
– 1.1 .3 .2 .2 .3 .3 .5 .5 1.1 41
– 1.3 .3 .3 .2 .2 .3 .5 .6 1.3 42– 2.0 .5 .7 .6 1.0 .8 1.3 .6 1.4 43
1.0 5.4 2.8 1.9 1.4 2.0 3.4 4.8 .4 1.9 44– 2.5 .7 1.1 .8 1.6 1.2 1.2 .9 1.8 45
1.0 3.1 .9 .7 .8 1.7 .8 1.6 .6 .7 461.0 2.5 .5 1.9 .9 .6 1.7 1.6 1.2 1.7 471.0 3.8 2.6 1.1 1.4 2.6 1.3 1.9 .9 .9 482.0 4.0 2.8 1.6 1.3 2.1 2.6 2.2 1.3 1.6 492.0 4.4 1.8 1.5 3.1 2.9 6.2 2.5 1.3 1.0 50
– 1.1 .5 .2 .4 .2 .5 .4 .5 1.0 51
– 1.3 .5 .2 .5 .4 .5 .5 .6 1.4 52– 1.2 .8 .4 .5 1.1 .9 .9 .3 1.1 53– 6.2 1.1 .7 .8 3.5 2.1 4.4 .4 5.0 54– 2.4 1.5 .7 .7 1.7 1.7 .8 .5 1.8 55– 2.6 .4 .4 1.2 2.0 1.5 1.9 1.3 2.3 56
1.0 2.7 .6 .3 .9 2.2 2.0 1.4 1.0 2.2 571.0 3.3 1.7 .6 .9 1.9 1.2 1.0 .9 1.1 581.0 5.0 1.1 1.0 2.3 2.7 3.3 1.4 2.0 1.9 591.0 3.2 1.7 1.6 3.3 2.3 3.2 1.3 1.5 2.2 60
1992 ECONOMIC CENSUS CHARACTERISTICS OF BUSINESS OWNERS 187
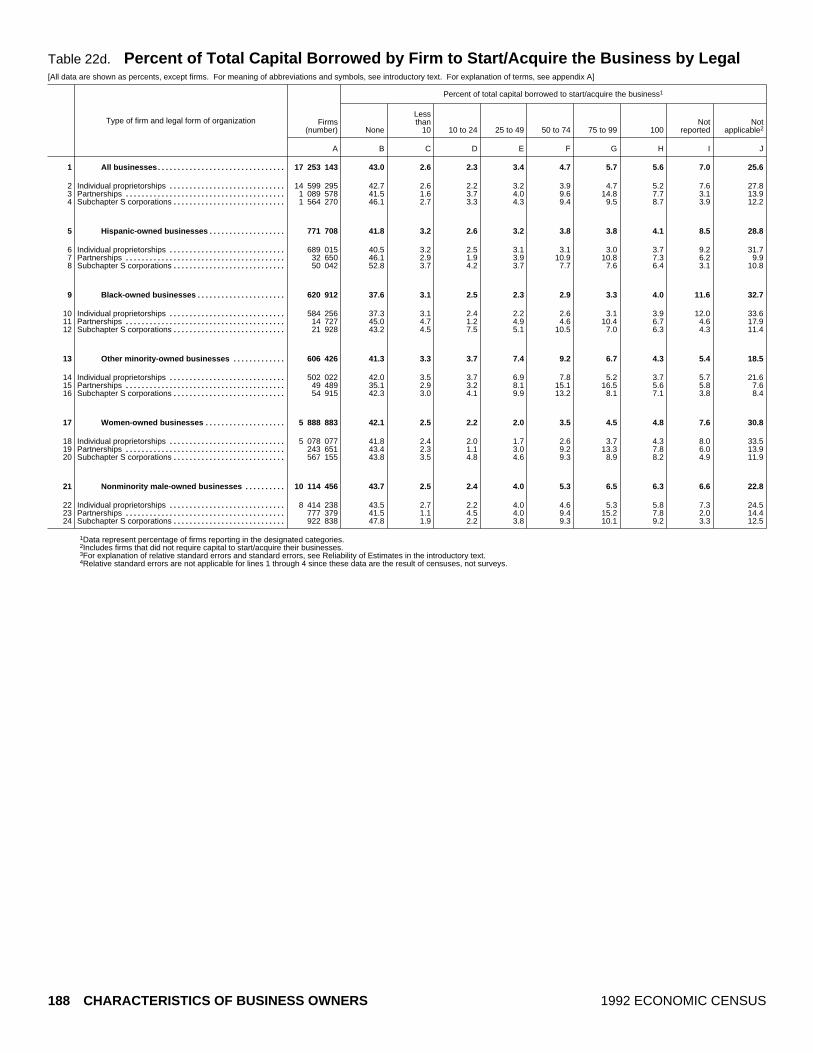
Table 22d. Percent of Total Capital Borrowed by Firm to Start/Acquire the Business by Legal[All data are shown as percents, except firms. For meaning of abbreviations and symbols, see introductory text. For explanation of terms, see appendix A]
Type of firm and legal form of organization
Percent of total capital borrowed to start/acquire the business1
Firms(number) None
Lessthan
10 10 to 24 25 to 49 50 to 74 75 to 99 100Not
reportedNot
applicable2
A B C D E F G H I J
All businesses 17 253 143................................ 43.0 2.6 2.3 3.4 4.7 5.7 5.6 7.0 25.61
Individual proprietorships 14 599 295............................. 42.7 2.6 2.2 3.2 3.9 4.7 5.2 7.6 27.82Partnerships 1 089 578........................................ 41.5 1.6 3.7 4.0 9.6 14.8 7.7 3.1 13.93Subchapter S corporations 1 564 270............................ 46.1 2.7 3.3 4.3 9.4 9.5 8.7 3.9 12.24
Hispanic ~owned businesses 771 708................... 41.8 3.2 2.6 3.2 3.8 3.8 4.1 8.5 28.85
Individual proprietorships 689 015............................. 40.5 3.2 2.5 3.1 3.1 3.0 3.7 9.2 31.76Partnerships 32 650........................................ 46.1 2.9 1.9 3.9 10.9 10.8 7.3 6.2 9.97Subchapter S corporations 50 042............................ 52.8 3.7 4.2 3.7 7.7 7.6 6.4 3.1 10.88
Black ~owned businesses 620 912...................... 37.6 3.1 2.5 2.3 2.9 3.3 4.0 11.6 32.79
Individual proprietorships 584 256............................. 37.3 3.1 2.4 2.2 2.6 3.1 3.9 12.0 33.610Partnerships 14 727........................................ 45.0 4.7 1.2 4.9 4.6 10.4 6.7 4.6 17.911Subchapter S corporations 21 928............................ 43.2 4.5 7.5 5.1 10.5 7.0 6.3 4.3 11.412
Other minority ~owned businesses 606 426............. 41.3 3.3 3.7 7.4 9.2 6.7 4.3 5.4 18.513
Individual proprietorships 502 022............................. 42.0 3.5 3.7 6.9 7.8 5.2 3.7 5.7 21.614Partnerships 49 489........................................ 35.1 2.9 3.2 8.1 15.1 16.5 5.6 5.8 7.615Subchapter S corporations 54 915............................ 42.3 3.0 4.1 9.9 13.2 8.1 7.1 3.8 8.416
Women ~owned businesses 5 888 883.................... 42.1 2.5 2.2 2.0 3.5 4.5 4.8 7.6 30.817
Individual proprietorships 5 078 077............................. 41.8 2.4 2.0 1.7 2.6 3.7 4.3 8.0 33.518Partnerships 243 651........................................ 43.4 2.3 1.1 3.0 9.2 13.3 7.8 6.0 13.919Subchapter S corporations 567 155............................ 43.8 3.5 4.8 4.6 9.3 8.9 8.2 4.9 11.920
Nonminority male ~owned businesses 10 114 456.......... 43.7 2.5 2.4 4.0 5.3 6.5 6.3 6.6 22.821
Individual proprietorships 8 414 238............................. 43.5 2.7 2.2 4.0 4.6 5.3 5.8 7.3 24.522Partnerships 777 379........................................ 41.5 1.1 4.5 4.0 9.4 15.2 7.8 2.0 14.423Subchapter S corporations 922 838............................ 47.8 1.9 2.2 3.8 9.3 10.1 9.2 3.3 12.524
1Data represent percentage of firms reporting in the designated categories.2Includes firms that did not require capital to start/acquire their businesses.3For explanation of relative standard errors and standard errors, see Reliability of Estimates in the introductory text.4Relative standard errors are not applicable for lines 1 through 4 since these data are the result of censuses, not surveys.
188 CHARACTERISTICS OF BUSINESS OWNERS 1992 ECONOMIC CENSUS

Form of Organization of Firm: 1992
Standard error of estimate3 for columnmRelative
standarderror of
estimate3 4
A B C D E F G H I J
(X) .9 .3 .1 .2 .2 .4 .3 .3 .9 1
(X) .9 .4 .2 .3 .2 .4 .3 .3 1.1 2(X) 2.6 .3 1.1 1.2 1.3 1.4 .7 .5 1.5 3(X) 2.5 .6 .5 .3 .8 .9 1.3 .4 1.1 4
– .8 .2 .2 .4 .2 .2 .3 .6 .7 5
– .8 .3 .2 .5 .3 .2 .4 .7 .7 62.0 4.2 .9 .6 .7 2.7 1.9 1.1 1.9 1.5 71.0 2.0 .6 .8 .6 .8 .9 .4 .4 1.9 8
– .6 .3 .3 .3 .2 .3 .4 .5 .9 9
– .7 .3 .3 .3 .2 .3 .4 .5 1.0 103.0 4.7 1.5 .4 1.8 1.1 1.8 1.6 .9 4.0 112.0 2.3 1.2 1.1 1.1 2.2 .5 1.7 1.3 1.0 12
– 1.3 .5 .7 .5 .7 .3 .3 .5 .5 13
– 1.4 .5 .6 .6 .7 .5 .3 .7 .5 141.0 2.4 1.7 1.4 1.2 2.3 1.6 1.2 1.4 1.0 151.0 2.1 .5 .9 1.1 1.5 .7 1.0 .8 1.1 16
– 1.1 .3 .2 .2 .3 .3 .5 .5 1.1 17
– 1.2 .3 .3 .2 .3 .4 .5 .5 1.4 181.0 3.1 .8 .4 1.0 1.8 2.9 2.0 1.7 3.1 19
– 2.7 1.1 1.0 .4 1.3 1.0 .8 1.2 1.3 20
– 1.1 .5 .2 .4 .2 .5 .4 .5 1.0 21
– 1.1 .6 .2 .5 .3 .5 .4 .6 1.2 22– 3.7 .3 1.4 1.5 1.8 1.6 1.1 .4 2.0 23– 3.3 .6 .4 .4 .7 1.3 2.1 .5 1.5 24
1992 ECONOMIC CENSUS CHARACTERISTICS OF BUSINESS OWNERS 189

Table 23a. Sources of Borrowed Capital for Firm by Industry Division: 1992[All data are shown as percents, except firms. For meaning of abbreviations and symbols, see introductory text. For explanation of terms, see appendix A]
Type of firm and industry division
Sources of borrowed capital obtained1
Firms(number)
Business loanfrom banking or
commerciallending institution
Government~guaranteed
business loanfrom banking or
commerciallending institution
Business loanfrom Federal,State or localgovernment
Business loanfrom investment
company/profit ornonprofit private
source
Businessloan from
previous owner
Businesstrade credit
from supplier
A B C D E F G
All businesses 17 253 143................................. 11.7 .4 .3 .6 1.9 .91
Agricultural services, forestry, fishing, and mining 583 253......... 13.8 .3 .2 .4 2.2 .72Construction 1 829 620......................................... 8.8 .1 .3 .6 .6 1.43Manufacturing 517 714........................................ 16.6 .6 .5 .9 2.1 2.04Transportation, communications, and utilities 698 903............. 18.5 .2 .2 .6 1.9 .95Wholesale trade 538 339...................................... 11.9 .8 .1 1.5 2.4 2.16
Retail trade 2 478 045.......................................... 16.0 .8 .2 .6 4.6 1.47Finance, insurance, and real estate 1 941 029..................... 14.8 .8 .5 1.1 2.3 .68Services 7 784 016............................................. 9.8 .3 .2 .5 1.4 .79Industries not classified 882 224................................ 6.1 .2 – .1 .5 .210
Hispanic ~owned businesses 771 708.................... 7.6 .3 .1 .3 1.6 .711
Agricultural services, forestry, fishing, and mining 32 927......... 9.0 .2 .1 .9 .6 .512Construction 97 476......................................... 4.8 – .1 .1 .6 .913Manufacturing 18 461........................................ 12.0 .9 .7 .8 2.0 .614Transportation, communications, and utilities 47 797............. 13.0 .3 .1 .2 2.5 1.215Wholesale trade 17 727...................................... 11.9 .2 .1 .9 2.9 2.716
Retail trade 107 846.......................................... 9.6 1.2 .1 .6 4.6 1.517Finance, insurance, and real estate 49 231..................... 12.9 .3 .4 .5 3.5 .718Services 347 297............................................. 5.9 .1 – .2 .8 .419Industries not classified 52 945................................ 5.7 .2 – .1 .3 .320
Black ~owned businesses 620 912....................... 6.6 .7 .3 .5 .6 .621
Agricultural services, forestry, fishing, and mining 10 309......... 10.0 .7 .6 – .5 1.422Construction 43 381......................................... 5.3 .5 – .3 .3 .923Manufacturing 10 469........................................ 13.1 1.3 .2 .3 1.5 2.124Transportation, communications, and utilities 49 095............ 10.4 .4 .4 1.2 1.4 .825Wholesale trade 7 550...................................... 9.2 .7 .3 .4 .5 .926
Retail trade 86 840.......................................... 9.1 .7 .4 .3 1.6 .327Finance, insurance, and real estate 40 924..................... 7.3 .6 .3 .9 .5 .328Services 332 981............................................. 5.4 .8 .3 .4 .3 .629Industries not classified 39 363................................ 4.4 .5 .1 .7 .4 1.030
Other minority ~owned businesses 606 426.............. 12.3 .7 .4 1.1 4.8 1.431
Agricultural services, forestry, fishing, and mining 15 218......... 13.2 .2 .5 .2 3.2 1.632Construction 28 295......................................... 8.4 .2 – 3.0 1.9 .733Manufacturing 18 976........................................ 8.5 1.5 .3 1.2 3.0 .734Transportation, communications, and utilities 24 362............. 13.2 .4 .2 1.2 2.6 .635Wholesale trade 20 043...................................... 10.3 .9 – 1.7 1.9 3.636
Retail trade 132 483.......................................... 13.8 1.8 .3 .8 9.6 2.937Finance, insurance, and real estate 64 762..................... 19.7 .5 .6 1.7 7.4 .238Services 273 774............................................. 10.8 .3 .4 .9 2.9 1.039Industries not classified 28 512................................ 7.4 .1 .4 .2 3.5 1.040
Women ~owned businesses 5 888 883..................... 8.6 .4 .2 .5 1.7 .841
Agricultural services, forestry, fishing, and mining 119 731......... 11.6 .2 .2 .8 1.6 .442Construction 183 695......................................... 13.8 .1 – .5 1.7 2.443Manufacturing 152 346........................................ 11.9 .8 .4 1.3 2.8 1.144Transportation, communications, and utilities 141 623............. 14.6 .3 – 1.1 4.1 .645Wholesale trade 154 542...................................... 9.8 1.1 .2 .7 2.8 2.146
Retail trade 1 093 342.......................................... 12.3 1.0 .1 .8 3.6 .947Finance, insurance, and real estate 602 802..................... 10.4 .3 .3 .7 2.0 .748Services 3 158 444............................................. 6.4 .2 .3 .3 .9 .749Industries not classified 282 358................................ 5.7 .1 – .1 .2 .150
Nonminority male ~owned businesses 10 114 456........... 13.7 .4 .3 .6 2.0 1.051
Agricultural services, forestry, fishing, and mining 412 917......... 14.8 .3 .1 .3 2.4 .852Construction 1 496 056......................................... 8.5 .1 .4 .6 .5 1.353Manufacturing 333 485........................................ 19.2 .5 .5 .7 1.8 2.554Transportation, communications, and utilities 458 400............. 21.0 .1 .3 .4 1.2 1.055Wholesale trade 352 721...................................... 12.9 .7 .1 1.8 2.2 2.156
Retail trade 1 197 943.......................................... 19.7 .5 .2 .4 5.2 1.657Finance, insurance, and real estate 1 240 594..................... 16.6 1.0 .6 1.3 2.3 .558Services 4 102 294............................................. 12.5 .3 .2 .6 1.7 .759Industries not classified 520 046................................ 6.4 .2 – .1 .6 .160
1Data represent percentage of firms reporting in the designated categories. Sum of percents in categories will not equal 100 since multiple responses were allowed.2Includes firms that did not require capital to start/acquire their businesses or that did not borrow capital.3For explanation of relative standard errors and standard errors, see Reliability of Estimates in the introductory text.4Relative standard errors are not applicable for lines 1 through 10 since these data are the result of censuses, not surveys.
190 CHARACTERISTICS OF BUSINESS OWNERS 1992 ECONOMIC CENSUS

Sources of borrowed capital obtained1mCon.
Standard error of estimate3 for columnm
Otherbusiness
loanNot
reportedNot
applicable2
Relativestandard
error ofestimate3 4
H I J A B C D E F G H I J
1.6 15.6 68.6 (X) .3 .1 .1 .1 .2 .1 .1 .6 .7 1
.9 17.6 65.3 (X) 1.9 .1 .1 .2 .6 .2 .1 1.9 2.7 2
.7 11.0 77.5 (X) .9 – .2 .3 .1 .7 .2 1.6 2.1 33.2 13.1 64.0 (X) 1.4 .1 .2 .1 .3 .6 .6 1.3 2.0 42.6 20.8 55.6 (X) 1.4 .1 .1 .2 .5 .3 .7 1.7 2.0 52.7 14.9 66.5 (X) 1.0 .4 – .5 .3 .5 .3 1.0 1.6 6
1.9 19.2 58.4 (X) 1.6 .3 – .1 .7 .3 .3 .9 1.8 72.6 11.4 68.3 (X) 1.4 .2 .2 .4 .7 .3 .6 .7 2.2 81.3 15.4 71.5 (X) .7 .1 .1 .2 .2 .2 .2 .9 1.1 9.4 22.5 70.2 (X) 1.1 – – – .1 .1 .2 2.3 2.4 10
1.6 18.1 70.6 – .6 .1 – .1 .2 .1 .2 .8 .8 11
.5 20.0 69.0 1.0 1.3 .1 .1 .5 .4 .2 .3 3.3 2.6 12
.7 14.7 78.5 1.0 .8 – .1 .1 .5 .4 .3 2.6 2.8 132.7 19.0 63.4 1.0 1.3 .5 .4 .4 .4 .2 .7 1.8 2.1 141.6 27.5 55.5 1.0 .9 .3 .1 .1 .8 .4 .4 2.6 2.6 153.2 11.2 69.5 2.0 1.5 .1 .1 .5 1.0 .6 .6 2.0 2.3 16
2.8 20.8 60.9 1.0 .7 .4 – .3 1.0 .5 .4 1.9 1.9 173.0 14.5 66.8 1.0 1.9 .1 .2 .2 1.0 .4 .8 1.6 2.2 181.4 17.1 74.6 – 1.0 – – .1 .2 .1 .3 1.3 1.2 191.0 20.9 71.6 1.0 1.2 .2 – .2 .2 .2 .6 2.8 3.3 20
.9 20.1 70.3 – .3 .1 .1 .1 .1 .1 .1 .6 .8 21
.8 21.1 66.1 1.0 1.4 .2 .3 – .2 .6 .5 1.8 1.7 22
.5 14.9 77.9 – 1.2 .3 – .2 .1 .5 .3 2.0 3.0 231.8 23.1 58.2 1.0 1.0 .4 .2 .2 .5 .3 .5 1.5 2.3 241.6 27.6 56.9 – 1.2 .3 .2 .4 .3 .3 .5 2.0 2.2 25.8 19.0 69.0 2.0 2.1 .3 .2 .1 .2 .4 .5 1.2 2.6 26
1.5 19.2 68.2 – .8 .3 .1 .2 .5 .1 .5 1.8 1.6 271.9 15.8 73.7 1.0 .7 .3 .1 .3 .2 .2 .6 1.3 1.4 28.6 19.7 72.3 – .5 .1 .1 .2 .1 .2 .2 .9 1.2 29.8 24.6 68.0 – 1.2 .3 .1 .4 .3 .4 .4 2.9 2.1 30
2.7 19.2 59.8 – .6 .1 .1 .2 .3 .3 .4 .9 1.3 31
1.6 16.8 64.5 1.0 2.3 .1 .3 .1 1.4 .9 .9 2.6 3.8 322.6 13.0 71.2 1.0 1.4 .1 – 1.2 1.0 .4 .6 3.0 3.4 333.9 17.4 65.9 1.0 1.3 1.1 .1 .6 .6 .5 .8 3.5 2.8 343.6 22.3 56.5 1.0 2.5 .3 .1 1.1 1.3 .2 1.0 3.2 3.7 354.6 16.0 64.8 1.0 1.3 .3 – .4 .7 .6 1.2 2.2 2.8 36
4.4 21.5 48.3 1.0 .9 .6 .1 .3 1.0 .6 1.1 2.7 2.2 372.9 14.1 56.9 1.0 1.9 .3 .3 .6 1.5 .2 .7 2.6 3.3 381.6 19.5 64.1 – 1.0 .1 .2 .3 .6 .6 .5 1.4 2.2 391.3 25.0 61.6 1.0 2.2 .1 .3 .2 .9 .7 .8 1.8 2.9 40
1.5 15.1 72.9 – .4 .1 .1 .1 .2 .1 .1 .6 .3 41
1.4 20.7 64.2 – 1.6 .1 .1 .7 .6 .1 .6 2.6 3.1 423.1 11.3 70.4 – 1.7 .1 – .2 .4 .7 .7 1.9 2.7 433.6 14.6 67.4 – 1.3 .3 .2 .4 .8 .3 .6 2.0 1.2 442.5 13.5 65.2 – 2.2 .1 – .7 1.2 .3 .5 2.8 4.0 453.3 12.8 71.5 – 1.3 .6 .1 .2 .7 .8 1.1 1.5 2.0 46
1.1 17.6 65.4 – 1.2 .5 – .2 .6 .3 .2 1.9 1.8 472.2 12.9 73.1 – 1.2 .1 .2 .4 .6 .5 .6 1.8 1.9 481.2 14.3 76.6 – .5 .1 .1 .2 .3 .2 .2 1.0 .8 49.8 20.4 72.7 – 1.9 – – – .1 .1 .6 3.3 4.5 50
1.6 15.4 66.5 – .5 – .1 .2 .3 .2 .2 .9 1.2 51
.8 16.5 65.3 – 2.4 .2 .1 .1 .7 .3 .2 2.7 3.6 52
.4 10.6 78.3 – 1.2 .1 .2 .4 .2 .9 .2 1.8 2.5 533.0 11.9 62.7 – 2.2 .1 .3 .2 .3 1.0 .8 2.3 3.1 542.8 21.7 52.8 – 2.2 .1 .2 .2 .5 .5 1.0 2.8 2.5 552.3 16.0 64.0 – 1.5 .3 .1 .8 .4 .7 .4 1.1 2.3 56
2.3 20.3 52.9 – 2.9 .1 .1 .1 1.4 .6 .4 2.9 2.6 572.8 10.6 66.5 – 1.8 .3 .2 .6 .8 .3 .8 1.1 2.9 581.4 15.7 68.1 – 1.2 .1 .1 .2 .3 .3 .3 1.5 1.9 59.2 23.5 69.4 – 1.5 .1 – – .2 .1 .1 2.9 2.7 60
1992 ECONOMIC CENSUS CHARACTERISTICS OF BUSINESS OWNERS 191

Table 23b. Sources of Borrowed Capital for Firm by Receipts Size of Firm: 1992[All data are shown as percents, except firms. For meaning of abbreviations and symbols, see introductory text. For explanation of terms, see appendix A]
Type of firm and receipts size
Sources of borrowed capital obtained1
Firms(number)
Business loanfrom banking or
commerciallending institution
Government~guaranteed
business loanfrom banking or
commerciallending institution
Business loanfrom Federal,State or localgovernment
Business loanfrom investment
company/profit ornonprofit private
source
Businessloan from
previous owner
Businesstrade credit
from supplier
A B C D E F G
All businesses 17 253 143................................. 11.7 .4 .3 .6 1.9 .91
Less than $5,000 5 226 553..................................... 4.9 – .2 .3 .3 .32$5,000 to $9,999 2 443 946..................................... 6.8 .2 .3 – 1.0 .53$10,000 to $24,999 3 076 410................................... 6.8 .2 .1 .1 1.0 .74$25,000 to $49,999 1 945 806................................... 13.4 .4 .2 .7 1.1 1.65$50,000 to $99,999 1 615 940................................... 17.3 .3 .3 1.1 2.7 1.06
$100,000 to $199,999 1 197 996................................. 21.4 .8 .5 1.3 5.2 1.27$200,000 to $249,999 301 794................................. 28.5 2.6 .3 1.4 8.7 1.48$250,000 to $499,999 682 583................................. 29.8 1.2 .5 1.7 6.6 2.59$500,000 to $999,999 372 078................................. 33.9 2.3 1.2 2.3 7.5 2.710$1,000,000 or more 390 037................................... 32.6 2.3 .7 2.7 6.7 2.811
Hispanic ~owned businesses 771 708.................... 7.6 .3 .1 .3 1.6 .712
Less than $5,000 219 226..................................... 1.5 .3 – – .5 –13$5,000 to $9,999 140 362..................................... 3.3 – .1 – .6 .614$10,000 to $24,999 165 667................................... 4.8 – – – .9 .515$25,000 to $49,999 87 288................................... 8.9 .1 – .3 1.4 .716$50,000 to $99,999 64 742................................... 13.5 .6 .1 .7 3.0 1.217
$100,000 to $199,999 41 578................................. 16.2 .7 .3 1.2 3.0 1.418$200,000 to $249,999 10 030................................. 20.8 – .3 .9 6.7 2.719$250,000 to $499,999 22 301................................. 21.2 1.1 .3 1.8 5.0 1.620$500,000 to $999,999 11 319................................. 24.6 1.9 1.3 1.7 6.8 4.121$1,000,000 or more 9 194................................... 24.6 1.7 .4 1.6 4.7 2.422
Black ~owned businesses 620 912....................... 6.6 .7 .3 .5 .6 .623
Less than $5,000 236 722..................................... 3.1 .2 – .3 .1 .324$5,000 to $9,999 111 512..................................... 3.0 .4 .1 .3 .1 .225$10,000 to $24,999 129 901................................... 6.8 .5 .4 .3 .7 .126$25,000 to $49,999 62 209................................... 8.5 1.4 – .8 .6 2.127$50,000 to $99,999 39 218................................... 15.4 1.6 1.6 1.5 1.7 1.628
$100,000 to $199,999 20 936................................. 20.6 2.5 .8 1.5 3.6 3.129$200,000 to $249,999 4 533................................. 28.9 7.0 4.1 .8 3.8 3.730$250,000 to $499,999 9 029................................. 29.5 2.7 1.0 1.5 2.6 1.531$500,000 to $999,999 3 823................................. 27.8 4.7 1.0 2.1 3.9 1.432$1,000,000 or more 3 028................................... 29.5 1.5 4.1 5.6 3.8 2.133
Other minority ~owned businesses 606 426.............. 12.3 .7 .4 1.1 4.8 1.434
Less than $5,000 132 493..................................... 2.9 – .5 .1 .7 .935$5,000 to $9,999 80 435..................................... 1.6 .3 – – 1.3 .436$10,000 to $24,999 108 195................................... 7.9 .1 .1 .4 1.3 1.237$25,000 to $49,999 77 345................................... 12.2 1.1 .3 2.2 5.8 .738$50,000 to $99,999 70 360................................... 15.7 1.0 .1 .9 6.0 1.139
$100,000 to $199,999 58 620................................. 17.6 .6 .4 2.1 9.2 1.640$200,000 to $249,999 15 740................................. 22.8 .4 1.3 1.1 8.2 6.041$250,000 to $499,999 34 266................................. 29.2 1.7 .8 2.1 11.6 2.442$500,000 to $999,999 16 467................................. 28.2 3.4 .6 2.3 10.3 2.943$1,000,000 or more 12 505................................... 28.4 2.4 .6 1.4 9.4 4.644
Women ~owned businesses 5 888 883..................... 8.6 .4 .2 .5 1.7 .845
Less than $5,000 2 310 303..................................... 4.0 – – .4 .5 .546$5,000 to $9,999 967 380..................................... 4.7 .5 .3 .1 .4 .147$10,000 to $24,999 1 051 358................................... 5.6 .1 .1 .1 1.4 1.148$25,000 to $49,999 538 885................................... 12.7 1.3 .6 .1 1.0 .649$50,000 to $99,999 381 517................................... 16.8 .5 .2 1.2 3.2 .450
$100,000 to $199,999 267 089................................. 23.5 .5 .7 2.3 5.5 2.551$200,000 to $249,999 66 464................................. 23.7 .2 .5 .5 12.7 3.052$250,000 to $499,999 146 313................................. 29.2 1.7 .4 1.7 8.6 2.153$500,000 to $999,999 80 539................................. 30.5 3.2 1.3 2.3 9.0 3.254$1,000,000 or more 79 037................................... 30.9 2.6 .5 3.1 7.0 2.955
Nonminority male ~owned businesses 10 114 456........... 13.7 .4 .3 .6 2.0 1.056
Less than $5,000 2 608 047..................................... 5.9 – .3 .2 .1 .157$5,000 to $9,999 1 285 456..................................... 8.9 – .3 – 1.5 .758$10,000 to $24,999 1 763 830................................... 7.6 .2 .2 – .6 .559$25,000 to $49,999 1 248 482................................... 14.1 – – .9 1.0 2.060$50,000 to $99,999 1 108 065................................... 17.8 .2 .4 1.1 2.3 1.161
$100,000 to $199,999 840 723................................. 21.3 .9 .4 .9 5.0 .762$200,000 to $249,999 212 693................................. 30.8 3.7 .2 1.9 7.4 .563$250,000 to $499,999 488 462................................. 30.3 1.0 .6 1.7 5.9 2.764$500,000 to $999,999 266 408................................. 35.8 2.0 1.3 2.4 7.0 2.565$1,000,000 or more 292 290................................... 33.5 2.3 .7 2.6 6.6 2.766
1Data represent percentage of firms reporting in the designated categories. Sum of percents in categories will not equal 100 since multiple responses were allowed.2Includes firms that did not require capital to start/acquire their businesses or that did not borrow capital.3For explanation of relative standard errors and standard errors, see Reliability of Estimates in the introductory text.4Relative standard errors are not applicable for lines 1 through 11 since these data are the result of censuses, not surveys.
192 CHARACTERISTICS OF BUSINESS OWNERS 1992 ECONOMIC CENSUS
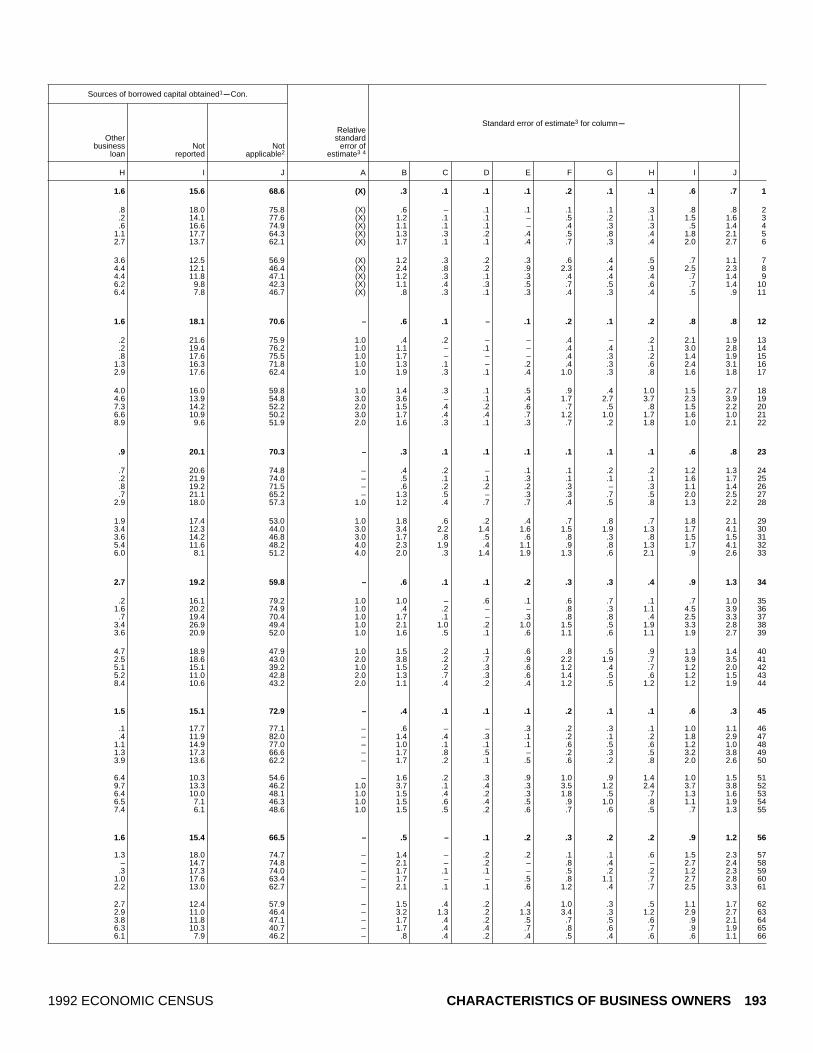
Sources of borrowed capital obtained1mCon.
Standard error of estimate3 for columnm
Otherbusiness
loanNot
reportedNot
applicable2
Relativestandard
error ofestimate3 4
H I J A B C D E F G H I J
1.6 15.6 68.6 (X) .3 .1 .1 .1 .2 .1 .1 .6 .7 1
.8 18.0 75.8 (X) .6 – .1 .1 .1 .1 .3 .8 .8 2
.2 14.1 77.6 (X) 1.2 .1 .1 – .5 .2 .1 1.5 1.6 3
.6 16.6 74.9 (X) 1.1 .1 .1 – .4 .3 .3 .5 1.4 41.1 17.7 64.3 (X) 1.3 .3 .2 .4 .5 .8 .4 1.8 2.1 52.7 13.7 62.1 (X) 1.7 .1 .1 .4 .7 .3 .4 2.0 2.7 6
3.6 12.5 56.9 (X) 1.2 .3 .2 .3 .6 .4 .5 .7 1.1 74.4 12.1 46.4 (X) 2.4 .8 .2 .9 2.3 .4 .9 2.5 2.3 84.4 11.8 47.1 (X) 1.2 .3 .1 .3 .4 .4 .4 .7 1.4 96.2 9.8 42.3 (X) 1.1 .4 .3 .5 .7 .5 .6 .7 1.4 106.4 7.8 46.7 (X) .8 .3 .1 .3 .4 .3 .4 .5 .9 11
1.6 18.1 70.6 – .6 .1 – .1 .2 .1 .2 .8 .8 12
.2 21.6 75.9 1.0 .4 .2 – – .4 – .2 2.1 1.9 13
.2 19.4 76.2 1.0 1.1 – .1 – .4 .4 .1 3.0 2.8 14
.8 17.6 75.5 1.0 1.7 – – – .4 .3 .2 1.4 1.9 151.3 16.3 71.8 1.0 1.3 .1 – .2 .4 .3 .6 2.4 3.1 162.9 17.6 62.4 1.0 1.9 .3 .1 .4 1.0 .3 .8 1.6 1.8 17
4.0 16.0 59.8 1.0 1.4 .3 .1 .5 .9 .4 1.0 1.5 2.7 184.6 13.9 54.8 3.0 3.6 – .1 .4 1.7 2.7 3.7 2.3 3.9 197.3 14.2 52.2 2.0 1.5 .4 .2 .6 .7 .5 .8 1.5 2.2 206.6 10.9 50.2 3.0 1.7 .4 .4 .7 1.2 1.0 1.7 1.6 1.0 218.9 9.6 51.9 2.0 1.6 .3 .1 .3 .7 .2 1.8 1.0 2.1 22
.9 20.1 70.3 – .3 .1 .1 .1 .1 .1 .1 .6 .8 23
.7 20.6 74.8 – .4 .2 – .1 .1 .2 .2 1.2 1.3 24
.2 21.9 74.0 – .5 .1 .1 .3 .1 .1 .1 1.6 1.7 25
.8 19.2 71.5 – .6 .2 .2 .2 .3 – .3 1.1 1.4 26
.7 21.1 65.2 – 1.3 .5 – .3 .3 .7 .5 2.0 2.5 272.9 18.0 57.3 1.0 1.2 .4 .7 .7 .4 .5 .8 1.3 2.2 28
1.9 17.4 53.0 1.0 1.8 .6 .2 .4 .7 .8 .7 1.8 2.1 293.4 12.3 44.0 3.0 3.4 2.2 1.4 1.6 1.5 1.9 1.3 1.7 4.1 303.6 14.2 46.8 3.0 1.7 .8 .5 .6 .8 .3 .8 1.5 1.5 315.4 11.6 48.2 4.0 2.3 1.9 .4 1.1 .9 .8 1.3 1.7 4.1 326.0 8.1 51.2 4.0 2.0 .3 1.4 1.9 1.3 .6 2.1 .9 2.6 33
2.7 19.2 59.8 – .6 .1 .1 .2 .3 .3 .4 .9 1.3 34
.2 16.1 79.2 1.0 1.0 – .6 .1 .6 .7 .1 .7 1.0 351.6 20.2 74.9 1.0 .4 .2 – – .8 .3 1.1 4.5 3.9 36.7 19.4 70.4 1.0 1.7 .1 – .3 .8 .8 .4 2.5 3.3 37
3.4 26.9 49.4 1.0 2.1 1.0 .2 1.0 1.5 .5 1.9 3.3 2.8 383.6 20.9 52.0 1.0 1.6 .5 .1 .6 1.1 .6 1.1 1.9 2.7 39
4.7 18.9 47.9 1.0 1.5 .2 .1 .6 .8 .5 .9 1.3 1.4 402.5 18.6 43.0 2.0 3.8 .2 .7 .9 2.2 1.9 .7 3.9 3.5 415.1 15.1 39.2 1.0 1.5 .2 .3 .6 1.2 .4 .7 1.2 2.0 425.2 11.0 42.8 2.0 1.3 .7 .3 .6 1.4 .5 .6 1.2 1.5 438.4 10.6 43.2 2.0 1.1 .4 .2 .4 1.2 .5 1.2 1.2 1.9 44
1.5 15.1 72.9 – .4 .1 .1 .1 .2 .1 .1 .6 .3 45
.1 17.7 77.1 – .6 – – .3 .2 .3 .1 1.0 1.1 46
.4 11.9 82.0 – 1.4 .4 .3 .1 .2 .1 .2 1.8 2.9 471.1 14.9 77.0 – 1.0 .1 .1 .1 .6 .5 .6 1.2 1.0 481.3 17.3 66.6 – 1.7 .8 .5 – .2 .3 .5 3.2 3.8 493.9 13.6 62.2 – 1.7 .2 .1 .5 .6 .2 .8 2.0 2.6 50
6.4 10.3 54.6 – 1.6 .2 .3 .9 1.0 .9 1.4 1.0 1.5 519.7 13.3 46.2 1.0 3.7 .1 .4 .3 3.5 1.2 2.4 3.7 3.8 526.4 10.0 48.1 1.0 1.5 .4 .2 .3 1.8 .5 .7 1.3 1.6 536.5 7.1 46.3 1.0 1.5 .6 .4 .5 .9 1.0 .8 1.1 1.9 547.4 6.1 48.6 1.0 1.5 .5 .2 .6 .7 .6 .5 .7 1.3 55
1.6 15.4 66.5 – .5 – .1 .2 .3 .2 .2 .9 1.2 56
1.3 18.0 74.7 – 1.4 – .2 .2 .1 .1 .6 1.5 2.3 57– 14.7 74.8 – 2.1 – .2 – .8 .4 – 2.7 2.4 58
.3 17.3 74.0 – 1.7 .1 .1 – .5 .2 .2 1.2 2.3 591.0 17.6 63.4 – 1.7 – – .5 .8 1.1 .7 2.7 2.8 602.2 13.0 62.7 – 2.1 .1 .1 .6 1.2 .4 .7 2.5 3.3 61
2.7 12.4 57.9 – 1.5 .4 .2 .4 1.0 .3 .5 1.1 1.7 622.9 11.0 46.4 – 3.2 1.3 .2 1.3 3.4 .3 1.2 2.9 2.7 633.8 11.8 47.1 – 1.7 .4 .2 .5 .7 .5 .6 .9 2.1 646.3 10.3 40.7 – 1.7 .4 .4 .7 .8 .6 .7 .9 1.9 656.1 7.9 46.2 – .8 .4 .2 .4 .5 .4 .6 .6 1.1 66
1992 ECONOMIC CENSUS CHARACTERISTICS OF BUSINESS OWNERS 193

Table 23c. Sources of Borrowed Capital for Firm by Employment Size of Firm: 1992[All data are shown as percents, except firms. For meaning of abbreviations and symbols, see introductory text. For explanation of terms, see appendix A]
Type of firm and employment size
Sources of borrowed capital obtained1
Firms(number)
Business loanfrom banking or
commerciallending institution
Government~guaranteed
business loanfrom banking or
commerciallending institution
Business loanfrom Federal,State or localgovernment
Business loanfrom investment
company/profit ornonprofit private
source
Businessloan from
previous owner
Businesstrade credit
from supplier
A B C D E F G
All businesses 17 253 143................................. 11.7 .4 .3 .6 1.9 .91
With no paid employees 14 118 184............................... 8.6 .2 .2 .4 1.0 .72With paid employees 3 134 959.................................. 25.5 1.1 .4 1.5 5.9 1.63
No employees5 435 838..................................... 16.2 .3 .1 .7 5.0 .941 to 4 employees 1 716 076................................... 23.1 .8 .2 1.3 5.3 1.555 to 9 employees 503 808................................... 32.5 1.6 .5 1.6 7.9 2.2610 to 19 employees 256 110................................. 32.6 1.9 .8 2.1 6.8 1.9720 to 49 employees 144 734................................. 33.4 2.4 .8 3.6 7.2 2.2850 to 99 employees 45 331................................. 43.9 2.5 2.0 2.5 6.9 4.09100 employees or more 33 062............................. 38.8 5.4 1.1 4.9 6.7 5.110
Hispanic ~owned businesses 771 708.................... 7.6 .3 .1 .3 1.6 .711
With no paid employees 656 343............................... 5.0 .1 – .2 .9 .412With paid employees 115 364.................................. 18.6 1.0 .3 1.0 4.5 1.913
No employees5 19 569..................................... 13.3 .1 .3 .7 3.7 1.6141 to 4 employees 64 631................................... 18.0 .9 .2 .8 3.6 1.4155 to 9 employees 16 937................................... 19.8 1.0 .5 1.6 8.1 4.01610 to 19 employees 8 553................................. 23.8 .9 .6 .9 4.7 1.91720 to 49 employees 4 050................................. 28.2 4.2 .2 2.2 7.6 3.11850 to 99 employees 948................................. 30.6 4.4 – 2.4 2.3 .819100 employees or more 676............................. 30.5 .8 2.1 3.1 1.9 1.020
Black ~owned businesses 620 912....................... 6.6 .7 .3 .5 .6 .621
With no paid employees 556 434............................... 5.2 .6 .2 .4 .5 .522With paid employees 64 478.................................. 18.4 1.8 1.4 1.5 1.6 2.023
No employees5 13 725..................................... 11.0 .9 .9 .1 .8 .8241 to 4 employees 37 587................................... 18.4 1.5 .8 1.3 1.6 2.3255 to 9 employees 7 853................................... 28.4 4.3 1.7 3.7 2.7 3.12610 to 19 employees 2 839................................. 20.4 2.7 8.9 2.4 1.5 1.82720 to 49 employees 1 700................................. 22.7 4.1 3.5 5.6 4.0 .92850 to 99 employees 432................................. 44.4 4.5 1.7 3.7 3.3 1.329100 employees or more 342............................. 30.6 2.9 3.2 4.6 2.6 1.230
Other minority ~owned businesses 606 426.............. 12.3 .7 .4 1.1 4.8 1.431
With no paid employees 470 075............................... 8.6 .3 .3 .9 3.1 1.032With paid employees 136 351.................................. 22.2 1.9 .5 1.5 9.4 2.533
No employees5 19 989..................................... 13.7 1.4 – .5 6.6 .7341 to 4 employees 76 636................................... 20.5 1.6 .2 1.0 8.9 2.6355 to 9 employees 22 862................................... 24.4 2.3 2.1 3.3 10.6 2.93610 to 19 employees 10 051................................. 31.1 3.2 .2 1.5 11.3 3.03720 to 49 employees 5 034................................. 35.9 3.5 .7 3.1 14.7 2.23850 to 99 employees 1 075................................. 40.0 3.1 1.2 1.2 7.5 5.139100 employees or more 705............................. 24.9 4.0 .9 4.0 11.3 3.640
Women ~owned businesses 5 888 883..................... 8.6 .4 .2 .5 1.7 .841
With no paid employees 5 071 110............................... 5.7 .3 .2 .3 .9 .642With paid employees 817 773.................................. 26.3 1.1 .3 1.7 6.3 1.843
No employees5 127 905..................................... 18.1 .9 – .5 4.5 1.7441 to 4 employees 435 550................................... 24.5 .7 .1 1.6 5.5 1.8455 to 9 employees 134 476................................... 32.3 1.8 .6 2.5 9.6 1.14610 to 19 employees 67 487................................. 32.4 1.4 .8 1.8 7.3 3.04720 to 49 employees 35 515................................. 35.0 1.5 .3 3.7 6.6 2.64850 to 99 employees 10 178................................. 40.1 4.0 1.7 1.2 4.4 2.449100 employees or more 6 663............................. 38.1 7.7 1.9 4.2 9.4 2.550
Nonminority male ~owned businesses 10 114 456........... 13.7 .4 .3 .6 2.0 1.051
With no paid employees 8 019 462............................... 10.5 .2 .3 .4 1.0 .852With paid employees 2 094 993.................................. 25.8 1.1 .4 1.4 5.7 1.553
No employees5 271 380..................................... 15.7 – .1 .8 5.3 .5541 to 4 employees 1 155 800................................... 23.0 .8 .2 1.2 5.1 1.2555 to 9 employees 334 483................................... 33.6 1.4 .4 1.2 7.1 2.55610 to 19 employees 173 140................................. 32.9 2.1 .7 2.3 6.5 1.35720 to 49 employees 101 938................................. 33.2 2.5 .9 3.5 7.3 2.15850 to 99 employees 33 406................................. 45.4 2.1 2.1 2.8 7.7 4.559100 employees or more 24 846............................. 40.0 4.9 .9 5.3 5.8 6.060
1Data represent percentage of firms reporting in the designated categories. Sum of percents in categories will not equal 100 since multiple responses were allowed.2Includes firms that did not require capital to start/acquire their businesses or that did not borrow capital.3For explanation of relative standard errors and standard errors, see Reliability of Estimates in the introductory text.4Relative standard errors are not applicable for lines 1 through 10 since these data are the result of censuses, not surveys.5Firms reported annual payroll, but did not report any employees on their payroll during specified period in 1992.
194 CHARACTERISTICS OF BUSINESS OWNERS 1992 ECONOMIC CENSUS

Sources of borrowed capital obtained1mCon.
Standard error of estimate3 for columnm
Otherbusiness
loanNot
reportedNot
applicable2
Relativestandard
error ofestimate3 4
H I J A B C D E F G H I J
1.6 15.6 68.6 (X) .3 .1 .1 .1 .2 .1 .1 .6 .7 1
.9 16.2 72.6 (X) .3 .1 .1 .1 .2 .1 .1 .6 .8 24.6 13.0 51.0 (X) 1.0 .1 .1 .3 .4 .2 .4 .9 1.0 35.0 14.7 59.1 (X) 2.9 .2 .1 .4 2.1 .2 1.4 1.8 3.6 43.7 14.7 53.0 (X) 1.4 .1 .1 .3 .6 .2 .5 1.5 1.4 55.3 10.0 45.0 (X) 1.5 .2 .2 .3 1.1 .5 .7 1.2 2.3 66.1 9.1 45.6 (X) 1.2 .5 .3 .4 1.1 .4 .6 .7 2.0 76.8 9.5 42.5 (X) 1.5 .5 .3 .6 1.0 .6 .7 1.7 2.8 85.8 4.8 40.1 (X) 3.6 1.0 .9 .9 2.0 .9 .6 1.1 3.6 96.6 4.6 42.1 (X) 3.3 2.8 .5 1.3 1.7 1.6 1.3 1.1 3.3 10
1.6 18.1 70.6 – .6 .1 – .1 .2 .1 .2 .8 .8 11
.8 19.1 73.7 – .6 .1 – – .2 .1 .1 1.0 .9 125.2 13.9 57.6 1.0 1.2 .2 .1 .2 .5 .4 .7 .7 1.7 134.3 16.1 62.4 2.0 2.7 .1 .2 .4 2.4 .7 2.3 3.2 4.1 143.1 14.1 61.0 1.0 2.4 .4 .1 .2 .5 .5 .5 1.2 2.8 15
10.1 14.8 47.5 2.0 1.6 .2 .3 .7 1.8 1.6 1.4 2.3 2.9 167.7 12.5 51.7 3.0 2.1 .3 .3 .3 1.1 .4 2.5 1.5 2.9 17
10.9 6.0 47.0 4.0 2.8 1.5 .1 1.0 1.6 .6 2.6 1.0 4.7 1810.3 7.9 48.4 6.0 3.9 1.9 – 1.4 .7 .3 2.6 1.7 3.1 1913.7 3.7 48.0 8.0 4.9 .4 1.6 1.3 1.4 .5 4.1 1.4 6.2 20
.9 20.1 70.3 – .3 .1 .1 .1 .1 .1 .1 .6 .8 21
.7 20.5 72.0 – .2 .1 .1 .1 .1 .1 .1 .6 .8 222.8 17.2 55.8 1.0 1.4 .2 .4 .4 .3 .3 .4 1.3 1.9 233.8 21.3 60.9 2.0 1.6 .4 .3 .1 .6 .3 1.8 3.1 3.0 242.0 16.7 57.2 1.0 1.7 .5 .3 .5 .4 .6 .5 1.7 2.0 253.4 18.2 41.2 3.0 2.9 1.3 .7 2.3 .8 1.1 .5 3.5 2.6 263.1 7.7 54.0 4.0 2.2 1.4 4.2 1.3 .4 1.2 1.6 1.5 3.3 274.6 11.4 51.6 6.0 2.9 2.3 1.7 2.7 1.7 .4 1.5 2.9 4.7 28
12.2 10.0 36.1 8.0 7.2 1.5 1.7 1.3 2.1 1.2 7.5 4.6 4.5 2913.7 3.2 51.2 – 4.9 1.2 2.0 1.7 1.5 .9 4.8 2.1 6.6 30
2.7 19.2 59.8 – .6 .1 .1 .2 .3 .3 .4 .9 1.3 31
1.5 19.9 65.9 – .9 .1 .1 .3 .4 .4 .4 1.3 1.9 325.8 17.2 43.5 1.0 1.2 .5 .1 .3 .7 .3 .7 1.7 1.7 334.4 31.2 43.3 2.0 3.0 .7 – .4 2.0 .3 1.7 6.5 5.9 345.6 17.6 45.9 1.0 1.6 .9 .1 .4 .8 .5 1.2 1.9 2.5 356.7 14.8 39.2 2.0 2.2 .6 .7 .8 1.9 .8 1.3 1.9 2.5 367.2 6.9 41.5 2.0 2.9 .7 .1 .4 1.3 .6 1.0 1.2 2.4 377.2 6.2 35.4 4.0 3.0 1.6 .3 1.4 2.3 .9 1.1 1.7 2.6 384.7 7.8 40.6 6.0 4.1 1.7 .4 .5 2.6 1.6 1.7 2.2 3.9 396.6 17.1 40.3 6.0 3.7 3.6 1.2 2.9 6.4 1.5 1.7 4.6 4.9 40
1.5 15.1 72.9 – .4 .1 .1 .1 .2 .1 .1 .6 .3 41
.8 15.4 76.7 – .4 .1 .1 .1 .2 .1 .1 .7 .5 425.8 12.9 49.9 – 1.5 .2 .1 .3 .6 .3 .7 1.0 1.6 435.1 22.8 51.6 1.0 5.3 .9 – .2 1.5 .9 .9 5.7 6.1 445.4 13.0 52.7 – 1.6 .3 .1 .5 1.1 .5 .9 .8 2.0 456.2 7.5 45.8 1.0 2.8 .5 .2 .6 1.5 .2 1.0 1.0 2.6 466.8 10.4 43.8 1.0 1.8 .3 .4 .5 1.3 .8 1.6 1.8 2.3 477.4 10.7 41.2 1.0 2.0 .3 .2 1.4 1.5 .8 1.9 3.6 3.7 488.2 5.1 42.1 2.0 3.9 .8 .8 .5 1.0 1.1 1.8 .6 3.8 49
11.1 4.5 33.4 2.0 4.8 4.1 1.2 1.2 2.8 1.3 3.5 1.3 4.5 50
1.6 15.4 66.5 – .5 – .1 .2 .3 .2 .2 .9 1.2 51
.9 16.2 70.5 – .6 .1 .1 .2 .3 .2 .3 .9 1.2 524.1 12.5 51.5 – 1.1 .2 .1 .4 .6 .2 .6 1.3 1.4 534.9 9.2 64.1 – 3.3 – .1 .6 2.9 .2 2.2 2.3 5.6 543.1 15.1 52.9 – 2.0 .2 .1 .6 1.0 .3 .8 2.2 2.2 554.9 10.1 45.0 – 2.4 .4 .3 .4 1.3 .7 1.1 1.9 3.1 566.0 8.6 46.5 1.0 1.7 .8 .3 .7 1.4 .4 1.1 1.0 3.3 576.5 9.3 42.8 1.0 2.1 .7 .4 .8 1.2 .7 .8 1.7 3.5 585.0 4.5 39.2 1.0 4.1 1.2 1.1 1.1 2.6 1.1 .8 1.5 4.9 595.0 4.3 44.3 1.0 3.4 3.8 .6 1.7 2.2 1.9 1.1 1.5 4.0 60
1992 ECONOMIC CENSUS CHARACTERISTICS OF BUSINESS OWNERS 195

Table 23d. Sources of Borrowed Capital for Firm by Legal Form of Organization of Firm: 1992[All data are shown as percents, except firms. For meaning of abbreviations and symbols, see introductory text. For explanation of terms, see appendix A]
Type of firm and legal form of organization
Sources of borrowed capital obtained1
Firms(number)
Business loanfrom banking or
commerciallending institution
Government~guaranteed
business loanfrom banking or
commerciallending institution
Business loanfrom Federal,State or localgovernment
Business loanfrom investment
company/profit ornonprofit private
source
Businessloan from
previous owner
Businesstrade credit
from supplier
A B C D E F G
All businesses 17 253 143................................. 11.7 .4 .3 .6 1.9 .91
Individual proprietorships 14 599 295.............................. 9.5 .3 .2 .3 1.4 .82Partnerships 1 089 578......................................... 28.2 1.4 1.1 2.4 4.6 .63Subchapter S corporations 1 564 270............................. 22.6 1.0 .4 2.5 5.2 1.74
Hispanic ~owned businesses 771 708.................... 7.6 .3 .1 .3 1.6 .75
Individual proprietorships 689 015.............................. 5.7 .2 – .2 1.0 .66Partnerships 32 650......................................... 23.0 .2 .5 1.2 6.1 .87Subchapter S corporations 50 042............................. 17.5 1.3 .3 1.7 5.0 2.08
Black ~owned businesses 620 912....................... 6.6 .7 .3 .5 .6 .69
Individual proprietorships 584 256.............................. 5.9 .6 .3 .4 .5 .610Partnerships 14 727......................................... 19.1 2.4 2.0 2.1 2.6 1.311Subchapter S corporations 21 928............................. 21.4 1.8 1.1 3.4 2.1 .812
Other minority ~owned businesses 606 426.............. 12.3 .7 .4 1.1 4.8 1.413
Individual proprietorships 502 022.............................. 8.4 .5 .2 .4 3.7 1.014Partnerships 49 489......................................... 28.4 1.5 .8 4.9 11.0 2.215Subchapter S corporations 54 915............................. 22.8 1.2 .7 2.2 7.1 2.916
Women ~owned businesses 5 888 883..................... 8.6 .4 .2 .5 1.7 .817
Individual proprietorships 5 078 077.............................. 6.1 .3 .2 .3 1.0 .718Partnerships 243 651......................................... 27.5 1.2 1.0 1.3 4.8 .719Subchapter S corporations 567 155............................. 24.8 1.0 .3 2.3 6.6 1.820
Nonminority male ~owned businesses 10 114 456........... 13.7 .4 .3 .6 2.0 1.021
Individual proprietorships 8 414 238.............................. 11.7 .2 .2 .3 1.6 1.022Partnerships 777 379......................................... 28.5 1.4 1.1 2.5 4.1 .423Subchapter S corporations 922 838............................. 21.3 1.0 .4 2.6 4.3 1.524
1Data represent percentage of firms reporting in the designated categories. Sum of percents in categories will not equal 100 since multiple responses were allowed.2Includes firms that did not require capital to start/acquire their businesses or that did not borrow capital.3For explanation of relative standard errors and standard errors, see Reliability of Estimates in the introductory text.4Relative standard errors are not applicable for lines 1 through 4 since these data are the result of censuses, not surveys.
196 CHARACTERISTICS OF BUSINESS OWNERS 1992 ECONOMIC CENSUS
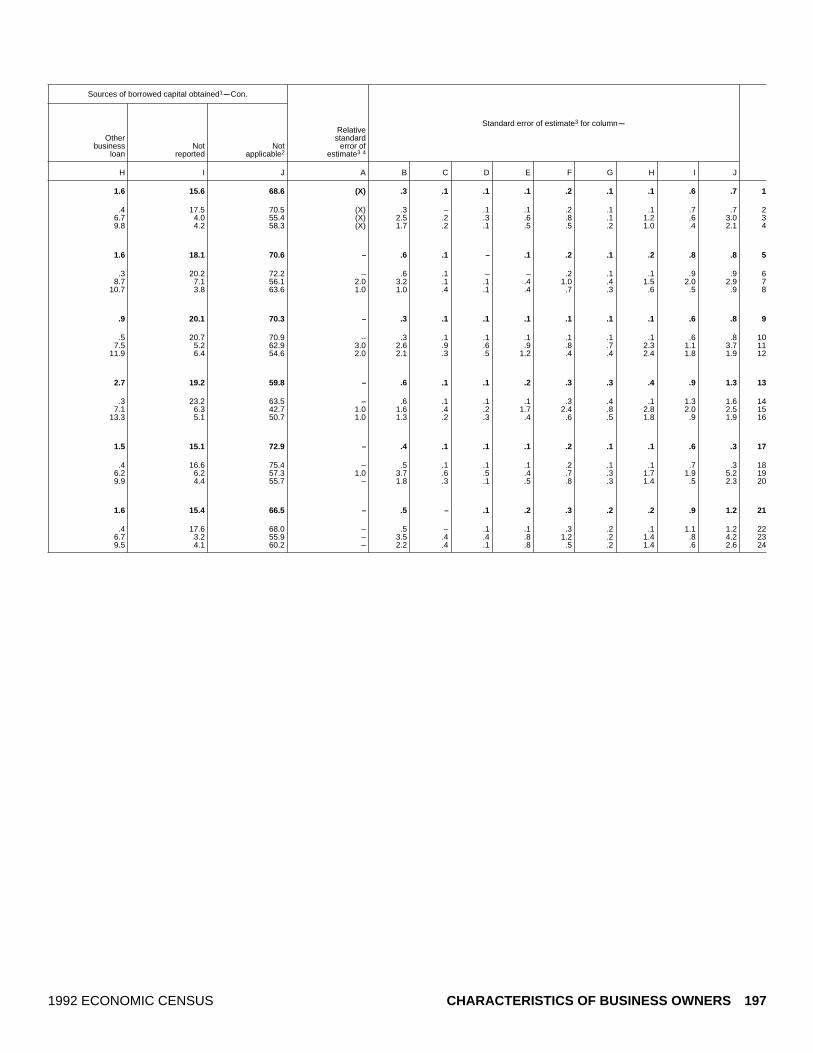
Sources of borrowed capital obtained1mCon.
Standard error of estimate3 for columnm
Otherbusiness
loanNot
reportedNot
applicable2
Relativestandard
error ofestimate3 4
H I J A B C D E F G H I J
1.6 15.6 68.6 (X) .3 .1 .1 .1 .2 .1 .1 .6 .7 1
.4 17.5 70.5 (X) .3 – .1 .1 .2 .1 .1 .7 .7 26.7 4.0 55.4 (X) 2.5 .2 .3 .6 .8 .1 1.2 .6 3.0 39.8 4.2 58.3 (X) 1.7 .2 .1 .5 .5 .2 1.0 .4 2.1 4
1.6 18.1 70.6 – .6 .1 – .1 .2 .1 .2 .8 .8 5
.3 20.2 72.2 – .6 .1 – – .2 .1 .1 .9 .9 68.7 7.1 56.1 2.0 3.2 .1 .1 .4 1.0 .4 1.5 2.0 2.9 7
10.7 3.8 63.6 1.0 1.0 .4 .1 .4 .7 .3 .6 .5 .9 8
.9 20.1 70.3 – .3 .1 .1 .1 .1 .1 .1 .6 .8 9
.5 20.7 70.9 – .3 .1 .1 .1 .1 .1 .1 .6 .8 107.5 5.2 62.9 3.0 2.6 .9 .6 .9 .8 .7 2.3 1.1 3.7 11
11.9 6.4 54.6 2.0 2.1 .3 .5 1.2 .4 .4 2.4 1.8 1.9 12
2.7 19.2 59.8 – .6 .1 .1 .2 .3 .3 .4 .9 1.3 13
.3 23.2 63.5 – .6 .1 .1 .1 .3 .4 .1 1.3 1.6 147.1 6.3 42.7 1.0 1.6 .4 .2 1.7 2.4 .8 2.8 2.0 2.5 15
13.3 5.1 50.7 1.0 1.3 .2 .3 .4 .6 .5 1.8 .9 1.9 16
1.5 15.1 72.9 – .4 .1 .1 .1 .2 .1 .1 .6 .3 17
.4 16.6 75.4 – .5 .1 .1 .1 .2 .1 .1 .7 .3 186.2 6.2 57.3 1.0 3.7 .6 .5 .4 .7 .3 1.7 1.9 5.2 199.9 4.4 55.7 – 1.8 .3 .1 .5 .8 .3 1.4 .5 2.3 20
1.6 15.4 66.5 – .5 – .1 .2 .3 .2 .2 .9 1.2 21
.4 17.6 68.0 – .5 – .1 .1 .3 .2 .1 1.1 1.2 226.7 3.2 55.9 – 3.5 .4 .4 .8 1.2 .2 1.4 .8 4.2 239.5 4.1 60.2 – 2.2 .4 .1 .8 .5 .2 1.4 .6 2.6 24
1992 ECONOMIC CENSUS CHARACTERISTICS OF BUSINESS OWNERS 197
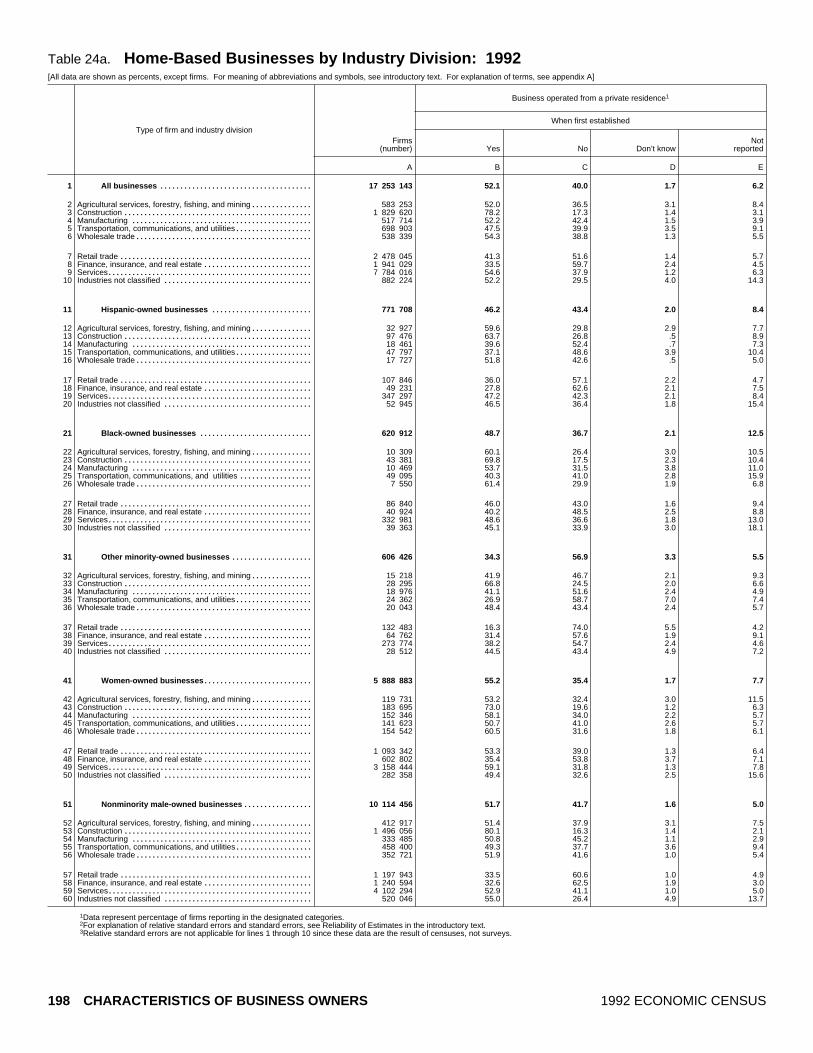
Table 24a. Home ~Based Businesses by Industry Division: 1992[All data are shown as percents, except firms. For meaning of abbreviations and symbols, see introductory text. For explanation of terms, see appendix A]
Type of firm and industry division
Business operated from a private residence1
When first established
Firms(number) Yes No Don’t know
Notreported
A B C D E
All businesses 17 253 143...................................... 52.1 40.0 1.7 6.21
Agricultural services, forestry, fishing, and mining 583 253............... 52.0 36.5 3.1 8.42Construction 1 829 620............................................... 78.2 17.3 1.4 3.13Manufacturing 517 714............................................. 52.2 42.4 1.5 3.94Transportation, communications, and utilities 698 903................... 47.5 39.9 3.5 9.15Wholesale trade 538 339............................................ 54.3 38.8 1.3 5.56
Retail trade 2 478 045................................................ 41.3 51.6 1.4 5.77Finance, insurance, and real estate 1 941 029........................... 33.5 59.7 2.4 4.58Services 7 784 016................................................... 54.6 37.9 1.2 6.39Industries not classified 882 224..................................... 52.2 29.5 4.0 14.310
Hispanic ~owned businesses 771 708......................... 46.2 43.4 2.0 8.411
Agricultural services, forestry, fishing, and mining 32 927............... 59.6 29.8 2.9 7.712Construction 97 476............................................... 63.7 26.8 .5 8.913Manufacturing 18 461............................................. 39.6 52.4 .7 7.314Transportation, communications, and utilities 47 797................... 37.1 48.6 3.9 10.415Wholesale trade 17 727............................................ 51.8 42.6 .5 5.016
Retail trade 107 846................................................ 36.0 57.1 2.2 4.717Finance, insurance, and real estate 49 231........................... 27.8 62.6 2.1 7.518Services 347 297................................................... 47.2 42.3 2.1 8.419Industries not classified 52 945..................................... 46.5 36.4 1.8 15.420
Black ~owned businesses 620 912............................ 48.7 36.7 2.1 12.521
Agricultural services, forestry, fishing, and mining 10 309............... 60.1 26.4 3.0 10.522Construction 43 381............................................... 69.8 17.5 2.3 10.423Manufacturing 10 469............................................. 53.7 31.5 3.8 11.024Transportation, communications, and utilities 49 095.................. 40.3 41.0 2.8 15.925Wholesale trade 7 550............................................ 61.4 29.9 1.9 6.826
Retail trade 86 840................................................ 46.0 43.0 1.6 9.427Finance, insurance, and real estate 40 924........................... 40.2 48.5 2.5 8.828Services 332 981................................................... 48.6 36.6 1.8 13.029Industries not classified 39 363..................................... 45.1 33.9 3.0 18.130
Other minority ~owned businesses 606 426.................... 34.3 56.9 3.3 5.531
Agricultural services, forestry, fishing, and mining 15 218............... 41.9 46.7 2.1 9.332Construction 28 295............................................... 66.8 24.5 2.0 6.633Manufacturing 18 976............................................. 41.1 51.6 2.4 4.934Transportation, communications, and utilities 24 362................... 26.9 58.7 7.0 7.435Wholesale trade 20 043............................................ 48.4 43.4 2.4 5.736
Retail trade 132 483................................................ 16.3 74.0 5.5 4.237Finance, insurance, and real estate 64 762........................... 31.4 57.6 1.9 9.138Services 273 774................................................... 38.2 54.7 2.4 4.639Industries not classified 28 512..................................... 44.5 43.4 4.9 7.240
Women ~owned businesses 5 888 883........................... 55.2 35.4 1.7 7.741
Agricultural services, forestry, fishing, and mining 119 731............... 53.2 32.4 3.0 11.542Construction 183 695............................................... 73.0 19.6 1.2 6.343Manufacturing 152 346............................................. 58.1 34.0 2.2 5.744Transportation, communications, and utilities 141 623................... 50.7 41.0 2.6 5.745Wholesale trade 154 542............................................ 60.5 31.6 1.8 6.146
Retail trade 1 093 342................................................ 53.3 39.0 1.3 6.447Finance, insurance, and real estate 602 802........................... 35.4 53.8 3.7 7.148Services 3 158 444................................................... 59.1 31.8 1.3 7.849Industries not classified 282 358..................................... 49.4 32.6 2.5 15.650
Nonminority male ~owned businesses 10 114 456................. 51.7 41.7 1.6 5.051
Agricultural services, forestry, fishing, and mining 412 917............... 51.4 37.9 3.1 7.552Construction 1 496 056............................................... 80.1 16.3 1.4 2.153Manufacturing 333 485............................................. 50.8 45.2 1.1 2.954Transportation, communications, and utilities 458 400................... 49.3 37.7 3.6 9.455Wholesale trade 352 721............................................ 51.9 41.6 1.0 5.456
Retail trade 1 197 943................................................ 33.5 60.6 1.0 4.957Finance, insurance, and real estate 1 240 594........................... 32.6 62.5 1.9 3.058Services 4 102 294................................................... 52.9 41.1 1.0 5.059Industries not classified 520 046..................................... 55.0 26.4 4.9 13.760
1Data represent percentage of firms reporting in the designated categories.2For explanation of relative standard errors and standard errors, see Reliability of Estimates in the introductory text.3Relative standard errors are not applicable for lines 1 through 10 since these data are the result of censuses, not surveys.
198 CHARACTERISTICS OF BUSINESS OWNERS 1992 ECONOMIC CENSUS

Business operated from aprivate residence1
mCon.
During 1992 Standard error of estimate2 for columnm
Yes NoNot
reported
Relativestandard
error ofestimate2 3
F G H A B C D E F G H
49.6 43.2 7.2 (X) .6 .6 .3 .3 .6 .4 .4 1
52.2 38.2 9.5 (X) 3.0 3.9 1.0 1.3 3.0 3.4 1.3 274.2 21.5 4.3 (X) 1.8 2.1 .8 .6 1.7 1.7 .6 349.2 46.0 4.9 (X) 1.6 1.7 .4 .7 1.2 1.4 .9 447.0 42.7 10.4 (X) 3.2 3.0 1.4 1.2 3.4 3.2 1.4 549.6 44.5 6.0 (X) 1.3 1.5 .4 1.0 1.6 1.6 1.0 6
38.9 54.7 6.4 (X) 1.5 2.2 .4 .9 1.6 1.9 1.0 733.2 60.2 6.6 (X) 1.9 1.6 .9 .8 1.8 2.2 1.3 851.8 41.1 7.1 (X) .9 1.1 .3 .4 .9 .7 .7 948.6 35.0 16.4 (X) 2.4 2.6 1.3 1.9 2.4 2.7 2.3 10
44.2 45.7 10.1 – 1.4 .8 .3 .9 1.6 1.0 1.0 11
58.5 31.7 9.8 1.0 3.7 3.5 .9 1.9 3.7 3.2 2.5 1260.1 29.7 10.2 1.0 4.1 2.6 .4 2.0 3.7 3.0 2.0 1334.9 56.7 8.4 1.0 1.6 1.6 .3 1.3 1.9 2.1 1.3 1434.6 52.8 12.6 1.0 3.5 2.5 1.2 2.0 3.5 3.2 2.3 1544.1 50.7 5.2 2.0 2.3 2.3 .3 1.0 2.6 1.9 1.5 16
34.0 59.6 6.4 1.0 2.9 2.7 .9 .9 3.4 3.1 1.3 1726.1 64.4 9.5 1.0 1.8 2.6 .6 1.7 2.0 2.8 2.1 1846.1 43.9 9.9 – 2.5 2.0 .4 1.5 2.7 1.8 1.6 1943.7 36.7 19.6 1.0 4.3 2.9 .8 2.1 3.9 3.7 1.7 20
47.2 37.7 15.1 – 1.2 1.0 .2 .4 1.1 .9 .4 21
58.3 29.2 12.5 1.0 1.2 1.3 1.0 1.6 1.5 1.4 1.8 2265.1 21.0 13.9 – 2.2 1.2 .5 1.4 2.1 1.1 1.8 2349.8 35.3 14.9 1.0 1.7 1.8 1.2 1.3 1.8 1.5 1.2 2439.0 42.3 18.7 – 1.3 1.9 .8 1.5 1.6 1.8 1.3 2556.2 34.2 9.6 2.0 2.4 1.7 .6 1.1 2.5 2.0 1.2 26
44.5 43.6 11.9 – 1.5 1.7 .6 1.3 1.5 1.9 1.6 2739.3 50.7 10.0 1.0 2.7 2.8 .6 .8 2.2 2.5 .7 2847.5 36.9 15.6 – 2.1 1.7 .3 .9 1.8 1.4 .8 2943.4 36.3 20.2 – 2.3 1.0 .5 2.3 2.1 1.6 1.7 30
33.8 59.9 6.3 – 1.0 1.1 .2 .2 1.0 1.1 .5 31
42.2 49.6 8.3 1.0 3.8 3.8 1.0 2.8 3.5 4.0 1.7 3263.3 27.5 9.2 1.0 2.6 3.5 1.0 1.8 3.0 3.8 2.2 3337.4 56.9 5.7 1.0 3.2 2.9 1.3 1.2 4.0 3.6 1.4 3427.1 62.9 10.0 1.0 2.6 2.5 2.5 2.7 3.3 3.5 2.6 3542.7 49.8 7.5 1.0 3.9 2.5 1.4 1.7 4.6 3.6 2.3 36
17.2 77.2 5.6 1.0 1.4 1.8 .9 .9 1.6 1.7 1.0 3733.4 56.2 10.4 1.0 3.1 2.7 1.0 1.6 2.9 1.9 1.7 3837.4 58.0 4.6 – 1.6 2.0 .5 .5 1.3 1.4 .6 3942.4 48.8 8.9 1.0 3.5 3.9 1.3 2.5 3.6 3.4 2.6 40
53.2 38.2 8.6 – .8 .4 .3 .7 .7 .4 .8 41
51.7 37.1 11.1 – 3.1 3.4 1.0 3.5 2.5 4.1 3.2 4267.4 24.7 7.8 – 1.8 1.9 .6 1.3 2.1 2.4 1.3 4355.9 36.7 7.4 – 2.2 1.8 1.0 .9 1.7 1.8 1.2 4447.9 45.6 6.5 – 3.2 3.0 1.0 1.1 3.6 3.3 .9 4556.3 37.0 6.7 – 2.9 2.8 .7 1.1 2.6 2.4 1.3 46
50.4 42.0 7.7 – 1.2 1.1 .6 1.1 1.1 1.6 1.6 4733.9 57.0 9.1 – 3.2 3.1 1.1 1.6 3.3 3.6 1.5 4857.7 34.0 8.2 – 1.5 1.2 .3 .9 1.5 1.1 1.0 4946.9 35.1 18.1 – 4.0 3.2 1.2 2.0 3.0 2.5 2.1 50
48.8 45.2 6.0 – .7 .8 .3 .4 .8 .7 .5 51
52.3 38.7 9.0 – 4.3 5.0 1.5 1.7 4.0 4.2 1.9 5276.2 20.7 3.1 – 2.4 2.7 1.0 .6 2.1 2.1 .8 5347.6 49.0 3.5 – 1.9 2.2 .4 .9 1.6 1.7 1.1 5449.5 39.9 10.6 – 4.2 3.8 1.9 1.8 4.5 4.2 2.0 5547.2 47.2 5.6 – 1.3 1.6 .4 1.3 1.9 1.9 1.3 56
31.1 63.9 5.0 – 3.1 4.2 .7 1.3 3.3 3.9 1.3 5732.9 61.9 5.2 – 2.6 2.1 1.1 .9 3.2 3.2 1.5 5848.8 45.3 5.9 – 1.2 1.4 .4 .9 1.3 1.2 1.0 5950.5 33.9 15.6 – 2.1 3.6 1.7 2.9 3.2 4.8 3.6 60
1992 ECONOMIC CENSUS CHARACTERISTICS OF BUSINESS OWNERS 199

Table 24b. Home ~Based Businesses by Receipts Size of Firm: 1992[All data are shown as percents, except firms. For meaning of abbreviations and symbols, see introductory text. For explanation of terms, see appendix A]
Type of firm and receipts size
Business operated from a private residence1
When first established
Firms(number) Yes No Don’t know
Notreported
A B C D E
All businesses 17 253 143...................................... 52.1 40.0 1.7 6.21
Less than $5,000 5 226 553........................................... 61.6 25.3 2.3 10.72$5,000 to $9,999 2 443 946........................................... 57.6 34.0 2.1 6.33$10,000 to $24,999 3 076 410......................................... 59.1 34.0 2.0 4.94$25,000 to $49,999 1 945 806......................................... 57.1 36.6 1.0 5.25$50,000 to $99,999 1 615 940......................................... 43.8 52.7 .8 2.76
$100,000 to $199,999 1 197 996....................................... 35.7 61.2 .9 2.27$200,000 to $249,999 301 794....................................... 24.0 73.0 1.1 1.98$250,000 to $499,999 682 583....................................... 22.8 73.6 1.0 2.69$500,000 to $999,999 372 078....................................... 18.7 77.1 .9 3.410$1,000,000 or more 390 037......................................... 14.1 81.9 1.1 2.911
Hispanic ~owned businesses 771 708......................... 46.2 43.4 2.0 8.412
Less than $5,000 219 226........................................... 57.4 26.8 1.9 13.913$5,000 to $9,999 140 362........................................... 47.3 37.7 3.8 11.214$10,000 to $24,999 165 667......................................... 47.4 40.6 3.2 8.715$25,000 to $49,999 87 288......................................... 47.0 48.1 .8 4.116$50,000 to $99,999 64 742......................................... 41.3 53.2 .7 4.817
$100,000 to $199,999 41 578....................................... 35.2 62.8 .4 1.618$200,000 to $249,999 10 030....................................... 30.3 64.9 .4 4.419$250,000 to $499,999 22 301....................................... 26.8 69.9 .4 2.920$500,000 to $999,999 11 319....................................... 22.2 74.3 .7 2.821$1,000,000 or more 9 194......................................... 16.0 81.0 .7 2.322
Black ~owned businesses 620 912............................ 48.7 36.7 2.1 12.523
Less than $5,000 236 722........................................... 54.7 26.1 2.3 16.824$5,000 to $9,999 111 512........................................... 52.3 32.2 2.5 13.125$10,000 to $24,999 129 901......................................... 46.6 40.3 2.1 11.026$25,000 to $49,999 62 209......................................... 41.7 47.9 1.6 8.727$50,000 to $99,999 39 218......................................... 40.8 51.6 1.2 6.428
$100,000 to $199,999 20 936....................................... 37.0 58.0 1.2 3.729$200,000 to $249,999 4 533....................................... 24.8 70.4 2.0 2.830$250,000 to $499,999 9 029....................................... 22.7 74.1 .6 2.731$500,000 to $999,999 3 823....................................... 17.2 78.0 .5 4.232$1,000,000 or more 3 028......................................... 15.9 78.8 1.5 3.833
Other minority ~owned businesses 606 426.................... 34.3 56.9 3.3 5.534
Less than $5,000 132 493........................................... 59.2 31.5 3.3 6.135$5,000 to $9,999 80 435........................................... 43.1 43.2 4.3 9.336$10,000 to $24,999 108 195......................................... 45.6 46.3 2.5 5.737$25,000 to $49,999 77 345......................................... 29.1 60.0 5.2 5.738$50,000 to $99,999 70 360......................................... 24.5 66.8 3.6 5.039
$100,000 to $199,999 58 620....................................... 18.3 74.4 3.0 4.340$200,000 to $249,999 15 740....................................... 14.3 82.2 .7 2.741$250,000 to $499,999 34 266....................................... 13.3 81.5 1.9 3.342$500,000 to $999,999 16 467....................................... 13.4 81.4 2.4 2.843$1,000,000 or more 12 505......................................... 13.3 81.1 1.7 3.944
Women ~owned businesses 5 888 883........................... 55.2 35.4 1.7 7.745
Less than $5,000 2 310 303........................................... 62.0 24.3 2.3 11.346$5,000 to $9,999 967 380........................................... 65.9 27.6 1.6 4.947$10,000 to $24,999 1 051 358......................................... 59.8 31.4 1.9 6.948$25,000 to $49,999 538 885......................................... 48.1 44.1 .3 7.549$50,000 to $99,999 381 517......................................... 38.1 55.4 1.3 5.250
$100,000 to $199,999 267 089....................................... 31.7 65.6 .8 2.051$200,000 to $249,999 66 464....................................... 21.4 71.8 1.0 5.952$250,000 to $499,999 146 313....................................... 22.9 74.6 .6 1.953$500,000 to $999,999 80 539....................................... 21.0 75.0 .6 3.354$1,000,000 or more 79 037......................................... 19.3 77.0 1.1 2.655
Nonminority male ~owned businesses 10 114 456................. 51.7 41.7 1.6 5.056
Less than $5,000 2 608 047........................................... 62.0 25.9 2.3 9.857$5,000 to $9,999 1 285 456........................................... 53.2 38.1 2.2 6.458$10,000 to $24,999 1 763 830......................................... 60.9 34.3 2.0 2.859$25,000 to $49,999 1 248 482......................................... 62.9 31.7 1.1 4.360$50,000 to $99,999 1 108 065......................................... 46.6 51.4 .5 1.561
$100,000 to $199,999 840 723....................................... 37.8 59.2 .8 2.362$200,000 to $249,999 212 693....................................... 25.1 73.3 1.2 .363$250,000 to $499,999 488 462....................................... 23.2 73.1 1.0 2.764$500,000 to $999,999 266 408....................................... 18.2 77.5 .9 3.465$1,000,000 or more 292 290......................................... 12.9 83.1 1.1 2.966
1Data represent percentage of firms reporting in the designated categories.2For explanation of relative standard errors and standard errors, see Reliability of Estimates in the introductory text.3Relative standard errors are not applicable for lines 1 through 11 since these data are the result of censuses, not surveys.
200 CHARACTERISTICS OF BUSINESS OWNERS 1992 ECONOMIC CENSUS
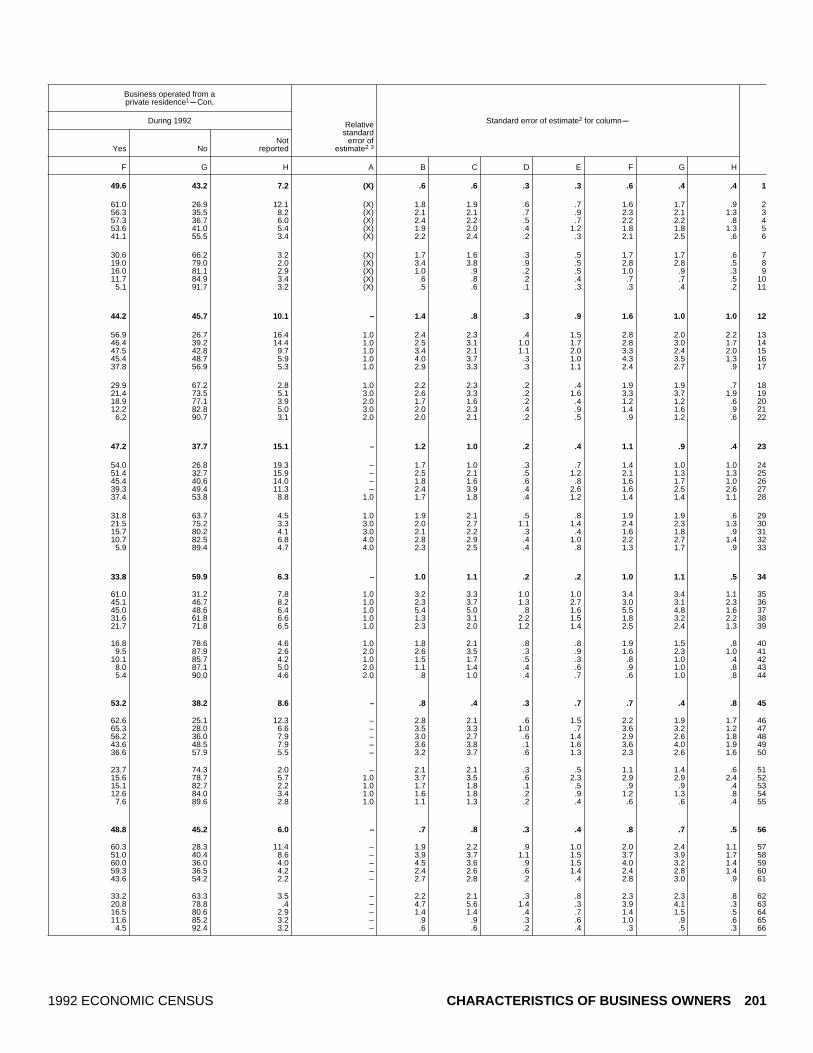
Business operated from aprivate residence1
mCon.
During 1992 Standard error of estimate2 for columnm
Yes NoNot
reported
Relativestandard
error ofestimate2 3
F G H A B C D E F G H
49.6 43.2 7.2 (X) .6 .6 .3 .3 .6 .4 .4 1
61.0 26.9 12.1 (X) 1.8 1.9 .6 .7 1.6 1.7 .9 256.3 35.5 8.2 (X) 2.1 2.1 .7 .9 2.3 2.1 1.3 357.3 36.7 6.0 (X) 2.4 2.2 .5 .7 2.2 2.2 .8 453.6 41.0 5.4 (X) 1.9 2.0 .4 1.2 1.8 1.8 1.3 541.1 55.5 3.4 (X) 2.2 2.4 .2 .3 2.1 2.5 .6 6
30.6 66.2 3.2 (X) 1.7 1.6 .3 .5 1.7 1.7 .6 719.0 79.0 2.0 (X) 3.4 3.8 .9 .5 2.8 2.8 .5 816.0 81.1 2.9 (X) 1.0 .9 .2 .5 1.0 .9 .3 911.7 84.9 3.4 (X) .6 .8 .2 .4 .7 .7 .5 10
5.1 91.7 3.2 (X) .5 .6 .1 .3 .3 .4 .2 11
44.2 45.7 10.1 – 1.4 .8 .3 .9 1.6 1.0 1.0 12
56.9 26.7 16.4 1.0 2.4 2.3 .4 1.5 2.8 2.0 2.2 1346.4 39.2 14.4 1.0 2.5 3.1 1.0 1.7 2.8 3.0 1.7 1447.5 42.8 9.7 1.0 3.4 2.1 1.1 2.0 3.3 2.4 2.0 1545.4 48.7 5.9 1.0 4.0 3.7 .3 1.0 4.3 3.5 1.3 1637.8 56.9 5.3 1.0 2.9 3.3 .3 1.1 2.4 2.7 .9 17
29.9 67.2 2.8 1.0 2.2 2.3 .2 .4 1.9 1.9 .7 1821.4 73.5 5.1 3.0 2.6 3.3 .2 1.6 3.3 3.7 1.9 1918.9 77.1 3.9 2.0 1.7 1.6 .2 .4 1.2 1.2 .6 2012.2 82.8 5.0 3.0 2.0 2.3 .4 .9 1.4 1.6 .9 21
6.2 90.7 3.1 2.0 2.0 2.1 .2 .5 .9 1.2 .6 22
47.2 37.7 15.1 – 1.2 1.0 .2 .4 1.1 .9 .4 23
54.0 26.8 19.3 – 1.7 1.0 .3 .7 1.4 1.0 1.0 2451.4 32.7 15.9 – 2.5 2.1 .5 1.2 2.1 1.3 1.3 2545.4 40.6 14.0 – 1.8 1.6 .6 .8 1.6 1.7 1.0 2639.3 49.4 11.3 – 2.4 3.9 .4 2.6 1.6 2.5 2.6 2737.4 53.8 8.8 1.0 1.7 1.8 .4 1.2 1.4 1.4 1.1 28
31.8 63.7 4.5 1.0 1.9 2.1 .5 .8 1.9 1.9 .6 2921.5 75.2 3.3 3.0 2.0 2.7 1.1 1.4 2.4 2.3 1.3 3015.7 80.2 4.1 3.0 2.1 2.2 .3 .4 1.6 1.8 .9 3110.7 82.5 6.8 4.0 2.8 2.9 .4 1.0 2.2 2.7 1.4 32
5.9 89.4 4.7 4.0 2.3 2.5 .4 .8 1.3 1.7 .9 33
33.8 59.9 6.3 – 1.0 1.1 .2 .2 1.0 1.1 .5 34
61.0 31.2 7.8 1.0 3.2 3.3 1.0 1.0 3.4 3.4 1.1 3545.1 46.7 8.2 1.0 2.3 3.7 1.3 2.7 3.0 3.1 2.3 3645.0 48.6 6.4 1.0 5.4 5.0 .8 1.6 5.5 4.8 1.6 3731.6 61.8 6.6 1.0 1.3 3.1 2.2 1.5 1.8 3.2 2.2 3821.7 71.8 6.5 1.0 2.3 2.0 1.2 1.4 2.5 2.4 1.3 39
16.8 78.6 4.6 1.0 1.8 2.1 .8 .8 1.9 1.5 .8 409.5 87.9 2.6 2.0 2.6 3.5 .3 .9 1.6 2.3 1.0 41
10.1 85.7 4.2 1.0 1.5 1.7 .5 .3 .8 1.0 .4 428.0 87.1 5.0 2.0 1.1 1.4 .4 .6 .9 1.0 .8 435.4 90.0 4.6 2.0 .8 1.0 .4 .7 .6 1.0 .8 44
53.2 38.2 8.6 – .8 .4 .3 .7 .7 .4 .8 45
62.6 25.1 12.3 – 2.8 2.1 .6 1.5 2.2 1.9 1.7 4665.3 28.0 6.6 – 3.5 3.3 1.0 .7 3.6 3.2 1.2 4756.2 36.0 7.9 – 3.0 2.7 .6 1.4 2.9 2.6 1.8 4843.6 48.5 7.9 – 3.6 3.8 .1 1.6 3.6 4.0 1.9 4936.6 57.9 5.5 – 3.2 3.7 .6 1.3 2.3 2.6 1.6 50
23.7 74.3 2.0 – 2.1 2.1 .3 .5 1.1 1.4 .6 5115.6 78.7 5.7 1.0 3.7 3.5 .6 2.3 2.9 2.9 2.4 5215.1 82.7 2.2 1.0 1.7 1.8 .1 .5 .9 .9 .4 5312.6 84.0 3.4 1.0 1.6 1.8 .2 .9 1.2 1.3 .8 54
7.6 89.6 2.8 1.0 1.1 1.3 .2 .4 .6 .6 .4 55
48.8 45.2 6.0 – .7 .8 .3 .4 .8 .7 .5 56
60.3 28.3 11.4 – 1.9 2.2 .9 1.0 2.0 2.4 1.1 5751.0 40.4 8.6 – 3.9 3.7 1.1 1.5 3.7 3.9 1.7 5860.0 36.0 4.0 – 4.5 3.6 .9 1.5 4.0 3.2 1.4 5959.3 36.5 4.2 – 2.4 2.6 .6 1.4 2.4 2.8 1.4 6043.6 54.2 2.2 – 2.7 2.8 .2 .4 2.8 3.0 .9 61
33.2 63.3 3.5 – 2.2 2.1 .3 .8 2.3 2.3 .8 6220.8 78.8 .4 – 4.7 5.6 1.4 .3 3.9 4.1 .3 6316.5 80.6 2.9 – 1.4 1.4 .4 .7 1.4 1.5 .5 6411.6 85.2 3.2 – .9 .9 .3 .6 1.0 .9 .6 65
4.5 92.4 3.2 – .6 .6 .2 .4 .3 .5 .3 66
1992 ECONOMIC CENSUS CHARACTERISTICS OF BUSINESS OWNERS 201
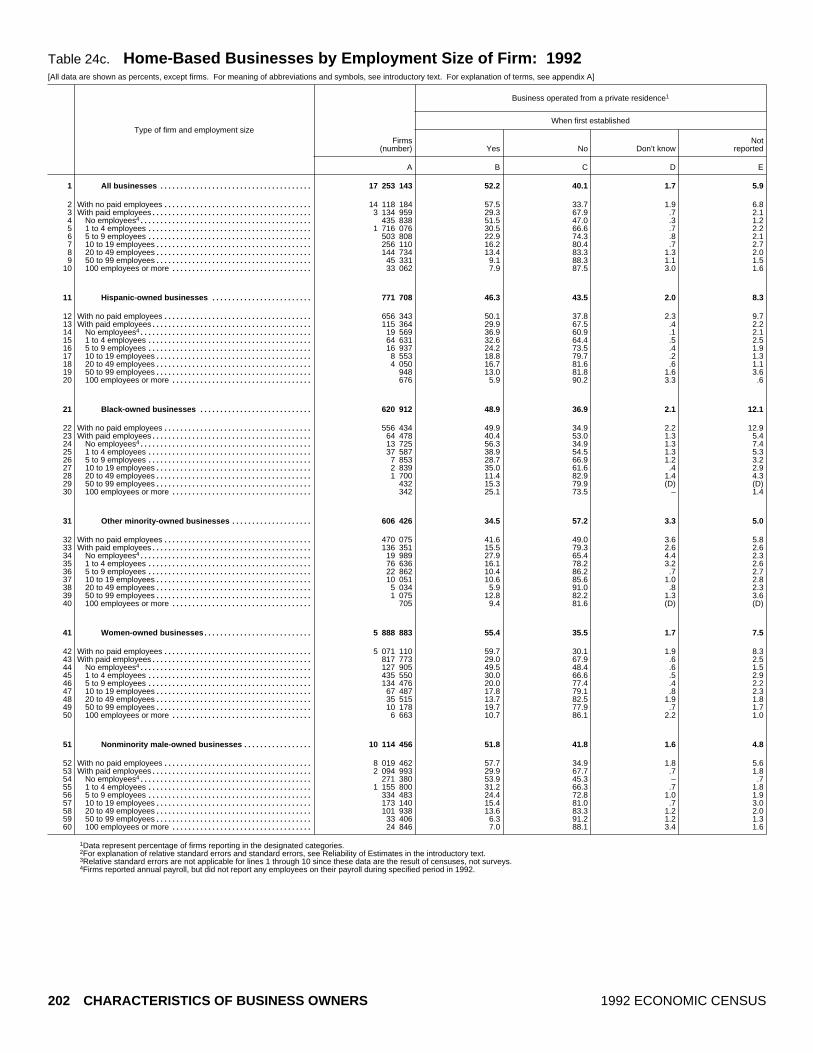
Table 24c. Home ~Based Businesses by Employment Size of Firm: 1992[All data are shown as percents, except firms. For meaning of abbreviations and symbols, see introductory text. For explanation of terms, see appendix A]
Type of firm and employment size
Business operated from a private residence1
When first established
Firms(number) Yes No Don’t know
Notreported
A B C D E
All businesses 17 253 143...................................... 52.2 40.1 1.7 5.91
With no paid employees 14 118 184..................................... 57.5 33.7 1.9 6.82With paid employees 3 134 959........................................ 29.3 67.9 .7 2.13
No employees4 435 838........................................... 51.5 47.0 .3 1.241 to 4 employees 1 716 076......................................... 30.5 66.6 .7 2.255 to 9 employees 503 808......................................... 22.9 74.3 .8 2.1610 to 19 employees 256 110....................................... 16.2 80.4 .7 2.7720 to 49 employees 144 734....................................... 13.4 83.3 1.3 2.0850 to 99 employees 45 331....................................... 9.1 88.3 1.1 1.59100 employees or more 33 062................................... 7.9 87.5 3.0 1.610
Hispanic ~owned businesses 771 708......................... 46.3 43.5 2.0 8.311
With no paid employees 656 343..................................... 50.1 37.8 2.3 9.712With paid employees 115 364........................................ 29.9 67.5 .4 2.213
No employees4 19 569........................................... 36.9 60.9 .1 2.1141 to 4 employees 64 631......................................... 32.6 64.4 .5 2.5155 to 9 employees 16 937......................................... 24.2 73.5 .4 1.91610 to 19 employees 8 553....................................... 18.8 79.7 .2 1.31720 to 49 employees 4 050....................................... 16.7 81.6 .6 1.11850 to 99 employees 948....................................... 13.0 81.8 1.6 3.619100 employees or more 676................................... 5.9 90.2 3.3 .620
Black ~owned businesses 620 912............................ 48.9 36.9 2.1 12.121
With no paid employees 556 434..................................... 49.9 34.9 2.2 12.922With paid employees 64 478........................................ 40.4 53.0 1.3 5.423
No employees4 13 725........................................... 56.3 34.9 1.3 7.4241 to 4 employees 37 587......................................... 38.9 54.5 1.3 5.3255 to 9 employees 7 853......................................... 28.7 66.9 1.2 3.22610 to 19 employees 2 839....................................... 35.0 61.6 .4 2.92720 to 49 employees 1 700....................................... 11.4 82.9 1.4 4.32850 to 99 employees 432....................................... 15.3 79.9 (D) (D)29100 employees or more 342................................... 25.1 73.5 – 1.430
Other minority ~owned businesses 606 426.................... 34.5 57.2 3.3 5.031
With no paid employees 470 075..................................... 41.6 49.0 3.6 5.832With paid employees 136 351........................................ 15.5 79.3 2.6 2.633
No employees4 19 989........................................... 27.9 65.4 4.4 2.3341 to 4 employees 76 636......................................... 16.1 78.2 3.2 2.6355 to 9 employees 22 862......................................... 10.4 86.2 .7 2.73610 to 19 employees 10 051....................................... 10.6 85.6 1.0 2.83720 to 49 employees 5 034....................................... 5.9 91.0 .8 2.33850 to 99 employees 1 075....................................... 12.8 82.2 1.3 3.639100 employees or more 705................................... 9.4 81.6 (D) (D)40
Women ~owned businesses 5 888 883........................... 55.4 35.5 1.7 7.541
With no paid employees 5 071 110..................................... 59.7 30.1 1.9 8.342With paid employees 817 773........................................ 29.0 67.9 .6 2.543
No employees4 127 905........................................... 49.5 48.4 .6 1.5441 to 4 employees 435 550......................................... 30.0 66.6 .5 2.9455 to 9 employees 134 476......................................... 20.0 77.4 .4 2.24610 to 19 employees 67 487....................................... 17.8 79.1 .8 2.34720 to 49 employees 35 515....................................... 13.7 82.5 1.9 1.84850 to 99 employees 10 178....................................... 19.7 77.9 .7 1.749100 employees or more 6 663................................... 10.7 86.1 2.2 1.050
Nonminority male ~owned businesses 10 114 456................. 51.8 41.8 1.6 4.851
With no paid employees 8 019 462..................................... 57.7 34.9 1.8 5.652With paid employees 2 094 993........................................ 29.9 67.7 .7 1.853
No employees4 271 380........................................... 53.9 45.3 – .7541 to 4 employees 1 155 800......................................... 31.2 66.3 .7 1.8555 to 9 employees 334 483......................................... 24.4 72.8 1.0 1.95610 to 19 employees 173 140....................................... 15.4 81.0 .7 3.05720 to 49 employees 101 938....................................... 13.6 83.3 1.2 2.05850 to 99 employees 33 406....................................... 6.3 91.2 1.2 1.359100 employees or more 24 846................................... 7.0 88.1 3.4 1.660
1Data represent percentage of firms reporting in the designated categories.2For explanation of relative standard errors and standard errors, see Reliability of Estimates in the introductory text.3Relative standard errors are not applicable for lines 1 through 10 since these data are the result of censuses, not surveys.4Firms reported annual payroll, but did not report any employees on their payroll during specified period in 1992.
202 CHARACTERISTICS OF BUSINESS OWNERS 1992 ECONOMIC CENSUS

Business operated from aprivate residence1
mCon.
During 1992 Standard error of estimate2 for columnm
Yes NoNot
reported
Relativestandard
error ofestimate2 3
F G H A B C D E F G H
49.6 43.2 7.2 (X) .5 .6 .3 .3 .6 .4 .4 1
55.6 36.1 8.3 (X) .4 .5 .3 .3 .7 .5 .4 223.9 73.5 2.6 (X) 1.1 1.2 .1 .3 1.3 1.3 .3 347.6 50.9 1.6 (X) 3.5 3.3 .1 .3 3.9 3.7 .3 426.6 70.8 2.6 (X) 1.2 1.4 .1 .5 1.4 1.6 .6 513.2 83.7 3.1 (X) 2.3 2.4 .3 .3 2.1 2.0 .4 6
7.9 88.7 3.4 (X) 1.6 1.5 .2 .5 1.8 1.8 .4 75.9 91.6 2.4 (X) 1.6 1.6 .4 .5 1.8 1.9 .6 81.4 96.0 2.6 (X) 2.1 2.2 .3 .6 .5 .7 .7 9.3 97.4 2.3 (X) 1.4 1.4 1.0 1.1 .3 1.1 1.1 10
44.2 45.7 10.1 – 1.4 .8 .3 .9 1.6 1.0 1.0 11
48.9 39.4 11.8 – 1.7 .9 .4 1.1 1.9 1.1 1.3 1224.4 72.3 3.2 1.0 1.1 1.3 .1 .4 1.0 1.1 .5 1333.5 63.7 2.8 2.0 4.1 3.9 .1 1.1 3.9 3.6 1.0 1428.5 68.4 3.1 1.0 1.9 2.0 .1 .6 1.6 1.9 .7 1515.4 79.8 4.8 2.0 2.0 2.2 .2 .5 1.6 1.8 .6 16
8.5 88.7 2.8 3.0 2.5 2.9 .1 .7 1.3 1.7 .8 177.8 90.8 1.4 4.0 2.0 1.7 .2 .5 1.2 1.0 .5 186.3 89.3 4.5 6.0 2.7 4.1 1.6 1.4 2.1 2.9 1.7 191.1 93.9 4.9 8.0 1.7 2.2 1.6 .4 .6 2.3 2.1 20
47.2 37.7 15.1 – 1.2 1.0 .2 .4 1.1 .9 .4 21
48.8 35.3 15.9 – 1.3 1.0 .2 .4 1.2 1.0 .5 2233.7 58.5 7.8 1.0 1.4 1.9 .3 1.3 1.9 2.4 1.6 2350.6 37.5 11.9 2.0 4.2 4.8 1.0 3.1 3.6 4.7 3.5 2431.7 61.4 6.9 1.0 1.8 2.3 .5 1.1 2.2 2.4 1.2 2524.6 68.2 7.2 3.0 2.8 2.1 .6 1.5 2.9 3.5 2.3 2626.0 70.5 3.5 4.0 5.1 4.9 .2 .8 4.7 4.7 .8 27
6.5 88.3 5.2 6.0 3.7 3.3 .5 1.4 3.9 3.6 1.4 2810.4 84.3 5.3 8.0 5.2 4.8 (D) (D) 5.0 5.1 3.2 29
(D) 95.8 (D) – 3.7 3.4 – .9 (D) 2.4 (D) 30
33.8 59.9 6.3 – 1.1 1.1 .2 .4 1.0 1.1 .5 31
42.1 50.9 7.1 – 1.0 1.1 .3 .6 1.1 1.2 .7 3211.8 83.9 4.3 1.0 1.1 1.0 .6 .4 .9 .8 .7 3322.6 70.3 7.1 2.0 5.8 5.6 1.6 .8 4.5 5.9 4.6 3413.7 82.7 3.6 1.0 1.4 1.6 .8 .6 1.2 1.1 .6 35
4.4 91.5 4.1 2.0 1.5 1.5 .2 .7 1.2 1.3 .9 364.9 90.5 4.6 2.0 2.0 2.3 .3 1.4 1.7 2.4 1.6 372.3 94.1 3.6 4.0 1.0 1.4 .5 .9 .6 1.2 .9 384.5 89.4 6.1 6.0 3.4 4.6 .6 1.8 3.1 4.1 2.6 39.5 90.4 9.1 6.0 4.6 6.5 (D) (D) .4 2.5 2.6 40
53.2 38.2 8.6 – .8 .4 .3 .7 .7 .4 .8 41
58.4 32.1 9.5 – .8 .5 .3 .8 .7 .7 .9 4221.9 74.7 3.3 – 1.5 1.8 .1 .6 1.5 1.6 .6 4346.4 51.5 2.1 1.0 2.6 2.2 .3 .7 3.7 3.1 .9 4424.2 71.9 3.9 – 1.9 2.4 .1 1.0 1.4 1.9 1.1 45
8.6 88.5 2.9 1.0 1.4 1.7 .1 .8 1.0 1.1 .7 466.9 90.1 3.0 1.0 1.7 2.1 .3 .7 1.4 1.3 .8 473.6 93.2 3.3 1.0 2.6 2.7 1.7 .6 2.1 2.0 1.0 484.4 93.8 1.8 2.0 3.7 3.7 .4 .7 1.5 1.9 .7 49.1 98.5 1.5 2.0 2.5 3.1 .9 .6 .1 .6 .6 50
48.8 45.2 6.0 – .6 .8 .3 .4 .8 .7 .5 51
55.2 37.7 7.1 – .6 .6 .5 .5 1.1 .8 .7 5224.9 73.0 2.1 – 1.5 1.6 .2 .4 1.6 1.6 .3 5349.9 49.6 .5 – 4.8 4.7 – .4 5.0 5.0 .2 5428.0 70.1 1.9 – 1.6 1.9 .2 .6 1.8 2.0 .6 5515.1 81.9 3.0 – 3.2 3.3 .5 .5 2.8 2.7 .6 56
8.1 88.4 3.5 1.0 2.3 2.1 .3 .7 2.4 2.5 .7 576.8 91.1 2.0 1.0 2.5 2.4 .3 .8 2.6 2.8 .7 58.4 97.0 2.6 1.0 2.1 1.9 .5 1.0 .3 1.0 1.0 59.4 97.5 2.1 1.0 1.8 2.0 1.2 1.7 .3 1.8 1.7 60
1992 ECONOMIC CENSUS CHARACTERISTICS OF BUSINESS OWNERS 203

Table 24d. Home ~Based Businesses by Legal Form of Organization of Firm: 1992[All data are shown as percents, except firms. For meaning of abbreviations and symbols, see introductory text. For explanation of terms, see appendix A]
Type of firm and legal form of organization
Business operated from a private residence1
When first established
Firms(number) Yes No Don’t know
Notreported
A B C D E
All businesses 17 253 143...................................... 52.2 40.1 1.7 5.91
Individual proprietorships 14 599 295.................................... 56.1 35.5 1.8 6.62Partnerships 1 089 578............................................... 29.5 67.0 1.4 2.23Subchapter S corporations 1 564 270.................................. 30.2 66.9 .6 2.44
Hispanic ~owned businesses 771 708......................... 46.3 43.5 2.0 8.35
Individual proprietorships 689 015.................................... 49.0 39.8 2.2 9.06Partnerships 32 650............................................... 21.9 71.6 .6 5.97Subchapter S corporations 50 042.................................. 32.9 64.2 .6 2.38
Black ~owned businesses 620 912............................ 48.9 36.9 2.1 12.19
Individual proprietorships 584 256.................................... 49.5 35.8 2.2 12.510Partnerships 14 727............................................... 35.0 60.3 1.1 3.611Subchapter S corporations 21 928.................................. 36.1 60.6 .3 3.112
Other minority ~owned businesses 606 426.................... 34.5 57.2 3.3 5.013
Individual proprietorships 502 022.................................... 37.8 53.0 4.0 5.314Partnerships 49 489............................................... 21.8 72.9 .3 5.015Subchapter S corporations 54 915.................................. 24.9 70.4 1.8 2.916
Women ~owned businesses 5 888 883........................... 55.4 35.5 1.7 7.517
Individual proprietorships 5 078 077.................................... 58.5 31.5 1.9 8.118Partnerships 243 651............................................... 36.6 61.1 .5 1.819Subchapter S corporations 567 155.................................. 33.1 62.4 .7 3.720
Nonminority male ~owned businesses 10 114 456................. 51.8 41.8 1.6 4.821
Individual proprietorships 8 414 238.................................... 56.2 36.8 1.7 5.422Partnerships 777 379............................................... 28.2 68.1 1.7 2.023Subchapter S corporations 922 838.................................. 28.4 69.6 .5 1.524
1Data represent percentage of firms reporting in the designated categories.2For explanation of relative standard errors and standard errors, see Reliability of Estimates in the introductory text.3Relative standard errors are not applicable for lines 1 through 4 since these data are the result of censuses, not surveys.
204 CHARACTERISTICS OF BUSINESS OWNERS 1992 ECONOMIC CENSUS

Business operated from aprivate residence1
mCon.
During 1992 Standard error of estimate2 for columnm
Yes NoNot
reported
Relativestandard
error ofestimate2 3
F G H A B C D E F G H
49.6 43.2 7.2 (X) .5 .6 .3 .3 .6 .4 .4 1
53.6 38.5 7.9 (X) .5 .6 .3 .3 .6 .4 .5 229.5 66.9 3.7 (X) 3.0 2.5 1.1 .6 2.6 2.5 .8 324.2 72.6 3.2 (X) 1.9 2.1 .1 .6 2.0 2.2 .7 4
44.2 45.7 10.1 – 1.4 .8 .3 .9 1.6 1.0 1.0 5
47.3 41.8 10.9 – 1.6 .9 .3 1.0 1.8 1.0 1.1 619.7 73.1 7.2 2.0 3.7 3.7 .6 1.7 3.2 3.8 1.8 727.5 68.7 3.8 1.0 2.7 2.8 .2 .5 2.9 2.6 .8 8
47.2 37.7 15.1 – 1.2 1.0 .2 .4 1.1 .9 .4 9
47.9 36.6 15.5 – 1.2 1.0 .2 .4 1.1 .8 .4 1033.1 62.1 4.8 3.0 3.6 3.4 .4 1.2 3.5 3.6 1.3 1130.2 63.3 6.5 2.0 1.9 1.8 .1 1.1 2.1 1.8 1.2 12
33.8 59.9 6.3 – 1.1 1.1 .2 .4 1.0 1.1 .5 13
37.6 55.5 6.9 – 1.0 1.2 .2 .6 1.1 1.3 .7 1422.2 72.7 5.1 1.0 2.0 2.1 .2 1.2 2.4 2.6 1.2 1520.5 75.8 3.7 1.0 2.3 2.0 .5 .6 2.4 2.1 .7 16
53.2 38.2 8.6 – .8 .4 .3 .7 .7 .4 .8 17
56.8 34.0 9.2 – 1.0 .6 .3 .8 .8 .5 .9 1835.7 59.8 4.5 1.0 5.4 5.5 .2 .7 4.6 5.0 1.0 1926.6 68.7 4.7 – 1.9 2.0 .1 .9 1.8 2.0 1.1 20
48.8 45.2 6.0 – .6 .8 .3 .4 .8 .7 .5 21
53.1 40.3 6.7 – .6 .9 .4 .5 .8 .7 .7 2228.5 68.2 3.3 – 3.8 3.5 1.5 .8 3.3 3.4 1.0 2322.7 75.2 2.1 – 2.7 2.8 .1 .6 2.8 2.9 .6 24
1992 ECONOMIC CENSUS CHARACTERISTICS OF BUSINESS OWNERS 205
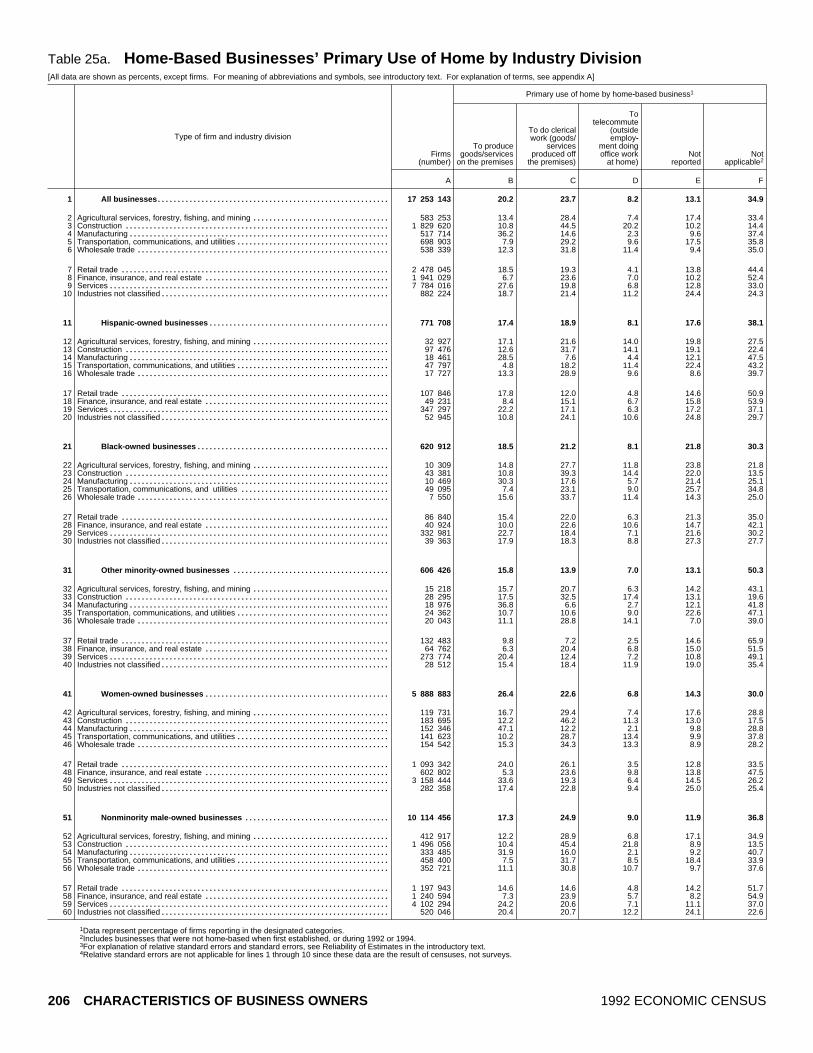
Table 25a. Home ~Based Businesses’ Primary Use of Home by Industry Division[All data are shown as percents, except firms. For meaning of abbreviations and symbols, see introductory text. For explanation of terms, see appendix A]
Type of firm and industry division
Primary use of home by home~based business1
Firms(number)
To producegoods/services
on the premises
To do clericalwork (goods/
servicesproduced off
the premises)
Totelecommute
(outsideemploy~
ment doing office work
at home)Not
reportedNot
applicable2
A B C D E F
All businesses 17 253 143.......................................................... 20.2 23.7 8.2 13.1 34.91
Agricultural services, forestry, fishing, and mining 583 253.................................. 13.4 28.4 7.4 17.4 33.42Construction 1 829 620.................................................................. 10.8 44.5 20.2 10.2 14.43Manufacturing 517 714................................................................. 36.2 14.6 2.3 9.6 37.44Transportation, communications, and utilities 698 903...................................... 7.9 29.2 9.6 17.5 35.85Wholesale trade 538 339............................................................... 12.3 31.8 11.4 9.4 35.06
Retail trade 2 478 045................................................................... 18.5 19.3 4.1 13.8 44.47Finance, insurance, and real estate 1 941 029.............................................. 6.7 23.6 7.0 10.2 52.48Services 7 784 016...................................................................... 27.6 19.8 6.8 12.8 33.09Industries not classified 882 224......................................................... 18.7 21.4 11.2 24.4 24.310
Hispanic ~owned businesses 771 708............................................. 17.4 18.9 8.1 17.6 38.111
Agricultural services, forestry, fishing, and mining 32 927.................................. 17.1 21.6 14.0 19.8 27.512Construction 97 476.................................................................. 12.6 31.7 14.1 19.1 22.413Manufacturing 18 461................................................................. 28.5 7.6 4.4 12.1 47.514Transportation, communications, and utilities 47 797...................................... 4.8 18.2 11.4 22.4 43.215Wholesale trade 17 727............................................................... 13.3 28.9 9.6 8.6 39.716
Retail trade 107 846................................................................... 17.8 12.0 4.8 14.6 50.917Finance, insurance, and real estate 49 231.............................................. 8.4 15.1 6.7 15.8 53.918Services 347 297...................................................................... 22.2 17.1 6.3 17.2 37.119Industries not classified 52 945......................................................... 10.8 24.1 10.6 24.8 29.720
Black ~owned businesses 620 912................................................ 18.5 21.2 8.1 21.8 30.321
Agricultural services, forestry, fishing, and mining 10 309.................................. 14.8 27.7 11.8 23.8 21.822Construction 43 381.................................................................. 10.8 39.3 14.4 22.0 13.523Manufacturing 10 469................................................................. 30.3 17.6 5.7 21.4 25.124Transportation, communications, and utilities 49 095..................................... 7.4 23.1 9.0 25.7 34.825Wholesale trade 7 550............................................................... 15.6 33.7 11.4 14.3 25.026
Retail trade 86 840................................................................... 15.4 22.0 6.3 21.3 35.027Finance, insurance, and real estate 40 924.............................................. 10.0 22.6 10.6 14.7 42.128Services 332 981...................................................................... 22.7 18.4 7.1 21.6 30.229Industries not classified 39 363......................................................... 17.9 18.3 8.8 27.3 27.730
Other minority ~owned businesses 606 426....................................... 15.8 13.9 7.0 13.1 50.331
Agricultural services, forestry, fishing, and mining 15 218.................................. 15.7 20.7 6.3 14.2 43.132Construction 28 295.................................................................. 17.5 32.5 17.4 13.1 19.633Manufacturing 18 976................................................................. 36.8 6.6 2.7 12.1 41.834Transportation, communications, and utilities 24 362...................................... 10.7 10.6 9.0 22.6 47.135Wholesale trade 20 043............................................................... 11.1 28.8 14.1 7.0 39.036
Retail trade 132 483................................................................... 9.8 7.2 2.5 14.6 65.937Finance, insurance, and real estate 64 762.............................................. 6.3 20.4 6.8 15.0 51.538Services 273 774...................................................................... 20.4 12.4 7.2 10.8 49.139Industries not classified 28 512......................................................... 15.4 18.4 11.9 19.0 35.440
Women ~owned businesses 5 888 883.............................................. 26.4 22.6 6.8 14.3 30.041
Agricultural services, forestry, fishing, and mining 119 731.................................. 16.7 29.4 7.4 17.6 28.842Construction 183 695.................................................................. 12.2 46.2 11.3 13.0 17.543Manufacturing 152 346................................................................. 47.1 12.2 2.1 9.8 28.844Transportation, communications, and utilities 141 623...................................... 10.2 28.7 13.4 9.9 37.845Wholesale trade 154 542............................................................... 15.3 34.3 13.3 8.9 28.246
Retail trade 1 093 342................................................................... 24.0 26.1 3.5 12.8 33.547Finance, insurance, and real estate 602 802.............................................. 5.3 23.6 9.8 13.8 47.548Services 3 158 444...................................................................... 33.6 19.3 6.4 14.5 26.249Industries not classified 282 358......................................................... 17.4 22.8 9.4 25.0 25.450
Nonminority male ~owned businesses 10 114 456.................................... 17.3 24.9 9.0 11.9 36.851
Agricultural services, forestry, fishing, and mining 412 917.................................. 12.2 28.9 6.8 17.1 34.952Construction 1 496 056.................................................................. 10.4 45.4 21.8 8.9 13.553Manufacturing 333 485................................................................. 31.9 16.0 2.1 9.2 40.754Transportation, communications, and utilities 458 400...................................... 7.5 31.7 8.5 18.4 33.955Wholesale trade 352 721............................................................... 11.1 30.8 10.7 9.7 37.656
Retail trade 1 197 943................................................................... 14.6 14.6 4.8 14.2 51.757Finance, insurance, and real estate 1 240 594.............................................. 7.3 23.9 5.7 8.2 54.958Services 4 102 294...................................................................... 24.2 20.6 7.1 11.1 37.059Industries not classified 520 046......................................................... 20.4 20.7 12.2 24.1 22.660
1Data represent percentage of firms reporting in the designated categories.2Includes businesses that were not home~based when first established, or during 1992 or 1994.3For explanation of relative standard errors and standard errors, see Reliability of Estimates in the introductory text.4Relative standard errors are not applicable for lines 1 through 10 since these data are the result of censuses, not surveys.
206 CHARACTERISTICS OF BUSINESS OWNERS 1992 ECONOMIC CENSUS

Standard error of estimate3 for columnmRelative
standarderror of
estimate3 4
A B C D E F
(X) .6 .7 .4 .5 .4 1
(X) 1.5 2.5 1.1 2.3 3.8 2(X) 1.2 2.5 2.5 1.5 1.5 3(X) 1.6 2.1 .6 1.3 1.7 4(X) 1.2 2.2 1.1 1.6 3.2 5(X) 1.7 2.1 1.2 1.8 1.3 6
(X) 1.1 1.7 .8 1.0 1.8 7(X) 1.7 1.2 1.2 1.6 1.9 8(X) 1.2 1.1 .8 .8 .7 9(X) 2.2 2.0 1.2 2.0 2.5 10
– 1.2 1.0 .2 1.3 .8 11
1.0 3.4 2.2 2.7 2.2 3.6 121.0 2.5 2.1 2.4 2.7 2.1 131.0 2.4 1.4 1.2 2.2 2.2 141.0 1.0 2.9 1.6 2.5 2.3 152.0 1.8 1.8 1.5 1.9 2.2 16
1.0 2.9 1.5 1.4 1.7 3.0 171.0 1.3 2.0 1.1 2.3 2.8 18
– 2.1 1.7 .7 1.9 1.8 191.0 1.3 2.4 2.3 2.1 3.7 20
– .8 .7 .4 .8 .9 21
1.0 1.5 2.5 1.6 2.0 1.5 22– 1.2 2.8 .9 1.6 1.2 23
1.0 1.9 1.7 1.3 1.9 2.1 24– 1.3 1.6 1.2 1.8 1.8 25
2.0 1.5 2.0 1.0 1.9 2.0 26
– 1.1 1.7 .8 1.8 1.6 271.0 1.5 1.8 1.0 1.8 2.8 28
– 1.3 1.2 .6 1.2 1.4 29– 2.0 1.7 .6 2.1 1.3 30
– 1.1 .7 .7 .5 .9 31
1.0 3.3 2.9 1.6 3.2 3.8 321.0 3.8 3.6 2.4 2.8 2.6 331.0 2.2 1.8 1.3 2.3 3.4 341.0 2.3 2.0 2.6 3.7 2.5 351.0 2.8 3.0 2.1 1.7 2.7 36
1.0 1.5 1.0 1.3 1.9 1.5 371.0 1.6 2.3 2.0 2.6 2.1 38
– 2.4 1.1 1.6 .8 1.9 391.0 1.9 2.2 2.5 4.8 3.7 40
– .8 .8 .5 .8 .5 41
– 1.9 1.8 1.3 3.6 3.8 42– 2.2 2.4 1.6 2.0 1.9 43– 2.3 2.3 .8 1.6 1.3 44– 1.5 2.4 3.5 1.5 3.2 45– 1.7 3.0 1.9 1.5 2.7 46
– 2.1 1.7 .9 1.7 1.5 47– 1.4 3.0 1.7 1.9 3.7 48– 1.3 1.3 .6 1.1 .9 49– 2.0 2.1 1.9 2.0 2.5 50
– .9 .9 .8 .8 .7 51
– 2.2 3.4 1.7 3.3 4.9 52– 1.5 3.1 3.1 1.7 1.9 53– 2.2 2.5 .9 1.7 2.4 54– 1.7 2.8 1.7 2.2 4.1 55– 2.5 2.5 1.9 2.5 1.5 56
– 2.5 2.5 1.5 1.3 3.4 57– 2.3 2.2 1.6 2.3 2.4 58– 2.1 1.7 1.4 1.4 .9 59– 3.1 3.1 2.5 3.7 3.8 60
1992 ECONOMIC CENSUS CHARACTERISTICS OF BUSINESS OWNERS 207
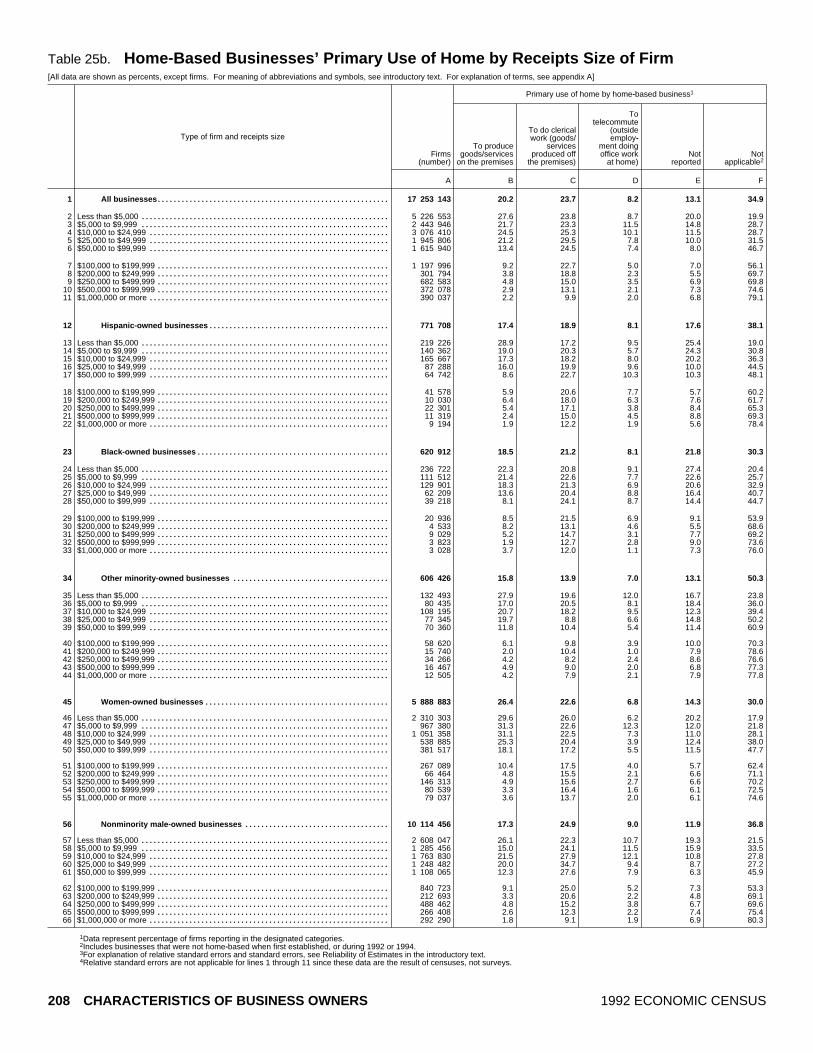
Table 25b. Home ~Based Businesses’ Primary Use of Home by Receipts Size of Firm[All data are shown as percents, except firms. For meaning of abbreviations and symbols, see introductory text. For explanation of terms, see appendix A]
Type of firm and receipts size
Primary use of home by home~based business1
Firms(number)
To producegoods/services
on the premises
To do clericalwork (goods/
servicesproduced off
the premises)
Totelecommute
(outsideemploy~
ment doing office work
at home)Not
reportedNot
applicable2
A B C D E F
All businesses 17 253 143.......................................................... 20.2 23.7 8.2 13.1 34.91
Less than $5,000 5 226 553.............................................................. 27.6 23.8 8.7 20.0 19.92$5,000 to $9,999 2 443 946.............................................................. 21.7 23.3 11.5 14.8 28.73$10,000 to $24,999 3 076 410............................................................ 24.5 25.3 10.1 11.5 28.74$25,000 to $49,999 1 945 806............................................................ 21.2 29.5 7.8 10.0 31.55$50,000 to $99,999 1 615 940............................................................ 13.4 24.5 7.4 8.0 46.76
$100,000 to $199,999 1 197 996.......................................................... 9.2 22.7 5.0 7.0 56.17$200,000 to $249,999 301 794.......................................................... 3.8 18.8 2.3 5.5 69.78$250,000 to $499,999 682 583.......................................................... 4.8 15.0 3.5 6.9 69.89$500,000 to $999,999 372 078.......................................................... 2.9 13.1 2.1 7.3 74.610$1,000,000 or more 390 037............................................................ 2.2 9.9 2.0 6.8 79.111
Hispanic ~owned businesses 771 708............................................. 17.4 18.9 8.1 17.6 38.112
Less than $5,000 219 226.............................................................. 28.9 17.2 9.5 25.4 19.013$5,000 to $9,999 140 362.............................................................. 19.0 20.3 5.7 24.3 30.814$10,000 to $24,999 165 667............................................................ 17.3 18.2 8.0 20.2 36.315$25,000 to $49,999 87 288............................................................ 16.0 19.9 9.6 10.0 44.516$50,000 to $99,999 64 742............................................................ 8.6 22.7 10.3 10.3 48.117
$100,000 to $199,999 41 578.......................................................... 5.9 20.6 7.7 5.7 60.218$200,000 to $249,999 10 030.......................................................... 6.4 18.0 6.3 7.6 61.719$250,000 to $499,999 22 301.......................................................... 5.4 17.1 3.8 8.4 65.320$500,000 to $999,999 11 319.......................................................... 2.4 15.0 4.5 8.8 69.321$1,000,000 or more 9 194............................................................ 1.9 12.2 1.9 5.6 78.422
Black ~owned businesses 620 912................................................ 18.5 21.2 8.1 21.8 30.323
Less than $5,000 236 722.............................................................. 22.3 20.8 9.1 27.4 20.424$5,000 to $9,999 111 512.............................................................. 21.4 22.6 7.7 22.6 25.725$10,000 to $24,999 129 901............................................................ 18.3 21.3 6.9 20.6 32.926$25,000 to $49,999 62 209............................................................ 13.6 20.4 8.8 16.4 40.727$50,000 to $99,999 39 218............................................................ 8.1 24.1 8.7 14.4 44.728
$100,000 to $199,999 20 936.......................................................... 8.5 21.5 6.9 9.1 53.929$200,000 to $249,999 4 533.......................................................... 8.2 13.1 4.6 5.5 68.630$250,000 to $499,999 9 029.......................................................... 5.2 14.7 3.1 7.7 69.231$500,000 to $999,999 3 823.......................................................... 1.9 12.7 2.8 9.0 73.632$1,000,000 or more 3 028............................................................ 3.7 12.0 1.1 7.3 76.033
Other minority ~owned businesses 606 426....................................... 15.8 13.9 7.0 13.1 50.334
Less than $5,000 132 493.............................................................. 27.9 19.6 12.0 16.7 23.835$5,000 to $9,999 80 435.............................................................. 17.0 20.5 8.1 18.4 36.036$10,000 to $24,999 108 195............................................................ 20.7 18.2 9.5 12.3 39.437$25,000 to $49,999 77 345............................................................ 19.7 8.8 6.6 14.8 50.238$50,000 to $99,999 70 360............................................................ 11.8 10.4 5.4 11.4 60.939
$100,000 to $199,999 58 620.......................................................... 6.1 9.8 3.9 10.0 70.340$200,000 to $249,999 15 740.......................................................... 2.0 10.4 1.0 7.9 78.641$250,000 to $499,999 34 266.......................................................... 4.2 8.2 2.4 8.6 76.642$500,000 to $999,999 16 467.......................................................... 4.9 9.0 2.0 6.8 77.343$1,000,000 or more 12 505............................................................ 4.2 7.9 2.1 7.9 77.844
Women ~owned businesses 5 888 883.............................................. 26.4 22.6 6.8 14.3 30.045
Less than $5,000 2 310 303.............................................................. 29.6 26.0 6.2 20.2 17.946$5,000 to $9,999 967 380.............................................................. 31.3 22.6 12.3 12.0 21.847$10,000 to $24,999 1 051 358............................................................ 31.1 22.5 7.3 11.0 28.148$25,000 to $49,999 538 885............................................................ 25.3 20.4 3.9 12.4 38.049$50,000 to $99,999 381 517............................................................ 18.1 17.2 5.5 11.5 47.750
$100,000 to $199,999 267 089.......................................................... 10.4 17.5 4.0 5.7 62.451$200,000 to $249,999 66 464.......................................................... 4.8 15.5 2.1 6.6 71.152$250,000 to $499,999 146 313.......................................................... 4.9 15.6 2.7 6.6 70.253$500,000 to $999,999 80 539.......................................................... 3.3 16.4 1.6 6.1 72.554$1,000,000 or more 79 037............................................................ 3.6 13.7 2.0 6.1 74.655
Nonminority male ~owned businesses 10 114 456.................................... 17.3 24.9 9.0 11.9 36.856
Less than $5,000 2 608 047.............................................................. 26.1 22.3 10.7 19.3 21.557$5,000 to $9,999 1 285 456.............................................................. 15.0 24.1 11.5 15.9 33.558$10,000 to $24,999 1 763 830............................................................ 21.5 27.9 12.1 10.8 27.859$25,000 to $49,999 1 248 482............................................................ 20.0 34.7 9.4 8.7 27.260$50,000 to $99,999 1 108 065............................................................ 12.3 27.6 7.9 6.3 45.961
$100,000 to $199,999 840 723.......................................................... 9.1 25.0 5.2 7.3 53.362$200,000 to $249,999 212 693.......................................................... 3.3 20.6 2.2 4.8 69.163$250,000 to $499,999 488 462.......................................................... 4.8 15.2 3.8 6.7 69.664$500,000 to $999,999 266 408.......................................................... 2.6 12.3 2.2 7.4 75.465$1,000,000 or more 292 290............................................................ 1.8 9.1 1.9 6.9 80.366
1Data represent percentage of firms reporting in the designated categories.2Includes businesses that were not home~based when first established, or during 1992 or 1994.3For explanation of relative standard errors and standard errors, see Reliability of Estimates in the introductory text.4Relative standard errors are not applicable for lines 1 through 11 since these data are the result of censuses, not surveys.
208 CHARACTERISTICS OF BUSINESS OWNERS 1992 ECONOMIC CENSUS

Standard error of estimate3 for columnmRelative
standarderror of
estimate3 4
A B C D E F
(X) .6 .7 .4 .5 .4 1
(X) .7 1.7 1.2 1.2 1.7 2(X) 2.0 2.0 1.8 1.4 1.9 3(X) 1.3 1.8 1.1 1.2 2.0 4(X) 1.4 1.8 1.2 1.4 1.7 5(X) 1.2 2.2 .9 .8 2.4 6
(X) 1.1 1.3 .9 .5 1.6 7(X) .8 3.5 .5 1.3 3.8 8(X) .7 .9 .6 .7 .7 9(X) .2 .7 .3 .6 .8 10(X) .1 .4 .2 .2 .6 11
– 1.2 1.0 .2 1.3 .8 12
1.0 3.2 2.2 1.8 1.6 1.2 131.0 1.5 2.1 1.4 3.3 2.8 141.0 1.1 2.4 1.0 2.3 1.5 151.0 2.8 2.6 1.8 1.5 3.2 161.0 1.3 2.1 .8 1.3 2.9 17
1.0 1.5 1.9 .7 1.3 2.1 183.0 1.5 3.2 2.0 1.9 3.0 192.0 .7 1.6 .4 1.0 1.5 203.0 .7 1.5 1.4 .8 2.0 212.0 .5 1.8 .5 .8 2.3 22
– .8 .7 .4 .8 .9 23
– 1.2 1.5 .7 1.5 1.0 24– 1.8 2.0 1.0 1.7 1.4 25– 2.1 1.3 .5 1.6 1.5 26– 1.5 1.3 1.7 2.3 3.2 27
1.0 1.1 1.5 1.5 1.2 1.1 28
1.0 1.3 1.3 1.4 1.4 2.7 293.0 2.2 1.8 1.5 1.7 2.6 303.0 .9 1.5 1.0 1.2 2.1 314.0 .4 2.6 .6 1.5 3.7 324.0 .5 1.8 .3 1.3 2.4 33
– 1.1 .7 .7 .5 .9 34
1.0 3.6 2.7 2.8 1.7 2.9 351.0 2.0 2.3 3.0 2.5 3.8 361.0 4.5 2.3 2.3 2.4 4.1 371.0 1.6 1.3 .9 1.6 2.2 381.0 1.8 1.4 1.0 2.2 2.4 39
1.0 1.0 .9 .8 1.6 2.2 402.0 .9 3.2 .6 1.7 3.1 411.0 .7 .8 .6 1.3 1.9 422.0 .7 1.0 .6 .9 1.5 432.0 .7 .7 .5 .9 1.1 44
– .8 .8 .5 .8 .5 45
– 1.5 1.8 .7 1.9 1.6 46– 2.6 2.0 2.5 1.6 2.6 47– 2.1 2.1 1.5 1.3 2.8 48– 3.1 2.9 1.0 2.4 3.1 49– 2.5 2.2 1.5 2.1 3.2 50
– 1.5 1.7 .6 1.0 2.0 511.0 2.5 2.9 .7 2.4 3.5 521.0 1.0 1.6 .6 .8 1.6 531.0 .6 1.5 .3 1.0 2.0 541.0 .4 .9 .3 .4 1.2 55
– .9 .9 .8 .8 .7 56
– 1.8 2.1 2.2 2.3 2.0 57– 3.6 3.6 3.1 1.7 3.8 58– 2.8 2.2 1.9 1.7 3.6 59– 2.4 2.6 1.6 1.3 2.2 60– 1.7 3.1 1.5 1.0 3.0 61
– 1.4 1.6 1.3 .7 2.2 62– 1.1 5.6 .8 1.9 5.6 63– 1.0 1.3 .8 1.0 1.4 64– .4 1.0 .4 .7 1.0 65– .1 .5 .3 .3 .6 66
1992 ECONOMIC CENSUS CHARACTERISTICS OF BUSINESS OWNERS 209

Table 25c. Home ~Based Businesses’ Primary Use of Home by Employment Size of Firm[All data are shown as percents, except firms. For meaning of abbreviations and symbols, see introductory text. For explanation of terms, see appendix A]
Type of firm and employment size
Primary use of home by home~based business1
Firms(number)
To producegoods/services
on the premises
To do clericalwork (goods/
servicesproduced off
the premises)
Totelecommute
(outsideemploy~
ment doing office work
at home)Not
reportedNot
applicable2
A B C D E F
All businesses 17 253 143.......................................................... 20.2 23.7 8.2 13.1 34.91
With no paid employees 14 118 184........................................................ 23.1 25.0 9.0 14.6 28.22With paid employees 3 134 959........................................................... 7.5 17.7 4.6 6.5 63.73
No employees5 435 838.............................................................. 13.2 27.0 10.6 4.6 44.641 to 4 employees 1 716 076............................................................ 8.3 18.3 5.1 6.7 61.555 to 9 employees 503 808............................................................ 5.5 15.2 1.7 7.7 69.9610 to 19 employees 256 110.......................................................... 3.2 12.0 .9 5.6 78.3720 to 49 employees 144 734.......................................................... 1.4 10.0 1.5 6.7 80.4850 to 99 employees 45 331.......................................................... 1.5 5.9 .7 6.5 85.59100 employees or more 33 062...................................................... 3.2 4.5 .3 9.2 82.710
Hispanic ~owned businesses 771 708............................................. 17.4 18.9 8.1 17.6 38.111
With no paid employees 656 343........................................................ 20.0 19.2 8.7 20.2 32.012With paid employees 115 364........................................................... 6.4 17.8 5.5 6.4 63.913
No employees5 19 569.............................................................. 8.0 23.0 5.9 4.3 58.8141 to 4 employees 64 631............................................................ 7.5 18.6 6.8 6.3 60.8155 to 9 employees 16 937............................................................ 3.7 16.2 2.7 8.7 68.61610 to 19 employees 8 553.......................................................... 3.1 11.6 3.2 6.9 75.21720 to 49 employees 4 050.......................................................... 3.0 10.3 3.7 4.2 78.81850 to 99 employees 948.......................................................... 2.4 8.1 2.2 6.4 80.919100 employees or more 676...................................................... 1.5 4.1 1.2 8.0 85.120
Black ~owned businesses 620 912................................................ 18.5 21.2 8.1 21.8 30.321
With no paid employees 556 434........................................................ 19.6 21.0 8.3 23.0 28.222With paid employees 64 478........................................................... 9.8 23.3 6.3 12.2 48.523
No employees5 13 725.............................................................. 11.2 31.3 12.2 18.3 27.0241 to 4 employees 37 587............................................................ 11.0 22.0 4.9 10.9 51.3255 to 9 employees 7 853............................................................ 4.8 18.4 5.1 10.6 61.12610 to 19 employees 2 839.......................................................... 4.9 26.6 1.9 8.6 58.12720 to 49 employees 1 700.......................................................... 1.6 8.4 3.7 6.4 79.92850 to 99 employees 432.......................................................... 1.7 12.4 2.7 5.4 77.829100 employees or more 342...................................................... 3.7 16.9 2.2 7.4 69.830
Other minority ~owned businesses 606 426....................................... 15.8 13.9 7.0 13.1 50.331
With no paid employees 470 075........................................................ 19.4 16.2 8.0 14.9 41.532With paid employees 136 351........................................................... 6.3 7.7 4.2 8.1 73.733
No employees5 19 989.............................................................. 14.5 9.8 10.6 5.1 60.0341 to 4 employees 76 636............................................................ 5.7 8.4 4.5 9.2 72.1355 to 9 employees 22 862............................................................ 5.0 4.9 1.2 6.9 82.03610 to 19 employees 10 051.......................................................... 3.5 7.4 1.0 6.7 81.43720 to 49 employees 5 034.......................................................... 3.0 4.4 .2 7.4 85.03850 to 99 employees 1 075.......................................................... 4.4 9.3 – 10.9 75.539100 employees or more 705...................................................... 1.1 8.3 (D) (D) 78.540
Women ~owned businesses 5 888 883.............................................. 26.4 22.6 6.8 14.3 30.041
With no paid employees 5 071 110........................................................ 29.1 23.7 7.3 15.6 24.342With paid employees 817 773........................................................... 10.0 16.2 3.5 6.4 63.943
No employees5 127 905.............................................................. 13.0 27.3 11.9 2.8 45.0441 to 4 employees 435 550............................................................ 11.5 16.7 2.5 7.1 62.1455 to 9 employees 134 476............................................................ 8.1 10.5 1.2 7.2 72.94610 to 19 employees 67 487.......................................................... 4.3 11.7 1.0 5.7 77.34720 to 49 employees 35 515.......................................................... 3.1 7.7 3.2 6.0 80.04850 to 99 employees 10 178.......................................................... 3.5 11.1 3.1 6.7 75.749100 employees or more 6 663...................................................... 2.5 7.8 .2 8.3 81.150
Nonminority male ~owned businesses 10 114 456.................................... 17.3 24.9 9.0 11.9 36.851
With no paid employees 8 019 462........................................................ 20.1 26.7 10.1 13.4 29.752With paid employees 2 094 993........................................................... 6.7 18.5 5.0 6.4 63.553
No employees5 271 380.............................................................. 13.8 27.2 10.1 4.9 43.9541 to 4 employees 1 155 800............................................................ 7.3 19.3 6.1 6.3 61.1555 to 9 employees 334 483............................................................ 4.5 17.3 1.8 7.9 68.55610 to 19 employees 173 140.......................................................... 2.7 12.0 .8 5.4 79.25720 to 49 employees 101 938.......................................................... .7 11.0 .9 7.0 80.55850 to 99 employees 33 406.......................................................... .9 4.4 .1 6.3 88.359100 employees or more 24 846...................................................... 3.6 3.4 .3 9.3 83.360
1Data represent percentage of firms reporting in the designated categories.2Includes businesses that were not home~based when first established, or during 1992 or 1994.3For explanation of relative standard errors and standard errors, see Reliability of Estimates in the introductory text.4Relative standard errors are not applicable for lines 1 through 10 since these data are the result of censuses, not surveys.5Firms reported annual payroll, but did not report any employees on their payroll during specified period in 1992.
210 CHARACTERISTICS OF BUSINESS OWNERS 1992 ECONOMIC CENSUS

Standard error of estimate3 for columnmRelative
standarderror of
estimate3 4
A B C D E F
(X) .6 .7 .4 .5 .4 1
(X) .7 .7 .5 .7 .4 2(X) .4 1.1 .9 .4 .9 3(X) 2.2 4.2 2.8 1.3 3.0 4(X) .9 1.4 .9 .8 1.0 5(X) 1.1 2.0 .3 .9 2.4 6(X) .7 1.5 .1 .7 1.5 7(X) .2 1.6 .5 1.0 1.8 8(X) .3 1.5 .3 1.0 2.1 9(X) .9 1.2 .2 1.7 1.5 10
– 1.2 1.0 .2 1.3 .8 11
– 1.4 1.3 .3 1.6 1.0 121.0 .9 .9 .7 .8 1.6 132.0 2.1 4.3 1.3 1.2 3.9 141.0 1.3 1.4 1.1 1.2 2.6 152.0 .5 2.1 .8 1.3 2.4 163.0 1.3 2.0 .8 .8 2.3 174.0 1.0 2.3 1.4 1.1 2.0 186.0 1.1 2.5 1.6 2.5 4.0 198.0 1.0 1.4 1.0 2.4 2.8 20
– .8 .7 .4 .8 .9 21
– .9 .8 .5 .9 1.0 221.0 1.2 1.3 1.2 1.9 2.1 232.0 3.8 4.2 3.1 4.1 4.9 241.0 1.3 2.2 1.3 1.9 2.3 253.0 1.2 3.0 1.5 3.5 3.5 264.0 1.7 4.7 .7 1.6 5.0 276.0 .8 4.5 2.3 1.6 5.1 288.0 1.7 5.2 2.7 2.7 5.0 29
– 1.9 4.1 1.1 3.9 4.3 30
– 1.1 .7 .7 .5 .9 31
– 1.4 .9 .9 .8 .9 321.0 .6 .5 .7 1.1 1.3 332.0 4.9 2.6 5.3 1.5 5.8 341.0 1.1 .6 .8 1.4 1.8 352.0 1.3 .7 .5 1.3 2.3 362.0 .9 1.7 .4 1.9 2.6 374.0 1.3 1.0 .1 1.9 2.4 386.0 1.6 3.2 – 3.0 5.0 396.0 .7 4.4 (D) (D) 6.2 40
– .8 .8 .5 .8 .5 41
– .9 1.0 .6 1.0 .6 42– 1.0 1.2 1.0 .6 1.7 43
1.0 4.1 4.9 4.8 .4 2.1 44– 1.6 1.7 .3 1.2 2.3 45
1.0 1.5 1.2 .4 1.0 1.7 461.0 .9 1.7 .3 1.2 1.9 471.0 .7 2.0 1.7 2.1 2.5 482.0 1.0 3.0 1.5 1.5 3.8 492.0 .9 2.5 .2 2.2 4.4 50
– .9 .9 .8 .8 .7 51
– 1.2 1.1 1.0 1.0 .7 52– .7 1.6 1.1 .6 1.1 53– 4.2 6.4 2.9 1.7 4.2 54– 1.0 1.9 1.4 1.0 1.2 55– 1.2 2.8 .4 1.1 3.3 56
1.0 1.0 2.0 .2 .6 2.2 571.0 .2 2.2 .3 1.2 2.6 581.0 .3 1.5 .1 1.5 1.9 591.0 1.3 1.1 .2 2.0 2.0 60
1992 ECONOMIC CENSUS CHARACTERISTICS OF BUSINESS OWNERS 211

Table 25d. Home ~Based Businesses’ Primary Use of Home by Legal Form of Organization of[All data are shown as percents, except firms. For meaning of abbreviations and symbols, see introductory text. For explanation of terms, see appendix A]
Type of firm and legal form of organization
Primary use of home by home~based business1
Firms(number)
To producegoods/services
on the premises
To do clericalwork (goods/
servicesproduced off
the premises)
Totelecommute
(outsideemploy~
ment doing office work
at home)Not
reportedNot
applicable2
A B C D E F
All businesses 17 253 143.......................................................... 20.2 23.7 8.2 13.1 34.91
Individual proprietorships 14 599 295....................................................... 22.6 24.1 8.9 14.0 30.32Partnerships 1 089 578.................................................................. 1.9 24.5 3.4 9.6 60.63Subchapter S corporations 1 564 270...................................................... 8.7 18.3 4.1 6.4 62.54
Hispanic ~owned businesses 771 708............................................. 17.4 18.9 8.1 17.6 38.15
Individual proprietorships 689 015....................................................... 19.0 19.0 8.5 19.1 34.46Partnerships 32 650.................................................................. 4.5 13.0 5.1 13.1 64.37Subchapter S corporations 50 042...................................................... 8.5 21.1 5.5 5.1 59.88
Black ~owned businesses 620 912................................................ 18.5 21.2 8.1 21.8 30.39
Individual proprietorships 584 256....................................................... 19.1 21.2 8.2 22.3 29.210Partnerships 14 727.................................................................. 7.5 20.0 3.1 11.9 57.511Subchapter S corporations 21 928...................................................... 5.8 24.1 5.1 10.4 54.612
Other minority ~owned businesses 606 426....................................... 15.8 13.9 7.0 13.1 50.313
Individual proprietorships 502 022....................................................... 18.8 13.7 7.5 14.4 45.714Partnerships 49 489.................................................................. 3.6 15.0 3.8 11.7 65.915Subchapter S corporations 54 915...................................................... 7.6 14.1 6.4 6.5 65.516
Women ~owned businesses 5 888 883.............................................. 26.4 22.6 6.8 14.3 30.017
Individual proprietorships 5 078 077....................................................... 29.2 22.4 7.4 15.0 26.018Partnerships 243 651.................................................................. 5.5 25.9 2.0 11.7 55.019Subchapter S corporations 567 155...................................................... 8.6 23.0 3.0 8.2 57.220
Nonminority male ~owned businesses 10 114 456.................................... 17.3 24.9 9.0 11.9 36.821
Individual proprietorships 8 414 238....................................................... 19.5 25.9 9.9 12.8 31.822Partnerships 777 379.................................................................. .7 25.1 3.6 8.9 61.723Subchapter S corporations 922 838...................................................... 9.0 15.2 4.7 5.2 65.924
1Data represent percentage of firms reporting in the designated categories.2Includes businesses that were not home~based when first established, or during 1992 or 1994.3For explanation of relative standard errors and standard errors, see Reliability of Estimates in the introductory text.4Relative standard errors are not applicable for lines 1 through 4 since these data are the result of censuses, not surveys.
212 CHARACTERISTICS OF BUSINESS OWNERS 1992 ECONOMIC CENSUS

Firm
Standard error of estimate3 for columnmRelative
standarderror of
estimate3 4
A B C D E F
(X) .6 .7 .4 .5 .4 1
(X) .6 .7 .5 .7 .4 2(X) .4 2.1 .9 1.9 2.2 3(X) 1.1 1.6 .9 .8 2.0 4
– 1.2 1.0 .2 1.3 .8 5
– 1.4 1.1 .3 1.4 .9 62.0 1.9 1.3 1.4 2.7 4.2 71.0 1.7 2.4 1.3 .8 2.7 8
– .8 .7 .4 .8 .9 9
– .8 .7 .4 .8 .9 103.0 2.4 2.0 .9 2.8 3.8 112.0 1.4 1.8 1.3 1.5 1.4 12
– 1.1 .7 .7 .5 .9 13
– 1.5 .8 .9 .5 .9 141.0 1.5 1.8 1.1 2.4 2.2 151.0 1.6 1.3 1.7 1.2 2.4 16
– .8 .8 .5 .8 .5 17
– .9 1.0 .6 1.0 .6 181.0 1.3 2.9 .7 1.9 5.2 19
– .9 1.6 .4 1.5 2.4 20
– .9 .9 .8 .8 .7 21
– 1.1 1.0 .9 1.1 .7 22– .4 2.7 1.4 2.7 3.5 23– 1.9 2.3 1.4 .9 3.0 24
1992 ECONOMIC CENSUS CHARACTERISTICS OF BUSINESS OWNERS 213

Table 26a. Franchised Businesses by Industry Division: 1992[All data are shown as percents, except firms. For meaning of abbreviations and symbols, see introductory text. For explanation of terms, see appendix A]
Type of firm and industry division
Franchised business1
Firms(number) Yes No
Notreported
A B C D
All businesses 17 253 143.......................................................... 2.9 89.9 7.21
Agricultural services, forestry, fishing, and mining 583 253................................... .8 89.7 9.52Construction 1 829 620................................................................... .6 94.6 4.83Manufacturing 517 714................................................................. 1.3 94.2 4.54Transportation, communications, and utilities 698 903....................................... 4.2 85.2 10.65Wholesale trade 538 339................................................................ 3.3 91.0 5.76
Retail trade 2 478 045.................................................................... 7.4 85.4 7.27Finance, insurance, and real estate 1 941 029............................................... 6.4 87.8 5.88Services 7 784 016....................................................................... 1.4 91.8 6.89Industries not classified 882 224......................................................... 2.0 81.8 16.310
Hispanic ~owned businesses 771 708............................................. 2.5 86.4 11.111
Agricultural services, forestry, fishing, and mining 32 927................................... 1.4 85.6 13.012Construction 97 476................................................................... 1.1 86.3 12.613Manufacturing 18 461................................................................. 1.7 90.2 8.214Transportation, communications, and utilities 47 797....................................... 2.4 84.1 13.515Wholesale trade 17 727................................................................ 3.2 91.3 5.416
Retail trade 107 846.................................................................... 6.1 86.2 7.717Finance, insurance, and real estate 49 231............................................... 5.8 85.2 9.018Services 347 297....................................................................... 1.3 87.8 11.019Industries not classified 52 945......................................................... 3.9 78.2 17.920
Black ~owned businesses 620 912................................................ 3.5 82.1 14.421
Agricultural services, forestry, fishing, and mining 10 309................................... 2.0 86.3 11.722Construction 43 381................................................................... 1.2 88.7 10.123Manufacturing 10 469................................................................. 2.2 83.1 14.624Transportation, communications, and utilities 49 095...................................... 6.0 75.4 18.525Wholesale trade 7 550................................................................ 4.3 86.4 9.326
Retail trade 86 840.................................................................... 7.6 78.6 13.827Finance, insurance, and real estate 40 924............................................... 8.7 81.7 9.628Services 332 981....................................................................... 1.7 83.7 14.629Industries not classified 39 363......................................................... 5.1 75.1 19.830
Other minority ~owned businesses 606 426........................................ 4.5 89.0 6.531
Agricultural services, forestry, fishing, and mining 15 218................................... 2.2 88.0 9.732Construction 28 295................................................................... 2.8 90.8 6.433Manufacturing 18 976................................................................. 2.7 91.1 6.234Transportation, communications, and utilities 24 362....................................... 12.0 75.4 12.635Wholesale trade 20 043................................................................ 2.2 91.2 6.636
Retail trade 132 483.................................................................... 7.6 87.8 4.637Finance, insurance, and real estate 64 762............................................... 7.0 82.4 10.638Services 273 774....................................................................... 2.6 91.9 5.539Industries not classified 28 512......................................................... 2.6 89.5 7.940
Women ~owned businesses 5 888 883............................................... 3.2 88.0 8.841
Agricultural services, forestry, fishing, and mining 119 731................................... 3.0 85.6 11.542Construction 183 695................................................................... .8 93.2 6.043Manufacturing 152 346................................................................. 1.9 90.1 8.044Transportation, communications, and utilities 141 623....................................... 3.3 89.6 7.145Wholesale trade 154 542................................................................ 3.2 90.4 6.346
Retail trade 1 093 342.................................................................... 6.2 84.2 9.647Finance, insurance, and real estate 602 802............................................... 7.6 85.4 7.048Services 3 158 444....................................................................... 1.4 90.1 8.549Industries not classified 282 358......................................................... 3.4 79.1 17.550
Nonminority male ~owned businesses 10 114 456..................................... 2.7 91.5 5.851
Agricultural services, forestry, fishing, and mining 412 917................................... – 91.4 8.652Construction 1 496 056................................................................... .5 95.6 3.953Manufacturing 333 485................................................................. .9 96.3 2.854Transportation, communications, and utilities 458 400....................................... 4.1 85.4 10.555Wholesale trade 352 721................................................................ 3.3 91.3 5.456
Retail trade 1 197 943.................................................................... 8.5 86.5 5.057Finance, insurance, and real estate 1 240 594............................................... 5.8 89.1 5.058Services 4 102 294....................................................................... 1.3 93.5 5.259Industries not classified 520 046......................................................... 1.0 83.3 15.760
1Data represent percentage of firms reporting in the designated categories.2For explanation of relative standard errors and standard errors, see Reliability of Estimates in the introductory text.3Relative standard errors are not applicable for lines 1 through 10 since these data are the result of censuses, not surveys.
214 CHARACTERISTICS OF BUSINESS OWNERS 1992 ECONOMIC CENSUS

Standard error of estimate2 for columnmRelative
standarderror of
estimate2 3
A B C D
(X) .2 .4 .3 1
(X) .2 1.2 1.0 2(X) .3 .7 .7 3(X) .2 .9 .7 4(X) 1.0 1.5 1.0 5(X) .9 1.3 1.1 6
(X) .6 1.2 .9 7(X) 1.5 2.0 .8 8(X) .3 .8 .6 9(X) .5 1.4 1.5 10
– .2 .9 .9 11
1.0 .7 3.1 3.3 121.0 .6 1.4 1.6 131.0 .6 1.2 1.3 141.0 .8 1.6 1.8 152.0 .6 1.7 1.6 16
1.0 .9 1.5 1.1 171.0 .9 2.0 1.8 18
– .3 1.5 1.5 191.0 1.6 1.2 1.9 20
– .3 .8 .7 21
1.0 .6 2.0 1.6 22– .5 1.5 1.4 23
1.0 .7 1.8 1.8 24– 1.0 1.8 1.5 25
2.0 .5 1.5 1.6 26
– .7 1.6 1.5 271.0 .8 1.2 1.0 28
– .4 1.1 1.1 29– 1.0 3.1 3.1 30
– .5 .6 .3 31
1.0 1.3 3.9 3.6 321.0 1.6 1.8 1.8 331.0 1.0 1.7 1.8 341.0 2.3 3.7 3.2 351.0 .7 2.0 2.0 36
1.0 .8 1.5 1.1 371.0 2.0 2.9 2.1 38
– .6 1.0 .9 391.0 1.0 2.1 2.3 40
– .4 .9 .7 41
– 1.2 4.4 3.6 42– .2 1.3 1.4 43– .5 1.3 1.3 44– .8 1.1 1.1 45– 1.1 1.1 1.4 46
– .9 2.0 1.5 47– 1.2 2.5 1.7 48– .4 .9 .9 49– 1.0 1.9 2.2 50
– .4 .7 .4 51
– – 1.5 1.5 52– .4 .9 .9 53– .3 .8 .7 54– 1.5 1.9 1.3 55– 1.1 1.9 1.3 56
– 1.1 1.7 1.3 57– 2.3 2.8 .9 58– .5 1.2 .9 59– .9 2.2 2.3 60
1992 ECONOMIC CENSUS CHARACTERISTICS OF BUSINESS OWNERS 215

Table 26b. Franchised Businesses by Receipts Size of Firm: 1992[All data are shown as percents, except firms. For meaning of abbreviations and symbols, see introductory text. For explanation of terms, see appendix A]
Type of firm and receipts size
Franchised business1
Firms(number) Yes No
Notreported
A B C D
All businesses 17 253 143.......................................................... 2.9 89.9 7.21
Less than $5,000 5 226 553............................................................... 2.8 85.1 12.12$5,000 to $9,999 2 443 946............................................................... 1.8 89.7 8.43$10,000 to $24,999 3 076 410............................................................. 2.5 91.7 5.94$25,000 to $49,999 1 945 806............................................................. 2.7 91.8 5.55$50,000 to $99,999 1 615 940............................................................. 2.6 94.7 2.76
$100,000 to $199,999 1 197 996........................................................... 2.7 94.6 2.77$200,000 to $249,999 301 794........................................................... 5.5 91.7 2.88$250,000 to $499,999 682 583........................................................... 4.4 92.2 3.49$500,000 to $999,999 372 078........................................................... 5.4 91.5 3.110$1,000,000 or more 390 037............................................................. 10.8 86.5 2.711
Hispanic ~owned businesses 771 708............................................. 2.5 86.4 11.112
Less than $5,000 219 226............................................................... 3.5 80.0 16.513$5,000 to $9,999 140 362............................................................... 1.4 82.5 16.114$10,000 to $24,999 165 667............................................................. 1.1 86.5 12.315$25,000 to $49,999 87 288............................................................. 2.0 90.8 7.316$50,000 to $99,999 64 742............................................................. 3.2 90.9 5.917
$100,000 to $199,999 41 578........................................................... 1.7 95.2 3.118$200,000 to $249,999 10 030........................................................... 6.3 89.5 4.219$250,000 to $499,999 22 301........................................................... 3.7 92.6 3.620$500,000 to $999,999 11 319........................................................... 5.1 92.1 2.921$1,000,000 or more 9 194............................................................. 8.7 88.9 2.422
Black ~owned businesses 620 912................................................ 3.5 82.1 14.423
Less than $5,000 236 722............................................................... 4.4 76.3 19.324$5,000 to $9,999 111 512............................................................... 2.8 81.2 16.025$10,000 to $24,999 129 901............................................................. 2.4 85.3 12.226$25,000 to $49,999 62 209............................................................. 3.8 86.8 9.527$50,000 to $99,999 39 218............................................................. 3.1 89.4 7.428
$100,000 to $199,999 20 936........................................................... 2.9 92.8 4.329$200,000 to $249,999 4 533........................................................... .7 94.7 4.530$250,000 to $499,999 9 029........................................................... 4.2 92.4 3.431$500,000 to $999,999 3 823........................................................... 5.8 88.6 5.732$1,000,000 or more 3 028............................................................. 17.5 78.6 4.033
Other minority ~owned businesses 606 426........................................ 4.5 89.0 6.534
Less than $5,000 132 493............................................................... 5.1 86.5 8.435$5,000 to $9,999 80 435............................................................... 1.7 89.3 9.036$10,000 to $24,999 108 195............................................................. 1.6 88.6 9.737$25,000 to $49,999 77 345............................................................. 6.5 87.6 5.938$50,000 to $99,999 70 360............................................................. 4.3 90.4 5.339
$100,000 to $199,999 58 620........................................................... 3.0 93.3 3.840$200,000 to $249,999 15 740........................................................... 6.4 90.7 2.841$250,000 to $499,999 34 266........................................................... 5.8 91.1 3.142$500,000 to $999,999 16 467........................................................... 9.7 87.8 2.543$1,000,000 or more 12 505............................................................. 13.1 83.1 3.844
Women ~owned businesses 5 888 883............................................... 3.2 88.0 8.845
Less than $5,000 2 310 303............................................................... 3.7 83.2 13.146$5,000 to $9,999 967 380............................................................... 2.3 90.0 7.747$10,000 to $24,999 1 051 358............................................................. 1.5 91.5 6.948$25,000 to $49,999 538 885............................................................. 3.6 89.0 7.449$50,000 to $99,999 381 517............................................................. 2.3 92.7 5.050
$100,000 to $199,999 267 089........................................................... 4.2 93.2 2.651$200,000 to $249,999 66 464........................................................... 3.1 90.5 6.452$250,000 to $499,999 146 313........................................................... 7.0 91.0 2.153$500,000 to $999,999 80 539........................................................... 6.3 90.5 3.254$1,000,000 or more 79 037............................................................. 8.3 89.2 2.555
Nonminority male ~owned businesses 10 114 456..................................... 2.7 91.5 5.856
Less than $5,000 2 608 047............................................................... 2.0 87.2 10.857$5,000 to $9,999 1 285 456............................................................... 1.5 90.5 8.058$10,000 to $24,999 1 763 830............................................................. 3.2 92.6 4.259$25,000 to $49,999 1 248 482............................................................. 2.2 93.3 4.660$50,000 to $99,999 1 108 065............................................................. 2.5 95.9 1.561
$100,000 to $199,999 840 723........................................................... 2.2 95.2 2.662$200,000 to $249,999 212 693........................................................... 6.2 92.3 1.563$250,000 to $499,999 488 462........................................................... 3.7 92.7 3.764$500,000 to $999,999 266 408........................................................... 4.8 92.1 3.165$1,000,000 or more 292 290............................................................. 11.3 86.0 2.666
1Data represent percentage of firms reporting in the designated categories.2For explanation of relative standard errors and standard errors, see Reliability of Estimates in the introductory text.3Relative standard errors are not applicable for lines 1 through 11 since these data are the result of censuses, not surveys.
216 CHARACTERISTICS OF BUSINESS OWNERS 1992 ECONOMIC CENSUS

Standard error of estimate2 for columnmRelative
standarderror of
estimate2 3
A B C D
(X) .2 .4 .3 1
(X) .3 .8 .7 2(X) .4 1.4 1.2 3(X) .8 1.2 .7 4(X) .9 1.7 1.2 5(X) .5 .7 .4 6
(X) .4 .8 .5 7(X) 1.9 3.0 1.1 8(X) .4 .5 .5 9(X) .4 .4 .4 10(X) .5 .5 .2 11
– .2 .9 .9 12
1.0 .8 2.4 2.1 131.0 .9 1.8 1.7 141.0 .5 2.4 2.2 151.0 .8 1.2 1.0 161.0 1.0 1.8 1.4 17
1.0 .6 .7 .6 183.0 1.5 2.4 1.6 192.0 .6 1.2 .8 203.0 1.3 1.2 .8 212.0 .5 .5 .3 22
– .3 .8 .7 23
– .6 1.5 1.6 24– .5 2.2 2.1 25– .6 1.3 1.1 26– .9 1.5 2.0 27
1.0 .6 1.4 .9 28
1.0 .6 .6 .7 293.0 .5 1.6 1.6 303.0 1.1 1.1 .6 314.0 1.4 2.3 1.2 324.0 2.3 2.4 .9 33
– .5 .6 .3 34
1.0 1.8 2.0 1.4 351.0 .6 2.6 2.7 361.0 .6 1.3 1.1 371.0 2.1 3.1 1.5 381.0 1.1 1.5 1.4 39
1.0 .4 .7 .6 402.0 2.2 2.3 1.0 411.0 .7 .8 .3 422.0 .7 1.1 .7 432.0 1.0 1.2 .8 44
– .4 .9 .7 45
– .7 1.9 1.8 46– 1.0 1.6 1.3 47– .5 1.3 1.1 48– 1.6 2.8 1.4 49– .7 1.8 1.5 50
– 1.2 1.2 .7 511.0 1.0 2.8 2.5 521.0 1.1 1.1 .4 531.0 .7 1.2 .8 541.0 .8 .9 .5 55
– .4 .7 .4 56
– .6 1.0 .7 57– .7 2.3 1.9 58– 1.3 2.0 1.6 59– 1.3 1.9 1.4 60– .7 .8 .5 61
– .6 .9 .7 62– 2.7 3.6 1.0 63– .6 .8 .7 64– .6 .6 .6 65– .6 .6 .2 66
1992 ECONOMIC CENSUS CHARACTERISTICS OF BUSINESS OWNERS 217

Table 26c. Franchised Businesses by Employment Size of Firm: 1992[All data are shown as percents, except firms. For meaning of abbreviations and symbols, see introductory text. For explanation of terms, see appendix A]
Type of firm and employment size
Franchised business1
Firms(number) Yes No
Notreported
A B C D
All businesses 17 253 143.......................................................... 2.9 89.9 7.21
With no paid employees 14 118 184......................................................... 2.6 89.2 8.22With paid employees 3 134 959............................................................ 4.4 93.0 2.53
No employees4 435 838............................................................... 3.6 94.6 1.841 to 4 employees 1 716 076............................................................. 2.8 94.7 2.555 to 9 employees 503 808............................................................. 3.4 93.7 2.9610 to 19 employees 256 110........................................................... 9.6 86.9 3.5720 to 49 employees 144 734........................................................... 13.7 84.2 2.1850 to 99 employees 45 331........................................................... 20.6 77.7 1.79100 employees or more 33 062....................................................... 14.1 83.2 2.610
Hispanic ~owned businesses 771 708............................................. 2.5 86.4 11.111
With no paid employees 656 343......................................................... 2.4 84.7 13.012With paid employees 115 364............................................................ 3.2 93.4 3.413
No employees4 19 569............................................................... 1.9 93.5 4.7141 to 4 employees 64 631............................................................. 2.2 94.1 3.6155 to 9 employees 16 937............................................................. 2.7 95.0 2.21610 to 19 employees 8 553........................................................... 8.2 89.9 1.91720 to 49 employees 4 050........................................................... 9.0 88.6 2.41850 to 99 employees 948........................................................... 13.7 82.5 3.819100 employees or more 676....................................................... 16.5 81.8 1.720
Black ~owned businesses 620 912................................................ 3.5 82.1 14.421
With no paid employees 556 434......................................................... 3.4 81.2 15.422With paid employees 64 478............................................................ 4.0 89.8 6.223
No employees4 13 725............................................................... 3.1 84.5 12.5241 to 4 employees 37 587............................................................. 2.6 92.8 4.6255 to 9 employees 7 853............................................................. 7.1 89.0 3.92610 to 19 employees 2 839........................................................... 5.2 90.6 4.22720 to 49 employees 1 700........................................................... 16.1 76.6 7.22850 to 99 employees 432........................................................... 49.1 47.3 3.729100 employees or more 342....................................................... 22.3 76.2 1.430
Other minority ~owned businesses 606 426........................................ 4.5 89.0 6.531
With no paid employees 470 075......................................................... 3.8 88.2 8.032With paid employees 136 351............................................................ 6.4 91.0 2.633
No employees4 19 989............................................................... 6.7 90.9 2.3341 to 4 employees 76 636............................................................. 4.5 93.0 2.5355 to 9 employees 22 862............................................................. 7.4 89.9 2.73610 to 19 employees 10 051........................................................... 9.9 87.6 2.53720 to 49 employees 5 034........................................................... 16.4 80.6 3.03850 to 99 employees 1 075........................................................... 10.3 86.1 3.639100 employees or more 705....................................................... 15.7 75.2 9.140
Women ~owned businesses 5 888 883............................................... 3.2 88.0 8.841
With no paid employees 5 071 110......................................................... 2.9 87.3 9.842With paid employees 817 773............................................................ 4.6 92.0 3.443
No employees4 127 905............................................................... 3.7 92.2 4.1441 to 4 employees 435 550............................................................. 2.6 94.4 3.0455 to 9 employees 134 476............................................................. 5.8 89.4 4.84610 to 19 employees 67 487........................................................... 9.1 88.2 2.74720 to 49 employees 35 515........................................................... 15.9 82.2 1.94850 to 99 employees 10 178........................................................... 16.0 82.4 1.649100 employees or more 6 663....................................................... 10.1 88.3 1.650
Nonminority male ~owned businesses 10 114 456..................................... 2.7 91.5 5.851
With no paid employees 8 019 462......................................................... 2.3 90.9 6.852With paid employees 2 094 993............................................................ 4.3 93.6 2.153
No employees4 271 380............................................................... 3.4 96.2 .3541 to 4 employees 1 155 800............................................................. 2.7 95.0 2.3555 to 9 employees 334 483............................................................. 2.2 95.7 2.15610 to 19 employees 173 140........................................................... 9.8 86.2 4.05720 to 49 employees 101 938........................................................... 12.9 85.1 2.05850 to 99 employees 33 406........................................................... 22.3 76.2 1.559100 employees or more 24 846....................................................... 15.4 81.8 2.860
1Data represent percentage of firms reporting in the designated categories.2For explanation of relative standard errors and standard errors, see Reliability of Estimates in the introductory text.3Relative standard errors are not applicable for lines 1 through 10 since these data are the result of censuses, not surveys.4Firms reported annual payroll, but did not report any employees on their payroll during specified period in 1992.
218 CHARACTERISTICS OF BUSINESS OWNERS 1992 ECONOMIC CENSUS
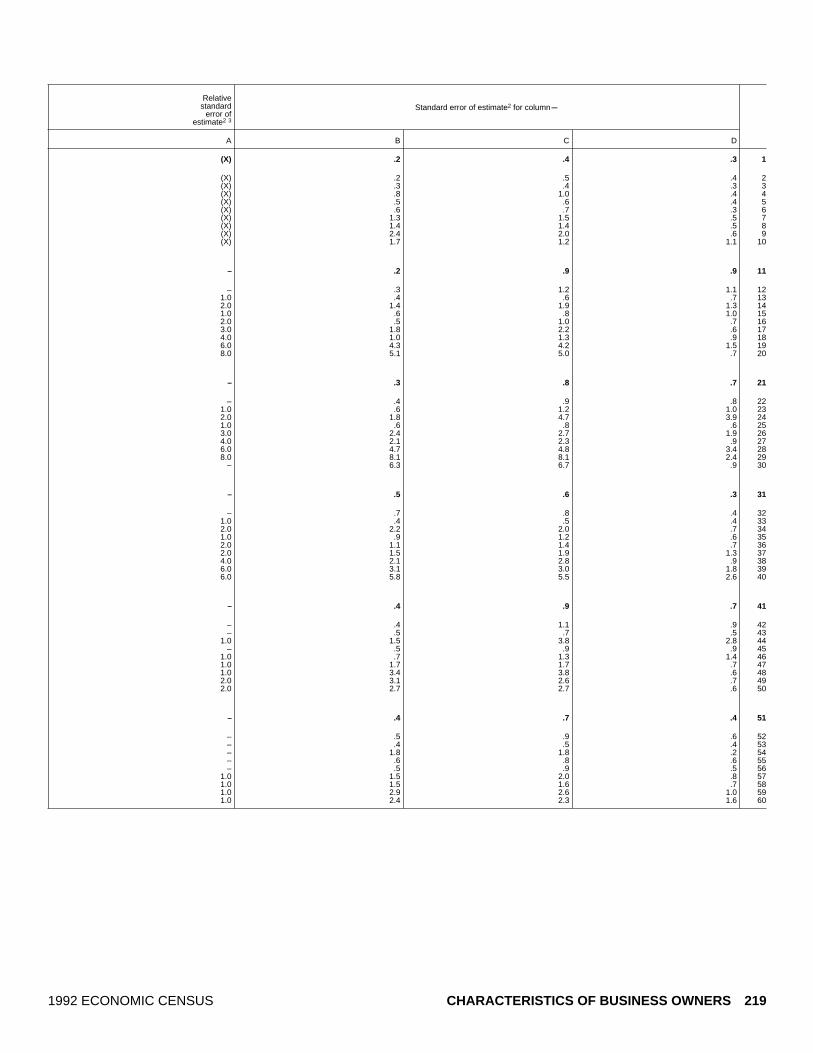
Standard error of estimate2 for columnmRelative
standarderror of
estimate2 3
A B C D
(X) .2 .4 .3 1
(X) .2 .5 .4 2(X) .3 .4 .3 3(X) .8 1.0 .4 4(X) .5 .6 .4 5(X) .6 .7 .3 6(X) 1.3 1.5 .5 7(X) 1.4 1.4 .5 8(X) 2.4 2.0 .6 9(X) 1.7 1.2 1.1 10
– .2 .9 .9 11
– .3 1.2 1.1 121.0 .4 .6 .7 132.0 1.4 1.9 1.3 141.0 .6 .8 1.0 152.0 .5 1.0 .7 163.0 1.8 2.2 .6 174.0 1.0 1.3 .9 186.0 4.3 4.2 1.5 198.0 5.1 5.0 .7 20
– .3 .8 .7 21
– .4 .9 .8 221.0 .6 1.2 1.0 232.0 1.8 4.7 3.9 241.0 .6 .8 .6 253.0 2.4 2.7 1.9 264.0 2.1 2.3 .9 276.0 4.7 4.8 3.4 288.0 8.1 8.1 2.4 29
– 6.3 6.7 .9 30
– .5 .6 .3 31
– .7 .8 .4 321.0 .4 .5 .4 332.0 2.2 2.0 .7 341.0 .9 1.2 .6 352.0 1.1 1.4 .7 362.0 1.5 1.9 1.3 374.0 2.1 2.8 .9 386.0 3.1 3.0 1.8 396.0 5.8 5.5 2.6 40
– .4 .9 .7 41
– .4 1.1 .9 42– .5 .7 .5 43
1.0 1.5 3.8 2.8 44– .5 .9 .9 45
1.0 .7 1.3 1.4 461.0 1.7 1.7 .7 471.0 3.4 3.8 .6 482.0 3.1 2.6 .7 492.0 2.7 2.7 .6 50
– .4 .7 .4 51
– .5 .9 .6 52– .4 .5 .4 53– 1.8 1.8 .2 54– .6 .8 .6 55– .5 .9 .5 56
1.0 1.5 2.0 .8 571.0 1.5 1.6 .7 581.0 2.9 2.6 1.0 591.0 2.4 2.3 1.6 60
1992 ECONOMIC CENSUS CHARACTERISTICS OF BUSINESS OWNERS 219

Table 26d. Franchised Businesses by Legal Form of Organization of Firm: 1992[All data are shown as percents, except firms. For meaning of abbreviations and symbols, see introductory text. For explanation of terms, see appendix A]
Type of firm and legal form of organization
Franchised business1
Firms(number) Yes No
Notreported
A B C D
All businesses 17 253 143.......................................................... 2.9 89.9 7.21
Individual proprietorships 14 599 295........................................................ 2.7 89.4 7.92Partnerships 1 089 578................................................................... 2.7 93.9 3.43Subchapter S corporations 1 564 270...................................................... 5.4 92.4 2.24
Hispanic ~owned businesses 771 708............................................. 2.5 86.4 11.15
Individual proprietorships 689 015........................................................ 2.3 85.5 12.26Partnerships 32 650................................................................... 4.4 89.8 5.77Subchapter S corporations 50 042...................................................... 3.5 93.4 3.18
Black ~owned businesses 620 912................................................ 3.5 82.1 14.49
Individual proprietorships 584 256........................................................ 3.5 81.6 14.910Partnerships 14 727................................................................... 2.5 92.7 4.911Subchapter S corporations 21 928...................................................... 4.4 92.0 3.512
Other minority ~owned businesses 606 426........................................ 4.5 89.0 6.513
Individual proprietorships 502 022........................................................ 4.6 88.1 7.314Partnerships 49 489................................................................... 3.1 91.6 5.415Subchapter S corporations 54 915...................................................... 5.1 92.2 2.716
Women ~owned businesses 5 888 883............................................... 3.2 88.0 8.817
Individual proprietorships 5 078 077........................................................ 3.0 87.3 9.718Partnerships 243 651................................................................... 1.5 96.2 2.319Subchapter S corporations 567 155...................................................... 5.8 91.2 3.020
Nonminority male ~owned businesses 10 114 456..................................... 2.7 91.5 5.821
Individual proprietorships 8 414 238........................................................ 2.5 91.1 6.422Partnerships 777 379................................................................... 2.9 93.5 3.623Subchapter S corporations 922 838...................................................... 5.2 93.2 1.524
1Data represent percentage of firms reporting in the designated categories.2For explanation of relative standard errors and standard errors, see Reliability of Estimates in the introductory text.3Relative standard errors are not applicable for lines 1 through 4 since these data are the result of censuses, not surveys.
220 CHARACTERISTICS OF BUSINESS OWNERS 1992 ECONOMIC CENSUS

Standard error of estimate2 for columnmRelative
standarderror of
estimate2 3
A B C D
(X) .2 .4 .3 1
(X) .2 .5 .4 2(X) .8 1.1 .7 3(X) .3 .3 .3 4
– .2 .9 .9 5
– .3 1.0 1.0 62.0 1.2 1.9 1.7 71.0 .7 1.2 .9 8
– .3 .8 .7 9
– .3 .8 .7 103.0 1.4 1.9 1.4 112.0 1.0 1.3 1.2 12
– .5 .6 .3 13
– .6 .8 .5 141.0 .6 1.7 1.8 151.0 .5 .8 .8 16
– .4 .9 .7 17
– .4 1.0 .8 181.0 .3 .9 .7 19
– .7 .7 .5 20
– .4 .7 .4 21
– .5 .8 .5 22– 1.1 1.6 1.0 23– .3 .5 .6 24
1992 ECONOMIC CENSUS CHARACTERISTICS OF BUSINESS OWNERS 221

Table 27a. Net Profit and Net Loss by Industry Division: 1992[All data are shown as percents, except firms. For meaning of abbreviations and symbols, see introductory text. For explanation of terms, see appendix A]
Type of firm and industry division
Net profit and net loss before taxes1
Net profit Net loss
Firms(number)
$100,000 ormore
$25,000 to$99,999
$10,000 to$24,999
Less than$10,000
Less than$10,000
$10,000 to$24,999
$25,000 to$99,999
$100,000 ormore
A B C D E F G H I
All businesses 17 253 143........................................ 2.2 8.0 8.3 38.5 15.6 2.6 1.5 .71
Agricultural services, forestry, fishing, and mining 583 253................ 1.6 7.2 8.9 39.4 17.6 2.4 1.1 .52Construction 1 829 620................................................. 1.3 9.6 12.4 37.2 9.4 3.7 1.3 .43Manufacturing 517 714............................................... 4.4 8.4 10.1 32.7 19.3 2.3 2.3 1.54Transportation, communications, and utilities 698 903.................... 1.4 8.0 15.8 31.1 12.8 3.9 2.1 .55Wholesale trade 538 339............................................. 5.6 13.0 13.0 26.9 17.7 3.3 2.1 1.06
Retail trade 2 478 045.................................................. 1.3 7.9 9.4 36.7 24.0 2.9 1.8 .37Finance, insurance, and real estate 1 941 029............................. 4.0 10.5 7.6 30.4 12.1 3.2 3.7 2.48Services 7 784 016.................................................... 2.2 7.3 6.4 42.7 15.2 2.0 .7 .59Industries not classified 882 224....................................... .3 3.7 4.0 43.2 13.9 2.2 1.1 .610
Hispanic ~owned businesses 771 708........................... 1.4 6.7 9.2 36.9 15.7 3.1 1.4 .411
Agricultural services, forestry, fishing, and mining 32 927................ .7 5.6 9.1 38.0 15.9 1.9 1.6 .312Construction 97 476................................................. 1.1 7.6 13.1 32.9 12.0 3.0 .9 .313Manufacturing 18 461............................................... 3.1 8.6 12.1 31.4 20.1 3.1 2.0 1.114Transportation, communications, and utilities 47 797.................... .7 7.7 17.2 30.1 13.0 4.3 3.1 .215Wholesale trade 17 727............................................. 3.4 12.7 15.5 31.7 14.9 4.2 1.3 1.116
Retail trade 107 846.................................................. .8 8.8 11.0 35.8 21.6 3.8 2.2 .317Finance, insurance, and real estate 49 231............................. 3.0 7.5 10.4 30.7 15.5 4.9 2.8 1.418Services 347 297.................................................... 1.6 5.9 6.1 40.1 15.2 2.7 .9 .219Industries not classified 52 945....................................... .4 2.5 6.9 41.0 14.2 2.7 .9 .520
Black ~owned businesses 620 912.............................. .6 2.5 4.5 35.7 22.8 2.7 1.3 .321
Agricultural services, forestry, fishing, and mining 10 309................ .3 1.8 4.1 42.0 19.1 3.0 .7 .422Construction 43 381................................................. .6 3.1 8.5 35.5 17.4 4.9 1.2 .223Manufacturing 10 469............................................... .7 2.9 5.6 34.2 24.3 4.0 2.0 .124Transportation, communications, and utilities 49 095.................... .2 3.6 8.4 31.0 17.6 3.8 3.5 .325Wholesale trade 7 550............................................. 1.5 6.4 6.8 32.8 27.1 4.7 1.2 .326
Retail trade 86 840.................................................. .3 1.8 4.4 35.4 35.1 3.0 .6 .127Finance, insurance, and real estate 40 924............................. .6 4.0 2.3 33.1 28.3 4.6 1.9 .928Services 332 981.................................................... .7 2.4 3.9 37.2 20.7 2.1 1.0 .429Industries not classified 39 363....................................... .2 .7 2.4 31.3 21.6 1.5 1.4 .530
Other minority ~owned businesses 606 426...................... 3.4 10.1 11.7 34.7 14.9 4.4 2.0 .931
Agricultural services, forestry, fishing, and mining 15 218................ 1.7 6.2 12.6 39.6 9.7 3.5 2.5 1.032Construction 28 295................................................. 2.9 10.3 12.8 33.9 15.4 2.1 1.3 2.633Manufacturing 18 976............................................... 4.8 10.2 12.3 34.5 21.7 2.4 1.5 1.634Transportation, communications, and utilities 24 362.................... .9 5.2 11.0 40.2 10.0 4.5 2.8 1.835Wholesale trade 20 043............................................. 5.5 15.4 15.2 25.8 18.7 4.7 2.0 1.136
Retail trade 132 483.................................................. 1.4 12.8 21.0 30.4 17.4 5.2 2.5 .137Finance, insurance, and real estate 64 762............................. 3.3 8.7 9.0 27.4 14.8 6.4 4.3 2.438Services 273 774.................................................... 4.8 10.2 8.1 37.7 13.2 3.8 1.3 .839Industries not classified 28 512....................................... .7 3.4 5.4 43.9 17.9 5.4 .5 –40
Women ~owned businesses 5 888 883............................ 1.0 4.2 5.1 42.2 21.1 2.8 1.0 .341
Agricultural services, forestry, fishing, and mining 119 731................ 1.0 4.3 4.4 36.1 21.4 1.6 .5 .542Construction 183 695................................................. 2.2 7.2 9.3 39.9 18.0 3.9 1.6 .643Manufacturing 152 346............................................... 2.9 5.2 6.6 40.3 21.0 3.2 1.0 .744Transportation, communications, and utilities 141 623.................... 1.4 4.7 8.8 37.4 19.9 4.0 2.7 .645Wholesale trade 154 542............................................. 3.1 9.0 8.4 35.0 22.0 3.6 2.5 .646
Retail trade 1 093 342.................................................. .6 3.7 6.0 36.5 31.6 3.2 1.7 .147Finance, insurance, and real estate 602 802............................. 1.5 7.4 7.0 34.4 18.1 3.7 1.6 .948Services 3 158 444.................................................... .7 3.5 3.9 47.1 18.2 2.5 .6 .249Industries not classified 282 358....................................... .2 1.4 4.2 37.8 20.8 2.3 .2 .150
Nonminority male ~owned businesses 10 114 456................... 3.0 10.3 9.8 36.9 12.6 2.3 1.7 1.051
Agricultural services, forestry, fishing, and mining 412 917................ 1.8 8.3 10.0 40.4 17.0 2.7 1.2 .652Construction 1 496 056................................................. 1.3 10.1 12.8 37.2 8.0 3.7 1.3 .453Manufacturing 333 485............................................... 5.1 9.8 11.5 29.3 18.5 1.8 2.9 1.854Transportation, communications, and utilities 458 400.................... 1.6 9.4 18.3 28.9 10.9 3.8 1.7 .455Wholesale trade 352 721............................................. 6.7 14.6 14.8 23.0 16.0 3.1 1.9 1.256
Retail trade 1 197 943.................................................. 2.0 11.1 11.2 38.0 17.9 2.4 1.8 .557Finance, insurance, and real estate 1 240 594............................. 5.2 12.2 7.8 28.5 8.9 2.8 4.7 3.158Services 4 102 294.................................................... 3.2 10.1 8.2 40.1 13.2 1.5 .7 .759Industries not classified 520 046....................................... .4 5.1 3.5 47.1 10.0 2.0 1.7 1.060
1Data represent percentage of firms reporting in the designated categories.2For explanation of relative standard errors and standard errors, see Reliability of Estimates in the introductory text.3Relative standard errors are not applicable for lines 1 through 10 since these data are the result of censuses, not surveys.
222 CHARACTERISTICS OF BUSINESS OWNERS 1992 ECONOMIC CENSUS
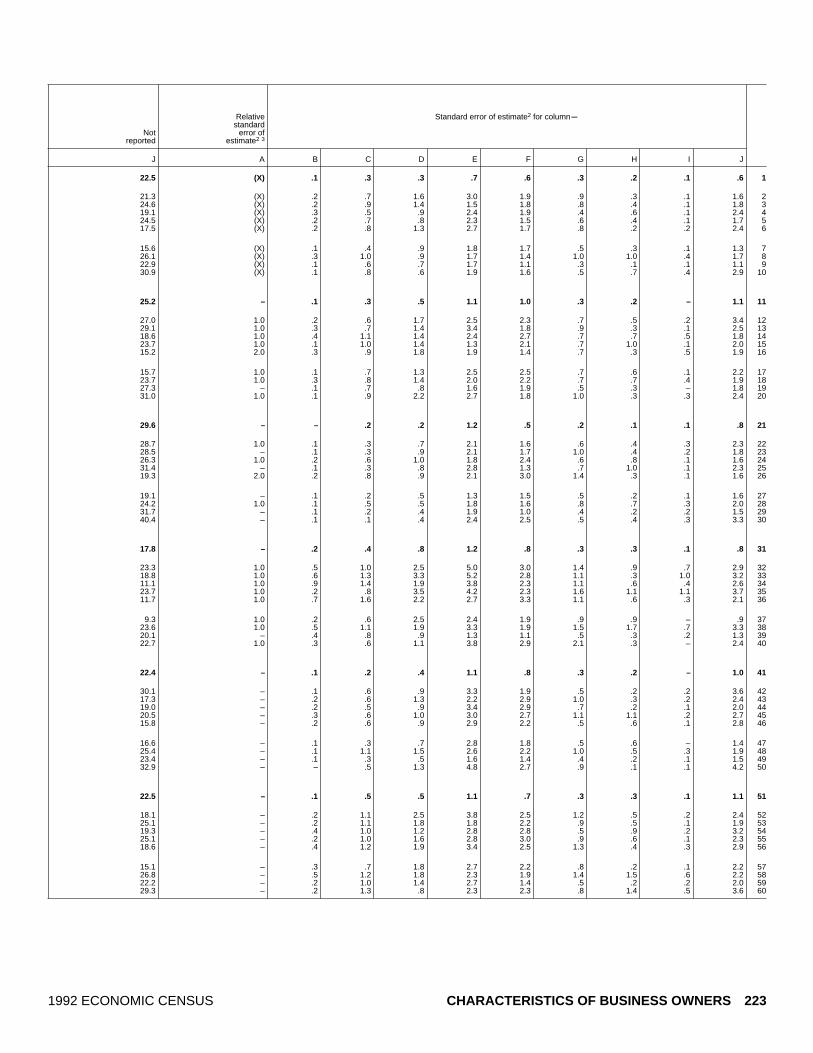
Standard error of estimate2 for columnm
Notreported
Relativestandard
error ofestimate2 3
J A B C D E F G H I J
22.5 (X) .1 .3 .3 .7 .6 .3 .2 .1 .6 1
21.3 (X) .2 .7 1.6 3.0 1.9 .9 .3 .1 1.6 224.6 (X) .2 .9 1.4 1.5 1.8 .8 .4 .1 1.8 319.1 (X) .3 .5 .9 2.4 1.9 .4 .6 .1 2.4 424.5 (X) .2 .7 .8 2.3 1.5 .6 .4 .1 1.7 517.5 (X) .2 .8 1.3 2.7 1.7 .8 .2 .2 2.4 6
15.6 (X) .1 .4 .9 1.8 1.7 .5 .3 .1 1.3 726.1 (X) .3 1.0 .9 1.7 1.4 1.0 1.0 .4 1.7 822.9 (X) .1 .6 .7 1.7 1.1 .3 .1 .1 1.1 930.9 (X) .1 .8 .6 1.9 1.6 .5 .7 .4 2.9 10
25.2 – .1 .3 .5 1.1 1.0 .3 .2 – 1.1 11
27.0 1.0 .2 .6 1.7 2.5 2.3 .7 .5 .2 3.4 1229.1 1.0 .3 .7 1.4 3.4 1.8 .9 .3 .1 2.5 1318.6 1.0 .4 1.1 1.4 2.4 2.7 .7 .7 .5 1.8 1423.7 1.0 .1 1.0 1.4 1.3 2.1 .7 1.0 .1 2.0 1515.2 2.0 .3 .9 1.8 1.9 1.4 .7 .3 .5 1.9 16
15.7 1.0 .1 .7 1.3 2.5 2.5 .7 .6 .1 2.2 1723.7 1.0 .3 .8 1.4 2.0 2.2 .7 .7 .4 1.9 1827.3 – .1 .7 .8 1.6 1.9 .5 .3 – 1.8 1931.0 1.0 .1 .9 2.2 2.7 1.8 1.0 .3 .3 2.4 20
29.6 – – .2 .2 1.2 .5 .2 .1 .1 .8 21
28.7 1.0 .1 .3 .7 2.1 1.6 .6 .4 .3 2.3 2228.5 – .1 .3 .9 2.1 1.7 1.0 .4 .2 1.8 2326.3 1.0 .2 .6 1.0 1.8 2.4 .6 .8 .1 1.6 2431.4 – .1 .3 .8 2.8 1.3 .7 1.0 .1 2.3 2519.3 2.0 .2 .8 .9 2.1 3.0 1.4 .3 .1 1.6 26
19.1 – .1 .2 .5 1.3 1.5 .5 .2 .1 1.6 2724.2 1.0 .1 .5 .5 1.8 1.6 .8 .7 .3 2.0 2831.7 – .1 .2 .4 1.9 1.0 .4 .2 .2 1.5 2940.4 – .1 .1 .4 2.4 2.5 .5 .4 .3 3.3 30
17.8 – .2 .4 .8 1.2 .8 .3 .3 .1 .8 31
23.3 1.0 .5 1.0 2.5 5.0 3.0 1.4 .9 .7 2.9 3218.8 1.0 .6 1.3 3.3 5.2 2.8 1.1 .3 1.0 3.2 3311.1 1.0 .9 1.4 1.9 3.8 2.3 1.1 .6 .4 2.6 3423.7 1.0 .2 .8 3.5 4.2 2.3 1.6 1.1 1.1 3.7 3511.7 1.0 .7 1.6 2.2 2.7 3.3 1.1 .6 .3 2.1 36
9.3 1.0 .2 .6 2.5 2.4 1.9 .9 .9 – .9 3723.6 1.0 .5 1.1 1.9 3.3 1.9 1.5 1.7 .7 3.3 3820.1 – .4 .8 .9 1.3 1.1 .5 .3 .2 1.3 3922.7 1.0 .3 .6 1.1 3.8 2.9 2.1 .3 – 2.4 40
22.4 – .1 .2 .4 1.1 .8 .3 .2 – 1.0 41
30.1 – .1 .6 .9 3.3 1.9 .5 .2 .2 3.6 4217.3 – .2 .6 1.3 2.2 2.9 1.0 .3 .2 2.4 4319.0 – .2 .5 .9 3.4 2.9 .7 .2 .1 2.0 4420.5 – .3 .6 1.0 3.0 2.7 1.1 1.1 .2 2.7 4515.8 – .2 .6 .9 2.9 2.2 .5 .6 .1 2.8 46
16.6 – .1 .3 .7 2.8 1.8 .5 .6 – 1.4 4725.4 – .1 1.1 1.5 2.6 2.2 1.0 .5 .3 1.9 4823.4 – .1 .3 .5 1.6 1.4 .4 .2 .1 1.5 4932.9 – – .5 1.3 4.8 2.7 .9 .1 .1 4.2 50
22.5 – .1 .5 .5 1.1 .7 .3 .3 .1 1.1 51
18.1 – .2 1.1 2.5 3.8 2.5 1.2 .5 .2 2.4 5225.1 – .2 1.1 1.8 1.8 2.2 .9 .5 .1 1.9 5319.3 – .4 1.0 1.2 2.8 2.8 .5 .9 .2 3.2 5425.1 – .2 1.0 1.6 2.8 3.0 .9 .6 .1 2.3 5518.6 – .4 1.2 1.9 3.4 2.5 1.3 .4 .3 2.9 56
15.1 – .3 .7 1.8 2.7 2.2 .8 .2 .1 2.2 5726.8 – .5 1.2 1.8 2.3 1.9 1.4 1.5 .6 2.2 5822.2 – .2 1.0 1.4 2.7 1.4 .5 .2 .2 2.0 5929.3 – .2 1.3 .8 2.3 2.3 .8 1.4 .5 3.6 60
1992 ECONOMIC CENSUS CHARACTERISTICS OF BUSINESS OWNERS 223

Table 27b. Net Profit and Net Loss by Receipts Size of Firm: 1992[All data are shown as percents, except firms. For meaning of abbreviations and symbols, see introductory text. For explanation of terms, see appendix A]
Type of firm and receipts size
Net profit and net loss before taxes1
Net profit Net loss
Firms(number)
$100,000 ormore
$25,000 to$99,999
$10,000 to$24,999
Less than$10,000
Less than$10,000
$10,000 to$24,999
$25,000 to$99,999
$100,000 ormore
A B C D E F G H I
All businesses 17 253 143........................................ 2.2 8.0 8.3 38.5 15.6 2.6 1.5 .71
Less than $5,000 5 226 553............................................ – – – 53.3 23.8 1.5 .2 .32$5,000 to $9,999 2 443 946............................................. – – – 53.6 19.1 1.3 .4 .13$10,000 to $24,999 3 076 410........................................... – – – 40.0 15.4 3.9 1.1 –4$25,000 to $49,999 1 945 806........................................... – – 23.0 31.4 12.0 2.7 1.7 .25$50,000 to $99,999 1 615 940........................................... – 28.9 25.3 20.9 8.5 3.3 2.7 .26
$100,000 to $199,999 1 197 996........................................ 4.8 32.4 19.8 18.4 7.5 4.2 2.9 1.17$200,000 to $249,999 301 794........................................ 9.3 27.4 21.9 18.4 6.7 3.3 4.9 1.48$250,000 to $499,999 682 583........................................ 13.7 28.7 14.5 15.6 6.7 3.4 3.7 2.99$500,000 to $999,999 372 078........................................ 18.7 27.4 11.4 13.7 5.4 3.2 5.0 5.110$1,000,000 or more 390 037.......................................... 31.5 22.6 7.3 9.6 2.9 2.7 4.8 9.811
Hispanic ~owned businesses 771 708........................... 1.4 6.7 9.2 36.9 15.7 3.1 1.4 .412
Less than $5,000 219 226............................................ – – – 46.9 22.8 1.7 .3 .213$5,000 to $9,999 140 362............................................. – – – 50.8 18.9 .9 .1 .114$10,000 to $24,999 165 667........................................... – – – 40.4 16.2 3.5 .7 –15$25,000 to $49,999 87 288........................................... – – 27.7 32.3 11.0 5.1 3.0 –16$50,000 to $99,999 64 742........................................... – 22.2 24.4 23.8 9.6 4.5 2.1 .117
$100,000 to $199,999 41 578........................................ 1.6 27.8 24.5 17.9 9.9 4.1 3.0 .418$200,000 to $249,999 10 030........................................ 10.3 28.1 16.4 21.0 8.7 5.1 2.7 .319$250,000 to $499,999 22 301........................................ 10.1 26.5 17.8 16.3 9.1 5.4 3.5 1.720$500,000 to $999,999 11 319........................................ 12.7 28.3 15.0 15.7 7.5 3.7 3.8 3.121$1,000,000 or more 9 194.......................................... 27.2 29.2 8.4 7.4 3.2 3.9 4.8 7.422
Black ~owned businesses 620 912.............................. .6 2.5 4.5 35.7 22.8 2.7 1.3 .323
Less than $5,000 236 722............................................ – – – 41.1 28.3 1.2 .2 .124$5,000 to $9,999 111 512............................................. – – – 42.0 26.7 1.6 .5 .425$10,000 to $24,999 129 901........................................... – – – 35.7 19.1 3.0 1.8 .426$25,000 to $49,999 62 209........................................... – – 21.9 26.7 16.3 5.6 2.3 –27$50,000 to $99,999 39 218........................................... – 16.2 20.9 20.1 14.9 6.3 3.0 .328
$100,000 to $199,999 20 936........................................ 2.8 24.5 17.0 16.8 12.1 5.8 4.8 1.229$200,000 to $249,999 4 533........................................ 15.2 24.0 16.7 14.8 14.0 3.5 3.2 1.530$250,000 to $499,999 9 029........................................ 12.1 24.2 15.2 14.7 9.3 6.7 3.4 2.131$500,000 to $999,999 3 823........................................ 18.5 22.3 10.1 11.8 10.8 5.4 3.8 4.432$1,000,000 or more 3 028.......................................... 28.5 18.3 10.0 9.7 3.7 2.7 6.3 7.833
Other minority ~owned businesses 606 426...................... 3.4 10.1 11.7 34.7 14.9 4.4 2.0 .934
Less than $5,000 132 493............................................ – – – 59.5 19.3 2.2 .1 .235$5,000 to $9,999 80 435............................................. – – – 55.1 19.7 3.5 1.1 .636$10,000 to $24,999 108 195........................................... – – – 37.2 15.6 6.4 .6 .637$25,000 to $49,999 77 345........................................... – – 23.8 32.0 17.9 3.9 2.8 .238$50,000 to $99,999 70 360........................................... – 20.7 24.9 24.9 12.6 6.3 1.9 .439
$100,000 to $199,999 58 620........................................ 3.8 25.2 19.9 19.6 11.9 5.8 3.5 .740$200,000 to $249,999 15 740........................................ 11.4 25.4 25.4 9.8 7.6 5.8 3.2 1.841$250,000 to $499,999 34 266........................................ 14.1 27.0 18.5 13.1 8.3 3.9 4.6 2.142$500,000 to $999,999 16 467........................................ 21.0 30.4 13.7 10.5 6.8 3.0 4.3 3.543$1,000,000 or more 12 505.......................................... 28.4 26.1 10.8 7.7 4.5 1.7 4.8 8.544
Women ~owned businesses 5 888 883............................ 1.0 4.2 5.1 42.2 21.1 2.8 1.0 .345
Less than $5,000 2 310 303............................................ – – – 51.7 26.7 1.3 .1 –46$5,000 to $9,999 967 380............................................. – – – 53.5 25.9 1.9 – .347$10,000 to $24,999 1 051 358........................................... – – – 39.1 17.4 4.3 .9 –48$25,000 to $49,999 538 885........................................... – – 20.8 30.1 16.7 2.1 1.8 .149$50,000 to $99,999 381 517........................................... – 23.0 16.9 25.8 11.7 5.7 3.2 .650
$100,000 to $199,999 267 089........................................ 2.5 23.5 20.0 21.5 11.9 7.1 3.1 1.351$200,000 to $249,999 66 464........................................ 8.6 18.0 17.2 22.0 13.0 5.0 3.7 .452$250,000 to $499,999 146 313........................................ 7.4 23.9 16.6 19.7 11.0 5.1 3.1 1.353$500,000 to $999,999 80 539........................................ 12.3 27.5 13.0 16.9 8.7 4.9 5.4 2.154$1,000,000 or more 79 037.......................................... 29.0 22.9 8.7 10.4 4.1 4.4 4.7 7.355
Nonminority male ~owned businesses 10 114 456................... 3.0 10.3 9.8 36.9 12.6 2.3 1.7 1.056
Less than $5,000 2 608 047............................................ – – – 55.2 21.5 1.7 .3 .657$5,000 to $9,999 1 285 456............................................. – – – 54.2 13.9 .9 .6 –58$10,000 to $24,999 1 763 830........................................... – – – 40.7 13.9 3.6 1.2 –59$25,000 to $49,999 1 248 482........................................... – – 23.4 31.9 10.1 2.6 1.5 .360$50,000 to $99,999 1 108 065........................................... – 31.7 27.8 19.1 7.3 2.3 2.6 .161
$100,000 to $199,999 840 723........................................ 5.7 35.7 19.5 17.5 5.9 3.3 2.8 1.062$200,000 to $249,999 212 693........................................ 8.9 30.6 23.7 17.7 4.4 2.3 5.7 1.863$250,000 to $499,999 488 462........................................ 15.7 30.3 13.6 14.5 5.4 2.8 3.9 3.564$500,000 to $999,999 266 408........................................ 20.6 27.2 10.6 13.0 4.3 2.7 5.0 6.065$1,000,000 or more 292 290.......................................... 32.3 22.2 6.7 9.6 2.5 2.3 4.9 10.566
1Data represent percentage of firms reporting in the designated categories.2For explanation of relative standard errors and standard errors, see Reliability of Estimates in the introductory text.3Relative standard errors are not applicable for lines 1 through 11 since these data are the result of censuses, not surveys.
224 CHARACTERISTICS OF BUSINESS OWNERS 1992 ECONOMIC CENSUS
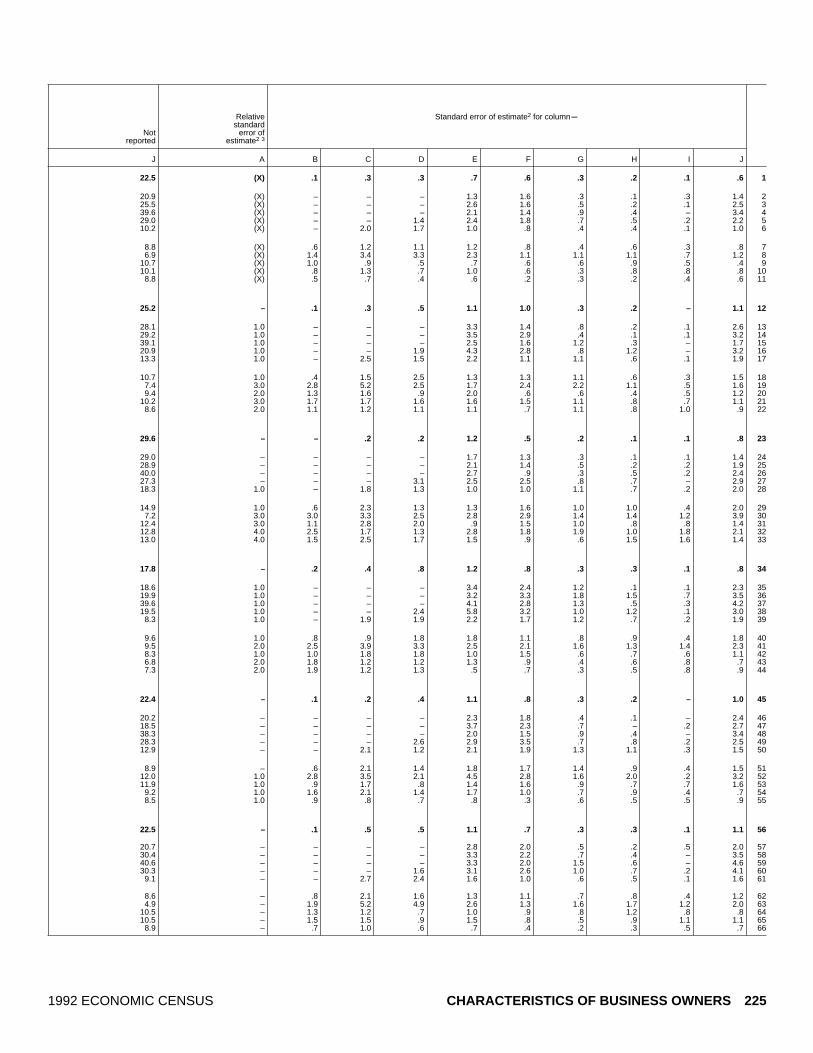
Standard error of estimate2 for columnm
Notreported
Relativestandard
error ofestimate2 3
J A B C D E F G H I J
22.5 (X) .1 .3 .3 .7 .6 .3 .2 .1 .6 1
20.9 (X) – – – 1.3 1.6 .3 .1 .3 1.4 225.5 (X) – – – 2.6 1.6 .5 .2 .1 2.5 339.6 (X) – – – 2.1 1.4 .9 .4 – 3.4 429.0 (X) – – 1.4 2.4 1.8 .7 .5 .2 2.2 510.2 (X) – 2.0 1.7 1.0 .8 .4 .4 .1 1.0 6
8.8 (X) .6 1.2 1.1 1.2 .8 .4 .6 .3 .8 76.9 (X) 1.4 3.4 3.3 2.3 1.1 1.1 1.1 .7 1.2 8
10.7 (X) 1.0 .9 .5 .7 .6 .6 .9 .5 .4 910.1 (X) .8 1.3 .7 1.0 .6 .3 .8 .8 .8 10
8.8 (X) .5 .7 .4 .6 .2 .3 .2 .4 .6 11
25.2 – .1 .3 .5 1.1 1.0 .3 .2 – 1.1 12
28.1 1.0 – – – 3.3 1.4 .8 .2 .1 2.6 1329.2 1.0 – – – 3.5 2.9 .4 .1 .1 3.2 1439.1 1.0 – – – 2.5 1.6 1.2 .3 – 1.7 1520.9 1.0 – – 1.9 4.3 2.8 .8 1.2 – 3.2 1613.3 1.0 – 2.5 1.5 2.2 1.1 1.1 .6 .1 1.9 17
10.7 1.0 .4 1.5 2.5 1.3 1.3 1.1 .6 .3 1.5 187.4 3.0 2.8 5.2 2.5 1.7 2.4 2.2 1.1 .5 1.6 199.4 2.0 1.3 1.6 .9 2.0 .6 .6 .4 .5 1.2 20
10.2 3.0 1.7 1.7 1.6 1.6 1.5 1.1 .8 .7 1.1 218.6 2.0 1.1 1.2 1.1 1.1 .7 1.1 .8 1.0 .9 22
29.6 – – .2 .2 1.2 .5 .2 .1 .1 .8 23
29.0 – – – – 1.7 1.3 .3 .1 .1 1.4 2428.9 – – – – 2.1 1.4 .5 .2 .2 1.9 2540.0 – – – – 2.7 .9 .3 .5 .2 2.4 2627.3 – – – 3.1 2.5 2.5 .8 .7 – 2.9 2718.3 1.0 – 1.8 1.3 1.0 1.0 1.1 .7 .2 2.0 28
14.9 1.0 .6 2.3 1.3 1.3 1.6 1.0 1.0 .4 2.0 297.2 3.0 3.0 3.3 2.5 2.8 2.9 1.4 1.4 1.2 3.9 30
12.4 3.0 1.1 2.8 2.0 .9 1.5 1.0 .8 .8 1.4 3112.8 4.0 2.5 1.7 1.3 2.8 1.8 1.9 1.0 1.8 2.1 3213.0 4.0 1.5 2.5 1.7 1.5 .9 .6 1.5 1.6 1.4 33
17.8 – .2 .4 .8 1.2 .8 .3 .3 .1 .8 34
18.6 1.0 – – – 3.4 2.4 1.2 .1 .1 2.3 3519.9 1.0 – – – 3.2 3.3 1.8 1.5 .7 3.5 3639.6 1.0 – – – 4.1 2.8 1.3 .5 .3 4.2 3719.5 1.0 – – 2.4 5.8 3.2 1.0 1.2 .1 3.0 38
8.3 1.0 – 1.9 1.9 2.2 1.7 1.2 .7 .2 1.9 39
9.6 1.0 .8 .9 1.8 1.8 1.1 .8 .9 .4 1.8 409.5 2.0 2.5 3.9 3.3 2.5 2.1 1.6 1.3 1.4 2.3 418.3 1.0 1.0 1.8 1.8 1.0 1.5 .6 .7 .6 1.1 426.8 2.0 1.8 1.2 1.2 1.3 .9 .4 .6 .8 .7 437.3 2.0 1.9 1.2 1.3 .5 .7 .3 .5 .8 .9 44
22.4 – .1 .2 .4 1.1 .8 .3 .2 – 1.0 45
20.2 – – – – 2.3 1.8 .4 .1 – 2.4 4618.5 – – – – 3.7 2.3 .7 – .2 2.7 4738.3 – – – – 2.0 1.5 .9 .4 – 3.4 4828.3 – – – 2.6 2.9 3.5 .7 .8 .2 2.5 4912.9 – – 2.1 1.2 2.1 1.9 1.3 1.1 .3 1.5 50
8.9 – .6 2.1 1.4 1.8 1.7 1.4 .9 .4 1.5 5112.0 1.0 2.8 3.5 2.1 4.5 2.8 1.6 2.0 .2 3.2 5211.9 1.0 .9 1.7 .8 1.4 1.6 .9 .7 .7 1.6 53
9.2 1.0 1.6 2.1 1.4 1.7 1.0 .7 .9 .4 .7 548.5 1.0 .9 .8 .7 .8 .3 .6 .5 .5 .9 55
22.5 – .1 .5 .5 1.1 .7 .3 .3 .1 1.1 56
20.7 – – – – 2.8 2.0 .5 .2 .5 2.0 5730.4 – – – – 3.3 2.2 .7 .4 – 3.5 5840.6 – – – – 3.3 2.0 1.5 .6 – 4.6 5930.3 – – – 1.6 3.1 2.6 1.0 .7 .2 4.1 60
9.1 – – 2.7 2.4 1.6 1.0 .6 .5 .1 1.6 61
8.6 – .8 2.1 1.6 1.3 1.1 .7 .8 .4 1.2 624.9 – 1.9 5.2 4.9 2.6 1.3 1.6 1.7 1.2 2.0 63
10.5 – 1.3 1.2 .7 1.0 .9 .8 1.2 .8 .8 6410.5 – 1.5 1.5 .9 1.5 .8 .5 .9 1.1 1.1 65
8.9 – .7 1.0 .6 .7 .4 .2 .3 .5 .7 66
1992 ECONOMIC CENSUS CHARACTERISTICS OF BUSINESS OWNERS 225

Table 27c. Net Profit and Net Loss by Employment Size of Firm: 1992[All data are shown as percents, except firms. For meaning of abbreviations and symbols, see introductory text. For explanation of terms, see appendix A]
Type of firm and employment size
Net profit and net loss before taxes1
Net profit Net loss
Firms(number)
$100,000 ormore
$25,000 to$99,999
$10,000 to$24,999
Less than$10,000
Less than$10,000
$10,000 to$24,999
$25,000 to$99,999
$100,000 ormore
A B C D E F G H I
All businesses 17 253 143........................................ 2.2 8.0 8.3 38.5 15.6 2.6 1.5 .71
With no paid employees 14 118 184....................................... .6 4.2 6.1 42.4 17.4 2.3 1.1 .42With paid employees 3 134 959......................................... 9.3 24.5 17.5 21.5 7.8 3.7 2.8 2.13
No employees4 435 838............................................ 3.1 13.3 16.2 28.7 17.3 5.0 2.4 .741 to 4 employees 1 716 076........................................... 5.3 25.9 20.7 23.4 7.1 3.2 2.2 1.155 to 9 employees 503 808........................................... 12.9 29.4 14.1 19.2 5.8 4.3 2.9 1.9610 to 19 employees 256 110........................................ 18.7 27.1 12.7 13.7 6.2 3.5 4.3 4.4720 to 49 employees 144 734........................................ 27.2 20.9 9.9 9.4 4.7 4.7 7.5 7.7850 to 99 employees 45 331........................................ 38.1 17.9 5.1 7.5 .8 2.4 5.7 14.69100 employees or more 33 062..................................... 46.8 10.2 1.2 3.5 1.1 3.6 4.0 21.510
Hispanic ~owned businesses 771 708........................... 1.4 6.7 9.2 36.9 15.7 3.1 1.4 .411
With no paid employees 656 343....................................... .3 3.5 7.2 40.3 17.0 2.6 1.0 .212With paid employees 115 364......................................... 6.1 20.4 17.5 22.8 10.2 5.2 2.8 1.213
No employees4 19 569............................................ 1.7 10.7 18.9 25.1 12.0 5.8 3.6 .3141 to 4 employees 64 631........................................... 3.4 20.0 18.5 25.4 10.5 5.3 2.3 .6155 to 9 employees 16 937........................................... 9.9 25.3 14.0 22.4 10.4 4.7 2.6 1.31610 to 19 employees 8 553........................................ 13.7 27.6 21.1 10.2 6.1 4.6 3.5 3.41720 to 49 employees 4 050........................................ 19.6 25.4 11.3 12.5 9.6 4.7 5.1 5.71850 to 99 employees 948........................................ 27.3 30.7 6.7 3.2 (D) (D) 5.5 9.319100 employees or more 676..................................... 41.7 23.8 .9 8.4 (D) (D) 3.5 12.820
Black ~owned businesses 620 912.............................. .6 2.5 4.5 35.7 22.8 2.7 1.3 .321
With no paid employees 556 434....................................... .2 1.2 3.2 37.1 23.9 2.4 1.0 .322With paid employees 64 478......................................... 3.9 13.5 15.2 24.2 13.9 5.6 3.5 1.023
No employees4 13 725............................................ .2 2.8 9.2 28.3 22.5 4.5 3.0 .6241 to 4 employees 37 587........................................... 3.2 15.7 17.9 25.1 12.1 5.6 3.8 .6255 to 9 employees 7 853........................................... 7.2 18.9 16.4 18.9 9.8 7.4 2.5 1.42610 to 19 employees 2 839........................................ 10.5 19.1 11.4 14.9 9.6 7.8 1.8 3.52720 to 49 employees 1 700........................................ 14.5 16.4 4.3 15.2 19.0 5.5 7.4 6.12850 to 99 employees 432........................................ 23.2 18.3 10.6 3.7 1.9 3.4 16.0 5.929100 employees or more 342..................................... 40.7 8.0 12.0 12.9 1.8 (D) (D) 7.930
Other minority ~owned businesses 606 426...................... 3.4 10.1 11.7 34.7 14.9 4.4 2.0 .931
With no paid employees 470 075....................................... 1.0 5.3 9.0 41.5 16.2 3.9 1.5 .632With paid employees 136 351......................................... 9.9 23.2 19.1 16.4 11.2 5.7 3.4 1.933
No employees4 19 989............................................ 3.7 10.7 11.6 17.9 16.6 15.2 3.7 2.0341 to 4 employees 76 636........................................... 8.0 23.8 22.6 18.6 12.0 4.6 2.5 .9355 to 9 employees 22 862........................................... 13.8 27.6 17.7 13.5 9.2 3.1 4.3 1.43610 to 19 employees 10 051........................................ 12.7 29.3 14.0 12.0 6.7 6.8 5.1 3.63720 to 49 employees 5 034........................................ 18.8 25.0 18.3 9.2 6.8 2.2 8.1 6.33850 to 99 employees 1 075........................................ 37.1 15.6 5.4 5.5 2.2 .9 4.2 20.139100 employees or more 705..................................... 50.0 14.9 1.3 3.3 – .5 2.6 14.140
Women ~owned businesses 5 888 883............................ 1.0 4.2 5.1 42.2 21.1 2.8 1.0 .341
With no paid employees 5 071 110....................................... .3 1.9 3.2 44.8 22.5 2.4 .7 .242With paid employees 817 773......................................... 5.2 17.6 16.4 26.0 12.7 5.3 3.1 1.243
No employees4 127 905............................................ 1.7 10.4 6.8 26.2 28.4 4.0 4.1 .3441 to 4 employees 435 550........................................... 2.1 16.5 18.8 30.8 10.9 6.0 2.3 .7455 to 9 employees 134 476........................................... 7.7 21.9 19.3 20.5 9.5 4.9 3.2 1.04610 to 19 employees 67 487........................................ 10.4 25.6 14.8 17.3 11.3 4.1 2.9 1.84720 to 49 employees 35 515........................................ 22.6 20.4 12.4 11.1 4.4 5.4 10.4 5.54850 to 99 employees 10 178........................................ 31.0 27.3 4.5 11.1 1.2 1.9 4.3 7.549100 employees or more 6 663..................................... 44.5 10.4 2.5 5.8 .7 7.3 5.5 18.750
Nonminority male ~owned businesses 10 114 456................... 3.0 10.3 9.8 36.9 12.6 2.3 1.7 1.051
With no paid employees 8 019 462....................................... .8 5.7 7.6 41.4 14.5 2.2 1.4 .652With paid employees 2 094 993......................................... 11.0 27.5 17.9 20.0 5.7 2.8 2.6 2.653
No employees4 271 380............................................ 3.9 15.2 20.5 30.9 12.8 4.7 1.5 .8541 to 4 employees 1 155 800........................................... 6.5 29.9 21.6 20.9 5.3 1.9 2.1 1.3555 to 9 employees 334 483........................................... 14.9 32.6 11.9 19.0 4.1 4.0 2.6 2.35610 to 19 employees 173 140........................................ 22.5 27.4 11.6 12.5 4.3 2.9 4.8 5.55720 to 49 employees 101 938........................................ 29.3 20.6 8.7 8.7 4.5 4.5 6.7 8.65850 to 99 employees 33 406........................................ 40.3 15.1 5.2 6.8 .6 2.7 6.1 16.359100 employees or more 24 846..................................... 47.2 9.8 .6 2.4 1.3 2.8 3.8 23.160
1Data represent percentage of firms reporting in the designated categories.2For explanation of relative standard errors and standard errors, see Reliability of Estimates in the introductory text.3Relative standard errors are not applicable for lines 1 through 10 since these data are the result of censuses, not surveys.4Firms reported annual payroll, but did not report any employees on their payroll during specified period in 1992.
226 CHARACTERISTICS OF BUSINESS OWNERS 1992 ECONOMIC CENSUS

Standard error of estimate2 for columnm
Notreported
Relativestandard
error ofestimate2 3
J A B C D E F G H I J
22.5 (X) .1 .3 .3 .7 .6 .3 .2 .1 .6 1
25.3 (X) .1 .3 .4 .8 .8 .3 .2 .1 .7 210.7 (X) .2 .7 .7 .5 .5 .4 .2 .1 .7 313.3 (X) .7 2.3 2.0 5.9 3.8 1.7 .7 .2 2.8 411.0 (X) .4 1.0 .9 .9 .6 .3 .3 .2 .9 5
9.6 (X) .8 1.4 1.3 2.0 .8 1.1 .5 .4 .8 69.4 (X) 1.2 1.6 1.6 1.5 1.0 .7 .8 .5 .9 78.1 (X) 1.0 1.5 1.5 1.3 .8 1.4 1.6 .8 .9 88.0 (X) 2.4 1.1 1.2 1.3 .3 1.2 1.1 1.4 1.7 98.0 (X) 3.2 2.7 .5 1.0 .8 1.1 1.3 2.1 1.8 10
25.2 – .1 .3 .5 1.1 1.0 .3 .2 – 1.1 11
27.9 – .1 .2 .6 1.2 1.2 .4 .2 .1 1.3 1213.8 1.0 .4 1.1 1.0 1.2 1.0 .7 .6 .1 1.5 1321.9 2.0 .5 2.5 4.7 4.9 2.1 1.6 2.7 .3 3.9 1414.1 1.0 .4 1.3 1.8 1.6 1.7 1.3 .5 .2 2.2 15
9.3 2.0 2.2 2.8 1.5 2.6 1.9 1.5 .3 .4 1.5 169.8 3.0 1.5 2.7 3.1 2.0 1.5 .9 .5 .8 2.0 176.2 4.0 1.6 2.0 1.9 3.4 2.4 1.1 2.0 1.2 1.3 18
14.2 6.0 3.1 5.5 1.9 1.3 (D) (D) 1.4 1.7 3.4 196.9 8.0 5.9 5.8 .5 4.1 (D) (D) 1.1 3.1 4.8 20
29.6 – – .2 .2 1.2 .5 .2 .1 .1 .8 21
30.9 – – .1 .2 1.3 .5 .2 .1 .1 .9 2219.0 1.0 .2 1.1 1.6 1.1 .9 .7 .8 .3 1.3 2329.1 2.0 .1 1.1 3.0 4.6 4.3 2.6 1.2 .5 4.9 2416.1 1.0 .3 1.3 2.3 1.9 1.4 .7 1.2 .3 1.4 2517.5 3.0 1.3 3.1 2.4 2.9 2.1 2.9 .7 .9 3.7 2621.4 4.0 1.7 2.7 2.6 3.6 3.3 1.8 .4 1.4 4.4 2711.7 6.0 3.1 2.4 2.2 4.8 5.0 2.6 1.4 1.5 2.3 2817.0 8.0 5.4 3.8 5.5 2.9 1.4 1.3 7.4 3.0 4.5 2912.2 10.0 5.0 4.0 4.8 3.5 .8 (D) (D) 3.7 3.9 30
17.8 – .2 .4 .8 1.2 .8 .3 .3 .1 .8 31
21.1 – .1 .3 1.0 1.5 1.2 .5 .5 .1 1.2 329.1 1.0 .6 1.3 1.2 .6 .8 .9 .4 .3 .9 33
18.6 2.0 1.0 1.6 2.6 3.1 5.4 4.7 1.3 .9 5.1 347.1 1.0 1.0 1.8 1.7 1.3 1.4 .8 .8 .3 .6 359.3 2.0 1.5 1.9 2.0 2.0 1.3 .6 1.2 .5 1.0 369.7 2.0 1.0 1.9 1.3 1.7 .8 2.1 .9 .9 3.3 375.2 4.0 2.4 3.4 2.5 1.7 1.5 1.1 1.8 1.7 1.2 389.1 6.0 4.1 2.4 2.9 2.3 1.5 .9 2.2 5.2 3.3 39
13.3 6.0 7.5 5.2 .8 2.3 – .5 1.4 5.0 3.2 40
22.4 – .1 .2 .4 1.1 .8 .3 .2 – 1.0 41
24.0 – – .2 .4 1.4 .9 .4 .2 – 1.2 4212.5 – .6 .9 1.4 1.5 1.3 .7 .4 .2 1.7 4318.2 1.0 .5 2.3 2.7 5.6 5.4 1.1 1.5 .1 5.6 4411.8 – .3 1.3 1.6 2.1 1.6 1.5 .7 .3 2.0 4511.9 1.0 1.8 1.7 3.0 1.4 1.8 .6 .8 .2 1.5 4612.0 1.0 1.2 1.9 1.8 2.8 2.7 1.1 .4 .3 1.9 47
7.8 1.0 2.7 2.3 2.5 2.5 .8 1.5 2.9 .6 1.0 4811.2 2.0 2.5 3.5 1.3 3.8 .6 .8 1.6 1.8 3.0 49
4.6 2.0 6.2 3.4 1.4 2.4 .4 3.1 2.4 3.8 .8 50
22.5 – .1 .5 .5 1.1 .7 .3 .3 .1 1.1 51
25.8 – .1 .4 .7 1.3 .9 .4 .3 .1 1.4 529.8 – .4 1.2 1.2 1.1 .6 .5 .3 .2 1.0 539.8 – 1.3 3.6 3.3 7.6 4.6 2.7 .5 .3 3.1 54
10.7 – .6 1.6 1.5 1.8 .9 .4 .4 .3 1.7 558.6 – 1.3 2.0 1.7 2.8 .8 1.6 .6 .6 .8 568.5 1.0 1.8 2.6 2.4 2.1 1.3 .9 1.2 .7 1.1 578.3 1.0 1.5 1.6 2.1 1.6 1.0 2.1 1.3 1.1 1.3 586.9 1.0 2.8 1.9 1.4 1.9 .4 1.6 1.5 1.8 2.0 598.9 1.0 3.3 3.2 .6 1.0 1.0 1.4 1.6 2.8 2.4 60
1992 ECONOMIC CENSUS CHARACTERISTICS OF BUSINESS OWNERS 227
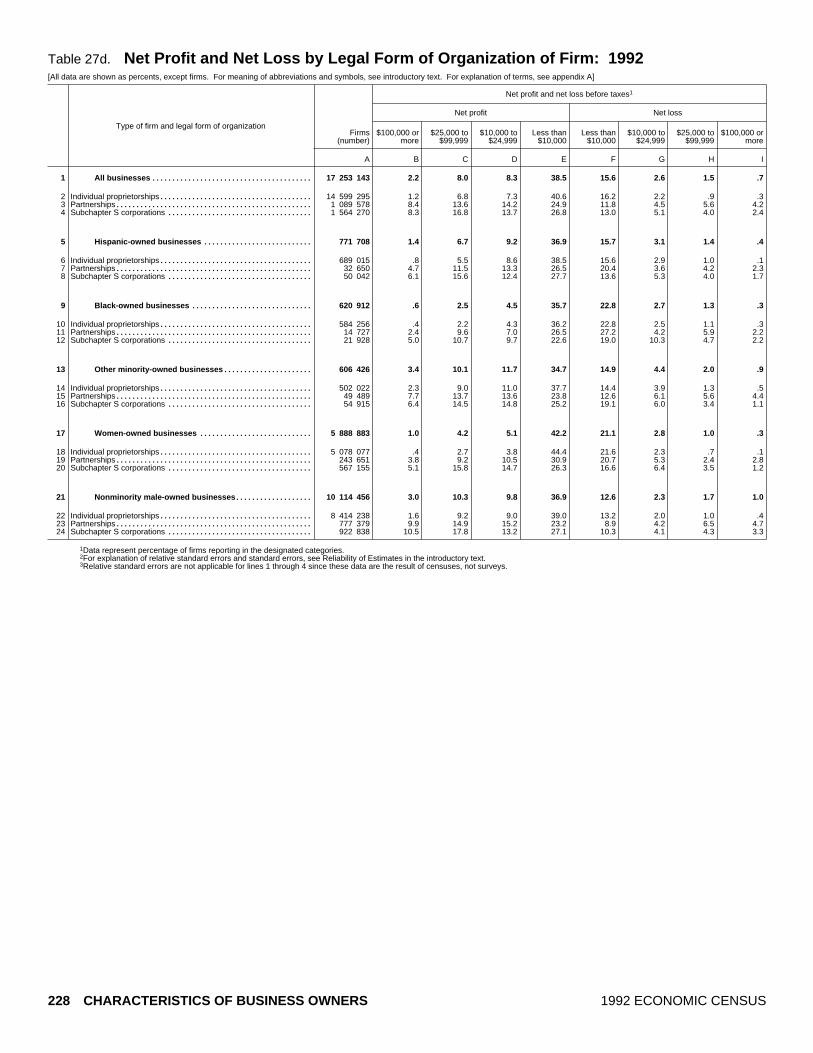
Table 27d. Net Profit and Net Loss by Legal Form of Organization of Firm: 1992[All data are shown as percents, except firms. For meaning of abbreviations and symbols, see introductory text. For explanation of terms, see appendix A]
Type of firm and legal form of organization
Net profit and net loss before taxes1
Net profit Net loss
Firms(number)
$100,000 ormore
$25,000 to$99,999
$10,000 to$24,999
Less than$10,000
Less than$10,000
$10,000 to$24,999
$25,000 to$99,999
$100,000 ormore
A B C D E F G H I
All businesses 17 253 143........................................ 2.2 8.0 8.3 38.5 15.6 2.6 1.5 .71
Individual proprietorships 14 599 295...................................... 1.2 6.8 7.3 40.6 16.2 2.2 .9 .32Partnerships 1 089 578................................................. 8.4 13.6 14.2 24.9 11.8 4.5 5.6 4.23Subchapter S corporations 1 564 270.................................... 8.3 16.8 13.7 26.8 13.0 5.1 4.0 2.44
Hispanic ~owned businesses 771 708........................... 1.4 6.7 9.2 36.9 15.7 3.1 1.4 .45
Individual proprietorships 689 015...................................... .8 5.5 8.6 38.5 15.6 2.9 1.0 .16Partnerships 32 650................................................. 4.7 11.5 13.3 26.5 20.4 3.6 4.2 2.37Subchapter S corporations 50 042.................................... 6.1 15.6 12.4 27.7 13.6 5.3 4.0 1.78
Black ~owned businesses 620 912.............................. .6 2.5 4.5 35.7 22.8 2.7 1.3 .39
Individual proprietorships 584 256...................................... .4 2.2 4.3 36.2 22.8 2.5 1.1 .310Partnerships 14 727................................................. 2.4 9.6 7.0 26.5 27.2 4.2 5.9 2.211Subchapter S corporations 21 928.................................... 5.0 10.7 9.7 22.6 19.0 10.3 4.7 2.212
Other minority ~owned businesses 606 426...................... 3.4 10.1 11.7 34.7 14.9 4.4 2.0 .913
Individual proprietorships 502 022...................................... 2.3 9.0 11.0 37.7 14.4 3.9 1.3 .514Partnerships 49 489................................................. 7.7 13.7 13.6 23.8 12.6 6.1 5.6 4.415Subchapter S corporations 54 915.................................... 6.4 14.5 14.8 25.2 19.1 6.0 3.4 1.116
Women ~owned businesses 5 888 883............................ 1.0 4.2 5.1 42.2 21.1 2.8 1.0 .317
Individual proprietorships 5 078 077...................................... .4 2.7 3.8 44.4 21.6 2.3 .7 .118Partnerships 243 651................................................. 3.8 9.2 10.5 30.9 20.7 5.3 2.4 2.819Subchapter S corporations 567 155.................................... 5.1 15.8 14.7 26.3 16.6 6.4 3.5 1.220
Nonminority male ~owned businesses 10 114 456................... 3.0 10.3 9.8 36.9 12.6 2.3 1.7 1.021
Individual proprietorships 8 414 238...................................... 1.6 9.2 9.0 39.0 13.2 2.0 1.0 .422Partnerships 777 379................................................. 9.9 14.9 15.2 23.2 8.9 4.2 6.5 4.723Subchapter S corporations 922 838.................................... 10.5 17.8 13.2 27.1 10.3 4.1 4.3 3.324
1Data represent percentage of firms reporting in the designated categories.2For explanation of relative standard errors and standard errors, see Reliability of Estimates in the introductory text.3Relative standard errors are not applicable for lines 1 through 4 since these data are the result of censuses, not surveys.
228 CHARACTERISTICS OF BUSINESS OWNERS 1992 ECONOMIC CENSUS

Standard error of estimate2 for columnm
Notreported
Relativestandard
error ofestimate2 3
J A B C D E F G H I J
22.5 (X) .1 .3 .3 .7 .6 .3 .2 .1 .6 1
24.5 (X) .1 .3 .3 .7 .7 .3 .1 .1 .6 212.9 (X) .7 .9 1.8 2.4 1.9 1.6 1.7 .4 2.4 3
9.9 (X) .4 .5 1.0 1.0 1.4 .6 .4 .2 1.3 4
25.2 – .1 .3 .5 1.1 1.0 .3 .2 – 1.1 5
27.0 – .1 .3 .6 1.2 1.2 .4 .2 – 1.2 613.6 2.0 .7 1.2 1.7 2.5 2.1 .9 1.2 .7 1.8 713.5 1.0 .4 .8 1.5 2.3 1.7 1.4 .7 .2 1.8 8
29.6 – – .2 .2 1.2 .5 .2 .1 .1 .8 9
30.2 – – .1 .2 1.2 .5 .1 .1 .1 .8 1015.0 3.0 .6 1.7 1.5 4.5 3.3 .8 1.9 .8 4.0 1115.8 2.0 .8 .9 1.7 2.5 2.4 2.6 1.2 .8 2.6 12
17.8 – .2 .4 .8 1.2 .8 .3 .3 .1 .8 13
19.9 – .2 .6 .8 1.1 .9 .4 .4 .1 1.1 1412.4 1.0 1.0 2.3 2.5 3.5 1.9 1.4 1.4 .8 1.4 15
9.5 1.0 .5 .9 1.5 1.8 1.4 1.5 .7 .1 1.0 16
22.4 – .1 .2 .4 1.1 .8 .3 .2 – 1.0 17
24.0 – .1 .2 .4 1.2 .9 .4 .2 – 1.1 1814.3 1.0 .6 1.5 3.0 2.4 3.3 1.8 1.2 .7 1.4 1910.4 – .3 1.5 1.7 1.4 2.0 1.3 .5 .1 1.1 20
22.5 – .1 .5 .5 1.1 .7 .3 .3 .1 1.1 21
24.6 – .1 .6 .5 1.1 .9 .4 .2 .2 1.1 2212.5 – .9 1.3 2.7 3.0 2.3 1.9 2.4 .5 3.3 23
9.3 – .6 .9 1.4 1.6 1.6 .8 .6 .4 2.1 24
1992 ECONOMIC CENSUS CHARACTERISTICS OF BUSINESS OWNERS 229

Table 28a. Percent of Women Employees by Industry Division: 1992[All data are shown as percents, except firms. For meaning of abbreviations and symbols, see introductory text. For explanation of terms, see appendix A]
Type of firm and industry division
Percent of women employees for pay period including March 121
Firms(number) None
Less than10 10 to 24 25 to 49 50 to 74 75 or more
Don’tknow
Notreported
A B C D E F G H I
All businesses 17 253 143........................................ 2.8 1.6 1.1 1.4 2.2 4.9 .2 2.11
Agricultural services, forestry, fishing, and mining 583 253................ 2.7 2.2 .7 .7 1.7 3.4 – 1.02Construction 1 829 620................................................. 8.7 3.8 1.8 .6 .3 .2 .2 4.63Manufacturing 517 714............................................... 6.1 5.2 4.3 3.4 3.2 3.5 .4 3.44Transportation, communications, and utilities 698 903.................... 4.1 2.6 1.2 1.1 1.5 1.5 .6 1.55Wholesale trade 538 339............................................. 5.2 4.1 4.2 5.4 4.3 3.2 .4 2.86
Retail trade 2 478 045.................................................. 3.1 1.9 2.2 2.9 5.1 7.9 .3 3.17Finance, insurance, and real estate 1 941 029............................. 1.0 .6 .2 1.4 2.3 3.5 .1 2.48Services 7 784 016.................................................... 1.6 .9 .6 .9 1.9 6.6 .1 1.49Industries not classified 882 224....................................... .2 .5 – .2 – – – –10
Hispanic ~owned businesses 771 708........................... 3.9 2.1 1.0 1.2 1.9 3.8 .2 2.211
Agricultural services, forestry, fishing, and mining 32 927................ 6.4 1.8 1.3 .9 .2 .5 .6 1.512Construction 97 476................................................. 11.4 3.8 1.3 .3 .3 .2 – 4.513Manufacturing 18 461............................................... 8.3 7.0 4.3 3.9 3.1 2.9 .1 3.214Transportation, communications, and utilities 47 797.................... 4.7 2.0 .6 .6 1.3 1.0 .2 2.515Wholesale trade 17 727............................................. 5.5 4.7 3.5 6.3 4.6 2.8 .3 4.416
Retail trade 107 846.................................................. 4.0 3.4 2.2 3.4 5.2 6.4 .5 3.017Finance, insurance, and real estate 49 231............................. 1.3 .8 .4 .4 1.4 4.2 .1 1.618Services 347 297.................................................... 2.2 1.3 .5 .7 1.6 5.3 .2 1.519Industries not classified 52 945....................................... .1 .2 – – – – – .220
Black ~owned businesses 620 912.............................. 1.6 1.0 .4 .4 .8 2.4 .1 1.721
Agricultural services, forestry, fishing, and mining 10 309................ 4.0 2.4 .4 .4 .1 1.1 .3 .922Construction 43 381................................................. 7.6 3.8 .4 .1 – – .1 4.123Manufacturing 10 469............................................... 6.3 1.9 .7 .3 .9 1.8 .1 1.324Transportation, communications, and utilities 49 095.................... 2.4 1.5 .6 .3 .2 .4 .1 1.725Wholesale trade 7 550............................................. 3.9 1.3 2.3 2.2 2.1 1.7 .1 1.126
Retail trade 86 840.................................................. 1.9 .8 .6 .6 1.6 2.8 .1 2.027Finance, insurance, and real estate 40 924............................. .1 .7 .1 .6 1.2 2.5 – .828Services 332 981.................................................... .7 .7 .4 .4 .9 3.1 .1 1.729Industries not classified 39 363....................................... .2 – – – – .3 – .130
Other minority ~owned businesses 606 426...................... 3.5 2.3 1.3 2.7 4.8 6.4 .2 2.731
Agricultural services, forestry, fishing, and mining 15 218................ 4.5 1.1 .5 .5 1.1 2.3 – 2.032Construction 28 295................................................. 9.8 6.1 2.5 .9 .5 .6 – 4.733Manufacturing 18 976............................................... 5.8 3.8 3.8 3.7 6.6 6.8 .3 3.834Transportation, communications, and utilities 24 362.................... 2.6 1.7 1.3 .6 .7 3.0 – 1.535Wholesale trade 20 043............................................. 5.4 4.0 3.1 6.9 5.5 2.9 .2 5.436
Retail trade 132 483.................................................. 6.3 3.9 2.6 6.9 9.0 6.9 .6 5.237Finance, insurance, and real estate 64 762............................. 1.2 .3 .3 .7 2.0 1.9 .3 2.038Services 273 774.................................................... 2.1 1.7 .7 1.5 4.7 9.2 .2 1.639Industries not classified 28 512....................................... – .1 – – – .1 – –40
Women ~owned businesses 5 888 883............................ 1.2 1.0 .6 .9 1.9 4.9 .1 1.641
Agricultural services, forestry, fishing, and mining 119 731................ 2.0 1.7 1.1 .8 1.1 3.7 .1 .842Construction 183 695................................................. 10.5 7.8 3.4 1.8 1.2 .7 .3 5.443Manufacturing 152 346............................................... 2.8 3.3 3.2 3.5 3.4 5.1 .2 2.844Transportation, communications, and utilities 141 623.................... 4.2 3.6 1.2 1.3 2.9 4.8 .2 2.845Wholesale trade 154 542............................................. 2.8 2.6 3.1 5.1 4.9 3.5 .3 3.246
Retail trade 1 093 342.................................................. 1.6 1.0 .9 1.7 4.0 8.1 .2 1.847Finance, insurance, and real estate 602 802............................. .3 .5 .2 .6 1.6 3.3 .1 1.648Services 3 158 444.................................................... .5 .4 .3 .4 1.1 5.0 .2 1.249Industries not classified 282 358....................................... .3 – – – – .1 – –50
Nonminority male ~owned businesses 10 114 456................... 3.6 2.0 1.4 1.6 2.4 5.0 .2 2.451
Agricultural services, forestry, fishing, and mining 412 917................ 2.6 2.4 .5 .7 2.0 3.7 – 1.052Construction 1 496 056................................................. 8.4 3.4 1.7 .4 .2 .2 .2 4.653Manufacturing 333 485............................................... 7.5 6.1 4.9 3.3 3.0 2.7 .5 3.654Transportation, communications, and utilities 458 400.................... 4.2 2.5 1.2 1.2 1.3 .6 .9 1.055Wholesale trade 352 721............................................. 6.1 4.7 4.7 5.6 4.0 3.2 .5 2.456
Retail trade 1 197 943.................................................. 4.2 2.5 3.4 3.8 6.0 8.0 .4 4.057Finance, insurance, and real estate 1 240 594............................. 1.4 .7 .2 1.8 2.6 3.7 .1 2.858Services 4 102 294.................................................... 2.4 1.2 .9 1.3 2.4 7.9 .1 1.459Industries not classified 520 046....................................... .1 .9 – .3 – – – –60
1Data represent percentage of firms reporting in the designated categories.2For explanation of relative standard errors and standard errors, see Reliability of Estimates in the introductory text.3Relative standard errors are not applicable for lines 1 through 10 since these data are the result of censuses, not surveys.
230 CHARACTERISTICS OF BUSINESS OWNERS 1992 ECONOMIC CENSUS

Standard error of estimate2 for columnm
No paidemployees
for pay period including
March 121
Relativestandard
error ofestimate2 3
J A B C D E F G H I J
83.6 (X) .1 .1 .1 .1 .1 .2 – .2 .4 1
87.5 (X) .4 .3 .1 .1 .3 .4 – .2 .5 279.7 (X) 1.4 .4 .3 .1 .1 .1 .1 .5 1.5 370.6 (X) .6 .4 .4 .4 .2 .4 .1 .6 1.1 486.0 (X) .7 .3 .1 .2 .4 .2 .4 .2 1.0 570.5 (X) .5 .4 .2 .3 .4 .6 .1 .3 1.0 6
73.3 (X) .4 .2 .3 .2 .3 .6 .1 .3 1.1 788.5 (X) .2 .4 – .2 .4 .4 – .3 .7 885.9 (X) .1 .2 .1 .1 .3 .4 – .2 .7 999.0 (X) .1 .5 – .2 – – – – .6 10
83.7 – .3 .2 .1 .1 .2 .3 .1 .2 .5 11
86.8 1.0 .7 .2 .3 .2 .1 .3 .2 .6 1.3 1278.3 1.0 1.0 .3 .2 .1 .1 .1 – 1.1 1.6 1367.2 1.0 .9 1.0 .8 .5 .7 .7 – .7 2.6 1487.0 1.0 .9 .5 .1 .2 .3 .3 .2 .7 1.1 1567.8 2.0 .9 .5 .5 .8 .8 .6 .1 1.0 1.8 16
72.0 1.0 .5 .4 .7 .5 .5 .7 .2 .4 1.3 1789.9 1.0 .3 .3 .1 .2 .3 .9 .1 .4 1.2 1886.6 – .4 .3 .1 .1 .3 .4 .1 .4 .6 1999.5 1.0 .1 .2 – – – – – .2 .3 20
91.6 – .1 .1 .1 .1 .1 .2 – .2 .2 21
90.3 1.0 .6 .6 .1 .2 .1 .3 .2 .4 .7 2283.7 – 1.0 .7 .1 .1 – – .1 .7 1.7 2386.7 1.0 .4 .6 .2 .1 .2 .9 – .4 .9 2492.8 – .5 .3 .3 .1 .1 .2 .1 .4 .4 2585.3 2.0 1.0 .4 .7 .6 .7 .6 – .5 1.5 26
89.8 – .4 .1 .1 .1 .2 .3 – .4 .5 2794.1 1.0 – .3 – .2 .4 .2 – .3 .6 2891.9 – .1 .1 .1 .1 .2 .3 – .4 .4 2999.3 – .1 – – – – .3 – .1 .3 30
76.2 – .3 .1 .1 .3 .2 .3 – .1 .5 31
88.1 1.0 .5 .4 .2 .2 .3 .5 – .6 1.3 3274.9 1.0 1.0 .8 .5 .3 .2 .5 – 1.2 2.1 3365.5 1.0 1.5 .6 1.0 .9 1.0 1.3 .1 .6 2.7 3488.7 1.0 1.0 .7 .4 .3 .2 .9 – .4 1.3 3566.6 1.0 .8 .6 .6 .5 1.3 .5 .1 1.3 2.2 36
58.7 1.0 1.0 .5 .3 1.1 .8 .5 .2 .7 1.7 3791.3 1.0 .5 .1 .2 .2 .3 .4 .1 .5 1.0 3878.3 – .3 .2 .2 .2 .7 .5 – .2 .8 3999.7 1.0 – .1 – – – – – – .2 40
87.7 – .1 .1 – .1 .1 .3 – .2 .5 41
88.6 – .6 .3 .3 .2 .2 .7 – .2 1.2 4269.0 – 1.1 1.1 .4 .4 .7 .2 .1 1.0 2.1 4375.8 – .6 .2 .2 .3 .3 .7 .1 .5 .9 4479.0 – .9 .8 .1 .2 .8 .6 .1 .6 1.6 4574.6 – .3 .4 .3 .4 .5 .4 .1 .5 1.1 46
80.7 – .5 .2 .1 .1 .4 .8 .1 .3 1.1 4791.8 – .2 .3 .1 .1 .3 .4 – .4 .5 4890.9 – .1 .1 .1 .1 .2 .5 .1 .3 .6 4999.6 – .2 – – – – – – – .2 50
81.4 – .2 .1 .1 .1 .2 .3 – .2 .6 51
87.1 – .6 .4 .1 .2 .4 .5 – .2 .6 5280.9 – 1.8 .4 .3 .1 .1 .1 .1 .6 1.9 5368.4 – 1.1 .6 .7 .6 .3 .4 .1 .7 2.1 5487.1 – .9 .4 .2 .3 .6 .2 .5 .1 1.2 5568.8 – .7 .7 .4 .5 .5 1.0 .1 .4 1.6 56
67.8 – .6 .4 .6 .6 .4 1.0 .1 .7 1.8 5786.8 – .3 .4 – .4 .6 .6 .1 .3 1.0 5882.5 – .2 .3 .2 .2 .4 .7 – .3 1.1 5998.6 – .1 .8 – .3 – – – – .9 60
1992 ECONOMIC CENSUS CHARACTERISTICS OF BUSINESS OWNERS 231

Table 28b. Percent of Women Employees by Receipts Size of Firm: 1992[All data are shown as percents, except firms. For meaning of abbreviations and symbols, see introductory text. For explanation of terms, see appendix A]
Type of firm and receipts size
Percent of women employees for pay period including March 121
Firms(number) None
Less than10 10 to 24 25 to 49 50 to 74 75 or more
Don’tknow
Notreported
A B C D E F G H I
All businesses 17 253 143........................................ 2.8 1.6 1.1 1.4 2.2 4.9 .2 2.11
Less than $5,000 5 226 553............................................ – .1 – – – – – –2$5,000 to $9,999 2 443 946............................................. – – – – .3 – .1 .13$10,000 to $24,999 3 076 410........................................... .2 .1 – – .1 1.1 – .44$25,000 to $49,999 1 945 806........................................... 2.7 .4 .1 – .5 1.4 – 1.95$50,000 to $99,999 1 615 940........................................... 5.2 1.7 .7 .9 2.5 11.5 .1 5.56
$100,000 to $199,999 1 197 996........................................ 12.0 4.1 2.3 3.4 7.1 17.5 .2 6.47$200,000 to $249,999 301 794........................................ 8.7 7.3 3.1 7.3 10.6 30.8 .8 4.18$250,000 to $499,999 682 583........................................ 12.4 8.2 5.9 7.5 9.9 23.2 .9 7.59$500,000 to $999,999 372 078........................................ 9.9 10.9 8.2 11.3 15.4 17.4 .9 5.410$1,000,000 or more 390 037.......................................... 5.7 15.5 17.2 15.8 17.6 10.6 2.6 11.711
Hispanic ~owned businesses 771 708........................... 3.9 2.1 1.0 1.2 1.9 3.8 .2 2.212
Less than $5,000 219 226............................................ – – – – – – – –13$5,000 to $9,999 140 362............................................. .1 – – – – – – –14$10,000 to $24,999 165 667........................................... .8 – – – .1 .3 .2 1.015$25,000 to $49,999 87 288........................................... 5.1 1.6 .4 .1 .6 3.3 .1 1.616$50,000 to $99,999 64 742........................................... 10.2 2.6 .4 1.4 2.4 5.9 .4 6.817
$100,000 to $199,999 41 578........................................ 13.1 5.6 3.4 2.5 5.7 16.8 .2 5.318$200,000 to $249,999 10 030........................................ 16.5 6.0 2.3 3.9 10.4 23.1 .5 5.419$250,000 to $499,999 22 301........................................ 13.4 11.1 5.8 8.0 11.5 19.1 .4 7.620$500,000 to $999,999 11 319........................................ 12.9 15.9 6.7 9.8 12.0 14.6 1.1 7.621$1,000,000 or more 9 194.......................................... 6.5 20.2 16.5 15.6 15.7 8.4 3.2 8.422
Black ~owned businesses 620 912.............................. 1.6 1.0 .4 .4 .8 2.4 .1 1.723
Less than $5,000 236 722............................................ – – – – – – – –24$5,000 to $9,999 111 512............................................. .1 – – – – – – –25$10,000 to $24,999 129 901........................................... .5 .5 – .2 .5 .5 – 1.326$25,000 to $49,999 62 209........................................... 3.6 1.9 1.0 .7 .8 3.9 – 5.027$50,000 to $99,999 39 218........................................... 5.6 3.6 1.0 .6 2.9 8.4 .3 7.028
$100,000 to $199,999 20 936........................................ 12.0 7.2 2.5 2.4 4.6 17.9 .4 6.829$200,000 to $249,999 4 533........................................ 15.9 3.1 2.7 4.0 6.4 30.7 .2 6.530$250,000 to $499,999 9 029........................................ 13.5 8.0 6.6 4.2 9.7 27.9 .7 7.231$500,000 to $999,999 3 823........................................ 8.1 14.1 5.3 10.1 11.7 23.6 1.3 8.932$1,000,000 or more 3 028.......................................... 2.3 12.9 14.0 15.9 20.0 15.3 4.6 9.733
Other minority ~owned businesses 606 426...................... 3.5 2.3 1.3 2.7 4.8 6.4 .2 2.734
Less than $5,000 132 493............................................ – – – – – .1 – –35$5,000 to $9,999 80 435............................................. – – – – – – – –36$10,000 to $24,999 108 195........................................... 1.0 – – – .8 .1 – .637$25,000 to $49,999 77 345........................................... 2.3 – .4 .1 2.4 .6 .1 .538$50,000 to $99,999 70 360........................................... 6.5 2.9 .2 .9 4.2 6.5 .2 2.939
$100,000 to $199,999 58 620........................................ 7.0 4.4 1.9 5.0 12.2 14.6 .5 7.940$200,000 to $249,999 15 740........................................ 6.5 5.0 2.6 7.8 14.2 27.8 .3 8.741$250,000 to $499,999 34 266........................................ 9.1 7.0 4.8 11.1 12.3 23.4 .5 5.642$500,000 to $999,999 16 467........................................ 8.5 8.1 5.6 13.4 14.8 22.4 1.0 5.643$1,000,000 or more 12 505.......................................... 6.4 14.6 13.3 15.8 17.0 13.0 2.3 13.144
Women ~owned businesses 5 888 883............................ 1.2 1.0 .6 .9 1.9 4.9 .1 1.645
Less than $5,000 2 310 303............................................ – – – – – – – –46$5,000 to $9,999 967 380............................................. – – – – – – – .147$10,000 to $24,999 1 051 358........................................... .3 – – – .3 1.2 .1 .348$25,000 to $49,999 538 885........................................... 2.1 .3 .1 – .6 3.5 – 3.949$50,000 to $99,999 381 517........................................... 2.9 2.0 .2 1.2 3.9 18.1 .5 6.450
$100,000 to $199,999 267 089........................................ 8.0 3.6 2.1 3.1 9.8 30.5 .6 5.051$200,000 to $249,999 66 464........................................ 3.8 7.0 1.1 4.7 16.8 34.7 1.1 6.152$250,000 to $499,999 146 313........................................ 6.8 8.6 5.4 9.7 13.1 30.7 .3 6.753$500,000 to $999,999 80 539........................................ 5.9 10.5 11.1 13.1 17.5 22.0 1.0 5.754$1,000,000 or more 79 037.......................................... 3.8 13.4 17.1 17.1 18.2 16.1 3.0 8.555
Nonminority male ~owned businesses 10 114 456................... 3.6 2.0 1.4 1.6 2.4 5.0 .2 2.456
Less than $5,000 2 608 047............................................ – .2 – – – – – –57$5,000 to $9,999 1 285 456............................................. – – – – .6 – .3 –58$10,000 to $24,999 1 763 830........................................... – .1 – – – 1.2 – .459$25,000 to $49,999 1 248 482........................................... 2.9 .4 – – .5 .6 – 1.160$50,000 to $99,999 1 108 065........................................... 5.7 1.5 .9 .8 1.9 10.0 – 5.261
$100,000 to $199,999 840 723........................................ 13.3 4.1 2.3 3.5 6.1 14.0 .1 6.762$200,000 to $249,999 212 693........................................ 9.9 7.6 4.0 8.4 8.2 30.4 .8 2.863$250,000 to $499,999 488 462........................................ 14.1 8.1 6.1 6.7 9.0 21.2 1.2 7.864$500,000 to $999,999 266 408........................................ 10.9 10.9 7.7 11.0 15.2 15.9 .8 5.165$1,000,000 or more 292 290.......................................... 6.1 16.0 17.4 15.6 17.6 9.2 2.5 12.566
1Data represent percentage of firms reporting in the designated categories.2For explanation of relative standard errors and standard errors, see Reliability of Estimates in the introductory text.3Relative standard errors are not applicable for lines 1 through 11 since these data are the result of censuses, not surveys.
232 CHARACTERISTICS OF BUSINESS OWNERS 1992 ECONOMIC CENSUS

Standard error of estimate2 for columnm
No paidemployees
for pay period including
March 121
Relativestandard
error ofestimate2 3
J A B C D E F G H I J
83.6 (X) .1 .1 .1 .1 .1 .2 – .2 .4 1
99.9 (X) – .1 – – – – – – .1 299.5 (X) – – – – .4 – .1 .1 .4 398.0 (X) .1 .1 – – .1 .7 – .2 .7 492.9 (X) .6 .2 – – .3 .4 – .5 .7 571.8 (X) .7 .4 .4 .3 .8 1.1 .1 .9 1.7 6
47.1 (X) .9 .5 .4 .8 .6 1.6 .1 .9 1.9 727.3 (X) 1.4 1.5 1.4 1.9 2.1 3.5 .6 1.1 2.3 824.4 (X) .9 .8 .8 .6 1.0 .8 .3 .9 1.1 920.4 (X) .7 .6 .6 .9 .7 1.1 .2 .5 1.1 10
3.3 (X) .4 .4 .7 .5 .7 .6 .3 .4 .3 11
83.7 – .3 .2 .1 .1 .2 .3 .1 .2 .5 12
100.0 1.0 – – – – – – – – – 1399.9 1.0 – – – – – – – – – 1497.4 1.0 .5 – – – .1 .3 .2 .6 .9 1587.0 1.0 1.4 1.1 .3 .1 .4 1.0 .2 .8 2.5 1669.9 1.0 1.4 .8 .2 .6 1.0 1.1 .2 1.5 2.3 17
47.4 1.0 2.0 1.3 1.0 .5 .7 1.7 .2 .9 1.9 1832.0 3.0 2.1 2.2 .8 1.1 1.9 4.5 .4 1.3 3.8 1923.2 2.0 1.3 1.4 1.1 .7 1.4 1.2 .2 1.0 1.5 2019.4 3.0 2.2 1.5 1.2 .8 1.1 1.0 .5 1.7 1.6 21
5.6 2.0 .9 1.2 .9 .7 1.1 .7 .7 1.1 1.1 22
91.6 – .1 .1 .1 .1 .1 .2 – .2 .2 23
100.0 – – – – – – – – – – 2499.9 – .1 – – – – – – – .1 2596.6 – .2 .3 – .1 .5 .2 – .5 .8 2683.0 – .7 .7 .7 .5 .5 1.0 – 1.5 1.5 2770.8 1.0 1.0 .6 .4 .4 .9 2.1 .2 .8 3.1 28
46.2 1.0 1.2 1.1 .5 .8 .8 1.1 .4 1.6 1.9 2930.5 3.0 3.2 1.2 1.9 1.7 3.2 3.5 .2 2.9 4.3 3022.2 3.0 2.0 1.4 .8 .6 2.0 2.2 .3 .5 1.3 3117.0 4.0 1.3 2.4 .9 2.1 2.1 3.2 .6 2.2 2.4 32
5.3 4.0 .4 1.2 1.8 2.0 1.6 1.8 1.6 1.8 1.1 33
76.2 – .3 .1 .1 .3 .2 .3 – .1 .5 34
99.9 1.0 – – – – – .1 – – .1 3599.9 1.0 – – – – – – – – – 3697.5 1.0 1.0 .1 – – .8 .1 – .5 1.6 3793.7 1.0 1.2 – .3 .1 1.1 .3 .1 .2 1.8 3875.6 1.0 1.4 .8 .2 .6 .9 1.7 .1 .5 1.1 39
46.4 1.0 1.1 1.3 .5 1.0 1.7 1.2 .3 1.0 1.9 4026.9 2.0 2.1 1.8 1.3 2.0 3.7 3.0 .2 2.0 3.1 4126.2 1.0 .8 .8 .5 1.2 1.5 1.3 .2 .7 1.6 4220.5 2.0 1.3 1.0 .4 1.5 1.5 1.1 .4 .7 1.0 43
4.5 2.0 1.0 1.6 1.0 2.0 1.6 1.5 .5 1.0 .5 44
87.7 – .1 .1 – .1 .1 .3 – .2 .5 45
99.9 – – – – – – – – – – 4699.8 – – – – – – – – .1 .1 4797.8 – .1 – – – .2 .9 .1 .1 1.0 4889.5 – .9 .1 .1 – .2 .7 – 1.8 2.2 4965.0 – .4 .5 .1 .4 .9 1.5 .3 1.5 2.5 50
37.4 – 1.6 .7 .7 .6 1.3 2.1 .5 1.0 1.4 5124.6 1.0 .4 2.2 .4 2.0 3.6 3.5 .9 2.0 3.2 5218.9 1.0 1.1 1.6 .8 1.0 1.0 2.6 .1 .6 1.3 5313.2 1.0 .5 .7 1.2 1.0 1.3 1.7 .4 .7 1.2 54
2.9 1.0 .4 .8 .8 1.0 1.2 .8 .7 .7 .3 55
81.4 – .2 .1 .1 .1 .2 .3 – .2 .6 56
99.8 – – .2 – – – – – – .2 5799.1 – – – – – .8 – .2 – .8 5898.2 – – .1 – – – 1.3 – .5 1.3 5994.6 – .9 .3 – – .3 .5 – .7 1.0 6073.9 – 1.2 .4 .6 .4 .9 1.6 – 1.1 2.2 61
49.9 – 1.3 .6 .6 1.1 .7 2.0 – 1.4 2.4 6227.9 – 2.1 1.7 2.1 2.3 2.7 5.3 .8 1.4 3.0 6325.7 – 1.3 .8 1.2 .8 1.3 1.2 .4 1.2 1.4 6422.5 – .9 .8 .6 1.2 1.1 1.4 .3 .6 1.4 65
3.2 – .7 .5 .8 .6 .7 .8 .4 .5 .4 66
1992 ECONOMIC CENSUS CHARACTERISTICS OF BUSINESS OWNERS 233

Table 28c. Percent of Women Employees by Employment Size of Firm: 1992[All data are shown as percents, except firms. For meaning of abbreviations and symbols, see introductory text. For explanation of terms, see appendix A]
Type of firm and employment size
Percent of women employees for pay period including March 121
Firms(number) None
Less than10 10 to 24 25 to 49 50 to 74 75 or more
Don’tknow
Notreported
A B C D E F G H I
All businesses 17 253 143........................................ 2.8 1.6 1.1 1.4 2.2 4.9 .2 2.11
With no paid employees 14 118 184....................................... (X) (X) (X) (X) (X) (X) (X) (X)2With paid employees 3 134 959......................................... 15.0 8.7 6.0 7.4 11.9 26.3 1.0 11.23
No employees4 435 838............................................ (X) (X) (X) (X) (X) (X) (X) (X)41 to 4 employees 1 716 076........................................... 22.9 8.2 3.7 6.3 11.7 31.3 .8 15.155 to 9 employees 503 808........................................... 9.6 12.3 10.9 10.3 14.3 34.2 .8 7.5610 to 19 employees 256 110........................................ 5.5 14.3 11.9 12.8 17.3 25.7 1.9 10.6720 to 49 employees 144 734........................................ 3.1 13.2 15.7 16.9 22.0 17.2 3.0 8.9850 to 99 employees 45 331........................................ 1.1 15.6 16.6 13.6 25.3 11.1 5.8 11.19100 employees or more 33 062..................................... .1 8.9 17.0 15.8 26.0 16.0 5.5 10.710
Hispanic ~owned businesses 771 708........................... 3.9 2.1 1.0 1.2 1.9 3.8 .2 2.211
With no paid employees 656 343....................................... (X) (X) (X) (X) (X) (X) (X) (X)12With paid employees 115 364......................................... 20.7 10.8 5.3 6.1 9.8 20.0 1.2 11.313
No employees4 19 569............................................ (X) (X) (X) (X) (X) (X) (X) (X)141 to 4 employees 64 631........................................... 31.5 11.0 2.6 4.5 9.2 23.5 1.3 16.3155 to 9 employees 16 937........................................... 13.8 13.8 13.5 10.7 14.3 26.8 .3 6.81610 to 19 employees 8 553........................................ 6.1 20.0 11.8 12.4 16.4 23.4 1.6 8.31720 to 49 employees 4 050........................................ 6.7 15.9 14.6 17.0 18.0 17.2 2.1 8.51850 to 99 employees 948........................................ 5.6 21.6 15.4 16.1 22.7 4.7 4.7 9.119100 employees or more 676..................................... – 8.7 13.0 17.4 26.4 10.8 18.2 5.520
Black ~owned businesses 620 912.............................. 1.6 1.0 .4 .4 .8 2.4 .1 1.721
With no paid employees 556 434....................................... (X) (X) (X) (X) (X) (X) (X) (X)22With paid employees 64 478......................................... 14.9 9.5 4.1 4.0 7.9 22.2 .7 16.023
No employees4 13 725............................................ (X) (X) (X) (X) (X) (X) (X) (X)241 to 4 employees 37 587........................................... 20.8 12.3 3.3 3.8 8.7 26.9 .6 23.6255 to 9 employees 7 853........................................... 15.7 11.0 11.8 6.5 12.6 32.5 .7 9.12610 to 19 employees 2 839........................................ 11.1 13.3 11.2 10.4 10.5 35.9 .3 7.42720 to 49 employees 1 700........................................ 3.5 10.4 9.2 13.1 17.8 27.5 5.6 12.92850 to 99 employees 432........................................ – 6.8 16.2 15.8 38.0 13.2 4.9 5.229100 employees or more 342..................................... – 3.2 8.5 22.8 24.0 22.8 11.9 6.830
Other minority ~owned businesses 606 426...................... 3.5 2.3 1.3 2.7 4.8 6.4 .2 2.731
With no paid employees 470 075....................................... (X) (X) (X) (X) (X) (X) (X) (X)32With paid employees 136 351......................................... 12.8 8.3 4.9 9.9 17.5 23.4 .9 9.933
No employees4 19 989............................................ (X) (X) (X) (X) (X) (X) (X) (X)341 to 4 employees 76 636........................................... 21.0 9.2 3.3 7.6 18.2 27.6 .6 12.5355 to 9 employees 22 862........................................... 4.6 10.1 8.1 15.8 23.2 29.0 1.3 7.83610 to 19 employees 10 051........................................ 2.4 10.7 11.7 20.4 21.5 24.0 1.2 8.13720 to 49 employees 5 034........................................ 1.4 8.8 10.3 20.8 25.4 19.2 1.3 12.83850 to 99 employees 1 075........................................ – 12.3 14.9 13.1 23.4 13.2 5.0 18.139100 employees or more 705..................................... – 7.1 5.3 14.5 25.5 13.4 14.3 19.940
Women ~owned businesses 5 888 883............................ 1.2 1.0 .6 .9 1.9 4.9 .1 1.641
With no paid employees 5 071 110....................................... (X) (X) (X) (X) (X) (X) (X) (X)42With paid employees 817 773......................................... 8.5 6.7 4.5 6.6 13.0 34.8 1.1 11.043
No employees4 127 905............................................ (X) (X) (X) (X) (X) (X) (X) (X)441 to 4 employees 435 550........................................... 13.4 6.4 2.1 5.4 13.7 41.6 .8 16.5455 to 9 employees 134 476........................................... 4.9 9.8 9.6 10.6 14.7 42.8 1.3 6.54610 to 19 employees 67 487........................................ 2.7 11.4 12.4 10.8 16.4 39.4 .8 6.14720 to 49 employees 35 515........................................ 1.1 10.0 11.5 15.4 28.6 22.4 5.0 6.04850 to 99 employees 10 178........................................ .6 13.5 14.0 15.8 25.1 20.3 3.8 6.949100 employees or more 6 663..................................... .3 7.2 11.8 14.5 20.4 33.8 6.7 5.350
Nonminority male ~owned businesses 10 114 456................... 3.6 2.0 1.4 1.6 2.4 5.0 .2 2.451
With no paid employees 8 019 462....................................... (X) (X) (X) (X) (X) (X) (X) (X)52With paid employees 2 094 993......................................... 17.1 9.3 6.7 7.8 11.6 23.8 1.0 11.253
No employees4 271 380............................................ (X) (X) (X) (X) (X) (X) (X) (X)541 to 4 employees 1 155 800........................................... 26.0 8.6 4.4 6.8 10.9 28.2 .8 14.4555 to 9 employees 334 483........................................... 11.2 13.1 11.5 9.9 13.8 32.0 .6 7.95610 to 19 employees 173 140........................................ 6.7 15.2 11.6 13.3 17.6 20.7 2.3 12.75720 to 49 employees 101 938........................................ 3.7 14.4 17.3 17.4 19.8 15.5 2.4 9.65850 to 99 employees 33 406........................................ 1.1 16.0 17.2 13.0 25.4 8.8 6.4 12.059100 employees or more 24 846..................................... – 9.5 19.3 15.9 27.8 11.0 4.4 12.060
1Data represent percentage of firms reporting in the designated categories.2For explanation of relative standard errors and standard errors, see Reliability of Estimates in the introductory text.3Relative standard errors are not applicable for lines 1 through 10 since these data are the result of censuses, not surveys.4Firms reported annual payroll, but did not report any employees on their payroll during specified period in 1992.
234 CHARACTERISTICS OF BUSINESS OWNERS 1992 ECONOMIC CENSUS
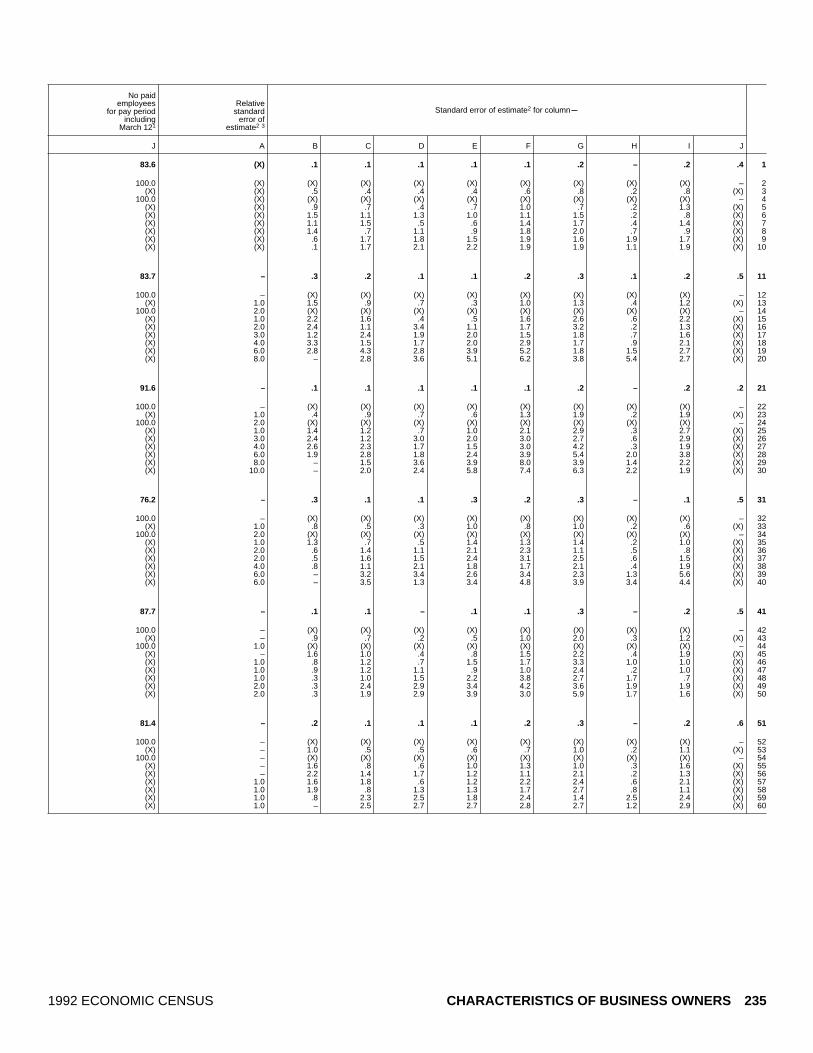
Standard error of estimate2 for columnm
No paidemployees
for pay period including
March 121
Relativestandard
error ofestimate2 3
J A B C D E F G H I J
83.6 (X) .1 .1 .1 .1 .1 .2 – .2 .4 1
100.0 (X) (X) (X) (X) (X) (X) (X) (X) (X) – 2(X) (X) .5 .4 .4 .4 .6 .8 .2 .8 (X) 3
100.0 (X) (X) (X) (X) (X) (X) (X) (X) (X) – 4(X) (X) .9 .7 .4 .7 1.0 .7 .2 1.3 (X) 5(X) (X) 1.5 1.1 1.3 1.0 1.1 1.5 .2 .8 (X) 6(X) (X) 1.1 1.5 .5 .6 1.4 1.7 .4 1.4 (X) 7(X) (X) 1.4 .7 1.1 .9 1.8 2.0 .7 .9 (X) 8(X) (X) .6 1.7 1.8 1.5 1.9 1.6 1.9 1.7 (X) 9(X) (X) .1 1.7 2.1 2.2 1.9 1.9 1.1 1.9 (X) 10
83.7 – .3 .2 .1 .1 .2 .3 .1 .2 .5 11
100.0 – (X) (X) (X) (X) (X) (X) (X) (X) – 12(X) 1.0 1.5 .9 .7 .3 1.0 1.3 .4 1.2 (X) 13
100.0 2.0 (X) (X) (X) (X) (X) (X) (X) (X) – 14(X) 1.0 2.2 1.6 .4 .5 1.6 2.6 .6 2.2 (X) 15(X) 2.0 2.4 1.1 3.4 1.1 1.7 3.2 .2 1.3 (X) 16(X) 3.0 1.2 2.4 1.9 2.0 1.5 1.8 .7 1.6 (X) 17(X) 4.0 3.3 1.5 1.7 2.0 2.9 1.7 .9 2.1 (X) 18(X) 6.0 2.8 4.3 2.8 3.9 5.2 1.8 1.5 2.7 (X) 19(X) 8.0 – 2.8 3.6 5.1 6.2 3.8 5.4 2.7 (X) 20
91.6 – .1 .1 .1 .1 .1 .2 – .2 .2 21
100.0 – (X) (X) (X) (X) (X) (X) (X) (X) – 22(X) 1.0 .4 .9 .7 .6 1.3 1.9 .2 1.9 (X) 23
100.0 2.0 (X) (X) (X) (X) (X) (X) (X) (X) – 24(X) 1.0 1.4 1.2 .7 1.0 2.1 2.9 .3 2.7 (X) 25(X) 3.0 2.4 1.2 3.0 2.0 3.0 2.7 .6 2.9 (X) 26(X) 4.0 2.6 2.3 1.7 1.5 3.0 4.2 .3 1.9 (X) 27(X) 6.0 1.9 2.8 1.8 2.4 3.9 5.4 2.0 3.8 (X) 28(X) 8.0 – 1.5 3.6 3.9 8.0 3.9 1.4 2.2 (X) 29(X) 10.0 – 2.0 2.4 5.8 7.4 6.3 2.2 1.9 (X) 30
76.2 – .3 .1 .1 .3 .2 .3 – .1 .5 31
100.0 – (X) (X) (X) (X) (X) (X) (X) (X) – 32(X) 1.0 .8 .5 .3 1.0 .8 1.0 .2 .6 (X) 33
100.0 2.0 (X) (X) (X) (X) (X) (X) (X) (X) – 34(X) 1.0 1.3 .7 .5 1.4 1.3 1.4 .2 1.0 (X) 35(X) 2.0 .6 1.4 1.1 2.1 2.3 1.1 .5 .8 (X) 36(X) 2.0 .5 1.6 1.5 2.4 3.1 2.5 .6 1.5 (X) 37(X) 4.0 .8 1.1 2.1 1.8 1.7 2.1 .4 1.9 (X) 38(X) 6.0 – 3.2 3.4 2.6 3.4 2.3 1.3 5.6 (X) 39(X) 6.0 – 3.5 1.3 3.4 4.8 3.9 3.4 4.4 (X) 40
87.7 – .1 .1 – .1 .1 .3 – .2 .5 41
100.0 – (X) (X) (X) (X) (X) (X) (X) (X) – 42(X) – .9 .7 .2 .5 1.0 2.0 .3 1.2 (X) 43
100.0 1.0 (X) (X) (X) (X) (X) (X) (X) (X) – 44(X) – 1.6 1.0 .4 .8 1.5 2.2 .4 1.9 (X) 45(X) 1.0 .8 1.2 .7 1.5 1.7 3.3 1.0 1.0 (X) 46(X) 1.0 .9 1.2 1.1 .9 1.0 2.4 .2 1.0 (X) 47(X) 1.0 .3 1.0 1.5 2.2 3.8 2.7 1.7 .7 (X) 48(X) 2.0 .3 2.4 2.9 3.4 4.2 3.6 1.9 1.9 (X) 49(X) 2.0 .3 1.9 2.9 3.9 3.0 5.9 1.7 1.6 (X) 50
81.4 – .2 .1 .1 .1 .2 .3 – .2 .6 51
100.0 – (X) (X) (X) (X) (X) (X) (X) (X) – 52(X) – 1.0 .5 .5 .6 .7 1.0 .2 1.1 (X) 53
100.0 – (X) (X) (X) (X) (X) (X) (X) (X) – 54(X) – 1.6 .8 .6 1.0 1.3 1.0 .3 1.6 (X) 55(X) – 2.2 1.4 1.7 1.2 1.1 2.1 .2 1.3 (X) 56(X) 1.0 1.6 1.8 .6 1.2 2.2 2.4 .6 2.1 (X) 57(X) 1.0 1.9 .8 1.3 1.3 1.7 2.7 .8 1.1 (X) 58(X) 1.0 .8 2.3 2.5 1.8 2.4 1.4 2.5 2.4 (X) 59(X) 1.0 – 2.5 2.7 2.7 2.8 2.7 1.2 2.9 (X) 60
1992 ECONOMIC CENSUS CHARACTERISTICS OF BUSINESS OWNERS 235

Table 28d. Percent of Women Employees by Legal Form of Organization of Firm: 1992[All data are shown as percents, except firms. For meaning of abbreviations and symbols, see introductory text. For explanation of terms, see appendix A]
Type of firm and legal form of organization
Percent of women employees for pay period including March 121
Firms(number) None
Less than10 10 to 24 25 to 49 50 to 74 75 or more
Don’tknow
Notreported
A B C D E F G H I
All businesses 17 253 143........................................ 2.8 1.6 1.1 1.4 2.2 4.9 .2 2.11
Individual proprietorships 14 599 295...................................... 2.1 .9 .5 .6 1.2 3.9 .1 1.52Partnerships 1 089 578................................................. 4.1 1.8 1.2 2.7 4.0 8.0 .3 4.63Subchapter S corporations 1 564 270.................................... 9.4 9.0 7.0 8.8 11.8 13.5 1.3 6.44
Hispanic ~owned businesses 771 708........................... 3.9 2.1 1.0 1.2 1.9 3.8 .2 2.25
Individual proprietorships 689 015...................................... 2.9 1.4 .5 .6 1.0 2.8 .2 1.66Partnerships 32 650................................................. 5.8 2.8 2.7 2.1 3.4 5.2 .5 5.27Subchapter S corporations 50 042.................................... 13.4 8.7 5.4 6.5 9.7 13.1 .6 6.28
Black ~owned businesses 620 912.............................. 1.6 1.0 .4 .4 .8 2.4 .1 1.79
Individual proprietorships 584 256...................................... 1.4 .8 .3 .2 .5 2.0 – 1.410Partnerships 14 727................................................. 3.8 4.1 .8 2.4 3.5 5.5 .6 4.411Subchapter S corporations 21 928.................................... 7.4 5.9 3.9 5.5 10.4 12.6 1.1 10.012
Other minority ~owned businesses 606 426...................... 3.5 2.3 1.3 2.7 4.8 6.4 .2 2.713
Individual proprietorships 502 022...................................... 2.1 1.3 .6 1.4 2.6 5.4 .1 1.914Partnerships 49 489................................................. 5.5 2.6 2.2 3.0 7.3 7.3 .9 4.715Subchapter S corporations 54 915.................................... 10.2 7.9 5.0 9.8 15.3 11.2 .6 6.116
Women ~owned businesses 5 888 883............................ 1.2 1.0 .6 .9 1.9 4.9 .1 1.617
Individual proprietorships 5 078 077...................................... .6 .3 .1 .2 .7 3.0 – 1.018Partnerships 243 651................................................. 2.1 1.7 .6 1.6 3.7 10.0 .3 4.019Subchapter S corporations 567 155.................................... 6.7 6.5 5.4 7.1 12.0 20.7 1.0 6.120
Nonminority male ~owned businesses 10 114 456................... 3.6 2.0 1.4 1.6 2.4 5.0 .2 2.421
Individual proprietorships 8 414 238...................................... 2.8 1.1 .7 .7 1.4 4.4 .1 1.822Partnerships 777 379................................................. 4.5 1.8 1.2 3.1 3.9 7.7 .3 4.623Subchapter S corporations 922 838.................................... 10.6 10.7 8.3 9.9 11.7 9.2 1.5 6.624
1Data represent percentage of firms reporting in the designated categories.2For explanation of relative standard errors and standard errors, see Reliability of Estimates in the introductory text.3Relative standard errors are not applicable for lines 1 through 4 since these data are the result of censuses, not surveys.
236 CHARACTERISTICS OF BUSINESS OWNERS 1992 ECONOMIC CENSUS

Standard error of estimate2 for columnm
No paidemployees
for pay period including
March 121
Relativestandard
error ofestimate2 3
J A B C D E F G H I J
83.6 (X) .1 .1 .1 .1 .1 .2 – .2 .4 1
89.4 (X) .1 .1 .1 .1 .1 .2 – .1 .3 273.2 (X) .4 .5 .2 .5 .4 .9 .1 .6 1.5 332.9 (X) .6 .6 .4 .6 1.0 .9 .2 .6 1.9 4
83.7 – .3 .2 .1 .1 .2 .3 .1 .2 .5 5
89.1 – .3 .2 .1 .1 .2 .3 .1 .2 .4 672.4 2.0 1.0 .7 .6 .4 .5 .9 .3 1.4 2.4 736.2 1.0 1.7 .5 .6 .5 .5 1.3 .1 .7 2.8 8
91.6 – .1 .1 .1 .1 .1 .2 – .2 .2 9
93.2 – – .1 .1 .1 .1 .2 – .2 .2 1074.9 3.0 .8 1.0 .3 1.1 1.1 1.7 .6 1.9 3.7 1143.2 2.0 1.0 .9 .4 .8 1.3 1.6 .4 2.3 3.2 12
76.2 – .3 .1 .1 .3 .2 .3 – .1 .5 13
84.6 – .3 .1 .1 .2 .2 .4 – .1 .4 1466.6 1.0 1.6 .7 .6 .5 1.1 1.4 .2 .7 3.3 1533.8 1.0 1.7 .6 .4 1.2 .7 1.2 .1 .9 2.4 16
87.7 – .1 .1 – .1 .1 .3 – .2 .5 17
94.0 – .1 .1 – – .1 .3 – .2 .4 1876.0 1.0 .7 .5 .2 .4 1.7 1.9 .1 1.9 3.0 1934.5 – .9 .7 .5 .8 1.0 1.4 .2 .7 2.9 20
81.4 – .2 .1 .1 .1 .2 .3 – .2 .6 21
87.0 – .1 .1 .1 .1 .2 .3 – .2 .6 2272.9 – .5 .6 .2 .7 .5 1.1 .1 .6 1.8 2331.5 – 1.0 1.2 .5 1.2 1.3 .9 .5 1.3 3.0 24
1992 ECONOMIC CENSUS CHARACTERISTICS OF BUSINESS OWNERS 237

Table 29a. Percent of Minority Employees by Industry Division: 1992[All data are shown as percents, except firms. For meaning of abbreviations and symbols, see introductory text. For explanation of terms, see appendix A]
Type of firm and industry division
Percent of minority employees for pay period including March 121
Firms(number) 25 or less 26 to 50 51 to 75 76 to 90
Morethan 90
Don’tknow
Notreported
A B C D E F G H
All businesses 17 253 143................................ 9.3 1.1 .6 .4 1.9 .9 2.31
Agricultural services, forestry, fishing, and mining 583 253........ 7.0 1.0 .1 .5 2.4 .4 1.12Construction 1 829 620........................................ 9.1 .9 .6 .5 3.0 1.2 5.13Manufacturing 517 714....................................... 16.2 2.2 1.2 1.2 2.9 2.4 3.34Transportation, communications, and utilities 698 903............ 7.4 .6 .4 .3 1.9 1.4 2.05Wholesale trade 538 339..................................... 17.6 1.9 1.1 .6 3.4 1.9 3.26
Retail trade 2 478 045......................................... 15.5 1.7 1.0 .6 2.9 1.3 3.67Finance, insurance, and real estate 1 941 029.................... 6.3 .5 .3 .1 .9 .8 2.68Services 7 784 016............................................ 8.6 1.1 .5 .3 1.5 .8 1.39Industries not classified 882 224............................... .2 .7 – – .1 – .110
Hispanic ~owned businesses 771 708................... 2.6 1.6 .9 .7 6.9 .9 2.611
Agricultural services, forestry, fishing, and mining 32 927........ 1.2 .7 .2 .5 8.3 .8 1.512Construction 97 476........................................ 2.3 1.3 1.5 1.1 9.0 1.4 5.213Manufacturing 18 461....................................... 5.4 2.7 2.3 2.6 13.7 2.7 3.514Transportation, communications, and utilities 47 797............ 1.8 1.6 .5 .3 5.1 1.0 2.615Wholesale trade 17 727..................................... 5.0 2.3 1.9 2.2 13.5 2.4 5.016
Retail trade 107 846......................................... 4.2 2.6 1.7 1.6 13.2 1.2 3.617Finance, insurance, and real estate 49 231.................... 2.2 1.2 .4 .3 3.3 .7 2.018Services 347 297............................................ 2.7 1.6 .7 .4 5.3 .7 2.019Industries not classified 52 945............................... .1 – – – .2 – .220
Black ~owned businesses 620 912...................... .8 .5 .3 .4 4.2 .3 1.921
Agricultural services, forestry, fishing, and mining 10 309........ .6 1.0 .6 .4 5.2 .1 1.722Construction 43 381........................................ .9 .8 .4 .8 8.2 .7 4.323Manufacturing 10 469....................................... 2.2 .2 .4 .5 7.1 1.0 1.924Transportation, communications, and utilities 49 095........... .4 .5 .1 .5 3.4 .3 2.025Wholesale trade 7 550..................................... 3.6 .8 1.0 .5 7.2 .2 1.426
Retail trade 86 840......................................... 1.2 .6 .2 .3 5.1 .6 2.227Finance, insurance, and real estate 40 924.................... 1.3 .5 .2 .4 2.0 .5 .928Services 332 981............................................ .8 .4 .3 .4 4.2 .3 1.829Industries not classified 39 363............................... – – – – .4 – .230
Other minority ~owned businesses 606 426............. 5.9 2.3 1.5 1.4 7.7 2.1 2.931
Agricultural services, forestry, fishing, and mining 15 218........ 2.7 1.3 .4 .5 4.5 .5 2.032Construction 28 295........................................ 6.8 1.8 1.0 1.7 4.6 3.8 5.433Manufacturing 18 976....................................... 5.6 2.3 2.7 3.1 13.6 3.4 3.834Transportation, communications, and utilities 24 362............ 3.7 .4 .4 1.0 3.8 .7 1.335Wholesale trade 20 043..................................... 6.6 2.1 2.0 1.8 12.8 3.0 5.036
Retail trade 132 483......................................... 7.8 3.7 2.6 2.3 15.1 4.2 5.637Finance, insurance, and real estate 64 762.................... 2.8 .6 .4 .4 1.4 1.0 2.238Services 273 774............................................ 6.6 2.7 1.5 1.3 6.5 1.4 1.839Industries not classified 28 512............................... .1 – – .1 .1 – –40
Women ~owned businesses 5 888 883.................... 7.1 .7 .4 .3 1.4 .7 1.741
Agricultural services, forestry, fishing, and mining 119 731........ 6.5 .4 .3 .7 1.9 .2 1.442Construction 183 695........................................ 17.3 1.8 .5 .7 3.5 1.6 5.543Manufacturing 152 346....................................... 12.3 1.9 .9 1.0 3.4 2.0 2.844Transportation, communications, and utilities 141 623............ 11.4 1.2 .5 .4 2.7 2.0 2.845Wholesale trade 154 542..................................... 14.1 2.0 1.0 .5 2.8 1.6 3.546
Retail trade 1 093 342......................................... 11.9 .8 .5 .4 2.4 .8 2.547Finance, insurance, and real estate 602 802.................... 4.4 .5 .1 .1 .5 .9 1.748Services 3 158 444............................................ 5.2 .6 .4 .2 .9 .5 1.249Industries not classified 282 358............................... .3 – – – – – –50
Nonminority male ~owned businesses 10 114 456.......... 11.4 1.3 .6 .3 1.5 1.0 2.551
Agricultural services, forestry, fishing, and mining 412 917........ 7.8 1.2 .1 .4 2.0 .4 1.052Construction 1 496 056........................................ 8.9 .7 .5 .4 2.4 1.1 5.153Manufacturing 333 485....................................... 19.0 2.3 1.3 1.1 1.9 2.5 3.554Transportation, communications, and utilities 458 400............ 7.6 .4 .4 .2 1.2 1.3 1.755Wholesale trade 352 721..................................... 20.1 1.8 1.1 .5 2.9 1.9 3.056
Retail trade 1 197 943......................................... 20.4 2.3 1.2 .6 1.8 1.4 4.457Finance, insurance, and real estate 1 240 594.................... 7.5 .4 .4 .1 1.0 .7 3.158Services 4 102 294............................................ 11.7 1.4 .5 .3 1.3 .9 1.359Industries not classified 520 046............................... .1 1.1 – – – – –60
1Data represent percentage of firms reporting in the designated categories.2For explanation of relative standard errors and standard errors, see Reliability of Estimates in the introductory text.3Relative standard errors are not applicable for lines 1 through 10 since these data are the result of censuses, not surveys.
238 CHARACTERISTICS OF BUSINESS OWNERS 1992 ECONOMIC CENSUS

Standard error of estimate2 for columnmNo paid employees forpay period including
March 121
Relativestandard
error ofestimate2 3
I A B C D E F G H I
83.6 (X) .4 .1 .1 – .1 .1 .2 .4 1
87.5 (X) .5 .2 – .3 .3 .1 .2 .5 279.7 (X) 1.4 .2 .2 .1 .5 .3 .6 1.5 370.6 (X) .8 .6 .1 .1 .4 .3 .6 1.1 486.0 (X) .6 .1 .1 .1 .3 .4 .5 1.0 570.5 (X) .7 .2 .1 .1 .1 .2 .4 1.0 6
73.3 (X) .9 .1 .1 .1 .2 .1 .4 1.1 788.5 (X) .6 .1 .1 – .2 .2 .3 .7 885.9 (X) .5 .2 .1 .1 .2 .2 .2 .7 999.0 (X) .1 .5 – – – – – .6 10
83.7 – .2 .2 .1 .1 .2 .1 .3 .5 11
86.8 1.0 .3 .2 .1 .3 .8 .3 .5 1.3 1278.3 1.0 .4 .4 .3 .4 .7 .3 1.3 1.6 1367.2 1.0 1.4 .6 .4 .5 1.3 .6 .8 2.6 1487.0 1.0 .5 .6 .2 .1 1.1 .3 .7 1.1 1567.8 2.0 .7 .6 .5 .4 1.1 .4 .9 1.8 16
72.0 1.0 .6 .4 .3 .2 1.0 .2 .5 1.3 1789.9 1.0 .6 .3 .2 .1 .5 .4 .3 1.2 1886.6 – .4 .3 .1 .1 .4 .2 .5 .6 1999.5 1.0 .1 – – – .2 – .2 .3 20
91.6 – .1 .1 – .1 .2 .1 .2 .2 21
90.3 1.0 .3 .3 .3 .2 .7 – .6 .7 2283.7 – .2 .3 .2 .3 .9 .3 .8 1.7 2386.7 1.0 .7 .1 .1 .1 .9 .3 .5 .9 2492.8 – .2 .2 .1 .2 .5 .1 .4 .4 2585.3 2.0 .8 .1 .3 .1 1.0 .1 .8 1.5 26
89.8 – .2 .2 .1 .1 .4 .2 .4 .5 2794.1 1.0 .2 .1 .1 .1 .4 .3 .3 .6 2891.9 – .2 .1 .1 .1 .4 .1 .4 .4 2999.3 – – – – – .3 – .1 .3 30
76.2 – .3 .1 .1 .1 .4 .3 .2 .5 31
88.1 1.0 .5 .3 .1 .2 .4 .3 .6 1.3 3274.9 1.0 .8 .4 .4 .5 .8 .8 1.4 2.1 3365.5 1.0 1.2 .5 .6 .9 2.2 .7 .6 2.7 3488.7 1.0 .7 .2 .1 .4 1.0 .3 .4 1.3 3566.6 1.0 .5 .3 .2 .3 1.7 .6 1.2 2.2 36
58.7 1.0 1.2 .6 .5 .5 .9 .8 .6 1.7 3791.3 1.0 .4 .2 .1 .2 .4 .2 .6 1.0 3878.3 – .4 .3 .2 .2 .6 .4 .2 .8 3999.7 1.0 – – – .1 – – – .2 40
87.7 – .3 .1 .1 – .1 .1 .2 .5 41
88.6 – .9 .1 .1 .3 .6 .1 .6 1.2 4269.0 – 1.2 .5 .1 .1 1.0 .3 1.1 2.1 4375.8 – .7 .3 .1 .2 .6 .4 .5 .9 4479.0 – 1.1 .3 .2 .1 .7 .7 .5 1.6 4574.6 – .6 .4 .2 .1 .3 .3 .5 1.1 46
80.7 – .6 .2 .1 .1 .3 .2 .4 1.1 4791.8 – .5 .4 .1 – .1 .4 .4 .5 4890.9 – .4 .1 .1 .1 .1 .1 .3 .6 4999.6 – .2 – – – – – – .2 50
81.4 – .6 .1 .1 .1 .2 .1 .3 .6 51
87.1 – .7 .3 – .3 .3 .1 .2 .6 5280.9 – 1.7 .2 .2 .1 .6 .3 .7 1.9 5368.4 – 1.8 .9 .2 .2 .4 .5 .8 2.1 5487.1 – 1.0 .1 .2 .1 .3 .5 .6 1.2 5568.8 – 1.2 .3 .1 .1 .3 .3 .5 1.6 56
67.8 – 1.4 .3 .2 .2 .3 .2 .8 1.8 5786.8 – .8 .1 .2 .1 .3 .3 .5 1.0 5882.5 – 1.0 .3 .1 .1 .3 .3 .3 1.1 5998.6 – .1 .9 – – – – – .9 60
1992 ECONOMIC CENSUS CHARACTERISTICS OF BUSINESS OWNERS 239

Table 29b. Percent of Minority Employees by Receipts Size of Firm: 1992[All data are shown as percents, except firms. For meaning of abbreviations and symbols, see introductory text. For explanation of terms, see appendix A]
Type of firm and receipts size
Percent of minority employees for pay period including March 121
Firms(number) 25 or less 26 to 50 51 to 75 76 to 90
Morethan 90
Don’tknow
Notreported
A B C D E F G H
All businesses 17 253 143................................ 9.3 1.1 .6 .4 1.9 .9 2.31
Less than $5,000 5 226 553.................................... – .1 – – – – –2$5,000 to $9,999 2 443 946.................................... .3 – – – – .1 .13$10,000 to $24,999 3 076 410.................................. 1.1 – – – .3 .1 .44$25,000 to $49,999 1 945 806.................................. 3.1 .2 – .2 1.3 .1 2.25$50,000 to $99,999 1 615 940.................................. 16.4 1.4 .2 .1 3.2 1.2 5.76
$100,000 to $199,999 1 197 996................................ 30.9 3.4 1.5 .9 6.2 2.8 7.27$200,000 to $249,999 301 794................................ 47.2 4.2 3.0 1.7 8.2 3.4 4.98$250,000 to $499,999 682 583................................ 44.5 5.1 3.3 1.9 9.1 3.9 7.99$500,000 to $999,999 372 078................................ 46.9 6.6 4.9 2.3 8.1 4.9 5.810$1,000,000 or more 390 037.................................. 48.1 9.7 5.2 4.0 7.5 10.2 12.011
Hispanic ~owned businesses 771 708................... 2.6 1.6 .9 .7 6.9 .9 2.612
Less than $5,000 219 226.................................... – – – – – – –13$5,000 to $9,999 140 362.................................... – – – – – .1 –14$10,000 to $24,999 165 667.................................. .5 .1 – – .7 .2 1.015$25,000 to $49,999 87 288.................................. 1.9 .8 .1 .2 7.3 .4 2.516$50,000 to $99,999 64 742.................................. 3.9 2.9 1.0 .5 11.6 1.2 9.017
$100,000 to $199,999 41 578................................ 7.3 4.9 2.9 1.9 25.3 3.4 6.818$200,000 to $249,999 10 030................................ 10.9 9.8 2.9 2.4 30.3 4.8 6.919$250,000 to $499,999 22 301................................ 17.6 8.6 6.4 4.7 28.5 3.8 7.220$500,000 to $999,999 11 319................................ 11.0 8.7 7.8 5.5 35.6 4.2 7.921$1,000,000 or more 9 194.................................. 17.0 8.7 8.6 10.0 33.3 8.0 8.822
Black ~owned businesses 620 912...................... .8 .5 .3 .4 4.2 .3 1.923
Less than $5,000 236 722.................................... – – – – – – –24$5,000 to $9,999 111 512.................................... – – – – .1 – –25$10,000 to $24,999 129 901.................................. .2 – – – 1.8 – 1.326$25,000 to $49,999 62 209.................................. 1.3 1.1 – .6 8.3 .4 5.227$50,000 to $99,999 39 218.................................. 2.1 1.1 .7 1.6 13.7 1.8 8.328
$100,000 to $199,999 20 936................................ 4.6 2.8 2.5 1.9 32.7 1.5 7.829$200,000 to $249,999 4 533................................ 15.2 4.3 2.6 3.7 33.7 3.3 6.630$250,000 to $499,999 9 029................................ 10.3 6.3 4.4 5.8 37.2 5.2 8.531$500,000 to $999,999 3 823................................ 13.0 8.8 4.2 5.4 36.8 3.6 11.332$1,000,000 or more 3 028.................................. 18.7 9.3 8.4 10.9 28.7 8.4 10.433
Other minority ~owned businesses 606 426............. 5.9 2.3 1.5 1.4 7.7 2.1 2.934
Less than $5,000 132 493.................................... – – – – .1 – –35$5,000 to $9,999 80 435.................................... .1 – – – – – –36$10,000 to $24,999 108 195.................................. .9 – – – 1.0 – .637$25,000 to $49,999 77 345.................................. 1.1 – .9 – 3.0 .8 .538$50,000 to $99,999 70 360.................................. 5.1 1.1 .4 .3 10.9 3.2 3.439
$100,000 to $199,999 58 620................................ 13.6 5.4 1.6 4.2 15.8 4.6 8.440$200,000 to $249,999 15 740................................ 17.1 8.9 8.3 2.1 21.4 4.9 10.341$250,000 to $499,999 34 266................................ 18.5 9.6 5.9 5.3 23.8 4.7 6.142$500,000 to $999,999 16 467................................ 22.7 8.6 5.8 7.0 23.3 6.2 6.143$1,000,000 or more 12 505.................................. 24.0 9.7 9.2 7.1 22.6 9.9 13.044
Women ~owned businesses 5 888 883.................... 7.1 .7 .4 .3 1.4 .7 1.745
Less than $5,000 2 310 303.................................... – – – – – – –46$5,000 to $9,999 967 380.................................... – – – – – – .147$10,000 to $24,999 1 051 358.................................. 1.4 – – – .3 .2 .348$25,000 to $49,999 538 885.................................. 4.3 .2 .2 – 1.1 .1 4.649$50,000 to $99,999 381 517.................................. 20.2 1.1 .5 .2 4.1 2.4 6.550
$100,000 to $199,999 267 089................................ 39.1 3.8 2.6 1.5 8.0 2.3 5.351$200,000 to $249,999 66 464................................ 50.1 2.6 .9 .7 7.6 4.6 9.052$250,000 to $499,999 146 313................................ 50.2 6.4 2.6 2.4 8.2 4.4 7.153$500,000 to $999,999 80 539................................ 51.2 8.2 4.3 3.0 8.4 6.0 5.754$1,000,000 or more 79 037.................................. 47.5 9.4 6.4 4.8 8.9 11.1 9.155
Nonminority male ~owned businesses 10 114 456.......... 11.4 1.3 .6 .3 1.5 1.0 2.556
Less than $5,000 2 608 047.................................... – .2 – – – – –57$5,000 to $9,999 1 285 456.................................... .6 – – – – .3 –58$10,000 to $24,999 1 763 830.................................. 1.1 – – – .3 – .459$25,000 to $49,999 1 248 482.................................. 2.8 .2 – .3 .8 – 1.360$50,000 to $99,999 1 108 065.................................. 16.7 1.4 – – 2.0 .7 5.361
$100,000 to $199,999 840 723................................ 31.0 3.2 1.1 .5 3.8 2.8 7.762$200,000 to $249,999 212 693................................ 51.1 4.0 3.4 2.0 5.9 2.8 2.863$250,000 to $499,999 488 462................................ 46.1 4.4 3.2 1.4 7.4 3.6 8.264$500,000 to $999,999 266 408................................ 49.1 6.0 4.8 1.8 5.7 4.5 5.665$1,000,000 or more 292 290.................................. 50.6 9.8 4.7 3.4 5.5 10.2 12.766
1Data represent percentage of firms reporting in the designated categories.2For explanation of relative standard errors and standard errors, see Reliability of Estimates in the introductory text.3Relative standard errors are not applicable for lines 1 through 11 since these data are the result of censuses, not surveys.
240 CHARACTERISTICS OF BUSINESS OWNERS 1992 ECONOMIC CENSUS
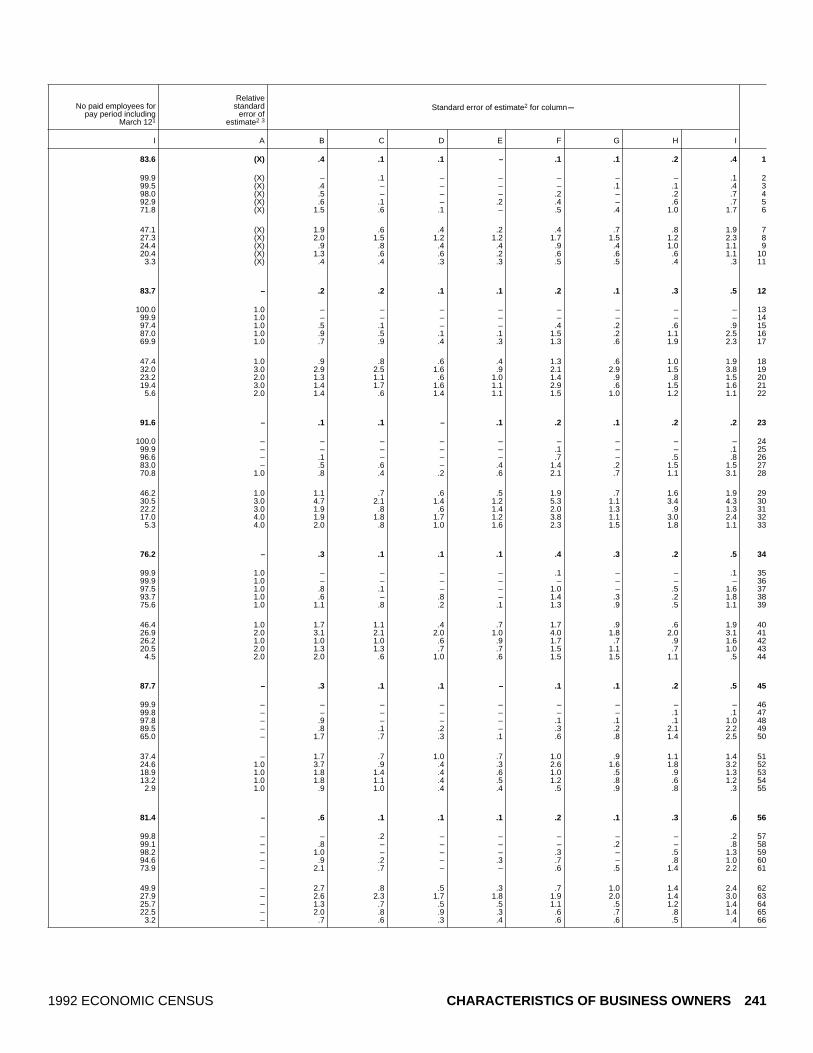
Standard error of estimate2 for columnmNo paid employees forpay period including
March 121
Relativestandard
error ofestimate2 3
I A B C D E F G H I
83.6 (X) .4 .1 .1 – .1 .1 .2 .4 1
99.9 (X) – .1 – – – – – .1 299.5 (X) .4 – – – – .1 .1 .4 398.0 (X) .5 – – – .2 – .2 .7 492.9 (X) .6 .1 – .2 .4 – .6 .7 571.8 (X) 1.5 .6 .1 – .5 .4 1.0 1.7 6
47.1 (X) 1.9 .6 .4 .2 .4 .7 .8 1.9 727.3 (X) 2.0 1.5 1.2 1.2 1.7 1.5 1.2 2.3 824.4 (X) .9 .8 .4 .4 .9 .4 1.0 1.1 920.4 (X) 1.3 .6 .6 .2 .6 .6 .6 1.1 10
3.3 (X) .4 .4 .3 .3 .5 .5 .4 .3 11
83.7 – .2 .2 .1 .1 .2 .1 .3 .5 12
100.0 1.0 – – – – – – – – 1399.9 1.0 – – – – – – – – 1497.4 1.0 .5 .1 – – .4 .2 .6 .9 1587.0 1.0 .9 .5 .1 .1 1.5 .2 1.1 2.5 1669.9 1.0 .7 .9 .4 .3 1.3 .6 1.9 2.3 17
47.4 1.0 .9 .8 .6 .4 1.3 .6 1.0 1.9 1832.0 3.0 2.9 2.5 1.6 .9 2.1 2.9 1.5 3.8 1923.2 2.0 1.3 1.1 .6 1.0 1.4 .9 .8 1.5 2019.4 3.0 1.4 1.7 1.6 1.1 2.9 .6 1.5 1.6 21
5.6 2.0 1.4 .6 1.4 1.1 1.5 1.0 1.2 1.1 22
91.6 – .1 .1 – .1 .2 .1 .2 .2 23
100.0 – – – – – – – – – 2499.9 – – – – – .1 – – .1 2596.6 – .1 – – – .7 – .5 .8 2683.0 – .5 .6 – .4 1.4 .2 1.5 1.5 2770.8 1.0 .8 .4 .2 .6 2.1 .7 1.1 3.1 28
46.2 1.0 1.1 .7 .6 .5 1.9 .7 1.6 1.9 2930.5 3.0 4.7 2.1 1.4 1.2 5.3 1.1 3.4 4.3 3022.2 3.0 1.9 .8 .6 1.4 2.0 1.3 .9 1.3 3117.0 4.0 1.9 1.8 1.7 1.2 3.8 1.1 3.0 2.4 32
5.3 4.0 2.0 .8 1.0 1.6 2.3 1.5 1.8 1.1 33
76.2 – .3 .1 .1 .1 .4 .3 .2 .5 34
99.9 1.0 – – – – .1 – – .1 3599.9 1.0 – – – – – – – – 3697.5 1.0 .8 .1 – – 1.0 – .5 1.6 3793.7 1.0 .6 – .8 – 1.4 .3 .2 1.8 3875.6 1.0 1.1 .8 .2 .1 1.3 .9 .5 1.1 39
46.4 1.0 1.7 1.1 .4 .7 1.7 .9 .6 1.9 4026.9 2.0 3.1 2.1 2.0 1.0 4.0 1.8 2.0 3.1 4126.2 1.0 1.0 1.0 .6 .9 1.7 .7 .9 1.6 4220.5 2.0 1.3 1.3 .7 .7 1.5 1.1 .7 1.0 43
4.5 2.0 2.0 .6 1.0 .6 1.5 1.5 1.1 .5 44
87.7 – .3 .1 .1 – .1 .1 .2 .5 45
99.9 – – – – – – – – – 4699.8 – – – – – – – .1 .1 4797.8 – .9 – – – .1 .1 .1 1.0 4889.5 – .8 .1 .2 – .3 .2 2.1 2.2 4965.0 – 1.7 .7 .3 .1 .6 .8 1.4 2.5 50
37.4 – 1.7 .7 1.0 .7 1.0 .9 1.1 1.4 5124.6 1.0 3.7 .9 .4 .3 2.6 1.6 1.8 3.2 5218.9 1.0 1.8 1.4 .4 .6 1.0 .5 .9 1.3 5313.2 1.0 1.8 1.1 .4 .5 1.2 .8 .6 1.2 54
2.9 1.0 .9 1.0 .4 .4 .5 .9 .8 .3 55
81.4 – .6 .1 .1 .1 .2 .1 .3 .6 56
99.8 – – .2 – – – – – .2 5799.1 – .8 – – – – .2 – .8 5898.2 – 1.0 – – – .3 – .5 1.3 5994.6 – .9 .2 – .3 .7 – .8 1.0 6073.9 – 2.1 .7 – – .6 .5 1.4 2.2 61
49.9 – 2.7 .8 .5 .3 .7 1.0 1.4 2.4 6227.9 – 2.6 2.3 1.7 1.8 1.9 2.0 1.4 3.0 6325.7 – 1.3 .7 .5 .5 1.1 .5 1.2 1.4 6422.5 – 2.0 .8 .9 .3 .6 .7 .8 1.4 65
3.2 – .7 .6 .3 .4 .6 .6 .5 .4 66
1992 ECONOMIC CENSUS CHARACTERISTICS OF BUSINESS OWNERS 241

Table 29c. Percent of Minority Employees by Employment Size of Firm: 1992[All data are shown as percents, except firms. For meaning of abbreviations and symbols, see introductory text. For explanation of terms, see appendix A]
Type of firm and employment size
Percent of minority employees for pay period including March 121
Firms(number) 25 or less 26 to 50 51 to 75 76 to 90
Morethan 90
Don’tknow
Notreported
A B C D E F G H
All businesses 17 253 143................................ 9.3 1.1 .6 .4 1.9 .9 2.31
With no paid employees 14 118 184.............................. (X) (X) (X) (X) (X) (X) (X)2With paid employees 3 134 959................................. 49.8 5.9 2.9 1.9 10.0 5.0 12.13
No employees4 435 838.................................... (X) (X) (X) (X) (X) (X) (X)41 to 4 employees 1 716 076.................................. 57.1 5.6 2.1 1.3 12.7 4.7 16.555 to 9 employees 503 808.................................. 61.9 5.9 4.4 3.3 10.2 5.8 8.5610 to 19 employees 256 110................................ 55.6 10.6 5.8 2.6 8.4 6.8 10.2720 to 49 employees 144 734................................ 47.9 11.3 8.4 5.6 8.3 9.2 9.3850 to 99 employees 45 331................................ 37.6 14.7 6.0 5.5 8.2 16.8 11.29100 employees or more 33 062............................ 39.5 17.7 6.0 4.2 4.3 17.9 10.410
Hispanic ~owned businesses 771 708................... 2.6 1.6 .9 .7 6.9 .9 2.611
With no paid employees 656 343.............................. (X) (X) (X) (X) (X) (X) (X)12With paid employees 115 364................................. 13.8 8.2 4.8 3.7 36.0 4.8 13.813
No employees4 19 569.................................... (X) (X) (X) (X) (X) (X) (X)141 to 4 employees 64 631.................................. 15.3 8.5 3.8 2.4 44.6 5.0 20.4155 to 9 employees 16 937.................................. 20.6 12.5 7.5 7.3 38.7 6.3 7.11610 to 19 employees 8 553................................ 13.9 11.6 12.5 7.5 39.0 6.1 9.41720 to 49 employees 4 050................................ 18.0 9.6 9.2 10.5 37.1 7.9 7.71850 to 99 employees 948................................ 9.9 10.7 7.9 19.6 35.2 8.8 7.919100 employees or more 676............................ 22.0 17.3 11.8 8.1 18.9 15.7 6.120
Black ~owned businesses 620 912...................... .8 .5 .3 .4 4.2 .3 1.921
With no paid employees 556 434.............................. (X) (X) (X) (X) (X) (X) (X)22With paid employees 64 478................................. 7.9 4.4 2.5 3.9 39.9 3.3 17.423
No employees4 13 725.................................... (X) (X) (X) (X) (X) (X) (X)241 to 4 employees 37 587.................................. 9.2 4.3 2.1 3.3 51.3 4.1 25.7255 to 9 employees 7 853.................................. 13.2 9.2 7.1 6.5 51.2 3.6 9.42610 to 19 employees 2 839................................ 9.3 9.9 3.7 17.6 47.1 2.0 10.32720 to 49 employees 1 700................................ 12.8 10.7 7.6 11.4 33.9 10.4 13.12850 to 99 employees 432................................ 15.5 16.5 8.0 11.2 38.9 4.7 5.229100 employees or more 342............................ 20.0 9.0 7.8 17.9 23.6 13.4 8.230
Other minority ~owned businesses 606 426............. 5.9 2.3 1.5 1.4 7.7 2.1 2.931
With no paid employees 470 075.............................. (X) (X) (X) (X) (X) (X) (X)32With paid employees 136 351................................. 21.6 8.6 5.6 5.2 28.3 7.6 10.733
No employees4 19 989.................................... (X) (X) (X) (X) (X) (X) (X)341 to 4 employees 76 636.................................. 24.5 9.0 4.9 3.8 36.2 8.1 13.6355 to 9 employees 22 862.................................. 27.6 11.2 6.9 10.9 25.8 9.6 7.93610 to 19 employees 10 051................................ 22.7 12.2 9.8 7.6 28.9 8.5 10.33720 to 49 employees 5 034................................ 21.2 10.8 14.8 9.8 21.4 9.3 12.83850 to 99 employees 1 075................................ 23.2 9.1 6.1 10.3 18.0 15.4 17.839100 employees or more 705............................ 23.2 9.9 15.2 5.0 8.3 18.0 20.440
Women ~owned businesses 5 888 883.................... 7.1 .7 .4 .3 1.4 .7 1.741
With no paid employees 5 071 110.............................. (X) (X) (X) (X) (X) (X) (X)42With paid employees 817 773................................. 49.9 4.9 2.8 1.8 9.6 5.1 12.143
No employees4 127 905.................................... (X) (X) (X) (X) (X) (X) (X)441 to 4 employees 435 550.................................. 57.6 4.0 1.9 1.2 12.4 4.9 18.1455 to 9 employees 134 476.................................. 62.5 7.1 4.2 3.1 9.2 6.5 7.34610 to 19 employees 67 487................................ 60.1 10.0 4.5 2.9 10.2 6.2 6.14720 to 49 employees 35 515................................ 48.9 8.9 10.8 6.8 6.8 11.2 6.54850 to 99 employees 10 178................................ 39.2 17.9 9.7 6.1 6.4 13.7 7.149100 employees or more 6 663............................ 30.9 14.7 11.2 7.3 10.1 19.5 6.350
Nonminority male ~owned businesses 10 114 456.......... 11.4 1.3 .6 .3 1.5 1.0 2.551
With no paid employees 8 019 462.............................. (X) (X) (X) (X) (X) (X) (X)52With paid employees 2 094 993................................. 54.0 6.0 2.8 1.6 7.2 4.8 12.053
No employees4 271 380.................................... (X) (X) (X) (X) (X) (X) (X)541 to 4 employees 1 155 800.................................. 62.0 5.8 2.0 1.2 9.0 4.3 15.6555 to 9 employees 334 483.................................. 66.2 4.8 4.2 2.9 7.7 5.3 9.05610 to 19 employees 173 140................................ 57.8 11.0 5.8 1.8 4.8 7.1 11.75720 to 49 employees 101 938................................ 50.4 12.1 7.2 4.8 6.9 8.7 9.95850 to 99 employees 33 406................................ 38.8 14.3 5.0 4.7 7.1 18.0 12.159100 employees or more 24 846............................ 42.9 19.0 4.3 3.0 1.8 17.9 11.260
1Data represent percentage of firms reporting in the designated categories.2For explanation of relative standard errors and standard errors, see Reliability of Estimates in the introductory text.3Relative standard errors are not applicable for lines 1 through 10 since these data are the result of censuses, not surveys.4Firms reported annual payroll, but did not report any employees on their payroll during specified period in 1992.
242 CHARACTERISTICS OF BUSINESS OWNERS 1992 ECONOMIC CENSUS

Standard error of estimate2 for columnmNo paid employees forpay period including
March 121
Relativestandard
error ofestimate2 3
I A B C D E F G H I
83.6 (X) .4 .1 .1 – .1 .1 .2 .4 1
100.0 (X) (X) (X) (X) (X) (X) (X) (X) – 2(X) (X) 1.1 .6 .3 .2 .6 .5 .9 (X) 3
100.0 (X) (X) (X) (X) (X) (X) (X) (X) – 4(X) (X) 1.6 .8 .3 .3 .8 .8 1.6 (X) 5(X) (X) 1.5 .5 .7 .4 1.1 .5 1.2 (X) 6(X) (X) 2.5 1.9 .9 .3 .8 .8 1.2 (X) 7(X) (X) 2.0 .7 1.2 .5 1.5 .8 1.0 (X) 8(X) (X) 2.4 2.1 .8 1.3 .9 2.3 1.9 (X) 9(X) (X) 3.9 2.6 1.7 1.0 1.0 2.5 2.3 (X) 10
83.7 – .2 .2 .1 .1 .2 .1 .3 .5 11
100.0 – (X) (X) (X) (X) (X) (X) (X) – 12(X) 1.0 .8 .9 .6 .4 .9 .5 1.7 (X) 13
100.0 2.0 (X) (X) (X) (X) (X) (X) (X) – 14(X) 1.0 1.4 1.6 .7 .4 1.1 .6 2.7 (X) 15(X) 2.0 2.3 2.0 .8 1.5 1.6 1.7 1.0 (X) 16(X) 3.0 1.3 2.0 2.2 1.6 2.6 .9 1.4 (X) 17(X) 4.0 2.1 1.8 1.8 1.2 2.5 1.7 2.2 (X) 18(X) 6.0 1.8 2.5 2.5 4.5 4.6 2.9 2.7 (X) 19(X) 8.0 6.1 4.5 3.8 4.1 4.2 3.5 2.6 (X) 20
91.6 – .1 .1 – .1 .2 .1 .2 .2 21
100.0 – (X) (X) (X) (X) (X) (X) (X) – 22(X) 1.0 1.1 .6 .4 .8 2.3 .5 2.2 (X) 23
100.0 2.0 (X) (X) (X) (X) (X) (X) (X) – 24(X) 1.0 1.9 .7 .4 .8 2.2 .8 3.3 (X) 25(X) 3.0 1.2 2.9 1.4 1.3 3.9 1.3 3.0 (X) 26(X) 4.0 1.6 3.5 1.0 4.4 3.6 .8 2.4 (X) 27(X) 6.0 3.3 2.9 2.2 4.6 5.4 2.6 3.4 (X) 28(X) 8.0 5.0 5.4 3.2 5.8 9.0 1.9 2.2 (X) 29(X) 10.0 4.6 2.8 1.9 4.3 6.1 3.4 1.5 (X) 30
76.2 – .3 .1 .1 .1 .4 .3 .2 .5 31
100.0 – (X) (X) (X) (X) (X) (X) (X) – 32(X) 1.0 1.2 .5 .5 .5 1.3 .9 .6 (X) 33
100.0 2.0 (X) (X) (X) (X) (X) (X) (X) – 34(X) 1.0 1.9 .5 .8 .5 1.9 1.3 .9 (X) 35(X) 2.0 1.9 1.7 1.2 2.1 2.6 1.2 .8 (X) 36(X) 2.0 1.5 1.6 1.7 1.0 3.3 1.7 2.4 (X) 37(X) 4.0 2.2 2.6 2.4 1.6 2.2 1.7 1.4 (X) 38(X) 6.0 4.5 1.7 1.3 2.7 4.9 3.0 5.5 (X) 39(X) 6.0 5.4 5.2 4.2 2.1 2.8 3.5 4.5 (X) 40
87.7 – .3 .1 .1 – .1 .1 .2 .5 41
100.0 – (X) (X) (X) (X) (X) (X) (X) – 42(X) – 2.1 .7 .3 .3 .5 .4 1.3 (X) 43
100.0 1.0 (X) (X) (X) (X) (X) (X) (X) – 44(X) – 2.6 .8 .4 .5 .9 .8 2.2 (X) 45(X) 1.0 1.9 1.2 .9 .6 1.7 1.2 1.1 (X) 46(X) 1.0 2.6 2.5 .9 .4 1.7 .5 1.1 (X) 47(X) 1.0 3.3 2.0 2.7 1.3 1.0 1.7 .5 (X) 48(X) 2.0 5.4 4.6 2.5 1.3 1.8 3.9 1.9 (X) 49(X) 2.0 4.9 5.1 3.5 1.6 3.1 4.6 2.0 (X) 50
81.4 – .6 .1 .1 .1 .2 .1 .3 .6 51
100.0 – (X) (X) (X) (X) (X) (X) (X) – 52(X) – 1.5 .7 .4 .3 .9 .7 1.2 (X) 53
100.0 – (X) (X) (X) (X) (X) (X) (X) – 54(X) – 2.0 1.0 .4 .5 1.2 1.2 1.9 (X) 55(X) – 2.2 .9 1.1 .6 1.2 .8 1.5 (X) 56(X) 1.0 2.9 2.4 1.0 .4 1.0 1.3 1.6 (X) 57(X) 1.0 3.1 1.2 1.3 .8 2.3 .8 1.2 (X) 58(X) 1.0 3.9 2.9 1.0 1.7 1.3 3.0 2.5 (X) 59(X) 1.0 5.3 3.1 1.5 1.6 .7 3.5 3.1 (X) 60
1992 ECONOMIC CENSUS CHARACTERISTICS OF BUSINESS OWNERS 243
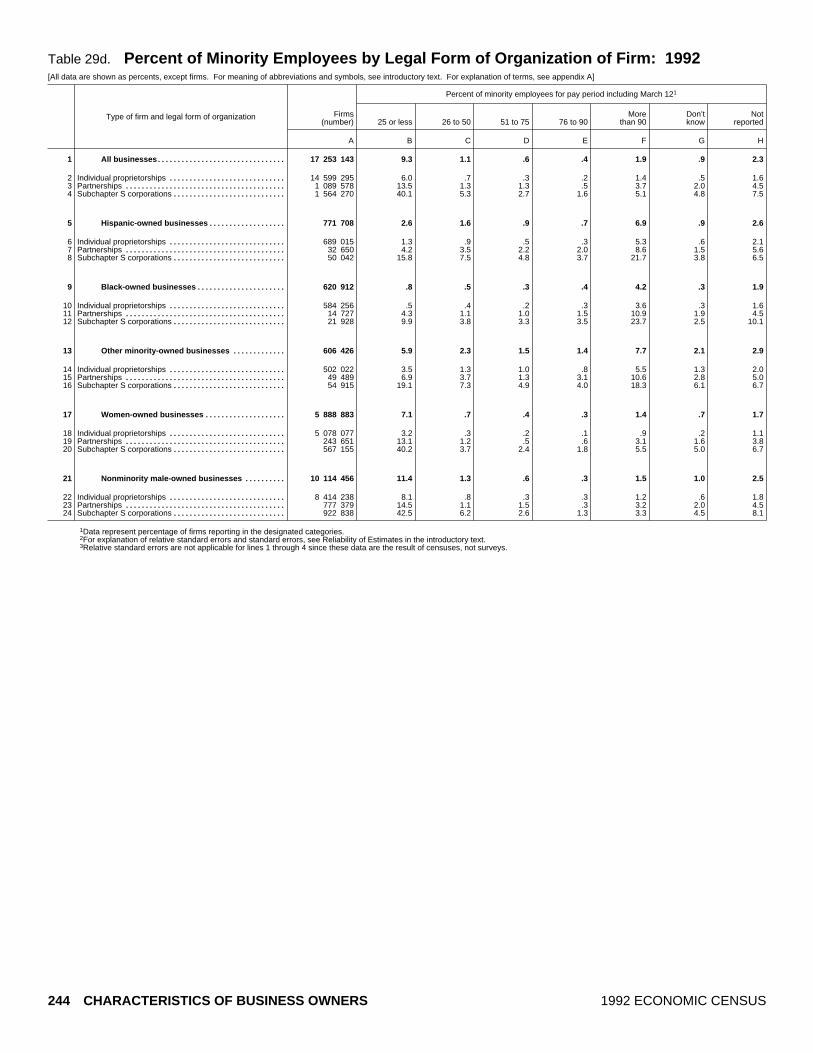
Table 29d. Percent of Minority Employees by Legal Form of Organization of Firm: 1992[All data are shown as percents, except firms. For meaning of abbreviations and symbols, see introductory text. For explanation of terms, see appendix A]
Type of firm and legal form of organization
Percent of minority employees for pay period including March 121
Firms(number) 25 or less 26 to 50 51 to 75 76 to 90
Morethan 90
Don’tknow
Notreported
A B C D E F G H
All businesses 17 253 143................................ 9.3 1.1 .6 .4 1.9 .9 2.31
Individual proprietorships 14 599 295............................. 6.0 .7 .3 .2 1.4 .5 1.62Partnerships 1 089 578........................................ 13.5 1.3 1.3 .5 3.7 2.0 4.53Subchapter S corporations 1 564 270............................ 40.1 5.3 2.7 1.6 5.1 4.8 7.54
Hispanic ~owned businesses 771 708................... 2.6 1.6 .9 .7 6.9 .9 2.65
Individual proprietorships 689 015............................. 1.3 .9 .5 .3 5.3 .6 2.16Partnerships 32 650........................................ 4.2 3.5 2.2 2.0 8.6 1.5 5.67Subchapter S corporations 50 042............................ 15.8 7.5 4.8 3.7 21.7 3.8 6.58
Black ~owned businesses 620 912...................... .8 .5 .3 .4 4.2 .3 1.99
Individual proprietorships 584 256............................. .5 .4 .2 .3 3.6 .3 1.610Partnerships 14 727........................................ 4.3 1.1 1.0 1.5 10.9 1.9 4.511Subchapter S corporations 21 928............................ 9.9 3.8 3.3 3.5 23.7 2.5 10.112
Other minority ~owned businesses 606 426............. 5.9 2.3 1.5 1.4 7.7 2.1 2.913
Individual proprietorships 502 022............................. 3.5 1.3 1.0 .8 5.5 1.3 2.014Partnerships 49 489........................................ 6.9 3.7 1.3 3.1 10.6 2.8 5.015Subchapter S corporations 54 915............................ 19.1 7.3 4.9 4.0 18.3 6.1 6.716
Women ~owned businesses 5 888 883.................... 7.1 .7 .4 .3 1.4 .7 1.717
Individual proprietorships 5 078 077............................. 3.2 .3 .2 .1 .9 .2 1.118Partnerships 243 651........................................ 13.1 1.2 .5 .6 3.1 1.6 3.819Subchapter S corporations 567 155............................ 40.2 3.7 2.4 1.8 5.5 5.0 6.720
Nonminority male ~owned businesses 10 114 456.......... 11.4 1.3 .6 .3 1.5 1.0 2.521
Individual proprietorships 8 414 238............................. 8.1 .8 .3 .3 1.2 .6 1.822Partnerships 777 379........................................ 14.5 1.1 1.5 .3 3.2 2.0 4.523Subchapter S corporations 922 838............................ 42.5 6.2 2.6 1.3 3.3 4.5 8.124
1Data represent percentage of firms reporting in the designated categories.2For explanation of relative standard errors and standard errors, see Reliability of Estimates in the introductory text.3Relative standard errors are not applicable for lines 1 through 4 since these data are the result of censuses, not surveys.
244 CHARACTERISTICS OF BUSINESS OWNERS 1992 ECONOMIC CENSUS

Standard error of estimate2 for columnmNo paid employees forpay period including
March 121
Relativestandard
error ofestimate2 3
I A B C D E F G H I
83.6 (X) .4 .1 .1 – .1 .1 .2 .4 1
89.4 (X) .3 .1 .1 – .1 .1 .1 .3 273.2 (X) 1.4 .1 .4 .1 .6 .3 .6 1.5 332.9 (X) 1.5 .8 .2 .2 .3 .3 1.0 1.9 4
83.7 – .2 .2 .1 .1 .2 .1 .3 .5 5
89.1 – .2 .1 .1 .1 .3 .1 .3 .4 672.4 2.0 .5 1.1 .3 .5 .9 .5 1.4 2.4 736.2 1.0 1.4 .7 .6 .5 1.2 .6 .6 2.8 8
91.6 – .1 .1 – .1 .2 .1 .2 .2 9
93.2 – .1 .1 – .1 .2 .1 .2 .2 1074.9 3.0 .9 .3 .3 .8 2.2 1.0 1.9 3.7 1143.2 2.0 1.3 .6 .5 .8 2.2 .7 2.4 3.2 12
76.2 – .3 .1 .1 .1 .4 .3 .2 .5 13
84.6 – .3 .1 .2 .2 .3 .2 .1 .4 1466.6 1.0 1.0 .8 .2 .9 1.4 .5 .7 3.3 1533.8 1.0 1.7 .9 .7 .5 2.0 1.3 1.0 2.4 16
87.7 – .3 .1 .1 – .1 .1 .2 .5 17
94.0 – .3 .1 – – .1 – .2 .4 1876.0 1.0 2.3 .3 .1 .2 .9 .5 1.9 3.0 1934.5 – 2.3 .3 .3 .4 .6 .4 .7 2.9 20
81.4 – .6 .1 .1 .1 .2 .1 .3 .6 21
87.0 – .5 .1 .1 .1 .2 .1 .2 .6 2272.9 – 1.6 .2 .5 .1 .8 .4 .6 1.8 2331.5 – 2.0 1.4 .3 .2 .4 .6 1.8 3.0 24
1992 ECONOMIC CENSUS CHARACTERISTICS OF BUSINESS OWNERS 245

Table 30a. Percent of Minority Customers by Industry Division: 1992[All data are shown as percents, except firms. For meaning of abbreviations and symbols, see introductory text. For explanation of terms, see appendix A]
Type of firm and industry division
Percent of minority customers for pay period including March 121
Firms(number)
25or less 26 to 50 51 to 75 76 to 90 More than 90
Don’tknow
Notreported
A B C D E F G H
All businesses 17 253 143..................................... 45.0 7.8 3.3 1.8 6.3 25.6 10.21
Agricultural services, forestry, fishing, and mining 583 253............. 40.8 5.4 1.7 .7 5.0 32.7 13.82Construction 1 829 620.............................................. 48.5 9.1 1.9 1.4 6.2 24.0 9.03Manufacturing 517 714............................................ 30.9 4.5 2.3 .8 5.0 49.8 6.74Transportation, communications, and utilities 698 903................. 33.4 7.6 4.5 1.9 4.6 34.4 13.65Wholesale trade 538 339.......................................... 37.9 8.4 5.4 1.6 4.6 34.7 7.36
Retail trade 2 478 045............................................... 49.2 10.6 5.2 2.1 5.6 18.7 8.67Finance, insurance, and real estate 1 941 029.......................... 39.3 7.4 2.3 2.7 6.8 29.5 11.98Services 7 784 016................................................. 47.3 7.1 3.2 1.8 6.9 24.2 9.59Industries not classified 882 224.................................... 43.0 7.6 3.6 1.8 5.4 21.0 17.710
Hispanic ~owned businesses 771 708........................ 25.0 10.5 8.2 6.3 17.4 20.6 12.011
Agricultural services, forestry, fishing, and mining 32 927............. 38.6 8.8 4.2 4.0 10.0 20.2 14.112Construction 97 476.............................................. 31.7 10.5 7.8 4.9 9.9 23.8 11.413Manufacturing 18 461............................................ 28.3 10.6 6.5 4.5 9.8 31.6 8.514Transportation, communications, and utilities 47 797................. 17.4 9.8 10.2 3.9 9.3 33.1 16.215Wholesale trade 17 727.......................................... 18.1 10.1 9.8 8.1 21.7 25.5 6.816
Retail trade 107 846............................................... 15.6 12.5 12.9 11.7 22.3 17.4 7.617Finance, insurance, and real estate 49 231.......................... 16.0 10.5 12.2 8.2 23.4 19.9 9.818Services 347 297................................................. 28.2 10.1 6.8 5.4 18.7 18.3 12.419Industries not classified 52 945.................................... 18.8 10.3 5.8 5.9 19.9 20.3 18.920
Black ~owned businesses 620 912........................... 17.5 8.1 6.0 6.4 28.4 15.8 17.921
Agricultural services, forestry, fishing, and mining 10 309............. 27.5 9.1 6.7 4.0 16.2 16.7 19.822Construction 43 381.............................................. 24.8 13.3 8.1 6.7 16.6 14.6 15.923Manufacturing 10 469............................................ 19.7 6.0 4.9 5.0 20.6 25.4 18.424Transportation, communications, and utilities 49 095................. 24.2 10.5 6.2 3.7 12.5 23.5 19.325Wholesale trade 7 550.......................................... 23.7 8.6 7.2 5.5 26.0 20.0 9.026
Retail trade 86 840............................................... 11.0 8.5 7.1 10.6 35.4 15.1 12.227Finance, insurance, and real estate 40 924.......................... 11.3 9.7 7.6 8.3 38.3 13.0 11.728Services 332 981................................................. 17.5 6.9 5.4 5.7 30.5 14.9 19.229Industries not classified 39 363.................................... 15.9 8.1 4.8 5.4 25.3 15.7 24.730
Other minority ~owned businesses 606 426................... 25.9 12.5 6.8 6.2 16.9 23.4 8.331
Agricultural services, forestry, fishing, and mining 15 218............. 31.1 9.8 4.2 2.2 8.3 32.5 11.832Construction 28 295.............................................. 25.0 8.4 4.8 2.9 19.3 30.3 9.333Manufacturing 18 976............................................ 17.8 7.2 5.5 2.3 13.5 48.5 5.134Transportation, communications, and utilities 24 362................. 21.0 11.9 5.9 4.1 19.1 25.6 12.435Wholesale trade 20 043.......................................... 21.2 10.8 4.4 7.3 16.0 34.5 5.836
Retail trade 132 483............................................... 25.8 16.5 10.7 7.4 17.6 16.3 5.837Finance, insurance, and real estate 64 762.......................... 18.7 8.7 4.8 12.2 22.0 20.0 13.738Services 273 774................................................. 29.6 13.1 6.2 5.1 15.5 22.8 7.839Industries not classified 28 512.................................... 19.0 9.1 6.6 5.7 18.2 32.8 8.640
Women ~owned businesses 5 888 883......................... 45.1 6.4 3.7 1.6 6.6 25.7 11.041
Agricultural services, forestry, fishing, and mining 119 731............. 42.1 4.3 1.8 .3 3.4 31.6 16.642Construction 183 695.............................................. 48.6 4.9 2.7 1.4 5.9 27.9 8.543Manufacturing 152 346............................................ 31.7 4.2 2.1 1.1 4.9 45.9 10.144Transportation, communications, and utilities 141 623................. 32.5 6.1 4.2 2.8 4.0 39.7 10.745Wholesale trade 154 542.......................................... 35.0 7.5 6.1 1.8 4.8 36.7 8.146
Retail trade 1 093 342............................................... 47.6 9.4 5.0 1.9 6.0 20.2 9.947Finance, insurance, and real estate 602 802.......................... 36.5 7.7 3.6 1.4 5.3 35.1 10.548Services 3 158 444................................................. 48.3 5.3 3.1 1.5 7.6 23.6 10.649Industries not classified 282 358.................................... 36.2 6.9 5.3 2.0 5.4 22.8 21.450
Nonminority male ~owned businesses 10 114 456................ 47.5 8.2 2.6 1.3 4.5 26.3 9.551
Agricultural services, forestry, fishing, and mining 412 917............. 41.0 5.2 1.3 .4 5.0 34.2 12.952Construction 1 496 056.............................................. 50.4 9.5 1.2 1.0 5.5 23.6 8.653Manufacturing 333 485............................................ 31.2 4.1 2.0 .5 4.2 53.0 5.054Transportation, communications, and utilities 458 400................. 36.2 7.3 4.0 1.3 3.3 34.4 13.655Wholesale trade 352 721.......................................... 40.6 8.7 4.9 1.0 3.3 34.3 7.256
Retail trade 1 197 943............................................... 55.5 11.2 4.6 .9 2.8 17.7 7.557Finance, insurance, and real estate 1 240 594.......................... 42.4 7.1 1.3 2.8 6.1 27.5 12.758Services 4 102 294................................................. 49.3 8.1 2.7 1.3 4.6 25.6 8.459Industries not classified 520 046.................................... 50.2 7.4 2.3 1.1 3.0 20.0 15.960
1Data represent percentage of firms reporting in the designated categories.2For explanation of relative standard errors and standard errors, see Reliability of Estimates in the introductory text.3Relative standard errors are not applicable for lines 1 through 10 since these data are the result of censuses, not surveys.
246 CHARACTERISTICS OF BUSINESS OWNERS 1992 ECONOMIC CENSUS
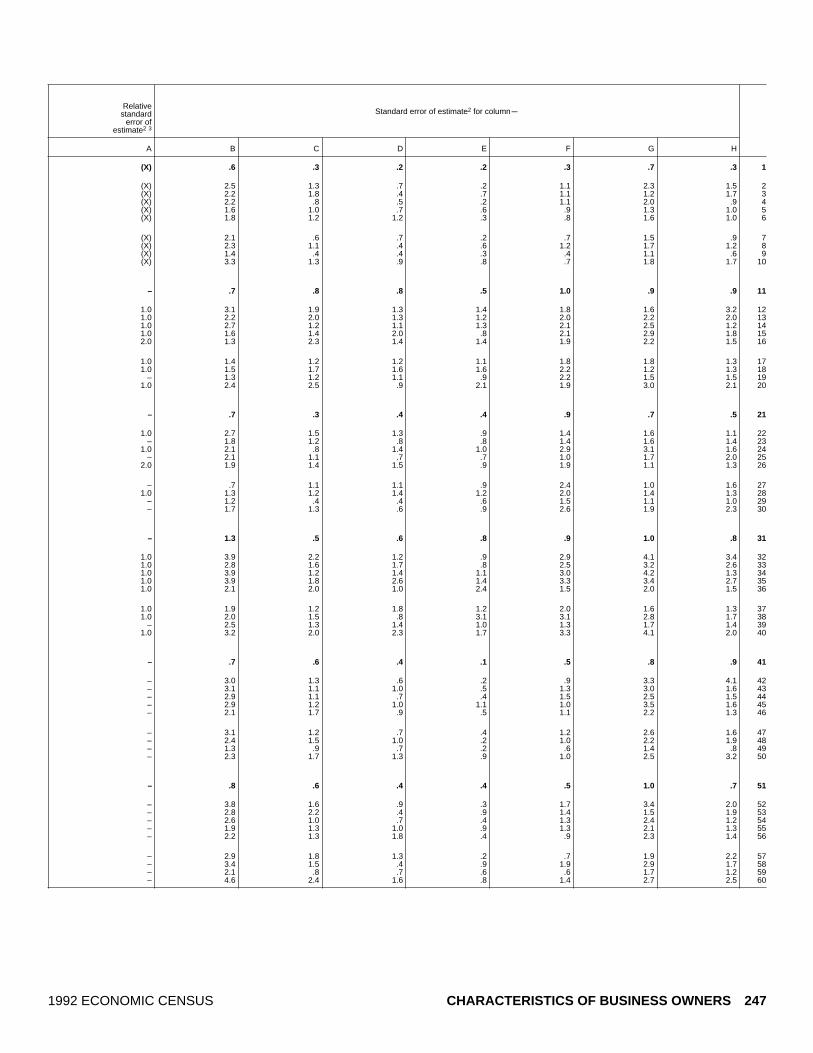
Standard error of estimate2 for columnmRelative
standarderror of
estimate2 3
A B C D E F G H
(X) .6 .3 .2 .2 .3 .7 .3 1
(X) 2.5 1.3 .7 .2 1.1 2.3 1.5 2(X) 2.2 1.8 .4 .7 1.1 1.2 1.7 3(X) 2.2 .8 .5 .2 1.1 2.0 .9 4(X) 1.6 1.0 .7 .6 .9 1.3 1.0 5(X) 1.8 1.2 1.2 .3 .8 1.6 1.0 6
(X) 2.1 .6 .7 .2 .7 1.5 .9 7(X) 2.3 1.1 .4 .6 1.2 1.7 1.2 8(X) 1.4 .4 .4 .3 .4 1.1 .6 9(X) 3.3 1.3 .9 .8 .7 1.8 1.7 10
– .7 .8 .8 .5 1.0 .9 .9 11
1.0 3.1 1.9 1.3 1.4 1.8 1.6 3.2 121.0 2.2 2.0 1.3 1.2 2.0 2.2 2.0 131.0 2.7 1.2 1.1 1.3 2.1 2.5 1.2 141.0 1.6 1.4 2.0 .8 2.1 2.9 1.8 152.0 1.3 2.3 1.4 1.4 1.9 2.2 1.5 16
1.0 1.4 1.2 1.2 1.1 1.8 1.8 1.3 171.0 1.5 1.7 1.6 1.6 2.2 1.2 1.3 18
– 1.3 1.2 1.1 .9 2.2 1.5 1.5 191.0 2.4 2.5 .9 2.1 1.9 3.0 2.1 20
– .7 .3 .4 .4 .9 .7 .5 21
1.0 2.7 1.5 1.3 .9 1.4 1.6 1.1 22– 1.8 1.2 .8 .8 1.4 1.6 1.4 23
1.0 2.1 .8 1.4 1.0 2.9 3.1 1.6 24– 2.1 1.1 .7 .7 1.0 1.7 2.0 25
2.0 1.9 1.4 1.5 .9 1.9 1.1 1.3 26
– .7 1.1 1.1 .9 2.4 1.0 1.6 271.0 1.3 1.2 1.4 1.2 2.0 1.4 1.3 28
– 1.2 .4 .4 .6 1.5 1.1 1.0 29– 1.7 1.3 .6 .9 2.6 1.9 2.3 30
– 1.3 .5 .6 .8 .9 1.0 .8 31
1.0 3.9 2.2 1.2 .9 2.9 4.1 3.4 321.0 2.8 1.6 1.7 .8 2.5 3.2 2.6 331.0 3.9 1.2 1.4 1.1 3.0 4.2 1.3 341.0 3.9 1.8 2.6 1.4 3.3 3.4 2.7 351.0 2.1 2.0 1.0 2.4 1.5 2.0 1.5 36
1.0 1.9 1.2 1.8 1.2 2.0 1.6 1.3 371.0 2.0 1.5 .8 3.1 3.1 2.8 1.7 38
– 2.5 1.3 1.4 1.0 1.3 1.7 1.4 391.0 3.2 2.0 2.3 1.7 3.3 4.1 2.0 40
– .7 .6 .4 .1 .5 .8 .9 41
– 3.0 1.3 .6 .2 .9 3.3 4.1 42– 3.1 1.1 1.0 .5 1.3 3.0 1.6 43– 2.9 1.1 .7 .4 1.5 2.5 1.5 44– 2.9 1.2 1.0 1.1 1.0 3.5 1.6 45– 2.1 1.7 .9 .5 1.1 2.2 1.3 46
– 3.1 1.2 .7 .4 1.2 2.6 1.6 47– 2.4 1.5 1.0 .2 1.0 2.2 1.9 48– 1.3 .9 .7 .2 .6 1.4 .8 49– 2.3 1.7 1.3 .9 1.0 2.5 3.2 50
– .8 .6 .4 .4 .5 1.0 .7 51
– 3.8 1.6 .9 .3 1.7 3.4 2.0 52– 2.8 2.2 .4 .9 1.4 1.5 1.9 53– 2.6 1.0 .7 .4 1.3 2.4 1.2 54– 1.9 1.3 1.0 .9 1.3 2.1 1.3 55– 2.2 1.3 1.8 .4 .9 2.3 1.4 56
– 2.9 1.8 1.3 .2 .7 1.9 2.2 57– 3.4 1.5 .4 .9 1.9 2.9 1.7 58– 2.1 .8 .7 .6 .6 1.7 1.2 59– 4.6 2.4 1.6 .8 1.4 2.7 2.5 60
1992 ECONOMIC CENSUS CHARACTERISTICS OF BUSINESS OWNERS 247

Table 30b. Percent of Minority Customers by Receipts Size of Firm: 1992[All data are shown as percents, except firms. For meaning of abbreviations and symbols, see introductory text. For explanation of terms, see appendix A]
Type of firm and receipts size
Percent of minority customers for pay period including March 121
Firms(number)
25or less 26 to 50 51 to 75 76 to 90 More than 90
Don’tknow
Notreported
A B C D E F G H
All businesses 17 253 143..................................... 45.0 7.8 3.3 1.8 6.3 25.6 10.21
Less than $5,000 5 226 553......................................... 41.3 6.2 2.2 1.8 7.7 25.9 14.92$5,000 to $9,999 2 443 946.......................................... 44.6 6.6 2.9 1.8 6.8 26.3 11.13$10,000 to $24,999 3 076 410........................................ 45.6 8.2 3.5 1.5 5.4 25.2 10.64$25,000 to $49,999 1 945 806........................................ 49.6 8.5 4.0 1.3 5.7 22.4 8.65$50,000 to $99,999 1 615 940........................................ 46.8 9.8 3.2 2.2 6.4 26.6 4.96
$100,000 to $199,999 1 197 996..................................... 49.1 9.1 5.0 2.5 5.6 23.9 4.97$200,000 to $249,999 301 794..................................... 55.6 7.0 4.0 4.0 4.1 20.4 4.98$250,000 to $499,999 682 583..................................... 46.6 11.2 5.0 2.0 4.6 25.2 5.49$500,000 to $999,999 372 078..................................... 44.1 9.9 5.2 2.7 3.8 28.3 5.910$1,000,000 or more 390 037....................................... 33.4 8.7 3.9 1.7 3.4 43.4 5.511
Hispanic ~owned businesses 771 708........................ 25.0 10.5 8.2 6.3 17.4 20.6 12.012
Less than $5,000 219 226......................................... 20.6 7.0 6.3 4.5 20.2 22.4 19.013$5,000 to $9,999 140 362.......................................... 23.8 8.8 7.8 6.8 20.0 17.5 15.414$10,000 to $24,999 165 667........................................ 23.7 11.4 8.4 5.1 19.1 19.9 12.415$25,000 to $49,999 87 288........................................ 28.8 12.9 7.9 8.4 14.0 21.3 6.616$50,000 to $99,999 64 742........................................ 32.6 12.8 9.5 5.5 13.6 19.5 6.517
$100,000 to $199,999 41 578..................................... 26.3 12.0 11.7 9.4 14.3 20.7 5.518$200,000 to $249,999 10 030..................................... 26.8 13.7 14.0 11.1 12.3 16.6 5.619$250,000 to $499,999 22 301..................................... 30.8 14.1 8.6 7.4 12.4 20.8 5.920$500,000 to $999,999 11 319..................................... 23.6 13.5 11.3 8.5 15.8 20.8 6.621$1,000,000 or more 9 194....................................... 19.7 10.7 9.7 8.1 13.7 33.7 4.422
Black ~owned businesses 620 912........................... 17.5 8.1 6.0 6.4 28.4 15.8 17.923
Less than $5,000 236 722......................................... 14.3 6.7 5.5 5.0 28.1 16.7 23.824$5,000 to $9,999 111 512.......................................... 16.0 7.7 5.8 6.5 32.0 14.7 17.425$10,000 to $24,999 129 901........................................ 18.6 9.3 6.1 6.6 28.7 14.1 16.626$25,000 to $49,999 62 209........................................ 23.8 9.3 6.1 8.5 25.5 15.3 11.427$50,000 to $99,999 39 218........................................ 21.6 9.7 5.7 7.4 24.8 19.4 11.328
$100,000 to $199,999 20 936..................................... 21.9 10.2 8.7 7.8 30.9 14.2 6.329$200,000 to $249,999 4 533..................................... 29.7 6.6 8.3 10.2 30.4 12.6 2.330$250,000 to $499,999 9 029..................................... 20.9 9.5 13.0 11.4 21.3 17.8 6.131$500,000 to $999,999 3 823..................................... 19.7 9.4 7.9 8.6 21.9 21.9 10.532$1,000,000 or more 3 028....................................... 20.3 9.2 8.2 6.2 15.9 32.0 8.233
Other minority ~owned businesses 606 426................... 25.9 12.5 6.8 6.2 16.9 23.4 8.334
Less than $5,000 132 493......................................... 21.5 7.1 3.7 2.7 24.4 30.2 10.435$5,000 to $9,999 80 435.......................................... 27.9 6.7 7.4 3.5 15.0 28.2 11.436$10,000 to $24,999 108 195........................................ 27.6 7.4 9.4 8.6 17.2 20.6 9.337$25,000 to $49,999 77 345........................................ 24.0 18.4 4.3 9.2 16.2 20.6 7.338$50,000 to $99,999 70 360........................................ 25.5 17.5 6.6 6.6 17.0 21.5 5.539
$100,000 to $199,999 58 620..................................... 28.6 14.9 9.5 6.9 13.9 18.4 7.840$200,000 to $249,999 15 740..................................... 28.8 23.8 8.6 7.5 12.1 13.2 6.041$250,000 to $499,999 34 266..................................... 28.1 16.4 8.0 6.0 14.0 20.9 6.642$500,000 to $999,999 16 467..................................... 28.9 14.2 9.4 7.4 10.7 23.8 5.743$1,000,000 or more 12 505....................................... 24.2 13.4 7.0 5.4 9.6 34.8 5.844
Women ~owned businesses 5 888 883......................... 45.1 6.4 3.7 1.6 6.6 25.7 11.045
Less than $5,000 2 310 303......................................... 40.7 4.6 2.6 1.1 7.4 28.4 15.246$5,000 to $9,999 967 380.......................................... 48.1 7.3 4.3 1.4 8.0 23.1 7.847$10,000 to $24,999 1 051 358........................................ 47.7 5.4 4.0 2.0 6.8 23.6 10.448$25,000 to $49,999 538 885........................................ 52.3 7.4 3.4 1.9 3.8 19.9 11.249$50,000 to $99,999 381 517........................................ 44.3 10.4 3.2 2.2 6.1 27.4 6.350
$100,000 to $199,999 267 089..................................... 47.8 10.0 7.4 2.4 4.3 25.1 3.151$200,000 to $249,999 66 464..................................... 53.1 8.1 3.6 2.2 4.6 22.4 5.952$250,000 to $499,999 146 313..................................... 45.5 9.7 5.7 2.5 4.1 26.6 5.953$500,000 to $999,999 80 539..................................... 40.6 11.2 6.0 2.6 3.6 30.5 5.654$1,000,000 or more 79 037....................................... 34.0 8.1 4.5 1.9 3.2 43.0 5.255
Nonminority male ~owned businesses 10 114 456................ 47.5 8.2 2.6 1.3 4.5 26.3 9.556
Less than $5,000 2 608 047......................................... 44.0 7.5 1.4 2.0 6.4 24.3 14.357$5,000 to $9,999 1 285 456.......................................... 44.9 5.8 1.2 1.3 3.8 29.9 13.158$10,000 to $24,999 1 763 830........................................ 47.5 10.0 2.5 .3 2.1 27.2 10.459$25,000 to $49,999 1 248 482........................................ 51.6 8.1 3.9 – 5.1 23.7 7.660$50,000 to $99,999 1 108 065........................................ 50.2 9.0 2.7 1.8 5.2 26.9 4.261
$100,000 to $199,999 840 723..................................... 52.2 8.3 3.7 1.8 4.7 24.1 5.262$200,000 to $249,999 212 693..................................... 60.4 4.7 3.1 3.9 2.8 20.6 4.563$250,000 to $499,999 488 462..................................... 49.1 11.3 4.5 1.2 3.5 25.4 5.164$500,000 to $999,999 266 408..................................... 47.1 9.2 4.5 2.1 2.9 28.4 5.865$1,000,000 or more 292 290....................................... 34.2 8.6 3.5 1.2 2.6 44.2 5.666
1Data represent percentage of firms reporting in the designated categories.2For explanation of relative standard errors and standard errors, see Reliability of Estimates in the introductory text.3Relative standard errors are not applicable for lines 1 through 11 since these data are the result of censuses, not surveys.
248 CHARACTERISTICS OF BUSINESS OWNERS 1992 ECONOMIC CENSUS

Standard error of estimate2 for columnmRelative
standarderror of
estimate2 3
A B C D E F G H
(X) .6 .3 .2 .2 .3 .7 .3 1
(X) 1.4 .9 .4 .5 .6 1.8 1.0 2(X) 1.6 .8 .5 .5 .8 1.5 1.5 3(X) 1.7 1.1 .7 .3 .8 1.3 1.0 4(X) 2.3 1.5 1.1 .2 1.5 1.5 1.6 5(X) 2.6 1.2 .5 .6 .7 2.1 .6 6
(X) 1.8 1.0 .6 .3 .5 1.3 .5 7(X) 2.0 1.0 1.4 1.2 1.0 2.8 1.2 8(X) 1.4 1.0 .3 .4 .6 1.3 .5 9(X) 1.5 .5 .6 .4 .3 1.2 .5 10(X) .8 .4 .4 .2 .2 .7 .3 11
– .7 .8 .8 .5 1.0 .9 .9 12
1.0 2.6 1.2 1.2 1.1 1.7 2.5 2.3 131.0 2.9 1.5 1.6 1.7 2.5 2.2 2.0 141.0 1.8 2.4 1.5 .9 2.8 1.9 2.7 151.0 3.5 2.4 1.4 2.5 2.3 2.3 1.1 161.0 1.4 1.2 1.0 1.0 1.7 2.2 1.1 17
1.0 1.4 1.1 1.1 1.0 2.4 2.0 1.8 183.0 5.0 2.7 1.3 2.6 2.7 3.3 1.5 192.0 1.4 1.6 .8 .9 .8 1.2 .6 203.0 1.8 2.0 1.9 1.2 1.3 1.6 1.0 212.0 2.0 1.1 .9 1.1 1.0 1.3 .6 22
– .7 .3 .4 .4 .9 .7 .5 23
– 1.2 .6 .5 .5 1.5 1.2 1.3 24– 2.3 .9 .9 1.0 2.2 1.7 1.7 25– .9 1.1 .9 .7 1.0 1.2 1.0 26– 2.1 1.3 1.6 1.5 3.1 2.3 2.1 27
1.0 1.9 1.4 1.2 1.1 2.9 1.3 1.4 28
1.0 1.2 1.8 .8 1.2 2.0 1.4 1.1 293.0 4.7 2.5 2.6 2.6 5.1 2.0 .8 303.0 1.6 1.1 1.6 1.2 1.6 2.3 .6 314.0 2.8 1.4 2.1 1.2 2.3 2.4 2.4 324.0 1.6 1.7 1.3 1.8 2.4 2.0 1.4 33
– 1.3 .5 .6 .8 .9 1.0 .8 34
1.0 4.1 2.1 1.3 .9 2.5 3.1 1.7 351.0 3.1 2.2 3.0 1.9 2.8 3.7 2.5 361.0 3.2 2.0 2.0 2.9 2.3 2.6 1.4 371.0 2.7 3.0 1.4 1.8 2.4 2.7 2.0 381.0 2.7 2.7 1.3 1.1 2.6 1.8 1.6 39
1.0 1.4 1.9 .8 1.2 1.6 1.6 1.3 402.0 3.5 2.8 2.9 2.3 3.2 3.2 2.2 411.0 1.5 1.6 .8 .8 1.0 1.3 .8 422.0 2.0 1.1 1.2 .7 1.1 2.0 1.1 432.0 1.7 1.2 .7 .7 1.0 1.5 .6 44
– .7 .6 .4 .1 .5 .8 .9 45
– 1.8 .8 .4 .3 .5 1.9 2.1 46– 2.2 1.1 .9 .5 1.6 1.6 1.2 47– 2.7 1.2 1.3 .6 1.0 2.3 1.1 48– 3.3 1.4 1.6 1.1 .5 3.5 2.4 49– 2.7 2.1 1.0 .7 1.4 2.2 1.4 50
– 2.3 1.0 1.5 .8 .7 2.2 .6 511.0 5.7 1.6 1.4 .9 3.9 5.2 1.8 521.0 1.6 1.5 1.0 .7 .5 2.0 .9 531.0 1.7 1.0 .9 .7 .4 1.3 .7 541.0 .9 .7 .7 .3 .3 1.2 .5 55
– .8 .6 .4 .4 .5 1.0 .7 56
– 1.6 1.4 .5 1.2 1.2 2.6 1.4 57– 3.5 1.6 .5 .9 1.0 3.2 2.7 58– 2.3 1.9 1.0 .2 1.0 2.2 1.8 59– 4.0 2.3 1.8 – 2.5 2.4 2.0 60– 3.5 1.8 .8 1.0 .9 2.7 .8 61
– 2.2 1.5 .8 .4 .8 1.4 .8 62– 3.7 1.5 2.1 1.6 .8 4.2 1.6 63– 2.1 1.1 .6 .5 .8 1.5 .8 64– 2.0 .6 .9 .6 .4 1.5 .7 65– 1.0 .6 .4 .3 .3 .8 .5 66
1992 ECONOMIC CENSUS CHARACTERISTICS OF BUSINESS OWNERS 249

Table 30c. Percent of Minority Customers by Employment Size of Firm: 1992[All data are shown as percents, except firms. For meaning of abbreviations and symbols, see introductory text. For explanation of terms, see appendix A]
Type of firm and employment size
Percent of minority customers for pay period including March 121
Firms(number)
25or less 26 to 50 51 to 75 76 to 90 More than 90
Don’tknow
Notreported
A B C D E F G H
All businesses 17 253 143..................................... 45.0 7.8 3.3 1.8 6.3 25.6 10.21
With no paid employees 14 118 184.................................... 43.6 7.4 3.0 1.8 6.7 26.2 11.52With paid employees 3 134 959...................................... 50.9 9.8 4.8 2.1 4.6 23.5 4.33
No employees4 435 838......................................... 44.3 11.1 6.2 2.5 4.7 27.4 3.841 to 4 employees 1 716 076........................................ 55.4 9.6 4.7 2.1 5.6 18.7 3.855 to 9 employees 503 808........................................ 52.1 8.9 4.0 2.6 3.1 24.3 5.0610 to 19 employees 256 110..................................... 41.4 11.9 4.6 1.5 3.0 31.8 5.9720 to 49 employees 144 734..................................... 38.8 7.9 5.8 1.8 2.6 37.2 5.8850 to 99 employees 45 331..................................... 34.0 8.5 3.1 .9 2.9 45.9 4.79100 employees or more 33 062.................................. 20.6 8.9 2.4 2.8 .9 58.3 6.010
Hispanic ~owned businesses 771 708........................ 25.0 10.5 8.2 6.3 17.4 20.6 12.011
With no paid employees 656 343.................................... 23.8 9.9 7.5 6.0 18.1 20.9 13.712With paid employees 115 364...................................... 29.8 13.0 11.2 7.5 14.5 19.1 4.813
No employees4 19 569......................................... 24.9 14.6 6.9 5.2 17.8 24.2 6.4141 to 4 employees 64 631........................................ 31.2 13.1 12.9 8.6 15.3 14.8 4.2155 to 9 employees 16 937........................................ 32.9 11.1 10.5 6.9 11.9 22.0 4.81610 to 19 employees 8 553..................................... 27.3 14.8 8.9 6.4 12.3 23.2 7.11720 to 49 employees 4 050..................................... 26.0 10.7 11.6 6.1 8.9 34.3 2.41850 to 99 employees 948..................................... 22.7 13.6 5.6 10.9 7.2 31.4 8.719100 employees or more 676.................................. 19.2 6.0 7.2 4.8 3.4 53.1 6.220
Black ~owned businesses 620 912........................... 17.5 8.1 6.0 6.4 28.4 15.8 17.921
With no paid employees 556 434.................................... 16.9 7.8 5.8 5.8 28.9 16.0 18.922With paid employees 64 478...................................... 22.5 10.5 8.0 11.3 24.4 14.3 9.023
No employees4 13 725......................................... 25.2 9.7 7.0 16.8 12.4 15.0 13.9241 to 4 employees 37 587........................................ 20.1 11.4 8.0 10.3 29.6 13.1 7.5255 to 9 employees 7 853........................................ 29.5 7.9 9.3 9.4 22.5 15.4 6.02610 to 19 employees 2 839..................................... 25.0 7.4 8.4 6.9 21.2 15.3 15.82720 to 49 employees 1 700..................................... 24.0 10.1 9.4 8.5 14.5 24.5 9.12850 to 99 employees 432..................................... 24.3 5.9 4.1 11.8 21.0 24.1 8.829100 employees or more 342.................................. 14.9 18.7 12.8 8.4 4.9 34.4 6.030
Other minority ~owned businesses 606 426................... 25.9 12.5 6.8 6.2 16.9 23.4 8.331
With no paid employees 470 075.................................... 24.5 10.7 5.8 6.2 19.4 24.1 9.432With paid employees 136 351...................................... 29.4 17.4 9.5 6.2 10.3 21.8 5.333
No employees4 19 989......................................... 30.9 16.3 8.8 4.5 10.7 22.6 6.1341 to 4 employees 76 636........................................ 27.0 18.4 10.8 7.9 11.4 19.4 5.1355 to 9 employees 22 862........................................ 34.9 16.8 7.7 3.9 9.1 22.4 5.33610 to 19 employees 10 051..................................... 34.5 16.7 7.0 4.1 9.1 24.2 4.43720 to 49 employees 5 034..................................... 29.6 16.1 8.7 3.5 4.9 30.7 6.63850 to 99 employees 1 075..................................... 17.9 10.5 6.8 3.7 4.7 50.8 5.639100 employees or more 705.................................. 25.0 4.7 2.0 4.8 2.7 49.8 11.040
Women ~owned businesses 5 888 883......................... 45.1 6.4 3.7 1.6 6.6 25.7 11.041
With no paid employees 5 071 110.................................... 44.5 6.1 3.3 1.5 6.9 25.8 12.042With paid employees 817 773...................................... 48.7 8.3 6.1 2.0 4.5 25.4 4.943
No employees4 127 905......................................... 40.4 5.7 9.4 2.6 5.7 29.3 6.9441 to 4 employees 435 550........................................ 51.9 8.7 5.4 1.6 5.0 23.2 4.3455 to 9 employees 134 476........................................ 49.1 9.2 5.8 2.6 3.1 26.0 4.24610 to 19 employees 67 487..................................... 50.2 8.4 3.4 3.0 4.2 24.5 6.44720 to 49 employees 35 515..................................... 38.8 8.0 10.7 1.5 1.9 33.8 5.34850 to 99 employees 10 178..................................... 37.1 4.5 4.2 1.8 3.4 44.1 4.949100 employees or more 6 663.................................. 18.5 8.3 9.0 7.9 1.2 48.8 6.250
Nonminority male ~owned businesses 10 114 456................ 47.5 8.2 2.6 1.3 4.5 26.3 9.551
With no paid employees 8 019 462.................................... 45.7 7.8 2.3 1.3 4.8 27.2 11.052With paid employees 2 094 993...................................... 54.6 9.8 3.7 1.5 3.5 23.1 3.953
No employees4 271 380......................................... 48.8 13.6 4.1 1.7 2.8 27.3 1.7541 to 4 employees 1 155 800........................................ 60.4 9.2 3.7 1.4 4.6 17.3 3.4555 to 9 employees 334 483........................................ 55.4 8.3 2.9 2.2 2.1 23.9 5.25610 to 19 employees 173 140..................................... 39.0 12.9 4.8 .4 1.8 35.5 5.75720 to 49 employees 101 938..................................... 39.7 7.3 3.9 1.6 2.3 39.0 6.15850 to 99 employees 33 406..................................... 34.3 9.4 2.6 – 2.4 46.8 4.559100 employees or more 24 846.................................. 21.1 9.4 .2 1.4 .5 61.8 5.760
1Data represent percentage of firms reporting in the designated categories.2For explanation of relative standard errors and standard errors, see Reliability of Estimates in the introductory text.3Relative standard errors are not applicable for lines 1 through 10 since these data are the result of censuses, not surveys.4Firms reported annual payroll, but did not report any employees on their payroll during specified period in 1992.
250 CHARACTERISTICS OF BUSINESS OWNERS 1992 ECONOMIC CENSUS

Standard error of estimate2 for columnmRelative
standarderror of
estimate2 3
A B C D E F G H
(X) .6 .3 .2 .2 .3 .7 .3 1
(X) .7 .3 .2 .3 .3 .9 .4 2(X) 1.2 .9 .3 .2 .3 .9 .3 3(X) 4.7 3.0 1.5 1.0 1.7 5.7 1.0 4(X) 1.4 1.2 .4 .3 .5 1.0 .3 5(X) 1.0 1.0 .6 .9 .4 1.2 .5 6(X) 1.7 1.7 .6 .3 .6 1.3 .9 7(X) 1.6 .6 1.2 .4 .4 1.2 .6 8(X) 2.1 1.8 .8 .2 .9 1.5 1.4 9(X) 2.3 2.0 .8 1.5 .3 3.2 1.9 10
– .7 .8 .8 .5 1.0 .9 .9 11
– .8 1.0 .9 .6 1.0 1.2 1.2 121.0 1.1 .5 .8 .6 1.1 .9 .6 132.0 3.7 3.1 3.4 1.3 3.1 4.2 2.4 141.0 1.6 .9 .9 .9 1.6 1.4 .8 152.0 2.7 1.6 1.4 1.7 1.8 1.8 1.0 163.0 2.3 1.9 .8 1.4 1.8 3.1 1.4 174.0 3.8 1.7 2.5 1.9 1.4 4.0 .7 186.0 3.9 4.4 1.3 3.4 1.8 3.6 3.0 198.0 5.0 2.4 1.7 2.9 1.8 4.4 1.8 20
– .7 .3 .4 .4 .9 .7 .5 21
– .9 .3 .4 .5 .9 .8 .6 221.0 1.3 1.1 1.1 1.7 .7 1.4 1.3 232.0 4.6 2.4 1.7 5.3 2.9 2.9 3.4 241.0 .9 1.6 1.4 1.6 1.5 1.4 1.5 253.0 2.5 2.2 1.7 2.1 2.1 2.2 1.8 264.0 4.2 1.8 2.1 2.3 2.1 3.2 4.4 276.0 4.9 1.6 2.3 1.9 3.6 3.2 2.5 288.0 4.6 3.3 1.1 4.9 7.4 5.6 2.5 29
– 5.4 5.0 2.4 4.0 2.1 4.5 2.2 30
– 1.3 .5 .6 .8 .9 1.0 .8 31
– 1.7 .6 .8 .9 1.1 1.3 1.0 321.0 1.5 .7 .7 .9 1.0 1.2 .5 332.0 3.9 4.7 4.4 1.5 1.6 5.5 1.4 341.0 1.9 .9 1.5 1.5 1.4 1.6 .7 352.0 2.3 2.0 1.3 .7 1.8 1.8 .7 362.0 2.2 1.5 2.1 .9 3.0 2.7 1.6 374.0 3.1 3.0 1.7 1.1 1.3 2.8 1.3 386.0 3.2 2.6 2.7 1.7 1.7 5.0 2.1 396.0 7.4 2.4 .8 3.0 1.5 6.8 2.6 40
– .7 .6 .4 .1 .5 .8 .9 41
– .8 .7 .3 .1 .5 .9 1.0 42– 1.9 .8 1.2 .2 .5 1.2 .8 43
1.0 5.0 1.1 5.1 .8 2.6 4.1 2.2 44– 2.8 1.1 .8 .2 .5 1.8 1.0 45
1.0 2.1 1.0 1.4 1.0 .6 1.5 .9 461.0 2.7 1.1 .7 1.4 1.2 1.8 1.6 471.0 3.3 1.7 3.0 .6 .5 2.0 1.0 482.0 6.1 1.8 2.8 .6 1.6 5.3 .9 492.0 4.2 3.5 2.9 3.8 .6 4.2 1.9 50
– .8 .6 .4 .4 .5 1.0 .7 51
– 1.0 .6 .4 .5 .6 1.2 .9 52– 1.5 1.2 .5 .3 .5 1.1 .3 53– 6.1 4.7 1.1 1.4 1.9 7.4 1.1 54– 1.8 1.6 .6 .6 .8 1.2 .5 55– 1.5 1.3 .6 1.0 .5 1.8 .9 56
1.0 2.2 2.4 .8 .2 .7 1.5 1.5 571.0 1.9 .6 .8 .6 .5 1.9 .7 581.0 2.5 2.5 1.0 – 1.1 1.7 2.0 591.0 3.2 2.4 .2 1.8 .3 4.2 2.6 60
1992 ECONOMIC CENSUS CHARACTERISTICS OF BUSINESS OWNERS 251

Table 30d. Percent of Minority Customers by Legal Form of Organization of Firm: 1992[All data are shown as percents, except firms. For meaning of abbreviations and symbols, see introductory text. For explanation of terms, see appendix A]
Type of firm and legal form of organization
Percent of minority customers for pay period including March 121
Firms(number)
25or less 26 to 50 51 to 75 76 to 90 More than 90
Don’tknow
Notreported
A B C D E F G H
All businesses 17 253 143..................................... 45.0 7.8 3.3 1.8 6.3 25.6 10.21
Individual proprietorships 14 599 295................................... 45.5 7.9 3.3 1.8 6.4 24.6 10.42Partnerships 1 089 578.............................................. 40.7 6.0 2.8 2.5 7.4 29.0 11.53Subchapter S corporations 1 564 270................................. 42.4 8.2 3.6 1.7 3.7 33.8 6.64
Hispanic ~owned businesses 771 708........................ 25.0 10.5 8.2 6.3 17.4 20.6 12.05
Individual proprietorships 689 015................................... 24.7 10.5 8.1 6.4 17.8 19.7 12.86Partnerships 32 650.............................................. 27.2 11.9 9.3 6.6 16.4 20.2 8.47Subchapter S corporations 50 042................................. 26.5 9.5 9.2 5.4 13.8 30.0 5.68
Black ~owned businesses 620 912........................... 17.5 8.1 6.0 6.4 28.4 15.8 17.99
Individual proprietorships 584 256................................... 17.2 8.1 6.0 6.4 28.4 15.6 18.310Partnerships 14 727.............................................. 21.7 6.3 4.8 5.4 34.0 16.5 11.211Subchapter S corporations 21 928................................. 24.2 8.1 8.6 7.1 25.3 20.5 6.212
Other minority ~owned businesses 606 426................... 25.9 12.5 6.8 6.2 16.9 23.4 8.313
Individual proprietorships 502 022................................... 25.0 11.7 7.2 6.2 19.1 22.5 8.314Partnerships 49 489.............................................. 22.9 16.0 4.7 8.7 11.9 24.5 11.315Subchapter S corporations 54 915................................. 33.2 14.6 6.3 4.0 7.8 28.4 5.716
Women ~owned businesses 5 888 883......................... 45.1 6.4 3.7 1.6 6.6 25.7 11.017
Individual proprietorships 5 078 077................................... 45.6 6.1 3.7 1.6 6.8 24.7 11.418Partnerships 243 651.............................................. 41.4 10.4 .9 1.8 3.3 28.3 13.919Subchapter S corporations 567 155................................. 41.7 7.5 4.2 1.3 5.1 34.5 5.620
Nonminority male ~owned businesses 10 114 456................ 47.5 8.2 2.6 1.3 4.5 26.3 9.521
Individual proprietorships 8 414 238................................... 48.3 8.6 2.5 1.2 4.5 25.3 9.622Partnerships 777 379.............................................. 42.5 3.9 2.9 2.0 7.7 29.9 11.123Subchapter S corporations 922 838................................. 44.3 8.4 2.8 1.5 2.0 33.7 7.424
1Data represent percentage of firms reporting in the designated categories.2For explanation of relative standard errors and standard errors, see Reliability of Estimates in the introductory text.3Relative standard errors are not applicable for lines 1 through 4 since these data are the result of censuses, not surveys.
252 CHARACTERISTICS OF BUSINESS OWNERS 1992 ECONOMIC CENSUS
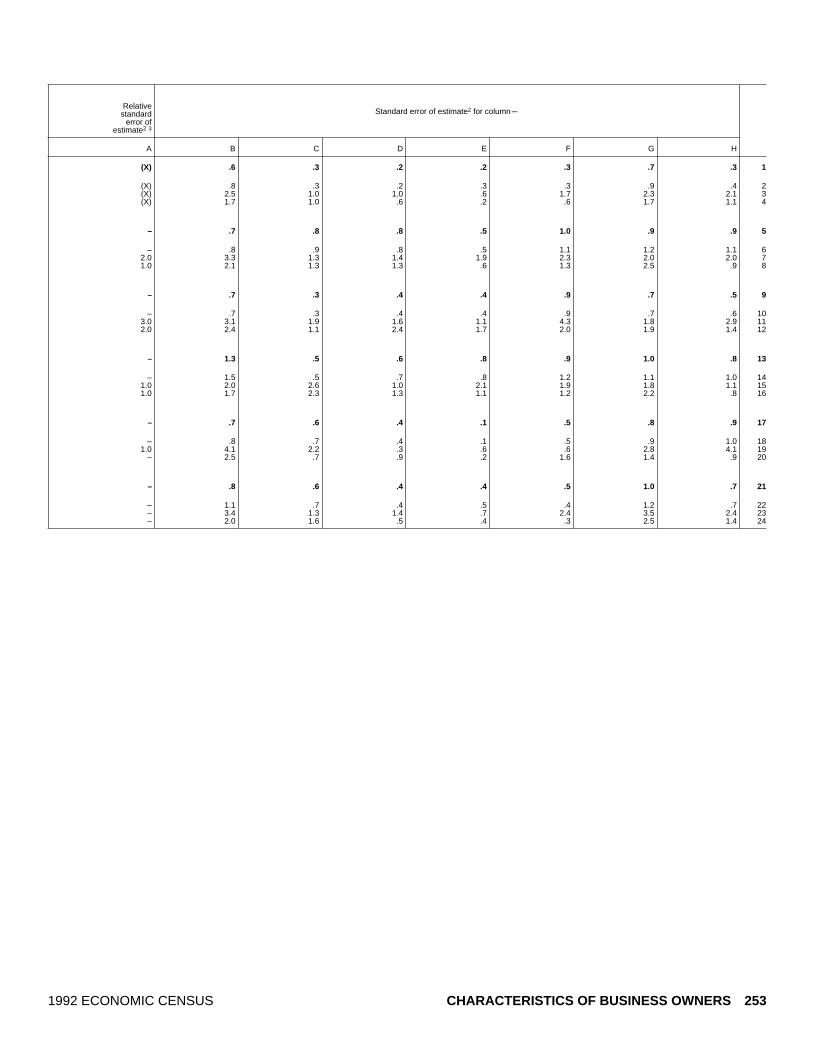
Standard error of estimate2 for columnmRelative
standarderror of
estimate2 3
A B C D E F G H
(X) .6 .3 .2 .2 .3 .7 .3 1
(X) .8 .3 .2 .3 .3 .9 .4 2(X) 2.5 1.0 1.0 .6 1.7 2.3 2.1 3(X) 1.7 1.0 .6 .2 .6 1.7 1.1 4
– .7 .8 .8 .5 1.0 .9 .9 5
– .8 .9 .8 .5 1.1 1.2 1.1 62.0 3.3 1.3 1.4 1.9 2.3 2.0 2.0 71.0 2.1 1.3 1.3 .6 1.3 2.5 .9 8
– .7 .3 .4 .4 .9 .7 .5 9
– .7 .3 .4 .4 .9 .7 .6 103.0 3.1 1.9 1.6 1.1 4.3 1.8 2.9 112.0 2.4 1.1 2.4 1.7 2.0 1.9 1.4 12
– 1.3 .5 .6 .8 .9 1.0 .8 13
– 1.5 .5 .7 .8 1.2 1.1 1.0 141.0 2.0 2.6 1.0 2.1 1.9 1.8 1.1 151.0 1.7 2.3 1.3 1.1 1.2 2.2 .8 16
– .7 .6 .4 .1 .5 .8 .9 17
– .8 .7 .4 .1 .5 .9 1.0 181.0 4.1 2.2 .3 .6 .6 2.8 4.1 19
– 2.5 .7 .9 .2 1.6 1.4 .9 20
– .8 .6 .4 .4 .5 1.0 .7 21
– 1.1 .7 .4 .5 .4 1.2 .7 22– 3.4 1.3 1.4 .7 2.4 3.5 2.4 23– 2.0 1.6 .5 .4 .3 2.5 1.4 24
1992 ECONOMIC CENSUS CHARACTERISTICS OF BUSINESS OWNERS 253

Table 31a. Total Sales of 10 Percent or More to Customer Categories by Industry Division:[All data are shown as percents, except firms. For meaning of abbreviations and symbols, see introductory text. For explanation of terms, see appendix A]
Type of firm and industry division
Customer categories accounting for 10 percent or more of business’s total salesof goods/services1
Firms(number)
FederalGovernment State government Local government
Otherbusinesses
and/orcorporations
A B C D E
All businesses 17 253 143.................................................... 2.6 2.3 2.8 30.11
Agricultural services, forestry, fishing, and mining 583 253............................ 2.3 1.1 1.4 28.42Construction 1 829 620............................................................ 3.0 2.3 4.0 29.43Manufacturing 517 714........................................................... 1.9 1.7 3.7 59.24Transportation, communications, and utilities 698 903................................ 3.2 1.8 3.0 38.85Wholesale trade 538 339......................................................... 2.0 1.3 3.7 60.36
Retail trade 2 478 045............................................................. 1.6 1.4 1.7 14.77Finance, insurance, and real estate 1 941 029........................................ 3.3 1.4 1.2 26.78Services 7 784 016................................................................ 2.8 3.2 3.4 31.69Industries not classified 882 224................................................... 1.0 1.1 2.3 28.210
Hispanic ~owned businesses 771 708....................................... 3.8 2.8 3.1 25.011
Agricultural services, forestry, fishing, and mining 32 927............................ 4.6 3.4 1.8 14.112Construction 97 476............................................................ 3.9 2.5 4.1 26.513Manufacturing 18 461........................................................... 3.8 1.5 2.3 51.814Transportation, communications, and utilities 47 797................................ 4.0 1.3 4.6 36.515Wholesale trade 17 727......................................................... 2.8 1.0 4.5 56.616
Retail trade 107 846............................................................. 2.9 2.5 4.3 11.417Finance, insurance, and real estate 49 231........................................ 1.1 1.3 1.6 22.818Services 347 297................................................................ 4.4 3.6 2.7 26.819Industries not classified 52 945................................................... 3.6 2.7 1.4 16.120
Black ~owned businesses 620 912.......................................... 4.4 3.6 3.5 16.421
Agricultural services, forestry, fishing, and mining 10 309............................ 5.4 3.2 4.1 17.522Construction 43 381............................................................ 4.9 3.2 4.1 20.423Manufacturing 10 469........................................................... 4.0 1.6 2.7 34.724Transportation, communications, and utilities 49 095............................... 3.4 1.2 4.8 22.225Wholesale trade 7 550......................................................... 3.1 2.6 6.0 34.426
Retail trade 86 840............................................................. 2.2 2.1 1.4 5.627Finance, insurance, and real estate 40 924........................................ 5.0 3.1 1.9 13.528Services 332 981................................................................ 5.1 4.5 3.7 17.529Industries not classified 39 363................................................... 4.2 3.8 4.8 14.130
Other minority ~owned businesses 606 426................................. 3.3 3.1 3.3 25.831
Agricultural services, forestry, fishing, and mining 15 218............................ 3.1 3.1 1.7 20.932Construction 28 295............................................................ 6.6 3.4 3.9 26.833Manufacturing 18 976........................................................... 2.6 .4 2.3 51.434Transportation, communications, and utilities 24 362................................ 2.8 1.6 4.5 31.535Wholesale trade 20 043......................................................... 1.5 1.5 2.3 62.536
Retail trade 132 483............................................................. 1.8 2.7 2.8 10.337Finance, insurance, and real estate 64 762........................................ .9 .7 .9 24.238Services 273 774................................................................ 4.9 4.5 4.4 29.439Industries not classified 28 512................................................... 1.4 1.6 1.8 20.740
Women ~owned businesses 5 888 883........................................ 2.5 2.1 3.0 23.541
Agricultural services, forestry, fishing, and mining 119 731............................ 1.8 .9 1.3 24.942Construction 183 695............................................................ 1.8 2.4 5.5 33.143Manufacturing 152 346........................................................... 2.4 1.1 3.7 51.544Transportation, communications, and utilities 141 623................................ 4.4 2.2 1.9 40.245Wholesale trade 154 542......................................................... 3.0 1.6 3.9 52.746
Retail trade 1 093 342............................................................. 2.2 1.5 1.8 11.347Finance, insurance, and real estate 602 802........................................ 4.5 1.9 2.0 19.248Services 3 158 444................................................................ 2.2 2.4 3.4 24.649Industries not classified 282 358................................................... 1.7 2.1 4.0 20.950
Nonminority male ~owned businesses 10 114 456.............................. 2.4 2.4 2.7 34.451
Agricultural services, forestry, fishing, and mining 412 917............................ 2.1 .9 1.3 30.952Construction 1 496 056............................................................ 3.0 2.3 3.8 29.453Manufacturing 333 485........................................................... 1.4 2.0 3.7 63.554Transportation, communications, and utilities 458 400................................ 2.8 1.7 2.9 40.455Wholesale trade 352 721......................................................... 1.5 1.2 3.7 63.856
Retail trade 1 197 943............................................................. .7 1.2 1.5 18.557Finance, insurance, and real estate 1 240 594........................................ 2.8 1.2 .8 30.358Services 4 102 294................................................................ 3.0 3.7 3.3 37.159Industries not classified 520 046................................................... .3 .3 1.4 33.660
1Data represent percentage of firms reporting in the designated categories. Sum of percents in categories will not equal 100 since multiple responses were allowed.2For explanation of relative standard errors and standard errors, see Reliability of Estimates in the introductory text.3Relative standard errors are not applicable for lines 1 through 10 since these data are the result of censuses, not surveys.
254 CHARACTERISTICS OF BUSINESS OWNERS 1992 ECONOMIC CENSUS

1992
Customer categories accounting for 10 percent or more ofbusiness’s total sales of goods/services1
mCon.
Standard error of estimate2 for columnm
Individuals All othersNot
reported
Relativestandard
error ofestimate2 3
F G H A B C D E F G H
52.8 6.0 22.6 (X) .2 .2 .2 .8 .8 .3 .8 1
46.0 6.2 29.2 (X) .6 .5 .4 2.7 3.0 .9 1.3 263.7 5.4 16.8 (X) 1.0 .7 1.0 2.0 2.1 1.2 1.2 337.4 5.8 13.5 (X) .3 .5 .7 2.2 3.1 .8 1.1 433.4 6.8 27.2 (X) .8 .6 1.4 2.2 2.2 1.4 1.6 533.7 6.8 13.6 (X) .4 .2 .3 2.0 1.8 .9 1.4 6
68.8 6.3 21.0 (X) .6 .4 .4 .9 1.4 .6 1.2 755.0 4.5 22.2 (X) .5 .5 .3 1.2 1.7 .6 1.3 850.6 6.2 23.5 (X) .4 .4 .4 1.3 1.5 .7 1.4 941.0 6.2 34.2 (X) .3 .3 .6 1.9 2.5 .9 2.2 10
46.7 6.5 27.9 – .3 .3 .3 .5 1.5 .4 1.0 11
49.2 4.4 33.6 1.0 1.0 .6 .7 1.6 2.2 1.1 2.2 1246.2 6.9 29.8 1.0 .8 .7 .9 1.9 2.4 1.0 1.6 1333.5 6.7 17.5 1.0 1.5 .9 .6 2.3 2.4 1.3 1.7 1430.1 8.3 32.4 1.0 .8 .4 .8 2.2 3.9 1.5 2.6 1532.6 6.9 14.9 2.0 .6 .4 1.0 1.6 2.7 1.2 2.1 16
62.3 6.7 25.0 1.0 1.0 .7 1.3 1.3 1.4 1.3 1.7 1757.4 7.4 20.6 1.0 .4 .5 .6 2.1 2.3 1.1 2.3 1844.5 6.1 28.0 – .5 .7 .6 1.1 2.6 .6 1.8 1943.0 6.8 36.3 1.0 1.1 .9 .7 1.5 2.7 1.1 2.8 20
45.6 6.0 32.7 – .2 .3 .3 .8 .8 .4 1.0 21
43.7 4.8 35.4 1.0 .8 .5 1.3 1.7 1.8 1.0 1.9 2250.6 5.7 27.2 – .8 1.0 .5 1.7 1.8 1.6 1.5 2337.7 7.6 29.9 1.0 .6 .5 .9 1.6 2.9 1.7 2.2 2435.0 7.7 34.3 – .8 .4 1.0 2.0 1.7 1.3 1.4 2543.3 8.4 21.2 2.0 .8 .9 1.2 2.7 2.2 1.1 2.0 26
60.4 4.7 30.4 – .6 .3 .4 .7 1.4 .8 1.5 2763.5 6.1 21.5 1.0 .7 .7 .6 1.4 .9 .9 1.4 2842.1 6.0 33.9 – .4 .6 .6 1.5 1.3 .4 1.7 2939.2 6.0 41.9 – .9 1.0 1.0 1.7 2.4 .5 2.8 30
54.2 9.4 17.5 – .4 .5 .3 1.1 1.6 .7 .9 31
43.0 10.4 28.9 1.0 1.4 1.2 .7 1.9 4.2 2.4 3.9 3253.5 8.2 17.8 1.0 2.2 1.4 1.0 1.9 2.9 1.9 1.8 3330.2 10.5 17.3 1.0 .7 .1 .9 5.0 4.8 2.4 3.3 3436.6 11.8 24.3 1.0 1.1 .9 1.7 2.8 3.5 2.7 2.8 3527.9 10.0 10.8 1.0 .5 .8 .7 3.5 4.3 1.5 2.8 36
69.5 10.4 14.8 1.0 .7 1.1 .7 1.0 1.4 1.4 1.5 3762.8 6.2 15.9 1.0 .1 .2 .9 3.4 2.9 1.5 3.2 3850.9 9.6 17.7 – .7 .8 .6 1.7 2.6 1.5 2.0 3950.1 8.7 25.3 1.0 .6 .7 .9 2.0 3.5 2.0 3.4 40
51.5 4.9 27.5 – .2 .3 .4 1.1 1.1 .2 1.3 41
45.6 5.4 34.5 – .8 .5 .5 2.2 4.0 1.5 4.2 4261.0 7.0 16.9 – .5 .5 1.1 2.5 2.8 1.1 2.3 4346.5 5.4 15.3 – 1.0 .5 .7 2.7 3.1 .6 2.0 4446.2 6.0 20.2 – 1.0 .8 .4 3.0 3.4 .8 2.7 4540.6 6.9 15.0 – .8 .3 .7 1.9 2.4 1.3 2.2 46
65.6 4.7 25.0 – 1.2 .9 .7 1.7 2.8 1.4 2.6 4757.4 5.4 24.3 – 1.0 .9 .9 1.5 2.1 1.4 1.9 4847.1 4.4 30.1 – .2 .3 .4 1.8 1.7 .5 1.8 4940.8 5.7 36.7 – .9 .8 1.2 3.4 3.5 1.0 4.2 50
54.1 6.3 19.6 – .4 .3 .3 1.2 1.5 .5 1.2 51
46.0 6.4 27.2 – 1.0 .7 .6 3.6 3.9 1.3 2.0 5265.5 5.0 15.7 – 1.2 .9 1.2 2.6 2.6 1.5 1.5 5333.8 5.6 12.2 – .4 .8 1.1 3.3 4.6 1.2 1.5 5429.8 6.5 28.2 – 1.5 1.0 2.5 3.1 3.8 2.1 2.6 5530.9 6.6 13.1 – .3 .4 .5 2.9 2.2 1.3 2.1 56
72.5 7.3 17.5 – .4 .4 .3 1.8 3.0 1.0 2.6 5753.3 3.9 21.8 – .7 .8 .3 2.0 2.5 .9 1.9 5853.8 7.3 18.7 – .7 .9 .6 2.2 2.6 1.1 2.2 5940.8 6.3 32.7 – .2 .2 .6 2.0 3.9 1.6 2.8 60
1992 ECONOMIC CENSUS CHARACTERISTICS OF BUSINESS OWNERS 255

Table 31b. Total Sales of 10 Percent or More to Customer Categories by Receipts Size of Firm:[All data are shown as percents, except firms. For meaning of abbreviations and symbols, see introductory text. For explanation of terms, see appendix A]
Type of firm and receipts size
Customer categories accounting for 10 percent or more of business’s total salesof goods/services1
Firms(number)
FederalGovernment State government Local government
Otherbusinesses
and/orcorporations
A B C D E
All businesses 17 253 143.................................................... 2.6 2.3 2.8 30.11
Less than $5,000 5 226 553........................................................ 1.7 1.9 1.9 20.62$5,000 to $9,999 2 443 946........................................................ 1.5 1.0 1.3 24.13$10,000 to $24,999 3 076 410...................................................... 2.2 1.9 2.8 29.64$25,000 to $49,999 1 945 806...................................................... 4.3 4.3 3.3 32.85$50,000 to $99,999 1 615 940...................................................... 2.9 1.8 4.2 42.66
$100,000 to $199,999 1 197 996.................................................... 3.6 2.6 4.8 39.77$200,000 to $249,999 301 794.................................................... 2.7 3.0 4.3 37.68$250,000 to $499,999 682 583.................................................... 3.8 4.0 3.5 40.19$500,000 to $999,999 372 078.................................................... 4.2 3.5 4.4 43.410$1,000,000 or more 390 037...................................................... 4.4 4.5 5.8 55.611
Hispanic ~owned businesses 771 708....................................... 3.8 2.8 3.1 25.012
Less than $5,000 219 226........................................................ 2.3 1.6 1.8 18.113$5,000 to $9,999 140 362........................................................ 2.9 1.3 1.7 14.014$10,000 to $24,999 165 667...................................................... 6.0 3.8 2.1 20.715$25,000 to $49,999 87 288...................................................... 2.4 3.0 3.8 33.516$50,000 to $99,999 64 742...................................................... 3.9 3.9 6.4 34.317
$100,000 to $199,999 41 578.................................................... 3.0 3.3 4.0 35.618$200,000 to $249,999 10 030.................................................... 6.5 5.7 3.3 32.219$250,000 to $499,999 22 301.................................................... 7.2 4.4 5.0 38.720$500,000 to $999,999 11 319.................................................... 5.2 4.2 5.4 42.421$1,000,000 or more 9 194...................................................... 6.5 5.4 9.1 48.822
Black ~owned businesses 620 912.......................................... 4.4 3.6 3.5 16.423
Less than $5,000 236 722........................................................ 3.1 3.2 2.9 10.324$5,000 to $9,999 111 512........................................................ 4.2 2.7 3.6 16.425$10,000 to $24,999 129 901...................................................... 4.7 3.2 2.9 15.526$25,000 to $49,999 62 209...................................................... 4.7 3.7 4.0 23.627$50,000 to $99,999 39 218...................................................... 6.1 4.7 4.0 30.428
$100,000 to $199,999 20 936.................................................... 9.3 7.7 7.1 28.729$200,000 to $249,999 4 533.................................................... 9.0 10.0 4.8 28.630$250,000 to $499,999 9 029.................................................... 9.9 10.4 8.0 26.931$500,000 to $999,999 3 823.................................................... 14.3 12.6 10.4 36.532$1,000,000 or more 3 028...................................................... 14.7 9.8 9.3 41.033
Other minority ~owned businesses 606 426................................. 3.3 3.1 3.3 25.834
Less than $5,000 132 493........................................................ 2.0 2.2 3.3 20.035$5,000 to $9,999 80 435........................................................ .4 .9 2.3 23.736$10,000 to $24,999 108 195...................................................... 1.0 1.4 4.1 25.237$25,000 to $49,999 77 345...................................................... 4.7 3.6 2.5 28.238$50,000 to $99,999 70 360...................................................... 4.7 2.9 3.2 27.739
$100,000 to $199,999 58 620.................................................... 4.0 3.7 2.7 25.140$200,000 to $249,999 15 740.................................................... 4.2 5.5 2.4 19.741$250,000 to $499,999 34 266.................................................... 7.0 7.0 3.5 27.642$500,000 to $999,999 16 467.................................................... 5.1 4.9 5.9 35.643$1,000,000 or more 12 505...................................................... 9.0 7.8 7.7 49.744
Women ~owned businesses 5 888 883........................................ 2.5 2.1 3.0 23.545
Less than $5,000 2 310 303........................................................ 2.1 1.7 2.7 17.846$5,000 to $9,999 967 380........................................................ 1.7 1.3 1.8 20.047$10,000 to $24,999 1 051 358...................................................... 2.9 2.7 2.3 22.348$25,000 to $49,999 538 885...................................................... 3.0 1.6 2.5 27.949$50,000 to $99,999 381 517...................................................... 3.6 2.4 6.8 33.750
$100,000 to $199,999 267 089.................................................... 1.7 2.8 5.1 37.251$200,000 to $249,999 66 464.................................................... 1.7 1.7 2.0 33.752$250,000 to $499,999 146 313.................................................... 3.7 4.0 3.2 36.553$500,000 to $999,999 80 539.................................................... 4.8 4.6 7.1 42.054$1,000,000 or more 79 037...................................................... 6.3 6.8 6.9 54.455
Nonminority male ~owned businesses 10 114 456.............................. 2.4 2.4 2.7 34.456
Less than $5,000 2 608 047........................................................ 1.3 1.9 1.1 23.157$5,000 to $9,999 1 285 456........................................................ 1.0 .7 .8 27.858$10,000 to $24,999 1 763 830...................................................... 1.5 1.4 3.1 35.559$25,000 to $49,999 1 248 482...................................................... 5.0 5.6 3.7 35.060$50,000 to $99,999 1 108 065...................................................... 2.4 1.3 3.2 46.861
$100,000 to $199,999 840 723.................................................... 4.0 2.3 4.9 41.562$200,000 to $249,999 212 693.................................................... 2.7 3.1 5.3 40.763$250,000 to $499,999 488 462.................................................... 3.3 3.7 3.5 42.164$500,000 to $999,999 266 408.................................................... 3.9 3.0 3.4 44.465$1,000,000 or more 292 290...................................................... 3.6 3.8 5.4 56.566
1Data represent percentage of firms reporting in the designated categories. Sum of percents in categories will not equal 100 since multiple responses were allowed.2For explanation of relative standard errors and standard errors, see Reliability of Estimates in the introductory text.3Relative standard errors are not applicable for lines 1 through 11 since these data are the result of censuses, not surveys.
256 CHARACTERISTICS OF BUSINESS OWNERS 1992 ECONOMIC CENSUS
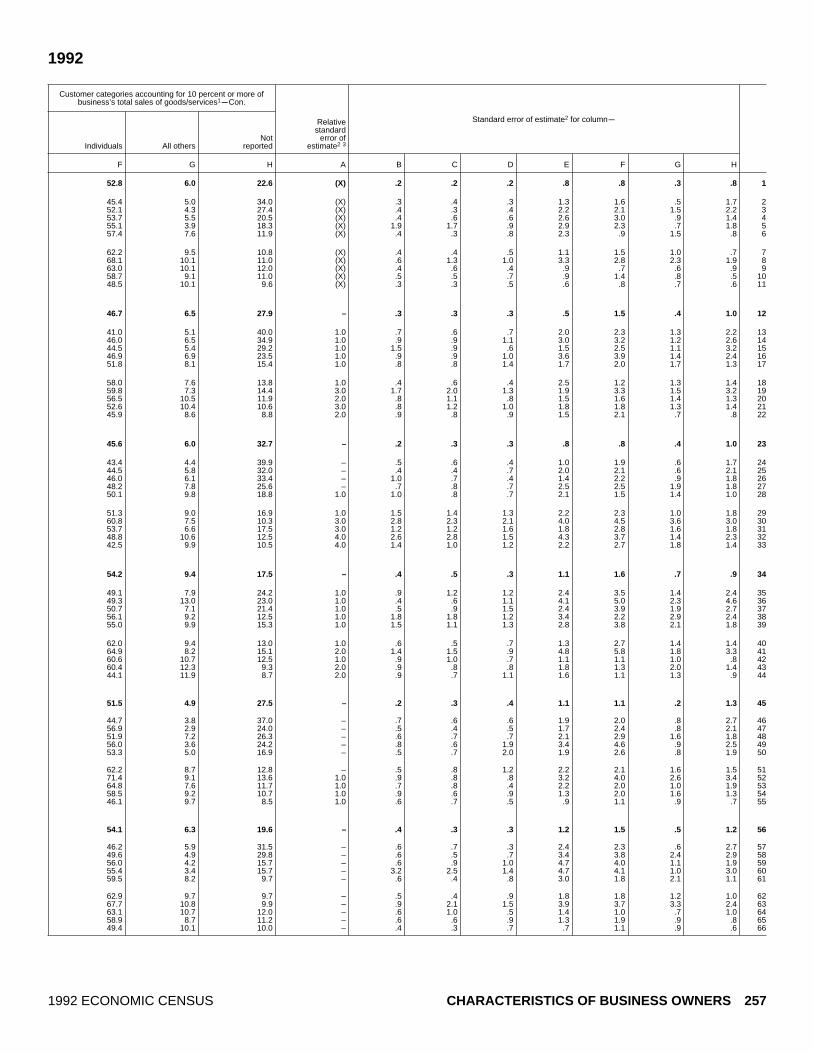
1992
Customer categories accounting for 10 percent or more ofbusiness’s total sales of goods/services1
mCon.
Standard error of estimate2 for columnm
Individuals All othersNot
reported
Relativestandard
error ofestimate2 3
F G H A B C D E F G H
52.8 6.0 22.6 (X) .2 .2 .2 .8 .8 .3 .8 1
45.4 5.0 34.0 (X) .3 .4 .3 1.3 1.6 .5 1.7 252.1 4.3 27.4 (X) .4 .3 .4 2.2 2.1 1.5 2.2 353.7 5.5 20.5 (X) .4 .6 .6 2.6 3.0 .9 1.4 455.1 3.9 18.3 (X) 1.9 1.7 .9 2.9 2.3 .7 1.8 557.4 7.6 11.9 (X) .4 .3 .8 2.3 .9 1.5 .8 6
62.2 9.5 10.8 (X) .4 .4 .5 1.1 1.5 1.0 .7 768.1 10.1 11.0 (X) .6 1.3 1.0 3.3 2.8 2.3 1.9 863.0 10.1 12.0 (X) .4 .6 .4 .9 .7 .6 .9 958.7 9.1 11.0 (X) .5 .5 .7 .9 1.4 .8 .5 1048.5 10.1 9.6 (X) .3 .3 .5 .6 .8 .7 .6 11
46.7 6.5 27.9 – .3 .3 .3 .5 1.5 .4 1.0 12
41.0 5.1 40.0 1.0 .7 .6 .7 2.0 2.3 1.3 2.2 1346.0 6.5 34.9 1.0 .9 .9 1.1 3.0 3.2 1.2 2.6 1444.5 5.4 29.2 1.0 1.5 .9 .6 1.5 2.5 1.1 3.2 1546.9 6.9 23.5 1.0 .9 .9 1.0 3.6 3.9 1.4 2.4 1651.8 8.1 15.4 1.0 .8 .8 1.4 1.7 2.0 1.7 1.3 17
58.0 7.6 13.8 1.0 .4 .6 .4 2.5 1.2 1.3 1.4 1859.8 7.3 14.4 3.0 1.7 2.0 1.3 1.9 3.3 1.5 3.2 1956.5 10.5 11.9 2.0 .8 1.1 .8 1.5 1.6 1.4 1.3 2052.6 10.4 10.6 3.0 .8 1.2 1.0 1.8 1.8 1.3 1.4 2145.9 8.6 8.8 2.0 .9 .8 .9 1.5 2.1 .7 .8 22
45.6 6.0 32.7 – .2 .3 .3 .8 .8 .4 1.0 23
43.4 4.4 39.9 – .5 .6 .4 1.0 1.9 .6 1.7 2444.5 5.8 32.0 – .4 .4 .7 2.0 2.1 .6 2.1 2546.0 6.1 33.4 – 1.0 .7 .4 1.4 2.2 .9 1.8 2648.2 7.8 25.6 – .7 .8 .7 2.5 2.5 1.9 1.8 2750.1 9.8 18.8 1.0 1.0 .8 .7 2.1 1.5 1.4 1.0 28
51.3 9.0 16.9 1.0 1.5 1.4 1.3 2.2 2.3 1.0 1.8 2960.8 7.5 10.3 3.0 2.8 2.3 2.1 4.0 4.5 3.6 3.0 3053.7 6.6 17.5 3.0 1.2 1.2 1.6 1.8 2.8 1.6 1.8 3148.8 10.6 12.5 4.0 2.6 2.8 1.5 4.3 3.7 1.4 2.3 3242.5 9.9 10.5 4.0 1.4 1.0 1.2 2.2 2.7 1.8 1.4 33
54.2 9.4 17.5 – .4 .5 .3 1.1 1.6 .7 .9 34
49.1 7.9 24.2 1.0 .9 1.2 1.2 2.4 3.5 1.4 2.4 3549.3 13.0 23.0 1.0 .4 .6 1.1 4.1 5.0 2.3 4.6 3650.7 7.1 21.4 1.0 .5 .9 1.5 2.4 3.9 1.9 2.7 3756.1 9.2 12.5 1.0 1.8 1.8 1.2 3.4 2.2 2.9 2.4 3855.0 9.9 15.3 1.0 1.5 1.1 1.3 2.8 3.8 2.1 1.8 39
62.0 9.4 13.0 1.0 .6 .5 .7 1.3 2.7 1.4 1.4 4064.9 8.2 15.1 2.0 1.4 1.5 .9 4.8 5.8 1.8 3.3 4160.6 10.7 12.5 1.0 .9 1.0 .7 1.1 1.1 1.0 .8 4260.4 12.3 9.3 2.0 .9 .8 .8 1.8 1.3 2.0 1.4 4344.1 11.9 8.7 2.0 .9 .7 1.1 1.6 1.1 1.3 .9 44
51.5 4.9 27.5 – .2 .3 .4 1.1 1.1 .2 1.3 45
44.7 3.8 37.0 – .7 .6 .6 1.9 2.0 .8 2.7 4656.9 2.9 24.0 – .5 .4 .5 1.7 2.4 .8 2.1 4751.9 7.2 26.3 – .6 .7 .7 2.1 2.9 1.6 1.8 4856.0 3.6 24.2 – .8 .6 1.9 3.4 4.6 .9 2.5 4953.3 5.0 16.9 – .5 .7 2.0 1.9 2.6 .8 1.9 50
62.2 8.7 12.8 – .5 .8 1.2 2.2 2.1 1.6 1.5 5171.4 9.1 13.6 1.0 .9 .8 .8 3.2 4.0 2.6 3.4 5264.8 7.6 11.7 1.0 .7 .8 .4 2.2 2.0 1.0 1.9 5358.5 9.2 10.7 1.0 .9 .6 .9 1.3 2.0 1.6 1.3 5446.1 9.7 8.5 1.0 .6 .7 .5 .9 1.1 .9 .7 55
54.1 6.3 19.6 – .4 .3 .3 1.2 1.5 .5 1.2 56
46.2 5.9 31.5 – .6 .7 .3 2.4 2.3 .6 2.7 5749.6 4.9 29.8 – .6 .5 .7 3.4 3.8 2.4 2.9 5856.0 4.2 15.7 – .6 .9 1.0 4.7 4.0 1.1 1.9 5955.4 3.4 15.7 – 3.2 2.5 1.4 4.7 4.1 1.0 3.0 6059.5 8.2 9.7 – .6 .4 .8 3.0 1.8 2.1 1.1 61
62.9 9.7 9.7 – .5 .4 .9 1.8 1.8 1.2 1.0 6267.7 10.8 9.9 – .9 2.1 1.5 3.9 3.7 3.3 2.4 6363.1 10.7 12.0 – .6 1.0 .5 1.4 1.0 .7 1.0 6458.9 8.7 11.2 – .6 .6 .9 1.3 1.9 .9 .8 6549.4 10.1 10.0 – .4 .3 .7 .7 1.1 .9 .6 66
1992 ECONOMIC CENSUS CHARACTERISTICS OF BUSINESS OWNERS 257

Table 31c. Total Sales of 10 Percent or More to Customer Categories by Employment Size of[All data are shown as percents, except firms. For meaning of abbreviations and symbols, see introductory text. For explanation of terms, see appendix A]
Type of firm and employment size
Customer categories accounting for 10 percent or more of business’s total salesof goods/services1
Firms(number)
FederalGovernment State government Local government
Otherbusinesses
and/orcorporations
A B C D E
All businesses 17 253 143.................................................... 2.6 2.3 2.8 30.11
With no paid employees 14 118 184.................................................. 2.4 2.1 2.3 27.72With paid employees 3 134 959..................................................... 3.3 3.1 5.1 40.73
No employees4 435 838........................................................ 4.3 2.7 2.2 43.441 to 4 employees 1 716 076...................................................... 2.7 2.5 5.8 37.455 to 9 employees 503 808...................................................... 3.9 4.3 4.4 43.3610 to 19 employees 256 110.................................................... 3.5 3.6 6.6 45.2720 to 49 employees 144 734.................................................... 3.4 4.0 5.5 48.4850 to 99 employees 45 331.................................................... 5.7 5.2 4.5 47.69100 employees or more 33 062................................................ 8.5 11.5 5.1 65.510
Hispanic ~owned businesses 771 708....................................... 3.8 2.8 3.1 25.011
With no paid employees 656 343.................................................. 3.6 2.4 2.5 22.712With paid employees 115 364..................................................... 4.7 4.7 5.6 34.513
No employees4 19 569........................................................ 3.4 1.5 3.7 34.6141 to 4 employees 64 631...................................................... 4.5 5.6 5.4 32.4155 to 9 employees 16 937...................................................... 5.5 4.2 5.7 37.11610 to 19 employees 8 553.................................................... 5.4 3.7 7.2 36.41720 to 49 employees 4 050.................................................... 6.4 4.7 9.6 45.21850 to 99 employees 948.................................................... 10.7 10.1 12.4 43.419100 employees or more 676................................................ 7.4 9.0 7.8 48.620
Black ~owned businesses 620 912.......................................... 4.4 3.6 3.5 16.421
With no paid employees 556 434.................................................. 4.1 3.3 3.2 15.222With paid employees 64 478..................................................... 7.3 6.2 5.8 26.923
No employees4 13 725........................................................ 3.5 4.5 4.7 26.1241 to 4 employees 37 587...................................................... 7.0 5.6 5.6 24.6255 to 9 employees 7 853...................................................... 11.1 9.9 7.9 31.52610 to 19 employees 2 839.................................................... 12.5 12.7 7.8 42.52720 to 49 employees 1 700.................................................... 14.9 9.5 9.4 35.72850 to 99 employees 432.................................................... 9.4 4.5 5.2 26.429100 employees or more 342................................................ 24.4 10.2 2.2 53.930
Other minority ~owned businesses 606 426................................. 3.3 3.1 3.3 25.831
With no paid employees 470 075.................................................. 2.8 2.7 3.1 25.032With paid employees 136 351..................................................... 4.8 4.0 3.9 28.133
No employees4 19 989........................................................ 4.3 2.9 2.2 23.9341 to 4 employees 76 636...................................................... 4.3 3.8 3.8 27.0355 to 9 employees 22 862...................................................... 5.1 3.9 2.8 26.73610 to 19 employees 10 051.................................................... 3.7 4.2 6.2 32.23720 to 49 employees 5 034.................................................... 8.3 8.0 7.5 40.33850 to 99 employees 1 075.................................................... 15.9 11.2 4.2 51.239100 employees or more 705................................................ 14.8 11.2 7.4 52.740
Women ~owned businesses 5 888 883........................................ 2.5 2.1 3.0 23.541
With no paid employees 5 071 110.................................................. 2.4 2.0 2.4 21.142With paid employees 817 773..................................................... 2.9 2.9 6.5 37.443
No employees4 127 905........................................................ 3.6 1.7 3.5 36.0441 to 4 employees 435 550...................................................... 1.9 1.9 7.9 36.3455 to 9 employees 134 476...................................................... 2.6 3.8 4.4 41.54610 to 19 employees 67 487.................................................... 5.0 5.1 6.0 35.04720 to 49 employees 35 515.................................................... 5.1 5.9 5.6 40.24850 to 99 employees 10 178.................................................... 8.9 10.6 9.7 47.349100 employees or more 6 663................................................ 18.2 22.9 7.3 54.150
Nonminority male ~owned businesses 10 114 456.............................. 2.4 2.4 2.7 34.451
With no paid employees 8 019 462.................................................. 2.2 2.2 2.2 32.152With paid employees 2 094 993..................................................... 3.2 3.0 4.7 43.253
No employees4 271 380........................................................ 4.7 3.2 1.4 49.2541 to 4 employees 1 155 800...................................................... 2.8 2.4 5.2 38.9555 to 9 employees 334 483...................................................... 4.2 4.5 4.3 45.25610 to 19 employees 173 140.................................................... 2.7 2.8 6.8 50.15720 to 49 employees 101 938.................................................... 2.5 3.2 5.2 51.65850 to 99 employees 33 406.................................................... 4.4 3.6 3.1 48.059100 employees or more 24 846................................................ 5.2 8.2 4.3 70.260
1Data represent percentage of firms reporting in the designated categories. Sum of percents in categories will not equal 100 since multiple responses were allowed.2For explanation of relative standard errors and standard errors, see Reliability of Estimates in the introductory text.3Relative standard errors are not applicable for lines 1 through 10 since these data are the result of censuses, not surveys.4Firms reported annual payroll, but did not report any employees on their payroll during specified period in 1992.
258 CHARACTERISTICS OF BUSINESS OWNERS 1992 ECONOMIC CENSUS
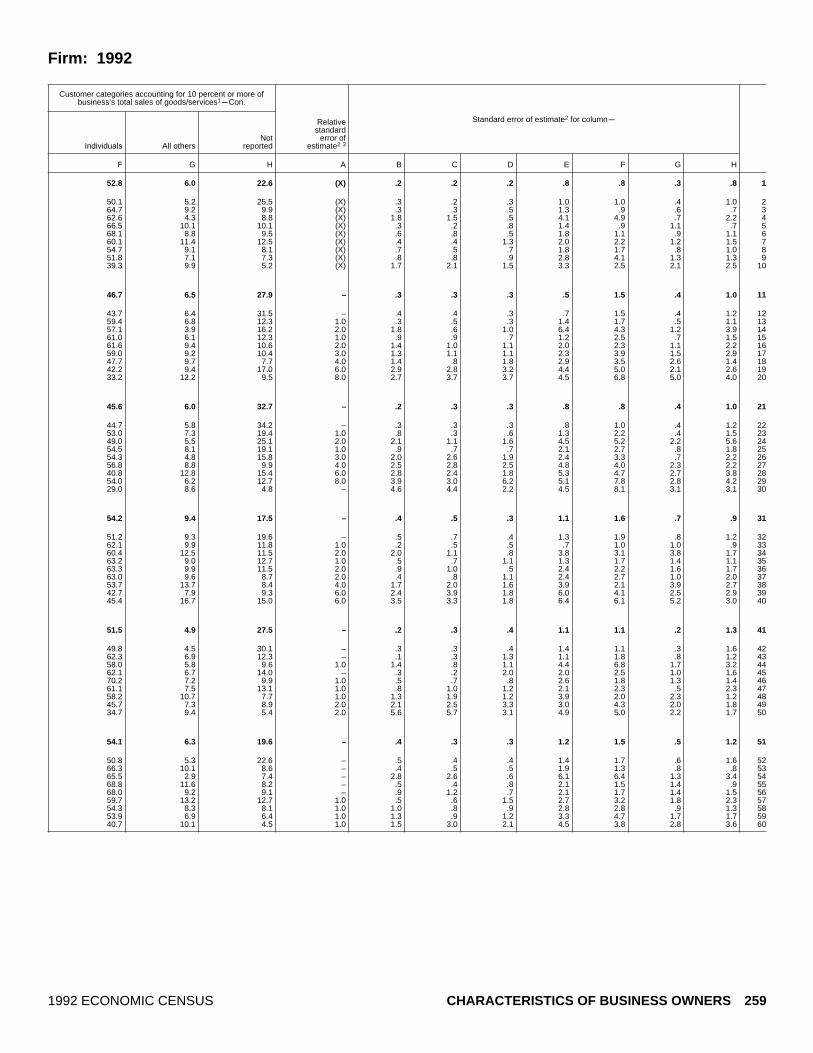
Firm: 1992
Customer categories accounting for 10 percent or more ofbusiness’s total sales of goods/services1
mCon.
Standard error of estimate2 for columnm
Individuals All othersNot
reported
Relativestandard
error ofestimate2 3
F G H A B C D E F G H
52.8 6.0 22.6 (X) .2 .2 .2 .8 .8 .3 .8 1
50.1 5.2 25.5 (X) .3 .2 .3 1.0 1.0 .4 1.0 264.7 9.2 9.9 (X) .3 .3 .5 1.3 .9 .6 .7 362.6 4.3 8.8 (X) 1.8 1.5 .5 4.1 4.9 .7 2.2 466.5 10.1 10.1 (X) .3 .2 .8 1.4 .9 1.1 .7 568.1 8.8 9.5 (X) .6 .8 .5 1.8 1.1 .9 1.1 660.1 11.4 12.5 (X) .4 .4 1.3 2.0 2.2 1.2 1.5 754.7 9.1 8.1 (X) .7 .5 .7 1.8 1.7 .8 1.0 851.8 7.1 7.3 (X) .8 .8 .9 2.8 4.1 1.3 1.3 939.3 9.9 5.2 (X) 1.7 2.1 1.5 3.3 2.5 2.1 2.5 10
46.7 6.5 27.9 – .3 .3 .3 .5 1.5 .4 1.0 11
43.7 6.4 31.5 – .4 .4 .3 .7 1.5 .4 1.2 1259.4 6.8 12.3 1.0 .3 .5 .3 1.4 1.7 .5 1.1 1357.1 3.9 16.2 2.0 1.8 .6 1.0 6.4 4.3 1.2 3.9 1461.0 6.1 12.3 1.0 .9 .9 .7 1.2 2.5 .7 1.5 1561.6 9.4 10.6 2.0 1.4 1.0 1.1 2.0 2.3 1.1 2.2 1659.0 9.2 10.4 3.0 1.3 1.1 1.1 2.3 3.9 1.5 2.9 1747.7 9.7 7.7 4.0 1.4 .8 1.8 2.9 3.5 2.6 1.4 1842.2 9.4 17.0 6.0 2.9 2.8 3.2 4.4 5.0 2.1 2.6 1933.2 12.2 9.5 8.0 2.7 3.7 3.7 4.5 6.8 5.0 4.0 20
45.6 6.0 32.7 – .2 .3 .3 .8 .8 .4 1.0 21
44.7 5.8 34.2 – .3 .3 .3 .8 1.0 .4 1.2 2253.0 7.3 19.4 1.0 .8 .3 .6 1.3 2.2 .4 1.5 2349.0 5.5 25.1 2.0 2.1 1.1 1.6 4.5 5.2 2.2 5.6 2454.5 8.1 19.1 1.0 .9 .7 .7 2.1 2.7 .8 1.8 2554.3 4.8 15.8 3.0 2.0 2.6 1.9 2.4 3.3 .7 2.2 2656.8 8.8 9.9 4.0 2.5 2.8 2.5 4.8 4.0 2.3 2.2 2740.8 12.8 15.4 6.0 2.8 2.4 1.8 5.3 4.7 2.7 3.8 2854.0 6.2 12.7 8.0 3.9 3.0 6.2 5.1 7.8 2.8 4.2 2929.0 8.6 4.8 – 4.6 4.4 2.2 4.5 8.1 3.1 3.1 30
54.2 9.4 17.5 – .4 .5 .3 1.1 1.6 .7 .9 31
51.2 9.3 19.6 – .5 .7 .4 1.3 1.9 .8 1.2 3262.1 9.9 11.8 1.0 .2 .5 .5 .7 1.0 1.0 .9 3360.4 12.5 11.5 2.0 2.0 1.1 .8 3.8 3.1 3.8 1.7 3463.2 9.0 12.7 1.0 .5 .7 1.1 1.3 1.7 1.4 1.1 3563.3 9.9 11.5 2.0 .9 1.0 .5 2.4 2.2 1.6 1.7 3663.0 9.6 8.7 2.0 .4 .8 1.1 2.4 2.7 1.0 2.0 3753.7 13.7 8.4 4.0 1.7 2.0 1.6 3.9 2.1 3.9 2.7 3842.7 7.9 9.3 6.0 2.4 3.9 1.8 6.0 4.1 2.5 2.9 3945.4 16.7 15.0 6.0 3.5 3.3 1.8 6.4 6.1 5.2 3.0 40
51.5 4.9 27.5 – .2 .3 .4 1.1 1.1 .2 1.3 41
49.8 4.5 30.1 – .3 .3 .4 1.4 1.1 .3 1.6 4262.3 6.9 12.3 – .1 .3 1.3 1.1 1.8 .8 1.2 4358.0 5.8 9.6 1.0 1.4 .8 1.1 4.4 6.8 1.7 3.2 4462.1 6.7 14.0 – .3 .2 2.0 2.0 2.5 1.0 1.6 4570.2 7.2 9.9 1.0 .5 .7 .8 2.6 1.8 1.3 1.4 4661.1 7.5 13.1 1.0 .8 1.0 1.2 2.1 2.3 .5 2.3 4758.2 10.7 7.7 1.0 1.3 1.9 1.2 3.9 2.0 2.3 1.2 4845.7 7.3 8.9 2.0 2.1 2.5 3.3 3.0 4.3 2.0 1.8 4934.7 9.4 5.4 2.0 5.6 5.7 3.1 4.9 5.0 2.2 1.7 50
54.1 6.3 19.6 – .4 .3 .3 1.2 1.5 .5 1.2 51
50.8 5.3 22.6 – .5 .4 .4 1.4 1.7 .6 1.6 5266.3 10.1 8.6 – .4 .5 .5 1.9 1.3 .8 .8 5365.5 2.9 7.4 – 2.8 2.6 .6 6.1 6.4 1.3 3.4 5468.8 11.6 8.2 – .5 .4 .8 2.1 1.5 1.4 .9 5568.0 9.2 9.1 – .9 1.2 .7 2.1 1.7 1.4 1.5 5659.7 13.2 12.7 1.0 .5 .6 1.5 2.7 3.2 1.8 2.3 5754.3 8.3 8.1 1.0 1.0 .8 .9 2.8 2.8 .9 1.3 5853.9 6.9 6.4 1.0 1.3 .9 1.2 3.3 4.7 1.7 1.7 5940.7 10.1 4.5 1.0 1.5 3.0 2.1 4.5 3.8 2.8 3.6 60
1992 ECONOMIC CENSUS CHARACTERISTICS OF BUSINESS OWNERS 259

Table 31d. Total Sales of 10 Percent or More to Customer Categories by Legal Form of[All data are shown as percents, except firms. For meaning of abbreviations and symbols, see introductory text. For explanation of terms, see appendix A]
Type of firm and legal form of organization
Customer categories accounting for 10 percent or more of business’s total salesof goods/services1
Firms(number)
FederalGovernment State government Local government
Otherbusinesses
and/orcorporations
A B C D E
All businesses 17 253 143.................................................... 2.6 2.3 2.8 30.11
Individual proprietorships 14 599 295................................................. 2.6 2.4 2.8 27.52Partnerships 1 089 578............................................................ 2.6 1.1 1.7 38.03Subchapter S corporations 1 564 270................................................ 2.6 2.4 3.6 50.24
Hispanic ~owned businesses 771 708....................................... 3.8 2.8 3.1 25.05
Individual proprietorships 689 015................................................. 3.8 2.8 2.8 22.16Partnerships 32 650............................................................ 3.6 2.6 2.4 30.57Subchapter S corporations 50 042................................................ 3.6 3.1 5.7 51.48
Black ~owned businesses 620 912.......................................... 4.4 3.6 3.5 16.49
Individual proprietorships 584 256................................................. 4.3 3.5 3.4 15.810Partnerships 14 727............................................................ 5.0 4.3 2.9 23.111Subchapter S corporations 21 928................................................ 8.1 6.4 5.9 35.012
Other minority ~owned businesses 606 426................................. 3.3 3.1 3.3 25.813
Individual proprietorships 502 022................................................. 3.4 3.2 3.5 23.014Partnerships 49 489............................................................ 2.4 1.6 1.6 29.315Subchapter S corporations 54 915................................................ 4.1 3.4 3.7 40.116
Women ~owned businesses 5 888 883........................................ 2.5 2.1 3.0 23.517
Individual proprietorships 5 078 077................................................. 2.5 2.1 2.8 21.018Partnerships 243 651............................................................ 1.2 1.2 3.5 26.419Subchapter S corporations 567 155................................................ 2.8 2.4 4.2 45.120
Nonminority male ~owned businesses 10 114 456.............................. 2.4 2.4 2.7 34.421
Individual proprietorships 8 414 238................................................. 2.4 2.5 2.8 31.922Partnerships 777 379............................................................ 2.8 .9 1.2 42.023Subchapter S corporations 922 838................................................ 2.2 2.2 3.2 53.924
1Data represent percentage of firms reporting in the designated categories. Sum of percents in categories will not equal 100 since multiple responses were allowed.2For explanation of relative standard errors and standard errors, see Reliability of Estimates in the introductory text.3Relative standard errors are not applicable for lines 1 through 4 since these data are the result of censuses, not surveys.
260 CHARACTERISTICS OF BUSINESS OWNERS 1992 ECONOMIC CENSUS
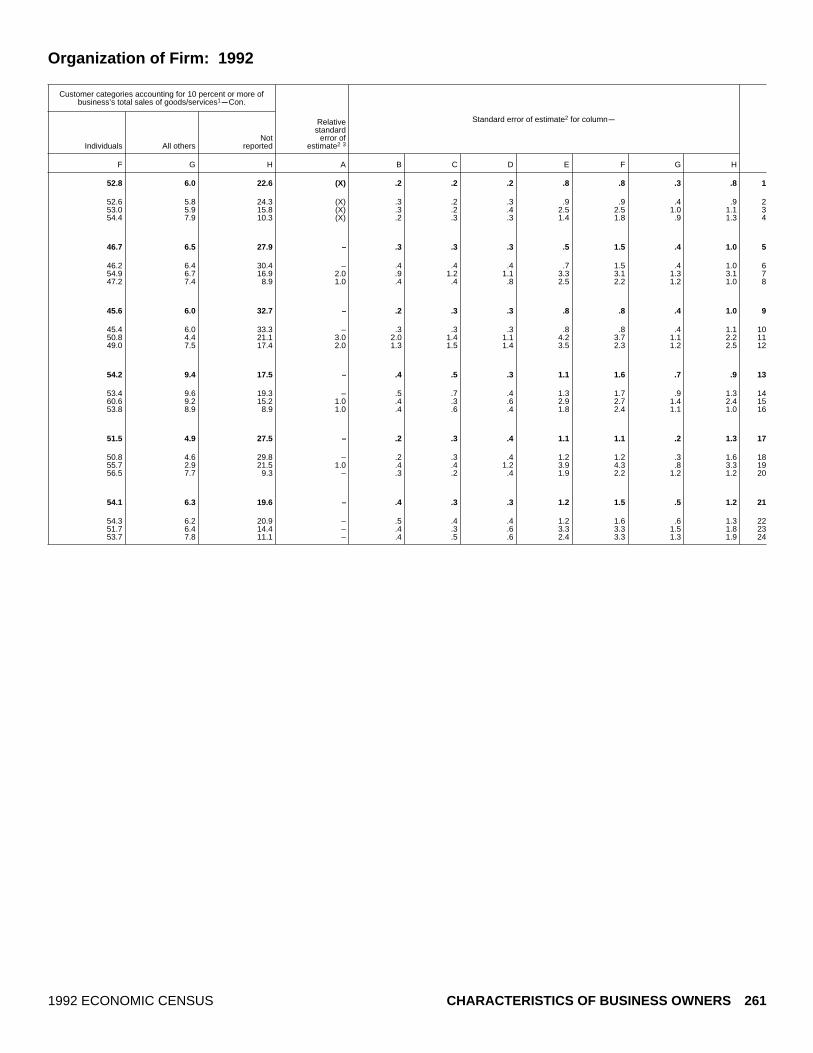
Organization of Firm: 1992
Customer categories accounting for 10 percent or more ofbusiness’s total sales of goods/services1
mCon.
Standard error of estimate2 for columnm
Individuals All othersNot
reported
Relativestandard
error ofestimate2 3
F G H A B C D E F G H
52.8 6.0 22.6 (X) .2 .2 .2 .8 .8 .3 .8 1
52.6 5.8 24.3 (X) .3 .2 .3 .9 .9 .4 .9 253.0 5.9 15.8 (X) .3 .2 .4 2.5 2.5 1.0 1.1 354.4 7.9 10.3 (X) .2 .3 .3 1.4 1.8 .9 1.3 4
46.7 6.5 27.9 – .3 .3 .3 .5 1.5 .4 1.0 5
46.2 6.4 30.4 – .4 .4 .4 .7 1.5 .4 1.0 654.9 6.7 16.9 2.0 .9 1.2 1.1 3.3 3.1 1.3 3.1 747.2 7.4 8.9 1.0 .4 .4 .8 2.5 2.2 1.2 1.0 8
45.6 6.0 32.7 – .2 .3 .3 .8 .8 .4 1.0 9
45.4 6.0 33.3 – .3 .3 .3 .8 .8 .4 1.1 1050.8 4.4 21.1 3.0 2.0 1.4 1.1 4.2 3.7 1.1 2.2 1149.0 7.5 17.4 2.0 1.3 1.5 1.4 3.5 2.3 1.2 2.5 12
54.2 9.4 17.5 – .4 .5 .3 1.1 1.6 .7 .9 13
53.4 9.6 19.3 – .5 .7 .4 1.3 1.7 .9 1.3 1460.6 9.2 15.2 1.0 .4 .3 .6 2.9 2.7 1.4 2.4 1553.8 8.9 8.9 1.0 .4 .6 .4 1.8 2.4 1.1 1.0 16
51.5 4.9 27.5 – .2 .3 .4 1.1 1.1 .2 1.3 17
50.8 4.6 29.8 – .2 .3 .4 1.2 1.2 .3 1.6 1855.7 2.9 21.5 1.0 .4 .4 1.2 3.9 4.3 .8 3.3 1956.5 7.7 9.3 – .3 .2 .4 1.9 2.2 1.2 1.2 20
54.1 6.3 19.6 – .4 .3 .3 1.2 1.5 .5 1.2 21
54.3 6.2 20.9 – .5 .4 .4 1.2 1.6 .6 1.3 2251.7 6.4 14.4 – .4 .3 .6 3.3 3.3 1.5 1.8 2353.7 7.8 11.1 – .4 .5 .6 2.4 3.3 1.3 1.9 24
1992 ECONOMIC CENSUS CHARACTERISTICS OF BUSINESS OWNERS 261
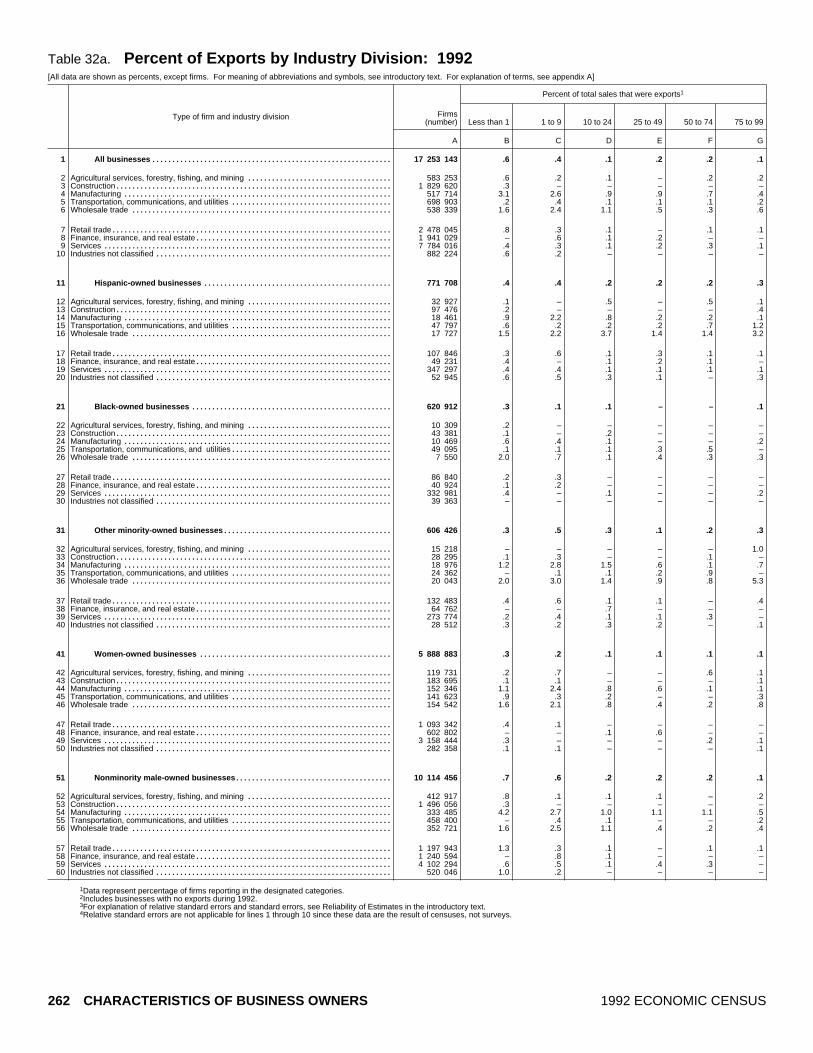
Table 32a. Percent of Exports by Industry Division: 1992[All data are shown as percents, except firms. For meaning of abbreviations and symbols, see introductory text. For explanation of terms, see appendix A]
Type of firm and industry division
Percent of total sales that were exports1
Firms(number) Less than 1 1 to 9 10 to 24 25 to 49 50 to 74 75 to 99
A B C D E F G
All businesses 17 253 143............................................................ .6 .4 .1 .2 .2 .11
Agricultural services, forestry, fishing, and mining 583 253.................................... .6 .2 .1 – .2 .22Construction 1 829 620..................................................................... .3 – – – – –3Manufacturing 517 714................................................................... 3.1 2.6 .9 .9 .7 .44Transportation, communications, and utilities 698 903........................................ .2 .4 .1 .1 .1 .25Wholesale trade 538 339................................................................. 1.6 2.4 1.1 .5 .3 .66
Retail trade 2 478 045...................................................................... .8 .3 .1 – .1 .17Finance, insurance, and real estate 1 941 029................................................. – .6 .1 .2 – –8Services 7 784 016........................................................................ .4 .3 .1 .2 .3 .19Industries not classified 882 224........................................................... .6 .2 – – – –10
Hispanic ~owned businesses 771 708............................................... .4 .4 .2 .2 .2 .311
Agricultural services, forestry, fishing, and mining 32 927.................................... .1 – .5 – .5 .112Construction 97 476..................................................................... .2 – – – – .413Manufacturing 18 461................................................................... .9 2.2 .8 .2 .2 .114Transportation, communications, and utilities 47 797........................................ .6 .2 .2 .2 .7 1.215Wholesale trade 17 727................................................................. 1.5 2.2 3.7 1.4 1.4 3.216
Retail trade 107 846...................................................................... .3 .6 .1 .3 .1 .117Finance, insurance, and real estate 49 231................................................. .4 – .1 .2 .1 –18Services 347 297........................................................................ .4 .4 .1 .1 .1 .119Industries not classified 52 945........................................................... .6 .5 .3 .1 – .320
Black ~owned businesses 620 912.................................................. .3 .1 .1 – – .121
Agricultural services, forestry, fishing, and mining 10 309.................................... .2 – – – – –22Construction 43 381..................................................................... .1 – .2 – – –23Manufacturing 10 469................................................................... .6 .4 .1 – – .224Transportation, communications, and utilities 49 095........................................ .1 .1 .1 .3 .5 –25Wholesale trade 7 550................................................................. 2.0 .7 .1 .4 .3 .326
Retail trade 86 840...................................................................... .2 .3 – – – –27Finance, insurance, and real estate 40 924................................................. .1 .2 – – – –28Services 332 981........................................................................ .4 – .1 – – .229Industries not classified 39 363........................................................... – – – – – –30
Other minority ~owned businesses 606 426.......................................... .3 .5 .3 .1 .2 .331
Agricultural services, forestry, fishing, and mining 15 218.................................... – – – – – 1.032Construction 28 295..................................................................... .1 .3 – – .1 –33Manufacturing 18 976................................................................... 1.2 2.8 1.5 .6 .1 .734Transportation, communications, and utilities 24 362........................................ – .1 .1 .2 .9 –35Wholesale trade 20 043................................................................. 2.0 3.0 1.4 .9 .8 5.336
Retail trade 132 483...................................................................... .4 .6 .1 .1 – .437Finance, insurance, and real estate 64 762................................................. – – .7 – – –38Services 273 774........................................................................ .2 .4 .1 .1 .3 –39Industries not classified 28 512........................................................... .3 .2 .3 .2 – .140
Women ~owned businesses 5 888 883................................................ .3 .2 .1 .1 .1 .141
Agricultural services, forestry, fishing, and mining 119 731.................................... .2 .7 – – .6 .142Construction 183 695..................................................................... .1 .1 – – – .143Manufacturing 152 346................................................................... 1.1 2.4 .8 .6 .1 .144Transportation, communications, and utilities 141 623........................................ .9 .3 .2 – – .345Wholesale trade 154 542................................................................. 1.6 2.1 .8 .4 .2 .846
Retail trade 1 093 342...................................................................... .4 .1 – – – –47Finance, insurance, and real estate 602 802................................................. – – .1 .6 – –48Services 3 158 444........................................................................ .3 – – – .2 .149Industries not classified 282 358........................................................... .1 .1 – – – .150
Nonminority male ~owned businesses 10 114 456....................................... .7 .6 .2 .2 .2 .151
Agricultural services, forestry, fishing, and mining 412 917.................................... .8 .1 .1 .1 – .252Construction 1 496 056..................................................................... .3 – – – – –53Manufacturing 333 485................................................................... 4.2 2.7 1.0 1.1 1.1 .554Transportation, communications, and utilities 458 400........................................ – .4 .1 – – .255Wholesale trade 352 721................................................................. 1.6 2.5 1.1 .4 .2 .456
Retail trade 1 197 943...................................................................... 1.3 .3 .1 – .1 .157Finance, insurance, and real estate 1 240 594................................................. – .8 .1 – – –58Services 4 102 294........................................................................ .6 .5 .1 .4 .3 –59Industries not classified 520 046........................................................... 1.0 .2 – – – –60
1Data represent percentage of firms reporting in the designated categories.2Includes businesses with no exports during 1992.3For explanation of relative standard errors and standard errors, see Reliability of Estimates in the introductory text.4Relative standard errors are not applicable for lines 1 through 10 since these data are the result of censuses, not surveys.
262 CHARACTERISTICS OF BUSINESS OWNERS 1992 ECONOMIC CENSUS
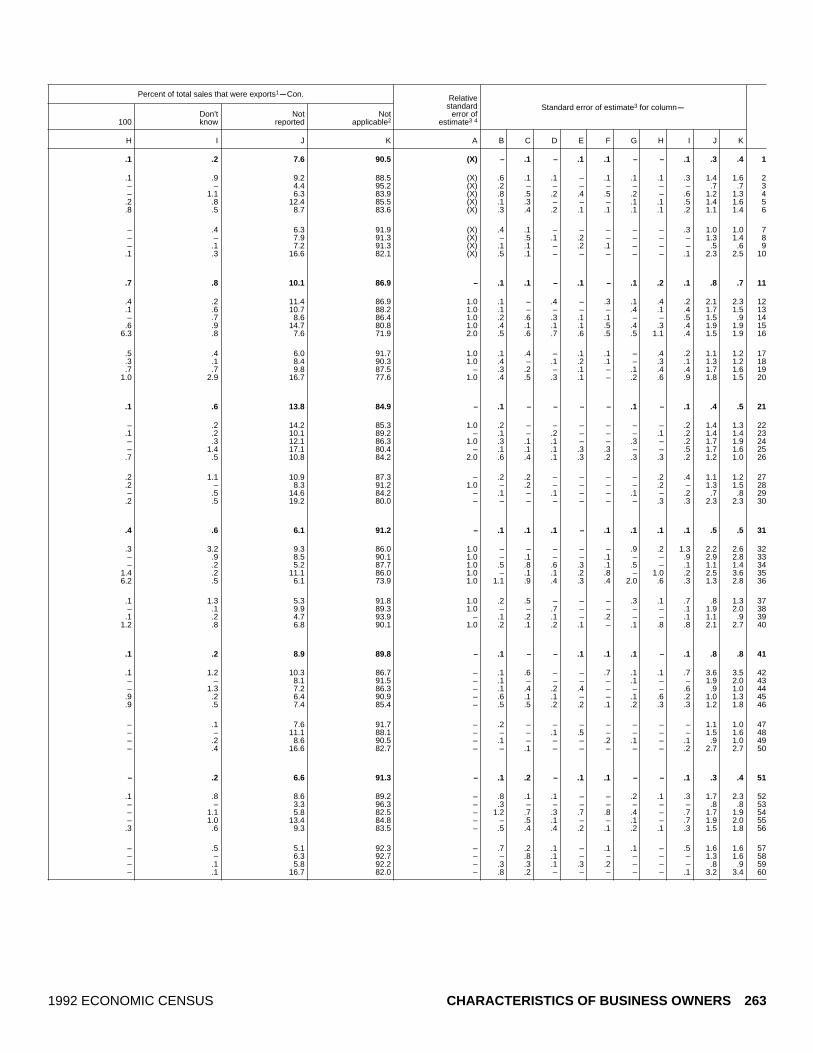
Percent of total sales that were exports1mCon.
Standard error of estimate3 for columnm
100Don’tknow
Notreported
Notapplicable2
Relativestandard
error ofestimate3 4
H I J K A B C D E F G H I J K
.1 .2 7.6 90.5 (X) – .1 – .1 .1 – – .1 .3 .4 1
.1 .9 9.2 88.5 (X) .6 .1 .1 – .1 .1 .1 .3 1.4 1.6 2– – 4.4 95.2 (X) .2 – – – – – – – .7 .7 3– 1.1 6.3 83.9 (X) .8 .5 .2 .4 .5 .2 – .6 1.2 1.3 4
.2 .8 12.4 85.5 (X) .1 .3 – – – .1 .1 .5 1.4 1.6 5
.8 .5 8.7 83.6 (X) .3 .4 .2 .1 .1 .1 .1 .2 1.1 1.4 6
– .4 6.3 91.9 (X) .4 .1 – – – – – .3 1.0 1.0 7– – 7.9 91.3 (X) – .5 .1 .2 – – – – 1.3 1.4 8– .1 7.2 91.3 (X) .1 .1 – .2 .1 – – – .5 .6 9
.1 .3 16.6 82.1 (X) .5 .1 – – – – – .1 2.3 2.5 10
.7 .8 10.1 86.9 – .1 .1 – .1 – .1 .2 .1 .8 .7 11
.4 .2 11.4 86.9 1.0 .1 – .4 – .3 .1 .4 .2 2.1 2.3 12
.1 .6 10.7 88.2 1.0 .1 – – – – .4 .1 .4 1.7 1.5 13– .7 8.6 86.4 1.0 .2 .6 .3 .1 .1 – – .5 1.5 .9 14
.6 .9 14.7 80.8 1.0 .4 .1 .1 .1 .5 .4 .3 .4 1.9 1.9 156.3 .8 7.6 71.9 2.0 .5 .6 .7 .6 .5 .5 1.1 .4 1.5 1.9 16
.5 .4 6.0 91.7 1.0 .1 .4 – .1 .1 – .4 .2 1.1 1.2 17
.3 .1 8.4 90.3 1.0 .4 – .1 .2 .1 – .3 .1 1.3 1.2 18
.7 .7 9.8 87.5 – .3 .2 – .1 – .1 .4 .4 1.7 1.6 191.0 2.9 16.7 77.6 1.0 .4 .5 .3 .1 – .2 .6 .9 1.8 1.5 20
.1 .6 13.8 84.9 – .1 – – – – .1 – .1 .4 .5 21
– .2 14.2 85.3 1.0 .2 – – – – – – .2 1.4 1.3 22.1 .2 10.1 89.2 – .1 – .2 – – – .1 .2 1.4 1.4 23– .3 12.1 86.3 1.0 .3 .1 .1 – – .3 – .2 1.7 1.9 24– 1.4 17.1 80.4 – .1 .1 .1 .3 .3 – – .5 1.7 1.6 25
.7 .5 10.8 84.2 2.0 .6 .4 .1 .3 .2 .3 .3 .2 1.2 1.0 26
.2 1.1 10.9 87.3 – .2 .2 – – – – .2 .4 1.1 1.2 27
.2 – 8.3 91.2 1.0 – .2 – – – – .2 – 1.3 1.5 28– .5 14.6 84.2 – .1 – .1 – – .1 – .2 .7 .8 29
.2 .5 19.2 80.0 – – – – – – – .3 .3 2.3 2.3 30
.4 .6 6.1 91.2 – .1 .1 .1 – .1 .1 .1 .1 .5 .5 31
.3 3.2 9.3 86.0 1.0 – – – – – .9 .2 1.3 2.2 2.6 32– .9 8.5 90.1 1.0 – .1 – – .1 – – .9 2.9 2.8 33– .2 5.2 87.7 1.0 .5 .8 .6 .3 .1 .5 – .1 1.1 1.4 34
1.4 .2 11.1 86.0 1.0 – .1 .1 .2 .8 – 1.0 .2 2.5 3.6 356.2 .5 6.1 73.9 1.0 1.1 .9 .4 .3 .4 2.0 .6 .3 1.3 2.8 36
.1 1.3 5.3 91.8 1.0 .2 .5 – – – .3 .1 .7 .8 1.3 37– .1 9.9 89.3 1.0 – – .7 – – – – .1 1.9 2.0 38
.1 .2 4.7 93.9 – .1 .2 .1 – .2 – – .1 1.1 .9 391.2 .8 6.8 90.1 1.0 .2 .1 .2 .1 – .1 .8 .8 2.1 2.7 40
.1 .2 8.9 89.8 – .1 – – .1 .1 .1 – .1 .8 .8 41
.1 1.2 10.3 86.7 – .1 .6 – – .7 .1 .1 .7 3.6 3.5 42– – 8.1 91.5 – .1 – – – – .1 – – 1.9 2.0 43– 1.3 7.2 86.3 – .1 .4 .2 .4 – – – .6 .9 1.0 44
.9 .2 6.4 90.9 – .6 .1 .1 – – .1 .6 .2 1.0 1.3 45
.9 .5 7.4 85.4 – .5 .5 .2 .2 .1 .2 .3 .3 1.2 1.8 46
– .1 7.6 91.7 – .2 – – – – – – – 1.1 1.0 47– – 11.1 88.1 – – – .1 .5 – – – – 1.5 1.6 48– .2 8.6 90.5 – .1 – – – .2 .1 – .1 .9 1.0 49– .4 16.6 82.7 – – .1 – – – – – .2 2.7 2.7 50
– .2 6.6 91.3 – .1 .2 – .1 .1 – – .1 .3 .4 51
.1 .8 8.6 89.2 – .8 .1 .1 – – .2 .1 .3 1.7 2.3 52– – 3.3 96.3 – .3 – – – – – – – .8 .8 53– 1.1 5.8 82.5 – 1.2 .7 .3 .7 .8 .4 – .7 1.7 1.9 54– 1.0 13.4 84.8 – – .5 .1 – – .1 – .7 1.9 2.0 55
.3 .6 9.3 83.5 – .5 .4 .4 .2 .1 .2 .1 .3 1.5 1.8 56
– .5 5.1 92.3 – .7 .2 .1 – .1 .1 – .5 1.6 1.6 57– – 6.3 92.7 – – .8 .1 – – – – – 1.3 1.6 58– .1 5.8 92.2 – .3 .3 .1 .3 .2 – – – .8 .9 59– .1 16.7 82.0 – .8 .2 – – – – – .1 3.2 3.4 60
1992 ECONOMIC CENSUS CHARACTERISTICS OF BUSINESS OWNERS 263

Table 32b. Percent of Exports by Receipts Size of Firm: 1992[All data are shown as percents, except firms. For meaning of abbreviations and symbols, see introductory text. For explanation of terms, see appendix A]
Type of firm and receipts size
Percent of total sales that were exports1
Firms(number) Less than 1 1 to 9 10 to 24 25 to 49 50 to 74 75 to 99
A B C D E F G
All businesses 17 253 143............................................................ .6 .4 .1 .2 .2 .11
Less than $5,000 5 226 553................................................................ .4 – – – .2 –2$5,000 to $9,999 2 443 946................................................................. .4 .5 – – – –3$10,000 to $24,999 3 076 410............................................................... .2 .1 .1 .7 .1 .14$25,000 to $49,999 1 945 806............................................................... 1.3 .2 – – – –5$50,000 to $99,999 1 615 940............................................................... .7 1.3 .2 – .4 .16
$100,000 to $199,999 1 197 996............................................................ .4 .6 .1 .1 – .17$200,000 to $249,999 301 794............................................................ .2 .1 .1 – – .28$250,000 to $499,999 682 583............................................................ .9 .5 .5 .2 .2 .29$500,000 to $999,999 372 078............................................................ .7 1.3 .6 .3 .5 .410$1,000,000 or more 390 037.............................................................. 2.5 3.8 1.6 .7 .3 .411
Hispanic ~owned businesses 771 708............................................... .4 .4 .2 .2 .2 .312
Less than $5,000 219 226................................................................ .5 .5 .1 – .1 –13$5,000 to $9,999 140 362................................................................. .5 .2 – – – .314$10,000 to $24,999 165 667............................................................... .1 .1 .3 .2 – –15$25,000 to $49,999 87 288............................................................... .3 .1 .2 .2 .2 .216$50,000 to $99,999 64 742............................................................... .2 .4 .2 .2 .3 .517
$100,000 to $199,999 41 578............................................................ .4 .7 .3 .3 .1 .418$200,000 to $249,999 10 030............................................................ 1.0 .6 .5 – .1 2.619$250,000 to $499,999 22 301............................................................ 1.4 .9 .6 .4 .4 .320$500,000 to $999,999 11 319............................................................ .4 1.4 .2 .5 1.7 1.321$1,000,000 or more 9 194.............................................................. 1.8 2.7 2.0 1.4 1.5 2.122
Black ~owned businesses 620 912.................................................. .3 .1 .1 – – .123
Less than $5,000 236 722................................................................ .2 .1 – – – –24$5,000 to $9,999 111 512................................................................. .6 .1 .1 – – .425$10,000 to $24,999 129 901............................................................... .1 – .2 .1 – .126$25,000 to $49,999 62 209............................................................... – .1 – – – –27$50,000 to $99,999 39 218............................................................... .4 .4 – – .2 –28
$100,000 to $199,999 20 936............................................................ .6 – .2 – .1 .129$200,000 to $249,999 4 533............................................................ – – – – – –30$250,000 to $499,999 9 029............................................................ .5 .4 – – .5 –31$500,000 to $999,999 3 823............................................................ .2 .5 .5 – – .132$1,000,000 or more 3 028.............................................................. 1.2 1.0 1.0 .2 .5 –33
Other minority ~owned businesses 606 426.......................................... .3 .5 .3 .1 .2 .334
Less than $5,000 132 493................................................................ .2 – .4 – – .435$5,000 to $9,999 80 435................................................................. – – – – – –36$10,000 to $24,999 108 195............................................................... .1 .9 .1 .1 .8 .737$25,000 to $49,999 77 345............................................................... .3 1.1 .1 – .3 –38$50,000 to $99,999 70 360............................................................... .1 .2 .1 .1 – .539
$100,000 to $199,999 58 620............................................................ .6 .1 .3 – .1 –40$200,000 to $249,999 15 740............................................................ – .1 .1 .1 .2 .441$250,000 to $499,999 34 266............................................................ .4 .8 .2 .3 .3 .342$500,000 to $999,999 16 467............................................................ .8 1.1 .9 .9 .1 .843$1,000,000 or more 12 505.............................................................. 2.0 3.1 2.0 1.1 .6 .844
Women ~owned businesses 5 888 883................................................ .3 .2 .1 .1 .1 .145
Less than $5,000 2 310 303................................................................ .2 – – – .3 –46$5,000 to $9,999 967 380................................................................. .3 .1 – – – –47$10,000 to $24,999 1 051 358............................................................... .1 .1 – .4 – .448$25,000 to $49,999 538 885............................................................... – .2 .1 – – –49$50,000 to $99,999 381 517............................................................... .5 .2 .1 .1 – .150
$100,000 to $199,999 267 089............................................................ 1.4 .7 .1 .1 – .151$200,000 to $249,999 66 464............................................................ .3 .1 .2 – – .552$250,000 to $499,999 146 313............................................................ 1.5 .7 .2 .1 – .353$500,000 to $999,999 80 539............................................................ 1.0 1.5 .7 .1 .5 .354$1,000,000 or more 79 037.............................................................. 2.9 4.0 1.6 .5 .5 .655
Nonminority male ~owned businesses 10 114 456....................................... .7 .6 .2 .2 .2 .156
Less than $5,000 2 608 047................................................................ .5 – – – .2 .157$5,000 to $9,999 1 285 456................................................................. .4 .9 – – – –58$10,000 to $24,999 1 763 830............................................................... .2 – .1 1.0 .2 –59$25,000 to $49,999 1 248 482............................................................... 2.0 .2 – – – –60$50,000 to $99,999 1 108 065............................................................... .8 1.8 .3 – .6 .161
$100,000 to $199,999 840 723............................................................ – .6 – .1 – .162$200,000 to $249,999 212 693............................................................ .1 – .1 – – –63$250,000 to $499,999 488 462............................................................ .7 .5 .6 .2 .2 .264$500,000 to $999,999 266 408............................................................ .7 1.3 .6 .3 .5 .465$1,000,000 or more 292 290.............................................................. 2.5 3.9 1.6 .7 .2 .366
1Data represent percentage of firms reporting in the designated categories.2Includes businesses with no exports during 1992.3For explanation of relative standard errors and standard errors, see Reliability of Estimates in the introductory text.4Relative standard errors are not applicable for lines 1 through 11 since these data are the result of censuses, not surveys.
264 CHARACTERISTICS OF BUSINESS OWNERS 1992 ECONOMIC CENSUS
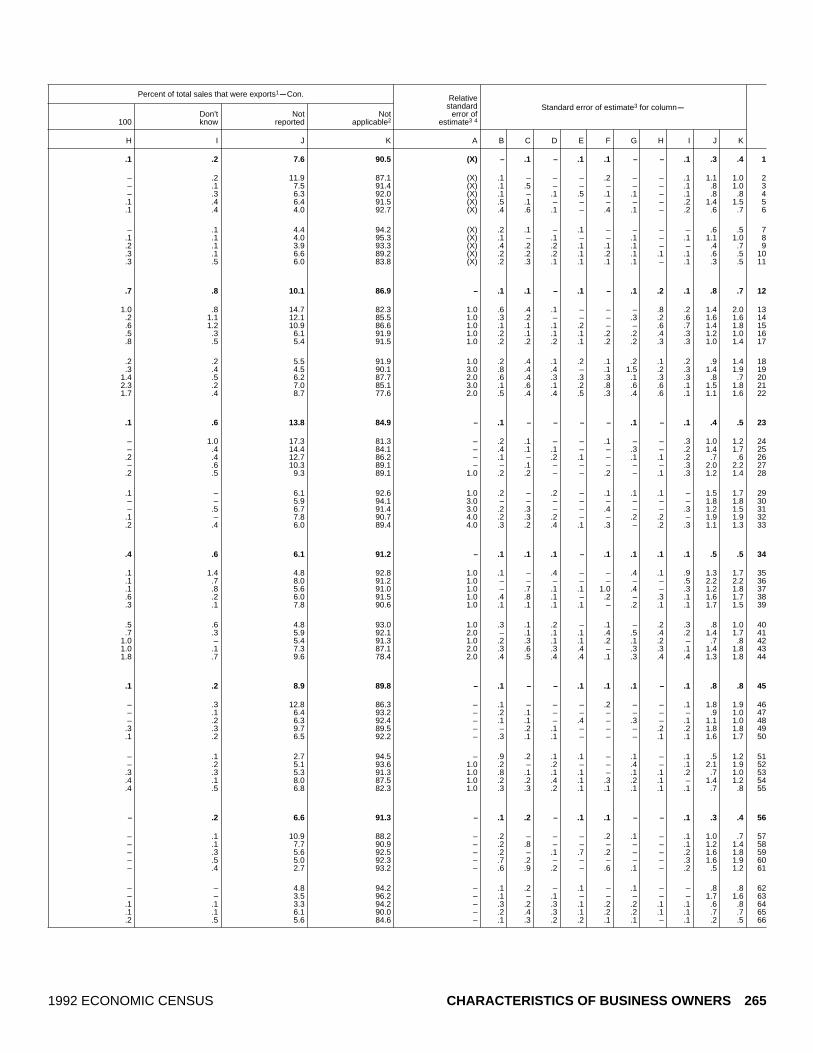
Percent of total sales that were exports1mCon.
Standard error of estimate3 for columnm
100Don’tknow
Notreported
Notapplicable2
Relativestandard
error ofestimate3 4
H I J K A B C D E F G H I J K
.1 .2 7.6 90.5 (X) – .1 – .1 .1 – – .1 .3 .4 1
– .2 11.9 87.1 (X) .1 – – – .2 – – .1 1.1 1.0 2– .1 7.5 91.4 (X) .1 .5 – – – – – .1 .8 1.0 3– .3 6.3 92.0 (X) .1 – .1 .5 .1 .1 – .1 .8 .8 4
.1 .4 6.4 91.5 (X) .5 .1 – – – – – .2 1.4 1.5 5
.1 .4 4.0 92.7 (X) .4 .6 .1 – .4 .1 – .2 .6 .7 6
– .1 4.4 94.2 (X) .2 .1 – .1 – – – – .6 .5 7.1 .1 4.0 95.3 (X) .1 – .1 – – .1 – .1 1.1 1.0 8.2 .1 3.9 93.3 (X) .4 .2 .2 .1 .1 .1 – – .4 .7 9.3 .1 6.6 89.2 (X) .2 .2 .2 .1 .2 .1 .1 .1 .6 .5 10.3 .5 6.0 83.8 (X) .2 .3 .1 .1 .1 .1 – .1 .3 .5 11
.7 .8 10.1 86.9 – .1 .1 – .1 – .1 .2 .1 .8 .7 12
1.0 .8 14.7 82.3 1.0 .6 .4 .1 – – – .8 .2 1.4 2.0 13.2 1.1 12.1 85.5 1.0 .3 .2 – – – .3 .2 .6 1.6 1.6 14.6 1.2 10.9 86.6 1.0 .1 .1 .1 .2 – – .6 .7 1.4 1.8 15.5 .3 6.1 91.9 1.0 .2 .1 .1 .1 .2 .2 .4 .3 1.2 1.0 16.8 .5 5.4 91.5 1.0 .2 .2 .2 .1 .2 .2 .3 .3 1.0 1.4 17
.2 .2 5.5 91.9 1.0 .2 .4 .1 .2 .1 .2 .1 .2 .9 1.4 18
.3 .4 4.5 90.1 3.0 .8 .4 .4 – .1 1.5 .2 .3 1.4 1.9 191.4 .5 6.2 87.7 2.0 .6 .4 .3 .3 .3 .1 .3 .3 .8 .7 202.3 .2 7.0 85.1 3.0 .1 .6 .1 .2 .8 .6 .6 .1 1.5 1.8 211.7 .4 8.7 77.6 2.0 .5 .4 .4 .5 .3 .4 .6 .1 1.1 1.6 22
.1 .6 13.8 84.9 – .1 – – – – .1 – .1 .4 .5 23
– 1.0 17.3 81.3 – .2 .1 – – .1 – – .3 1.0 1.2 24– .4 14.4 84.1 – .4 .1 .1 – – .3 – .2 1.4 1.7 25
.2 .4 12.7 86.2 – .1 – .2 .1 – .1 .1 .2 .7 .6 26– .6 10.3 89.1 – – .1 – – – – – .3 2.0 2.2 27
.2 .5 9.3 89.1 1.0 .2 .2 – – .2 – .1 .3 1.2 1.4 28
.1 – 6.1 92.6 1.0 .2 – .2 – .1 .1 .1 – 1.5 1.7 29– – 5.9 94.1 3.0 – – – – – – – – 1.8 1.8 30– .5 6.7 91.4 3.0 .2 .3 – – .4 – – .3 1.2 1.5 31
.1 – 7.8 90.7 4.0 .2 .3 .2 – – .2 .2 – 1.9 1.9 32
.2 .4 6.0 89.4 4.0 .3 .2 .4 .1 .3 – .2 .3 1.1 1.3 33
.4 .6 6.1 91.2 – .1 .1 .1 – .1 .1 .1 .1 .5 .5 34
.1 1.4 4.8 92.8 1.0 .1 – .4 – – .4 .1 .9 1.3 1.7 35
.1 .7 8.0 91.2 1.0 – – – – – – – .5 2.2 2.2 36
.1 .8 5.6 91.0 1.0 – .7 .1 .1 1.0 .4 – .3 1.2 1.8 37
.6 .2 6.0 91.5 1.0 .4 .8 .1 – .2 – .3 .1 1.6 1.7 38
.3 .1 7.8 90.6 1.0 .1 .1 .1 .1 – .2 .1 .1 1.7 1.5 39
.5 .6 4.8 93.0 1.0 .3 .1 .2 – .1 – .2 .3 .8 1.0 40
.7 .3 5.9 92.1 2.0 – .1 .1 .1 .4 .5 .4 .2 1.4 1.7 411.0 – 5.4 91.3 1.0 .2 .3 .1 .1 .2 .1 .2 – .7 .8 421.0 .1 7.3 87.1 2.0 .3 .6 .3 .4 – .3 .3 .1 1.4 1.8 431.8 .7 9.6 78.4 2.0 .4 .5 .4 .4 .1 .3 .4 .4 1.3 1.8 44
.1 .2 8.9 89.8 – .1 – – .1 .1 .1 – .1 .8 .8 45
– .3 12.8 86.3 – .1 – – – .2 – – .1 1.8 1.9 46– .1 6.4 93.2 – .2 .1 – – – – – – .9 1.0 47– .2 6.3 92.4 – .1 .1 – .4 – .3 – .1 1.1 1.0 48
.3 .3 9.7 89.5 – – .2 .1 – – – .2 .2 1.8 1.8 49
.1 .2 6.5 92.2 – .3 .1 .1 – – – .1 .1 1.6 1.7 50
– .1 2.7 94.5 – .9 .2 .1 .1 – .1 – .1 .5 1.2 51– .2 5.1 93.6 1.0 .2 – .2 – – .4 – .1 2.1 1.9 52
.3 .3 5.3 91.3 1.0 .8 .1 .1 .1 – .1 .1 .2 .7 1.0 53
.4 .1 8.0 87.5 1.0 .2 .2 .4 .1 .3 .2 .1 – 1.4 1.2 54
.4 .5 6.8 82.3 1.0 .3 .3 .2 .1 .1 .1 .1 .1 .7 .8 55
– .2 6.6 91.3 – .1 .2 – .1 .1 – – .1 .3 .4 56
– .1 10.9 88.2 – .2 – – – .2 .1 – .1 1.0 .7 57– .1 7.7 90.9 – .2 .8 – – – – – .1 1.2 1.4 58– .3 5.6 92.5 – .2 – .1 .7 .2 – – .2 1.6 1.8 59– .5 5.0 92.3 – .7 .2 – – – – – .3 1.6 1.9 60– .4 2.7 93.2 – .6 .9 .2 – .6 .1 – .2 .5 1.2 61
– – 4.8 94.2 – .1 .2 – .1 – .1 – – .8 .8 62– – 3.5 96.2 – .1 – .1 – – – – – 1.7 1.6 63
.1 .1 3.3 94.2 – .3 .2 .3 .1 .2 .2 .1 .1 .6 .8 64
.1 .1 6.1 90.0 – .2 .4 .3 .1 .2 .2 .1 .1 .7 .7 65
.2 .5 5.6 84.6 – .1 .3 .2 .2 .1 .1 – .1 .2 .5 66
1992 ECONOMIC CENSUS CHARACTERISTICS OF BUSINESS OWNERS 265

Table 32c. Percent of Exports by Employment Size of Firm: 1992[All data are shown as percents, except firms. For meaning of abbreviations and symbols, see introductory text. For explanation of terms, see appendix A]
Type of firm and employment size
Percent of total sales that were exports1
Firms(number) Less than 1 1 to 9 10 to 24 25 to 49 50 to 74 75 to 99
A B C D E F G
All businesses 17 253 143............................................................ .6 .4 .1 .2 .2 .11
With no paid employees 14 118 184........................................................... .5 .3 .1 .2 .1 .12With paid employees 3 134 959............................................................. .7 1.0 .4 .2 .3 .13
No employees5 435 838................................................................ .4 .4 .3 .1 .9 .141 to 4 employees 1 716 076............................................................... .6 .8 .3 .1 .1 .155 to 9 employees 503 808............................................................... .5 1.0 .4 .2 .3 .1610 to 19 employees 256 110............................................................ 1.3 1.5 .6 .3 .2 .1720 to 49 employees 144 734............................................................ 1.4 3.0 1.0 .5 .2 .3850 to 99 employees 45 331............................................................ 4.4 3.9 1.6 .2 .2 .19100 employees or more 33 062......................................................... 2.7 6.1 2.8 1.4 .1 .310
Hispanic ~owned businesses 771 708............................................... .4 .4 .2 .2 .2 .311
With no paid employees 656 343........................................................... .4 .3 .2 .1 .1 .212With paid employees 115 364............................................................. .6 .8 .5 .4 .4 .513
No employees5 19 569................................................................ .3 1.5 1.2 .1 – .5141 to 4 employees 64 631............................................................... .5 .4 .3 .3 .1 .4155 to 9 employees 16 937............................................................... .6 1.2 .3 .4 .9 .31610 to 19 employees 8 553............................................................ 2.0 1.2 .6 .2 .8 .51720 to 49 employees 4 050............................................................ .7 1.7 .8 1.7 1.3 2.11850 to 99 employees 948............................................................ .7 2.4 2.5 1.5 2.7 .719100 employees or more 676......................................................... 2.0 4.4 1.3 (D) (D) –20
Black ~owned businesses 620 912.................................................. .3 .1 .1 – – .121
With no paid employees 556 434........................................................... .3 .1 .1 – – .122With paid employees 64 478............................................................. .4 .1 .1 – .1 –23
No employees5 13 725................................................................ – – – – – –241 to 4 employees 37 587............................................................... .4 – .1 – .1 –255 to 9 employees 7 853............................................................... .3 .5 .2 – .5 .12610 to 19 employees 2 839............................................................ .2 .2 (D) (D) – –2720 to 49 employees 1 700............................................................ .6 .6 .2 – – –2850 to 99 employees 432............................................................ 1.1 1.5 – – – –29100 employees or more 342......................................................... 2.2 (D) (D) – – –30
Other minority ~owned businesses 606 426.......................................... .3 .5 .3 .1 .2 .331
With no paid employees 470 075........................................................... .2 .3 .2 – .1 .332With paid employees 136 351............................................................. .5 1.1 .4 .3 .6 .433
No employees5 19 989................................................................ 1.1 3.1 .5 .3 3.4 .7341 to 4 employees 76 636............................................................... .2 .7 .2 .2 .1 .4355 to 9 employees 22 862............................................................... .3 .6 .5 .5 .3 .23610 to 19 employees 10 051............................................................ .8 1.0 .8 .6 .2 .13720 to 49 employees 5 034............................................................ 2.0 1.6 .8 .4 – .23850 to 99 employees 1 075............................................................ 2.0 3.0 1.3 1.1 – .339100 employees or more 705......................................................... 1.7 4.6 3.9 1.0 .7 .640
Women ~owned businesses 5 888 883................................................ .3 .2 .1 .1 .1 .141
With no paid employees 5 071 110........................................................... .2 .1 – .1 .1 .142With paid employees 817 773............................................................. 1.2 .9 .3 .1 .1 .243
No employees5 127 905................................................................ .3 .7 .2 – – .1441 to 4 employees 435 550............................................................... 1.4 .5 .3 .1 – .2455 to 9 employees 134 476............................................................... 1.0 1.0 .2 .1 .3 .14610 to 19 employees 67 487............................................................ 1.3 1.7 .8 .2 .2 .14720 to 49 employees 35 515............................................................ 1.6 2.1 .7 .3 – .34850 to 99 employees 10 178............................................................ 3.1 4.3 2.0 .1 .4 .349100 employees or more 6 663......................................................... 1.6 4.3 1.6 .4 .4 –50
Nonminority male ~owned businesses 10 114 456....................................... .7 .6 .2 .2 .2 .151
With no paid employees 8 019 462........................................................... .8 .4 .1 .2 .2 .152With paid employees 2 094 993............................................................. .6 1.2 .5 .2 .3 .153
No employees5 271 380................................................................ .4 .3 .3 .1 1.1 –541 to 4 employees 1 155 800............................................................... .3 1.0 .3 .1 .2 .1555 to 9 employees 334 483............................................................... .4 1.0 .4 .2 .2 .15610 to 19 employees 173 140............................................................ 1.4 1.5 .6 .4 .2 .15720 to 49 employees 101 938............................................................ 1.4 3.4 1.2 .5 .2 .35850 to 99 employees 33 406............................................................ 4.9 3.9 1.5 .2 .1 .159100 employees or more 24 846......................................................... 3.1 6.7 3.1 1.7 – .360
1Data represent percentage of firms reporting in the designated categories.2Includes businesses with no exports during 1992.3For explanation of relative standard errors and standard errors, see Reliability of Estimates in the introductory text.4Relative standard errors are not applicable for lines 1 through 10 since these data are the result of censuses, not surveys.5Firms reported annual payroll, but did not report any employees on their payroll during specified period in 1992.
266 CHARACTERISTICS OF BUSINESS OWNERS 1992 ECONOMIC CENSUS

Percent of total sales that were exports1mCon.
Standard error of estimate3 for columnm
100Don’tknow
Notreported
Notapplicable2
Relativestandard
error ofestimate3 4
H I J K A B C D E F G H I J K
.1 .2 7.6 90.5 (X) – .1 – .1 .1 – – .1 .3 .4 1
.1 .3 8.4 90.1 (X) .1 .1 – .1 .1 – – .1 .4 .5 2
.1 .2 4.4 92.6 (X) .1 .1 .1 – .1 – – .1 .5 .6 3
.1 .2 6.7 90.8 (X) .2 .2 .2 .1 .8 – .1 .1 2.6 2.8 4
.1 .2 3.6 94.1 (X) .2 .3 .1 – .1 .1 – .2 .7 .7 5
.1 .1 4.0 93.3 (X) .2 .2 .1 .1 .1 .1 – .1 .5 .7 6
.1 .1 5.3 90.3 (X) .2 .2 .1 .1 .1 .1 – .1 .5 .5 7
.1 .2 5.4 87.9 (X) .3 .4 .2 .1 .1 .1 – .1 .7 1.1 8
.2 .6 8.2 80.6 (X) 1.2 .4 .4 .1 .1 .1 .2 .2 1.6 1.8 9
.1 .9 7.1 78.5 (X) .5 1.2 .8 .5 .1 .2 .1 .3 1.5 2.2 10
.7 .8 10.1 86.9 – .1 .1 – .1 – .1 .2 .1 .8 .7 11
.7 .9 11.2 86.0 – .2 .2 – .1 – .1 .2 .2 .9 .9 12
.7 .3 5.3 90.6 1.0 .1 .3 .1 .1 .1 .1 .2 .1 .6 .7 131.4 .9 4.1 89.9 2.0 .3 1.1 .5 .2 – .3 .9 .5 1.5 1.8 14.5 .2 4.7 92.6 1.0 .1 .2 .1 .2 .1 .1 .1 .1 .9 .9 15.7 – 6.0 89.4 2.0 .3 .5 .1 .1 .4 .1 .2 – 1.6 1.6 16.8 .1 8.0 85.9 3.0 .9 .3 .2 .1 .4 .1 .6 – 1.9 2.1 17.1 .1 10.4 81.1 4.0 .2 .4 .2 1.0 .4 1.2 .1 .1 2.6 2.9 18.9 .5 5.0 83.0 6.0 .4 1.7 1.8 .6 1.9 .3 .6 .3 1.3 2.4 19– 1.0 5.1 85.7 8.0 1.4 1.4 .7 (D) (D) – – .8 1.5 2.1 20
.1 .6 13.8 84.9 – .1 – – – – .1 – .1 .4 .5 21
.1 .7 14.5 84.2 – .1 – – – – .1 – .2 .5 .6 22– .2 8.5 90.6 1.0 .1 – – – .1 – – .1 1.6 1.7 23– .1 11.5 88.3 2.0 .1 – – – – – – .1 3.2 3.2 24
.1 .2 7.0 92.1 1.0 .2 – – – – – .1 .1 1.5 1.7 25– .3 8.8 89.2 3.0 .3 .5 .1 – .7 .1 – .3 3.2 3.2 26– – 15.4 83.9 4.0 .2 .1 (D) (D) – – – – 4.2 4.2 27– .4 7.6 90.6 6.0 .2 .3 .1 – – – – .3 1.8 2.1 28– .7 4.0 92.7 8.0 1.2 .7 – – – – – 1.3 3.4 4.3 29
1.0 – 4.8 89.8 – 1.7 (D) (D) – – – 2.4 – 1.3 3.3 30
.4 .6 6.1 91.2 – .1 .1 .1 – .1 .1 .1 .1 .5 .5 31
.4 .7 6.3 91.5 – .1 .2 .1 – .1 .1 .1 .2 .7 .8 32
.4 .3 5.7 90.3 1.0 .2 .3 .1 .1 .4 .2 .1 .1 .6 .8 33
.8 1.4 5.8 82.9 2.0 .7 2.9 .7 .4 4.5 .6 .6 .9 2.0 6.2 34
.4 – 4.8 92.9 1.0 .1 .3 .1 .1 .1 .2 .1 – .9 1.1 35
.2 .2 7.2 90.1 2.0 .2 .1 .2 .3 .3 .1 .1 .3 1.3 1.5 36
.2 – 6.6 89.8 2.0 .4 .3 .4 .3 .1 .1 .2 – 1.6 1.3 37
.2 .2 8.7 85.8 4.0 .8 .4 .3 .2 .1 .1 .1 .1 1.7 2.1 38
.3 .4 7.9 83.7 6.0 .7 .7 .5 .4 – .3 .3 .5 2.7 2.6 39– 2.8 12.6 72.1 6.0 .5 1.8 2.8 1.0 .6 .3 – 1.5 3.7 5.1 40
.1 .2 8.9 89.8 – .1 – – .1 .1 .1 – .1 .8 .8 41
.1 .2 9.7 89.4 – .1 – – .1 .1 .1 – .1 .9 1.0 42
.1 .2 4.5 92.5 – .4 .1 .1 – – – – .1 .6 .7 43
.2 .4 3.3 94.9 1.0 .2 .4 .1 – – .1 .1 .2 .8 1.2 44
.1 .2 4.1 93.2 – .7 .2 .1 – – .1 – .1 1.2 1.2 45– .1 5.2 92.0 1.0 .4 .3 .1 – .3 .1 – – .8 .8 46– .1 6.1 89.5 1.0 .3 .4 .3 .1 .1 – – – .8 1.1 47– .3 6.4 88.3 1.0 .6 .4 .3 .1 – .2 – .1 1.1 1.4 48
.1 .2 8.5 81.2 2.0 .9 1.1 .6 .1 .2 .2 .1 .3 2.7 3.0 49– .4 7.6 83.5 2.0 .9 1.6 .8 .4 .3 – – .2 2.1 2.3 50
– .2 6.6 91.3 – .1 .2 – .1 .1 – – .1 .3 .4 51
– .2 7.3 90.9 – .1 .2 – .2 .1 – – .1 .5 .5 52.1 .2 4.1 92.9 – .1 .2 .1 – .1 – – .1 .8 .9 53– .1 8.3 89.3 – .3 .2 .2 .1 2.3 – – .1 4.3 4.6 54
.1 .3 3.1 94.6 – .1 .5 .2 – .1 .1 – .3 .9 1.2 55
.1 .2 3.2 94.3 – .2 .2 .1 .1 .1 .1 – .1 .8 .9 56– .2 4.9 90.8 1.0 .2 .3 .1 .2 .1 .1 – .1 .9 .8 57
.1 .2 4.9 87.9 1.0 .2 .6 .3 .1 .1 .1 .1 .1 .8 1.3 58
.2 .7 8.3 80.2 1.0 1.7 .5 .6 .2 – .1 .2 .3 1.8 2.7 59
.1 1.0 6.8 77.1 1.0 .8 1.5 1.2 .7 – .3 .1 .4 2.1 3.1 60
1992 ECONOMIC CENSUS CHARACTERISTICS OF BUSINESS OWNERS 267

Table 32d. Percent of Exports by Legal Form of Organization of Firm: 1992[All data are shown as percents, except firms. For meaning of abbreviations and symbols, see introductory text. For explanation of terms, see appendix A]
Type of firm and legal form of organization
Percent of total sales that were exports1
Firms(number) Less than 1 1 to 9 10 to 24 25 to 49 50 to 74 75 to 99
A B C D E F G
All businesses 17 253 143............................................................ .6 .4 .1 .2 .2 .11
Individual proprietorships 14 599 295.......................................................... .5 .3 .1 .2 .2 .12Partnerships 1 089 578..................................................................... .2 .3 .1 .1 – .13Subchapter S corporations 1 564 270........................................................ 1.1 1.4 .7 .3 .1 .44
Hispanic ~owned businesses 771 708............................................... .4 .4 .2 .2 .2 .35
Individual proprietorships 689 015.......................................................... .3 .2 .1 .1 .1 .26Partnerships 32 650..................................................................... .7 1.2 .4 .3 – .27Subchapter S corporations 50 042........................................................ .9 1.4 1.1 .8 .7 .88
Black ~owned businesses 620 912.................................................. .3 .1 .1 – – .19
Individual proprietorships 584 256.......................................................... .3 .1 .1 – – .110Partnerships 14 727..................................................................... – – – – – –11Subchapter S corporations 21 928........................................................ .6 .3 .2 – .4 –12
Other minority ~owned businesses 606 426.......................................... .3 .5 .3 .1 .2 .313
Individual proprietorships 502 022.......................................................... .2 .3 .2 .1 .2 .314Partnerships 49 489..................................................................... .1 .3 .2 .1 .1 .315Subchapter S corporations 54 915........................................................ .6 2.2 .7 .4 .3 .616
Women ~owned businesses 5 888 883................................................ .3 .2 .1 .1 .1 .117
Individual proprietorships 5 078 077.......................................................... .3 .1 – .1 .1 .118Partnerships 243 651..................................................................... .2 .4 .2 – – .119Subchapter S corporations 567 155........................................................ 1.1 1.1 .4 .3 .1 .220
Nonminority male ~owned businesses 10 114 456....................................... .7 .6 .2 .2 .2 .121
Individual proprietorships 8 414 238.......................................................... .7 .5 .1 .2 .2 –22Partnerships 777 379..................................................................... .2 .2 .1 .1 – .123Subchapter S corporations 922 838........................................................ 1.1 1.7 .8 .3 .1 .524
1Data represent percentage of firms reporting in the designated categories.2Includes businesses with no exports during 1992.3For explanation of relative standard errors and standard errors, see Reliability of Estimates in the introductory text.4Relative standard errors are not applicable for lines 1 through 4 since these data are the result of censuses, not surveys.
268 CHARACTERISTICS OF BUSINESS OWNERS 1992 ECONOMIC CENSUS
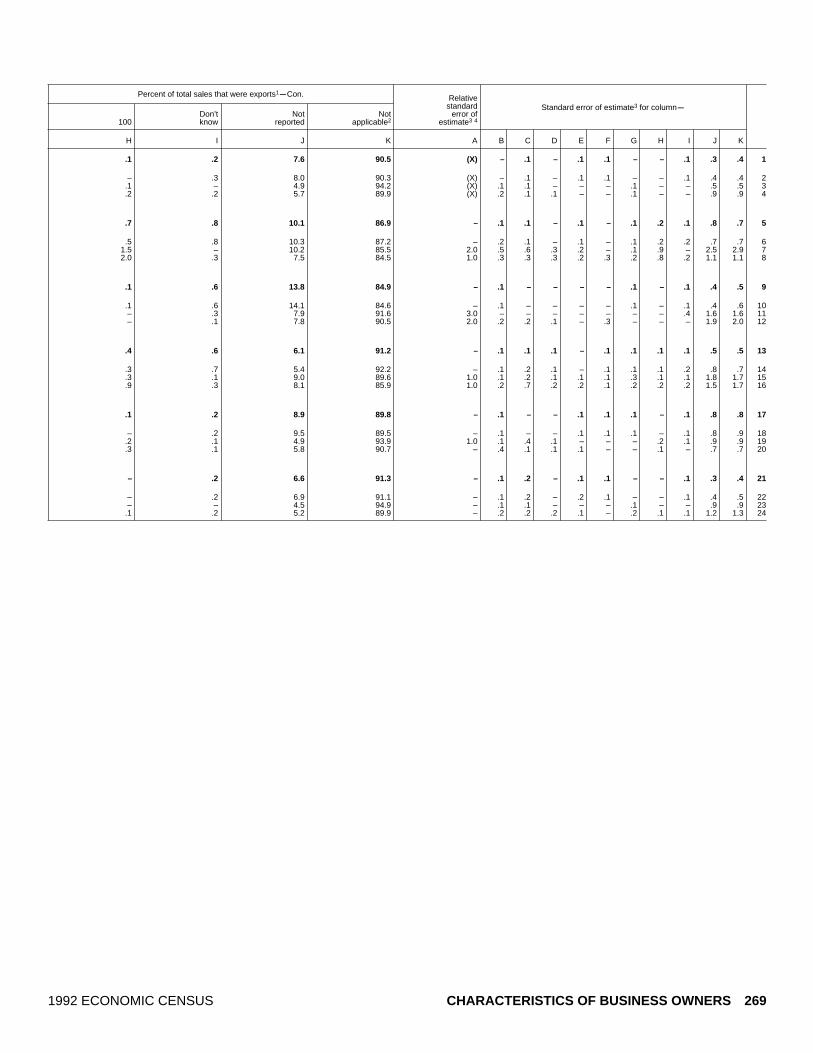
Percent of total sales that were exports1mCon.
Standard error of estimate3 for columnm
100Don’tknow
Notreported
Notapplicable2
Relativestandard
error ofestimate3 4
H I J K A B C D E F G H I J K
.1 .2 7.6 90.5 (X) – .1 – .1 .1 – – .1 .3 .4 1
– .3 8.0 90.3 (X) – .1 – .1 .1 – – .1 .4 .4 2.1 – 4.9 94.2 (X) .1 .1 – – – .1 – – .5 .5 3.2 .2 5.7 89.9 (X) .2 .1 .1 – – .1 – – .9 .9 4
.7 .8 10.1 86.9 – .1 .1 – .1 – .1 .2 .1 .8 .7 5
.5 .8 10.3 87.2 – .2 .1 – .1 – .1 .2 .2 .7 .7 61.5 – 10.2 85.5 2.0 .5 .6 .3 .2 – .1 .9 – 2.5 2.9 72.0 .3 7.5 84.5 1.0 .3 .3 .3 .2 .3 .2 .8 .2 1.1 1.1 8
.1 .6 13.8 84.9 – .1 – – – – .1 – .1 .4 .5 9
.1 .6 14.1 84.6 – .1 – – – – .1 – .1 .4 .6 10– .3 7.9 91.6 3.0 – – – – – – – .4 1.6 1.6 11– .1 7.8 90.5 2.0 .2 .2 .1 – .3 – – – 1.9 2.0 12
.4 .6 6.1 91.2 – .1 .1 .1 – .1 .1 .1 .1 .5 .5 13
.3 .7 5.4 92.2 – .1 .2 .1 – .1 .1 .1 .2 .8 .7 14
.3 .1 9.0 89.6 1.0 .1 .2 .1 .1 .1 .3 .1 .1 1.8 1.7 15
.9 .3 8.1 85.9 1.0 .2 .7 .2 .2 .1 .2 .2 .2 1.5 1.7 16
.1 .2 8.9 89.8 – .1 – – .1 .1 .1 – .1 .8 .8 17
– .2 9.5 89.5 – .1 – – .1 .1 .1 – .1 .8 .9 18.2 .1 4.9 93.9 1.0 .1 .4 .1 – – – .2 .1 .9 .9 19.3 .1 5.8 90.7 – .4 .1 .1 .1 – – .1 – .7 .7 20
– .2 6.6 91.3 – .1 .2 – .1 .1 – – .1 .3 .4 21
– .2 6.9 91.1 – .1 .2 – .2 .1 – – .1 .4 .5 22– – 4.5 94.9 – .1 .1 – – – .1 – – .9 .9 23
.1 .2 5.2 89.9 – .2 .2 .2 .1 – .2 .1 .1 1.2 1.3 24
1992 ECONOMIC CENSUS CHARACTERISTICS OF BUSINESS OWNERS 269

Appendix A.Explanation of Terms
Employment. Employment includes all employees, full-time and part-time, reported on a firm’s payroll duringspecified pay periods in 1992. Persons on sick leave, paidholidays, and paid vacations are included as employees,as are salaried officers and executives of corporations.However, proprietors and partners of unincorporated busi-nesses are not considered as employees.
The derivation of the 1992 employment figures variessomewhat among the different industries. For firms in theminerals, manufacturing, and construction industries, employ-ment represents an annual average of the number of‘‘production workers’’ on the payroll for any part of the payperiods including the 12th of March, May, August, andNovember, plus the number of ‘‘all other employees’’during the March 12th pay period. For the other industriescovered by the economic census and for those industriesnot covered, employment consists of all employees on thepayroll of a firm during the pay period including March 12.
Ethnicity. The ethnic categories used in this survey arethe same as those defined by the Office of Managementand Budget (OMB) in their Circular No. A-46, dated May12, 1977.
Firm. In this survey, a firm is a legal entity engaged ineconomic activity during any part of 1992 that filed an IRSform 1040, Schedule C; 1065; or 1120S. The differententities are described under Legal Form of Organization. Afirm may operate one place of business or more, such as achain of restaurants, or have no fixed business location,such as the firm represented by a self-employed carpenteror salesperson. A firm contrasts with an establishment,which is a single physical location at which business isconducted. Most of the other surveys under the economiccensus are conducted on an establishment, rather than afirm, basis.
Legal form of organization. The three legal forms oforganization included in this report are:
1. Individual proprietorship. An unincorporated busi-ness owned by an individual. Also, included in thiscategory are self-employed persons. The businessmay be the only occupation of an individual or thesecondary activity of an individual who works full timefor someone else.
2. Partnership. An unincorporated business owned bytwo or more persons having a financial interest in thebusiness.
3. Subchapter S corporation. A legally incorporatedbusiness under State laws. A subchapter S corporationis a special IRS designation for legally incorporatedbusinesses with 35 or fewer shareholders who, becauseof tax advantages, elect to be taxed as individualshareholders rather than as corporations.
Race. The race categories used in this survey are thesame as those defined by the Office of Management andBudget (OMB) in their Circular No. A-46, dated May 12,1977.
Receipts. Receipts include the gross value of all productssold, services rendered, or other receipts from customersduring the year, less returns and allowances. Value forsales and services is given whether or not payment wasactually received during the year, and therefore, does notindicate a cash flow. Although receipts data were sup-posed to cover calendar year 1992, fiscal year reportingwas permitted if it did not produce great differences. Noadjustments are made for the costs of doing business. Dueto the nature of the banking, real estate, and insuranceindustries and educational and social services, receiptsmay not be a good indicator of financial worth or size.
APPENDIX A A-11992 ECONOMIC CENSUS
Appendix B.1992 Survey of Minority-Owned Business Enterprises andSurvey of Women-Owned Businesses
These surveys are designed to measure the extent ofbusiness ownership by specific minority groups and women.They are based on the entire firm rather than on establish-ments of a firm.
The Survey of Minority-Owned Business Enterprises(SMOBE) was first conducted as a special project in 1969and was incorporated into the economic census in 1972. Itprovides basic economic data on businesses owned byBlacks, and persons of Hispanic or Latin American, Asian,Pacific Islander, American Indian, or Alaska Native ances-try. The Survey of Women-Owned Businesses (WOB) wasadded as a special project in 1972 and made part of theeconomic census in 1977.
The published reports show number of firms, grossreceipts, number of paid employees, and annual payroll.The data are presented by two-digit SIC codes; metropoli-tan areas (MA’s), counties, and places with 100 or moreminority- or women-owned firms; States; employment andreceipts size of firm; and legal form of organization.
A firm was classified as minority-owned if the sole owneror information reported for the majority of owners ofpartnerships and subchapter S corporations indicatedminor-ity ancestry. The same criteria are applied to identifywomen-owned firms.
The minority and women reports include data for indi-vidual proprietorships, partnerships, and subchapter Scorporations. They do not include corporations which file aform 1120 tax return. Both surveys include the sameindustries as the 1992 Characteristics of Business Owners(CBO) Survey.
SURVEY METHODOLOGY
The business population that filed IRS form 1040,Schedule C (individual proprietorship or self-employedperson); 1065 (partnership); or 1120S (subchapter S cor-poration) in 1992 was identified from government adminis-trative records (see CENSUS DISCLOSURE RULES in theintroductory text for safeguards).
For businesses filing these forms, the IRS provided theCensus Bureau with the following information:
x Name and address of the firm
x Employer identification number of the firm
x Social Security numbers (SSN’s) of the owners for filersof Form 1040 Schedule C
x Principal industrial activity code (see COMPARABILITYOF 1987 AND 1992 DATA in the introductory text)
x Dollar receipts
x Legal form of organization
Individual Proprietorships and Self-EmployedPersons (Filers of Form 1040, Schedule C)
The methodology for collecting information about busi-nesses owned by Hispanics, Asians, Pacific Islanders,American Indians, and Alaska Natives that filed IRS Form1040, Schedule C, was similar to 1987. The SSN’s of theowners were sent to the SSA, which provided the racecodes that were indicated by the individuals on theiroriginal applications for SSN’s.
Persons applying for SSN’s prior to 1981 could catego-rize their race as (a) White, (b) Black, or (c) Other. In 1981,the racial descriptions on social security applications wereexpanded to (a) Asian, Asian-American, or Pacific Islander,(b) Hispanic, (c) Black, (d) Northern American Indian orAlaskan Native, and (e) White.
Most persons who currently own businesses applied fortheir SSN’s prior to 1981. Therefore, the majority of ownerscould be classified only as ‘‘White,’’ ‘‘Black,’’ or ‘‘Other’’ byuse of SSA race codes. The SSA race codes weresufficient to determine if a firm was Black-owned, but asample mail canvass was used to determine if a firm wasowned by persons of Hispanic, Asian, Pacific Islander,American Indian, or Alaska Native ancestry. Individualproprietors who reported they were of minority ancestry inthe 1987 survey and whose firms were still active in 1992were excluded from the mail canvass.
The Census Bureau has developed lists of Hispanic andAsian surnames. A firm was considered potentially minorityowned if the owner’s surname was included on these listsor the owner’s SSA race code was ‘‘Hispanic’’ or ‘‘Other.’’Survey forms were sent to the following potentially minority-owned firms:
1. Individual proprietorships with no employees weresampled at varying rates based on the numbers offirms in a particular industry and State. All cases wereselected in States and industries where there wererelatively few firms, and the sampling rate was lowestin States and industries with the greatest number of
APPENDIX B B-11992 ECONOMIC CENSUS

firms. No sampling rate was lower than one in ten.Some cases were selected with certainty based onreceipts size and their respective industry and State.
2. Individual proprietorships with paid employees weresampled at a rate of one in two, or were selected withcertainty based on receipts size, number of employ-ees, and annual payroll for their respective industryand State.
A similar methodology was used to select a sample fromthe remaining universe of individual proprietorships. Asurvey form was sent to these cases to estimate thenumber of firms owned by Americans of minority ancestrywho have surnames more often associated with nonminor-ity ancestries. These firms are used to make estimates ofthe undercoverage of minority-owned firms.
Partnerships and Subchapter S Corporations(Filed either IRS Form 1065 or 1120S)
Themethodology for collecting information about minority-owned partnerships and subchapter S corporations changedin 1992. Information about the surnames of the businessowners was not available. Therefore, a sample of all of thebusinesses filing 1065 and 1120S tax forms was taken atvarying rates depending on the State, industry, andemployer/nonemployer status of the businesses, and pastSMOBEsurveys indicating the businesswasBlack-, Hispanic-,
Asian-, Pacific Islander-, American Indian-, or Alaska Native-owned. A firm selected into the sample was mailed a formto determine the ethnicity and race of the owners.
In the 1992 SMOBE, a firm is classified as minority-owned if the sole owner or information reported for themajority of owners of partnerships and subchapter Scorporations indicated Black, American Indian, AlaskaNative,Asian American or Pacific Islander race or Hispanic ances-try.
It was possible for a firm to be classified in more thanone minority group (one racial and one Hispanic ethnicity)and to be included in more than one minority report. Forexample, a firm could be included in both the Asians andPacific Islanders, American Indians, and Alaska Nativesreport and the Hispanic report if it were owned equally bytwo people, one of Japanese ancestry and one of Mexicanancestry. However, such a firm is counted only once attotal levels in the summary report.
The following information was obtained for each firmfrom the Census Bureau’s 1992 Economic Census files:
x Standard industrial classification (SIC) code (see INDUS-TRY CLASSIFICATIONS in the introductory text)
x Geographic code
x Legal form of organization code
x Number of employees, annual payroll, and receipts forfirms with paid employees
B-2 APPENDIX B 1992 ECONOMIC CENSUS

Appendix C.Questionnaires
The sample report forms are shown on the following pages.
APPENDIX C C–11992 ECONOMIC CENSUS

1992 ECONOMIC CENSUSAPPENDIX CC–2
1992 ECONOMIC CENSUS
SOLE PROPRIETORSHIPOMB No. 0640-0022: Approval Expires 08/31/96
CBO-1
U.S. DEPARTMENT OF COMMERCE BUREAU OF THE CENSUS
FORM
If you have questions aboutcompleting this report, please callor write the Census Bureau. Inany communication, be sure torefer to the 11-digit Census FileNumber (CFN) printed in the labelto the right.
Toll-free assistance, 8 a.m. to5 p.m., eastern time. Monday
through Friday:1–800–354–7271
Please read the instructions belowbefore answering the questions.
CBO-1
In correspondence pertaining to this report,please refer to this Census File Number (CFN)
Please correct errors in name, address, and ZIP Code. ENTER street and number if not shown.
U.S
. DEP
ARTMENT OF COM
ME
RC
E
BU
R
EAU OF THE CENSU
S
Notice — Response to this inquiry isrequired by law (Title 13, U.S.Code). By the same law, your reportto the Census Bureau is confidential.It may be seen only by sworn Censusemployees and may be used only forstatistical purposes. The law alsoprovides that copies retained in yourfiles are immune from legal process.
INSTRUCTIONS — Please Read
The purpose of this questionnaire is to collect information aboutthe characteristics of self-employed persons, business owners,and their business activities.
The term business in the following questions refers to the self-employment or business activity for which you filed one of thefollowing IRS tax forms in 1992:
a. Form 1040 WITH a Schedule C, "Profit or Loss FromBusiness" (Sole Proprietorship)
b. Form 1040 WITH a Schedule C-EZ, "Net Profit From aBusiness" (Sole Proprietorship)
Examples of a person who should complete this questionnaire:
• A sole proprietor
• An independent salesperson
• An independent agent or commission worker
• An independent contractor
• A statutory employee
The questions apply to business activities during all or part ofcalendar years 1992 and 1994 and must be completed even ifthe business has since been sold, reorganized, or discontinuedor you are no longer self-employed.
If the information requested is not available, your best estimateis acceptable.
Even if this questionnaire was mailed to your home address andthe business is not located at this address, the form is applicableand must be completed.
Data provided by you will be used only for statistical purposesand will be kept strictly confidential.
1a.
b.
c.
Do you still own the same business, referred to in theabove mailing label, that you owned in 1992?
What year did your ownership end?
1992
1993
Mark X the item below which best describes thechange in ownership and complete the questionnairefor the business you owned in 1992.
Sold
No
1994
1995
Business no longer exists
Transferred ownership/gift
2a.
Yes — SKIP to question 3
No
Don’t know — SKIP to question 3
Is the business you owned in 1992 still operating?
b. What year did the operations discontinue?
1992
1993
1994
1995
c. Which item below best describes the status of thisbusiness at the time the decision was made to ceaseoperations?
Successful — SKIP to question 3
Unsuccessful
IMPORTANT — How to Fill Out This FormPlease use a #2 black lead pencil. Mostquestions ask you to mark X IN THEBOX, or to print the information.See EXAMPLE
Yes
No
X
CHARACTERISTICS OF BUSINESS OWNERS SURVEY
15 DAYS AFTERRECEIPT OF FORM
DUE DATE:
Yes — SKIP to question 2a
§!"¨

1992 ECONOMIC CENSUS APPENDIX C C–3
3.
Male
Female
What is your gender?
2d. Why was this business unsuccessful? Mark X all that apply.
Inadequate cash flow or low sales
Lack of access to business loans/credit
Lack of access to personal loans/credit
Other — Specify
4a.
Under 25
25—34
35—44
What was your age as of December 31, 1992?
45—54
55—64
65 or over
b. Were you born in the United States?
5.
On the date that youstarted/acquired this business?
What was your marital status —
Never married
Married
Divorced/separated
Widowed
As of December 31, 1992?
Never married
Married
Divorced/separated
Widowed
6a. What was your veteran status as of December 31, 1992?
Not a veteran — SKIP to question 7
6 months or more active duty —Complete questions 6b and 6c
b. Was any of your active duty served during theVietnam-era (i.e., any service between August 5, 1964and May 7, 1975)?
c. Are you a disabled veteran?
7.
During 1992?
Did you have health insurance from any source —
Yes, through spouse’s insurer
Yes, through this business’s insurer
Yes, through another business’s insurer
Yes, through trade association’s insurer
Yes, through some other source
No
During 1994?
Yes, through spouse’s insurer
Yes, through this business’s insurer
Yes, through another business’s insurer
Yes, through trade association’s insurer
Yes, through some other source
No
8a. How much schooling had you completed when youstarted/acquired this business? Mark X ONE boxonly for the highest level completed or degree received.
Less than 9th grade
Some high school, but no diploma
High school graduate — DIPLOMA orEQUIVALENT DIPLOMA (GED)
Technical, trade, or vocational school
Some college, but no degree
Associate Degree
Bachelor’s Degree
Master’s Degree
Professional School or Doctorate
b. If you attended college or other school beyondhigh school, what was your area ofconcentration?
Architecture/Engineering
Biological/Medical Science
Business
Computer Science
Construction Trade/Industrial Arts
Law and Legal Studies
Liberal Arts/General Studies
Mathematics
Military Technologies
Other college
Other vocational
Continue with question 9a on page 3
FORM CBO-1 (10-1-94)Page 2
Yes
No
Yes
No
Yes
No
Less than 6 months active duty —SKIP to question 6c

APPENDIX CC–4
10a. How many years of work experience did you haveprior to starting/acquiring this business?
b. If " X Yes," did you work for any of these relatives?
b.
None
Less than 2 years
2—5 years
6—9 years
10—19 years
20 years or more
Not sure
How many of those years did you work in amanagerial capacity?
Continue with question 13c on page 4
FORM CBO-1 (10-1-94) Page 3
c.
None
Less than 2 years
2—5 years
6—9 years
10—19 years
20 years or more
Not sure
How many of those years were you anowner of another business?
d.
Yes
No
Did you previously work for a business whosegoods/service(s) were similar to those provided bythis business?
What was YOUR total personal income – (Do notinclude income from spouse or other family members.)
11.
For the year of 1992?Mark X ONE box only.
Less than $5,000
$5,000—$9,999
$10,000—$14,999
$15,000—$24,999
$25,000—$34,999
$35,000—$49,999
$50,000—$74,999
$75,000—$99,999
$100,000—$149,999
$150,000 or more
12. What year was this business established?
Before 1970
1970—1979
1980—1985
1986—1988
1989
1990
1991
1992
13a. When did you acquire ownership of this business?
Before 1970
1970—1979
1980—1985
1986—1988
1989
1990
1991
1992
b. How did you acquire ownership of this business?
Founded
Received transfer of ownership/gift
Purchased
Inherited
Other — Specify
Less than $5,000
$5,000—$9,999
$10,000—$14,999
$15,000—$24,999
$25,000—$34,999
$35,000—$49,999
$50,000—$74,999
$75,000—$99,999
$100,000—$149,999
$150,000 or more
9a. Prior to beginning/acquiring this business, had any ofyour close relatives ever owned a business OR beenself-employed? (Close relatives refer to spouses,parents/guardians, brothers, sisters, or immediate family.) For the year of 1994?
Mark X ONE box only.
Yes
No
§!$¨
None (did not work) — SKIP to question 11
Less than 2 years
2—5 years
6—9 years
10—19 years
20 years or more
Yes
No — SKIP to question 10a
1992 ECONOMIC CENSUS

APPENDIX C C–5
To have more freedom to meet family responsibilities
To bring a new idea to the marketplace
To advance in my profession
To be my own boss
Other — Specify
To have a primary source of income
To have a secondary source of income
To have work which conforms to my health limitations
13c. Which of the following most closely matches yourreason for becoming an owner in this business?Mark X ONE box only.
Continue with question 16 on page 5
FORM CBO-1 (10-1-94)Page 4
14a. What was the total amount of capital required tostart/acquire this business? (Capital includes assets andmoney that were your own, that were given to you, and thatyou borrowed.)
None — SKIP to question 15a
Less than $5,000
$5,000—$9,999
$10,000—$24,999
$25,000—$49,999
$50,000—$99,999
$100,000—$249,999
$250,000—$999,999
$1,000,000 or more
14d. What was the source(s) of this business’snon-borrowed capital? Mark X all that apply.
None — 100% borrowed capital
15a. How many weeks did you spend managing orworking in this business —
b. What percent of the total capital, by means ofbusiness and personal loans, did you borrow tostart/acquire ownership of this business?
None — SKIP toquestion 14d
c. What was the source(s) from which you receivedthe money you borrowed? Mark X all that apply.
Business loan from banking or commerciallending institution
Government-guaranteed business loan frombanking or commercial lending institution
Business loan from Federal, State or local government
Business loan from investment company/profit ornonprofit private source
Business loan from previous owner
Business trade credit from supplier
Other business loan
Personal loan using your home mortgage/equityline of credit
Personal credit card
Personal loan from spouse
Personal loan from family
Other personal loan
Proceeds from the sale of personal assets
Personal/family savings
Other — Specify
Use of personal/family physical assets(building, motor vehicle, equipment, etc.)
e. What measure(s) did you take if this business wasproducing inadequate cash flow or low sales afteryour initial investment of start-up/acquisitioncapital? Mark X all that apply.
Did not occur — SKIP to question 15a
Relied upon own income from other business/job
Invested additional capital
Delayed payment to suppliers
Received help from family
Other — Specify
During 1992?
None
Less than 12 weeks
12—23 weeks
24—35 weeks
36—47 weeks
48 weeks or more
During 1994?
None
Less than 12 weeks
12—23 weeks
24—35 weeks
36—47 weeks
48 weeks or more
b. What was the average number of hours per weekyou spent managing or working in this business —
During 1992?
None
Less than 10 hours
10—19 hours
20—29 hours
30—39 hours
40 hours
41—49 hours
50—59 hours
60 hours or more
During 1994?
None
Less than 10 hours
10—19 hours
20—29 hours
30—39 hours
40 hours
41—49 hours
50—59 hours
60 hours or more
25%—49%
50%—74%
75%—99%
100%
Less than 10%
10%—24%
To have work not available elsewhere in the job market
1992 ECONOMIC CENSUS

APPENDIX CC–6
Continue with question 18b on page 6
FORM CBO-1 (10-1-94) Page 5
16. Did you receive any grants, management training,or technical assistance in the start-up or operationof this business from any of the followingsources? Mark X all that apply.
No assistance received
Federal government
State and/or local government
College or university
Other business/franchisor
Other — Specify
17a. What was this business’s total sales/gross receipts —
For the Year of 1992?
Less than $5,000
$5,000—$9,999
$10,000—$24,999
$25,000—$49,999
$50,000—$99,999
$100,000—$199,999
$200,000—$249,999
$250,000—$499,999
$500,000—$999,999
$1,000,000 or more
b. Check any of the following categories if theyaccounted for 10% or more of this business’s totalsales of goods/services —
During 1992.
Federal government
State government
Local government (including school districts,transportation authorities, etc.)
Other business and/or corporations
Individuals
All others
During 1994.
Federal government
State government
Local government (including school districts,transportation authorities, etc.)
Other business and/or corporations
Individuals
All others
17c. Which geographic area(s) best describes themarketplace where this business’s goods/serviceswere sold — Mark X all that apply.
During 1992?
Neighborhood
City/county
Less than $5,000
$5,000—$9,999
$10,000—$24,999
$25,000—$49,999
$50,000—$99,999
$100,000—$199,999
$200,000—$249,999
$250,000—$499,999
$500,000—$999,999
$1,000,000 or more
Regional (adjoining counties and/or states)
National
International
During 1994?
Neighborhood
City/county
Regional (adjoining counties and/or states)
National
International
d. What percent of the customers served by thisbusiness were WHITE and NOT of HISPANIC origin —
18a. What was this business’s net profit (or net loss)BEFORE taxes as reported on your tax return —(Net profit or loss is defined as total sales/gross receiptsminus total expenses.)
During 1992?
Less than 10%
10%—24%
25%—49%
50%—74%
75% or more
Don’t know
For the Year of 1994? Mark X ONE box only.
NET PROFIT
Less than $10,000
$10,000—$24,999
$25,000—$99,999
$100,000 or more
NET LOSS
Less than $10,000
$10,000—$24,999
$25,000—$99,999
$100,000 or more
During 1994?
Less than 10%
10%—24%
25%—49%
50%—74%
75% or more
Don’t know
NET PROFIT
Less than $10,000
$10,000—$24,999
$25,000—$99,999
$100,000 or more
NET LOSS
Less than $10,000
$10,000—$24,999
$25,000—$99,999
$100,000 or more
Mark X ONE box only.For the Year of 1994?Mark X ONE box only.
For the Year of 1992? Mark X ONE box only.
§!&¨
1992 ECONOMIC CENSUS

APPENDIX C C–7
Yes — Continue with question 19b on page 7
No — SKIP to question 20 on page 7
Continue on page 7
FORM CBO-1 (10-1-94)Page 6
18b. What percent of your total personal income was produced as a result of this business —(DO NOT include income from spouse or other family member.)
For the Year of 1992? Mark X ONE box only.
None
Less than 10%
10%—24%
25%—49%
50%—74%
75%—99%
100%
c. What was the impact of the following issues upon the profitability of this business —
During 1992? Mark X ONE box for each of lines I—VIII.
I. Health insurance costs . . . . . . . . . . . . . . . .
II. Credit market conditions . . . . . . . . . . . . . .
III. IRS regulations or penalties . . . . . . . . . . . .
IV. Environmental regulations . . . . . . . . . . . . .
V. The Americans with Disabilities Act . . . . . . . .
VI. The Occupational Safety and Health Act (OSHA)
Strongpositiveimpact
Minorpositiveimpact
NeutralMinor
negativeimpact
Strongnegativeimpact
Notapplicable
Don’tknow
None
Less than 10%
10%—24%
25%—49%
50%—74%
75%—99%
100%
I. Health insurance costs . . . . . . . . . . . . . . . .
II. Credit market conditions . . . . . . . . . . . . . .
III. IRS regulations or penalties . . . . . . . . . . . .
IV. Environmental regulations . . . . . . . . . . . . .
V. The Americans with Disabilities Act . . . . . . . .
VI. The Occupational Safety and Health Act (OSHA)
Strongpositiveimpact
Minorpositiveimpact
NeutralMinor
negativeimpact
Strongnegativeimpact
Notapplicable
Don’tknow
19a. Did this business have any paid employees in 1992 or 1994?
For the Year of 1994? Mark X ONE box only.
During 1994? Mark X ONE box for each of lines I—VIII.
VII. Lack of financial capital . . . . . . . . . . . . . . . . . . . . . . . . . . .
VIII. Crime . . . . . . . . . . . . . . . . . . . . . . . . . . . . . . . . . . . . .
VII. Lack of financial capital . . . . . . . . . . . . . . . . . . . . . . . . . . .
VIII. Crime . . . . . . . . . . . . . . . . . . . . . . . . . . . . . . . . . . . . .
1992 ECONOMIC CENSUS

APPENDIX CC–8
Continue with question 21b on page 8
FORM CBO-1 (10-1-94) Page 7
e. Did this business offer any retirement plan (profitsharing, employee stock ownership, pension,including 401(K), annuity, Keogh, SEP, etc.) to itsemployees —
During 1992?
Yes
No
f. Did this business offer any health plan to itsemployees in either 1992 or 1994?
Yes, both in 1992 and 1994 — SKIP to question 20
Yes, in 1992 only
Yes, in 1994 only
No, not in 1992 or 1994
19g. What was the main reason this business did notoffer any health plan to its employees —
During 1992? Mark X ONE box only.
Costs/premiums were too high-priced
Rejected by health insurers
Dropped by this business’s health insurer
Not needed to attract or retain employees
High full-/part-time employee turnover
Administrative burden
Not desired by employees
Don’t know
Other — Specify
Costs/premiums were too high-priced
Rejected by health insurers
Dropped by this business’s health insurer
Not needed to attract or retain employees
High full-/part-time employee turnover
Administrative burden
Not desired by employees
Don’t know
Other — Specify
During 1994?
Yes
No
21a. Was this business operated primarily from or in ahome — Mark X ONE box in each time period.
When first established?
19b. What was this business’s total employment —
During the pay periodincluding March 12,1992?
No employees
1—4 employees
5—9 employees
10—19 employees
20—49 employees
50—99 employees
100 employeesor more
During the pay periodincluding March 12,1994?
No employees
1—4 employees
5—9 employees
10—19 employees
20—49 employees
50—99 employees
100 employeesor more
c. Approximately what percent of this business’semployees were WOMEN —
During the pay periodincluding March 12,1992?
No womenemployees
During the pay periodincluding March 12,1994?
No womenemployees
d. Approximately what percent of this business’semployees (men and women) were WHITE and NOTof HISPANIC origin —
During the pay periodincluding March 12,1992?
Less than 10%
10%—24%
25%—49%
50%—74%
75% or more
Don’t know
During the pay periodincluding March 12,1994?
Less than 10%
10%—24%
25%—49%
50%—74%
75% or more
Don’t know
20. Was this business a franchise —
During 1994? Mark X ONE box only.
Less than 10%
10%—24%
25%—49%
50%—74%
75% or more
Don’t know
Less than 10%
10%—24%
25%—49%
50%—74%
75% or more
Don’t know
During 1992?
Yes
No
During 1994?
Yes
No
Yes
No
Don’t know
During 1992?
Yes
No
During 1994?
Yes
No
§!(¨
If you answered " X No"to all three parts ofquestion 21a, SKIP toquestion 21c on page 8.
1992 ECONOMIC CENSUS
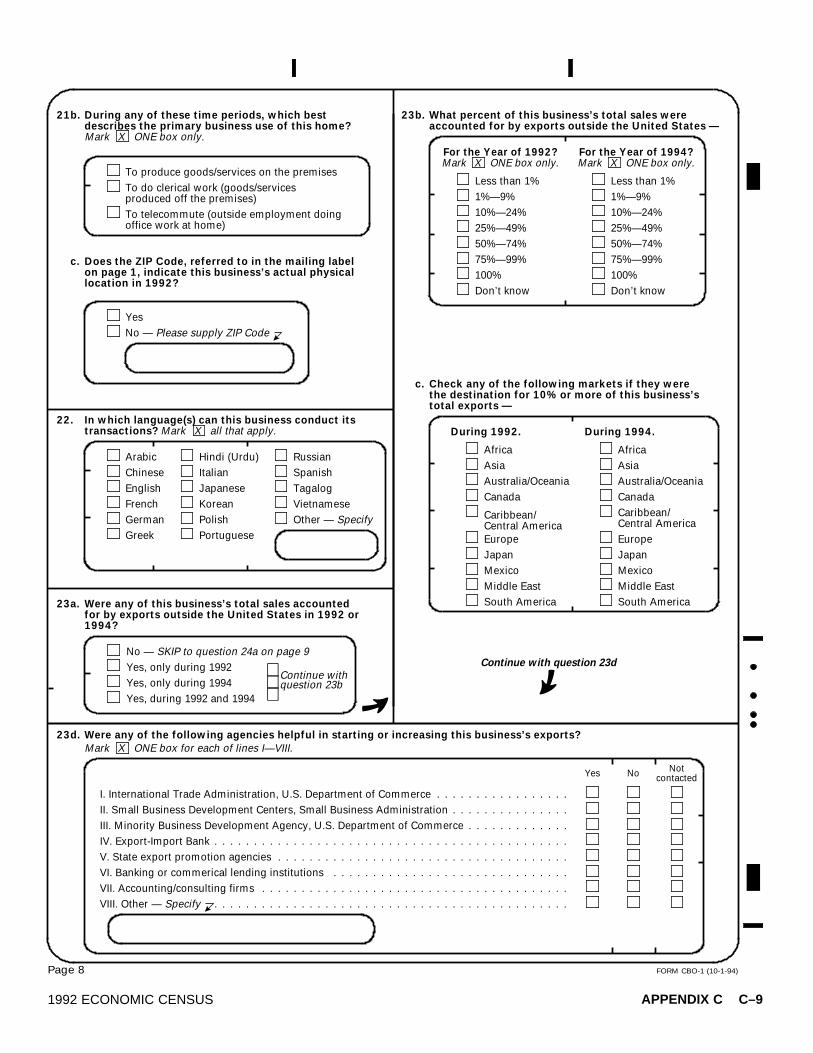
APPENDIX C C–9
FORM CBO-1 (10-1-94)Page 8
22. In which language(s) can this business conduct itstransactions? Mark X all that apply.
Arabic
Chinese
English
French
German
Greek
During any of these time periods, which bestdescribes the primary business use of this home?Mark X ONE box only.
To produce goods/services on the premises
To do clerical work (goods/servicesproduced off the premises)
To telecommute (outside employment doingoffice work at home)
c. Does the ZIP Code, referred to in the mailing labelon page 1, indicate this business’s actual physicallocation in 1992?
Yes
No — Please supply ZIP Code
23a. Were any of this business’s total sales accountedfor by exports outside the United States in 1992 or1994?
Continue withquestion 23b
23b. What percent of this business’s total sales wereaccounted for by exports outside the United States —
For the Year of 1992?Mark X ONE box only.
Less than 1%
1%—9%
10%—24%
25%—49%
50%—74%
75%—99%
100%
Don’t know
Italian
Japanese
Korean
Polish
Portuguese
Hindi (Urdu)
Tagalog
Other — Specify
Vietnamese
Russian
Spanish
Less than 1%
1%—9%
10%—24%
25%—49%
50%—74%
75%—99%
100%
Don’t know
c. Check any of the following markets if they werethe destination for 10% or more of this business’stotal exports —
During 1992.
23d. Were any of the following agencies helpful in starting or increasing this business’s exports?
I. International Trade Administration, U.S. Department of Commerce . . . . . . . . . . . . . . . . .
Yes NoNot
contacted
II. Small Business Development Centers, Small Business Administration . . . . . . . . . . . . . . .
III. Minority Business Development Agency, U.S. Department of Commerce . . . . . . . . . . . . .
IV. Export-Import Bank . . . . . . . . . . . . . . . . . . . . . . . . . . . . . . . . . . . . . . . . . . . . .
V. State export promotion agencies . . . . . . . . . . . . . . . . . . . . . . . . . . . . . . . . . . . . .
VI. Banking or commerical lending institutions . . . . . . . . . . . . . . . . . . . . . . . . . . . . . .
VII. Accounting/consulting firms . . . . . . . . . . . . . . . . . . . . . . . . . . . . . . . . . . . . . . .
VIII. Other — Specify . . . . . . . . . . . . . . . . . . . . . . . . . . . . . . . . . . . . . . . . . . . . .
Caribbean/Central America
Europe
Japan
Mexico
Middle East
South America
During 1994.
Africa
Asia
Australia/Oceania
Canada
Caribbean/Central America
Europe
Japan
Mexico
Middle East
South America
Continue with question 23d
Africa
Asia
Australia/Oceania
Canada
Mark X ONE box for each of lines I—VIII.
For the Year of 1994?Mark X ONE box only.
21b.
No — SKIP to question 24a on page 9
Yes, only during 1992
Yes, only during 1994
Yes, during 1992 and 1994
1992 ECONOMIC CENSUS

APPENDIX CC–10
FORM CBO-1 (10-1-94) Page 9
23e. How long had this business been involved in exporting before December 31, 1992?
Less than 1 year
1—5 years
6—10 years
More than 10 years
24a. Is this business planning on starting or increasing its exports in the near future?
Yes
No
b. Are the following issues important to this business’s ability to export?
I. Export financing . . . . . . . . . . . . . . . . . . . . . . . . . . .
II. Information on export opportunities . . . . . . . . . . . . . . .
III. Foreign trade restrictions . . . . . . . . . . . . . . . . . . . . .
IV. U.S. trade restrictions . . . . . . . . . . . . . . . . . . . . . . .
V. Competition in the foreign market . . . . . . . . . . . . . . . .
VI. Price of this business’s exports . . . . . . . . . . . . . . . . .
VII. Dollar exchange rate . . . . . . . . . . . . . . . . . . . . . . .
VIII. Local environmental restrictions . . . . . . . . . . . . . . . .
IX. Other — Specify . . . . . . . . . . . . . . . . . . . . . . . . .
Somewhatimportant
Notimportant
Notapplicable
Don’tknow
24c. Will this business’s exports increase substantiallyas a result of the North American Free TradeAgreement —
To Canada?
Yes
No
d. Will this business relocate some of its productionfacilities as a result of the North American FreeTrade Agreement —
• If this business had no paid employees in either 1992 or 1994,please SKIP to the Certification Box at the bottom ofpage 11 of this report form.
• If there were paid employees in either 1992 or 1994, pleaseCONTINUE on page 10.
Please read
To Mexico?
Yes
No
Continue with question 24c
PLEASE READ
Mark X ONE box for each of lines I—IX.
Veryimportant
To Canada?
Yes
No
To Mexico?
Yes
No
§!*¨
1992 ECONOMIC CENSUS

APPENDIX C C–11
Continue with question 29 on page 11
FORM CBO-1 (10-1-94)Page 10
26. Did this business have 50 or more employees(including full-time and part-time employees, andthose on leave of absence) on its payroll for 20 ormore calendar workweeks —
25. Is your business covered by the federal Family andMedical Leave Act (FMLA) of 1993?
Yes
No
Have not heard of law
Not sure whether law applies to my business
The following questions relate to family or medical leave taken byemployees. In this context, the terms "family leave" and "medicalleave" have the same meaning as under the federal Family andMedical Leave Act (FMLA) of 1993 — a law that requires coveredemployers to provide unpaid, job-protected leave to employees(a) for their own serious health condition, including pregnancyand childbirth ("medical leave") and (b) to care for a newborn,newly-placed adopted or foster child, or seriously ill child, spouse,or parent ("family leave").
During 1992?
Yes
No
27. Approximately, what percentage of your totalnumber of employees worked at least 1,250 hoursper year —
During 1992?
0%
Less than 1%
1%—4%
5%—9%
10%—24%
25%—49%
50%—74%
75%—100%
28a. Did any employee of this business take family ormedical leave —
During 1992?
Yes
No
If you marked " X No" for both years, SKIP to question 29 on page 11.
During 1994?
Yes
No
Questions 25 through 31 to be completed if there WERE PAID EMPLOYEES IN EITHER 1992 OR 1994
During 1994?
0%
Less than 1%
1%—4%
5%—9%
10%—24%
25%—49%
50%—74%
75%—100%
During 1994?
Yes
No
28b. How many employees took family or medical leave —
d. What was the typical length, in weeks, of family ormedical leave taken by an employee —
During 1992?
1—4
5—9
10—19
20—34
35—49
50—99
100—499
500 or more
c. Approximately, what percentage of the employees whotook family or medical leave in either year were male —
During 1992?
0%
Less than 1%
1%—4%
5%—9%
10%—24%
25%—49%
50%—74%
75%—100%
During 1992?
Less than 1 week
1 week
2 weeks
3—4 weeks
5—7 weeks
8—12 weeks
More than 12 weeks
During 1994?
1—4
5—9
10—19
20—34
35—49
50—99
100—499
500 or more
During 1994?
0%
Less than 1%
1%—4%
5%—9%
10%—24%
25%—49%
50%—74%
75%—100%
During 1994?
Less than 1 week
1 week
2 weeks
3—4 weeks
5—7 weeks
8—12 weeks
More than 12 weeks
1992 ECONOMIC CENSUS

APPENDIX CC–12
FORM CBO-1 (10-1-94) Page 11
29. Was it necessary for this business to change its following leave policies and practices to comply withthe federal Family and Medical Leave Act (FMLA) of 1993?
I. Leave by mothers to care for newborn child . . . . . . . . . . . . . . . . . .
II. Leave by fathers to care for newborn child . . . . . . . . . . . . . . . . . .
III. Leave for newly-placed adopted or foster child . . . . . . . . . . . . . . .
IV. Leave for own serious health condition, including childbirth . . . . . . .
V. Leave for care of seriously ill child, spouse, or parent . . . . . . . . . . .
Yes No
b. Approximately, what percentage of 1994 annual payroll (as reported on line 1 of IRS Form W-3),including costs for salaries, bonuses, and this business’s share of taxable employee benefits, does theabove cost associated with the federal Family and Medical Leave Act (FMLA) of 1993 represent?
0%
Less than 1%
1%—4%
If you answered " X No" to each of lines I—V, SKIP to the Certification Box at the bottom ofthis page; otherwise CONTINUE with question 30a.
30a. Did the changes in leave policies or practices required by the federal Family and Medical Leave Act(FMLA) of 1993 impose any NEW costs on this business in 1994?
I. Administrative costs . . . . . . . . . . . . . . . . . . . . . . . . . . . . . . . .
II. Continuation of benefits (health plan, etc.) during leave . . . . . . . . . .
III. Hiring/training costs . . . . . . . . . . . . . . . . . . . . . . . . . . . . . . .
IV. Other costs . . . . . . . . . . . . . . . . . . . . . . . . . . . . . . . . . . . .
NoLessthan
$5,000
$5,000 —$9,999
$10,000or
more
31. Have the changes in leave policies or practices required by the federal Family and Medical Leave Act(FMLA) of 1993 had any of the following effects on employees of this business?
I. Unscheduled absences not related to family and medical leave . . . . . .
II. Employee turnover . . . . . . . . . . . . . . . . . . . . . . . . . . . . . . . .
III. Employee productivity . . . . . . . . . . . . . . . . . . . . . . . . . . . . . .
IV. Employee morale . . . . . . . . . . . . . . . . . . . . . . . . . . . . . . . . .
V. Employees’ ability to handle family needs . . . . . . . . . . . . . . . . . .
ReducedNo
noticeableeffect
Increased
CERTIFICATION — Please print name of person responsible for completing this report.
Name Telephone number (Include Area Code)
Signature Date
5%—9%
10%—14%
15% or more
Mark X ONE box for each of lines I—V.
Mark X ONE box for each of lines I—IV.
Mark X ONE box for each of lines I—V.
Remarks
§¦,¨
1992 ECONOMIC CENSUS

APPENDIX C C–13
QUESTIONS AND ANSWERS REGARDING THE 1992CHARACTERISTICS OF BUSINESS OWNERS SURVEY
CBO-1 (10-1-94)
Why is this survey being taken?To provide valuable data for comparing selected economic, demographic, and sociological characteristics ofbusiness owners, self-employed persons, and their businesses. This survey is part of the economic censusprogram, which the Census Bureau is required to conduct every 5 years by law (Title 13 of the United StatesCode). The Census Bureau combines data from this survey with data from the 1992 Economic Census andpresents them in the Characteristics of Business Owners publication. The published data describe businessowners and self-employed persons, including their education, capital requirements, owner’s work experience,workforce characteristics, and business characteristics.
Who uses the survey data?Persons and institutions in both the public and private sectors extensively use these survey data. Accurate dataregarding business ownership are critical to informed decision making by Federal, State, and local governmentsregarding business assistance programs. In addition, private companies and trade associations use the data toanalyze trends; educators use them in teaching and research; and the media use them in news articles.
Why was I selected for this survey?You are part of a small sample of business owners that we randomly selected to represent your type of businessand geographic area. The use of a sample substantially limits the reporting burden on small businesses andreduces the survey cost; however, it also greatly increases the importance of receiving a report from eachbusiness selected.
What businesses are included in this survey?Businesses were eligible to be selected for this survey if they reported any business activity on the 1992 InternalRevenue Service tax Form 1040, Schedule C, "Profit or Loss From Business "(Sole Proprietorship) or ScheduleC-EZ, "Net Profit From a Business" (Sole Proprietorship).
Can I be paid for completing this report?No. The law (Title 13 of the United States Code) that directs the Census Bureau to conduct the economic censusand requires firms to report does not authorize payment for completing census reports. In addition, no fundshave been appropriated for this purpose.
Is each survey response kept confidential?Yes. By law, the Census Bureau cannot give individual responses to anyone (including government agencies) forany purpose. Survey responses are immune from legal action and exempt from the provisions of the Freedom ofInformation Act. Census Bureau publications summarize responses so that the confidentiality of respondents andtheir business activities is fully protected.
Why is the Census Bureau asking questions about 1992 and 1994?The complete sample for this survey cannot be selected until all collected data from the 1992 Economic Censusare available. Use of these data delays the mailout of this survey, but allows us to reduce significantly thenumber of survey questions and the survey cost. To determine the viability of businesses in existence in 1992and to improve the timeliness of the Characteristics of Business Owners publication, business owners are beingasked about their 1994 economic activities.
How can I get more information?Call 1–800–354–7271 Monday through Friday, 8 a.m. to 5 p.m. eastern time. Our telephone staff can answersurvey questions as well as provide you with additional forms and instructions.
We estimate it will take 30 minutes or less to complete this questionnaire. If you have anycomments regarding these estimates or any other aspect of this survey, send them to theAssociate Director for Administration, Paperwork Reduction Project 0640-0022, Room 3104,FB 3, Bureau of the Census, Washington, DC 20233; and to the Office of Management andBudget, Paperwork Reduction Project 0640-0022, Washington, DC 20503.
Page 12
Please send the questionnaire in the preaddressed return envelope. If you did not receive a returnenvelope, send the questionnaire to the Bureau of the Census, 1201 East 10th Street, Jeffersonville,IN 47134-0001.
1992 ECONOMIC CENSUS

APPENDIX CC–14
19
92
EC
ON
OM
IC C
EN
SU
S
PA
RT
NE
RS
HIP
OR
SU
BC
HA
PT
ER
S C
OR
PO
RA
TIO
N—
BU
SIN
ES
SC
HA
RA
CT
ER
IST
ICS
OM
B N
o. 0
640-0
022: A
pp
roval E
xp
ires 0
8/3
1/9
6
CB
O-2
U.S
. DE
PA
RT
ME
NT
OF
CO
MM
ER
CE
B
UR
EA
U O
F T
HE
CE
NS
US
FO
RM
DU
E D
AT
E: 1
5 D
AY
S A
FTE
R R
EC
EIP
T O
F FOR
M
To
ll-free
assis
tan
ce
, 8 a
.m. to
5 p
.m., e
aste
rntim
e. M
on
da
y th
rou
gh
Frid
ay
: 1–8
00
–3
54
–7
27
1
CB
O-2
In co
rresp
on
den
ce p
erta
inin
g to
this re
po
rt,p
lease
refe
r to th
is Cen
sus F
ile N
um
ber (C
FN
)
Please correct errors in name, address, and ZIP Code. EN
TER street and number if not show
n.
U.S. DEPARTME
NT
OF
CO
M
MERCE
BUREAU
OF
TH
EC
EN
SU S
Notice —
Re
sp
on
se
to th
is in
qu
iry is req
uired
by law
(Title 1
3, U
.S.
Co
de). B
y th
e s
am
e la
w, y
ou
r rep
ort to
the
Ce
nsu
s B
ure
au
is co
nfid
ential.
It ma
y b
e s
ee
n o
nly
by
sw
orn
Ce
nsu
s e
mp
loy
ee
s a
nd
ma
y b
e u
se
d o
nly
for
sta
tistic
al p
urp
ose
s. T
he
law
als
o p
rov
ide
s th
at c
op
ies re
tain
ed
in y
ou
r files
are
imm
un
e fro
m le
ga
l pro
ce
ss.
INS
TRU
CTIO
NS
— P
lease
Read
Th
e p
urp
ose
of th
is qu
estio
nn
aire
is to co
llect in
form
atio
n a
bo
ut th
e ch
ara
cteristics o
fse
lf-em
plo
ye
d p
erso
ns, b
usin
ess o
wn
ers, a
nd
the
ir bu
sine
ss activ
ities.
Th
e te
rm b
usin
ess in
the
follo
win
g q
ue
stion
s refe
rs to th
e se
lf-em
plo
ym
en
t or b
usin
ess
activ
ity fo
r wh
ich y
ou
filed
on
e o
f the
follo
win
g IR
S ta
x fo
rms in
19
92
:
a.F
orm
10
65
, "U.S
. Pa
rtne
rship
Re
turn
of In
com
e"
b.F
orm
11
20
S, "U
.S. In
com
e T
ax
Re
turn
for a
n S
Co
rpo
ratio
n"
Ex
am
ple
s of a
bu
sine
ss en
terp
rise th
at sh
ou
ld co
mp
lete
this q
ue
stion
na
ire:
•A
corp
ora
tion
tha
t ele
cted
to b
e a
n S
corp
ora
tion
by
filing
Fo
rm 2
55
3, "E
lectio
n b
y a
Sm
all B
usin
ess C
orp
ora
tion
;" the
IRS
acce
pte
d th
e e
lectio
n; a
nd
the
ele
ction
rem
ain
ed
in e
ffect d
urin
g 1
99
2.
Th
e q
ue
stion
s ap
ply
to b
usin
ess a
ctivitie
s du
ring
all o
r pa
rt of ca
len
da
r ye
ars 1
99
2 a
nd
19
94
an
d m
ust b
e co
mp
lete
d e
ve
n if th
e b
usin
ess h
as sin
ce b
ee
n so
ld, re
org
an
ized
, or
disco
ntin
ue
d o
r yo
u a
re n
o lo
ng
er se
lf-em
plo
ye
d.
If the
info
rma
tion
req
ue
sted
is no
t av
aila
ble
, yo
ur b
est e
stima
te is a
ccep
tab
le.
Ev
en
if this q
ue
stion
na
ire w
as m
aile
d to
yo
ur h
om
e a
dd
ress a
nd
the
bu
sine
ss is no
tlo
cate
d a
t this a
dd
ress, th
e fo
rm is a
pp
licab
le a
nd
mu
st be
com
ple
ted
.
Da
ta p
rov
ide
d b
y y
ou
will b
e u
sed
on
ly fo
r statistica
l pu
rpo
ses a
nd
will b
e ke
pt strictly
con
fide
ntia
l.
•A
pa
rtne
rship
, limite
d p
artn
ersh
ip, sy
nd
icate
, gro
up
, po
ol, jo
int v
en
ture
, or sim
ilar
un
inco
rpo
rate
d b
usin
ess th
at w
as n
ot a
trust, e
state
, or so
le p
rop
rieto
rship
in 1
99
2.
PLE
AS
E O
PE
N T
HIS
BO
OK
LE
T A
ND
BE
GIN
TH
E S
UR
VE
Y W
ITH
QU
ES
TIO
N 1
.
IMPO
RTAN
T —H
owto Fill O
ut This FormP
lea
se u
se a
#2
bla
ck lea
d p
en
cil. Mo
stq
ue
stion
s ask y
ou
to m
ark
X IN
TH
E B
OX
, or
to p
rint th
e in
form
atio
n.
Se
e E
XA
MP
LE
Yes
No
X
CH
AR
AC
TE
RIS
TIC
S O
F BU
SIN
ES
S O
WN
ER
S S
UR
VE
Y
If yo
u h
av
e q
ue
stio
ns a
bo
ut c
om
ple
ting
this
rep
ort, p
lea
se
ca
ll or w
rite th
eC
en
su
s B
ure
au
. In a
ny
co
mm
un
ica
tion
, be
su
re to
refe
r to th
e 1
1-d
igit
Ce
nsu
s F
ile N
um
be
r (CF
N) p
rinte
d in
the
lab
el to
the
righ
t.
§!"¨
1992 ECONOMIC CENSUS

APPENDIX C C–15
1a. Is the business that was in existence in 1992, referredto in the mailing label on page 1, still operating?
Before 1970
1970—1979
1980—1985
1986—1988
3a.
None — SKIP toquestion 4 on page 3
What was the total amount of capital required tostart/acquire this business? (Capital includes assets andmoney that were required of owners as well as those that thebusiness borrowed.)
b. What percent of the total capital, by means ofbusiness loans, was borrowed for this business’sstart-up/acquisition?
None — SKIP to question 3d
Continue with question 4 on page 3
FORM CBO-2 (10-1-94)Page 2
c. What was the source(s) from which this businessreceived the money it borrowed?
Business loan from banking or commerciallending institution
Government-guaranteed business loan frombanking or commercial lending institution
Business loan from Federal, State, or localgovernment
Business loan from investment company/profitor nonprofit private source
Business loan from previous owner
Business trade credit from supplier
Other business loan
d. What was the source(s) of this business’snon-borrowed capital?
None — 100% borrowed capital
Use of partnership’s/subchapter S corporation’sbusiness assets (building, motor vehicle,equipment, etc.)
Proceeds from the sale of partnership’s/subchapter S corporation’s business assets
Partnership’s/subchapter S corporation’s cash
Other — Specify
2. What year was this business established?
Yes — SKIP to question 2
No
Don’t know — SKIP to question 2
b. What year did the operations discontinue?
1992
1993
c. Which item below best describes the status of thisbusiness at the time the decision was made to ceaseoperations?
Successful — SKIP to question 2
Unsuccessful
d. Why was this business unsuccessful?
Inadequate cash flow or low sales
Lack of access to business loans/credit
Other — Specify
Mark X all that apply.
Mark X all that apply.
e. What measure(s) did this business take if it wasproducing inadequate cash flow or low sales after itsinitial investment of start-up/acquisition capital?
Did not occur — SKIP to question 4 on page 3
Operated using existing cash reserves
Invested additional capital
Delayed payment to suppliers
Other — Specify
Mark X all that apply.
Mark X all that apply.
1994
1995
1989
1990
1991
1992
$25,000—$49,999
$50,000—$99,999
$100,000—$249,999
$250,000—$999,999
$1,000,000 or more
50%—74%
75%—99%
100%
Less than $5,000
$5,000—$9,999
$10,000—$24,999
Less than 10%
10%—24%
25%—49%
1992 ECONOMIC CENSUS

APPENDIX CC–16
4. Did this business receive any grants, managementtraining, or technical assistance in its start-up oroperation from any of the following sources?
Continue with question 6b on page 4
FORM CBO-2 (10-1-94) Page 3
No assistance received
Federal government
State and/or local government
College or university
Other business/franchisor
Other — Specify
5a. What was this business’s total sales/gross receipts —
Mark X all that apply.
For the year of 1992?
Less than $5,000
$5,000—$9,999
$10,000—$24,999
$25,000—$49,999
$50,000—$99,999
$100,000—$199,999
$200,000—$249,999
$250,000—$499,999
$500,000—$999,999
$1,000,000 or more
Mark X ONE box only.
b. Check any of the following categories if theyaccounted for 10% or more of this business’s totalsales of goods/services —
During 1992?Federal government
State government
5c. Which geographic area(s) best describes themarketplace where this business’s goods/serviceswere sold —
During 1992?
Neighborhood
City/county
During 1994?Mark X all that apply. Mark X all that apply.
Regional (adjoiningcounties and/orstates)
National
International
Neighborhood
City/county
Regional (adjoiningcounties and/orstates)
National
International
d. What percent of the customers served by thisbusiness were WHITE and NOT of HISPANIC origin —
During 1992?
Less than 10%
10%—24%
25%—49%
50%—74%
75% or more
Don’t know
During 1994?
Less than 10%
10%—24%
25%—49%
50%—74%
75% or more
Don’t know
6a.
For the year of 1992?
Less than $10,000
$10,000—$24,999
$25,000—$99,999
$100,000 or more
Mark X ONE box only.
Less than $10,000
$10,000—$24,999
$25,000—$99,999
$100,000 or more
NET PROFIT NET LOSS
Local government (including school districts,transportation authorities, etc.)
Other businesses and/or corporations
Individuals
All others
During 1994?Federal government
State government
Local government (including school districts,transportation authorities, etc.)
Other businesses and/or corporations
Individuals
All others
For the year of 1994?
Less than $10,000
$10,000—$24,999
$25,000—$99,999
$100,000 or more
Mark X ONE box only.
Less than $10,000
$10,000—$24,999
$25,000—$99,999
$100,000 or more
NET PROFIT NET LOSS
What was this business’s net profit (OR net loss)BEFORE taxes (as reported on its tax return) — (Netprofit or net loss is defined as total sales/gross receiptsminus total expenses.)
For the year of 1994?
Less than $5,000
$5,000—$9,999
$10,000—$24,999
$25,000—$49,999
$50,000—$99,999
$100,000—$199,999
$200,000—$249,999
$250,000—$499,999
$500,000—$999,999
$1,000,000 or more
Mark X ONE box only.
§!$¨
1992 ECONOMIC CENSUS

APPENDIX C C–17
Continue with question 7d on page 5
FORM CBO-2 (10-1-94)Page 4
6b. What was the impact of the following issues upon the profitability of this business —
During 1992?
I. Health insurance costs . . . . . . . . . . . . . . . . .
II. Credit market conditions . . . . . . . . . . . . . . .
III. IRS regulations or penalties . . . . . . . . . . . . .
IV. Environmental regulations . . . . . . . . . . . . .
V. The Americans with Disabilities Act . . . . . . . .
VI. The Occupational Safety and Health Act (OSHA)
Strongpositiveimpact
Minorpositiveimpact
NeutralMinor
negativeimpact
Strongnegativeimpact
Notapplicable
Don’tknow
7a. Did this business have any paid employees in 1992or 1994?
Yes
No — SKIP to question 8 on page 5
Mark X ONE box for each of lines I—VIII.
Continue with question 7c
7c. Approximately what percent of this business’semployees were WOMEN —
During the pay periodincluding March 12,1992?
No womenemployees
During the pay periodincluding March 12,1994?
No womenemployeesb. What was this business’s total employment —
During the pay periodincluding March 12,1992?
No employees
1—4 employees
5—9 employees
10—19 employees
20—49 employees
50—99 employees
100 employeesor more
During 1994?
I. Health insurance costs . . . . . . . . . . . . . . . . .
II. Credit market conditions . . . . . . . . . . . . . . .
III. IRS regulations or penalties . . . . . . . . . . . . .
IV. Environmental regulations . . . . . . . . . . . . .
V. The Americans with Disabilities Act . . . . . . . .
VI. The Occupational Safety and Health Act (OSHA)
Strongpositiveimpact
Minorpositiveimpact
NeutralMinor
negativeimpact
Strongnegativeimpact
Notapplicable
Don’tknow
Mark X ONE box for each of lines I—VIII.
During the pay periodincluding March 12,1994?
No employees
1—4 employees
5—9 employees
10—19 employees
20—49 employees
50—99 employees
100 employeesor more
Less than 10%
10%—24%
25%—49%
50%—74%
75% or more
Don’t know
Less than 10%
10%—24%
25%—49%
50%—74%
75% or more
Don’t know
VII. Lack of financial capital . . . . . . . . . . . . . . . . . . . . . . . . . . . .
VIII. Crime . . . . . . . . . . . . . . . . . . . . . . . . . . . . . . . . . . . . . .
VII. Lack of financial capital . . . . . . . . . . . . . . . . . . . . . . . . . . . .
VIII. Crime . . . . . . . . . . . . . . . . . . . . . . . . . . . . . . . . . . . . . .
1992 ECONOMIC CENSUS
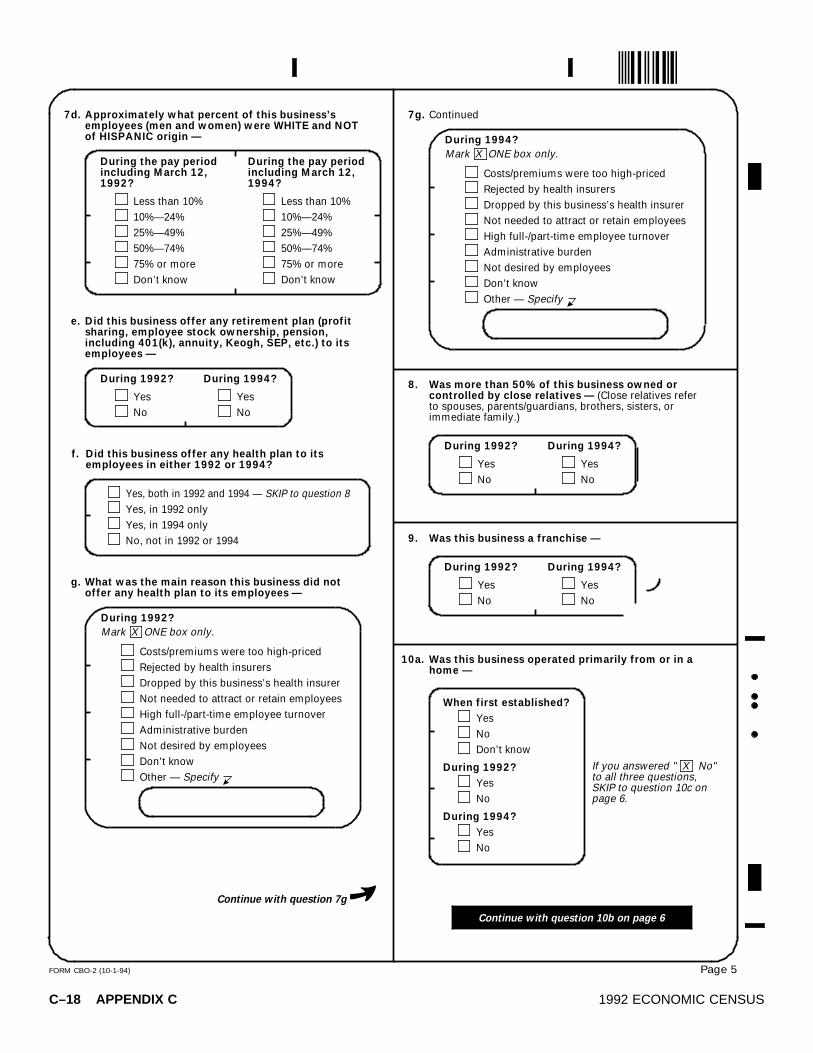
APPENDIX CC–18
Continue with question 10b on page 6
FORM CBO-2 (10-1-94) Page 5
f. Did this business offer any health plan to itsemployees in either 1992 or 1994?
Yes, both in 1992 and 1994 — SKIP to question 8
Mark X ONE box only.
7d. Approximately what percent of this business’semployees (men and women) were WHITE and NOTof HISPANIC origin —
During the pay periodincluding March 12,1992?
Less than 10%
10%—24%
25%—49%
50%—74%
75% or more
Don’t know
During the pay periodincluding March 12,1994?
7g. Continued
Continue with question 7g
Less than 10%
10%—24%
25%—49%
50%—74%
75% or more
Don’t know
e. Did this business offer any retirement plan (profitsharing, employee stock ownership, pension,including 401(k), annuity, Keogh, SEP, etc.) to itsemployees —
During 1992?
Yes
No
During 1994?
Yes
No
g. What was the main reason this business did notoffer any health plan to its employees —
During 1992?
Costs/premiums were too high-priced
Rejected by health insurers
Dropped by this business’s health insurer
Not needed to attract or retain employees
High full-/part-time employee turnover
Administrative burden
Not desired by employees
Don’t know
Other — Specify
8. Was more than 50% of this business owned orcontrolled by close relatives — (Close relatives referto spouses, parents/guardians, brothers, sisters, orimmediate family.)
During 1992?
Yes
No
9. Was this business a franchise —
10a. Was this business operated primarily from or in ahome —
When first established?Yes
No
Don’t know
During 1992?Yes
No
During 1994?Yes
No
If you answered " X No"to all three questions,SKIP to question 10c onpage 6.
Mark X ONE box only.
During 1994?
Costs/premiums were too high-priced
Rejected by health insurers
Dropped by this business’s health insurer
Not needed to attract or retain employees
High full-/part-time employee turnover
Administrative burden
Not desired by employees
Don’t know
Other — Specify
Yes
No
During 1992?
Yes
No
During 1994?
Yes
No
During 1994?
Yes, in 1992 only
Yes, in 1994 only
No, not in 1992 or 1994
§!&¨
1992 ECONOMIC CENSUS

APPENDIX C C–19
Continue with question 12d on page 7
FORM CBO-2 (10-1-94)Page 6
10b. During any of these time periods, which bestdescribes the primary business use of this home?
To produce goods/services on the premises
b. What percent of this business’s total sales wereaccounted for by exports outside the UnitedStates –
Continue with question 12a
For the year 1992?
Less than 1%
1%—9%
10%—24%
25%—49%
50%—74%
75%—99%
100%
Don’t know
Mark X ONE box only.
To do clerical work (goods/servicesproduced off the premises)
To telecommute (outside employment doingoffice work at home)
c. Does the ZIP Code, referred to in the mailing labelon page 1, indicate this business’s actual physicallocation in 1992?
Yes
No — Please supply ZIP Code
11. In which language(s) can this business conduct itstransactions?
Arabic
Chinese
English
French
German
Greek
Hindi (Urdu)
Italian
Japanese
Korean
Polish
Portuguese
Russian
Spanish
Tagalog
Vietnamese
Other — Specify
Mark X all that apply.
12a. Were any of this business’s total sales accountedfor by exports outside the United States in 1992or 1994?
No — SKIP to question 13a on page 7
Yes, only during 1992
Yes, only during 1994
Yes, during 1992 and 1994
Mark X ONE box only.
For the year 1994?Mark X ONE box only.
Less than 1%
1%—9%
10%—24%
25%—49%
50%—74%
75%—99%
100%
Don’t know
c. Check any of the following markets if they werethe destination for 10% or more of this business’stotal exports —
During 1992.
Africa
Asia
Australia/Oceania
Canada
Europe
Japan
Mexico
Middle East
South America
Caribbean/Central America
During 1994.
Africa
Asia
Australia/Oceania
Canada
Europe
Japan
Mexico
Middle East
South America
Caribbean/Central America
1992 ECONOMIC CENSUS

APPENDIX CC–20
Continue with question 13c on page 8
FORM CBO-2 (10-1-94) Page 7
12d. Were any of the following agencies helpful in starting or increasing this business’s exports?
I. International Trade Administration, U.S. Department of Commerce . . . . . . . . . . . . . . . . .
Yes No Notcontacted
II. Small Business Development Centers, Small Business Administration . . . . . . . . . . . . . .
III. Minority Business Development Agency, U.S. Department of Commerce . . . . . . . . . . . . .
IV. Export-Import Bank . . . . . . . . . . . . . . . . . . . . . . . . . . . . . . . . . . . . . . . . . . . . .
V. State export promotion agencies . . . . . . . . . . . . . . . . . . . . . . . . . . . . . . . . . . . . .
VI. Banking or commercial lending institutions . . . . . . . . . . . . . . . . . . . . . . . . . . . . . .
VII. Accounting/consulting firms . . . . . . . . . . . . . . . . . . . . . . . . . . . . . . . . . . . . . . .
VIII. Other — Specify . . . . . . . . . . . . . . . . . . . . . . . . . . . . . . . . . . . . . . . . . . . . .
e. How long had this business been involved in exporting before December 31, 1992?
Less than 1 year
1—5 years
6—10 years
More than 10 years
13a. Is this business planning on starting or increasing its exports in the near future?
Yes
No
b. Are the following issues important to this business’s ability to export?
I. Export financing . . . . . . . . . . . . . . . . . . . . . . . . . . .
II. Information on export opportunities . . . . . . . . . . . . . . .
III. Foreign trade restrictions . . . . . . . . . . . . . . . . . . . . .
IV. U.S. trade restrictions . . . . . . . . . . . . . . . . . . . . . . .
V. Competition in the foreign market . . . . . . . . . . . . . . . .
VI. Price of this business’s exports . . . . . . . . . . . . . . . . .
VII. Dollar exchange rate . . . . . . . . . . . . . . . . . . . . . . .
VIII. Local environmental restrictions . . . . . . . . . . . . . . . .
IX. Other — Specify . . . . . . . . . . . . . . . . . . . . . . . . .
Veryimportant
Somewhatimportant
Notimportant
Notapplicable
Don’tknow
Mark X ONE box for each of lines I—VIII.
Mark X ONE box for each of lines I—IX.
§!(¨
1992 ECONOMIC CENSUS
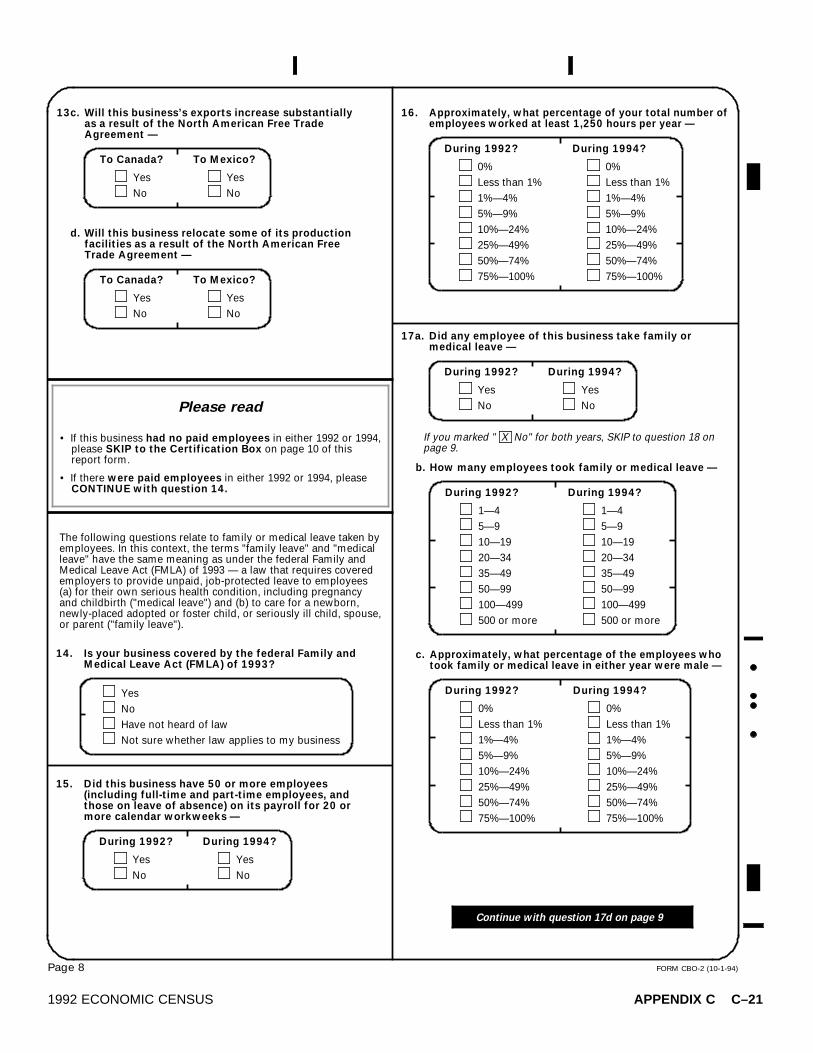
APPENDIX C C–21
FORM CBO-2 (10-1-94)Page 8
13c. Will this business’s exports increase substantiallyas a result of the North American Free TradeAgreement —
To Canada?
Yes
No
d. Will this business relocate some of its productionfacilities as a result of the North American FreeTrade Agreement —
• If this business had no paid employees in either 1992 or 1994,please SKIP to the Certification Box on page 10 of thisreport form.
• If there were paid employees in either 1992 or 1994, pleaseCONTINUE with question 14.
Please read
To Mexico?
Yes
No
Continue with question 17d on page 9
15. Did this business have 50 or more employees(including full-time and part-time employees, andthose on leave of absence) on its payroll for 20 ormore calendar workweeks —
14. Is your business covered by the federal Family andMedical Leave Act (FMLA) of 1993?
Yes
No
Have not heard of law
Not sure whether law applies to my business
The following questions relate to family or medical leave taken byemployees. In this context, the terms "family leave" and "medicalleave" have the same meaning as under the federal Family andMedical Leave Act (FMLA) of 1993 — a law that requires coveredemployers to provide unpaid, job-protected leave to employees(a) for their own serious health condition, including pregnancyand childbirth ("medical leave") and (b) to care for a newborn,newly-placed adopted or foster child, or seriously ill child, spouse,or parent ("family leave").
During 1992?
Yes
No
16. Approximately, what percentage of your total number ofemployees worked at least 1,250 hours per year —
During 1992?
0%
Less than 1%
1%—4%
5%—9%
10%—24%
25%—49%
50%—74%
75%—100%
17a. Did any employee of this business take family ormedical leave —
During 1992?
Yes
No
If you marked " X No" for both years, SKIP to question 18 onpage 9.
During 1994?
Yes
No
During 1994?
0%
Less than 1%
1%—4%
5%—9%
10%—24%
25%—49%
50%—74%
75%—100%
During 1994?
Yes
No
b. How many employees took family or medical leave —
During 1992?
1—4
5—9
10—19
20—34
35—49
50—99
100—499
500 or more
c. Approximately, what percentage of the employees whotook family or medical leave in either year were male —
During 1992?
0%
Less than 1%
1%—4%
5%—9%
10%—24%
25%—49%
50%—74%
75%—100%
During 1994?
1—4
5—9
10—19
20—34
35—49
50—99
100—499
500 or more
During 1994?
0%
Less than 1%
1%—4%
5%—9%
10%—24%
25%—49%
50%—74%
75%—100%
To Canada?
Yes
No
To Mexico?
Yes
No
1992 ECONOMIC CENSUS

APPENDIX CC–22
Continue with question 20 on page 10
FORM CBO-2 (10-1-94) Page 9
17d. What was the typical length, in weeks, of family or medical leave taken by an employee —
During 1992?
Less than 1 week
1 week
2 weeks
3—4 weeks
5—7 weeks
8—12 weeks
More than 12 weeks
During 1994?
Less than 1 week
1 week
2 weeks
3—4 weeks
5—7 weeks
8—12 weeks
More than 12 weeks
18.
I. Leave by mothers to care for newborn child . . . . . . . . . . . . . . . . . .
II. Leave by fathers to care for newborn child . . . . . . . . . . . . . . . . . .
III. Leave for newly-placed adopted or foster child . . . . . . . . . . . . . . .
IV. Leave for own serious health condition, including childbirth . . . . . . .
V. Leave for care of seriously ill child, spouse, or parent . . . . . . . . . . .
Yes No
b. Approximately, what percentage of 1994 annual payroll (as reported on line 1 of IRS Form W-3),including costs for salaries, bonuses, and this business’s share of taxable employee benefits does theabove cost associated with the federal Family and Medical Leave Act (FMLA) of 1993 represent?
0%
Less than 1%
1%—4%
19a. Did the changes in leave policies or practices required by the federal Family and Medical Leave Act(FMLA) of 1993 impose any NEW costs on this business in 1994?
I. Administrative costs . . . . . . . . . . . . . . . . . . . . . . . . . . . . . . . .
II. Continuation of benefits (health plan, etc.) during leave . . . . . . . . . .
III. Hiring/training costs . . . . . . . . . . . . . . . . . . . . . . . . . . . . . . .
IV. Other costs . . . . . . . . . . . . . . . . . . . . . . . . . . . . . . . . . . . .
NoLessthan
$5,000
$5,000 —$9,999
$10,000or
more
5%—9%
10%—14%
15% or more
Mark X ONE box for each of lines I—V.
Mark X ONE box for each of lines I—IV.
If you answered " X No" to each of lines I—V, SKIP to the Certification box on page 10; otherwise, pleasecontinue with question 19a.
Was it necessary for this business to change its following leave policies and practices to comply withthe federal Family and Medical Leave Act (FMLA) of 1993?
§!*¨
1992 ECONOMIC CENSUS

APPENDIX C C–23
FORM CBO-2 (10-1-94)Page 10
20. Have the changes in leave policies or practices required by the federal Family and Medical Leave Act(FMLA) of 1993 had any of the following effects on employees of this business?
I. Unscheduled absences not related to family and medical leave . . . . . .
II. Employee turnover . . . . . . . . . . . . . . . . . . . . . . . . . . . . . . . .
III. Employee productivity . . . . . . . . . . . . . . . . . . . . . . . . . . . . . .
IV. Employee morale . . . . . . . . . . . . . . . . . . . . . . . . . . . . . . . . .
V. Employees’ ability to handle family needs . . . . . . . . . . . . . . . . . .
ReducedNo
noticeableeffect
Increased
CERTIFICATION — Please print name of person responsible for completing this report.
Name Telephone number (Include Area Code)
Signature Date
THANK YOU FOR COMPLETING THIS QUESTIONNAIRE.
Mark X ONE box for each of lines I—V.
Remarks
Please send the questionnaire in the preaddressed return envelope. If you did notreceive a return envelope, send the questionnaire to the Bureau of the Census,1201 East 10th Street, Jeffersonville, IN 47134-0001.
1992 ECONOMIC CENSUS

APPENDIX CC–24
QUESTIONS AND ANSWERS REGARDING THE 1992CHARACTERISTICS OF BUSINESS OWNERS SURVEY
FORM CBO-2 (10-1-94)
Why is this survey being taken?
To provide valuable data for comparing selected economic, demographic, and sociological characteristics ofbusiness owners, self-employed persons, and their businesses. This survey is part of the economic censusprogram, which the Census Bureau is required to conduct every 5 years by law (Title 13 of the United StatesCode). The Census Bureau combines data from this survey with data from the 1992 Economic Census andpresents them in the Characteristics of Business Owners publication. The published data describe businessowners and self-employed persons, including their education, capital requirements, owner’s work experience,workforce characteristics, and business characteristics.
Who uses the survey data?
Persons and institutions in both the public and private sectors extensively use these survey data. Accurate dataregarding business ownership are critical to informed decision making by Federal, State, and local govern-ments regarding business assistance programs. In addition, private companies and trade associations use thedata to analyze trends; educators use them in teaching and research; and the media use them in news articles.
Why was I selected for this survey?
You are part of a small sample of businesses that we randomly selected to represent your type of business andgeographic area. The use of a sample substantially limits the reporting burden on small businesses andreduces the survey cost; however, it also greatly increases the importance of receiving a report from eachbusiness selected.
What businesses are included in this survey?
Businesses were eligible to be selected for this survey if they reported any business activity on the 1992Internal Revenue Service tax form 1065, "U.S. Partnership Return of Income," or form 1120S, "U.S. Income TaxReturn for an S Corporation". To survey its owner characteristics, each selected business is being asked todistribute respectively the Characteristics of Business Owner Survey Form CBO-3 to those partners orshareholders who received a 1992 IRS form 1065, Schedule K-1, "Partner’s Share of Income, Credits,Deductions, etc." or form 1120S, Schedule K-1, "Shareholder’s Share of Income, Credits, Deductions, etc.".
Can I be paid for completing this report?
No. The law (Title 13 of the United States Code) that directs the Census Bureau to conduct the economiccensus and requires firms to report does not authorize payment for completing census reports. In addition, nofunds have been appropriated for this purpose.
Is each survey response kept confidential?
Yes. By law, the Census Bureau cannot give individual responses to anyone (including government agencies)for any purpose. Survey responses are immune from legal action and exempt from the provisions of theFreedom of Information Act. Census Bureau publications summarize responses so that the confidentiality ofrespondents and their business activities is fully protected.
Why is the Census Bureau asking questions about 1992 and 1994?
The complete sample for this survey cannot be selected until all collected data from the 1992 Economic Censusare available. Use of these data delays the mailout of this survey, but allows us to reduce significantly thenumber of survey questions and the survey cost. To determine the viability of businesses in existence in 1992and to improve the timeliness of the Characteristics of Business Owners publication, business owners arebeing asked about their 1994 economic activities.
How can I get more information?
Call 1–800–354–7271 Monday through Friday, 8 a.m. to 5 p.m. eastern time. Our telephone staff can answersurvey questions as well as provide you with additional forms and instructions.
We estimate it will take 30 minutes or less to complete this questionnaire. If you have anycomments regarding these estimates or any other aspect of this survey, send them to theAssociate Director for Administration, Paperwork Reduction Project 0640-0022, Room 3104,FB 3, Bureau of the Census, Washington, DC 20233; and to the Office of Management andBudget, Paperwork Reduction Project 0640-0022, Washington, DC 20503.
Page 11
§¦,¨
1992 ECONOMIC CENSUS

APPENDIX C C–25
19
92
EC
ON
OM
IC C
EN
SU
S
PA
RT
NE
RS
HIP
OR
SU
BC
HA
PT
ER
S C
OR
PO
RA
TIO
N – O
WN
ER
CH
AR
AC
TE
RIS
TIC
S
OM
B N
o. 0
640-0
022: A
pp
roval E
xp
ires 0
8/3
1/9
6
CB
O-3
U.S
. DE
PA
RT
ME
NT
OF
CO
MM
ER
CE
B
UR
EA
U O
F T
HE
CE
NS
US
FO
RM
DU
E D
AT
E: 1
5 D
AY
S A
FTE
R R
EC
EIP
T O
F FOR
M
If yo
u h
av
e q
ue
stio
ns a
bo
ut c
om
ple
ting
this
rep
ort, p
lea
se
ca
ll or
write
the
Ce
nsu
s B
ure
au
. In a
ny
co
mm
un
ica
tion
, be
su
re to
refe
rto
the
11
-dig
it Ce
nsu
s F
ile N
um
be
r (CF
N) p
rinte
d in
the
lab
el to
the
righ
t.
To
ll-free
assis
tan
ce
, 8 a
.m. to
5 p
.m., e
aste
rntim
e. M
on
da
y th
rou
gh
Frid
ay
: 1–8
00
–3
54
–7
27
1
CB
O-3
In co
rresp
on
den
ce p
erta
inin
g to
this re
po
rt,p
lease
refe
r to th
is Cen
sus F
ile N
um
ber (C
FN
)
Please correct errors in name, address, and ZIP Code. EN
TER street and number if not show
n.
U.S. DEPARTME
NT
OF
CO
M
MERCE
BUREAU
OF
TH
EC
EN
SUS
No
tice — R
esp
on
se
to th
is in
qu
iry is req
uired
by law
(Title 1
3, U
.S.
Co
de). B
y th
e s
am
e la
w, y
ou
r rep
ort to
the
Ce
nsu
s B
ure
au
is co
nfid
ential.
It ma
y b
e s
ee
n o
nly
by
sw
orn
Ce
nsu
s e
mp
loy
ee
s a
nd
ma
y b
e u
se
d o
nly
for
sta
tistic
al p
urp
ose
s. T
he
law
als
o p
rov
ide
s th
at c
op
ies re
tain
ed
in y
ou
r files
are
imm
un
e fro
m le
ga
l pro
ce
ss.
INS
TRU
CTIO
NS
— P
lea
se R
ea
d
Th
e p
urp
ose
of th
is qu
estio
nn
aire
is to co
llect in
form
atio
n a
bo
ut th
e ch
ara
cteristics o
fse
lf-em
plo
ye
d p
erso
ns, b
usin
ess o
wn
ers, a
nd
the
ir bu
sine
ss activ
ities.
Th
e te
rm b
usin
ess in
the
follo
win
g q
ue
stion
s refe
rs to th
e se
lf-em
plo
ym
en
t or b
usin
ess
activ
ity fo
r wh
ich y
ou
filed
on
e o
f the
follo
win
g IR
S ta
x fo
rms in
19
92
:
a. S
che
du
le K
-1 (F
orm
10
65
) "Pa
rtne
r’s Sh
are
of In
com
e, C
red
its, De
du
ction
s, etc.", o
r
b. S
che
du
le K
-1 (F
orm
11
20
S) "S
ha
reh
old
er’s S
ha
re o
f Inco
me
, Cre
dits, D
ed
uctio
ns, e
tc."
Ex
am
ple
s of a
pe
rson
, con
side
red
a b
usin
ess o
wn
er, w
ho
sho
uld
com
ple
te th
isq
ue
stion
na
ire:
•A
sha
reh
old
er in
a co
rpo
ratio
n th
at e
lecte
d to
be
an
S co
rpo
ratio
n b
y filin
g F
orm
25
53
, "Ele
ction
by
a S
ma
ll Bu
sine
ss Co
rpo
ratio
n", th
e IR
S a
ccep
ted
the
ele
ction
, an
dth
e e
lectio
n re
ma
ine
d in
effe
ct du
ring
19
92
.
Th
e q
ue
stion
s ap
ply
to b
usin
ess a
ctivitie
s du
ring
all o
r pa
rt of ca
len
da
r ye
ars 1
99
2 a
nd
19
94
an
d m
ust b
e co
mp
lete
d e
ve
n if th
e b
usin
ess h
as sin
ce b
ee
n so
ld, re
org
an
ized
, or
disco
ntin
ue
d o
r yo
u a
re n
o lo
ng
er se
lf-em
plo
ye
d. F
or a
child
wh
o is a
sha
reh
old
er, th
ech
ild’s p
are
nt o
r gu
ard
ian
mu
st com
ple
te th
e q
ue
stion
s for th
e ch
ild.
If the
info
rma
tion
req
ue
sted
is no
t av
aila
ble
, yo
ur b
est e
stima
te is a
ccep
tab
le.
Ev
en
if this q
ue
stion
na
ire w
as m
aile
d to
yo
ur h
om
e a
dd
ress a
nd
the
bu
sine
ss is no
tlo
cate
d a
t this a
dd
ress, th
e fo
rm is a
pp
licab
le a
nd
mu
st be
com
ple
ted
.
Da
ta p
rov
ide
d b
y y
ou
will b
e u
sed
on
ly fo
r statistica
l pu
rpo
ses a
nd
will b
e ke
pt strictly
con
fide
ntia
l.•
Am
em
be
r in a
pa
rtne
rship
, limite
d p
artn
ersh
ip, sy
nd
icate
, gro
up
, po
ol, jo
int v
en
ture
or sim
ilar u
nin
corp
ora
ted
bu
sine
ss tha
t wa
s no
t a tru
st, esta
te, o
r sole
pro
prie
torsh
ipin
19
92
.
PL
EA
SE
TU
RN
TH
IS B
OO
KL
ET
OV
ER
AN
D B
EG
IN T
HE
SU
RV
EY
WIT
H Q
UE
ST
ION
1a
.
Pa
ge
1
IMP
OR
TA
NT
— H
ow
to Fill O
ut T
his Fo
rmP
lea
se
use
a #
2 b
lack le
ad
pe
ncil. M
ost q
ue
stio
ns
ask y
ou
to m
ark
X
IN T
HE
BO
X, o
r to p
rint th
ein
form
atio
n.
Se
e E
XA
MP
LE
Yes
No
X
CH
AR
AC
TE
RIS
TIC
S O
F BU
SIN
ES
S O
WN
ER
S S
UR
VE
Y
1992 ECONOMIC CENSUS
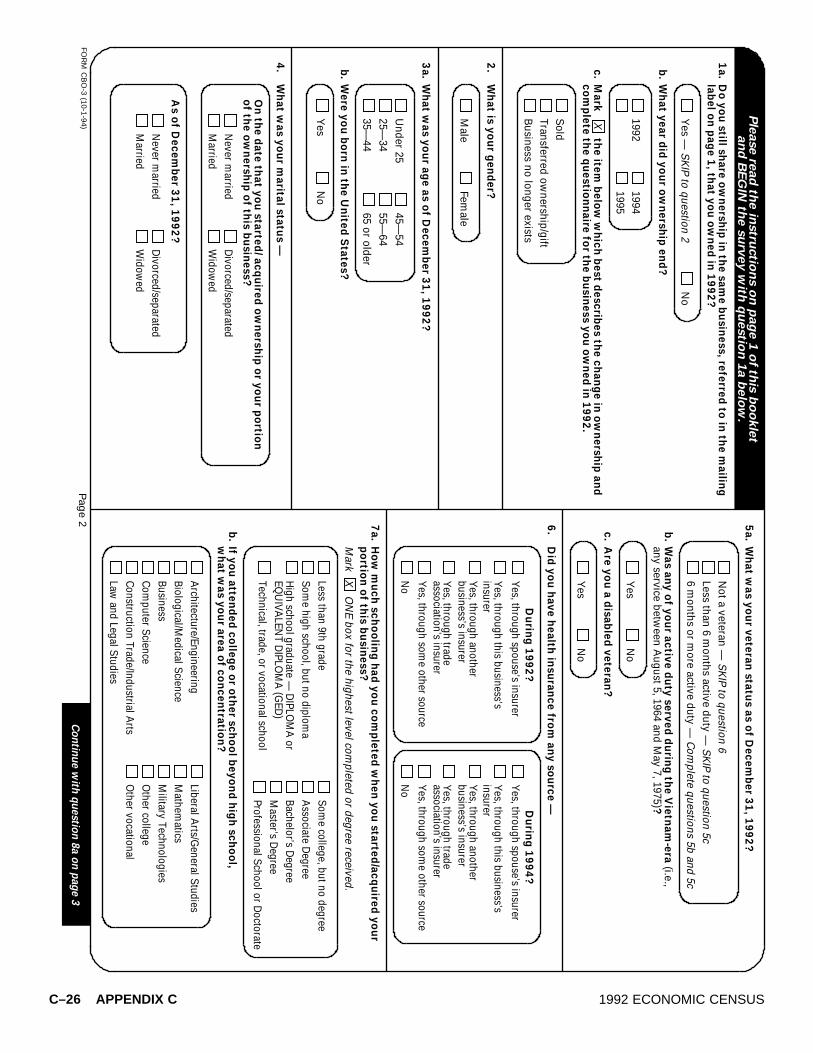
APPENDIX CC–26
FO
RM
CB
O-3
(10
-1-9
4)
Pag
e 2
1a.D
o you still share ownership in the sam
e business, referred to in the mailing
label on page 1, that you owned in 1992?
Ye
s —
SK
IP to
qu
estio
n 2
No
b.W
hat year did your ownership end?
19
92
19
94
19
95
c.
Ple
ase
rea
d th
e in
stru
ctio
ns o
n p
ag
e 1
of th
is b
oo
kle
ta
nd
BE
GIN
the
su
rve
y w
ith q
ue
stio
n 1
a b
elo
w.
So
ld
Tra
nsfe
rred
ow
ne
rsh
ip/g
ift
Bu
sin
ess n
o lo
ng
er e
xis
ts
2.W
hat is your gender?
Ma
leF
em
ale
5a.W
hat was your veteran status as of D
ecember 31, 1992?
No
t a v
ete
ran
— S
KIP
to q
ue
stion
6
Le
ss th
an
6 m
on
ths a
ctiv
e d
uty
— S
KIP
to q
ue
stion
5c
6 m
on
ths o
r mo
re a
ctiv
e d
uty
— C
om
ple
te q
ue
stion
s 5b
an
d 5
c
b.W
ere you born in the United S
tates?
Ye
sN
o
4.W
hat was your m
arital status—
On the date that you started/ acquired ow
nership or your portionof the ow
nership of this business?
Never m
arrie
d
Ma
rried
Div
orce
d/se
pa
rate
d
Wid
ow
ed
As of D
ecember 31, 1992?
Never m
arrie
d
Ma
rried
Div
orce
d/se
pa
rate
d
Wid
ow
ed
b.W
as any of your active duty served during the Vietnam
-era (i.e.,
an
y s
erv
ice
be
twe
en
Au
gu
st 5
, 19
64
an
d M
ay
7, 1
97
5)?
Ye
sN
o
c.A
re you a disabled veteran?
6.D
id you have health insurance from any source
—
During 1992?
Yes, th
rou
gh
spo
use
’s insu
rer
7a.H
ow m
uch schooling had you completed w
hen you started/acquired yourportion of this business? M
ark
X O
NE
bo
x fo
r the
hig
he
st lev
el co
mp
lete
d o
r de
gre
e re
ceiv
ed
.
Less th
an
9th
gra
de
So
me h
igh
scho
ol, b
ut n
o d
iplo
ma
3a.W
hat was your age as of D
ecember 31, 1992?
Un
de
r 25
25
—3
4
35
—4
4
45
—5
4
55
—6
4
65
or o
lde
r
Tech
nica
l, trad
e, o
r vo
catio
nal sch
oo
l
So
me co
lleg
e, b
ut n
o d
eg
ree
Asso
ciate
Deg
ree
Bach
elo
r’s Deg
ree
Maste
r’s Deg
ree
Pro
fessio
nal S
cho
ol o
r Do
ctora
te
Hig
h sch
oo
l gra
du
ate
—D
IPLO
MA
or
EQ
UIV
ALE
NT
DIP
LO
MA
(GE
D)
Co
ntin
ue
with
qu
estio
n 8
a o
n p
ag
e 3
Yes, th
rou
gh
this b
usin
ess’s
insu
rer
Yes, th
rou
gh
an
oth
er
bu
siness’s in
sure
r
Yes, th
rou
gh
som
e o
ther so
urce
No
During 1994?
Yes, th
rou
gh
spo
use
’s insu
rer
Yes, th
rou
gh
this b
usin
ess’s
insu
rer
Yes, th
rou
gh
an
oth
er
bu
siness’s in
sure
r
Yes, th
rou
gh
som
e o
ther so
urce
No
b.If you attended college or other school beyond high school,w
hat was your area of concentration?
Arch
itectu
re/E
ng
ineerin
g
Bio
log
ical/M
ed
ical S
cien
ce
Bu
sine
ss
Co
mp
ute
r Scie
nce
Co
nstru
ction
Tra
de/In
du
strial A
rts
Law
an
d L
eg
al S
tud
ies
Lib
era
l Arts/G
en
era
l Stu
die
s
Math
em
atics
Milita
ry T
ech
no
log
ies
Oth
er co
lleg
e
Oth
er v
oca
tion
al
Yes, th
rou
gh
trad
easso
ciatio
n’s in
sure
rY
es, th
rou
gh
trad
easso
ciatio
n’s in
sure
r
Ye
sN
o
Mark
X the item
below w
hich best describes the change in ownership and
complete the questionnaire for the business you ow
ned in 1992.
1992 ECONOMIC CENSUS

APPENDIX C C–27
Pag
e 3
8a.P
rior to beginning/acquiring this business, had any of your close relativesever ow
ned a business OR
been self-employed? (C
lose re
lativ
es re
fer to
sp
ou
ses, p
are
nts
/gu
ard
ian
s, b
roth
ers
, sis
ters
, or im
med
iate
fam
ily.)
Ye
sN
o —
SK
IP to
qu
estio
n 9
a
10a.W
hat was Y
OU
R total personal incom
e – (Do
NO
T in
clu
de in
co
me fro
msp
ou
se o
r oth
er fa
mily
mem
bers
.)
For the year of 1992?
Less th
an
$5,0
00
$5
,00
0—
$9
,99
9
$1
0,0
00
—$
14
,99
9
9a.H
ow m
any years of work experience did you have prior to starting/acquiring
your portion of this business?
No
ne (d
id n
ot w
ork
) — S
KIP
to q
uestio
n 1
0a
Less th
an
2 y
ears
2—
5 y
ears
Mark
X O
NE
bo
x o
nly
.
b.If "Y
es", did you work for any of these relatives?
Ye
sN
o
6—
9 y
ears
10—
19 y
ears
20 y
ears
or m
ore
b.H
ow m
any of those years did you work in a m
anagerial capacity?
No
ne
Less th
an
2 y
ears
2—
5 y
ears
10—
19 y
ears
20 y
ears
or m
ore
c.H
ow m
any of those years were you an ow
ner of another business?
d.D
id you previously work for a business w
hose goods/service(s) were sim
ilarto those provided by this business?
Ye
sN
o
$3
5,0
00
—$
49
,99
9
What percent of your total personal incom
e was produced as a
result of this business –
For the year of 1992?
No
ne
Less th
an
10%
10
%—
24
%
25
%—
49
%
Mark
X O
NE
bo
x o
nly
.
50
%—
74
%
75
%—
99
%
10
0%
Co
ntin
ue w
ith q
uestio
n 1
0b
Co
ntin
ue w
ith q
uestio
n 1
2b
on
pag
e 4
11a.W
hen did you acquire the ownership or your portion of the
ownership in this business?
Befo
re 1
970
19
70
—1
97
9
b.H
ow did you acquire ow
nership in this business?
Fo
un
ded
Pu
rchase
d
No
ne —
SK
IP to
qu
estio
n 1
3a o
n p
ag
e 4
Rece
ived
tran
sfer
of o
wn
ersh
ip/g
ift
c.W
hich of the following m
ost closely matches your reason for becom
ing anow
ner in this business?
To
have a
prim
ary
sou
rce o
f inco
me
To
have a
seco
nd
ary
sou
rce o
f inco
me
12a.W
hat was the total am
ount of capital required to start/acquire your portionof the ow
nership in this business? (Cap
ital in
clu
des a
ssets
an
d m
on
ey th
at w
ere
yo
ur o
wn
, that w
ere
giv
en
to y
ou
, an
d th
at y
ou
bo
rrow
ed
.)
$5
0,0
00
—$
99
,99
9
$1
00
,00
0—
$2
49
,99
9
$2
50
,00
0—
$9
99
,99
9
$1,0
00,0
00 o
r mo
re
To
brin
g a
new
idea to
the
ma
rketp
lace
To
have w
ork w
hich
con
form
sto
my h
ealth
limita
tion
s
To
have w
ork n
ot a
vaila
ble
else
wh
ere
in th
e jo
b m
arke
t
To
have m
ore
freed
om
tom
eet fa
mily
resp
on
sibilitie
s
For the year of 1994?
No
ne
Less th
an
10%
10
%—
24
%
25
%—
49
%
50
%—
74
%
75
%—
99
%
10
0%
10b.
6—
9 y
ears
No
t su
re
No
ne
Less th
an
2 y
ears
2—
5 y
ears
10—
19 y
ears
20 y
ears
or m
ore
6—
9 y
ears
No
t su
re
19
86
—1
98
8
19
91
19
92
$15,0
00 —
$24,9
99
$5
0,0
00
—$
74
,99
9
$7
5,0
00
—$
99
,99
9
$1
00
,00
0—
$1
49
,99
9
$150,0
00 o
r mo
re
$2
5,0
00
—$
34
,99
9
For the year of 1994?
Less th
an
$5,0
00
$5
,00
0—
$9
,99
9
$1
0,0
00
—$
14
,99
9
Mark
X O
NE
bo
x o
nly
.
$3
5,0
00
—$
49
,99
9
$15,0
00 —
$24,9
99
$5
0,0
00
—$
74
,99
9
$7
5,0
00
—$
99
,99
9
$1
00
,00
0—
$1
49
,99
9
$150,0
00 o
r mo
re
$2
5,0
00
—$
34
,99
9
19
80
—1
98
51
98
9
19
90
Inh
erite
dO
the
r — S
pe
cify
To
ad
van
ce in
my p
rofe
ssion
To
be m
y o
wn
bo
ss
Oth
er —
Sp
ecify
Less th
an
$5,0
00
$5
,00
0—
$9
,99
9
$1
0,0
00
—$
24
,99
9
$2
5,0
00
—$
49
,99
9
1992 ECONOMIC CENSUS

APPENDIX CC–28
FO
RM
CB
O-3
(10
-1-9
4)
Pag
e 4
d.
No
ne
—100%
bo
rrow
ed
cap
ital
13a.H
ow m
any weeks did you spend m
anaging or working in this business
—
During 1992?
No
ne
Co
ntin
ue w
ith q
uestio
n 1
3b
No
ne
— S
KIP
to q
uestio
n 1
2d
Less th
an
10%
12b.
50
%—
74
%
75
%—
99
%
Pers
on
al lo
an
usin
g y
ou
r ho
me
mo
rtgag
e/e
qu
ity lin
e o
f cre
dit
c.W
hat was the source(s) from
which you received the m
oney you borrowed?
Mark
X a
ll that a
pp
ly.
What w
as the source(s) of your non-borrowed capital? M
ark
X a
ll that a
pp
ly.
Use
of p
erso
nal/fa
mily
ph
ysica
l asse
ts(b
uild
ing
, mo
tor v
eh
icle, e
qu
ipm
en
t, etc.)
Pro
ceed
s from
the sa
le o
f perso
nal a
ssets
Perso
nal/fa
mily
savin
gs
Oth
er —
Sp
ecify
e.W
hat measure(s) did you take if this business w
as producing inadequatecash flow
or low sales after your initial investm
ent of start-up/acquisitioncapital?D
id n
ot o
ccur
— S
KIP
to q
uestio
n 1
3a
Relie
d u
po
n o
wn
inco
me fro
mo
ther b
usin
ess/jo
b
Investe
d a
dd
ition
al ca
pita
l
Rece
ived
help
from
fam
ily
Oth
er —
Sp
ecify
24
—35
we
eks
36
—47
we
eks
48 w
eeks o
r mo
re1
2—
23
we
eks
Less th
an
12 w
eeks
During 1994?
No
ne
24
—35
we
eks
36
—47
we
eks
48 w
eeks o
r mo
re1
2—
23
we
eks
Less th
an
12 w
eeks
b.W
hat was the average num
ber of hours per week you spent m
anaging orw
orking in this business—
During 1992?
No
ne
40 h
ou
rs
41
—49
ho
urs
50
—59
ho
urs
60 h
ou
rs or m
ore
10
—19
ho
urs
20
—29
ho
urs
30
—39
ho
urs
Less th
an
10 h
ou
rs
During 1994?
No
ne
40 h
ou
rs
41
—49
ho
urs
50
—59
ho
urs
60 h
ou
rs or m
ore
10
—19
ho
urs
20
—29
ho
urs
30
—39
ho
urs
Less th
an
10 h
ou
rs
14.D
id you receive any grants, managem
ent training, or technicalassistance in the start-up or operation of this business from
any of thefollow
ing sources?M
ark
X a
ll that a
pp
ly.
No
assista
nce
rece
ived
Sta
te a
nd
/or lo
cal g
overn
men
t
Co
lleg
e o
r un
iversity
Fed
era
l go
vern
men
t
Oth
er b
usin
ess/fra
nch
isor
Oth
er —
Sp
ecify
CER
TIFICA
TION
— P
lease p
rint n
am
e o
f pers
on
resp
on
sib
le fo
r co
mp
letin
g th
is re
po
rt.
Sig
na
ture
Na
me
Date
Re
ma
rksPL
EA
SE
DE
TA
CH
LE
TT
ER
AL
ON
G P
ER
FO
RA
TIO
N B
EF
OR
E M
AIL
ING
.
10
%—
24
%
25
%—
49
%1
00
%
Pers
on
al c
red
it card
Pers
on
al lo
an
from
sp
ou
se
Pers
on
al lo
an
from
fam
ily
Oth
er p
ers
on
al lo
an
Mark
X a
ll that a
pp
ly.
What percent of the total capital, by m
eans of personal loans, did youborrow
to start/acquire your portion of the ownership of this business?
Tele
ph
on
e n
um
ber (In
clud
e A
rea C
od
e)
Sen
d th
e q
uestio
nn
aire
in th
e p
read
dre
ssed
retu
rn e
nvelo
pe. If y
ou
did
no
t receiv
e a
retu
rnen
velo
pe, s
en
d th
e q
uestio
nn
aire
to th
e B
ure
au
of th
e C
en
su
s, 1
201 E
ast 1
0th
Stre
et,
Jeffe
rso
nville
, IN 4
7134-0
001.
1992 ECONOMIC CENSUS

APPENDIX C C–29
QUESTIONS AND ANSWERS REGARDING THE 1992CHARACTERISTICS OF BUSINESS OWNERS SURVEY
Why is this survey being taken?
To provide valuable data for comparing selected economic, demographic, and sociological characteristics ofbusiness owners, self-employed persons, and their businesses. This survey is part of the economic censusprogram, which the Census Bureau is required to conduct every 5 years by law (Title 13 of the United StatesCode). The Census Bureau combines data from this survey with data from the 1992 Economic Census andpresents them in the Characteristics of Business Owners publication. The published data describe businessowners and self-employed persons, including their education, capital requirements, owner’s work experience,workforce characteristics, and business characteristics.
Who uses the survey data?
Persons and institutions in both the public and private sectors extensively use these survey data. Accurate dataregarding business ownership are critical to informed decision making by Federal, State, and local governmentsregarding business assistance programs. In addition, private companies and trade associations use the data toanalyze trends; educators use them in teaching and research; and the media use them in news articles.
Why was I selected for this survey?
You are part of a small sample of business owners that we randomly selected to represent your type of businessand geographic area. The use of a sample substantially limits the reporting burden on small businesses andreduces the survey cost; however, it also greatly increases the importance of receiving a report from eachbusiness selected.
What businesses are included in this survey?
Businesses were eligible to be selected for this survey if they reported any business activity on the 1992 InternalRevenue Service tax form 1065, "U.S. Partnership Return of Income," or form 1120S, "U.S. Income Tax Return foran S Corporation". To survey its owner characteristics, each selected business is being asked to distributerespectively the Characteristics of Business Owner Survey Form CBO-3 to those partners or shareholders whoreceived a 1992 IRS form 1065, Schedule K-1, "Partner’s Share of Income, Credits, Deductions, etc." or form1120S, Schedule K-1, "Shareholder’s Share of Income, Credits, Deductions, etc.".
Can I be paid for completing this report?
No. The law (Title 13 of the United States Code) that directs the Census Bureau to conduct the economic censusand requires firms to report does not authorize payment for completing census reports. In addition, no fundshave been appropriated for this purpose.
Is each survey response kept confidential?
Yes. By law, the Census Bureau cannot give individual responses to anyone (including government agencies) forany purpose. Survey responses are immune from legal action and exempt from the provisions of the Freedom ofInformation Act. Census Bureau publications summarize responses so that the confidentiality of respondents andtheir business activities is fully protected.
Why is the Census Bureau asking questions about 1992 and 1994?
The complete sample for this survey cannot be selected until all collected data from the 1992 Economic Censusare available. Use of these data delays the mailout of this survey, but allows us to reduce significantly thenumber of survey questions and the survey cost. To determine the viability of businesses in existence in 1992and to improve the timeliness of the Characteristics of Business Owners publication, business owners are beingasked about their 1994 economic activities.
How can I get more information?
Call 1–800–354–7271 Monday through Friday, 8 a.m. to 5 p.m. eastern time. Our telephone staff can answersurvey questions as well as provide you with additional forms and instructions.
We estimate it will take 15 minutes or less to complete this questionnaire. If you have anycomments regarding these estimates or any other aspect of this survey, send them to theAssociate Director for Administration, Paperwork Reduction Project 0640-0022, Room3104, FB 3, Bureau of the Census, Washington, DC 20233; and to the Office ofManagement and Budget, Paperwork Reduction Project 0640-0022, Washington, DC 20503.
CBO-3(L) (10-94)
1992 ECONOMIC CENSUS

1992 CHARACTERISTICS OF BUSINESSOWNERS SURVEY
The publication for the 1992 Characteristics of BusinessOwners Survey, containing data on women-owned, minority-owned, and nonminority male-owned firms in the UnitedStates, is described below. Publication order forms for thereport may be obtained from any Department of Commercedistrict office or from Administrative and Customer ServicesDivision, Bureau of the Census, Washington, DC 20233-1900.
Report
CBO92-1 Characteristics of Business Owners
Data are presented by type of firm (women, minority,and nonminority male), by industry classifications, size offirm (employment and receipts), and legal form of organi-zation (individual proprietorships, partnerships, and sub-chapter S corporations). Tables within the report show thenumber of firms and such characteristics of the firms andowners as age, marital status, education, financing, type ofemployees, and method of business acquisition, as well asother data.
Electronic Media
All data included in the printed reports are available onCD-ROM. The CD-ROM provides the same information
found in the final reports as well as additional informationnot published in the final reports. Electronic media productsare available for users who wish to summarize, rearrange,or process large amounts of data. These products, withcorresponding technical documentation, are sold by Admin-istrative and Customer Services Division, Bureau of theCensus, Washington, DC 20233-1900.
The Internet (www.census.gov) highlights selected infor-mation from Bureau of the Census publications. Thisenables immediate access to recently released facts anddata. Various subjects and topics are included on thiselectronic resource.
For system technical assistance, or questions regardingthe sale or availability of electronic products, contactAdministrative and Customer Services Division, 301-457-4100.
OTHER ECONOMIC CENSUS REPORTS
Data on retail trade, wholesale trade, financial, insur-ance, real estate, construction industries, manufactures,mineral industries, transportation, communications, utili-ties, enterprise statistics, minority-owned business enter-prises, and women-owned businesses also are availablefrom the 1992 Economic Census. A separate series ofreports covers the census of outlying areas—Puerto Rico,Virgin Islands of the United States, Guam, and the North-ern Marianas. Separate announcements describing thesereports are available free of charge from Administrativeand Customer Services Division, Bureau of the Census,Washington, DC 20233-1900.
If you have any questions concerning the sale or availability of publications or electronic products, callAdministrative and Customer Services Division, 301-457-4100.
Publication Program