population and housing unit counts - census.gov or latino origin, household relationship, race, sex,...
TRANSCRIPT
U.S. Department of CommerceEconomics and Statistics Administration
U.S. CENSUS BUREAU
census.gov
Delaware: 2010Population and Housing Unit Counts
2010 Census of Population and Housing
Issued June 2012CPH-2-9

U.S. Department of Commerce Rebecca M. Blank,
Acting Secretary
Rebecca M. Blank, Deputy Secretary
Economics and Statistics Administration Vacant,
Under Secretary for Economic Affairs
U.S. CENSUS BUREAU Robert M. Groves,
Director
Delaware: 2010Population and Housing Unit Counts
Issued June 2012
CPH-2-9
ECONOMICS
AND STATISTICS
ADMINISTRATION
SUGGESTED CITATION
U.S. Census Bureau, 2010 Census of
Population and Housing, Population and
Housing Unit Counts,CPH-2-9, Delaware
U.S. Government Printing Office, Washington, DC,
2012
Economics and Statistics Administration
Vacant, Under Secretary for Economic Affairs
U.S. CENSUS BUREAU
Robert M. Groves, Director
Thomas L. Mesenbourg, Deputy Director and Chief Operating Officer
Nancy A. Potok, Associate Director for Demographic Programs
Enrique J. Lamas, Chief, Population Division
Contents iii
List of Statistical Tables . . . . . . . . . . . . . . . . . . . . . . . . . . . . . . . . . . . . . v How to Use This Census Report . . . . . . . . . . . . . . . . . . . . . . . . . . . . . . I-1 Table Finding Guide . . . . . . . . . . . . . . . . . . . . . . . . . . . . . . . . . . . . . . . II-1 User Notes . . . . . . . . . . . . . . . . . . . . . . . . . . . . . . . . . . . . . . . . . . . . . . III-1 Crosswalk of Urban Areas and Places: 2010 . . . . . . . . . . . . . . . . . . . . . IV-1 Statistical Tables . . . . . . . . . . . . . . . . . . . . . . . . . . . . . . . . . . . . . . . . . . 1
Appendixes
A Geographic Terms and Concepts . . . . . . . . . . . . . . . . . . . . . . . . . *B Definitions of Subject Characteristics . . . . . . . . . . . . . . . . . . . . . . *C Data Collection and Processing Procedures . . . . . . . . . . . . . . . . . . *D Questionnaire . . . . . . . . . . . . . . . . . . . . . . . . . . . . . . . . . . . . . . . . *E Maps . . . . . . . . . . . . . . . . . . . . . . . . . . . . . . . . . . . . . . . . . . . . . . E-1F Operational Overview and Accuracy of the Data . . . . . . . . . . . . . . *G Residence Rule and Residence Situations for the 2010 Census of the United States . . . . . . . . . . . . . . . . . . . . . . . . . . . . . . . . . . *H Acknowledgments . . . . . . . . . . . . . . . . . . . . . . . . . . . . . . . . . . . . *
*Appendix may be found in the separate volume, CPH-2-A, Population and Housing Unit Counts, Selected Appendixes, in print and on the Internet at <www .census .gov /prod/cen2010/cph-2-a .pdf> .
CONTENTS


List of Statistical Tables v
LIST OF STATISTICAL
TABLES
Table no. Title Page
1. Population: Earliest Census to 2010; and Housing Units: 1950 to 2010 . . . . . . . . . . . . . . . . . . . . . . . . . . . . . . . . . . . . . 1 State, Urban and Rural
2. Population, Housing Units, and Land Area by Urban and Rural and Size of Urban Area: 2010 . . . . . . . . . . . . . . . . . . . 2 State, Urban and Rural, Size of Urban Area [Population]
3. Population by Urban and Rural and Size of Place: 2010 . . . 4 State, Size of Place [Population]
4. Population and Housing Units: 1970 to 2010 . . . . . . . . . . . . 6 State, County/County Equivalent
5. Population, Housing Units, Land Area, and Density: 2010; and Percent Change: 1980 to 2010 . . . . . . . . . . . . . . . . . . . . 7 State, County/County Equivalent
6. Rank of Counties by Percent Change in Population: 2000 to 2010 . . . . . . . . . . . . . . . . . . . . . . . . . . . . . . . . . . . . . . 8 County/County Equivalent
7. Population by Urban and Rural: 2010 . . . . . . . . . . . . . . . . . . 9 State, County/County Equivalent
8. Population and Housing Units: 1990 to 2010; and Area Measurements and Density: 2010 . . . . . . . . . . . . . . . . . . . . 10 State, County/County Equivalent, County Subdivision, Place
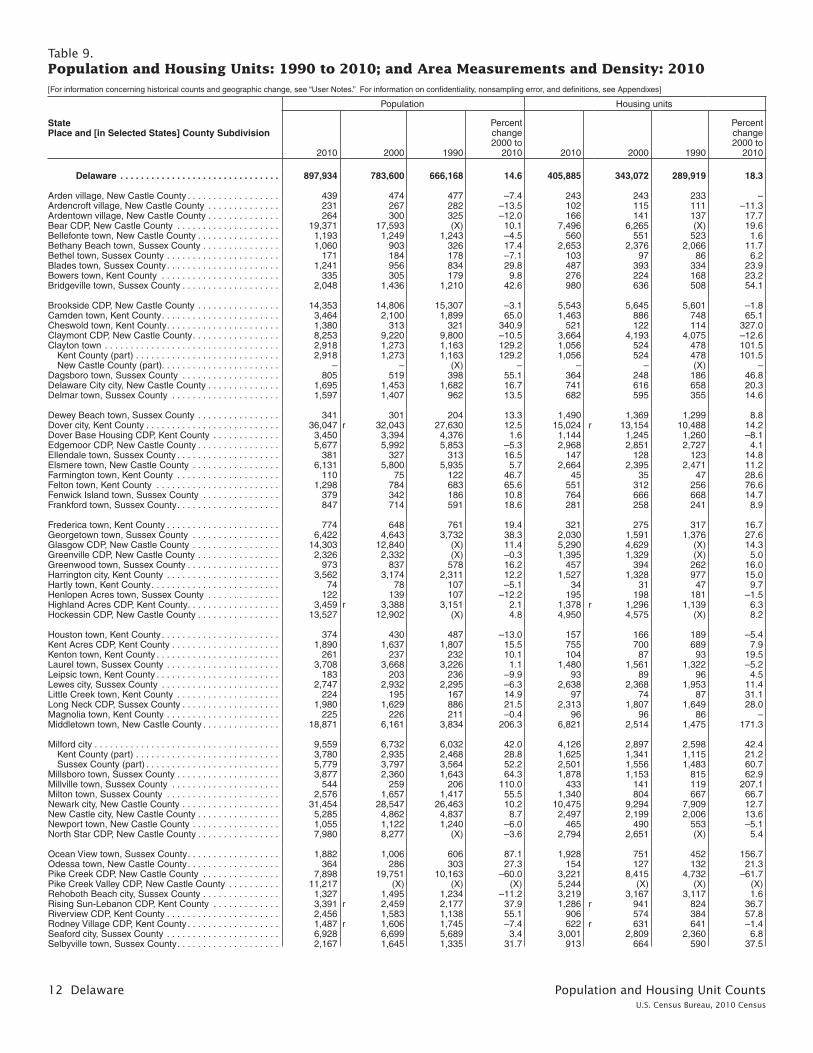
9. Population and Housing Units: 1990 to 2010; and Area Measurements and Density: 2010 . . . . . . . . . . . . . . . . . . . . 12 State, Place and [in Selected States] County Subdivision
10. Rank by 2010 Population and Housing Units: 2000 and 2010 . . . . . . . . . . . . . . . . . . . . . . . . . . . . . . . . . . . . 16 Place [2,500 or More Population]
11. Rank of Places by Percent Change in Population: 2000 to 2010 . . . . . . . . . . . . . . . . . . . . . . . . . . . . . . . . . . . . . . 17 Place [2,500 or More Population]
12. Population and Housing Units for Urban Areas: 2010 . . . . . 18 State, Urbanized Area, Urban Cluster

How to Use This Census Report I-1U.S. Census Bureau, 2010 Census
How to Use This Census Report
CONTENTS
Page
Introduction . . . . . . . . . . . . . . . . . . . . . . . . . . . . . . . . . . . . . . . . . . . . . . . . . . . . . . . . . . . . . . . . . . I-1
How to Find Geographic Areas and Subject Matter Data . . . . . . . . . . . . . . . . . . . . . . . . . . . . . . . . . I-2
How to Use the Statistical Tables . . . . . . . . . . . . . . . . . . . . . . . . . . . . . . . . . . . . . . . . . . . . . . . . . . . I-2
Graphics . . . . . . . . . . . . . . . . . . . . . . . . . . . . . . . . . . . . . . . . . . . . . . . . . . . . . . . . . . . . . . . . . . . . . I-5
User Notes . . . . . . . . . . . . . . . . . . . . . . . . . . . . . . . . . . . . . . . . . . . . . . . . . . . . . . . . . . . . . . . . . . . I-5
Appendixes . . . . . . . . . . . . . . . . . . . . . . . . . . . . . . . . . . . . . . . . . . . . . . . . . . . . . . . . . . . . . . . . . . I-5
INTRODUCTION
Data from the 2010 Census for the United States and Puerto Rico are presented in two printed report series and a single report for American Indians and Alaska Natives by tribe:
1. CPH-1, Summary Population and Housing Characteristics
2. CPH-2, Population and Housing Unit Counts
3. CPH-3, Characteristics of American Indians and Alaska Natives by Tribe
The data from the 2010 Census were derived from a limited number of basic questions asked of the entire population and about every housing unit. Appendix D (see Selected Appendixes report at <www.census .gov/prod/cen2010/cph-2-a.pdf>) presents a facsimile of the questionnaire pages used to collect the data included in this report. Note that the “long form” data included in previous censuses are not included in the 2010 Census.
The CPH-1, Summary Population and Housing Characteristics, report series provides data based on age, Hispanic or Latino origin, household relationship, race, sex, tenure (owner- or renter-occupied), and vacancy characteristics. Land area measurements and population density also are provided. This series is similar to the Census 2000 PHC-1 series.
The CPH-2, Population and Housing Unit Counts, report series provides 2010 Census and historical com-parisons of the population and housing unit counts. It also provides area measurements and density. The user notes section documents geographic changes over the past decade. This series is similar to the Census 2000 PHC-3 series.
In each series, there is one report for each state, the District of Columbia, and Puerto Rico, plus a United States summary report. Many tables in the United States summary reports include data for Puerto Rico.
The CPH-3, Characteristics of American Indians and Alaska Natives by Tribe, report provides population and housing information for selected American Indian and Alaska Native tribes. This report is similar to the Census 2000 PHC-5 report. This is a single report covering the entire United States.
I-2 How to Use This Census ReportU.S. Census Bureau, 2010 Census
HOW TO FIND GEOGRAPHIC AREAS AND SUBJECT MATTER DATA
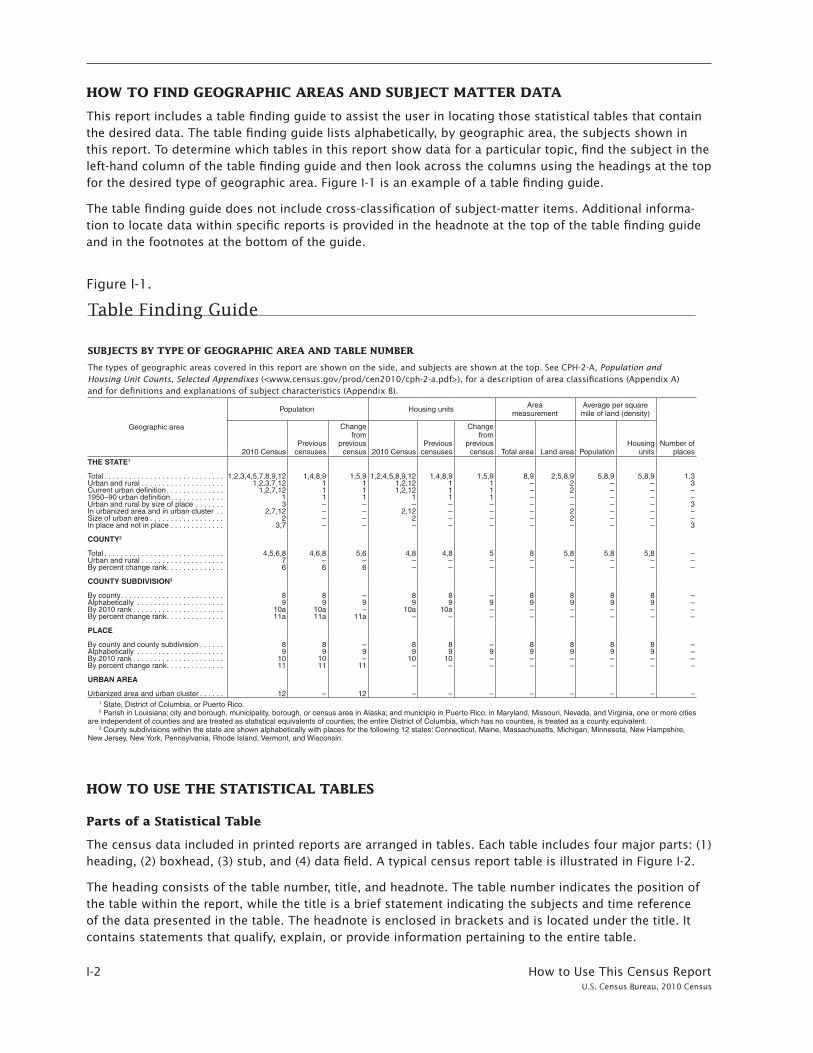
This report includes a table finding guide to assist the user in locating those statistical tables that contain the desired data. The table finding guide lists alphabetically, by geographic area, the subjects shown in this report. To determine which tables in this report show data for a particular topic, find the subject in the left-hand column of the table finding guide and then look across the columns using the headings at the top for the desired type of geographic area. Figure I-1 is an example of a table finding guide.
The table finding guide does not include cross-classification of subject-matter items. Additional informa-tion to locate data within specific reports is provided in the headnote at the top of the table finding guide and in the footnotes at the bottom of the guide.
Figure I-1.
Table Fin
din
g G
uid
e II-1
U.S. C
ensu
s Bureau
, 20
10
Cen
sus
Geographic area
Population Housing units Area measurement
Average per square mile of land (density)
Number of places 2010 Census
Previous censuses
Change from
previous census 2010 Census
Previous censuses
Change from
previous census Total area Land area Population
Housing units
THE STATE1
Total . . . . . . . . . . . . . . . . . . . . . . . . . . . . . 1,2,3,4,5,7,8,9,12 1,4,8,9 1,5,9 1,2,4,5,8,9,12 1,4,8,9 1,5,9 8,9 2,5,8,9 5,8,9 5,8,9 1,3Urban and rural . . . . . . . . . . . . . . . . . . . . 1,2,3,7,12 1 1 1,2,12 1 1 – 2 – – 3Current urban definition . . . . . . . . . . . . . . 1,2,7,12 1 1 1,2,12 1 1 – 2 – – –1950–90 urban definition . . . . . . . . . . . . . 1 1 1 1 1 1 – – – – –Urban and rural by size of place . . . . . . . 3 – – – – – – – – – 3In urbanized area and in urban cluster . . 2,7,12 – – 2,12 – – – 2 – – –Size of urban area . . . . . . . . . . . . . . . . . . 2 – – 2 – – – 2 – – –In place and not in place . . . . . . . . . . . . . 3,7 – – – – – – – – – 3
COUNTY2
Total . . . . . . . . . . . . . . . . . . . . . . . . . . . . . 4,5,6,8 4,6,8 5,6 4,8 4,8 5 8 5,8 5,8 5,8 –Urban and rural . . . . . . . . . . . . . . . . . . . . 7 – – – – – – – – – –By percent change rank . . . . . . . . . . . . . . 6 6 6 – – – – – – – –
COUNTY SUBDIVISION3
By county . . . . . . . . . . . . . . . . . . . . . . . . . 8 8 – 8 8 – 8 8 8 8 –Alphabetically . . . . . . . . . . . . . . . . . . . . . 9 9 9 9 9 9 9 9 9 9 –By 2010 rank . . . . . . . . . . . . . . . . . . . . . . 10a 10a – 10a 10a – – – – – –By percent change rank . . . . . . . . . . . . . . 11a 11a 11a – – – – – – – –
PLACE
By county and county subdivision . . . . . . 8 8 – 8 8 – 8 8 8 8 –Alphabetically . . . . . . . . . . . . . . . . . . . . . 9 9 9 9 9 9 9 9 9 9 –By 2010 rank . . . . . . . . . . . . . . . . . . . . . . 10 10 – 10 10 – – – – – –By percent change rank . . . . . . . . . . . . . . 11 11 11 – – – – – – – –
URBAN AREA
Urbanized area and urban cluster . . . . . . 12 – 12 – – – – – – – –1 State, District of Columbia, or Puerto Rico .2 Parish in Louisiana; city and borough, municipality, borough, or census area in Alaska; and municipio in Puerto Rico; in Maryland, Missouri, Nevada, and Virginia, one or more cities
are independent of counties and are treated as statistical equivalents of counties; the entire District of Columbia, which has no counties, is treated as a county equivalent .3 County subdivisions within the state are shown alphabetically with places for the following 12 states: Connecticut, Maine, Massachusetts, Michigan, Minnesota, New Hampshire,
New Jersey, New York, Pennsylvania, Rhode Island, Vermont, and Wisconsin .
Table Finding Guide
SUBJECTS BY TYPE OF GEOGRAPHIC AREA AND TABLE NUMBER
The types of geographic areas covered in this report are shown on the side, and subjects are shown at the top. See CPH-2-A, Population and Housing Unit Counts, Selected Appendixes (<www.census.gov/prod/cen2010/cph-2-a.pdf>), for a description of area classifications (Appendix A) and for definitions and explanations of subject characteristics (Appendix B).
HOW TO USE THE STATISTICAL TABLES
Parts of a Statistical Table
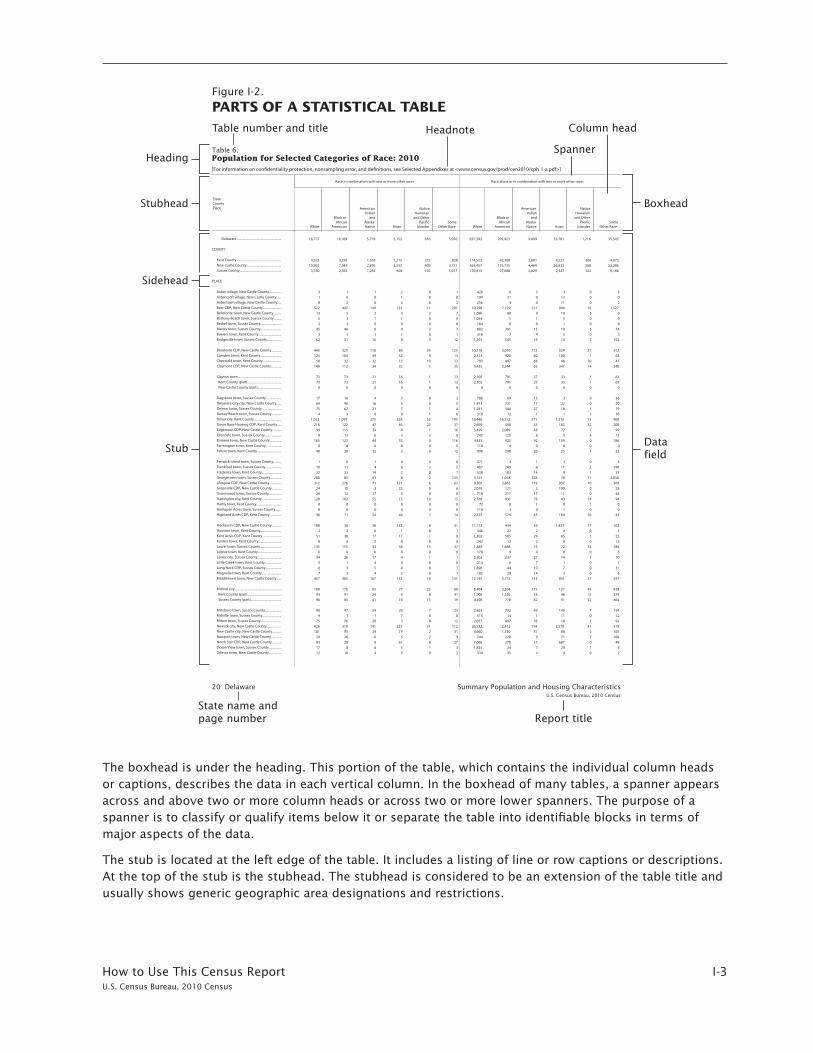
The census data included in printed reports are arranged in tables. Each table includes four major parts: (1) heading, (2) boxhead, (3) stub, and (4) data field. A typical census report table is illustrated in Figure I-2.
The heading consists of the table number, title, and headnote. The table number indicates the position of the table within the report, while the title is a brief statement indicating the subjects and time reference of the data presented in the table. The headnote is enclosed in brackets and is located under the title. It contains statements that qualify, explain, or provide information pertaining to the entire table.
How to Use This Census Report I-3U.S. Census Bureau, 2010 Census
The boxhead is under the heading. This portion of the table, which contains the individual column heads or captions, describes the data in each vertical column. In the boxhead of many tables, a spanner appears across and above two or more column heads or across two or more lower spanners. The purpose of a spanner is to classify or qualify items below it or separate the table into identifiable blocks in terms of major aspects of the data.
The stub is located at the left edge of the table. It includes a listing of line or row captions or descriptions. At the top of the stub is the stubhead. The stubhead is considered to be an extension of the table title and usually shows generic geographic area designations and restrictions.
Race in combination with one or more other races Race alone or in combination with one or more other races
Asian
NativeHawaiian
and OtherPaci�c
Islander
AmericanIndian
andAlaskaNative
SomeOther Race
Black orAfrican
AmericanWhite White
Black orAfrican
American
AmericanIndian
andAlaskaNative Asian
NativeHawaiian
and OtherPaci�c
IslanderSome
Other Race
Table 6.
[For information on con�dentiality protection, nonsampling error, and de�nitions, see Selected Appendixes at <www.census.gov/prod/cen2010/cph-1-a.pdf>]
Population for Selected Categories of Race: 2010
StateCountyPlace
18,775 14,109 5,718 5,152 816 5,026 637,392 205,923 33,7019,899 1,216 35,545 Delaware.........................................................
COUNTY
4,523 3,595 1,558 1,215 215 838 114,522 42,508 4,5212,601 306 4,073 Kent County.........................................................10,502 7,949 2,895 3,333 409 3,171 363,457 135,735 26,6334,469 568 22,286 New Castle County............................................
3,750 2,565 1,265 604 192 1,017 159,413 27,680 2,5472,829 342 9,186 Sussex County.....................................................
PLACE
3 1 1 2 0 1 428 6 33 0 3 Arden village, New Castle County.................1 0 0 1 0 0 199 21 120 0 0 Ardencroft village, New Castle County..........8 2 0 5 0 2 256 4 110 0 2 Ardentown village, New Castle County.........
522 447 149 132 11 201 10,298 7,129 944211 16 1,527 Bear CDP, New Castle County........................13 5 2 5 2 7 1,096 80 194 3 9 Bellefonte town, New Castle County.............
5 3 1 1 0 0 1,054 5 51 0 0 Bethany Beach town, Sussex County...........2 2 0 0 0 0 164 8 10 0 0 Bethel town, Sussex County...........................
45 46 6 0 3 7 802 391 1015 3 74 Blades town, Sussex County............................3 1 1 1 0 1 318 7 54 0 5 Bowers town, Kent County.............................
62 51 16 8 5 12 1,391 545 1419 7 152 Bridgeville town, Sussex County...................
445 325 118 80 35 125 10,218 3,070 529172 37 912 Brookside CDP, New Castle County.............124 104 49 52 0 13 2,413 920 18060 1 63 Camden town, Kent County............................
50 32 32 12 10 13 793 497 4668 10 47 Cheswold town, Kent County........................149 112 34 32 5 25 5,435 2,344 34762 14 240 Claymont CDP, New Castle County..............
73 73 21 16 1 13 2,105 791 3327 1 63 Clayton town........................................................73 73 21 16 1 13 2,105 791 3327 1 63 Kent County (part)............................................
0 0 0 0 0 0 0 0 00 0 0 New Castle County (part)..............................
17 16 4 3 0 2 706 69 312 0 36 Dagsboro town, Sussex County....................64 46 16 5 0 5 1,473 231 2217 0 20 Delaware City city, New Castle County..........75 67 21 7 1 4 1,281 344 1827 1 19 Delmar town, Sussex County..........................
4 3 0 0 1 0 318 12 11 3 10 Dewey Beach town, Sussex County.............1,053 1,097 375 328 52 195 18,446 16,312 1,310571 75 960 Dover city, Kent County...................................
216 122 47 85 23 37 2,699 580 16355 32 200 Dover Base Housing CDP, Kent County........99 115 39 9 1 16 3,499 2,089 7258 1 99 Edgemoor CDP, New Castle County............
8 13 6 3 2 0 242 125 56 4 15 Ellendale town, Sussex County.....................165 123 44 33 0 116 4,435 925 13992 0 786 Elsmere town, New Castle County................
0 0 0 0 0 0 110 0 00 0 0 Farmington town, Kent County........................48 38 12 3 0 12 998 290 2520 1 23 Felton town, Kent County.................................
1 0 1 0 0 0 371 2 31 0 3 Fenwick Island town, Sussex County............10 11 4 0 2 5 407 249 114 2 190 Frankford town, Sussex County....................32 33 14 2 0 7 558 183 914 1 57 Frederica town, Kent County.........................
200 85 51 8 2 133 3,191 1,018 78328 11 2,038 Georgetown town, Sussex County................312 276 71 121 6 67 9,505 3,862 937119 10 309 Glasgow CDP, New Castle County................
24 10 3 22 0 6 2,018 121 1903 0 28 Greenville CDP, New Castle County.............28 12 17 5 0 0 718 211 1117 0 48 Greenwood town, Sussex County.................
120 102 55 15 10 15 2,568 931 4376 14 94 Harrington city, Kent County.........................0 0 0 0 0 0 72 0 01 1 0 Hartly town, Kent County..................................0 0 0 0 0 0 118 3 10 0 0 Henlopen Acres town, Sussex County..........
96 71 24 44 7 14 2,725 579 18945 10 45 Highland Acres CDP, Kent County................
188 38 38 132 8 31 11,712 434 1,42959 17 102 Hockessin CDP, New Castle County............2 2 0 1 0 1 346 22 42 0 3 Houston town, Kent County..........................
51 38 17 17 1 8 1,302 505 6529 1 55 Kent Acres CDP, Kent County.........................8 6 2 0 0 0 242 12 02 0 13 Kenton town, Kent County..............................
135 155 33 38 15 37 1,889 1,668 7275 33 188 Laurel town, Sussex County............................6 6 0 0 0 0 170 9 04 0 6 Leipsic town, Kent County...............................
34 26 17 4 1 1 2,502 237 1427 3 10 Lewes city, Sussex County................................5 1 4 0 0 0 214 6 17 0 1 Little Creek town, Kent County........................6 3 5 0 0 1 1,896 44 710 0 31 Long Neck CDP, Sussex County....................7 2 4 2 0 1 182 28 314 0 6 Magnolia town, Kent County.........................
457 405 107 132 19 131 12,145 5,772 841143 27 597 Middletown town, New Castle County...........
189 176 65 27 23 60 6,404 2,304 137115 45 838 Milford city............................................................93 91 24 8 8 41 1,906 1,526 4653 13 374 Kent County (part)............................................96 85 41 19 15 19 4,498 778 9162 32 464 Sussex County (part).......................................
90 97 29 20 7 23 2,863 792 14949 7 154 Millsboro town, Sussex County.....................9 1 1 7 0 0 515 14 111 0 12 Millville town, Sussex County........................
75 76 20 3 0 12 2,027 497 1838 1 92 Milton town, Sussex County............................626 318 141 325 31 112 26,532 2,412 2,570194 41 519 Newark city, New Castle County...................101 95 39 19 2 31 3,660 1,530 8057 2 105 New Castle city, New Castle County.............
29 26 6 5 2 9 744 220 219 2 100 Newport town, New Castle County................83 20 8 61 0 27 7,066 270 68711 0 48 North Star CDP, New Castle County.............17 8 6 5 1 3 1,835 24 297 1 8 Ocean View town, Sussex County................12 10 4 5 0 2 334 35 94 0 2 Odessa town, New Castle County..................
20 Delaware Summary Population and Housing CharacteristicsU.S. Census Bureau, 2010 Census
Figure I-2.
PARTS OF A STATISTICAL TABLETable number and title Headnote
Heading
Stubhead
Stub
Sidehead
State name andpage number Report title
Spanner
Column head
Boxhead
Data field
I-4 How to Use This Census ReportU.S. Census Bureau, 2010 Census
In the stub, several features are used to help the user better understand the contents of the table. Usually, a block of data lines is preceded by a sidehead. The sidehead, similar to a spanner, describes and classifies the stub entries following it. The use of indentation in a stub indicates the relationship of one data line to another. Indented data lines represent subcategories that, in most instances, sum to a total. Occasionally in tables, it is desirable to show one or more single-line subcategories that do not sum to the total.
The data field is that part of the statistical table that contains the data. It extends from the bottom of the boxhead to the bottom of the table and from the right of the stub to the right edge of the page.
Both geographic and subject-matter terms appear in tables. It is important to read the definitions of the terms used in the tables because census terms often are defined in special ways that reflect the manner in which the questions were asked and the data were tabulated. Definitions of geographic terms are provided in Appendix A of CPH-2-A, Population and Housing Unit Counts, Selected Appendixes (<www.census.gov /prod/cen2010/cph-2-a.pdf>). Census tables often include derived measures such as medians, means, per-centages, and ratios. These and other subject-matter terms are defined in Appendix B of the same report.
Symbols and Geographic Abbreviations
The following symbols are used in the tables and explanations of subjects covered in 2010 Census reports:
• A dash ‘‘–’’ represents zero or a derived measure that rounds to less than 0.1.
• (X) means not applicable. In the 1990 and earlier decennial census reports, three dots ‘‘. . . ’’ meant not applicable.
• (NA) means not available.
• The superscript prefix ‘‘r’’ indicates that a Census 2000 count has been revised since the publication of the Census 2000 reports as a result of certified Count Question Resolution (CQR) changes (see also <www.census.gov/prod/cen2000/notes/errata.pdf>). This symbol appears only in the 2010 Census CPH-2, Population and Housing Unit Counts, report series.
• A minus sign ‘‘–’’ preceding a figure denotes decrease. The minus sign appears only in the 2010 Census CPH-2, Population and Housing Unit Counts, report series.
The following are examples of geographic abbreviations and terms that may be used in the tables in this report:
• A ‘‘(part)’’ next to the name of a geographic area in a hierarchical presentation indicates that the geo-graphic entity is located only partially in the superior geographic entity. For example, a ‘‘(part)’’ next to a place name in a county subdivision-place hierarchy indicates that the place is located in more than one county subdivision. (Places also may be ‘‘split’’ by county, congressional district, urban/rural, metropoli-tan area, voting district, and other geographic boundaries, depending on the presentation.) Other geo-graphic entities also can be ‘‘split’’ by a higher-level entity. The exception is a tabulation block, which is unique within all geographic entities in census products.
• ANVSA is Alaska Native village statistical area.
• ANRC is Alaska Native Regional Corporation.
• CCD is census county division.
• CDP is census designated place.
• CSA is combined statistical area.
• NECTA is New England city and town area.
• Metro Area is metropolitan statistical area.
How to Use This Census Report I-5U.S. Census Bureau, 2010 Census
• Micro Area is micropolitan statistical area.
• OTSA is Oklahoma tribal statistical area.
• SDTSA is state designated tribal statistical area.
• TDSA is tribal designated statistical area.
• UT is unorganized territory.
GRAPHICS
Charts, statistical maps, and other graphic summaries are included in some 2010 Census reports.
USER NOTES
User notes include general explanatory information, historical notes, and geographic notes. They also pro-vide information about unique characteristics of the report and sometimes changes or corrections made too late to be reflected in the text or tables themselves. However, sometimes this information becomes available too late to be reflected even in the user notes. Therefore, updates are available in the Notes and Errata document at <www.census.gov/prod/cen2010/notes/errata.pdf>.
APPENDIXES
Appendixes A through D, and F through H, described below, are in the separate printed volume, CPH-2-A, Population and Housing Unit Counts, Selected Appendixes, or on the Internet at <www.census.gov/prod /cen2010/cph-2-a.pdf>. Appendix E is included in this report.
Appendix A, Geographic Terms and Concepts. Provides definitions of the types of geographic areas and related information used in census products.
Appendix B, Definitions of Subject Characteristics. Contains definitions for the subject-matter terms used in census products, including explanations of derived measures, limitations of the data, and com-parability with previous censuses. The subjects are listed alphabetically. Population characteristics are defined first, followed by the definitions of the housing subjects.
Appendix C, Data Collection and Processing Procedures. Explains the 2010 Census mission and scope and provides thumbnail descriptions of 2010 Census operations.
Appendix D, Questionnaire. Presents a facsimile of the 2010 Census questionnaire used to collect the data in this report.
Appendix E, Maps. Contains maps depicting the geographic areas shown in this report.
Appendix F, Operational Overview and Accuracy of the Data. Provides information on 2010 Census operations, including group quarters enumeration, confidentiality of the data, imputation of housing unit status and population counts, sources of errors in the data, and data editing.
Appendix G, Residence Rule and Residence Situations for the 2010 Census of the United States. Contains a description of the residence rule and residence situations used by Census Bureau staff to guide decisions on where people should be counted in the 2010 Census. This document is the basis for residence-related sections of questionnaires, collection instruments, field materials, and training materials.
Appendix H, Acknowledgments. Lists many of the U.S. Census Bureau staff who participated in report preparation.

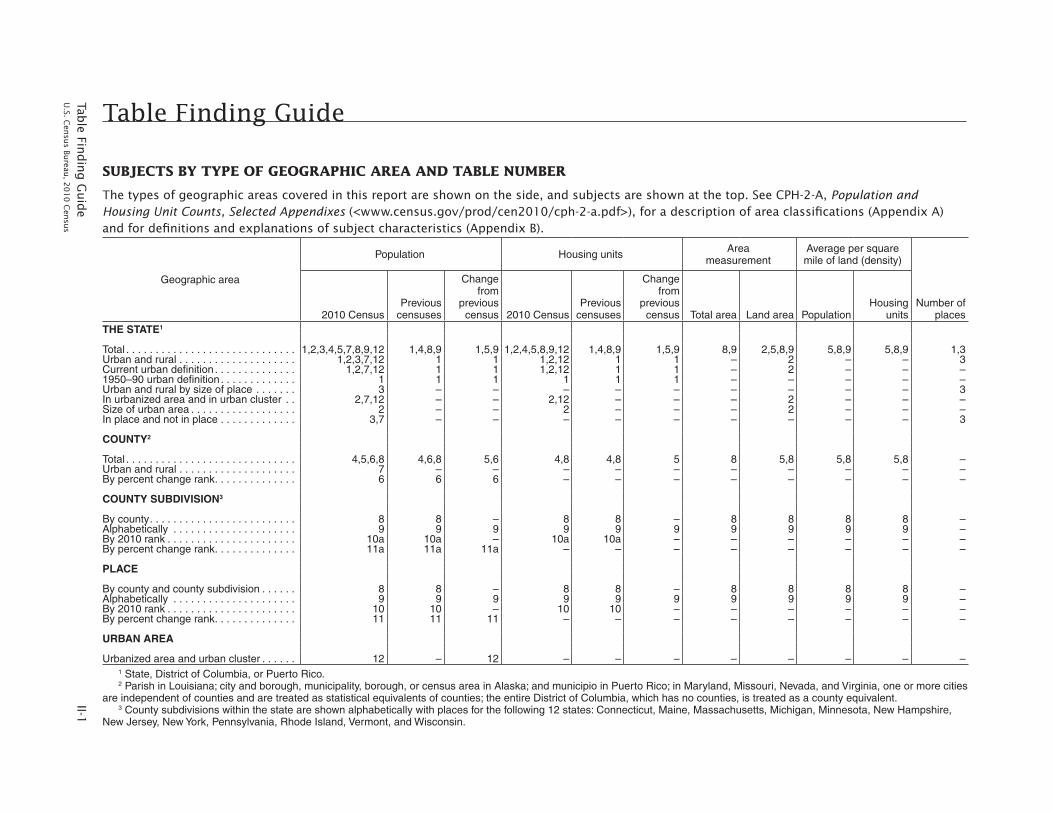
Table Fin
din
g G
uid
e II-1
U.S. C
ensu
s Bureau
, 20
10
Cen
sus
Table Finding Guide
SUBJECTS BY TYPE OF GEOGRAPHIC AREA AND TABLE NUMBER
The types of geographic areas covered in this report are shown on the side, and subjects are shown at the top. See CPH-2-A, Population and Housing Unit Counts, Selected Appendixes (<www.census.gov/prod/cen2010/cph-2-a.pdf>), for a description of area classifications (Appendix A) and for definitions and explanations of subject characteristics (Appendix B).
Geographic area
Population Housing units Area measurement
Average per square mile of land (density)
Number of places 2010 Census
Previous censuses
Change from
previous census 2010 Census
Previous censuses
Change from
previous census Total area Land area Population
Housing units
THE STATE1
Total . . . . . . . . . . . . . . . . . . . . . . . . . . . . . 1,2,3,4,5,7,8,9,12 1,4,8,9 1,5,9 1,2,4,5,8,9,12 1,4,8,9 1,5,9 8,9 2,5,8,9 5,8,9 5,8,9 1,3Urban and rural . . . . . . . . . . . . . . . . . . . . 1,2,3,7,12 1 1 1,2,12 1 1 – 2 – – 3Current urban definition . . . . . . . . . . . . . . 1,2,7,12 1 1 1,2,12 1 1 – 2 – – –1950–90 urban definition . . . . . . . . . . . . . 1 1 1 1 1 1 – – – – –Urban and rural by size of place . . . . . . . 3 – – – – – – – – – 3In urbanized area and in urban cluster . . 2,7,12 – – 2,12 – – – 2 – – –Size of urban area . . . . . . . . . . . . . . . . . . 2 – – 2 – – – 2 – – –In place and not in place . . . . . . . . . . . . .
COUNTY2
3,7 – – – – – – – – – 3
Total . . . . . . . . . . . . . . . . . . . . . . . . . . . . . 4,5,6,8 4,6,8 5,6 4,8 4,8 5 8 5,8 5,8 5,8 –Urban and rural . . . . . . . . . . . . . . . . . . . . 7 – – – – – – – – – –By percent change rank . . . . . . . . . . . . . .
COUNTY SUBDIVISION3
6 6 6 – – – – – – – –
By county . . . . . . . . . . . . . . . . . . . . . . . . . 8 8 – 8 8 – 8 8 8 8 –Alphabetically . . . . . . . . . . . . . . . . . . . . . 9 9 9 9 9 9 9 9 9 9 –By 2010 rank . . . . . . . . . . . . . . . . . . . . . . 10a 10a – 10a 10a – – – – – –By percent change rank . . . . . . . . . . . . . .
PLACE
11a 11a 11a – – – – – – – –
By county and county subdivision . . . . . . 8 8 – 8 8 – 8 8 8 8 –Alphabetically . . . . . . . . . . . . . . . . . . . . . 9 9 9 9 9 9 9 9 9 9 –By 2010 rank . . . . . . . . . . . . . . . . . . . . . . 10 10 – 10 10 – – – – – –By percent change rank . . . . . . . . . . . . . .
URBAN AREA
11 11 11 – – – – – – – –
Urbanized area and urban cluster . . . . . . 12 – 12 – – – – – – – –1 State, District of Columbia, or Puerto Rico .2 Parish in Louisiana; city and borough, municipality, borough, or census area in Alaska; and municipio in Puerto Rico; in Maryland, Missouri, Nevada, and Virginia, one or more cities
are independent of counties and are treated as statistical equivalents of counties; the entire District of Columbia, which has no counties, is treated as a county equivalent .3 County subdivisions within the state are shown alphabetically with places for the following 12 states: Connecticut, Maine, Massachusetts, Michigan, Minnesota, New Hampshire,
New Jersey, New York, Pennsylvania, Rhode Island, Vermont, and Wisconsin .

User Notes III-1U.S. Census Bureau, 2010 Census
User Notes
Additional information concerning this 2010 Census product may become available after this report is published. This information, called Notes and Errata, is available in portable document format (PDF) on the U.S. Census Bureau’s Internet site at <www.census.gov/prod/cen2010/notes/errata.pdf>.
GENERAL NOTES
User Note 1
The user should be aware that there are limitations to many of these data. Please refer to the text provided with this report for further explanation of the limitations of the data. The population and other data shown for the 2010 Census in this report are as of April 1, 2010; the boundaries used for all geographic entities are as of January 1, 2010. All boundaries are intended for Census Bureau statistical data collection and presentation only; their depiction and designation for statistical purposes do not constitute a determina-tion of jurisdictional authority or entitlement. Corrections to the 2010 Census data as a result of certified Count Question Resolution (CQR) changes are available from the Census Bureau’s Internet site at <www.census.gov/prod/cen2010/notes/errata.pdf>.
User Note 2
Data comparability for county subdivisions is shown only when the county subdivision contains sub-stantially the same territory as reported for Census 2000 (generally defined as at least 60 percent of the previous territory). There is no comparability provided for county subdivisions that have been extensively revised. Revised entities are noted by and within county. Changes to a geographic entity can be the result of legal change actions, statistical redefinition, correction of previous boundary or drafting errors, or new erroneous information.
Incorporated place and census designated place (CDP) comparability is provided for all places that retained their name or general area without regard to the amount of territorial change between censuses. Place comparability is not shown if the entity is new for the 2010 Census or is the result of a merger that created an entirely new entity, or if a 2010 Census geographic area shares no area with a Census 2000 area of the same name. American Indian area (including tribal subdivisions), Alaska Native area, and Hawaiian home land comparability follows the same rules as for place comparability.
User Note 3
When applicable, tables show the revised Census 2000 population and/or housing unit counts that resulted from the Count Question Resolution (CQR) program. These revised counts are accompanied by a prefix “r” symbol in the data tables.
Derived values (e.g., percent distribution, density, or change) that are calculated from Census 2000 popu-lation or housing unit counts only account for the aforementioned CQR revisions in certain cases.
• Calculations include the corrected Census 2000 counts when a table:
º Shows population or housing unit change (or percent change) from 2000 to 2010.
º Shows population or housing unit change (or percent change) from 1990 to 2000, and also shows the 2000 population or housing unit count that it is derived from.
º Shows population or housing unit density or percent distribution in 2000, and also shows the 2000 population or housing unit count that it is derived from.
III-2 User NotesU.S. Census Bureau, 2010 Census
• Calculations do not include the corrected Census 2000 counts when a table:
º Shows population or housing unit change (or percent change) from 1990 to 2000, but does not show the 2000 population or housing unit count that it is derived from.
º Shows population or housing unit density or percent distribution in 2000, but does not show the 2000 population or housing unit count that it is derived from.
• When a table shows component parts of a revised 2000 population or housing unit count (e.g., clas-sified by urban/rural or by size of place), the component parts may not sum to the total population or housing unit count, because the component parts were not revised during the 2000 CQR program. Therefore, any derived values (e.g., percent distribution or number of places by population size) for the component parts cannot account for the revised Census 2000 counts either.
HISTORICAL NOTES
The area of Delaware was part of the original territory of the United States. Included in the grant to William Penn, the Three Lower Counties (Delaware) were annexed as part of the grant establishing the Province of Pennsylvania in 1683. The counties were granted a separate charter providing semiautonomy in 1701, with generally the same boundary as the present state. In 1776, Delaware declared itself a separate government. Delaware ratified the U.S. Constitution on December 7, 1787; it was the first of the original 13 states to join the Union.
GEOGRAPHIC NOTES
Delaware is divided into three counties. The 27 county subdivisions in the state are census county divi-sions (CCDs), which are statistical subdivisions delineated for presentation of decennial census data. There are 57 incorporated places and 19 CDPs in Delaware. Incorporated places in the state are legally described as cities, towns, and villages. The Census Bureau treats all incorporated places and CDPs as dependent within CCDs.
GEOGRAPHIC CHANGE NOTES
The Geographic Change Notes listed below document high-level geographic entities—American Indian areas, Alaska Native areas, and Hawaiian home lands; counties and their equivalents; county subdivi-sions; and places—that are different from the information reported in Census 2000. The notes identify geographic entities whose name, legal description, and/or boundary have changed, entities that no longer exist, newly established entities (both legal and statistical), and changes in geographic relationships, such as places that exist in one county and have expanded into or withdrawn from another county (the notes do not identify the other county(ies) in which the entity exists; this can be determined from Table 9 of this publication), places that have been removed from comparable 2000 county subdivisions, and places that have become independent of or dependent within one or more county subdivisions. The changes are reported by and within county; counties without changes are not shown in the listing. Changes to Ameri-can Indian areas, Alaska Native areas, and Hawaiian home lands appear after the list of counties; areas with no changes are not shown. A few of the reported changes in name, legal status, or legal relationship may be incorrect; if so, the correct version is shown in any Correction Notes section above. Some changes are the result of legal actions that took place prior to Census 2000 but were not reported in that census.
For the 2010 Census, the notes reflect any boundary change that affects a geographic entity, regardless of whether it is the result of legal action, redefinition of a statistical entity, correction of a previous draft-ing error, or new erroneous information. Between Census 2000 and the 2010 Census, the Census Bureau invested in improving the coordinate accuracy of its geographic database. As a result, the geographic positions of boundaries may be different between the two censuses even though little or no change actu-ally occurred to the boundaries. In compiling the Geographic Change Notes, the Census Bureau inspected the many corrections to determine if a change actually affected significant land area or population. For example, the county-level text ‘‘all MCDs [minor civil divisions] revised’’ may reflect a legal redistricting
User Notes III-3U.S. Census Bureau, 2010 Census
of all county subdivisions in the county, a major or minor relocation of county subdivision boundaries due to more accurate mapping or more accurate boundary information, or a combination of these that, in one way or another, affect every county subdivision in a county. Boundary corrections that resulted in incor-porated places gaining or losing territory are shown as annexations or detachments even if no legal action occurred between 2000 and 2010. Most places shown with a detachment resulted from such corrections. In states whose legal entities rarely undergo a legal boundary change, such as the New England states, most of the entities reported to have annexed, detached, exchanged, gained, or lost territory did so as the result of mapping changes, not legal actions. The extent and location of the boundary changes affecting any particular entity can be determined by comparing the TIGER/Line® Shapefiles, Cartographic Boundary Files, or a comparable set of maps for the 2000 and 2010 censuses.
Counties, County Subdivisions, and Places
Kent County—Annexations: Dover, Harrington, and Milford cities; Camden, Cheswold, Clayton, Felton, Frederica, Kenton, Smyrna, and Wyoming towns; Detachments: Dover and Harrington cities; Camden, Felton, and Frederica towns; CDP Changes: Highland Acres CDP part annexed to Camden town; Kent Acres part annexed to Dover city.
New Castle County—Name Changes: Glasgow CCD name changed from Central Pencader; Newark CCD name changed from Greater Newark; Annexations: Delaware City, Newark, New Castle, and Wilmington cities; Middletown, Newport, Odessa, Smyrna, and Townsend towns; Detachments: Newark and New Castle cities; Townsend town; Ardentown village; New CDPs: Pike Creek Valley CDP (formed from part of Pike Creek CDP); CDP Changes: Pike Creek CDP part taken to form Pike Creek Valley CDP and lost addi-tional area.
Sussex County—Annexations: Lewes, Milford, and Seaford cities; Blades, Bridgeville, Dagsboro, Delmar, Ellendale, Georgetown, Greenwood, Laurel, Millsboro, Millville, Milton, Ocean View, and Selbyville towns; Detachments: Lewes and Seaford cities; Delmar, Georgetown, Millsboro, Millville, and Selbyville towns.
American Indian Areas
Lenape Indian Tribe of Delaware SDTSA—New area for 2010 in Kent County.
Nanticoke Indian Tribe SDTSA—SDTSA gained and lost area in Sussex County.


Crosswalk of Urban Areas and Places IV-1U.S. Census Bureau, 2010 Census
Crosswalk of Urban Areas and Places: 2010 Urban Area Place Within Urban Area
URBANIZED AREA
Dover, DE Urbanized Area Camden town (part)Cheswold town (part)Clayton town (part)Dover city (part)Dover Base Housing CDPFelton town (part)Frederica town (part)Highland Acres CDPKent Acres CDPMagnolia townRising Sun-Lebanon CDPRiverview CDP (part)Rodney Village CDPSmyrna town (part)Viola town (part)Woodside townWoodside East CDP (part)Wyoming town (part)
Philadelphia, PA--NJ--DE--MD Urbanized Area (part) Arden villageArdencroft villageArdentown villageBear CDPBellefonte townBrookside CDPClaymont CDPEdgemoor CDPElsmere townGlasgow CDP (part)Greenville CDP (part)Hockessin CDP (part)Newark city (part)New Castle city (part)Newport townNorth Star CDP (part)Pike Creek CDPPike Creek Valley CDPWilmington cityWilmington Manor CDP
Salisbury, MD--DE Urbanized Area (part) Blades townDelmar town (part)Laurel town (part)Seaford city (part)
URBAN CLUSTER
Bridgeville, DE Urban Cluster Bridgeville town (part)
Georgetown, DE Urban Cluster Georgetown town (part)
Harrington, DE Urban Cluster Harrington city (part)
Lewes, DE Urban Cluster Dewey Beach townHenlopen Acres townLewes city (part)Rehoboth Beach city (part)
Long Neck, DE Urban Cluster Long Neck CDP
Middletown, DE Urban Cluster Middletown town (part)Odessa town (part)Townsend town (part)
Milford, DE Urban Cluster Houston town (part)Milford city (part)
Millsboro, DE Urban Cluster Dagsboro town (part)Frankford town (part)Millsboro town (part)
Milton, DE Urban Cluster Milton town (part)
Ocean Pines, MD--DE Urban Cluster (part) Fenwick Island town (part)
Ocean View, DE Urban Cluster Bethany Beach townMillville town (part)Ocean View townSouth Bethany town (part)

Population and Housing Unit Counts Delaware 1U.S. Census Bureau, 2010 Census
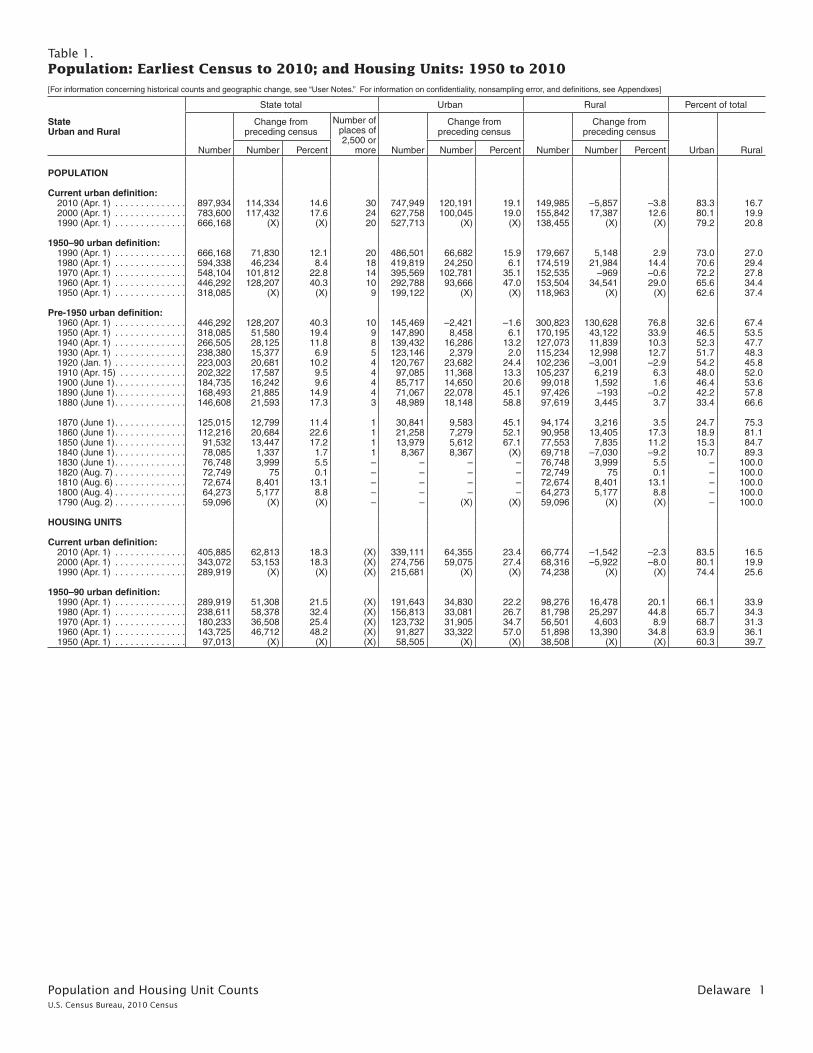
Table 1. Population: Earliest Census to 2010; and Housing Units: 1950 to 2010[For information concerning historical counts and geographic change, see “User Notes .” For information on confidentiality, nonsampling error, and definitions, see Appendixes]
StateUrban and Rural
State total Urban Rural Percent of total
Number
Change from preceding census
Number of places of 2,500 or
more Number
Change from preceding census
Number
Change from preceding census
Urban RuralNumber Percent Number Percent Number Percent
POPULATION
Current urban definition: 2010 (Apr . 1) . . . . . . . . . . . . . . 897,934 114,334 14 .6 30 747,949 120,191 19 .1 149,985 –5,857 –3 .8 83 .3 16 .7 2000 (Apr . 1) . . . . . . . . . . . . . . 783,600 117,432 17 .6 24 627,758 100,045 19 .0 155,842 17,387 12 .6 80 .1 19 .9 1990 (Apr . 1) . . . . . . . . . . . . . . 666,168 (X) (X) 20 527,713 (X) (X) 138,455 (X) (X) 79 .2 20 .8
1950–90 urban definition: 1990 (Apr . 1) . . . . . . . . . . . . . . 666,168 71,830 12 .1 20 486,501 66,682 15 .9 179,667 5,148 2 .9 73 .0 27 .0 1980 (Apr . 1) . . . . . . . . . . . . . . 594,338 46,234 8 .4 18 419,819 24,250 6 .1 174,519 21,984 14 .4 70 .6 29 .4 1970 (Apr . 1) . . . . . . . . . . . . . . 548,104 101,812 22 .8 14 395,569 102,781 35 .1 152,535 –969 –0 .6 72 .2 27 .8 1960 (Apr . 1) . . . . . . . . . . . . . . 446,292 128,207 40 .3 10 292,788 93,666 47 .0 153,504 34,541 29 .0 65 .6 34 .4 1950 (Apr . 1) . . . . . . . . . . . . . . 318,085 (X) (X) 9 199,122 (X) (X) 118,963 (X) (X) 62 .6 37 .4
Pre-1950 urban definition: 1960 (Apr . 1) . . . . . . . . . . . . . . 446,292 128,207 40 .3 10 145,469 –2,421 –1 .6 300,823 130,628 76 .8 32 .6 67 .4 1950 (Apr . 1) . . . . . . . . . . . . . . 318,085 51,580 19 .4 9 147,890 8,458 6 .1 170,195 43,122 33 .9 46 .5 53 .5 1940 (Apr . 1) . . . . . . . . . . . . . . 266,505 28,125 11 .8 8 139,432 16,286 13 .2 127,073 11,839 10 .3 52 .3 47 .7 1930 (Apr . 1) . . . . . . . . . . . . . . 238,380 15,377 6 .9 5 123,146 2,379 2 .0 115,234 12,998 12 .7 51 .7 48 .3 1920 (Jan . 1) . . . . . . . . . . . . . . 223,003 20,681 10 .2 4 120,767 23,682 24 .4 102,236 –3,001 –2 .9 54 .2 45 .8 1910 (Apr . 15) . . . . . . . . . . . . . 202,322 17,587 9 .5 4 97,085 11,368 13 .3 105,237 6,219 6 .3 48 .0 52 .0 1900 (June 1) . . . . . . . . . . . . . . 184,735 16,242 9 .6 4 85,717 14,650 20 .6 99,018 1,592 1 .6 46 .4 53 .6 1890 (June 1) . . . . . . . . . . . . . . 168,493 21,885 14 .9 4 71,067 22,078 45 .1 97,426 –193 –0 .2 42 .2 57 .8 1880 (June 1) . . . . . . . . . . . . . . 146,608 21,593 17 .3 3 48,989 18,148 58 .8 97,619 3,445 3 .7 33 .4 66 .6
1870 (June 1) . . . . . . . . . . . . . . 125,015 12,799 11 .4 1 30,841 9,583 45 .1 94,174 3,216 3 .5 24 .7 75 .3 1860 (June 1) . . . . . . . . . . . . . . 112,216 20,684 22 .6 1 21,258 7,279 52 .1 90,958 13,405 17 .3 18 .9 81 .1 1850 (June 1) . . . . . . . . . . . . . . 91,532 13,447 17 .2 1 13,979 5,612 67 .1 77,553 7,835 11 .2 15 .3 84 .7 1840 (June 1) . . . . . . . . . . . . . . 78,085 1,337 1 .7 1 8,367 8,367 (X) 69,718 –7,030 –9 .2 10 .7 89 .3 1830 (June 1) . . . . . . . . . . . . . . 76,748 3,999 5 .5 – – – – 76,748 3,999 5 .5 – 100 .0 1820 (Aug . 7) . . . . . . . . . . . . . . 72,749 75 0 .1 – – – – 72,749 75 0 .1 – 100 .0 1810 (Aug . 6) . . . . . . . . . . . . . . 72,674 8,401 13 .1 – – – – 72,674 8,401 13 .1 – 100 .0 1800 (Aug . 4) . . . . . . . . . . . . . . 64,273 5,177 8 .8 – – – – 64,273 5,177 8 .8 – 100 .0 1790 (Aug . 2) . . . . . . . . . . . . . . 59,096 (X) (X) – – (X) (X) 59,096 (X) (X) – 100 .0
HOUSING UNITS
Current urban definition: 2010 (Apr . 1) . . . . . . . . . . . . . . 405,885 62,813 18 .3 (X) 339,111 64,355 23 .4 66,774 –1,542 –2 .3 83 .5 16 .5 2000 (Apr . 1) . . . . . . . . . . . . . . 343,072 53,153 18 .3 (X) 274,756 59,075 27 .4 68,316 –5,922 –8 .0 80 .1 19 .9 1990 (Apr . 1) . . . . . . . . . . . . . . 289,919 (X) (X) (X) 215,681 (X) (X) 74,238 (X) (X) 74 .4 25 .6
1950–90 urban definition: 1990 (Apr . 1) . . . . . . . . . . . . . . 289,919 51,308 21 .5 (X) 191,643 34,830 22 .2 98,276 16,478 20 .1 66 .1 33 .9 1980 (Apr . 1) . . . . . . . . . . . . . . 238,611 58,378 32 .4 (X) 156,813 33,081 26 .7 81,798 25,297 44 .8 65 .7 34 .3 1970 (Apr . 1) . . . . . . . . . . . . . . 180,233 36,508 25 .4 (X) 123,732 31,905 34 .7 56,501 4,603 8 .9 68 .7 31 .3 1960 (Apr . 1) . . . . . . . . . . . . . . 143,725 46,712 48 .2 (X) 91,827 33,322 57 .0 51,898 13,390 34 .8 63 .9 36 .1 1950 (Apr . 1) . . . . . . . . . . . . . . 97,013 (X) (X) (X) 58,505 (X) (X) 38,508 (X) (X) 60 .3 39 .7

2 Delaware Population and Housing Unit CountsU.S. Census Bureau, 2010 Census
Table 2. Population, Housing Units, and Land Area by Urban and Rural and Size of Urban Area: 2010[Areas classified by population size . For information on confidentiality, nonsampling error, and definitions, see Appendixes]
StateUrban and RuralSize of Urban Area [Population]
Population Housing units Land area Number of urban areas
TotalPercent
distribution TotalPercent
distributionIn square
milesPercent
distribution TotalEntirely in
statePartly in
state
Delaware . . . . . . . . . . . . . . . . 897,934 100 .0 405,885 100 .0 1,949 100 .0 14 11 3
Urban . . . . . . . . . . . . . . . . . . . . . 747,949 83 .3 339,111 83 .6 407 20 .9 14 11 3
In urbanized area . . . . . . . . . . . . . . . . 616,982 68 .7 251,189 61 .9 286 14 .7 3 1 2 1,000,000 or more . . . . . . . . . . . . . 481,625 53 .6 197,839 69 191 9 .8 1 – 1 500,000 to 999,999 . . . . . . . . . . . . – – – – – – – – – 250,000 to 499,999 . . . . . . . . . . . . – – – – – – – – – 100,000 to 249,999 . . . . . . . . . . . . 110,769 12 .3 43,144 10 .6 74 3 .8 1 1 – 50,000 to 99,999 . . . . . . . . . . . . . . 24,588 2 .7 10,206 2 .5 21 1 .1 1 – 1
In urban cluster . . . . . . . . . . . . . . . . . 130,967 14 .6 87,922 21 .7 121 6 .2 11 10 1 25,000 to 49,999 . . . . . . . . . . . . . . 33,561 3 .7 15,556 3 .8 21 1 .1 2 1 1 10,000 to 24,999 . . . . . . . . . . . . . . 68,630 7 .6 61,266 15 .1 77 3 .9 4 4 – 5,000 to 9,999 . . . . . . . . . . . . . . . . 18,429 2 .1 6,504 1 .6 16 0 .8 2 2 – 2,500 to 4,999 . . . . . . . . . . . . . . . . 10,347 1 .2 4,596 1 .1 7 0 .4 3 3 –
Cumulative summary:Urban area of— 1,000,000 or more . . . . . . . . . . . . . 481,625 53 .6 197,839 48 .7 191 9 .8 1 – 1 500,000 or more . . . . . . . . . . . . . . . 481,625 53 .6 197,839 48 .7 191 9 .8 1 – 1 250,000 or more . . . . . . . . . . . . . . . 481,625 53 .6 197,839 48 .7 191 9 .8 1 – 1 100,000 or more . . . . . . . . . . . . . . . 592,394 66 .0 240,983 59 .4 265 13 .6 2 1 1 50,000 or more . . . . . . . . . . . . . . . . 616,982 68 .7 251,189 61 .9 286 14 .7 3 1 2 25,000 or more . . . . . . . . . . . . . . . . 650,543 72 .5 266,745 65 .7 307 15 .8 5 2 3 10,000 or more . . . . . . . . . . . . . . . . 719,173 80 .1 328,011 80 .8 384 19 .7 9 6 3 5,000 or more . . . . . . . . . . . . . . . . . 737,602 82 .1 334,515 82 .4 400 20 .5 11 8 3 2,500 or more . . . . . . . . . . . . . . . . . 747,949 83 .3 339,111 83 .6 407 20 .9 14 11 3
Rural . . . . . . . . . . . . . . . . . . . . . 149,985 16 .7 66,774 16 .5 1,542 79 .1 (X) (X) (X)

Population and Housing Unit Counts Delaware 3U.S. Census Bureau, 2010 Census
This page is intentionally blank.

4 Delaware Population and Housing Unit CountsU.S. Census Bureau, 2010 Census
Table 3. Population by Urban and Rural and Size of Place: 2010[Places classified by population size. For information on confidentiality, nonsampling error, and definitions, see Appendixes]
Table 3. Population by Urban and Rural and Size of Place: 2010—Con.[Places classified by population size. For information on confidentiality, nonsampling error, and definitions, see Appendixes]
StateSize of Place [Population]
Total Urban Rural
StateSize of Place [Population]
PopulationNumber of
places
Percent of total
population Total
In place
Not in place Total
In place
Not in place
All urban places (entirely or partly urban) Entirely urban places Partly urban places
All rural places (entirely or partly rural) Entirely rural places Partly rural places
PopulationNumber of
places PopulationNumber of
places PopulationNumber of
places PopulationNumber of
places PopulationNumber of
places PopulationNumber of
places
Delaware . . . . . . . . . . . . . . 897,934 76 100 .0 747,949 376,179 64 175,531 27 200,648 37 371,770 149,985 12,187 49 6,781 12 5,406 37 137,798 Delaware
In place . . . . . . . . . . . . . . . . . 388,366 76 43 .3 376,179 376,179 64 175,531 27 200,648 37 (X) 12,187 12,187 49 6,781 12 5,406 37 (X) In place Not in place . . . . . . . . . . . . . . 509,568 (X) 56 .8 371,770 (X) (X) (X) (X) (X) (X) 371,770 137,798 (X) (X) (X) (X) (X) (X) 137,798 Not in place
In place of— In place of— 1,000,000 or more . . . . . . . . . . . – – – – – – – – – – (X) – – – – – – – (X) 1,000,000 or more 500,000 to 999,999 . . . . . . . . . . – – – – – – – – – – (X) – – – – – – – (X) 500,000 to 999,999 250,000 to 499,999 . . . . . . . . . . – – – – – – – – – – (X) – – – – – – – (X) 250,000 to 499,999 100,000 to 249,999 . . . . . . . . . . – – – – – – – – – – (X) – – – – – – – (X) 100,000 to 249,999 50,000 to 99,999 . . . . . . . . . . . . 70,851 1 7.9 70,851 70,851 1 70,851 1 – – (X) – – – – – – – (X) 50,000 to 99,999 25,000 to 49,999 . . . . . . . . . . . . 67,501 2 7.5 66,757 66,757 2 – – 66,757 2 (X) 744 744 2 – – 744 2 (X) 25,000 to 49,999 10,000 to 24,999 . . . . . . . . . . . . 101,665 7 11.3 100,824 100,824 7 44,941 3 55,883 4 (X) 841 841 4 – – 841 4 (X) 10,000 to 24,999
5,000 to 9,999 . . . . . . . . . . . . . . 72,022 10 8.0 71,029 71,029 10 35,848 5 35,181 5 (X) 993 993 5 – – 993 5 (X) 5,000 to 9,999 2,500 to 4,999 . . . . . . . . . . . . . . 33,152 10 3.7 32,211 32,211 10 10,300 3 21,911 7 (X) 941 941 7 – – 941 7 (X) 2,500 to 4,999 2,000 to 2,499 . . . . . . . . . . . . . . 13,362 6 1.5 9,885 9,885 5 – – 9,885 5 (X) 3,477 3,477 6 2,167 1 1,310 5 (X) 2,000 to 2,499 1,500 to 1,999 . . . . . . . . . . . . . . 9,044 5 1.0 7,292 7,292 4 5,752 3 1,540 1 (X) 1,752 1,752 2 1,695 1 57 1 (X) 1,500 to 1,999 1,000 to 1,499 . . . . . . . . . . . . . . 11,354 9 1.3 11,277 11,277 9 6,036 5 5,241 4 (X) 77 77 4 – – 77 4 (X) 1,000 to 1,499 500 to 999 . . . . . . . . . . . . . . . . . 3,943 5 0.4 2,600 2,600 4 – – 2,600 4 (X) 1,343 1,343 5 973 1 370 4 (X) 500 to 999 200 to 499 . . . . . . . . . . . . . . . . . 4,474 14 0.5 2,993 2,993 9 1,500 5 1,493 4 (X) 1,481 1,481 9 1,408 5 73 4 (X) 200 to 499 Less than 200 . . . . . . . . . . . . . . 998 7 0.1 460 460 3 303 2 157 1 (X) 538 538 5 538 4 – 1 (X) Less than 200
Cumulative summary: Cumulative summary:In place of— In place of— 1,000,000 or more . . . . . . . . . . . – – – – – – – – – – (X) – – – – – – – (X) 1,000,000 or more 500,000 or more . . . . . . . . . . . . . – – – – – – – – – – (X) – – – – – – – (X) 500,000 or more 250,000 or more . . . . . . . . . . . . . – – – – – – – – – – (X) – – – – – – – (X) 250,000 or more 100,000 or more . . . . . . . . . . . . . – – – – – – – – – – (X) – – – – – – – (X) 100,000 or more 50,000 or more . . . . . . . . . . . . . . 70,851 1 7.9 70,851 70,851 1 70,851 1 – – (X) – – – – – – – (X) 50,000 or more 25,000 or more . . . . . . . . . . . . . . 138,352 3 15.4 137,608 137,608 3 70,851 1 66,757 2 (X) 744 744 2 – – 744 2 (X) 25,000 or more 10,000 or more . . . . . . . . . . . . . . 240,017 10 26.7 238,432 238,432 10 115,792 4 122,640 6 (X) 1,585 1,585 6 – – 1,585 6 (X) 10,000 or more
5,000 or more . . . . . . . . . . . . . . . 312,039 20 34.8 309,461 309,461 20 151,640 9 157,821 11 (X) 2,578 2,578 11 – – 2,578 11 (X) 5,000 or more 2,500 or more . . . . . . . . . . . . . . . 345,191 30 38.4 341,672 341,672 30 161,940 12 179,732 18 (X) 3,519 3,519 18 – – 3,519 18 (X) 2,500 or more 2,000 or more . . . . . . . . . . . . . . . 358,553 36 39.9 351,557 351,557 35 161,940 12 189,617 23 (X) 6,996 6,996 24 2,167 1 4,829 23 (X) 2,000 or more 1,500 or more . . . . . . . . . . . . . . . 367,597 41 40.9 358,849 358,849 39 167,692 15 191,157 24 (X) 8,748 8,748 26 3,862 2 4,886 24 (X) 1,500 or more 1,000 or more . . . . . . . . . . . . . . . 378,951 50 42.2 370,126 370,126 48 173,728 20 196,398 28 (X) 8,825 8,825 30 3,862 2 4,963 28 (X) 1,000 or more 500 or more . . . . . . . . . . . . . . . . 382,894 55 42.6 372,726 372,726 52 173,728 20 198,998 32 (X) 10,168 10,168 35 4,835 3 5,333 32 (X) 500 or more 200 or more . . . . . . . . . . . . . . . . 387,368 69 43.1 375,719 375,719 61 175,228 25 200,491 36 (X) 11,649 11,649 44 6,243 8 5,406 36 (X) 200 or more

Population and Housing Unit Counts Delaware 5U.S. Census Bureau, 2010 Census
Table 3. Population by Urban and Rural and Size of Place: 2010[Places classified by population size. For information on confidentiality, nonsampling error, and definitions, see Appendixes]
Table 3. Population by Urban and Rural and Size of Place: 2010—Con.[Places classified by population size. For information on confidentiality, nonsampling error, and definitions, see Appendixes]
StateSize of Place [Population]
Total Urban Rural
StateSize of Place [Population]
PopulationNumber of
places
Percent of total
population Total
In place
Not in place Total
In place
Not in place
All urban places (entirely or partly urban) Entirely urban places Partly urban places
All rural places (entirely or partly rural) Entirely rural places Partly rural places
PopulationNumber of
places PopulationNumber of
places PopulationNumber of
places PopulationNumber of
places PopulationNumber of
places PopulationNumber of
places
Delaware . . . . . . . . . . . . . . 897,934 76 100 .0 747,949 376,179 64 175,531 27 200,648 37 371,770 149,985 12,187 49 6,781 12 5,406 37 137,798 Delaware
In place . . . . . . . . . . . . . . . . . 388,366 76 43 .3 376,179 376,179 64 175,531 27 200,648 37 (X) 12,187 12,187 49 6,781 12 5,406 37 (X) In place Not in place . . . . . . . . . . . . . . 509,568 (X) 56 .8 371,770 (X) (X) (X) (X) (X) (X) 371,770 137,798 (X) (X) (X) (X) (X) (X) 137,798 Not in place
In place of— In place of— 1,000,000 or more . . . . . . . . . . . – – – – – – – – – – (X) – – – – – – – (X) 1,000,000 or more 500,000 to 999,999 . . . . . . . . . . – – – – – – – – – – (X) – – – – – – – (X) 500,000 to 999,999 250,000 to 499,999 . . . . . . . . . . – – – – – – – – – – (X) – – – – – – – (X) 250,000 to 499,999 100,000 to 249,999 . . . . . . . . . . – – – – – – – – – – (X) – – – – – – – (X) 100,000 to 249,999 50,000 to 99,999 . . . . . . . . . . . . 70,851 1 7.9 70,851 70,851 1 70,851 1 – – (X) – – – – – – – (X) 50,000 to 99,999 25,000 to 49,999 . . . . . . . . . . . . 67,501 2 7.5 66,757 66,757 2 – – 66,757 2 (X) 744 744 2 – – 744 2 (X) 25,000 to 49,999 10,000 to 24,999 . . . . . . . . . . . . 101,665 7 11.3 100,824 100,824 7 44,941 3 55,883 4 (X) 841 841 4 – – 841 4 (X) 10,000 to 24,999
5,000 to 9,999 . . . . . . . . . . . . . . 72,022 10 8.0 71,029 71,029 10 35,848 5 35,181 5 (X) 993 993 5 – – 993 5 (X) 5,000 to 9,999 2,500 to 4,999 . . . . . . . . . . . . . . 33,152 10 3.7 32,211 32,211 10 10,300 3 21,911 7 (X) 941 941 7 – – 941 7 (X) 2,500 to 4,999 2,000 to 2,499 . . . . . . . . . . . . . . 13,362 6 1.5 9,885 9,885 5 – – 9,885 5 (X) 3,477 3,477 6 2,167 1 1,310 5 (X) 2,000 to 2,499 1,500 to 1,999 . . . . . . . . . . . . . . 9,044 5 1.0 7,292 7,292 4 5,752 3 1,540 1 (X) 1,752 1,752 2 1,695 1 57 1 (X) 1,500 to 1,999 1,000 to 1,499 . . . . . . . . . . . . . . 11,354 9 1.3 11,277 11,277 9 6,036 5 5,241 4 (X) 77 77 4 – – 77 4 (X) 1,000 to 1,499 500 to 999 . . . . . . . . . . . . . . . . . 3,943 5 0.4 2,600 2,600 4 – – 2,600 4 (X) 1,343 1,343 5 973 1 370 4 (X) 500 to 999 200 to 499 . . . . . . . . . . . . . . . . . 4,474 14 0.5 2,993 2,993 9 1,500 5 1,493 4 (X) 1,481 1,481 9 1,408 5 73 4 (X) 200 to 499 Less than 200 . . . . . . . . . . . . . . 998 7 0.1 460 460 3 303 2 157 1 (X) 538 538 5 538 4 – 1 (X) Less than 200
Cumulative summary: Cumulative summary:In place of— In place of— 1,000,000 or more . . . . . . . . . . . – – – – – – – – – – (X) – – – – – – – (X) 1,000,000 or more 500,000 or more . . . . . . . . . . . . . – – – – – – – – – – (X) – – – – – – – (X) 500,000 or more 250,000 or more . . . . . . . . . . . . . – – – – – – – – – – (X) – – – – – – – (X) 250,000 or more 100,000 or more . . . . . . . . . . . . . – – – – – – – – – – (X) – – – – – – – (X) 100,000 or more 50,000 or more . . . . . . . . . . . . . . 70,851 1 7.9 70,851 70,851 1 70,851 1 – – (X) – – – – – – – (X) 50,000 or more 25,000 or more . . . . . . . . . . . . . . 138,352 3 15.4 137,608 137,608 3 70,851 1 66,757 2 (X) 744 744 2 – – 744 2 (X) 25,000 or more 10,000 or more . . . . . . . . . . . . . . 240,017 10 26.7 238,432 238,432 10 115,792 4 122,640 6 (X) 1,585 1,585 6 – – 1,585 6 (X) 10,000 or more
5,000 or more . . . . . . . . . . . . . . . 312,039 20 34.8 309,461 309,461 20 151,640 9 157,821 11 (X) 2,578 2,578 11 – – 2,578 11 (X) 5,000 or more 2,500 or more . . . . . . . . . . . . . . . 345,191 30 38.4 341,672 341,672 30 161,940 12 179,732 18 (X) 3,519 3,519 18 – – 3,519 18 (X) 2,500 or more 2,000 or more . . . . . . . . . . . . . . . 358,553 36 39.9 351,557 351,557 35 161,940 12 189,617 23 (X) 6,996 6,996 24 2,167 1 4,829 23 (X) 2,000 or more 1,500 or more . . . . . . . . . . . . . . . 367,597 41 40.9 358,849 358,849 39 167,692 15 191,157 24 (X) 8,748 8,748 26 3,862 2 4,886 24 (X) 1,500 or more 1,000 or more . . . . . . . . . . . . . . . 378,951 50 42.2 370,126 370,126 48 173,728 20 196,398 28 (X) 8,825 8,825 30 3,862 2 4,963 28 (X) 1,000 or more 500 or more . . . . . . . . . . . . . . . . 382,894 55 42.6 372,726 372,726 52 173,728 20 198,998 32 (X) 10,168 10,168 35 4,835 3 5,333 32 (X) 500 or more 200 or more . . . . . . . . . . . . . . . . 387,368 69 43.1 375,719 375,719 61 175,228 25 200,491 36 (X) 11,649 11,649 44 6,243 8 5,406 36 (X) 200 or more

6 Delaware Population and Housing Unit CountsU.S. Census Bureau, Census 2010
Table 4. Population and Housing Units: 1970 to 2010[For information concerning historical counts and geographic change, see “User Notes .” For information on confidentiality, nonsampling error, and definitions, see Appendixes]
StateCounty/County Equivalent
Population Housing units
2010 2000 1990 1980 1970 2010 2000 1990 1980 1970
Delaware . . . . . . . . . . . . 897,934 783,600 666,168 594,338 548,104 405,885 343,072 289,919 238,611 180,233
Kent County . . . . . . . . . . . . . . . . 162,310 126,697 110,993 98,219 81,892 65,338 50,481 42,106 35,354 25,242New Castle County . . . . . . . . . . 538,479 500,265 441,946 398,115 385,856 217,511 199,521 173,560 148,563 120,704Sussex County . . . . . . . . . . . . . 197,145 156,638 113,229 98,004 80,356 123,036 93,070 74,253 54,694 34,287
Population and Housing Unit Counts Delaware 7U.S. Census Bureau, 2010 Census
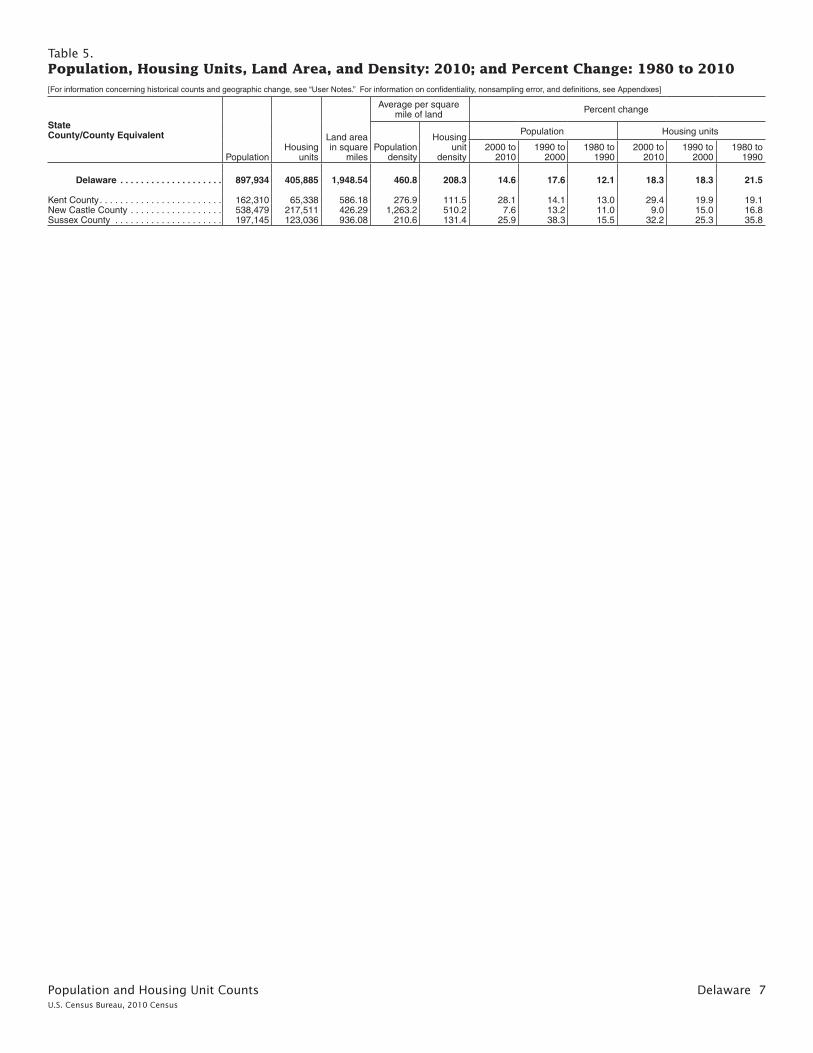
Table 5. Population, Housing Units, Land Area, and Density: 2010; and Percent Change: 1980 to 2010[For information concerning historical counts and geographic change, see “User Notes .” For information on confidentiality, nonsampling error, and definitions, see Appendixes]
StateCounty/County Equivalent
PopulationHousing
units
Land area in square
miles
Average per square mile of land Percent change
Population density
Housing unit
density
Population Housing units
2000 to 2010
1990 to 2000
1980 to 1990
2000 to 2010
1990 to 2000
1980 to 1990
Delaware . . . . . . . . . . . . . . . . . . . . 897,934 405,885 1,948 .54 460 .8 208 .3 14 .6 17 .6 12 .1 18 .3 18 .3 21 .5
Kent County . . . . . . . . . . . . . . . . . . . . . . . . 162,310 65,338 586 .18 276 .9 111 .5 28 .1 14 .1 13 .0 29 .4 19 .9 19 .1New Castle County . . . . . . . . . . . . . . . . . . 538,479 217,511 426 .29 1,263 .2 510 .2 7 .6 13 .2 11 .0 9 .0 15 .0 16 .8Sussex County . . . . . . . . . . . . . . . . . . . . . 197,145 123,036 936 .08 210 .6 131 .4 25 .9 38 .3 15 .5 32 .2 25 .3 35 .8

8 Delaware Population and Housing Unit CountsU.S. Census Bureau, 2010 Census
Table 6. Rank of Counties by Percent Change in Population: 2000 to 2010 [For information concerning historical counts and geographic change, see “User Notes .” For information on confidentiality, nonsampling error, and definitions, see Appendixes]
County/County EquivalentPopulation Percent change
2010 2000 Rank Percent
Kent County . . . . . . . . . . . . . . . . . . . . 162,310 126,697 1 28 .1Sussex County . . . . . . . . . . . . . . . . . 197,145 156,638 2 25 .9New Castle County . . . . . . . . . . . . . . 538,479 500,265 3 7 .6
Population and Housing Unit Counts Delaware 9U.S. Census Bureau, 2010 Census
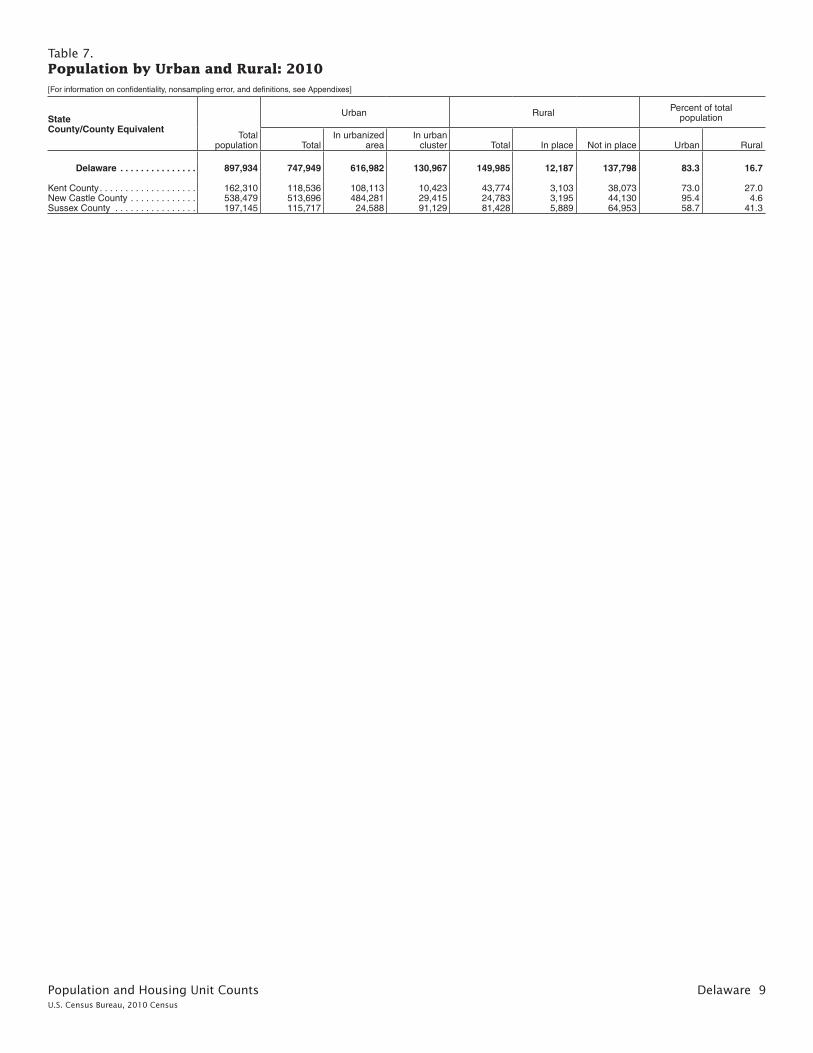
Table 7. Population by Urban and Rural: 2010[For information on confidentiality, nonsampling error, and definitions, see Appendixes]
StateCounty/County Equivalent
Total population
Urban Rural Percent of total population
TotalIn urbanized
areaIn urban
cluster Total In place Not in place Urban Rural
Delaware . . . . . . . . . . . . . . . 897,934 747,949 616,982 130,967 149,985 12,187 137,798 83 .3 16 .7
Kent County . . . . . . . . . . . . . . . . . . . 162,310 118,536 108,113 10,423 43,774 3,103 38,073 73 .0 27 .0New Castle County . . . . . . . . . . . . . 538,479 513,696 484,281 29,415 24,783 3,195 44,130 95 .4 4 .6Sussex County . . . . . . . . . . . . . . . . 197,145 115,717 24,588 91,129 81,428 5,889 64,953 58 .7 41 .3

10 Delaware Population and Housing Unit CountsU.S. Census Bureau, 2010 Census
Table 8. Population and Housing Units: 1990 to 2010; and Area Measurements and Density: 2010—Con.[For information concerning historical counts and geographic change, see “User Notes .” For information on confidentiality, nonsampling error, and definitions, see Appendixes]
StateCounty/County EquivalentCounty SubdivisionPlace
Population Housing units Area measurements in square miles
Average per square mile of land
2010 2000 1990 2010 2000 1990 Total area Land areaPopulation
densityHousing unit
density
Delaware . . . . . . . . . . . . . . . . . 897,934 783,600 666,168 405,885 343,072 289,919 2,488 .72 1,948 .54 460 .8 208 .3
Kent County . . . . . . . . . . . . . . . . . . . . . 162,310 126,697 110,993 65,338 50,481 42,106 798 .33 586 .18 276 .9 111 .5 Central Kent CCD . . . . . . . . . . . . . . 25,655 18,267 15,838 9,909 6,962 6,047 82 .66 82 .43 311 .2 120 .2 Camden town (part) . . . . . . . . . . . 54 (X) (X) 15 (X) (X) 1 .25 1 .25 43 .2 12 .0 Magnolia town . . . . . . . . . . . . . . . 225 226 211 96 96 86 0 .12 0 .12 1,875 .0 800 .0 Rising Sun-Lebanon CDP
(part) . . . . . . . . . . . . . . . . . . . . . 2,938 2,189 1,915 1,109 829 716 2 .93 2 .93 1,002 .7 378 .5 Riverview CDP . . . . . . . . . . . . . . . 2,456 1,583 1,138 906 574 384 3 .69 3 .61 680 .3 251 .0 Viola town . . . . . . . . . . . . . . . . . . . 157 156 153 64 62 58 0 .18 0 .18 872 .2 355 .6 Woodside town . . . . . . . . . . . . . . . 181 184 140 78 72 56 0 .16 0 .16 1,131 .3 487 .5 Woodside East CDP . . . . . . . . . . . 2,316 2,174 1,655 906 855 635 1 .70 1 .70 1,362 .4 532 .9 Dover CCD . . . . . . . . . . . . . . . . . . . . 77,165 66,555 59,473 31,338 26,632 22,139 247 .93 151 .94 507 .9 206 .3 Camden town (part) . . . . . . . . . . . 3,410 2,100 1,899 1,448 886 748 2 .45 2 .45 1,391 .8 591 .0 Cheswold town . . . . . . . . . . . . . . . 1,380 313 321 521 122 114 1 .29 1 .29 1,069 .8 403 .9 Dover city . . . . . . . . . . . . . . . . . . . 36,047 r 32,043 27,630 15,024 r 13,154 10,488 23 .44 23 .15 1,557 .1 649 .0 Dover Base Housing CDP . . . . . . 3,450 3,394 4,376 1,144 1,245 1,260 0 .69 0 .69 5,000 .0 1,658 .0 Hartly town . . . . . . . . . . . . . . . . . . 74 78 107 34 31 47 0 .06 0 .06 1,233 .3 566 .7 Highland Acres CDP . . . . . . . . . . 3,459 r 3,388 3,151 1,378 r 1,296 1,139 1 .54 1 .50 2,306 .0 918 .7 Kent Acres CDP . . . . . . . . . . . . . . 1,890 1,637 1,807 755 700 689 0 .88 0 .84 2,250 .0 898 .8 Leipsic town (part) . . . . . . . . . . . . 180 199 236 92 88 95 0 .21 0 .19 947 .4 484 .2 Little Creek town . . . . . . . . . . . . . . 224 195 167 97 74 87 0 .14 0 .14 1,600 .0 692 .9 Rising Sun-Lebanon CDP
(part) . . . . . . . . . . . . . . . . . . . . . 453 r 270 262 177 r 112 108 0 .63 0 .46 984 .8 384 .8 Rodney Village CDP . . . . . . . . . . . 1,487 r 1,606 1,745 622 r 631 641 0 .59 0 .59 2,520 .3 1,054 .2 Wyoming town . . . . . . . . . . . . . . . 1,313 1,141 977 572 485 394 1 .07 1 .06 1,238 .7 539 .6 Felton CCD . . . . . . . . . . . . . . . . . . . 7,085 5,493 4,844 2,972 2,172 1,858 57 .31 57 .10 124 .1 52 .0 Felton town . . . . . . . . . . . . . . . . . . 1,298 784 683 551 312 256 0 .82 0 .82 1,582 .9 672 .0 Harrington CCD . . . . . . . . . . . . . . . . 12,650 10,352 9,018 5,198 4,110 3,539 102 .24 102 .09 123 .9 50 .9 Farmington town . . . . . . . . . . . . . . 110 75 122 45 35 47 0 .08 0 .08 1,375 .0 562 .5 Harrington city . . . . . . . . . . . . . . . 3,562 3,174 2,311 1,527 1,328 977 2 .75 2 .75 1,295 .3 555 .3 Houston town . . . . . . . . . . . . . . . . 374 430 487 157 166 189 0 .33 0 .33 1,133 .3 475 .8 Kenton CCD . . . . . . . . . . . . . . . . . . . 6,541 5,337 4,429 2,469 1,919 1,582 48 .16 48 .16 135 .8 51 .3 Kenton town . . . . . . . . . . . . . . . . . 261 237 232 104 87 93 0 .19 0 .19 1,373 .7 547 .4 Milford North CCD . . . . . . . . . . . . . . 10,236 8,786 6,758 4,566 3,910 2,938 157 .79 76 .90 133 .1 59 .4 Bowers town . . . . . . . . . . . . . . . . . 335 305 (X) 276 224 (X) 0 .30 0 .29 1,155 .2 951 .7 Frederica town . . . . . . . . . . . . . . . 774 648 761 321 275 317 1 .92 1 .92 403 .1 167 .2 Milford city (part) . . . . . . . . . . . . . . 3,780 2,935 2,476 1,625 1,341 1,118 3 .92 3 .89 971 .7 417 .7 Smyrna CCD . . . . . . . . . . . . . . . . . . 22,978 11,907 10,633 8,886 4,776 4,003 102 .23 67 .55 340 .2 131 .5 Clayton town (part) . . . . . . . . . . . . 2,918 1,273 1,163 1,056 524 478 1 .67 1 .67 1,747 .3 632 .3 Leipsic town (part) . . . . . . . . . . . . 3 4 – 1 1 1 0 .10 0 .10 30 .0 10 .0 Smyrna town (part) . . . . . . . . . . . . 9,989 5,679 5,231 4,022 2,242 1,878 5 .10 5 .02 1,989 .8 801 .2
New Castle County . . . . . . . . . . . . . . . 538,479 500,265 441,946 217,511 199,521 173,560 494 .00 426 .29 1,263 .2 510 .2 Brandywine CCD . . . . . . . . . . . . . . . 77,182 78,620 80,434 34,275 33,940 32,890 38 .47 31 .41 2,457 .2 1,091 .2 Arden village . . . . . . . . . . . . . . . . . 439 474 477 243 243 233 0 .26 0 .26 1,688 .5 934 .6 Ardencroft village . . . . . . . . . . . . . 231 267 282 102 115 111 0 .10 0 .10 2,310 .0 1,020 .0 Ardentown village . . . . . . . . . . . . . 264 300 325 166 141 137 0 .16 0 .16 1,650 .0 1,037 .5 Bellefonte town . . . . . . . . . . . . . . . 1,193 1,249 1,243 560 551 523 0 .18 0 .18 6,627 .8 3,111 .1 Claymont CDP . . . . . . . . . . . . . . . 8,253 9,220 9,800 3,664 4,193 4,075 2 .15 2 .15 3,838 .6 1,704 .2 Edgemoor CDP . . . . . . . . . . . . . . 5,677 5,992 5,853 2,968 2,851 2,727 2 .12 1 .87 3,035 .8 1,587 .2 Glasgow CCD . . . . . . . . . . . . . . . . . 39,748 32,096 17,719 14,987 11,724 6,597 32 .51 31 .90 1,246 .0 469 .8 Bear CDP (part) . . . . . . . . . . . . . . 4,945 3,876 (X) 2,269 1,616 (X) 1 .25 1 .25 3,956 .0 1,815 .2 Glasgow CDP . . . . . . . . . . . . . . . . 14,303 12,840 (X) 5,290 4,629 (X) 9 .93 9 .93 1,440 .4 532 .7 Newark city (part) . . . . . . . . . . . . . 5 12 14 2 6 6 0 .05 0 .05 100 .0 40 .0 Lower Christiana CCD . . . . . . . . . . . 36,558 36,250 36,543 15,477 15,194 14,979 11 .80 11 .64 3,140 .7 1,329 .6 Elsmere town . . . . . . . . . . . . . . . . 6,131 5,800 5,935 2,664 2,395 2,471 1 .01 1 .01 6,070 .3 2,637 .6 Newport town . . . . . . . . . . . . . . . . 1,055 1,122 1,240 465 490 553 0 .45 0 .44 2,397 .7 1,056 .8 Wilmington city (part) . . . . . . . . . . – – 3 – – 2 0 .16 0 .15 – – Middletown-Odessa CCD . . . . . . . . 52,453 29,682 18,578 17,356 10,004 6,225 215 .69 186 .65 281 .0 93 .0 Clayton town (part) . . . . . . . . . . . . – – (X) – – (X) 0 .17 0 .17 – – Middletown town . . . . . . . . . . . . . . 18,871 6,161 3,834 6,821 2,514 1,475 11 .67 11 .61 1,625 .4 587 .5 Odessa town . . . . . . . . . . . . . . . . 364 286 303 154 127 132 0 .53 0 .51 713 .7 302 .0 Smyrna town (part) . . . . . . . . . . . . 34 – – 13 – – 0 .91 0 .91 37 .4 14 .3 Townsend town . . . . . . . . . . . . . . . 2,049 346 322 621 151 150 1 .05 1 .05 1,951 .4 591 .4 Newark CCD . . . . . . . . . . . . . . . . . . 68,723 67,114 61,003 25,480 24,014 21,307 30 .13 30 .13 2,280 .9 845 .7 Brookside CDP . . . . . . . . . . . . . . . 14,353 14,806 15,307 5,543 5,645 5,601 3 .95 3 .95 3,633 .7 1,403 .3 Newark city (part) . . . . . . . . . . . . . 31,449 28,535 25,084 10,473 9,288 7,854 9 .14 9 .14 3,440 .8 1,145 .8 Pike Creek CDP (part) . . . . . . . . . 534 5,883 5,438 174 2,552 2,367 0 .28 0 .28 1,907 .1 621 .4 Pike Creek Valley CDP (part) . . . . 5,137 (X) (X) 2,357 (X) (X) 1 .00 1 .00 5,137 .0 2,357 .0

Population and Housing Unit Counts Delaware 11U.S. Census Bureau, 2010 Census
Table 8. Population and Housing Units: 1990 to 2010; and Area Measurements and Density: 2010—Con.[For information concerning historical counts and geographic change, see “User Notes .” For information on confidentiality, nonsampling error, and definitions, see Appendixes]
StateCounty/County EquivalentCounty SubdivisionPlace
Population Housing units Area measurements in square miles
Average per square mile of land
2010 2000 1990 2010 2000 1990 Total area Land areaPopulation
densityHousing unit
density
Delaware—Con .
New Castle County—Con . New Castle CCD . . . . . . . . . . . . . . . 86,227 82,021 67,798 33,709 31,906 26,075 51 .05 37 .54 2,296 .9 897 .9 Bear CDP (part) . . . . . . . . . . . . . . 14,426 13,717 (X) 5,227 4,649 (X) 4 .46 4 .46 3,234 .5 1,172 .0 New Castle city . . . . . . . . . . . . . . . 5,285 4,862 4,837 2,497 2,199 2,006 3 .52 3 .40 1,554 .4 734 .4 Wilmington Manor CDP . . . . . . . . 7,889 8,262 8,568 3,039 3,173 3,173 1 .55 1 .55 5,089 .7 1,960 .6 Piedmont CCD . . . . . . . . . . . . . . . . . 29,569 29,388 24,402 11,687 11,044 8,794 39 .89 39 .53 748 .0 295 .6 Greenville CDP . . . . . . . . . . . . . . . 2,326 2,332 (X) 1,395 1,329 (X) 2 .77 2 .74 848 .9 509 .1 Hockessin CDP (part) . . . . . . . . . . 11,685 11,610 (X) 4,422 4,202 (X) 9 .33 9 .32 1,253 .8 474 .5 North Star CDP . . . . . . . . . . . . . . 7,980 8,277 (X) 2,794 2,651 (X) 6 .80 6 .80 1,173 .5 410 .9 Pike Creek-Central Kirkwood
CCD . . . . . . . . . . . . . . . . . . . . . . . . 42,016 42,312 38,733 17,994 17,645 15,777 14 .53 14 .52 2,893 .7 1,239 .3 Hockessin CDP (part) . . . . . . . . . . 1,842 1,292 (X) 528 373 (X) 0 .72 0 .72 2,558 .3 733 .3 Pike Creek CDP (part) . . . . . . . . . 7,364 13,868 4,725 3,047 5,863 2,365 2 .48 2 .48 2,969 .4 1,228 .6 Pike Creek Valley CDP (part) . . . . 6,080 (X) (X) 2,887 (X) (X) 1 .57 1 .57 3,872 .6 1,838 .9 Red Lion CCD . . . . . . . . . . . . . . . . . 8,816 5,589 4,033 3,100 2,014 1,396 31 .16 20 .27 434 .9 152 .9 Delaware City city . . . . . . . . . . . . . 1,695 1,453 1,682 741 616 658 1 .31 1 .23 1,378 .0 602 .4 Upper Christiana CCD . . . . . . . . . . . 26,336 24,529 21,177 10,626 9,898 8,278 11 .97 11 .95 2,203 .8 889 .2 Wilmington CCD . . . . . . . . . . . . . . . . 70,851 72,664 71,526 32,820 32,138 31,242 16 .79 10 .75 6,590 .8 3,053 .0 Wilmington city (part) . . . . . . . . . . 70,851 72,664 71,526 32,820 32,138 31,242 16 .79 10 .75 6,590 .8 3,053 .0
Sussex County . . . . . . . . . . . . . . . . . . 197,145 156,638 113,229 123,036 93,070 74,253 1,196 .39 936 .08 210 .6 131 .4 Bridgeville-Greenwood CCD . . . . . . 11,912 9,462 6,899 4,853 3,807 2,796 107 .31 107 .30 111 .0 45 .2 Bridgeville town (part) . . . . . . . . . . 2,048 1,436 1,210 980 636 508 4 .44 4 .44 461 .3 220 .7 Greenwood town . . . . . . . . . . . . . 973 837 578 457 394 262 0 .72 0 .72 1,351 .4 634 .7 Georgetown CCD . . . . . . . . . . . . . . . 14,967 11,811 7,776 4,770 3,793 2,996 71 .18 70 .83 211 .3 67 .3 Georgetown town (part) . . . . . . . . 6,422 4,643 3,732 2,030 1,591 1,376 5 .01 5 .01 1,281 .8 405 .2 Laurel-Delmar CCD . . . . . . . . . . . . . 23,234 20,410 15,086 9,614 8,403 6,100 183 .62 182 .10 127 .6 52 .8 Bethel town . . . . . . . . . . . . . . . . . . 171 184 178 103 97 86 0 .40 0 .40 427 .5 257 .5 Delmar town . . . . . . . . . . . . . . . . . 1,597 1,407 962 682 595 355 1 .77 1 .77 902 .3 385 .3 Laurel town . . . . . . . . . . . . . . . . . . 3,708 3,668 3,226 1,480 1,561 1,322 2 .98 2 .89 1,283 .0 512 .1 Lewes CCD . . . . . . . . . . . . . . . . . . . 29,592 21,517 13,628 28,630 20,728 16,845 166 .68 75 .58 391 .5 378 .8 Dewey Beach town . . . . . . . . . . . . 341 301 204 1,490 1,369 1,299 0 .33 0 .33 1,033 .3 4,515 .2 Henlopen Acres town . . . . . . . . . . 122 139 107 195 198 181 0 .26 0 .26 469 .2 750 .0 Lewes city . . . . . . . . . . . . . . . . . . . 2,747 2,932 2,295 2,638 2,368 1,953 4 .73 3 .80 722 .9 694 .2 Rehoboth Beach city . . . . . . . . . . 1,327 1,495 1,234 3,219 3,167 3,117 1 .64 1 .18 1,124 .6 2,728 .0 Milford South CCD . . . . . . . . . . . . . . 21,217 16,525 14,044 9,146 6,935 5,910 230 .26 127 .54 166 .4 71 .7 Ellendale town . . . . . . . . . . . . . . . 381 327 313 147 128 123 0 .44 0 .44 865 .9 334 .1 Milford city (part) . . . . . . . . . . . . . . 5,779 3,797 3,564 2,501 1,556 1,483 5 .62 5 .56 1,039 .4 449 .8 Slaughter Beach town . . . . . . . . . 207 198 114 246 253 168 1 .38 1 .36 152 .2 180 .9 Millsboro CCD . . . . . . . . . . . . . . . . . 26,024 19,558 12,897 16,735 12,220 10,263 99 .42 91 .05 285 .8 183 .8 Long Neck CDP . . . . . . . . . . . . . . 1,980 1,629 886 2,313 1,807 1,649 2 .60 2 .58 767 .4 896 .5 Millsboro town . . . . . . . . . . . . . . . 3,877 2,360 1,643 1,878 1,153 815 3 .95 3 .71 1,045 .0 506 .2 Milton CCD . . . . . . . . . . . . . . . . . . . . 14,573 10,611 7,671 8,038 5,641 3,847 63 .69 63 .15 230 .8 127 .3 Georgetown town (part) . . . . . . . . – (X) (X) – (X) (X) 0 .04 0 .04 – – Milton town . . . . . . . . . . . . . . . . . . 2,576 1,657 1,417 1,340 804 667 1 .90 1 .80 1,431 .1 744 .4 Seaford CCD . . . . . . . . . . . . . . . . . . 25,116 22,498 18,897 10,385 9,156 7,484 94 .88 93 .44 268 .8 111 .1 Blades town . . . . . . . . . . . . . . . . . 1,241 956 834 487 393 334 0 .56 0 .56 2,216 .1 869 .6 Bridgeville town (part) . . . . . . . . . . – (X) (X) – (X) (X) 0 .21 0 .21 – – Seaford city . . . . . . . . . . . . . . . . . 6,928 6,699 5,689 3,001 2,809 2,360 5 .28 5 .21 1,329 .8 576 .0 Selbyville-Frankford CCD . . . . . . . . . 30,510 24,246 16,331 30,865 22,387 18,012 179 .34 125 .08 243 .9 246 .8 Bethany Beach town . . . . . . . . . . 1,060 903 326 2,653 2,376 2,066 1 .17 1 .15 921 .7 2,307 .0 Dagsboro town . . . . . . . . . . . . . . . 805 519 398 364 248 186 1 .36 1 .36 591 .9 267 .6 Fenwick Island town . . . . . . . . . . . 379 342 186 764 666 668 0 .48 0 .33 1,148 .5 2,315 .2 Frankford town . . . . . . . . . . . . . . . 847 714 591 281 258 241 0 .73 0 .73 1,160 .3 384 .9 Millville town . . . . . . . . . . . . . . . . . 544 259 206 433 141 119 2 .50 2 .50 217 .6 173 .2 Ocean View town . . . . . . . . . . . . . 1,882 1,006 606 1,928 751 452 2 .45 2 .45 768 .2 786 .9 Selbyville town . . . . . . . . . . . . . . . 2,167 1,645 1,335 913 664 590 3 .39 3 .39 639 .2 269 .3 South Bethany town . . . . . . . . . . . 449 492 148 1,297 1,137 845 0 .53 0 .51 880 .4 2,543 .1
12 Delaware Population and Housing Unit CountsU.S. Census Bureau, 2010 Census
Table 9. Population and Housing Units: 1990 to 2010; and Area Measurements and Density: 2010—Con.[For information concerning historical counts and geographic change, see “User Notes .” For information on confidentiality, nonsampling error, and definitions, see Appendixes]
Table 9. Population and Housing Units: 1990 to 2010; and Area Measurements and Density: 2010—Con.[For information concerning historical counts and geographic change, see “User Notes .” For information on confidentiality, nonsampling error, and definitions, see Appendixes]
StatePlace and [in Selected States] County Subdivision
Population Housing units Area measurements in square miles Average per square mile of land
StatePlace and [in Selected States] County Subdivision
2010 2000 1990
Percent change 2000 to
2010 2010 2000 1990
Percent change 2000 to
2010 Total area Land area Population density Housing unit density
Delaware . . . . . . . . . . . . . . . . . . . . . . . . . . . . . . . 897,934 783,600 666,168 14 .6 405,885 343,072 289,919 18 .3 2,488 .72 1,948 .54 460 .8 208 .3 Delaware
Arden village, New Castle County . . . . . . . . . . . . . . . . . . 439 474 477 –7 .4 243 243 233 – 0 .26 0 .26 1,688 .5 934 .6 Arden village, New Castle CountyArdencroft village, New Castle County . . . . . . . . . . . . . . 231 267 282 –13 .5 102 115 111 –11 .3 0 .10 0 .10 2,310 .0 1,020 .0 Ardencroft village, New Castle CountyArdentown village, New Castle County . . . . . . . . . . . . . . 264 300 325 –12 .0 166 141 137 17 .7 0 .16 0 .16 1,650 .0 1,037 .5 Ardentown village, New Castle CountyBear CDP, New Castle County . . . . . . . . . . . . . . . . . . . . 19,371 17,593 (X) 10 .1 7,496 6,265 (X) 19 .6 5 .71 5 .71 3,392 .5 1,312 .8 Bear CDP, New Castle CountyBellefonte town, New Castle County . . . . . . . . . . . . . . . . 1,193 1,249 1,243 –4 .5 560 551 523 1 .6 0 .18 0 .18 6,627 .8 3,111 .1 Bellefonte town, New Castle CountyBethany Beach town, Sussex County . . . . . . . . . . . . . . . 1,060 903 326 17 .4 2,653 2,376 2,066 11 .7 1 .17 1 .15 921 .7 2,307 .0 Bethany Beach town, Sussex CountyBethel town, Sussex County . . . . . . . . . . . . . . . . . . . . . . 171 184 178 –7 .1 103 97 86 6 .2 0 .40 0 .40 427 .5 257 .5 Bethel town, Sussex CountyBlades town, Sussex County . . . . . . . . . . . . . . . . . . . . . . 1,241 956 834 29 .8 487 393 334 23 .9 0 .56 0 .56 2,216 .1 869 .6 Blades town, Sussex CountyBowers town, Kent County . . . . . . . . . . . . . . . . . . . . . . . 335 305 179 9 .8 276 224 168 23 .2 0 .30 0 .29 1,155 .2 951 .7 Bowers town, Kent CountyBridgeville town, Sussex County . . . . . . . . . . . . . . . . . . . 2,048 1,436 1,210 42 .6 980 636 508 54 .1 4 .65 4 .65 440 .4 210 .8 Bridgeville town, Sussex County
Brookside CDP, New Castle County . . . . . . . . . . . . . . . . 14,353 14,806 15,307 –3 .1 5,543 5,645 5,601 –1 .8 3 .95 3 .95 3,633 .7 1,403 .3 Brookside CDP, New Castle CountyCamden town, Kent County . . . . . . . . . . . . . . . . . . . . . . . 3,464 2,100 1,899 65 .0 1,463 886 748 65 .1 3 .70 3 .70 936 .2 395 .4 Camden town, Kent CountyCheswold town, Kent County . . . . . . . . . . . . . . . . . . . . . . 1,380 313 321 340 .9 521 122 114 327 .0 1 .29 1 .29 1,069 .8 403 .9 Cheswold town, Kent CountyClaymont CDP, New Castle County . . . . . . . . . . . . . . . . . 8,253 9,220 9,800 –10 .5 3,664 4,193 4,075 –12 .6 2 .15 2 .15 3,838 .6 1,704 .2 Claymont CDP, New Castle CountyClayton town . . . . . . . . . . . . . . . . . . . . . . . . . . . . . . . . . . 2,918 1,273 1,163 129 .2 1,056 524 478 101 .5 1 .84 1 .84 1,585 .9 573 .9 Clayton town Kent County (part) . . . . . . . . . . . . . . . . . . . . . . . . . . . . 2,918 1,273 1,163 129 .2 1,056 524 478 101 .5 1 .67 1 .67 1,747 .3 632 .3 Kent County (part) New Castle County (part) . . . . . . . . . . . . . . . . . . . . . . . – – (X) – – – (X) – 0 .17 0 .17 – – New Castle County (part)Dagsboro town, Sussex County . . . . . . . . . . . . . . . . . . . 805 519 398 55 .1 364 248 186 46 .8 1 .36 1 .36 591 .9 267 .6 Dagsboro town, Sussex CountyDelaware City city, New Castle County . . . . . . . . . . . . . . 1,695 1,453 1,682 16 .7 741 616 658 20 .3 1 .31 1 .23 1,378 .0 602 .4 Delaware City city, New Castle CountyDelmar town, Sussex County . . . . . . . . . . . . . . . . . . . . . 1,597 1,407 962 13 .5 682 595 355 14 .6 1 .77 1 .77 902 .3 385 .3 Delmar town, Sussex County
Dewey Beach town, Sussex County . . . . . . . . . . . . . . . . 341 301 204 13 .3 1,490 1,369 1,299 8 .8 0 .33 0 .33 1,033 .3 4,515 .2 Dewey Beach town, Sussex CountyDover city, Kent County . . . . . . . . . . . . . . . . . . . . . . . . . . 36,047 r 32,043 27,630 12 .5 15,024 r 13,154 10,488 14 .2 23 .44 23 .15 1,557 .1 649 .0 Dover city, Kent CountyDover Base Housing CDP, Kent County . . . . . . . . . . . . . 3,450 3,394 4,376 1 .6 1,144 1,245 1,260 –8 .1 0 .69 0 .69 5,000 .0 1,658 .0 Dover Base Housing CDP, Kent CountyEdgemoor CDP, New Castle County . . . . . . . . . . . . . . . . 5,677 5,992 5,853 –5 .3 2,968 2,851 2,727 4 .1 2 .12 1 .87 3,035 .8 1,587 .2 Edgemoor CDP, New Castle CountyEllendale town, Sussex County . . . . . . . . . . . . . . . . . . . . 381 327 313 16 .5 147 128 123 14 .8 0 .44 0 .44 865 .9 334 .1 Ellendale town, Sussex CountyElsmere town, New Castle County . . . . . . . . . . . . . . . . . 6,131 5,800 5,935 5 .7 2,664 2,395 2,471 11 .2 1 .01 1 .01 6,070 .3 2,637 .6 Elsmere town, New Castle CountyFarmington town, Kent County . . . . . . . . . . . . . . . . . . . . 110 75 122 46 .7 45 35 47 28 .6 0 .08 0 .08 1,375 .0 562 .5 Farmington town, Kent CountyFelton town, Kent County . . . . . . . . . . . . . . . . . . . . . . . . 1,298 784 683 65 .6 551 312 256 76 .6 0 .82 0 .82 1,582 .9 672 .0 Felton town, Kent CountyFenwick Island town, Sussex County . . . . . . . . . . . . . . . 379 342 186 10 .8 764 666 668 14 .7 0 .48 0 .33 1,148 .5 2,315 .2 Fenwick Island town, Sussex CountyFrankford town, Sussex County . . . . . . . . . . . . . . . . . . . . 847 714 591 18 .6 281 258 241 8 .9 0 .73 0 .73 1,160 .3 384 .9 Frankford town, Sussex County
Frederica town, Kent County . . . . . . . . . . . . . . . . . . . . . . 774 648 761 19 .4 321 275 317 16 .7 1 .92 1 .92 403 .1 167 .2 Frederica town, Kent CountyGeorgetown town, Sussex County . . . . . . . . . . . . . . . . . 6,422 4,643 3,732 38 .3 2,030 1,591 1,376 27 .6 5 .04 5 .04 1,274 .2 402 .8 Georgetown town, Sussex CountyGlasgow CDP, New Castle County . . . . . . . . . . . . . . . . . 14,303 12,840 (X) 11 .4 5,290 4,629 (X) 14 .3 9 .93 9 .93 1,440 .4 532 .7 Glasgow CDP, New Castle CountyGreenville CDP, New Castle County . . . . . . . . . . . . . . . . 2,326 2,332 (X) –0 .3 1,395 1,329 (X) 5 .0 2 .77 2 .74 848 .9 509 .1 Greenville CDP, New Castle CountyGreenwood town, Sussex County . . . . . . . . . . . . . . . . . . 973 837 578 16 .2 457 394 262 16 .0 0 .72 0 .72 1,351 .4 634 .7 Greenwood town, Sussex CountyHarrington city, Kent County . . . . . . . . . . . . . . . . . . . . . . 3,562 3,174 2,311 12 .2 1,527 1,328 977 15 .0 2 .75 2 .75 1,295 .3 555 .3 Harrington city, Kent CountyHartly town, Kent County . . . . . . . . . . . . . . . . . . . . . . . . . 74 78 107 –5 .1 34 31 47 9 .7 0 .06 0 .06 1,233 .3 566 .7 Hartly town, Kent CountyHenlopen Acres town, Sussex County . . . . . . . . . . . . . . 122 139 107 –12 .2 195 198 181 –1 .5 0 .26 0 .26 469 .2 750 .0 Henlopen Acres town, Sussex CountyHighland Acres CDP, Kent County . . . . . . . . . . . . . . . . . . 3,459 r 3,388 3,151 2 .1 1,378 r 1,296 1,139 6 .3 1 .54 1 .50 2,306 .0 918 .7 Highland Acres CDP, Kent CountyHockessin CDP, New Castle County . . . . . . . . . . . . . . . . 13,527 12,902 (X) 4 .8 4,950 4,575 (X) 8 .2 10 .05 10 .04 1,347 .3 493 .0 Hockessin CDP, New Castle County
Houston town, Kent County . . . . . . . . . . . . . . . . . . . . . . . 374 430 487 –13 .0 157 166 189 –5 .4 0 .33 0 .33 1,133 .3 475 .8 Houston town, Kent CountyKent Acres CDP, Kent County . . . . . . . . . . . . . . . . . . . . . 1,890 1,637 1,807 15 .5 755 700 689 7 .9 0 .88 0 .84 2,250 .0 898 .8 Kent Acres CDP, Kent CountyKenton town, Kent County . . . . . . . . . . . . . . . . . . . . . . . . 261 237 232 10 .1 104 87 93 19 .5 0 .19 0 .19 1,373 .7 547 .4 Kenton town, Kent CountyLaurel town, Sussex County . . . . . . . . . . . . . . . . . . . . . . 3,708 3,668 3,226 1 .1 1,480 1,561 1,322 –5 .2 2 .98 2 .89 1,283 .0 512 .1 Laurel town, Sussex CountyLeipsic town, Kent County . . . . . . . . . . . . . . . . . . . . . . . . 183 203 236 –9 .9 93 89 96 4 .5 0 .32 0 .29 631 .0 320 .7 Leipsic town, Kent CountyLewes city, Sussex County . . . . . . . . . . . . . . . . . . . . . . . 2,747 2,932 2,295 –6 .3 2,638 2,368 1,953 11 .4 4 .73 3 .80 722 .9 694 .2 Lewes city, Sussex CountyLittle Creek town, Kent County . . . . . . . . . . . . . . . . . . . . 224 195 167 14 .9 97 74 87 31 .1 0 .14 0 .14 1,600 .0 692 .9 Little Creek town, Kent CountyLong Neck CDP, Sussex County . . . . . . . . . . . . . . . . . . . 1,980 1,629 886 21 .5 2,313 1,807 1,649 28 .0 2 .60 2 .58 767 .4 896 .5 Long Neck CDP, Sussex CountyMagnolia town, Kent County . . . . . . . . . . . . . . . . . . . . . . 225 226 211 –0 .4 96 96 86 – 0 .12 0 .12 1,875 .0 800 .0 Magnolia town, Kent CountyMiddletown town, New Castle County . . . . . . . . . . . . . . . 18,871 6,161 3,834 206 .3 6,821 2,514 1,475 171 .3 11 .67 11 .61 1,625 .4 587 .5 Middletown town, New Castle County
Milford city . . . . . . . . . . . . . . . . . . . . . . . . . . . . . . . . . . . . 9,559 6,732 6,032 42 .0 4,126 2,897 2,598 42 .4 9 .54 9 .45 1,011 .5 436 .6 Milford city Kent County (part) . . . . . . . . . . . . . . . . . . . . . . . . . . . . 3,780 2,935 2,468 28 .8 1,625 1,341 1,115 21 .2 3 .92 3 .89 971 .7 417 .7 Kent County (part) Sussex County (part) . . . . . . . . . . . . . . . . . . . . . . . . . . 5,779 3,797 3,564 52 .2 2,501 1,556 1,483 60 .7 5 .62 5 .56 1,039 .4 449 .8 Sussex County (part)Millsboro town, Sussex County . . . . . . . . . . . . . . . . . . . . 3,877 2,360 1,643 64 .3 1,878 1,153 815 62 .9 3 .95 3 .71 1,045 .0 506 .2 Millsboro town, Sussex CountyMillville town, Sussex County . . . . . . . . . . . . . . . . . . . . . 544 259 206 110 .0 433 141 119 207 .1 2 .50 2 .50 217 .6 173 .2 Millville town, Sussex CountyMilton town, Sussex County . . . . . . . . . . . . . . . . . . . . . . 2,576 1,657 1,417 55 .5 1,340 804 667 66 .7 1 .90 1 .80 1,431 .1 744 .4 Milton town, Sussex CountyNewark city, New Castle County . . . . . . . . . . . . . . . . . . . 31,454 28,547 26,463 10 .2 10,475 9,294 7,909 12 .7 9 .19 9 .19 3,422 .6 1,139 .8 Newark city, New Castle CountyNew Castle city, New Castle County . . . . . . . . . . . . . . . . 5,285 4,862 4,837 8 .7 2,497 2,199 2,006 13 .6 3 .52 3 .40 1,554 .4 734 .4 New Castle city, New Castle CountyNewport town, New Castle County . . . . . . . . . . . . . . . . . 1,055 1,122 1,240 –6 .0 465 490 553 –5 .1 0 .45 0 .44 2,397 .7 1,056 .8 Newport town, New Castle CountyNorth Star CDP, New Castle County . . . . . . . . . . . . . . . . 7,980 8,277 (X) –3 .6 2,794 2,651 (X) 5 .4 6 .80 6 .80 1,173 .5 410 .9 North Star CDP, New Castle County
Ocean View town, Sussex County . . . . . . . . . . . . . . . . . . 1,882 1,006 606 87 .1 1,928 751 452 156 .7 2 .45 2 .45 768 .2 786 .9 Ocean View town, Sussex CountyOdessa town, New Castle County . . . . . . . . . . . . . . . . . . 364 286 303 27 .3 154 127 132 21 .3 0 .53 0 .51 713 .7 302 .0 Odessa town, New Castle CountyPike Creek CDP, New Castle County . . . . . . . . . . . . . . . 7,898 19,751 10,163 –60 .0 3,221 8,415 4,732 –61 .7 2 .76 2 .76 2,861 .6 1,167 .0 Pike Creek CDP, New Castle CountyPike Creek Valley CDP, New Castle County . . . . . . . . . . 11,217 (X) (X) (X) 5,244 (X) (X) (X) 2 .58 2 .58 4,347 .7 2,032 .6 Pike Creek Valley CDP, New Castle CountyRehoboth Beach city, Sussex County . . . . . . . . . . . . . . . 1,327 1,495 1,234 –11 .2 3,219 3,167 3,117 1 .6 1 .64 1 .18 1,124 .6 2,728 .0 Rehoboth Beach city, Sussex CountyRising Sun-Lebanon CDP, Kent County . . . . . . . . . . . . . 3,391 r 2,459 2,177 37 .9 1,286 r 941 824 36 .7 3 .57 3 .39 1,000 .3 379 .4 Rising Sun-Lebanon CDP, Kent CountyRiverview CDP, Kent County . . . . . . . . . . . . . . . . . . . . . . 2,456 1,583 1,138 55 .1 906 574 384 57 .8 3 .69 3 .61 680 .3 251 .0 Riverview CDP, Kent CountyRodney Village CDP, Kent County . . . . . . . . . . . . . . . . . . 1,487 r 1,606 1,745 –7 .4 622 r 631 641 –1 .4 0 .59 0 .59 2,520 .3 1,054 .2 Rodney Village CDP, Kent CountySeaford city, Sussex County . . . . . . . . . . . . . . . . . . . . . . 6,928 6,699 5,689 3 .4 3,001 2,809 2,360 6 .8 5 .28 5 .21 1,329 .8 576 .0 Seaford city, Sussex CountySelbyville town, Sussex County . . . . . . . . . . . . . . . . . . . . 2,167 1,645 1,335 31 .7 913 664 590 37 .5 3 .39 3 .39 639 .2 269 .3 Selbyville town, Sussex County

Population and Housing Unit Counts Delaware 13U.S. Census Bureau, 2010 Census
Table 9. Population and Housing Units: 1990 to 2010; and Area Measurements and Density: 2010—Con.[For information concerning historical counts and geographic change, see “User Notes .” For information on confidentiality, nonsampling error, and definitions, see Appendixes]
Table 9. Population and Housing Units: 1990 to 2010; and Area Measurements and Density: 2010—Con.[For information concerning historical counts and geographic change, see “User Notes .” For information on confidentiality, nonsampling error, and definitions, see Appendixes]
Area measurements in square miles Average per square mile of land
StatePlace and [in Selected States] County Subdivision
Total area Land area Population density Housing unit density
2,488 .72 1,948 .54 460 .8 208 .3 Delaware
0 .26 0 .26 1,688 .5 934 .6 Arden village, New Castle County0 .10 0 .10 2,310 .0 1,020 .0 Ardencroft village, New Castle County0 .16 0 .16 1,650 .0 1,037 .5 Ardentown village, New Castle County5 .71 5 .71 3,392 .5 1,312 .8 Bear CDP, New Castle County0 .18 0 .18 6,627 .8 3,111 .1 Bellefonte town, New Castle County1 .17 1 .15 921 .7 2,307 .0 Bethany Beach town, Sussex County0 .40 0 .40 427 .5 257 .5 Bethel town, Sussex County0 .56 0 .56 2,216 .1 869 .6 Blades town, Sussex County0 .30 0 .29 1,155 .2 951 .7 Bowers town, Kent County4 .65 4 .65 440 .4 210 .8 Bridgeville town, Sussex County
3 .95 3 .95 3,633 .7 1,403 .3 Brookside CDP, New Castle County3 .70 3 .70 936 .2 395 .4 Camden town, Kent County1 .29 1 .29 1,069 .8 403 .9 Cheswold town, Kent County2 .15 2 .15 3,838 .6 1,704 .2 Claymont CDP, New Castle County1 .84 1 .84 1,585 .9 573 .9 Clayton town1 .67 1 .67 1,747 .3 632 .3 Kent County (part)0 .17 0 .17 – – New Castle County (part)1 .36 1 .36 591 .9 267 .6 Dagsboro town, Sussex County1 .31 1 .23 1,378 .0 602 .4 Delaware City city, New Castle County1 .77 1 .77 902 .3 385 .3 Delmar town, Sussex County
0 .33 0 .33 1,033 .3 4,515 .2 Dewey Beach town, Sussex County23 .44 23 .15 1,557 .1 649 .0 Dover city, Kent County
0 .69 0 .69 5,000 .0 1,658 .0 Dover Base Housing CDP, Kent County2 .12 1 .87 3,035 .8 1,587 .2 Edgemoor CDP, New Castle County0 .44 0 .44 865 .9 334 .1 Ellendale town, Sussex County1 .01 1 .01 6,070 .3 2,637 .6 Elsmere town, New Castle County0 .08 0 .08 1,375 .0 562 .5 Farmington town, Kent County0 .82 0 .82 1,582 .9 672 .0 Felton town, Kent County0 .48 0 .33 1,148 .5 2,315 .2 Fenwick Island town, Sussex County0 .73 0 .73 1,160 .3 384 .9 Frankford town, Sussex County
1 .92 1 .92 403 .1 167 .2 Frederica town, Kent County5 .04 5 .04 1,274 .2 402 .8 Georgetown town, Sussex County9 .93 9 .93 1,440 .4 532 .7 Glasgow CDP, New Castle County2 .77 2 .74 848 .9 509 .1 Greenville CDP, New Castle County0 .72 0 .72 1,351 .4 634 .7 Greenwood town, Sussex County2 .75 2 .75 1,295 .3 555 .3 Harrington city, Kent County0 .06 0 .06 1,233 .3 566 .7 Hartly town, Kent County0 .26 0 .26 469 .2 750 .0 Henlopen Acres town, Sussex County1 .54 1 .50 2,306 .0 918 .7 Highland Acres CDP, Kent County
10 .05 10 .04 1,347 .3 493 .0 Hockessin CDP, New Castle County
0 .33 0 .33 1,133 .3 475 .8 Houston town, Kent County0 .88 0 .84 2,250 .0 898 .8 Kent Acres CDP, Kent County0 .19 0 .19 1,373 .7 547 .4 Kenton town, Kent County2 .98 2 .89 1,283 .0 512 .1 Laurel town, Sussex County0 .32 0 .29 631 .0 320 .7 Leipsic town, Kent County4 .73 3 .80 722 .9 694 .2 Lewes city, Sussex County0 .14 0 .14 1,600 .0 692 .9 Little Creek town, Kent County2 .60 2 .58 767 .4 896 .5 Long Neck CDP, Sussex County0 .12 0 .12 1,875 .0 800 .0 Magnolia town, Kent County
11 .67 11 .61 1,625 .4 587 .5 Middletown town, New Castle County
9 .54 9 .45 1,011 .5 436 .6 Milford city3 .92 3 .89 971 .7 417 .7 Kent County (part)5 .62 5 .56 1,039 .4 449 .8 Sussex County (part)3 .95 3 .71 1,045 .0 506 .2 Millsboro town, Sussex County2 .50 2 .50 217 .6 173 .2 Millville town, Sussex County1 .90 1 .80 1,431 .1 744 .4 Milton town, Sussex County9 .19 9 .19 3,422 .6 1,139 .8 Newark city, New Castle County3 .52 3 .40 1,554 .4 734 .4 New Castle city, New Castle County0 .45 0 .44 2,397 .7 1,056 .8 Newport town, New Castle County6 .80 6 .80 1,173 .5 410 .9 North Star CDP, New Castle County
2 .45 2 .45 768 .2 786 .9 Ocean View town, Sussex County0 .53 0 .51 713 .7 302 .0 Odessa town, New Castle County2 .76 2 .76 2,861 .6 1,167 .0 Pike Creek CDP, New Castle County2 .58 2 .58 4,347 .7 2,032 .6 Pike Creek Valley CDP, New Castle County1 .64 1 .18 1,124 .6 2,728 .0 Rehoboth Beach city, Sussex County3 .57 3 .39 1,000 .3 379 .4 Rising Sun-Lebanon CDP, Kent County3 .69 3 .61 680 .3 251 .0 Riverview CDP, Kent County0 .59 0 .59 2,520 .3 1,054 .2 Rodney Village CDP, Kent County5 .28 5 .21 1,329 .8 576 .0 Seaford city, Sussex County3 .39 3 .39 639 .2 269 .3 Selbyville town, Sussex County
StatePlace and [in Selected States] County Subdivision
Population Housing units
2010 2000 1990
Percent change 2000 to
2010 2010 2000 1990
Percent change 2000 to
2010
Delaware . . . . . . . . . . . . . . . . . . . . . . . . . . . . . . . 897,934 783,600 666,168 14 .6 405,885 343,072 289,919 18 .3
Arden village, New Castle County . . . . . . . . . . . . . . . . . . 439 474 477 –7 .4 243 243 233 –Ardencroft village, New Castle County . . . . . . . . . . . . . . 231 267 282 –13 .5 102 115 111 –11 .3Ardentown village, New Castle County . . . . . . . . . . . . . . 264 300 325 –12 .0 166 141 137 17 .7Bear CDP, New Castle County . . . . . . . . . . . . . . . . . . . . 19,371 17,593 (X) 10 .1 7,496 6,265 (X) 19 .6Bellefonte town, New Castle County . . . . . . . . . . . . . . . . 1,193 1,249 1,243 –4 .5 560 551 523 1 .6Bethany Beach town, Sussex County . . . . . . . . . . . . . . . 1,060 903 326 17 .4 2,653 2,376 2,066 11 .7Bethel town, Sussex County . . . . . . . . . . . . . . . . . . . . . . 171 184 178 –7 .1 103 97 86 6 .2Blades town, Sussex County . . . . . . . . . . . . . . . . . . . . . . 1,241 956 834 29 .8 487 393 334 23 .9Bowers town, Kent County . . . . . . . . . . . . . . . . . . . . . . . 335 305 179 9 .8 276 224 168 23 .2Bridgeville town, Sussex County . . . . . . . . . . . . . . . . . . . 2,048 1,436 1,210 42 .6 980 636 508 54 .1
Brookside CDP, New Castle County . . . . . . . . . . . . . . . . 14,353 14,806 15,307 –3 .1 5,543 5,645 5,601 –1 .8Camden town, Kent County . . . . . . . . . . . . . . . . . . . . . . . 3,464 2,100 1,899 65 .0 1,463 886 748 65 .1Cheswold town, Kent County . . . . . . . . . . . . . . . . . . . . . . 1,380 313 321 340 .9 521 122 114 327 .0Claymont CDP, New Castle County . . . . . . . . . . . . . . . . . 8,253 9,220 9,800 –10 .5 3,664 4,193 4,075 –12 .6Clayton town . . . . . . . . . . . . . . . . . . . . . . . . . . . . . . . . . . 2,918 1,273 1,163 129 .2 1,056 524 478 101 .5 Kent County (part) . . . . . . . . . . . . . . . . . . . . . . . . . . . . 2,918 1,273 1,163 129 .2 1,056 524 478 101 .5 New Castle County (part) . . . . . . . . . . . . . . . . . . . . . . . – – (X) – – – (X) –Dagsboro town, Sussex County . . . . . . . . . . . . . . . . . . . 805 519 398 55 .1 364 248 186 46 .8Delaware City city, New Castle County . . . . . . . . . . . . . . 1,695 1,453 1,682 16 .7 741 616 658 20 .3Delmar town, Sussex County . . . . . . . . . . . . . . . . . . . . . 1,597 1,407 962 13 .5 682 595 355 14 .6
Dewey Beach town, Sussex County . . . . . . . . . . . . . . . . 341 301 204 13 .3 1,490 1,369 1,299 8 .8Dover city, Kent County . . . . . . . . . . . . . . . . . . . . . . . . . . 36,047 r 32,043 27,630 12 .5 15,024 r 13,154 10,488 14 .2Dover Base Housing CDP, Kent County . . . . . . . . . . . . . 3,450 3,394 4,376 1 .6 1,144 1,245 1,260 –8 .1Edgemoor CDP, New Castle County . . . . . . . . . . . . . . . . 5,677 5,992 5,853 –5 .3 2,968 2,851 2,727 4 .1Ellendale town, Sussex County . . . . . . . . . . . . . . . . . . . . 381 327 313 16 .5 147 128 123 14 .8Elsmere town, New Castle County . . . . . . . . . . . . . . . . . 6,131 5,800 5,935 5 .7 2,664 2,395 2,471 11 .2Farmington town, Kent County . . . . . . . . . . . . . . . . . . . . 110 75 122 46 .7 45 35 47 28 .6Felton town, Kent County . . . . . . . . . . . . . . . . . . . . . . . . 1,298 784 683 65 .6 551 312 256 76 .6Fenwick Island town, Sussex County . . . . . . . . . . . . . . . 379 342 186 10 .8 764 666 668 14 .7Frankford town, Sussex County . . . . . . . . . . . . . . . . . . . . 847 714 591 18 .6 281 258 241 8 .9
Frederica town, Kent County . . . . . . . . . . . . . . . . . . . . . . 774 648 761 19 .4 321 275 317 16 .7Georgetown town, Sussex County . . . . . . . . . . . . . . . . . 6,422 4,643 3,732 38 .3 2,030 1,591 1,376 27 .6Glasgow CDP, New Castle County . . . . . . . . . . . . . . . . . 14,303 12,840 (X) 11 .4 5,290 4,629 (X) 14 .3Greenville CDP, New Castle County . . . . . . . . . . . . . . . . 2,326 2,332 (X) –0 .3 1,395 1,329 (X) 5 .0Greenwood town, Sussex County . . . . . . . . . . . . . . . . . . 973 837 578 16 .2 457 394 262 16 .0Harrington city, Kent County . . . . . . . . . . . . . . . . . . . . . . 3,562 3,174 2,311 12 .2 1,527 1,328 977 15 .0Hartly town, Kent County . . . . . . . . . . . . . . . . . . . . . . . . . 74 78 107 –5 .1 34 31 47 9 .7Henlopen Acres town, Sussex County . . . . . . . . . . . . . . 122 139 107 –12 .2 195 198 181 –1 .5Highland Acres CDP, Kent County . . . . . . . . . . . . . . . . . . 3,459 r 3,388 3,151 2 .1 1,378 r 1,296 1,139 6 .3Hockessin CDP, New Castle County . . . . . . . . . . . . . . . . 13,527 12,902 (X) 4 .8 4,950 4,575 (X) 8 .2
Houston town, Kent County . . . . . . . . . . . . . . . . . . . . . . . 374 430 487 –13 .0 157 166 189 –5 .4Kent Acres CDP, Kent County . . . . . . . . . . . . . . . . . . . . . 1,890 1,637 1,807 15 .5 755 700 689 7 .9Kenton town, Kent County . . . . . . . . . . . . . . . . . . . . . . . . 261 237 232 10 .1 104 87 93 19 .5Laurel town, Sussex County . . . . . . . . . . . . . . . . . . . . . . 3,708 3,668 3,226 1 .1 1,480 1,561 1,322 –5 .2Leipsic town, Kent County . . . . . . . . . . . . . . . . . . . . . . . . 183 203 236 –9 .9 93 89 96 4 .5Lewes city, Sussex County . . . . . . . . . . . . . . . . . . . . . . . 2,747 2,932 2,295 –6 .3 2,638 2,368 1,953 11 .4Little Creek town, Kent County . . . . . . . . . . . . . . . . . . . . 224 195 167 14 .9 97 74 87 31 .1Long Neck CDP, Sussex County . . . . . . . . . . . . . . . . . . . 1,980 1,629 886 21 .5 2,313 1,807 1,649 28 .0Magnolia town, Kent County . . . . . . . . . . . . . . . . . . . . . . 225 226 211 –0 .4 96 96 86 –Middletown town, New Castle County . . . . . . . . . . . . . . . 18,871 6,161 3,834 206 .3 6,821 2,514 1,475 171 .3
Milford city . . . . . . . . . . . . . . . . . . . . . . . . . . . . . . . . . . . . 9,559 6,732 6,032 42 .0 4,126 2,897 2,598 42 .4 Kent County (part) . . . . . . . . . . . . . . . . . . . . . . . . . . . . 3,780 2,935 2,468 28 .8 1,625 1,341 1,115 21 .2 Sussex County (part) . . . . . . . . . . . . . . . . . . . . . . . . . . 5,779 3,797 3,564 52 .2 2,501 1,556 1,483 60 .7Millsboro town, Sussex County . . . . . . . . . . . . . . . . . . . . 3,877 2,360 1,643 64 .3 1,878 1,153 815 62 .9Millville town, Sussex County . . . . . . . . . . . . . . . . . . . . . 544 259 206 110 .0 433 141 119 207 .1Milton town, Sussex County . . . . . . . . . . . . . . . . . . . . . . 2,576 1,657 1,417 55 .5 1,340 804 667 66 .7Newark city, New Castle County . . . . . . . . . . . . . . . . . . . 31,454 28,547 26,463 10 .2 10,475 9,294 7,909 12 .7New Castle city, New Castle County . . . . . . . . . . . . . . . . 5,285 4,862 4,837 8 .7 2,497 2,199 2,006 13 .6Newport town, New Castle County . . . . . . . . . . . . . . . . . 1,055 1,122 1,240 –6 .0 465 490 553 –5 .1North Star CDP, New Castle County . . . . . . . . . . . . . . . . 7,980 8,277 (X) –3 .6 2,794 2,651 (X) 5 .4
Ocean View town, Sussex County . . . . . . . . . . . . . . . . . . 1,882 1,006 606 87 .1 1,928 751 452 156 .7Odessa town, New Castle County . . . . . . . . . . . . . . . . . . 364 286 303 27 .3 154 127 132 21 .3Pike Creek CDP, New Castle County . . . . . . . . . . . . . . . 7,898 19,751 10,163 –60 .0 3,221 8,415 4,732 –61 .7Pike Creek Valley CDP, New Castle County . . . . . . . . . . 11,217 (X) (X) (X) 5,244 (X) (X) (X)Rehoboth Beach city, Sussex County . . . . . . . . . . . . . . . 1,327 1,495 1,234 –11 .2 3,219 3,167 3,117 1 .6Rising Sun-Lebanon CDP, Kent County . . . . . . . . . . . . . 3,391 r 2,459 2,177 37 .9 1,286 r 941 824 36 .7Riverview CDP, Kent County . . . . . . . . . . . . . . . . . . . . . . 2,456 1,583 1,138 55 .1 906 574 384 57 .8Rodney Village CDP, Kent County . . . . . . . . . . . . . . . . . . 1,487 r 1,606 1,745 –7 .4 622 r 631 641 –1 .4Seaford city, Sussex County . . . . . . . . . . . . . . . . . . . . . . 6,928 6,699 5,689 3 .4 3,001 2,809 2,360 6 .8Selbyville town, Sussex County . . . . . . . . . . . . . . . . . . . . 2,167 1,645 1,335 31 .7 913 664 590 37 .5
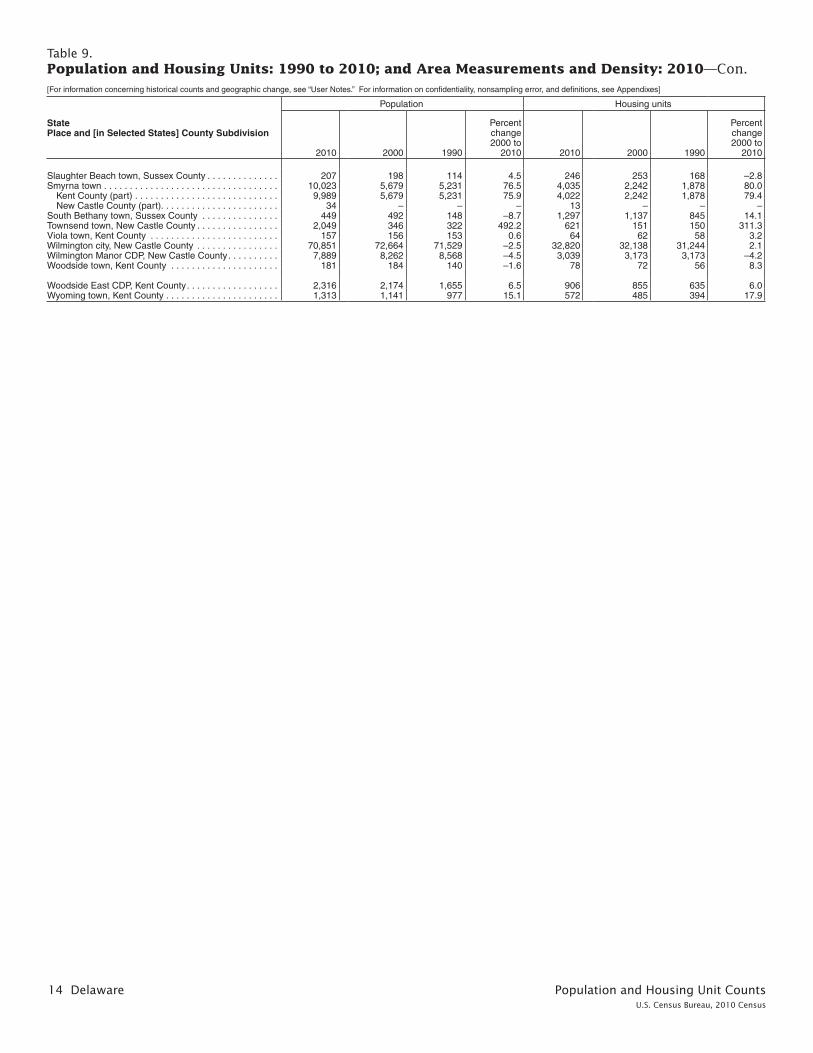
14 Delaware Population and Housing Unit CountsU.S. Census Bureau, 2010 Census
Table 9. Population and Housing Units: 1990 to 2010; and Area Measurements and Density: 2010—Con.[For information concerning historical counts and geographic change, see “User Notes .” For information on confidentiality, nonsampling error, and definitions, see Appendixes]
StatePlace and [in Selected States] County Subdivision
Population Housing units
2010 2000 1990
Percent change 2000 to
2010 2010 2000 1990
Percent change 2000 to
2010
Slaughter Beach town, Sussex County . . . . . . . . . . . . . . 207 198 114 4 .5 246 253 168 –2 .8Smyrna town . . . . . . . . . . . . . . . . . . . . . . . . . . . . . . . . . . 10,023 5,679 5,231 76 .5 4,035 2,242 1,878 80 .0 Kent County (part) . . . . . . . . . . . . . . . . . . . . . . . . . . . . 9,989 5,679 5,231 75 .9 4,022 2,242 1,878 79 .4 New Castle County (part) . . . . . . . . . . . . . . . . . . . . . . . 34 – – – 13 – – –South Bethany town, Sussex County . . . . . . . . . . . . . . . 449 492 148 –8 .7 1,297 1,137 845 14 .1Townsend town, New Castle County . . . . . . . . . . . . . . . . 2,049 346 322 492 .2 621 151 150 311 .3Viola town, Kent County . . . . . . . . . . . . . . . . . . . . . . . . . 157 156 153 0 .6 64 62 58 3 .2Wilmington city, New Castle County . . . . . . . . . . . . . . . . 70,851 72,664 71,529 –2 .5 32,820 32,138 31,244 2 .1Wilmington Manor CDP, New Castle County . . . . . . . . . . 7,889 8,262 8,568 –4 .5 3,039 3,173 3,173 –4 .2Woodside town, Kent County . . . . . . . . . . . . . . . . . . . . . 181 184 140 –1 .6 78 72 56 8 .3
Woodside East CDP, Kent County . . . . . . . . . . . . . . . . . . 2,316 2,174 1,655 6 .5 906 855 635 6 .0Wyoming town, Kent County . . . . . . . . . . . . . . . . . . . . . . 1,313 1,141 977 15 .1 572 485 394 17 .9
Table 9. Population and Housing Units: 1990 to 2010; and Area Measurements and Density: 2010—Con.[For information concerning historical counts and geographic change, see “User Notes .” For information on confidentiality, nonsampling error, and definitions, see Appendixes]
Area measurements in square miles Average per square mile of land
StatePlace and [in Selected States] County Subdivision
Total area Land area Population density Housing unit density
1 .38 1 .36 152 .2 180 .9 Slaughter Beach town, Sussex County6 .01 5 .93 1,690 .2 680 .4 Smyrna town5 .10 5 .02 1,989 .8 801 .2 Kent County (part)0 .91 0 .91 37 .4 14 .3 New Castle County (part)0 .53 0 .51 880 .4 2,543 .1 South Bethany town, Sussex County1 .05 1 .05 1,951 .4 591 .4 Townsend town, New Castle County0 .18 0 .18 872 .2 355 .6 Viola town, Kent County
16 .95 10 .90 6,500 .1 3,011 .0 Wilmington city, New Castle County1 .55 1 .55 5,089 .7 1,960 .6 Wilmington Manor CDP, New Castle County0 .16 0 .16 1,131 .3 487 .5 Woodside town, Kent County
1 .70 1 .70 1,362 .4 532 .9 Woodside East CDP, Kent County1 .07 1 .06 1,238 .7 539 .6 Wyoming town, Kent County

Population and Housing Unit Counts Delaware 15U.S. Census Bureau, 2010 Census
Table 9. Population and Housing Units: 1990 to 2010; and Area Measurements and Density: 2010—Con.[For information concerning historical counts and geographic change, see “User Notes .” For information on confidentiality, nonsampling error, and definitions, see Appendixes]
Table 9. Population and Housing Units: 1990 to 2010; and Area Measurements and Density: 2010—Con.[For information concerning historical counts and geographic change, see “User Notes .” For information on confidentiality, nonsampling error, and definitions, see Appendixes]
Area measurements in square miles Average per square mile of land
StatePlace and [in Selected States] County Subdivision
Total area Land area Population density Housing unit density
1 .38 1 .36 152 .2 180 .9 Slaughter Beach town, Sussex County6 .01 5 .93 1,690 .2 680 .4 Smyrna town5 .10 5 .02 1,989 .8 801 .2 Kent County (part)0 .91 0 .91 37 .4 14 .3 New Castle County (part)0 .53 0 .51 880 .4 2,543 .1 South Bethany town, Sussex County1 .05 1 .05 1,951 .4 591 .4 Townsend town, New Castle County0 .18 0 .18 872 .2 355 .6 Viola town, Kent County
16 .95 10 .90 6,500 .1 3,011 .0 Wilmington city, New Castle County1 .55 1 .55 5,089 .7 1,960 .6 Wilmington Manor CDP, New Castle County0 .16 0 .16 1,131 .3 487 .5 Woodside town, Kent County
1 .70 1 .70 1,362 .4 532 .9 Woodside East CDP, Kent County1 .07 1 .06 1,238 .7 539 .6 Wyoming town, Kent County
StatePlace and [in Selected States] County Subdivision
Population Housing units
2010 2000 1990
Percent change 2000 to
2010 2010 2000 1990
Percent change 2000 to
2010
Slaughter Beach town, Sussex County . . . . . . . . . . . . . . 207 198 114 4 .5 246 253 168 –2 .8Smyrna town . . . . . . . . . . . . . . . . . . . . . . . . . . . . . . . . . . 10,023 5,679 5,231 76 .5 4,035 2,242 1,878 80 .0 Kent County (part) . . . . . . . . . . . . . . . . . . . . . . . . . . . . 9,989 5,679 5,231 75 .9 4,022 2,242 1,878 79 .4 New Castle County (part) . . . . . . . . . . . . . . . . . . . . . . . 34 – – – 13 – – –South Bethany town, Sussex County . . . . . . . . . . . . . . . 449 492 148 –8 .7 1,297 1,137 845 14 .1Townsend town, New Castle County . . . . . . . . . . . . . . . . 2,049 346 322 492 .2 621 151 150 311 .3Viola town, Kent County . . . . . . . . . . . . . . . . . . . . . . . . . 157 156 153 0 .6 64 62 58 3 .2Wilmington city, New Castle County . . . . . . . . . . . . . . . . 70,851 72,664 71,529 –2 .5 32,820 32,138 31,244 2 .1Wilmington Manor CDP, New Castle County . . . . . . . . . . 7,889 8,262 8,568 –4 .5 3,039 3,173 3,173 –4 .2Woodside town, Kent County . . . . . . . . . . . . . . . . . . . . . 181 184 140 –1 .6 78 72 56 8 .3
Woodside East CDP, Kent County . . . . . . . . . . . . . . . . . . 2,316 2,174 1,655 6 .5 906 855 635 6 .0Wyoming town, Kent County . . . . . . . . . . . . . . . . . . . . . . 1,313 1,141 977 15 .1 572 485 394 17 .9
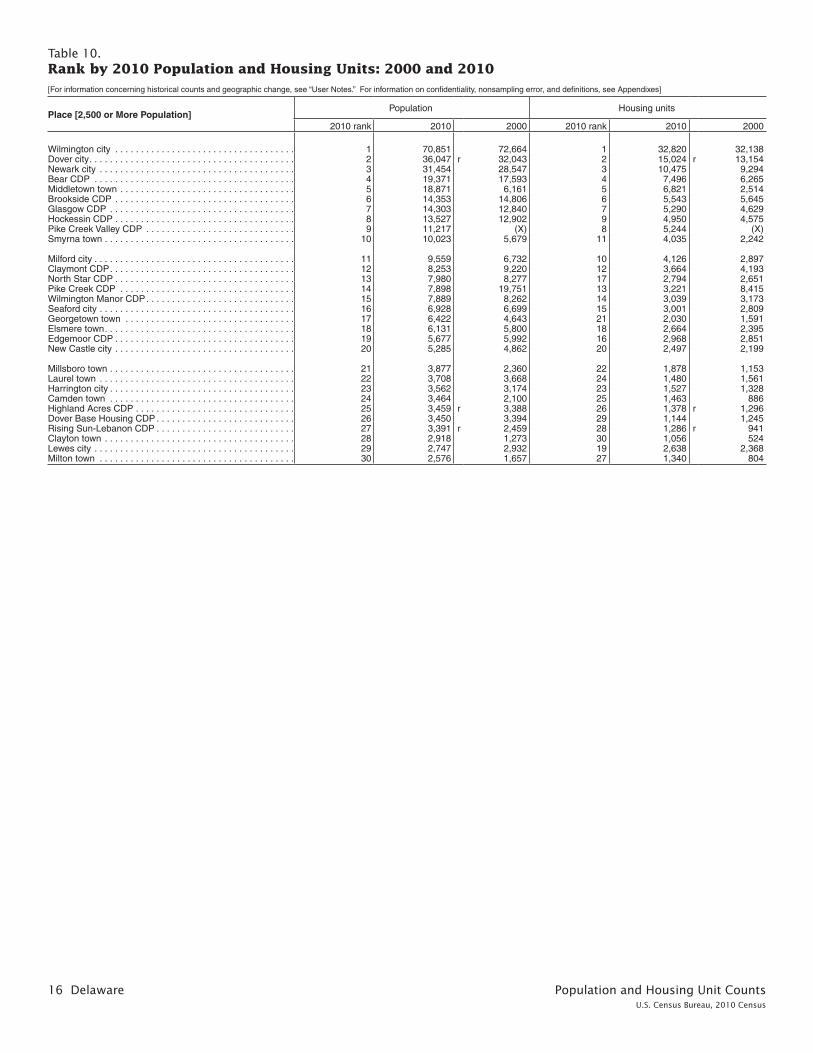
16 Delaware Population and Housing Unit CountsU.S. Census Bureau, 2010 Census
Table 10. Rank by 2010 Population and Housing Units: 2000 and 2010 [For information concerning historical counts and geographic change, see “User Notes .” For information on confidentiality, nonsampling error, and definitions, see Appendixes]
Place [2,500 or More Population]Population Housing units
2010 rank 2010 2000 2010 rank 2010 2000
Wilmington city . . . . . . . . . . . . . . . . . . . . . . . . . . . . . . . . . . . 1 70,851 72,664 1 32,820 32,138Dover city . . . . . . . . . . . . . . . . . . . . . . . . . . . . . . . . . . . . . . . . 2 36,047 r 32,043 2 15,024 r 13,154Newark city . . . . . . . . . . . . . . . . . . . . . . . . . . . . . . . . . . . . . . 3 31,454 28,547 3 10,475 9,294Bear CDP . . . . . . . . . . . . . . . . . . . . . . . . . . . . . . . . . . . . . . . 4 19,371 17,593 4 7,496 6,265Middletown town . . . . . . . . . . . . . . . . . . . . . . . . . . . . . . . . . . 5 18,871 6,161 5 6,821 2,514Brookside CDP . . . . . . . . . . . . . . . . . . . . . . . . . . . . . . . . . . . 6 14,353 14,806 6 5,543 5,645Glasgow CDP . . . . . . . . . . . . . . . . . . . . . . . . . . . . . . . . . . . . 7 14,303 12,840 7 5,290 4,629Hockessin CDP . . . . . . . . . . . . . . . . . . . . . . . . . . . . . . . . . . . 8 13,527 12,902 9 4,950 4,575Pike Creek Valley CDP . . . . . . . . . . . . . . . . . . . . . . . . . . . . . 9 11,217 (X) 8 5,244 (X)Smyrna town . . . . . . . . . . . . . . . . . . . . . . . . . . . . . . . . . . . . . 10 10,023 5,679 11 4,035 2,242
Milford city . . . . . . . . . . . . . . . . . . . . . . . . . . . . . . . . . . . . . . . 11 9,559 6,732 10 4,126 2,897Claymont CDP . . . . . . . . . . . . . . . . . . . . . . . . . . . . . . . . . . . . 12 8,253 9,220 12 3,664 4,193North Star CDP . . . . . . . . . . . . . . . . . . . . . . . . . . . . . . . . . . . 13 7,980 8,277 17 2,794 2,651Pike Creek CDP . . . . . . . . . . . . . . . . . . . . . . . . . . . . . . . . . . 14 7,898 19,751 13 3,221 8,415Wilmington Manor CDP . . . . . . . . . . . . . . . . . . . . . . . . . . . . . 15 7,889 8,262 14 3,039 3,173Seaford city . . . . . . . . . . . . . . . . . . . . . . . . . . . . . . . . . . . . . . 16 6,928 6,699 15 3,001 2,809Georgetown town . . . . . . . . . . . . . . . . . . . . . . . . . . . . . . . . . 17 6,422 4,643 21 2,030 1,591Elsmere town . . . . . . . . . . . . . . . . . . . . . . . . . . . . . . . . . . . . . 18 6,131 5,800 18 2,664 2,395Edgemoor CDP . . . . . . . . . . . . . . . . . . . . . . . . . . . . . . . . . . . 19 5,677 5,992 16 2,968 2,851New Castle city . . . . . . . . . . . . . . . . . . . . . . . . . . . . . . . . . . . 20 5,285 4,862 20 2,497 2,199
Millsboro town . . . . . . . . . . . . . . . . . . . . . . . . . . . . . . . . . . . . 21 3,877 2,360 22 1,878 1,153Laurel town . . . . . . . . . . . . . . . . . . . . . . . . . . . . . . . . . . . . . . 22 3,708 3,668 24 1,480 1,561Harrington city . . . . . . . . . . . . . . . . . . . . . . . . . . . . . . . . . . . . 23 3,562 3,174 23 1,527 1,328Camden town . . . . . . . . . . . . . . . . . . . . . . . . . . . . . . . . . . . . 24 3,464 2,100 25 1,463 886Highland Acres CDP . . . . . . . . . . . . . . . . . . . . . . . . . . . . . . . 25 3,459 r 3,388 26 1,378 r 1,296Dover Base Housing CDP . . . . . . . . . . . . . . . . . . . . . . . . . . . 26 3,450 3,394 29 1,144 1,245Rising Sun-Lebanon CDP . . . . . . . . . . . . . . . . . . . . . . . . . . . 27 3,391 r 2,459 28 1,286 r 941Clayton town . . . . . . . . . . . . . . . . . . . . . . . . . . . . . . . . . . . . . 28 2,918 1,273 30 1,056 524Lewes city . . . . . . . . . . . . . . . . . . . . . . . . . . . . . . . . . . . . . . . 29 2,747 2,932 19 2,638 2,368Milton town . . . . . . . . . . . . . . . . . . . . . . . . . . . . . . . . . . . . . . 30 2,576 1,657 27 1,340 804

Population and Housing Unit Counts Delaware 17U.S. Census Bureau, 2010 Census
Table 11. Rank of Places by Percent Change in Population: 2000 to 2010 [For information concerning historical counts and geographic change, see “User Notes .” For information on confidentiality, nonsampling error, and definitions, see Appendixes]
Population Percent changePlace [2,500 or More Population]
2010 2000 Rank Percent
Middletown town . . . . . . . . . . . . . . . . . . . . 18,871 6,161 1 206 .30Clayton town . . . . . . . . . . . . . . . . . . . . . . . 2,918 1,273 2 129 .22Smyrna town . . . . . . . . . . . . . . . . . . . . . . . 10,023 5,679 3 76 .49Camden town . . . . . . . . . . . . . . . . . . . . . . 3,464 2,100 4 64 .95Millsboro town . . . . . . . . . . . . . . . . . . . . . . 3,877 2,360 5 64 .28Milton town . . . . . . . . . . . . . . . . . . . . . . . . 2,576 1,657 6 55 .46Milford city . . . . . . . . . . . . . . . . . . . . . . . . . 9,559 6,732 7 41 .99Georgetown town . . . . . . . . . . . . . . . . . . . 6,422 4,643 8 38 .32Rising Sun-Lebanon CDP . . . . . . . . . . . . . 3,391 r 2,459 9 37 .90Dover city . . . . . . . . . . . . . . . . . . . . . . . . . . 36,047 r 32,043 10 12 .50
Harrington city . . . . . . . . . . . . . . . . . . . . . . 3,562 3,174 11 12 .22Glasgow CDP . . . . . . . . . . . . . . . . . . . . . . 14,303 12,840 12 11 .39Newark city . . . . . . . . . . . . . . . . . . . . . . . . 31,454 28,547 13 10 .18Bear CDP . . . . . . . . . . . . . . . . . . . . . . . . . 19,371 17,593 14 10 .11New Castle city . . . . . . . . . . . . . . . . . . . . . 5,285 4,862 15 8 .70Elsmere town . . . . . . . . . . . . . . . . . . . . . . . 6,131 5,800 16 5 .71Hockessin CDP . . . . . . . . . . . . . . . . . . . . . 13,527 12,902 17 4 .84Seaford city . . . . . . . . . . . . . . . . . . . . . . . . 6,928 6,699 18 3 .42Highland Acres CDP . . . . . . . . . . . . . . . . . 3,459 r 3,388 19 2 .10Dover Base Housing CDP . . . . . . . . . . . . . 3,450 3,394 20 1 .65
Laurel town . . . . . . . . . . . . . . . . . . . . . . . . 3,708 3,668 21 1 .09Wilmington city . . . . . . . . . . . . . . . . . . . . . 70,851 72,664 22 –2 .50Brookside CDP . . . . . . . . . . . . . . . . . . . . . 14,353 14,806 23 –3 .06North Star CDP . . . . . . . . . . . . . . . . . . . . . 7,980 8,277 24 –3 .59Wilmington Manor CDP . . . . . . . . . . . . . . . 7,889 8,262 25 –4 .51Edgemoor CDP . . . . . . . . . . . . . . . . . . . . . 5,677 5,992 26 –5 .26Lewes city . . . . . . . . . . . . . . . . . . . . . . . . . 2,747 2,932 27 –6 .31Claymont CDP . . . . . . . . . . . . . . . . . . . . . . 8,253 9,220 28 –10 .49Pike Creek CDP . . . . . . . . . . . . . . . . . . . . 7,898 19,751 29 –60 .01Pike Creek Valley CDP . . . . . . . . . . . . . . . 11,217 (X) (X) (X)
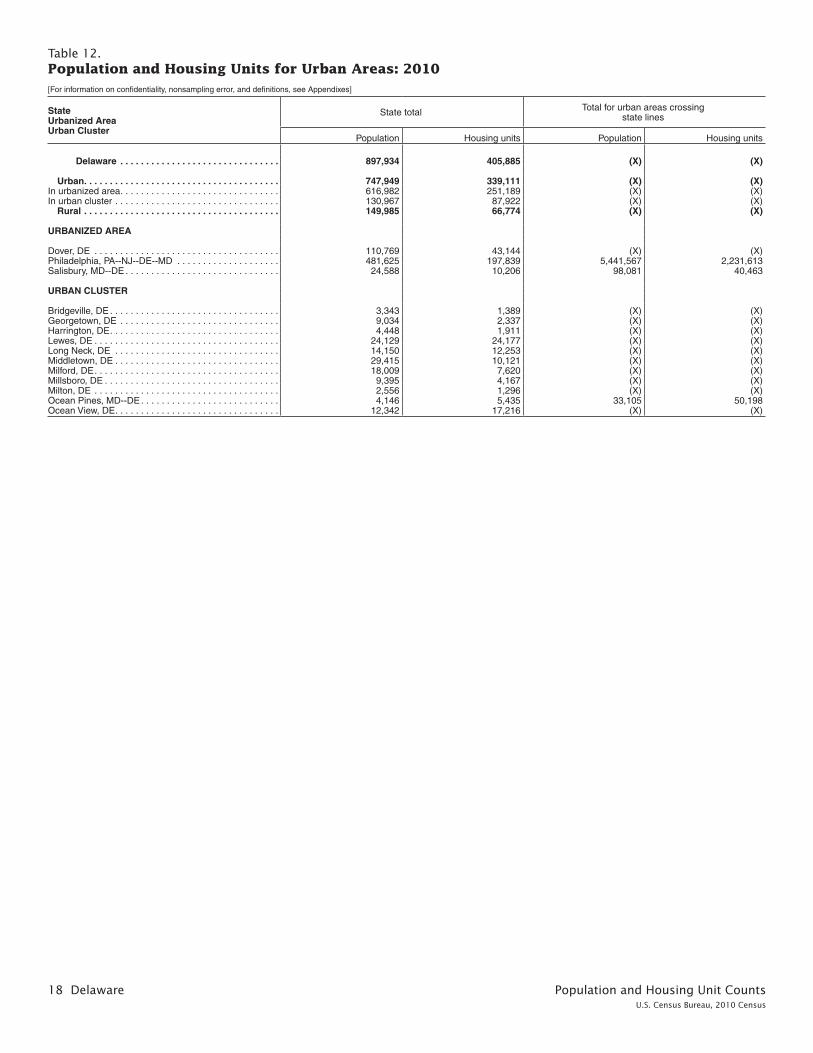
18 Delaware Population and Housing Unit CountsU.S. Census Bureau, 2010 Census
Table 12. Population and Housing Units for Urban Areas: 2010[For information on confidentiality, nonsampling error, and definitions, see Appendixes]
StateUrbanized AreaUrban Cluster
State total Total for urban areas crossing state lines
Population Housing units Population Housing units
Delaware . . . . . . . . . . . . . . . . . . . . . . . . . . . . . . . 897,934 405,885 (X) (X)
Urban . . . . . . . . . . . . . . . . . . . . . . . . . . . . . . . . . . . . . . 747,949 339,111 (X) (X)In urbanized area . . . . . . . . . . . . . . . . . . . . . . . . . . . . . . . 616,982 251,189 (X) (X)In urban cluster . . . . . . . . . . . . . . . . . . . . . . . . . . . . . . . . 130,967 87,922 (X) (X) Rural . . . . . . . . . . . . . . . . . . . . . . . . . . . . . . . . . . . . . . 149,985 66,774 (X) (X)
URBANIZED AREA
Dover, DE . . . . . . . . . . . . . . . . . . . . . . . . . . . . . . . . . . . . 110,769 43,144 (X) (X)Philadelphia, PA--NJ--DE--MD . . . . . . . . . . . . . . . . . . . . 481,625 197,839 5,441,567 2,231,613Salisbury, MD--DE . . . . . . . . . . . . . . . . . . . . . . . . . . . . . . 24,588 10,206 98,081 40,463
URBAN CLUSTER
Bridgeville, DE . . . . . . . . . . . . . . . . . . . . . . . . . . . . . . . . . 3,343 1,389 (X) (X)Georgetown, DE . . . . . . . . . . . . . . . . . . . . . . . . . . . . . . . 9,034 2,337 (X) (X)Harrington, DE . . . . . . . . . . . . . . . . . . . . . . . . . . . . . . . . . 4,448 1,911 (X) (X)Lewes, DE . . . . . . . . . . . . . . . . . . . . . . . . . . . . . . . . . . . . 24,129 24,177 (X) (X)Long Neck, DE . . . . . . . . . . . . . . . . . . . . . . . . . . . . . . . . 14,150 12,253 (X) (X)Middletown, DE . . . . . . . . . . . . . . . . . . . . . . . . . . . . . . . . 29,415 10,121 (X) (X)Milford, DE . . . . . . . . . . . . . . . . . . . . . . . . . . . . . . . . . . . . 18,009 7,620 (X) (X)Millsboro, DE . . . . . . . . . . . . . . . . . . . . . . . . . . . . . . . . . . 9,395 4,167 (X) (X)Milton, DE . . . . . . . . . . . . . . . . . . . . . . . . . . . . . . . . . . . . 2,556 1,296 (X) (X)Ocean Pines, MD--DE . . . . . . . . . . . . . . . . . . . . . . . . . . . 4,146 5,435 33,105 50,198Ocean View, DE . . . . . . . . . . . . . . . . . . . . . . . . . . . . . . . . 12,342 17,216 (X) (X)
Appendixes U.S. Census Bureau, 2010 Census
Appendixes
Several appendixes traditionally found in printed reports are now available in a separate volume. For thefollowing, see CPH-2-A, Population and Housing Unit Counts, Selected Appendixes, in print or on the Internet at <www.census.gov/prod/cen2010/cph-2-a.pdf> :
Appendix A. Geographic Terms and ConceptsAppendix B. Definitions of Subject CharacteristicsAppendix C. Data Collection and Processing ProceduresAppendix D. QuestionnaireAppendix F. Operational Overview and Accuracy of the DataAppendix G. Residence Rule and Residence Situations for the 2010 Census of the United StatesAppendix H. Acknowledgments
This Appendix section contains:
Appendix E. Maps


Maps Delaware E-1U.S. Census Bureau, 2010 Census
Appendix E. Maps
KENT
NEW CASTLE
SUSSEX
NEW JERSEY
PENNSYLVANIA
MARYLAND
75°
75°
76°
76°
39° 39°
Counties
0 4 8 12 Kilometers
0 4 8 12 Miles
LEGENDMARYLAND State
ShorelineNote: All boundaries and names are as of January 1, 2010.
KENT County
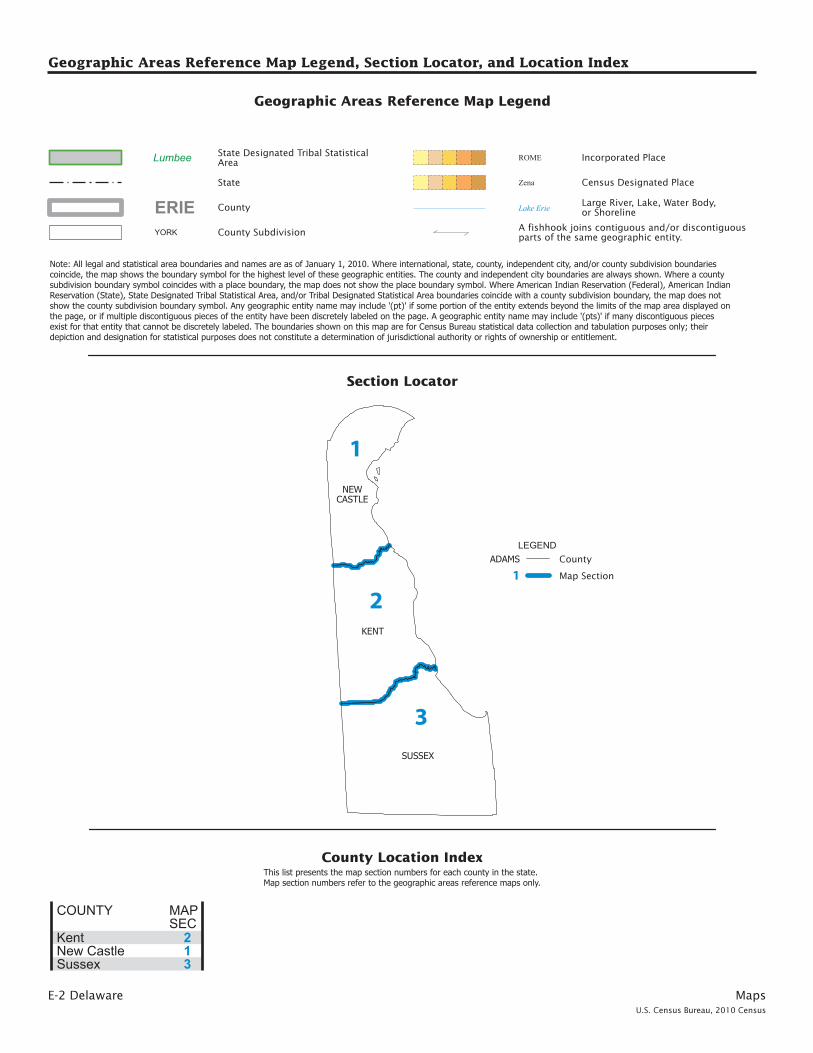
E-2 Delaware MapsU.S. Census Bureau, 2010 Census
Geographic Areas Reference Map Legend, Section Locator, and Location Index
3
2
1
SUSSEX
KENT
NEWCASTLE
Geographic Areas Reference Map Legend
Census Designated Place
Large River, Lake, Water Body,or Shoreline
Zena
Lake Erie
Note: All legal and statistical area boundaries and names are as of January 1, 2010. Where international, state, county, independent city, and/or county subdivision boundariescoincide, the map shows the boundary symbol for the highest level of these geographic entities. The county and independent city boundaries are always shown. Where a countysubdivision boundary symbol coincides with a place boundary, the map does not show the place boundary symbol. Where American Indian Reservation (Federal), American IndianReservation (State), State Designated Tribal Statistical Area, and/or Tribal Designated Statistical Area boundaries coincide with a county subdivision boundary, the map does notshow the county subdivision boundary symbol. Any geographic entity name may include ’(pt)’ if some portion of the entity extends beyond the limits of the map area displayed onthe page, or if multiple discontiguous pieces of the entity have been discretely labeled on the page. A geographic entity name may include ’(pts)’ if many discontiguous piecesexist for that entity that cannot be discretely labeled. The boundaries shown on this map are for Census Bureau statistical data collection and tabulation purposes only; theirdepiction and designation for statistical purposes does not constitute a determination of jurisdictional authority or rights of ownership or entitlement.
Section Locator
A fishhook joins contiguous and/or discontiguousparts of the same geographic entity.
LEGENDADAMS County
1 Map Section
State
Incorporated PlaceROME
YORK County Subdivision
CountyERIE
State Designated Tribal StatisticalAreaLumbee
COUNTY MAPSEC
KentNew CastleSussex
213
County Location IndexThis list presents the map section numbers for each county in the state.Map section numbers refer to the geographic areas reference maps only.
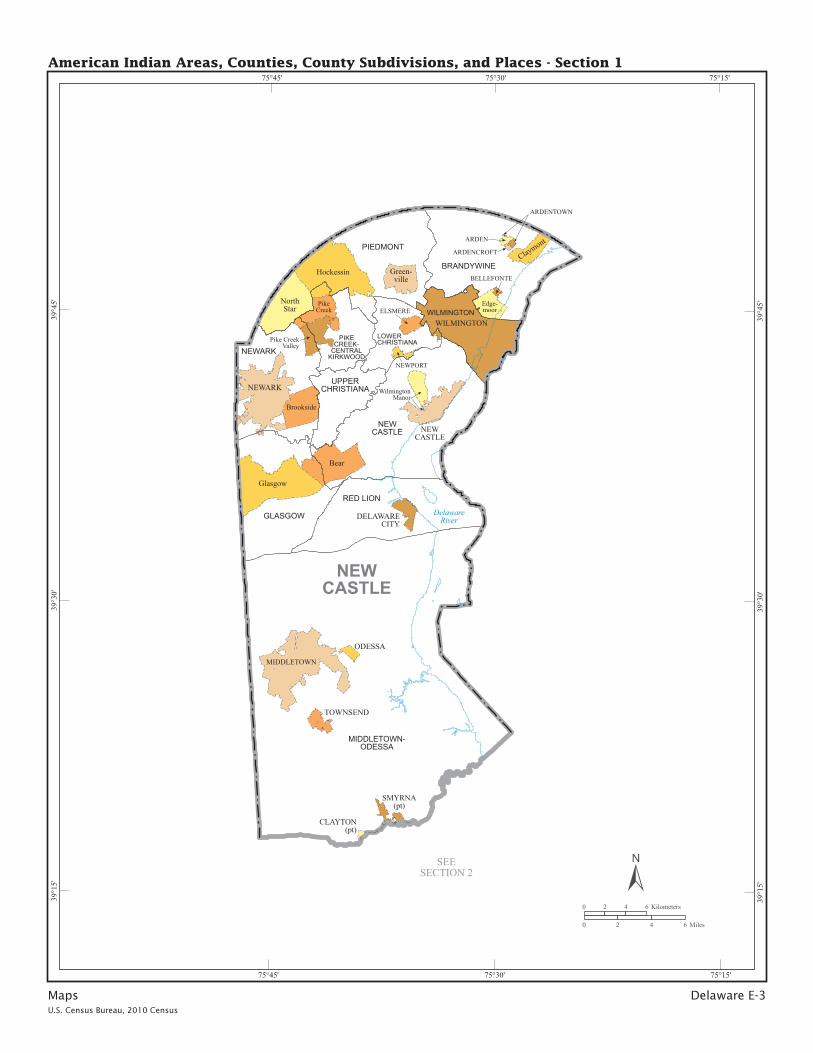
Maps Delaware E-3U.S. Census Bureau, 2010 Census
NEWCASTLE
CLAYTON(pt)
DELAWARECITY
ELSMERE
MIDDLETOWN
NEWARK
NEWCASTLE
NEWPORT
ODESSA
SMYRNA(pt)
TOWNSEND
WILMINGTON
ARDEN
ARDENCROFT
ARDENTOWN
BELLEFONTE
WilmingtonManor
Bear
Brookside
Claymont
Edge-moor
Glasgow
Green-ville
Hockessin
NorthStar
PikeCreek
Pike CreekValley
BRANDYWINE
GLASGOW
LOWERCHRISTIANA
MIDDLETOWN-ODESSA
NEWARK
NEWCASTLE
PIEDMONT
PIKECREEK-
CENTRALKIRKWOOD
RED LION
UPPERCHRISTIANA
WILMINGTON
SEESECTION 2
DelawareRiver
75°15’
75°15’
75°30’
75°30’
75°45’
75°45’
39°4
5’
39°4
5’
39°3
0’
39°3
0’
39°1
5’
39°1
5’
American Indian Areas, Counties, County Subdivisions, and Places - Section 1
0 2 4 6 Kilometers
0 2 4 6 Miles

E-4 Delaware MapsU.S. Census Bureau, 2010 Census
KENT
1
2
KEY
1 Kent Acres2 Highland Acres
KENT
CHESWOLD
CLAYTON(pt)
DOVER
FARMINGTON
FELTONFREDERICA
HARRINGTON
HARTLY
HOUSTON
KENTONLEIPSIC
LITTLECREEK
MAGNOLIA
MILFORD(pt)
SMYRNA(pt)
VIOLA
WOODSIDE
WYOMING
BOWERS
CAMDEN
WoodsideEast
Dover BaseHousing
Rising Sun-Lebanon
Riverview
Rodney Village
Lenape Indian Tribeof Delaware (pts)
CENTRALKENT
DOVER
FELTON
HARRINGTON
KENTON
MILFORDNORTH
SMYRNA
SEESECTION 1
SEESECTION 3
Delaware Bay
75°15’
75°15’
75°30’
75°30’
75°45’
75°45’
39°1
5’
39°1
5’
39°
39°
38°4
5’
38°4
5’
American Indian Areas, Counties, County Subdivisions, and Places - Section 2
0 2 4 6 Kilometers
0 2 4 6 Miles
SUSS
EX
Del
awar
e Ba
y
DA
GSB
OR
O
DEL
MA
R
DEW
EYB
EAC
H
ELLE
ND
ALE
FEN
WIC
KIS
LAN
D
FRA
NK
FOR
D
GEO
RG
ETO
WN
GR
EEN
WO
OD
HEN
LOPE
NA
CR
ES
LAU
REL
LEW
ES
MIL
FOR
D(p
t)
MIL
LSB
OR
O
MIL
LVIL
LE
MIL
TON
OC
EAN
VIE
W
REH
OB
OTH
BEA
CH
SEA
FOR
D
SELB
YV
ILLE
SLA
UG
HTE
RB
EAC
H
SOU
THB
ETH
AN
Y
BET
HA
NY
BEA
CH
BET
HEL
BLA
DES
BR
IDG
EVIL
LE
Long
Nec
k
Nanticoke
Indian
Tribe
BR
IDG
EV
ILLE
-GR
EE
NW
OO
D
GE
OR
GE
TOW
N
LAU
RE
L-D
ELM
AR
LEW
ES
MIL
FOR
D S
OU
TH
MIL
LSB
OR
O
MIL
TON
SE
AFO
RD
SE
LBY
VIL
LE-F
RA
NK
FOR
D
SEE
SEC
TIO
N 2
Atla
ntic
Oce
an
Littl
eAs
saw
oman Ba
yReho
both
Bay
American Indian Areas, Counties, County Subdivisions, and Places - Section 3
75°1
5’
75°1
5’
75°3
0’
75°3
0’
75°
75°
75°4
5’
75°4
5’
39°
39°
38°45’
38°45’
38°30’
38°30’
02
46
Kilo
met
ers
02
46
Mile
s
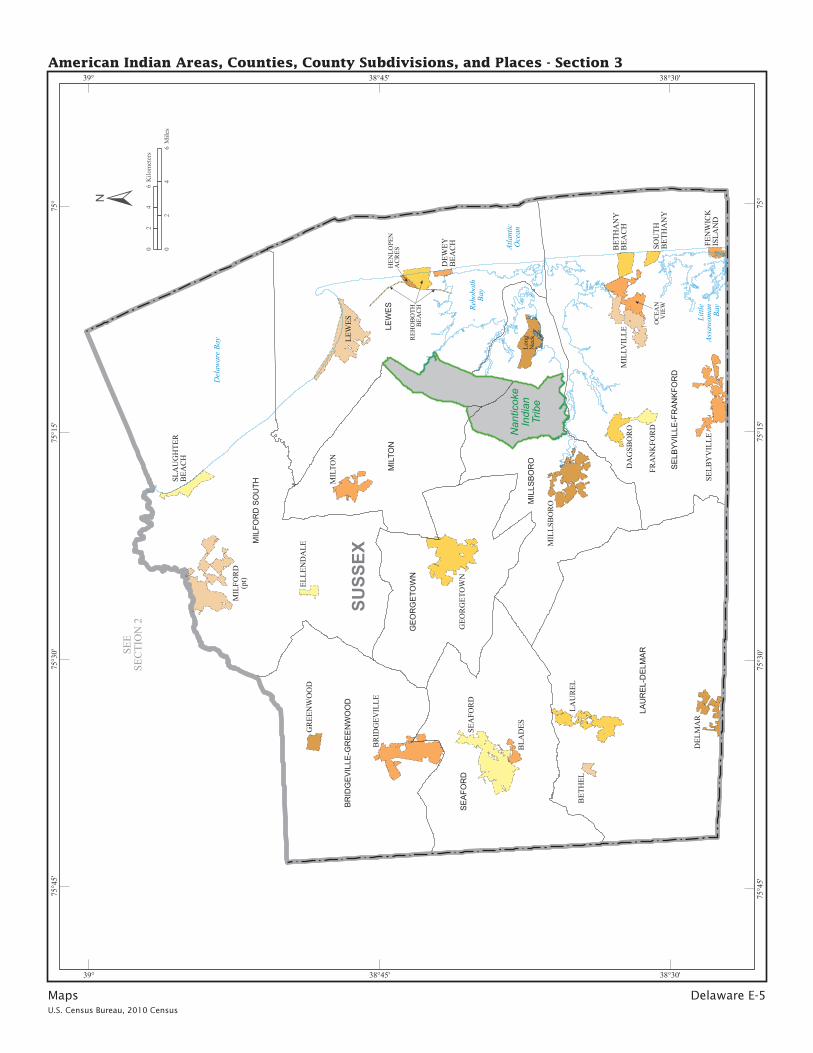
Maps Delaware E-5U.S. Census Bureau, 2010 Census
SUSS
EX
Del
awar
e Ba
y
DA
GSB
OR
O
DEL
MA
R
DEW
EYB
EAC
H
ELLE
ND
ALE
FEN
WIC
KIS
LAN
D
FRA
NK
FOR
D
GEO
RG
ETO
WN
GR
EEN
WO
OD
HEN
LOPE
NA
CR
ES
LAU
REL
LEW
ES
MIL
FOR
D(p
t)
MIL
LSB
OR
O
MIL
LVIL
LE
MIL
TON
OC
EAN
VIE
W
REH
OB
OTH
BEA
CH
SEA
FOR
D
SELB
YV
ILLE
SLA
UG
HTE
RB
EAC
H
SOU
THB
ETH
AN
Y
BET
HA
NY
BEA
CH
BET
HEL
BLA
DES
BR
IDG
EVIL
LE
Long
Nec
k
Nanticoke
Indian
Tribe
BR
IDG
EV
ILLE
-GR
EE
NW
OO
D
GE
OR
GE
TOW
N
LAU
RE
L-D
ELM
AR
LEW
ES
MIL
FOR
D S
OU
TH
MIL
LSB
OR
O
MIL
TON
SE
AFO
RD
SE
LBY
VIL
LE-F
RA
NK
FOR
D
SEE
SEC
TIO
N 2
Atla
ntic
Oce
an
Littl
eAs
saw
oman Ba
yReho
both
Bay
American Indian Areas, Counties, County Subdivisions, and Places - Section 3
75°1
5’
75°1
5’
75°3
0’
75°3
0’
75°
75°
75°4
5’
75°4
5’
39°
39°
38°45’
38°45’
38°30’
38°30’
02
46
Kilo
met
ers
02
46
Mile
s

E-6 Delaware MapsU.S. Census Bureau, 2010 Census
Wilmington
CECIL SALEM
Dover
Seaford
Wilmington
CHESTER(PART)
DELAWARE(PART)
GLOUCESTER
CAMDEN(PART)
BURLINGTON(PART)
Philadelphia
KENT
NEW CASTLE
SUSSEX
NEW JERSEY
PENNSYLVANIA
MARYLAND
Seaford
DOVER
PHILADELPHIA-CAMDEN-
WILMINGTON(PART)
Philadelphia-Camden-Vineland
(Part)
75°
75°
76°
76°
39° 39°
Core Based Statistical Areas, Counties, and Principal Cities
0 3 6 9 Kilometers
0 3 6 9 Miles
CBSA boundaries and names are as of December 2009. All other boundaries and names are as of January 1, 2010.
Shoreline
LEGENDPhiladelphia-Camden-
Vineland Combined Statistical Area
Seaford Micropolitan Statistical Area
MARYLAND StateNEW CASTLE County
DOVER Metropolitan Statistical Area
Metropolitan DivisionWilmington
Dover Principal CityState capital underlined
County outside Delaware
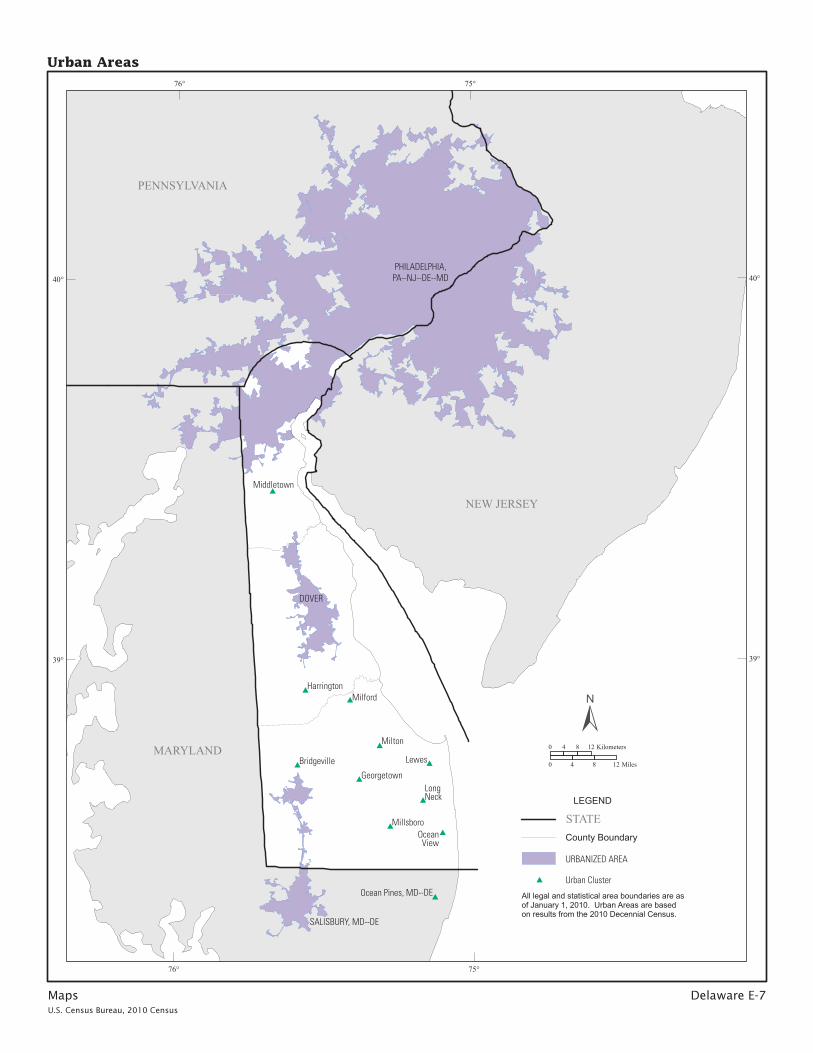
Maps Delaware E-7U.S. Census Bureau, 2010 Census
#
#
#
#
#
#
#
#
#
##
MARYLAND
NEW JERSEY
PENNSYLVANIA
Bridgeville
Georgetown
Harrington
Lewes
LongNeck
Middletown
Milford
Milton
Ocean Pines, MD--DE
OceanView
Millsboro
DOVER
PHILADELPHIA,PA--NJ--DE--MD
SALISBURY, MD--DE
75°
75°
76°
76°
40° 40°
39° 39°
Urban Areas
±0 4 8 12 Kilometers
0 4 8 12 Miles
LEGEND
All legal and statistical area boundaries are asof January 1, 2010. Urban Areas are based on results from the 2010 Decennial Census.
STATECounty Boundary
# Urban Cluster
URBANIZED AREA