characteristics of low performing special … report 60 characteristics of low performing special...
TRANSCRIPT

Technical Report 60
Characteristics of Low Performing Special Education and Non-special Education Students on Large-scale Assessments
N A T I O N A L
C E N T E R O N
E D U C AT I O N A L
O U T C O M E S
In collaboration with:Council of Chief State School Officers (CCSSO)
National Association of State Directors of Special Education (NASDSE)
Supported by:U.S. Office of Special Education Programs

Technical Report 60
Characteristics of Low Performing Special Education and Non-special Education Students on Large-scale Assessments
Yi-Chen Wu • Kristin K. Liu • Martha L. Thurlow • Sheryl S. Lazarus • Jason Altman • Elizabeth Christian
March 2012
All rights reserved. Any or all portions of this document may be reproduced and distributed without prior permission, provided the source is cited as:
Wu, Y. C., Liu, K. K. , Thurlow, M. L., Lazarus, S. S., Altman, J., & Christian, E. (2012). Characteristics of low performing special education and non-special education students on large-scale assessments (Technical Report 60). Minneapolis, MN: University of Minnesota, National Center on Educational Outcomes.
N A T I O N A L
C E N T E R O N
E D U C AT I O N A L
O U T C O M E S
The Center is supported through a Cooperative Agreement (#H326G050007) with the Research to Practice Division, Office of Special Education Pro-grams, U.S. Department of Education. The Center is affiliated with the Institute on Community Integration at the College of Education and Human Development, University of Minnesota. This report was funded with partial support from the Multi-state GSEG Toward a Defensible AA-MAS. This project is supported by General Supervision Enhance-ment Grants (#H373X070021) from the Research to Practice Division, Office of Special Education Programs, U.S. Department of Education. Opinions expressed herein do not necessarily reflect those of the U.S. Department of Education or Offices within it.
NCEO Core Staff
Martha L. Thurlow, DirectorDeb A. AlbusManuel T. BarreraLaurene L. ChristensenKamarrie DavisLinda GoldstoneJames HattenChristopher J. JohnstoneJane L. Krentz
Sheryl S. LazarusKristi K. LiuRoss E. MoenMichael L. MooreRachel F. QuenemoenRebekah RiekeChristopher RogersMiong VangYi-Chen Wu
National Center on Educational OutcomesUniversity of Minnesota • 207 Pattee Hall150 Pillsbury Dr. SE • Minneapolis, MN 55455Phone 612/624-8561 • Fax 612/624-0879http://www.nceo.info
The University of Minnesota shall provide equal access to and opportunity in its programs, facilities, and employment without regard to race, color, creed, religion, national origin, gender, age, marital status, disability, public assistance status, veteran status, sexual orientation, gender identity, or gender expression.
This document is available in alternative formats upon request.

Executive Summary
Federal legislation requires that all students participate in state assessments for accountability purposes. Most students with disabilities participate in the general assessment, with or without accommodations. Several states offer an additional assessment option for students with disabili-ties—the alternate assessment based on modified achievement standards (AA-MAS). In order to take the AA-MAS, students must have an Individualized Education Program (IEP) containing goals aligned with grade level content. Students must also be able to make significant progress, but not be expected to reach grade-level proficiency in the year covered by their IEP.
States that choose to offer an AA-MAS must also develop participation guidelines (subject to federal approval) that IEP teams can use to determine which special education students may participate in the assessment. Previous NCEO reports have demonstrated that the participation guidelines outlined by states with an AA-MAS assessment option differ. Many states target stu-dents with disabilities who score at the lowest levels on the regular state assessment as potential AA-MAS participants. Researchers who have examined the characteristics of low-performing students have concluded that low performing students are more often male, from racial or ethnic minority groups, receiving free or reduced price lunch, and receiving special education services. However, many students with low scores on standards-based assessments do not have disabilities.
The purpose of the current report is to investigate whether the characteristics of the lowest per-forming students in special education differ from the characteristics of the lowest performing students who are not in special education. The investigation in this report used data from low performing students in four states: Alabama, Hawaii, South Dakota, and Wisconsin. Achieve-ment data were disaggregated by three demographic characteristics (gender, race/ethnicity, and income status) for students taking the reading or mathematics assessments in fifth or eighth grade. In addition, we tracked data for each student over three years to identify how students moved in and out of the low performing category (low performing was defined as the tenth percentile and below for this report) across time.
Results revealed that the demographic characteristics of students who performed at the lowest levels on the state assessment over several years were similar regardless of whether students received special education services. In both groups, the lowest performers were more likely to be students of racial or ethnic minority, and students from low-income backgrounds. However, students receiving special education services were more likely than their non-special education peers to score below the 10th percentile for several years in a row. Among students receiving special education, those from racial/ethnic minority backgrounds and low-income families were more likely than their peers to score at the lowest levels on state assessments for several consecu-tive years. These results suggest widespread issues with low achievement in minority and low income groups that states must address when assessing students for accountability purposes.

Table of Contents
Executive Summary ................................................................................................................ iii
Table of Contents ......................................................................................................................v
Overview ...................................................................................................................................1
Related Research .......................................................................................................................2
Method ......................................................................................................................................4
Procedures ..........................................................................................................................4
Analyses ............................................................................................................................5
Participants ........................................................................................................................5
Results .......................................................................................................................................6
Research Question 1 ..........................................................................................................6
Research Question 2 ........................................................................................................21
Research Question 3 ........................................................................................................29
Discussion and Conclusions ...................................................................................................33
References ...............................................................................................................................37
Appendix A .............................................................................................................................41
Appendix B .............................................................................................................................55
Appendix C .............................................................................................................................57


1NCEO
Overview
Federal laws require states to include all students, including students in special education, in state assessments used for accountability purposes. Most students with disabilities participate in the general assessment, with or without accommodations (Altman, Thurlow, & Vang, 2010). Students with significant cognitive disabilities may participate in alternate assessments based on alternate achievement standards (AA-AAS) (Quenemoen, 2008). Several states offer an ad-ditional assessment option—alternate assessments based on modified achievement standards (AA-MAS) (Albus, Lazarus, Thurlow, & Cormier, 2009; Cortiella, 2007; U.S. Department of Education, 2007).
According to federal regulations, students who participate in an AA-MAS must have an In-dividualized Education Program (IEP). They also must be able to make significant progress, but not be expected to reach grade-level proficiency within the year covered by their IEP. The regulations require that students who participate in an AA-MAS have access to grade level content and they may be from any disability category (U.S. Department of Education, 2007). The AA-MAS is an optional assessment and many states do not offer it.
Federal regulations require states that offer an AA-MAS to develop participation guidelines (sub-ject to federal approval) that IEP teams can use to determine which special education students may participate in this option. Research has shown that state participation policies differ, and that most states include previous poor performance on state assessments or multiple measures in their participation guidelines for AA-MAS (Lazarus, Hodgson, Price, & Thurlow, 2011).
In an effort to identify who might be potential AA-MAS participants if they were selected from among the lowest performing students, we embarked on a detailed longitudinal analysis of four states’ assessment data. The analysis used three years of demographic and performance data. The four states—Alabama, Hawaii, South Dakota, and Wisconsin—are all members of a state consortium that studies ways to identify students who are eligible for an AA-MAS. Some of the analyses shown in this report were included in a previous NCEO Brief (Lazarus, Wu, Altman, & Thurlow, 2010). However, that brief examined the characteristics of all low performing stu-dents. It did not disaggregate the data reported to show the characteristics of special education students who may be eligible to take an AA-MAS.
This report examines the characteristics of low performing special education students. This approach is consistent with federal regulations which indicate that students must have an IEP to be eligible to take the AA-MAS. To provide additional context, we compared the data on low performing special education students to those of low performing non-special education students. For this analysis, low performing (LP) students were defined as students who scored at the 10th percentile or below on the statewide assessment in any one of the three years of

2 NCEO
data we examined. Students who scored at the 10th percentile or below for all three years were identified as persistently low performing (PLP) students. Three research questions guide the investigations presented in this report:
1. Are the demographic characteristics of persistently low performing special education stu-dents different from the characteristics of persistently low performing students who are not in special education?
2. Are special education students who were low performing in the first year more or less likely to move out of the low performing group than non-special education students? Is there any variation in movement by content area (reading vs. math)?
3. Are low performing special education students in some demographic subgroups more or less likely to move out of the low performing group than their low performing peers who are not in special education?
Related Research
Since the AA-MAS assessment option was made available to states in 2007, several studies have been conducted to identify the population of students who might qualify to take the AA-MAS. States have found this to be a difficult task because many students with low scores on standards-based assessments do not have identified disabilities (Lazarus & Quenemoen, 2011; Marion, Gong, & Simpson, 2006).
Some of the earliest research on the characteristics of low-performing students was conducted in Colorado. In an effort to learn more about the characteristics of students “in the gap,” a study committee in Colorado conducted research focusing on students with IEPs who scored at the lowest levels on the general state assessment, but who were not eligible for the state’s alternate assessment for students with significant cognitive disabilities (HB 05-1246 Study Committee, 2005). The study committee found that students “in the gap” were more often American Indian, African American, or Hispanic than “non-gap” students. Male students outnumbered female students “in the gap” by nearly two to one. The committee noted that there was a small percent-age of students who scored at the lowest levels on the state assessment, and did not have an IEP. However, these students were mentioned only briefly in the report and their demographic characteristics were not examined.
The characteristics of low-performing students have been studied in other states as well. Hess, McDivitt, and Fincher (2008) examined research conducted in Georgia on the characteristics of students who might qualify for an AA-MAS. In examining the population of students within the state who were “persistently low performing” (defined as those students scoring at the low-

3NCEO
est performance level on the regular state assessment for three consecutive years), it was found that these students were more often African American, male, receiving free and reduced lunch, and often had an IEP and/or mild intellectual disabilities.
Research on the characteristics of low performers in the New England Compact states included teacher judgments about this population. It was found that though the group of lowest performers included students with and without disabilities, more than half of the group had IEPs. Addition-ally, students who performed poorly on standardized tests but received higher teacher judgments were far less likely to have an IEP (Bechard & Godin, 2007). Lazarus and Quenemoen (2011) concluded that the results of these related studies (e.g., Colorado, Georgia, New England Com-pact states) indicate that the lowest performing students are often from historically underserved populations such as students of ethnic minority background, students of low socioeconomic status, or students in special education.
The Center on Education Policy has issued a series of reports in which they investigated achievement differences among subgroups on state tests. The multi-state results have shown that females tend to outperform males in reading and that the gap is not narrowing (Chudowsky & Chudowsky, 2010). Additional analyses focused on differences between the performance of students from different racial/ethnic backgrounds, students with low socio-economic status (Chudowsky, Chudowsky & Kober, 2009), and students in special education (Chudowsky & Chudowsky, 2009). Performance gains were seen in each of these subgroups at all achievement levels. Achievement gaps narrowed for Latino and African American students to a greater extent than for students from other racial/ethnic groups (Kober, Chudowsky, & Chudowsky, 2010). The authors note that test data for students in special education were imprecise, so interpreta-tions of these data provided only a rough indicator of the achievement trends of these students. Notably, none of these analyses examined students with more than one of these characteristics (e.g., low-income students in special education).
A number of National Center on Educational Outcomes (NCEO) investigations of assessment data reported on state websites showed that students in special education score proficient at different rates across states and that achievement gaps between this population and students without disabilities also vary extensively between states (Albus, Thurlow, & Bremer, 2009; Thurlow, Bremer, & Albus, 2008; VanGetson & Thurlow, 2007). Also, an analysis of assess-ment performance of students in special education within states compared to the state targets for this subgroup showed that states were making gains but were challenged to keep up with the ambitious targets that they had set (Altman, Rogers, Bremer, & Thurlow, 2010).
These findings raise the question of whether the characteristics of the lowest performing stu-dents in special education differ from the characteristics of the lowest performing non-special education students. This question will be investigated in depth in this report. This analysis is also

4 NCEO
distinctive in its investigation of the movement of students in various demographic subgroups across performance levels.
Method Procedures
Preparation of Data SetsThe data for the current study are based on students who took the regular statewide assessment in reading or mathematics and had valid scores for three consecutive years. In Alabama, Hawaii, and South Dakota, we selected students who were in grades 5 and 8 during the 2006-07 school year and then collected assessment data for these same students in the previous two years as well (2005-2006 and 2004-2005). In Wisconsin, we followed a similar procedure beginning with fifth and eighth graders in the 2007-2008 school year and following their scores backward for two years (2006-2007 and 2005-2006).
For each state, the older test scores were merged with the scores from the most recent year in order to examine student performance across time. Demographic information such as income-level, race/ethnicity, and gender were based on the characteristics in the most recent year of data.
Identifying Low-performing Students For the purposes of this report, we identified fifth and eighth grade low performing students whose scale score on state reading or math assessments was at or below the tenth percentile. To make this determination, we examined the cumulative frequency distributions of scale scores for reading and math tests in each year of the available data. Any student who had a score less than or equal to the 10% cut point was classified as low performing for that particular assess-ment and year. For three years, we tracked the performance of all students who were identified as low performing in the first year of our data set. (For a table comparing the cut scores across states, see Appendix A, Table A1). Students who were not identified as low performing in the first year of three years of data collection were excluded from this analysis.
Defining Variables and TermsAll of the analyses in this report compare low performing non-special education students to low-performing special education students to determine whether there are demographic and performance differences in low performing students between these two groups. We perform the same analyses at grades five and eight and for reading and math assessments.
States’ definitions of demographic variables vary considerably. In this report, we only selected the demographic variables available across most, or all, of the states. The research cited in the literature review section of this paper suggested that students who are low performing are more likely to be males, students of color, and low-income students (cf. HB 05-1246 Study Commit-

5NCEO
tee, 2005; Hess, McDivitt, & Fincher, 2008). For that reason we focused our analyses on these groups of students. For purposes of clarity we chose to use the terms “white” and “non-white” students for these analyses.
In other instances, we ran data using a variable from state databases as an indicator of a demo-graphic characteristic but we chose not to use the data variable name in our discussions of tables and figures. For example, we used the term “Free/Reduced Lunch,” representing students who are eligible for free or reduced price lunches at school, as indicator of students from low-income backgrounds. Our figures and tables present data for students who receive free or reduced lunch but our text explaining those figures refers to low-income students.
Identifying Movement CategoriesSome of the analyses in this document examine whether students identified as low performing in year one of our data set moved out of the low performing group in subsequent years. To clearly communicate the results of these movement analyses we use the term “initially low performing” to mean students who were in the bottom 10th percentile the first year of our analyses, but not in the second, or third years. We use the term “persistently low performing” (PLP) to indicate students who were in the bottom 10th percentile all three years of our analyses.
Analyses
Descriptive analyses were performed to explore the characteristics of low performing students in special education and not in special education. We performed crosstabs to provide the infor-mation by selected demographic variables, and performance groups at grades five and eight and for reading and math assessments.
Participants
Table 1 shows the total number of non-special education and special education students in each state who had three years of test results for reading and math assessments. The grade levels listed in the table are the grades students were in during the final year of analysis.
Of the four states in this study, Wisconsin had the largest number of students with three years of data. For example, for fifth grade reading 45,467 non-special education students and 6,383 special education students are included in this analysis. South Dakota had the fewest students with three years of data. Of the 5th graders, 6,916 non-special education students had three years of reading assessment scores and 1,014 special education students had three years of reading scores. In each of the four states, the number of students with three years of data for the reading assessment is slightly different from in the math assessment.

6 NCEO
Table 1. Number of Grade 5 and 8 Special Education and Non-Special Education Students with Three Years of Data on the State Reading and Math Assessments
Alabama Hawaii South Dakota Wisconsin
Grade Subject Non-SpEd SpEd Non-SpEd SpEd Non-SpEd SpEd Non-SpEd SpEd
5Reading 35706 3578 10377 1182 6916 1014 45467 6383
Math 35666 3579 10372 1179 6967 1028 45577 6551
8Reading 36410 3829 9954 1335 7793 893 48936 7140
Math 36335 3805 9950 1336 7794 893 48918 7155
Note: The numbers in this table are based on school years 2004-05 through 2006-07 for Alabama, Hawaii, and South Dakota. The data for Wisconsin is based on school years 2005-06 through 2007-08.
Results
Research Question 1: Are the demographic characteristics of persistently low performing special education students different from the characteristics of persistently low performing non-special education students?
As the discussion of Figures 1 through 12 will highlight, the demographic characteristics of persistently low performing students in these four states are more complex than previous re-search findings have suggested. Findings for gender are mixed and do not show a consistent pattern across tests, across the persistently low performing versus total population of students, or across special education and non-special education students. There is, however, a clear pattern of a greater percentage of non-white and low income students in the persistently low performing groups, regardless of whether those students are in special education or not. The tendency for the persistently low-performing group to have a higher percentage of non-white students is magnified in the non-special education group on both the reading and math assess-ments. Similarly, our findings suggest that the increased percentage of low income students is magnified in the persistently low-performing non-special education group compared to the special education group.
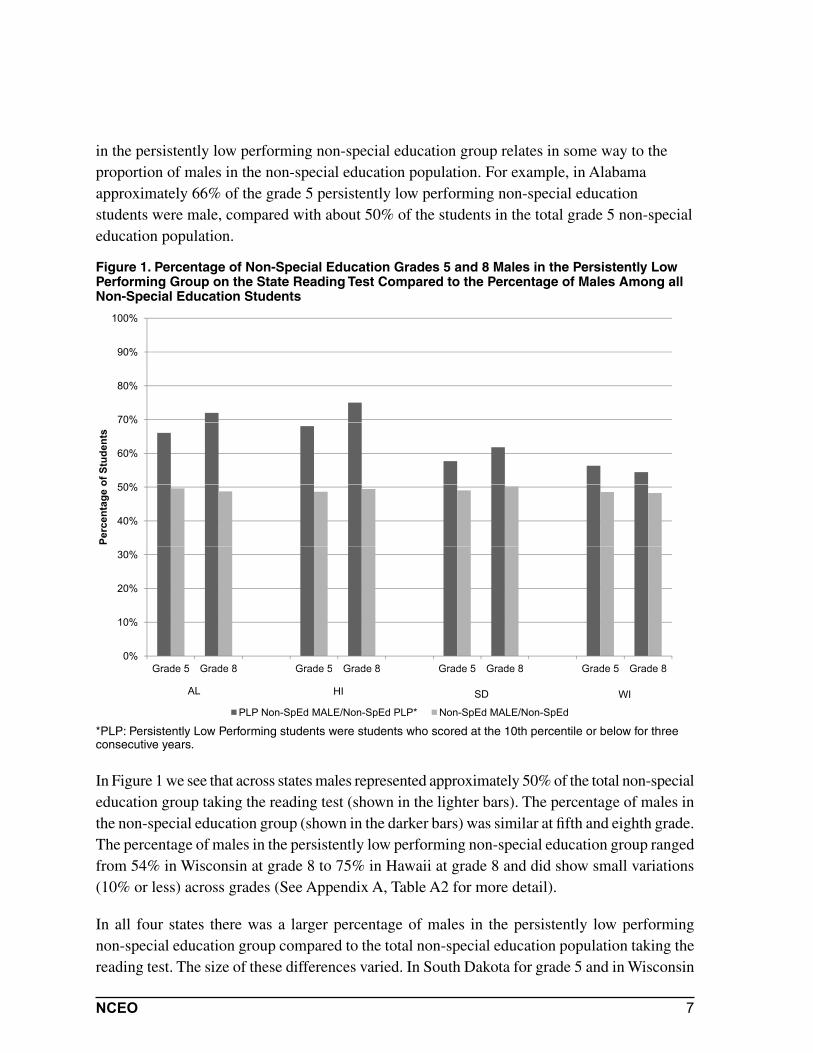
GenderReading. To answer our first research question, we began by examining the gender of persistently low performing students (i.e., below the 10th percentile for three consecutive years) in both non-special education and special education. Figure 1 shows the percentage of males in the persistently low performing non-special education population on the reading test at fifth and eighth grade compared to the percentage of males in the total non-special education population in those same grades (see Appendix A, Table A2 for more detail). Looking at the data in this way allows us to see whether the proportion of males
7NCEO
in the persistently low performing non-special education group relates in some way to the proportion of males in the non-special education population. For example, in Alabama approximately 66% of the grade 5 persistently low performing non-special education students were male, compared with about 50% of the students in the total grade 5 non-special education population.
Figure 1. Percentage of Non-Special Education Grades 5 and 8 Males in the Persistently Low Performing Group on the State Reading Test Compared to the Percentage of Males Among all Non-Special Education Students
*PLP: Persistently Low Performing students were students who scored at the 10th percentile or below for three consecutive years.
In Figure 1 we see that across states males represented approximately 50% of the total non-special education group taking the reading test (shown in the lighter bars). The percentage of males in the non-special education group (shown in the darker bars) was similar at fifth and eighth grade. The percentage of males in the persistently low performing non-special education group ranged from 54% in Wisconsin at grade 8 to 75% in Hawaii at grade 8 and did show small variations (10% or less) across grades (See Appendix A, Table A2 for more detail).
In all four states there was a larger percentage of males in the persistently low performing non-special education group compared to the total non-special education population taking the reading test. The size of these differences varied. In South Dakota for grade 5 and in Wisconsin
90%
100%
70%
80%
50%
60%
70%
of S
tude
nts
40%
50%
Perc
enta
geo
20%
30%
0%
10%
Grade 5 Grade 8 Grade 5 Grade 8 Grade 5 Grade 8 Grade 5 Grade 8Grade 5 Grade 8 Grade 5 Grade 8 Grade 5 Grade 8 Grade 5 Grade 8
PLP Non-SpEd MALE/Non-SpEd PLP* Non-SpEd MALE/Non-SpEd
AL HI SD WI

8 NCEO
at both grades, the size of the difference was small (10% or less). In South Dakota for grade 8, and in Alabama and Hawaii at both grades, the size of the difference was large (more than 10%).
Figure 2 presents similar data to Figure 1 for the special education students. This figure shows, for example, that in Alabama 72% of the grade 5 persistently low performing special education students (darker bar) was male, compared with about 65% of the students in the total grade 5 special education population (lighter bar).
Figure 2. Percentage of Special Education Grades 5 and 8 Males in the Persistently Low Performing Group on the State Reading Test Compared to the Percentage of Males Among all Special Education Students
*PLP: Persistently Low Performing students were students who scored at the 10th percentile or below for three consecutive years.
Figure 2 indicates that males represented more than half of the overall special education popula-tion taking the reading test at fifth and eighth grades (lighter bars). The percentage of males in the special education population ranged from a low of 65% for South Dakota eighth graders to a high of 72% for Hawaii fifth graders (see Appendix A, Table A3 for detail). The percentage of males in the total special education population was fairly similar at grades five and eight for each state with only small (10% or less) variations evident. The percentage of males in the subgroup of persistently low performing special education students (darker bars) ranged from a
90%
100%
70%
80%
50%
60%
70%
of S
tude
nts
40%
50%
Perc
enta
geo
20%
30%
0%
10%
Grade 5 Grade 8 Grade 5 Grade 8 Grade 5 Grade 8 Grade 5 Grade 8Grade 5 Grade 8 Grade 5 Grade 8 Grade 5 Grade 8 Grade 5 Grade 8
PLP SpEd MALE/SpEd PLP* SpEd MALE/SpEd
AL HI SD WI

9NCEO
low of 63% in South Dakota at both grades to a high of 78% in Hawaii at grade 8. This percent-age was similar at grades 5 and 8 with only small differences (10% or less).
The percentage of males varied in the persistently low performing special education student group (darker bars) compared to the total special education group (lighter bars). In two states, Alabama and Hawaii, there was a slightly higher percentage of males in the group of persistently low performing special education students than there was in the total group of special education students. In the other two states, South Dakota and Wisconsin, the percentage of males in the persistently low performing special education students was similar to the percentage of males in the total special education population. The size of these differences was small (10% or less) Math. Figures 3 and 4 examine mathematics data for the same states at the same grades. Figure 3 presents fifth and eighth grade non-special education data, while Figure 4 presents the special education data (see Appendix A, Tables A4 and A5 for more detail).
Figure 3 shows the percentage of males in the persistently low-performing non-special educa-tion population on the math test at fifth and eighth grade compared to the percentage of males in the total non-special education population in those same grades. For example, in Alabama approximately 50% of the students in the grade 5 non-special education group were male (shown by the lighter bar). In comparison, 54% of the grade 5 persistently low performing non-special education students (shown by the darker bar) were male.
Across the four states shown in Figure 3, males represented roughly half, 48% to 50%, of the fifth and eighth grade non-special education population taking the math test (lighter bars). In comparison, the percentage of males in the persistently low performing group of non-special education students (darker bars) ranged from a low of 41% in Wisconsin at both grades to a high of 62% in Hawaii at eighth grade. With the exception of Hawaii, the difference in the percent-age of males across grades within a group was typically small (10% or less). Hawaii showed a large difference (more than 10%) from grade 5 to grade 8 in the percentage of males in the persistently low performing non-special education group.
There was no consistent pattern when we compared the percentage of males in the persistently low performing non-special education population (darker bars) to the percentage of males in the total non-special education population (lighter bars). Two states, Alabama and South Dakota, had a greater percentage of males in the persistently low performing non-special education group than in the entire non-special education population. In contrast, Wisconsin had a smaller percentage of males in the persistently low performing population than in the total non-special education population. In the remaining state, Hawaii, the pattern differed across grades. At fifth grade, the percentage of males was slightly smaller in the persistently low performing group in Hawaii than it was in the total non-special education group. In contrast, at eighth grade the

10 NCEO
percentage of males in the non-special education persistently low performing group was 13% greater than the percentage in the total non-special education population. Other than in Hawaii at eighth grade, most states in Figure 3 did not show a large difference (i.e. greater than 10%) in the percentage of males across grades in the same group.
Figure 4 provides the percentage of males in the persistently low performing special education group on the math test and in the total special education group. The data in this figure indicate that more than half (65% to 72%) of all special education students taking the math test were male (lighter bars). Similarly, more than half (55% to 69%) of persistently low performing special education students (darker bars) were male. Except for in Wisconsin at grade 5, there did not appear to be a sizeable difference (larger than 10%) in the percentage of males in either group across grade levels.
Figure 3. Percentage of Grades 5 and 8 Males in the Non-Special Education Persistently Low Performing Group on the State Math Test Compared to the Percentage of Males Among Non-Special Education Students
*PLP: Persistently Low Performing students were students who scored at the 10th percentile or below for three consecutive years.
90%
100%
70%
80%
50%
60%
70%
of S
tude
nts
40%
50%
Perc
enta
geo
20%
30%
0%
10%
Grade 5 Grade 8 Grade 5 Grade 8 Grade 5 Grade 8 Grade 5 Grade 8Grade 5 Grade 8 Grade 5 Grade 8 Grade 5 Grade 8 Grade 5 Grade 8
PLP Non-SpEd MALE/Non-SpEd PLP* Non-SpEd MALE/Non-SpEd
AL HI SD WI

11NCEO
Figure 4. Percentage of Special Education Grades 5 and 8 Males in the Persistently Low Performing Group on the State Math Test Compared to the Percentage of Males Among all Special Education Students
*PLP: Persistently Low Performing students were students who scored at the 10th percentile or below for three consecutive years.
On the math tests the percentage of males in the persistently low performing special education group (darker bars) was either similar to, or smaller than, the percentage in the total special education population (lighter bars) on the math test. Alabama had roughly the same percentage of males in the two groups at each grade. In Wisconsin at grade 5 there was a large (greater than 10%) difference in the percentage of males in the two groups, with a smaller percentage in the persistently low performing special education group (55%) compared to the total population (67%). In the remaining states the difference in the percentage of males across groups within one grade level was small (10% or less).
Race/Ethnicity Reading. Another demographic variable that we examined was the race/ethnicity of persistently low performing students. The data in these figures are labeled “white” and “non-white students.” Figures five and six highlight these data from the reading assessments at
90%
100%
70%
80%
50%
60%
70%
of S
tude
nts
40%
50%
Perc
enta
geo
20%
30%
0%
10%
Grade 5 Grade 8 Grade 5 Grade 8 Grade 5 Grade 8 Grade 5 Grade 8Grade 5 Grade 8 Grade 5 Grade 8 Grade 5 Grade 8 Grade 5 Grade 8
PLP SpEd MALE/SpEd PLP* SpEd MALE/SpEd
AL HI SD WI

12 NCEO
grades 5 and 8. Figure 5 presents the non-special education data and Figure 6 presents the special education data (see Appendix A, Tables A6 and A7 for more detail).
Figure 5. Percentage of Non-Special Education Grades 5 and 8 Non-White Students in the Persistently Low Performing Group on the State Reading Test Compared to the Percentage of Non-White Students Among all Non-Special Education Students
*PLP: Persistently Low Performing students were students who scored at the 10th percentile or below for three consecutive years.
Figure 5 shows that there was a great deal of variability in the percentage of non-white stu-dents in both groups on the reading assessment. In the total non-special education group the percentage of students who were non-white ranged from a low of approximately 13% to 15% in South Dakota to a high of 87% to 88% in Hawaii (lighter bars). Differences across grades were minimal (10% or less). The range in the percentage of non-white students in the persistently low performing non-special education group was slightly smaller with a low of 52% non-white students at grade 5 in South Dakota to a high of 96% in Hawaii at both grades 5 and 8 (darker bars). There were some differences in the percentage of males across grades for this popula-tion, but the size of the differences varied from small (10% or less) in Alabama, Hawaii, and South Dakota, to large (greater than 10%) in Wisconsin. When examining Figure 5, we caution
90%
100%
70%
80%
50%
60%
70%
of S
tude
nts
40%
50%
Perc
enta
geo
20%
30%
0%
10%
Grade 5 Grade 8 Grade 5 Grade 8 Grade 5 Grade 8 Grade 5 Grade 8Grade 5 Grade 8 Grade 5 Grade 8 Grade 5 Grade 8 Grade 5 Grade 8
PLP Non-SpEd Non-White/Non-SpEd PLP* Non-SpEd Non-White/Non-SpEd
AL HI SD WI
13NCEO
the reader to keep in mind that small group sizes can affect the appearance of the magnitude of changes in student demographics.
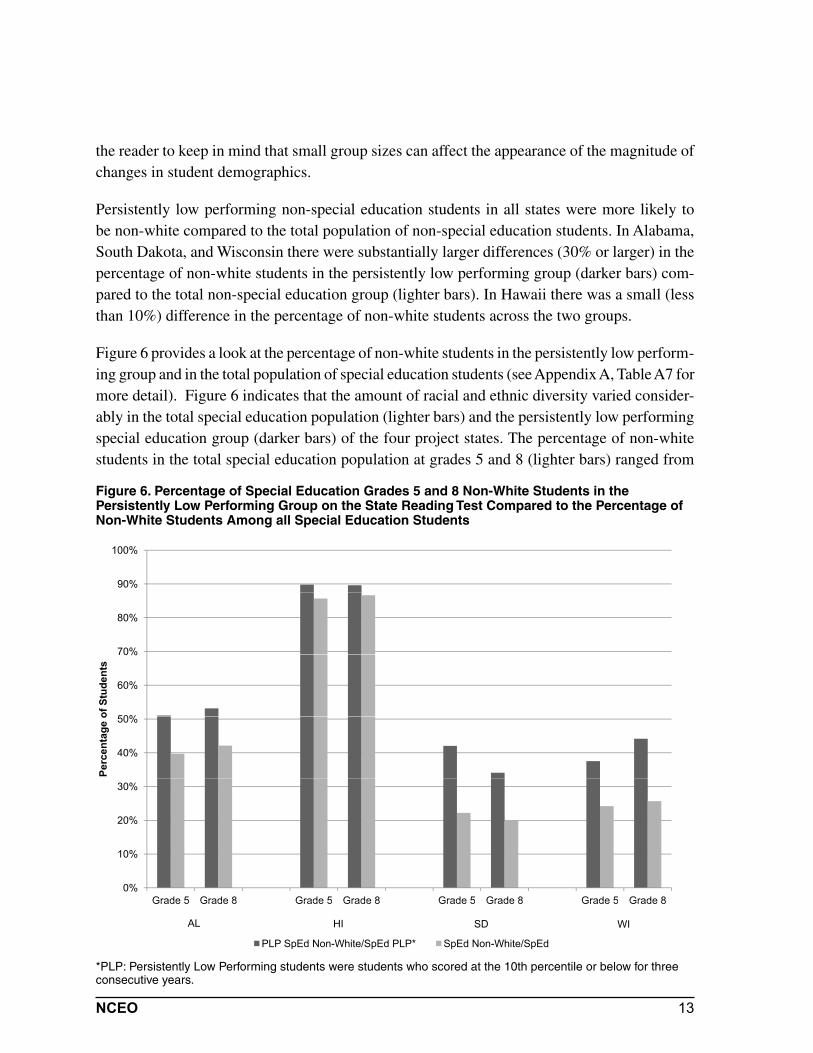
Persistently low performing non-special education students in all states were more likely to be non-white compared to the total population of non-special education students. In Alabama, South Dakota, and Wisconsin there were substantially larger differences (30% or larger) in the percentage of non-white students in the persistently low performing group (darker bars) com-pared to the total non-special education group (lighter bars). In Hawaii there was a small (less than 10%) difference in the percentage of non-white students across the two groups.
Figure 6 provides a look at the percentage of non-white students in the persistently low perform-ing group and in the total population of special education students (see Appendix A, Table A7 for more detail). Figure 6 indicates that the amount of racial and ethnic diversity varied consider-ably in the total special education population (lighter bars) and the persistently low performing special education group (darker bars) of the four project states. The percentage of non-white students in the total special education population at grades 5 and 8 (lighter bars) ranged from
Figure 6. Percentage of Special Education Grades 5 and 8 Non-White Students in the Persistently Low Performing Group on the State Reading Test Compared to the Percentage of Non-White Students Among all Special Education Students
*PLP: Persistently Low Performing students were students who scored at the 10th percentile or below for three consecutive years.
90%
100%
70%
80%
50%
60%
70%
of S
tude
nts
40%
50%
Perc
enta
geo
20%
30%
0%
10%
Grade 5 Grade 8 Grade 5 Grade 8 Grade 5 Grade 8 Grade 5 Grade 8Grade 5 Grade 8 Grade 5 Grade 8 Grade 5 Grade 8 Grade 5 Grade 8
PLP SpEd Non-White/SpEd PLP* SpEd Non-White/SpEd
AL HI SD WI

14 NCEO
roughly 20% in South Dakota at grade 8 to 87% in Hawaii. This range is similar to the range in the percentage of non-white non-special education students taking the reading test (See Figure 5). In the persistently low performing special education group (darker bars) the percentage of males ranged from 34% in South Dakota at grade 8 to 90% in Hawaii at grade 5.
Across states, the percentage of non-white students in the persistently low performing special education group was consistently higher than the percentage of non-white students in the total special education population. In some states such as Hawaii, the size of this difference was rela-tively small (less than 10%) and in others such as South Dakota it was relatively large (more than 10%). Again, we caution the reader to keep in mind that the size of the total student population and state demographics play a role in the size of this difference.
Comparing bars across grade levels, the percentages in Figure 6 do not highlight any sizeable differences (e.g., 10% or above) between fifth and eighth grade in the percentage of non-white students in the persistently low performing special education students on the state reading as-sessment.
Math. Figures 7 and 8 present similar data to Figures 5 and 6 but they show data for math instead of reading. Figure 7 includes the non-special education data and Figure 8 includes the special education data (see Appendix A, Tables A8 and A9 for more detail).
Figure 7 shows that there was a great deal of variability across states in the percentage of non-white students in the non-special education group taking the math test. The percentage of non-white students in the total non-special education population (lighter bars) ranged from a low of 13% to 15% in South Dakota to a high of 87% to 88% in Hawaii. The percentage of non-white students in the persistently low performing non-special education group (darker bars) ranged from 58% in South Dakota at grade 8 to about 94% in Hawaii at both grades.
In each state, the percentage of non-white students in the persistently low performing non-special education group (darker bars) was greater than the percentage in the total non-special education population at the same grade. In Alabama, South Dakota, and Wisconsin the size of this differ-ence was quite large (approximately 30%). In Hawaii the difference between the percentages of non-white students in the two groups was fairly small (less than 10%). As with previous figures, the size of these differences should be interpreted cautiously because it relates to the size of the student population in each state and to that state’s overall student demographics.
Except for Wisconsin, there were only small differences (<10%) across grades in the percent-age of non-white non-special education students who were persistently low performing on the math test.

15NCEO
Figure 7. Percentage of Non-Special Education Grades 5 and 8 Non-White Students in the Persistently Low Performing Group on the State Math Test Compared to the Percentage of Non-White Students Among all Non-Special Education Students
*PLP: Persistently Low Performing students were students who scored at the 10th percentile or below for three consecutive years.
Figure 8 shows similar data for the fifth and eighth grade special education population on the math test. As shown in this figure, the percentage of non-white students in the total special edu-cation population taking the math test (lighter bars) varied a great deal across the four states. The range in the percentage of non-white special education students stretched from a low of 37% in South Dakota at grade eight to a high of 86% in Hawaii at grade 8. The percentage of non-white students in the persistently low performing group of special education students was also extremely variable. South Dakota, with 37% at grade 8, had the smallest percentage of non-white persistently low performers. Hawaii, with approximately 91% at grade 5, had the largest percentage of non-white persistently low performers in special education. The substantial number of non-white students in special education in Hawaii reflects the overall diversity of the state’s total student population.
90%
100%
70%
80%
50%
60%
70%
of S
tude
nts
40%
50%
Perc
enta
geo
20%
30%
0%
10%
Grade 5 Grade 8 Grade 5 Grade 8 Grade 5 Grade 8 Grade 5 Grade 8Grade 5 Grade 8 Grade 5 Grade 8 Grade 5 Grade 8 Grade 5 Grade 8
PLP Non-SpEd Non-White/Non-SpEd PLP* Non-SpEd Non-White/Non-SpEd
AL HI SD WI

16 NCEO
Figure 8. Percentage of Special Education Grades 5 and 8 Non-White Students in the Persistently Low Performing Group on the State Math Test Compared to the Percentage of Non-White Students Among all Special Education Students
*PLP: Persistently Low Performing students were students who scored at the 10th percentile or below for three consecutive years.
For most states there is a general pattern of a larger percentage of non-white students in the persistently low performing special education population (darker bar) compared to the total special education population (lighter bar) on the math test. With the variations in the overall degree of student diversity the size of this difference fluctuated. There was no difference in the percentage of non-white students in the two groups for Hawaii’s eighth grade. A small difference (less than 10%) existed for Hawaii’s fifth grade. In the remaining three states there were large (greater than 10%) differences between the percentage of non-white students in the persistently low performing special education group and in the total population of special education students.
There was a small difference (10%) across grade levels in the percentage of non-white special education and persistently low performing special education students.
Low-income BackgroundReading. The final student characteristic that we investigated in our analyses was income level. Figures 9 and 10 present the percentages of low-income students in the persistently low
90%
100%
70%
80%
50%
60%
70%
of S
tude
nts
40%
50%
Perc
enta
geo
20%
30%
0%
10%
Grade 5 Grade 8 Grade 5 Grade 8 Grade 5 Grade 8 Grade 5 Grade 8Grade 5 Grade 8 Grade 5 Grade 8 Grade 5 Grade 8 Grade 5 Grade 8
PLP SpEd Non-White/SpEd PLP* SpEd Non-White/SpEd
AL HI SD WI

17NCEO
performing and total populations of special education and non-special education students. The data variable used for these analyses was the percent of students receiving free or reduced lunch at school. Students receive free or reduced lunch at school on the basis of their family’s income level. Alabama did not have data on free or reduced lunch status in the state database. Therefore, the column for Alabama is left blank in the figures in this section. Figure 9 presents the non-special education data at grades 5 and 8, and Figure 10 presents the special education data at grades 5 and 8 (see Appendix A, Tables A10 and A11 for more detail).
In Figure 9 the percentage of low-income students in the non-special education population (lighter bars) ranged from 27% for South Dakota and Wisconsin eighth graders to 43% for Hawaii’s fifth graders (lighter bars). In the persistently low performing non-special education group (darker bars) the percentage ranged from 50% in South Dakota at eighth grade to 80% in Hawaii at fifth grade. For the most part, differences across grades within either group were small (10% or less) except in Hawaii where there were 12% more low income persistently low performing students in fifth grade compared to eighth grade (i.e., a large difference).
Figure 9. Percentage of Non-Special Education Grades 5 and 8 Low-Income Students in the Persistently Low Performing Group on the State Reading Test Compared to the Percentage of Low-income Students Among all Non-Special Education Students
*PLP: Persistently Low Performing students were students who scored at the 10th percentile or below for three consecutive years.
90%
100%
70%
80%
50%
60%
70%
of S
tude
nts
40%
50%
Perc
enta
geo
20%
30%
0%
10%
Grade 5 Grade 8 Grade 5 Grade 8 Grade 5 Grade 8 Grade 5 Grade 8Grade 5 Grade 8 Grade 5 Grade 8 Grade 5 Grade 8 Grade 5 Grade 8
PLP Non-SpEd Low-Income/Non-SpEd PLP* Non-SpEd Low-Income/Non-SpEd
HI SD WIAL

18 NCEO
In the figure we can see a consistent pattern of higher percentages of low-income students in the persistently low performing non-special education population (darker bars) compared to the total non-special education population (lighter bars). The differences in the percentage of low income students across the two groups were sizeable (greater than 20%) for the three states with data.
Figure 10 presents the data for fifth and eighth grade special education students on the reading assessment. There were varying percentages of low income students in the special education population overall and in the persistently low performing special education group. Low income students represent slightly less than half (46% to 48%) of the total special education population (lighter bars) in South Dakota and Wisconsin, but more than half of the population (57% to 60%) in Hawaii. In the persistently low performing special education group (darker bars) in South Dakota, low income students made up about half (46% and 55%) of the students while in both Wisconsin and Hawaii they made up greater than 60% of the group. Differences across grade levels in the percentage of low-income persistently low performing special education students were minimal (10% or less) and represented some increases and some decreases.
Figure 10. Percentage of Special Education Grades 5 and 8 Low-Income Students in the Persistently Low Performing Group on the State Reading Test Compared to the Percentage of Low-Income Students Among all Special Education Students
*PLP: Persistently Low Performing students were students who scored at the 10th percentile or below for three consecutive years.
90%
100%
70%
80%
50%
60%
70%
of S
tude
nts
40%
50%
Perc
enta
geo
20%
30%
0%
10%
Grade 5 Grade 8 Grade 5 Grade 8 Grade 5 Grade 8 Grade 5 Grade 8Grade 5 Grade 8 Grade 5 Grade 8 Grade 5 Grade 8 Grade 5 Grade 8
PLP SpEd Low-Income/SpEd PLP* SpEd Low-Income/SpEd
HI SD WIAL

19NCEO
In all three states with income data, there was a greater percentage of low income students in the persistently low performing special education group compared to the total special education population. However, the magnitude of the difference varied. In Wisconsin the size of the dif-ference was large (greater than 10%) while in the other two states, South Dakota and Hawaii, it was small (10% or less). Math. Figures 11 and 12 contain graphs that show the percentages of low-income students in the persistently low performing student groups on the state math test. Figure 11 shows the non-special education group, and Figure 12 shows the special education group (see Appendix A, Tables A12 and A13 for more detail).
Figure 11. Percentage of Non-Special Education Grades 5 and 8 Low-Income Students in the Persistently Low Performing Group on the State Math Test Compared to the Percentage of Low-Income Students Among all Non-Special Education Students
*PLP: Persistently Low Performing students were students who scored at the 10th percentile or below for three consecutive years.
90%
100%
70%
80%
50%
60%
70%
of S
tude
nts
40%
50%
Perc
enta
geo
20%
30%
0%
10%
Grade 5 Grade 8 Grade 5 Grade 8 Grade 5 Grade 8 Grade 5 Grade 8Grade 5 Grade 8 Grade 5 Grade 8 Grade 5 Grade 8 Grade 5 Grade 8
PLP Non-SpEd Low-Income/Non-SpEd PLP* Non-SpEd Low-Income/Non-SpEd
HI SD WIAL

20 NCEO
Figure 11 highlights the varying percentages of low income students in the total non-special education and persistently low performing non-special education groups on the math test. The percentage of low income students in the total population (lighter bars) ranged from 27% for South Dakota and Wisconsin eighth graders, to 43% for Hawaii fifth graders. In comparison, the percentage of low income students in the subgroup of persistently low performers (darker bars) ranged from 54% in South Dakota at eighth grade to 74% in Hawaii at fifth grade and Wisconsin at eighth grade. Differences within a group across grades were typically small (10% or less) except in Hawaii where there was a large difference (greater than 10%) with fewer low income students in the persistently low performing group at grade 8 compared to grade 5.
In each of the three states with data on family income, the percentage of low income students in the persistently low performing non-special education group was substantially higher, 26% to 47% more, than the percentage of low-income non-special education students overall.
Figure 12 shows data for all special education students and persistently low performing special education students taking the state math test at grades 5 and 8.
Figure 12. Percentage of Special Education Grades 5 and 8 Low-Income Students in the Persistently Low Performing Group on the State Math Test Compared to the Percentage of Low-Income Students Among all Special Education Students
*PLP: Persistently Low Performing students were students who scored at the 10th percentile or below for three consecutive years.
90%
100%
70%
80%
50%
60%
70%
of S
tude
nts
40%
50%
Perc
enta
geo
20%
30%
0%
10%
Grade 5 Grade 8 Grade 5 Grade 8 Grade 5 Grade 8 Grade 5 Grade 8Grade 5 Grade 8 Grade 5 Grade 8 Grade 5 Grade 8 Grade 5 Grade 8
PLP SpEd Low-Income/SpEd PLP* SpEd Low-Income/SpEd
HI SD WIAL

21NCEO
On the math test, the percentage of low-income students in the total special education popula-tion (lighter bars) varied from just under 50% in South Dakota and Wisconsin to over 57% to 60% in Hawaii. These percentages did show small differences (10% or less) across grades in two of the three states with income data. In the subgroup of persistently low performing spe-cial education students, those from low income backgrounds represented between 51% (South Dakota, grade 8) and 68% (Hawaii grade 5) of the group. Again, there were small differences across grades (10% or less).
Across the three states with data, there was a larger percentage of low-income students in the persistently low performing group of special education students (darker bars) than there was in the total special education population (lighter bars). The size of this difference varied from small (10% or less) in Hawaii at both grades and South Dakota at grade 8 to large (more than 10%) in South Dakota at grade 5 and Wisconsin at both grades.
Conclusion for Research Question 1The discussion of Figures 1-12 highlighted that there are more nuances to the demographic data on persistently low performers in special education and non-special education settings than previous research has suggested. If we use the percentage of students with a particular de-mographic characteristic in the total population as our point of comparison for the persistently low performers we see that there are mixed findings on whether or not there are more males in the persistently low performing subgroup of either non-special education or special education students. Patterns varied for males on the reading test versus the math test and for special educa-tion students versus non-special education students. In comparison, there were clear indications that persistently low performers, in both the special education and non-special education groups, were more likely to be non-white and low-income than their higher performing peers. These results were true on the reading and the math test. There were few consistent differences in the demographic make-up of the groups across grade levels.
Although we did not specifically compare variations in the demographic characteristics of a group taking the math test versus the reading test, we did note that for gender, there were differ-ent patterns of gender representation across the two tests for the non-special education group.
Research Question 2: Are special education students more or less likely to move out of the persistently low performing group than non-special education students? Is there any variation in movement by content area?
As Tables 2 and 3, along with Figures 13 through 16, will demonstrate, low performing special education students were more likely to be identified as persistently low performing across three years than their non-special education peers at the same grade. There were no major differ-ences in the percentages of students moving out of the low performing groups for mathematics

22 NCEO
compared to reading and patterns were similar across grades. These findings are described in more detail in the sections that follow.
Overall Movement Out of the Low-performing Category
Table 2 shows the total number of all fifth and eighth grade students who were identified as low performing (i.e., at or below the 10th percentile) in the first year in our data set. We grouped the students into what we call “movement categories” according to the years in which they were identified as low performing.
In the left-hand column of the table, Persistently Low Performing (PLP) students are those who were low performing in each of the three years in our data set. In the middle two rows under “Movement Category” for each grade are students who were identified as low perform-ing twice within three consecutive years, including the first year. In the last row in each grade, “Initially low performing” students are those who were identified as low performing only in the first year of our data set. The second and third years these students obtained a score above the 10th percentile.
Table 2. Total Number and Percentage of Fifth Grade and Eighth Grade Low Performing Students in Different Movement Categories in the Reading Assessment
Grade Movement CategoryAL HI SD WI
Count % Count % Count % Count %
5
Persistently low performing 1,778 48.4 566 47.1 344 40.1 2,200 42.0Low performing in year 1 and 3 333 9.1 145 12.1 96 11.2 584 11.1
Low performing in year 1 and 2 598 16.3 196 16.3 182 21.2 976 18.6
Initially low performing 962 26.2 295 24.5 236 27.5 1,479 28.2Total 3,671 100.0 1,202 100.0 858 100.0 5,239 100.0
8
Persistently low performing 1,740 43.8 478 42.2 377 41.1 2,757 48.3Low performing in year 1 and 3 343 8.6 144 12.7 114 12.4 689 12.1
Low performing in year 1 and 2 824 20.8 200 17.7 186 20.3 873 15.3
Initially low performing 1,064 26.8 310 27.4 240 26.2 1,389 24.3Total 3,971 100.0 1,132 100.0 917 100.0 5,708 100.0
In Table 2 students who were persistently low performers (i.e., low performing for three years) made up the largest percentage of all low performing students on the reading test (from 40.1% to 48.4%). Students who were initially low performing in year one and scored higher than the tenth percentile in years two and three represented the next largest group (24.3% to 28.2%).

23NCEO
There were no obvious differences across grade levels in the percentage of students who fell into a particular movement category on the reading assessment.
We also looked at the total number of students in each state who fell into a particular performance category in math (see Table 3) to see whether there were any differences across grade levels.
Table 3. Total Number and Percentage of Fifth Grade and Eighth Grade Low Performing Students in Different Movement Categories in the Math Assessment
Grade Movement CategoryAL HI SD WI
Count % Count % Count % Count %
5
Persistently low performing 1,616 40.6 531 43.8 337 42.2 2,071 39.9Low performing in year 1 and 3 393 9.9 172 14.2 109 13.7 603 11.6Low performing in year 1 and 2 733 18.4 196 16.2 131 16.4 931 17.9Initially low performing 1,239 31.1 314 25.9 221 27.7 1,587 30.6Total 3,981 100.0 1,213 100.0 798 100.0 5,192 100.0
8
Persistently low performing 1,201 28.2 450 39.4 402 41.0 2,630 46.0Low performing in year 1 and 3 600 14.1 143 12.5 119 12.1 672 11.7Low performing in year 1 and 2 1,162 27.3 264 23.1 198 20.2 975 17.0Initially low performing 1,293 30.4 285 25.0 262 26.7 1,444 25.2Total 4,256 100.0 1,142 100.0 981 100.0 5,721 100.0
As Table 3 shows, in math there was some variability in the percentage of students within a particular performance group across grades and states, but persistently low performing students still represented the largest group of low performers in most cases. Similar to reading, the sec-ond largest group of low performers was typically those who were initially low performing in year one of the data and who scored above the tenth percentile in years two and three. The one exception to this pattern was the state of Alabama, where a large difference (greater than 10%) was observed in the percentage of persistently low performing students at grade eight compared to grade five. In the same state a small difference (10% or less) was observed in the percentage of low performing in years one and two students.
Movement on the Reading TestFigure 13 uses stacked bar charts to represent the percentage of non-special education and special education fifth graders in each state and the movement category into which they fell on the state reading test (see Appendix B, Table B1 for more detail). This figure includes all fifth grade students who were identified as low performing (i.e., at or below the 10th percentile) in year one (2005-2006 in Wisconsin; 2004-2005 in all other states) of our data set. The non-special

24 NCEO
education bar is on the left side of each column and the special education bar is on the right side. The darkest colored tier, at the bottom, shows the percentage of students in either general or special education who were persistently low performing (i.e., below the 10th percentile each of three years). The second tier from the bottom is the percentage of students who were low performing in years one and three only. The third tier from the bottom shows the students who were low performing in years one and two only, followed by the students who were initially low performing (i.e., low performing only in year one).
Figure 13. Percentage of Fifth Grade Non-Special Education and Special Education Low Performing Students in Each Movement Category on the Reading Test
The left-hand bar of each state in Figure 13, shows that on the state reading assessment a higher overall percentage of fifth grade special education students were identified as persistently low performing compared to their non-special education peers (right-hand bar in each state). Across the four states, 27% to 32% of low performing non-special education fifth graders on the reading test were persistently low performing. In contrast, 52% to 66% of low performing fifth grade special education students (the right hand bar in each column) were persistently low performing.
Of the students who initially scored below the tenth percentile, non-special education students were more likely to move out of the low-performing category over time in comparison to the
12‐8‐11 KL and BC with new conclusion
29
were low performing in years one and two only, followed by the students who were initially low performing (i.e., low performing only in year one).
Figure 13. Percentage of Fifth Grade Non-Special Education and Special Education Low Performing Students in Each Movement Category on the Reading Test
The left-hand bar of each state in Figure 13, shows that on the state reading assessment a higher overall percentage of fifth grade special education students were identified as persistently low performing compared to their non-special education peers (right-hand bar in each state). Across the four states, 27% to 32% of low performing non-special education fifth graders on the reading test were persistently low performing. In contrast, 52% to 66% of low performing fifth grade special education students (the right hand bar in each column) were persistently low performing.
Of the students who initially scored below the tenth percentile, non-special education students were more likely to move out of the low performing category over time in comparison to the special education students. These students are represented by the top two tiers of each bar Adding together these two tiers for each state, a range of 57% to 60% of non-special education
0%
10%
20%
30%
40%
50%
60%
70%
80%
90%
100%
Non-SpEd
SpEd Non-SpEd
SpEd Non-SpEd
SpEd Non-SpEd
SpEd
Perc
enta
ge o
f Stu
dent
s
AL HI SD WI
Initially Low Performing Low Performing in Year 1 and 2Low Performing in Year 1 and 3 Persistently Low Performing

25NCEO
special education students. These students are represented by the top two tiers of each bar. Adding together these two tiers for each state, a range of 57% to 60% of non-special education students who were initially low performing were no longer low performing by year three on the reading test. They scored above the 10th percentile in years two and three. In contrast, only 26% to 38% of fifth grade special education students who were initially low performing (see the top two tiers of the right hand bar in each column) were no longer low performing by year three.
Figure 14 shows comparable data for all eighth grade students who took the reading assessment and who were identified as low performing in year one of our data set (see Appendix B, Table B1 for more detail). Similar to Figure 13, each state’s column includes a bar for non-special education students on the left side, and a bar for special education students on the right side. The bottom tier of each bar represents the students who continued to be identified as low performing in each of the three years (i.e., persistently low performing). The second and third tiers represent the percentage of students identified as low performing in only two out of the three years. The top tier of each bar represents the percentage of students who were identified as low performing only in year one (i.e., initially low performing). By years two and three these students scored at or above the 10th percentile on the reading assessment.
Figure 14. Percentage of Eighth Grade Non-Special Education and Special Education Low Performing Students in Each Movement Category on the Reading Test
12‐8‐11 KL and BC with new conclusion
31
Figure 14. Percentage of Eighth Grade Non-Special Education and Special Education Low Performing Students in Each Movement Category on the Reading Test
0%
10%
20%
30%
40%
50%
60%
70%
80%
90%
100%
Non-SpEd
SpEd Non-SpEd
SpEd Non-SpEd
SpEd Non-SpEd
SpEd
Perc
enta
ge o
f Stu
dent
s
AL HI SD WI
Initially Low Performing Low Performing in Year 1 and 2
Low Performing in Year 1 and 3 Persistently Low Performing

26 NCEO
Figure 14 indicates that for eighth graders taking the state reading assessment, a greater percent-age of special education students were identified as persistently low performing compared to their non-special education peers. Twenty-three percent to 32% of non-special education students who were low performing in the first year of the data set (see the left hand bar in each column) were persistently low performing across three years. In contrast, 56% to 61% of eighth grade special education students (see the right hand bar in each column) were persistently low performing.
Of the eighth grade students who initially scored below the tenth percentile, special education students were less likely than their non-special education peers to score above the tenth percen-tile in reading in later years. Fifty-five percent to 62% of eighth grade non-special education students who were low performing (see left-hand bars in each column) in year one moved out of the low-performing group by year three on the reading test. In contrast, only 28% to 34% of eighth grade special education students who were initially identified as low performing (see the right hand bars in each column) moved out of the low performing group by year three.
Movement on the Math TestFigures 15 and 16 show the percentage of non-special education and special education fifth and eighth graders in the various movement categories on the state math test (see Appendix B, Table B2 for more details). Figure 15 presents all fifth grade students who took the state math assessment and were identified as low performing in year one of our data set. The tiers within each bar indicate the percentage of those students who either remained low performing in each subsequent year, or moved out of the low-performing group at least temporarily. Each state’s column includes a bar for non-special education students on the left side, and a bar for special education students on the right side. The bottom tier of each bar represents the students who were persistently low performing. The two middle tiers represent the percentage of students identified as low performing twice within three consecutive years, including the first year of data collection. The top tier of each bar represents the percentage of students who were identi-fied as low performing only in year one. In years two and three these students scored above the 10th percentile on the math test.
Figure 15 shows that on the fifth grade math test a greater percentage of low performing special education students were persistently low performing compared to their non-special education peers. Between 26% and 32% of fifth grade non-special education students who were initially identified as low performing in math (the left-hand bar in each column) were persistently low performing. In contrast, 51% to 61% of low performing fifth grade special education students were persistently low performing.
Of the students who were low performing, non-special education students were more likely than special education students to score higher than the tenth percentile at some time during the three-year period. Between 53% and 64% percent of initially low performing non-special educa-

27NCEO
tion students moved out of the low-performing group by year three (see the top two tiers of the left-hand bar in each state). In contrast, only 27% to 37% of low performing special education students moved out of the low-performing group on the math test by year three.
Figure 15. Percentage of Fifth Grade Non-Special Education and Special Education Low Performing Students in Each Movement Category on the Math Test
Figure 16 presents data for eighth grade non-special education and special education students who took the state math test.
Figure 16 shows that on the eighth grade math test a greater percentage of low performing spe-cial education students were persistently low performing over a three year period compared to non-special education students. Twenty-one percent to 35% of eighth grade non-special educa-tion students who were initially identified as low performing in math (the left hand bar in each column) were persistently low performing. In contrast, 38% to 56% of low performing special education students were persistently low performing across three years.
12‐8‐11 KL and BC with new conclusion
33
Figure 15. Percentage of Fifth Grade Non-Special Education and Special Education Low Performing Students in Each Movement Category on the Math Test
0%
10%
20%
30%
40%
50%
60%
70%
80%
90%
100%
Non-SpEd
SpEd Non-SpEd
SpEd Non-SpEd
SpEd Non-SpEd
SpEd
Perc
enta
ge o
f Stu
dent
s
AL HI SD WI
Initially Low Performing Low Performing in Year 1 and 2
Low Performing in Year 1 and 3 Persistently Low Performing

28 NCEO
Figure 16. Percentage of Eighth Grade Non-Special Education and Special Education Low Performing Students in Each Movement Category on the Math Test
Examining all of the low performing students who made some kind of movement in their test scores, initially low performing non-special education students were much more likely than their special education peers to score above the tenth percentile in years two or three. For non-special education students, 52% to 65% of the low performing eighth graders in math (the right hand column) in year one had moved out of the low-performing group by year three. In contrast, only 33% to 48% of low-performing students in special education (the left hand column) moved out of the low-performing group by year three.
Conclusion for Research Question 2The discussion of Tables 5 and 6 and Figures 13-16 indicate that low performing special edu-cation students tend to stay low performing (i.e., become persistently low performing) more frequently than the low-performing non-special education students in the same grade level. These results were true for both reading and math and for fifth grade as well as eighth grade.
Although our analyses did not specifically compare the percentages of persistently low perform-ing students on the reading versus the math test, we did note that there appear to be some large
12‐8‐11 KL and BC with new conclusion
35
Figure 16. Percentage of Eighth Grade Non-Special Education and Special Education Low Performing Students in Each Movement Category on the Math Test
0%
10%
20%
30%
40%
50%
60%
70%
80%
90%
100%
Non-SpEd
SpEd Non-SpEd
SpEd Non-SpEd
SpEd Non-SpEd
SpEd
Perc
enta
ge o
f Stu
dent
s
AL HI SD WI
Initially Low Performing Low Performing in Year 1 and 2
Low Performing in Year 1 and 3 Persistently Low Performing
29NCEO
differences in the percent of either special education or non-special education persistently low performers across tests.
Research Question #3: Are low performing special education students in some demographic groups more or less likely to move out of the low performing group than their peers in non-special education?
For this research question, which contains multi-categorical analyses, we narrowed the focus solely to fifth grade reading data because the data are extremely complex. The fifth grade math data generally show similar patterns (see Appendix C, Tables C4, C5, and C6 for more details).
The discussion of Figures 17 through 19 indicate that low-performing special education students who were male, non-white and low income were more likely than their non-special education peers to be identified as persistently low performing on the reading test (i.e., low performing for all three years of the data analysis). In this section we provide more detailed description of the data to support this finding.
GenderFigure 17 provides data for all fifth grade male students who took the state reading assessment and were identified as low performing in year one of our data set (see Appendix C, Table C1 for more detail). Each state’s column includes a bar for non-special education male students on the left side, and a bar for special education male students on the right side. Each bar is then divided into tiers that represent performance levels. The bottom tier of each bar represents the persistently low performing students (i.e., those identified as low performing in each of the three years). The two middle tiers of each bar represent the percentage of students identified as low performing in the first year of the dataset, and in one additional year. Thus, the students in the middle tiers were not low performing in one year of the study. The top tier of each bar represents the percentage of students who were identified as low performing only in year one. After the first year, these students moved out of the low performing group.
Figure 17 shows that on the state reading assessment a greater percentage of low performing special education males were persistently low performing across three years in comparison to their non-special education peers. Twenty-eight percent to 33% of fifth grade low performing non-special education males (the left hand bar in each column), were persistently low perform-ing. In comparison, 51% to 68% of low performing males in special education (the bottom tier of the right-hand bar) were persistently low performing. The percentage of persistently low performing males in special education was higher in Alabama (68%) and Hawaii (64%) com-pared to Wisconsin (54%) and South Dakota (51%).

30 NCEO
Figure 17. Percentage of Fifth Grade Male Non-Special Education and Special Education Low Performing Students in Each Movement Category on the Reading Test
A larger percentage of low-performing males in the non-special education group, compared to those in special education, moved out of the low-performing group on the reading test by year three. Across states, roughly 57% to 60% of fifth grade non-special education low-performing male students (left-hand bar of each column) scored higher than the 10th percentile by year three. A much smaller percentage of low-performing male students in special education (right-hand bar of each column) moved out of the low-performing group by year three (26% to 39%).
Race/EthnicityFigure 18 presents all fifth grade non-white students who took the state reading assessment and were identified as low performing in year one of our data set (see Appendix C, Table C2 for more detail). Each state’s column includes a bar for non-white non-special education students on the left side, and a bar for non-white students in special education on the right side. Each bar is then divided into tiers that correspond to the different performance groups. The bottom tier of each bar represents the students who were persistently low performing. The two middle tiers of each bar represent the percentage of students identified as low performing in the first year of the dataset, and in one additional year, indicating that they were not low performing in one year out of three. The top tier of each bar represents the percentage of students who were
12‐8‐11 KL and BC with new conclusion
38
Figure 17. Percentage of Fifth Grade Male Non-Special Education and Special Education Low Performing Students in Each Movement Category on the Reading Test
0%
10%
20%
30%
40%
50%
60%
70%
80%
90%
100%
Non-SpEd
SpEd Non-SpEd
SpEd Non-SpEd
SpEd Non-SpEd
SpEd
Perc
enta
ge o
f Stu
dent
s
AL HI SD WI
Persistently Low Performing Low Performing in Year 1 and 3
Low Performing in Year 1 and 2 Initially Low Performing

31NCEO
identified as low performing only in year one. After the first year, these students were no longer low performing (i.e., achieved at or above the 10th percentile).
Figure 18. Percentage of Fifth Grade Non-White Non-Special Education and Special Education Low Performing Students in Each Movement Category on the Reading Test
In Figure 18 we can see that, of the fifth grade low-performing students, a larger percentage of non-white students in special education (right-hand bar in each column) were persistently low performing compared to their non-special education peers (left-hand bars). Twenty-eight percent to 40% of low performing non-white non-special education students were persistently low performing. In comparison, the right-hand bar in each state shows that 64% to 69% of low performing non-white students in special education were persistently low performing.
The top two tiers of each bar, representing students moving out of the low performing category after year 1, illustrate that a larger percentage of non-special education students move out of the low performing category over time, in comparison to their special education peers. Of the fifth grade low-performing students, 49% to 59% of non-white non-special education students moved out of the low performing group by year three. In contrast, the right hand bar shows that only 26% to 30% of non-white low-performing students in special education moved out of the low performing group by year three.
12‐8‐11 KL and BC with new conclusion
40
Figure 18. Percentage of Fifth Grade Non-White Non-Special Education and Special Education Low Performing Students in Each Movement Category on the Reading Test
0%
10%
20%
30%
40%
50%
60%
70%
80%
90%
100%
Non-SpEd
SpEd Non-SpEd
SpEd Non-SpEd
SpEd Non-SpEd
SpEd
Perc
enta
ge o
f Stu
dent
s
AL HI SD WI
Persistently Low Performing Low Performing in Year 1 and 3
Low Performing in Year 1 and 2 Initially Low Performing

32 NCEO
12‐8‐11 KL and BC with new conclusion
42
Figure 19. Percentage of Fifth Grade Low-Income Non-Special Education and Special Education Low Performing Students in Each Movement Category on the Reading Test
*Alabama does not have income data available.
0%
10%
20%
30%
40%
50%
60%
70%
80%
90%
100%
Non-SpEd
SpEd Non-SpEd
SpEd Non-SpEd
SpEd Non-SpEd
SpEd
Perc
enta
ge o
f Stu
dent
s
AL* HI SD WI
Persistently Low Performing Low Performing in Year 1 and 3
Low Performing in Year 1 and 2 Initially Low Performing
Income LevelFigure 19 illustrates the movement of all fifth grade low-income students who took the state reading assessment and were identified as low performing in year one of our data set (see Ap-pendix C, Table C3 for more detail). Similar to previous figures, each state’s column includes a bar for non-special education low-income students on the left side, and a bar for low-income students in special education on the right side. The bottom tier of each bar represents the students who continued to be identified as low performing in each of the three years (i.e., persistently low performing). The two middle tiers of each bar represent the percentage of students identi-fied as low performing in the first year of the dataset and in one additional year, indicating that they were not low performing in one year out of three. The top tier represents the percentage of students who were identified as low performing only in year one. After the first year, these students were no longer low performing.
Figure 19. Percentage of Fifth Grade Low-Income Non-Special Education and Special Education Low Performing Students in Each Movement Category on the Reading Test
*Alabama does not have income data available.
33NCEO
Figure 19 shows that, of fifth grade low performing low-income students, a larger percentage in special education (right hand bar in each column) were persistently low performing compared to their non-special education peers (left-hand bar in each column). Thirty-one percent to 33% of fifth grade low performing low income non-special education students were persistently low performing. In contrast, 52% to 66%, of low performing low income students in special educa-tion were identified as persistently low performing.
Of the low performing low income students, those who were not in special education were more likely than those in special education to score higher than the tenth percentile by year three. Looking at the top two tiers of the left-hand bar in each state we can see that 54% to 56% of low income non-special education students moved out of the low-performing group by year three compared to 23% to 36% of low income special education students.
Conclusion for Research Question 3The discussion of Figures 17 through 19 indicates that there are some identifiable patterns of movement in the low performing group on the reading assessments that are different for students from certain demographic categories. Low performing special education students who are male, non-white and low income are be more likely to become persistently low performing. Their non-special education classmates from the same demographic groups are more likely to score in the low performing range once and move out of the group in later years.
Discussion and Conclusions
The results of this study suggest three key findings. First, the demographic characteristics of persistently low performing students were generally similar regardless of whether students re-ceived special education services. In both groups, the lowest performers were more likely to be non-white students and students from low-income backgrounds. The data from the four states we studied did not conclusively show a pattern of more persistently low performing males, compared to females, across all content areas and grade levels. Second, of the students who were identified as low performing in the first year of our data, special education students were more likely than their non-special education peers to remain low performing across the three years of the study. Non-special education students were more likely to score higher in subsequent years while the special education students’ scores remained relatively unchanged. Third, looking at only the low performing special education students, those who were non-white and from low income backgrounds were more likely than their white, higher-income level peers, to be identified as persistently low performing across three years. The findings for males were less consistent.
There are some important implications of these findings for K-12 standards-based assessment and instruction. The results show that many low performing students on state assessments do
34 NCEO
not have disabilities, and therefore would not be eligible to take an alternate assessment based on modified achievement standards (AA-MAS). Because low performing non-special education students are not eligible for the AA-MAS, state departments of education should consider other actions to help these students succeed in the grade-level standards-based curriculum. There is a wide-ranging variety of system-level factors that might play into differential performance patterns by particular subgroups of students. These factors include: school poverty levels and resource availability, teacher availability, teacher qualifications and training, student attendance, student health, school violence, an emphasis on remedial instruction rather than grade-level standards-based instruction, a teacher-student culture and relationship gap, and appropriate state assessment design and implementation for a particular population of students (cf. Archibald, 2006; Belfiore, Auld, & Lee, 2005; Cooper & Jackson, 2011; Goodwin, Englert, & Cicchinelli, 2003; Jackson, 2011). It is not within the scope of this report to address all the possible ways in which state departments of education and policymakers might address issues related to low levels of academic achievement by low income and minority students with, and without, dis-abilities. However, from an assessment fairness perspective (cf. Goodwin et al., 2002) there are three key issues state departments of education could investigate when faced with data showing differential achievement outcomes of this magnitude for certain subgroups of students:
1. Examine whether existing assessment items function differently for some groups of students compared to others. Test items should be designed to allow the greatest possible number of students to demonstrate their knowledge and skills in the grade-level content. Barriers such as biased test content or inaccessible test item formats should be identified and attended to early.
2. Examine whether correct test participation and administration policies and procedures are adhered to. Are all students participating in the appropriate state assessments according to state-determined participation criteria? Do students receive the test accommodations that they need as indicated by their IEPs, or more generally by state accommodations policies if accommodations are offered to any student? Are accommodations administered correctly?
3. Examine whether all students have had sufficient opportunity to learn the grade-level standards-based content that is measured on the state test. Are high academic expectations the norm for all students or only for some? For the lowest performing students on the state assessment, how well are their curricula aligned with grade-level standards? If students are instructed in classrooms where curricula are well-aligned with state standards, what strategies are teachers using to get to know the skills and interests of their low-income, non-white students so that content instruction can build on students’ strengths and develop their academic potential? A part of addressing students’ opportunity to learn would also include investigation of the progress monitoring and feedback processes educators use to

35NCEO
adapt daily instruction and provide targeted interventions for specific students who have learning challenges.
Federal legislation describing the AA-MAS option states that students with disabilities who are being considered as possible candidates for participation in the AA-MAS must have access to grade-level content (U.S. Department of Education, 2007). Further research is needed to get a better understanding of whether low performing students with disabilities have access to grade-level content—though preliminary evidence indicates that some may not have access (see, for example, Altman, Cormier, Lazarus & Thurlow, 2011; Lazarus et al., 2011).Taking steps to ensure that all low performing students with disabilities have access to grade level content is a crucial part of improving their academic outcomes. Improving the opportunity to learn for low performing students with disabilities can also have far-reaching effects that improve academic outcomes for low performing students who are not in special education and vice versa (see Telfer, 2011). Given that students with disabilities may move in and out of special education status repeatedly over time (cf. Ysseldyke & Bielinski, 2002), our data indicate the importance of addressing the instruction and assessment needs of all low performing students simultane-ously, regardless of which assessment they take.

36 NCEO

37NCEO
References
Albus, D., Lazarus, S. S., Thurlow, M. L., & Cormier, D. (2009). Characteristics of states’ alter-nate assessments based on modified academic achievement standards in 2008 (Synthesis Report 72). Minneapolis, MN: University of Minnesota, National Center on Educational Outcomes.
Albus, D., Thurlow, M. L., & Bremer, C. (2009). Achieving transparency in the public report-ing of 2006-2007 assessment results (Technical Report 53). Minneapolis, MN: University of Minnesota, National Center on Educational Outcomes.
Altman, J. R., Cormier, D. C., Lazarus, S. S., & Thurlow, M. L. (2011). Tennessee special edu-cation teacher survey: Training, large-scale testing and TCAP-MAAS administration (Techni-cal Report 61). Minneapolis, MN: University of Minnesota, National Center on Educational Outcomes.
Altman, J., Rogers, C., Bremer C., & Thurlow, M. (2010). States challenged to meet special education targets for assessment indicator (Technical Report 55). Minneapolis, MN: University of Minnesota, National Center on Educational Outcomes.
Altman, J., Thurlow, M., & Vang, M. (2010). Annual performance report: 2007-2008 state assessment data. Minneapolis, MN: University of Minnesota, National Center on Educational Outcomes.
Archibald, S. (2006). Narrowing in on educational resources that do affect student achievement. Peabody Journal of Education, 81(4), 23-42.
Bechard, S., & Godin, K. (2007). Who are the students in the gaps, what are their attributes, and how do they perform? Newton MA: CAST, The Education Alliance, EDC, INTASC, Measured Progress. Retrieved from http://www.necompact.org/Students_in_the_Gaps.pdf
Belfiore, P., Auld, R., & Lee, D. (2005). The disconnect of poor-urban education: Equal access and a pedagogy of risk taking. Psychology in the schools, 42(8), 855-863.
Chudowsky, N., & Chudowsky, V. (2009). State test score trends through 2007-2008, part 4: Has progress been made in raising achievement for students with disabilities? Retrieved from Center on Education Policy website: http://www.cep-dc.org/publications/index.cfm?selectedYear=2009
Chudowsky, N., & Chudowsky, V. (2010). State test score trends through 2007-2008, part 5: Are there differences in achievement between boys and girls? Retrieved from Center on Education Policy website: http://www.cep-dc.org/publications/index.cfm?selectedYear=2010

38 NCEO
Chudowsky, N., Chudowsky, V., & Kober, N. (2009). State test score trends through 2007-2008, part 3: Are achievement gaps closing and is achievement rising for all? Retrieved from Center on Education Policy website: http://www.cep-dc.org/publications/index.cfm?selectedYear=2009
Cooper, E., & Jackson, Y. (2011). The ‘fierce urgency of now’: Narrowing the race and culture gaps between students and teachers. Education Week, 30(18), 22-23.
Cortiella, C. (2007). Learning opportunities for your child through alternate assessments: Alternate assessments based on modified academic achievement standards. Minneapolis MN: University of Minnesota, National Center on Educational Outcomes.
Colorado Department of Education. (2005, December). Assessing “students in the gap” in Colorado: Report from the HB 05-1246 study committee. Denver, CO: Author.
Goodwin, B., Englert, K., & Cicchinelli, L. (2003). Comprehensive accountability systems: A framework for evaluation. Aurora, CO: Mid-continent Research for Education and Learning.
Hess, K., McDivitt, P., & Fincher, M. (2008). Who are the 2% students and how do we design test items and assessments that provide greater access for them? Results from a pilot study with Georgia students. Paper presented at the CCSSO National Conference on Student Assessment Orlando, FL. Retrieved from http://www.nciea.org/publications/CCSSO_KHPMMF08.pdf
Jackson, Y. (2011). The pedagogy of confidence: Inspiring high intellectual performance in urban schools. New York: Teachers College Press, Columbia University.
Kober, N., Chudowsky, N., & Chudowsky, V. (2010). State test score trends through 2008-09, part 2: Slow and uneven progress in narrowing gaps. Retrieved from Center on Education Policy website: http://www.cep-dc.org/publications/index.cfm?selectedYear=2010
Lazarus, S. S., Hodgson, J. R., Price, L. M., & Thurlow, M. L. (2011). States’ participation guidelines for alternate assessments based on modified academic achievement standards (AA-MAS) in 2010 (Synthesis Report 82). Minneapolis, MN: University of Minnesota, National Center on Educational Outcomes.
Lazarus, S. S., & Quenemoen, R. (2011). Instructing and assessing students who may be can-didates for alternate assessments based on modified achievement standards (AA-MAS). In M. Russell & M. Kavanaugh (Eds.), Assessing students in the margins (pp.215-233). Charlotte, NC: Information Age Publishing.
Lazarus, S. S., Wu, Y. C., Altman, J., & Thurlow, M. L. (2010). NCEO brief: The characteristics of low performing students on large-scale assessments. Minneapolis, MN: University of Min-nesota, National Center on Educational Outcomes.
39NCEO
Marion, S., Gong, B., & Simpson, M. A. (2006, Feb. 6). Mining achievement data to guide policies and practices on assessment options. Teleconferences on Making Good Decisions on NCLB Flexibility Options. Minneapolis: National Center on Educational Outcomes. Available at: http://www.cehd.umn.edu/nceo/Teleconferences/tele11/default.html
Quenemoen, R. (2008). A brief history of alternate assessments based on alternate achievement standards (Synthesis Report 68). Minneapolis, MN: University of Minnesota, National Center on Educational Outcomes.
Telfer, D. (2011). Moving your numbers: Five districts share how they used assessment and accountability to increase performance for students with disabilities as part of district-wide improvement. Minneapolis, MN: University of Minnesota, National Center on Educational Outcomes.
Thurlow, M., Bremer, C., & Albus, D. (2008). Good news and bad news in disaggregated subgroup reporting to the public on 2005-2006 assessment results (Technical Report 52). Min-neapolis, MN: University of Minnesota, National Center on Educational Outcomes.
U.S. Department of Education (2007, April 9). Final Rule 34 CFR Parts 200 and 300: Title I-Improving the Academic Achievement of the Disadvantaged; Individuals with Disabilities Education Act (IDEA). Federal Register. 72(67), Washington DC: Author.
VanGetson, G. R., & Thurlow, M. L. (2007). Nearing the target in disaggregated subgroup reporting to the public on 2004-2005 assessment results (Technical Report 46). Minneapolis, MN: University of Minnesota, National Center on Educational Outcomes.
Ysseldyke, J., & Bielinski, J. (2002). Effect of different methods of reporting and reclassifica-tion on trends in test scores for students with disabilities. Exceptional Children, 68(2), 189-201.

40 NCEO

41NCEO
Appendix A
Tables Supporting Research Question 1
Table A1. 10th Percentile Cut Scores by State, Content Area, Test Year, and Grade
12‐8‐11 KL and BC with new conclusion
47
Appendix A Table A1. 10th Percentile Cut Scores by State, Content Area, Test Year, and Grade
State Year 5th Grade 8th Grade Math Reading Math Reading
Alabama 2005 569 570 615 6112006 589 590 621 6222007 601 600 647 628
South Dakota 2005 579 588 629 6242006 599 601 642 6372007 621 614 665 652
Wisconsin 2006 377 418 458 4452007 415 425 485 4572008 435 431 482 468
Hawaii 2005 175 210 158 1942006 171 220 165 2022007 241 257 231 257

42 NCEO
Tab
le A
2. P
erce
nta
ge
of
Stu
den
ts in
th
e N
on
-Sp
ecia
l Ed
uca
tio
n P
op
ula
tio
n b
y G
end
er a
n D
iffe
ren
t P
erfo
rman
ce G
rou
p o
n t
he
Rea
din
g A
sses
smen
t ac
ross
Sta
tes
12‐8‐11 KL and
BC with
new
con
clusion
48
Tabl
e A
2. P
erce
ntag
e of
Stu
dent
s in
the
Non
-Spe
cial
Edu
catio
n Po
pula
tion
by G
ende
r and
Diff
eren
t Per
form
ance
Gro
up o
n th
e R
eadi
ng
Ass
essm
ent a
cros
s St
ates
Gra
de
Stat
e G
ende
r
Pers
iste
ntly
lo
w
perf
orm
ing
Pote
ntia
lly
pers
iste
ntly
lo
w
perf
orm
ing
Low
pe
rfor
min
g 10
th o
r abo
ve
all t
hree
ye
ars
Tota
l
Cou
nt
%
Cou
nt
%
Cou
nt
%
Cou
nt
%
Cou
nt
%
Gra
de 5
Ala
bam
a Fe
mal
e 18
934
%34
036
%85
839
%
16,5
9452
%17
,981
50%
Mal
e 36
866
%60
564
%1,
369
61%
15
,383
48%
17,7
2550
%
Haw
aii
Fem
ale
4632
%98
36%
260
39%
4,
926
53%
5,33
051
%M
ale
9868
%17
464
%40
361
%
4,37
247
%5,
047
49%
Sou
thD
akot
a Fe
mal
e 66
42%
111
46%
235
45%
3,
112
52%
3,52
451
%M
ale
9058
%12
854
%28
855
%
2,88
648
%3,
392
49%
Wis
cons
in
Fem
ale
307
44%
552
46%
1,10
946
%
21,4
1852
%23
,386
51%
Mal
e 39
656
%65
254
%1,
325
54%
19
,708
48%
22,0
8149
%
Gra
de 8
Ala
bam
a Fe
mal
e 18
128
%31
029
%90
037
%
17,2
7454
%18
,665
51%
Mal
e 46
572
%75
471
%1,
549
63%
14
,977
46%
17,7
4549
%
Haw
aii
Fem
ale
2825
%65
27%
293
39%
4,
645
52%
5,03
151
%M
ale
8475
%17
773
%45
261
%
4,21
048
%4,
923
49%
Sou
thD
akot
a Fe
mal
e 60
38%
115
44%
234
43%
3,
473
51%
3,88
250
%M
ale
9762
%14
556
%30
657
%
3,36
349
%3,
911
50%
Wis
cons
in
Fem
ale
366
46%
519
45%
1,03
445
%
23,4
0152
%25
,320
52%
Mal
e 43
754
%62
555
%1,
281
55%
21
,273
48%
23,6
1648
%

43NCEO
Tab
le A
3. P
erce
nta
ge
of
Stu
den
ts in
th
e S
pec
ial E
du
cati
on
Po
pu
lati
on
by
Gen
der
an
d D
iffe
ren
t P
erfo
rman
ce G
rou
p o
n t
he
Rea
din
g
Ass
essm
ent
acro
ss S
tate
s
12‐8‐11 KL and
BC with
new
con
clusion
49
Tabl
e A
3. P
erce
ntag
e of
Stu
dent
s in
the
Spec
ial E
duca
tion
Popu
latio
n by
Gen
der a
nd D
iffer
ent P
erfo
rman
ce G
roup
on
the
Rea
ding
A
sses
smen
t acr
oss
Stat
es
Gra
de
Stat
e G
ende
r
Pers
iste
ntly
lo
w
perf
orm
ing
Pote
ntia
lly
pers
iste
ntly
lo
w
perf
orm
ing
Low
pe
rfor
min
g 10
th o
r abo
ve
all t
hree
ye
ars
Tota
l
Cou
nt
%
Cou
nt
%
Cou
nt
%
Cou
nt
%
Cou
nt
%
Gra
de 5
Ala
bam
a Fe
mal
e 35
429
%23
838
%19
534
%
427
37%
1,21
434
%M
ale
867
71%
390
62%
371
66%
73
663
%2,
364
66%
Haw
aii
Fem
ale
107
25%
5624
%62
31%
10
232
%32
728
%M
ale
315
75%
180
76%
141
69%
21
968
%85
572
%S
outh
Dak
ota
Fem
ale
7037
%64
36%
5730
%
149
32%
340
34%
Mal
e 11
863
%11
564
%13
170
%
310
68%
674
66%
Wis
cons
in
Fem
ale
521
35%
330
33%
345
34%
93
532
%2,
131
33%
Mal
e 97
665
%66
767
%66
066
%
1,94
968
%4,
252
67%
Gra
de 8
Ala
bam
a Fe
mal
e 27
926
%20
028
%27
338
%
507
39%
1,25
933
%M
ale
815
74%
521
72%
452
62%
78
261
%2,
570
67%
Haw
aii
Fem
ale
8122
%88
30%
7228
%
140
34%
381
29%
Mal
e 28
578
%21
070
%18
872
%
271
66%
954
71%
Sou
thD
akot
a Fe
mal
e 81
37%
5835
%55
31%
11
936
%31
335
%M
ale
139
63%
107
65%
120
69%
21
464
%58
065
%
Wis
cons
in
Fem
ale
688
35%
407
37%
367
32%
95
832
%2,
420
34%
Mal
e 1,
266
65%
686
63%
766
68%
2,
002
68%
4,72
066
%

44 NCEO
Tab
le A
4. P
erce
nta
ge
of
Stu
den
ts in
th
e N
on
-Sp
ecia
l Ed
uca
tio
n P
op
ula
tio
n b
y G
end
er a
nd
Dif
fere
nt
Per
form
ance
Gro
up
on
th
e M
ath
A
sses
smen
t ac
ross
Sta
tes
12‐8‐11 KL and
BC with
new
con
clusion
50
Tabl
e A
4. P
erce
ntag
e of
Stu
dent
s in
the
Non
-Spe
cial
Edu
catio
n Po
pula
tion
by G
ende
r and
Diff
eren
t Per
form
ance
Gro
up o
n th
e M
ath
Ass
essm
ent a
cros
s St
ates
Gra
de
Stat
e G
ende
r
Pers
iste
ntly
lo
w
perf
orm
ing
Pote
ntia
lly
pers
iste
ntly
lo
w
perf
orm
ing
Low
pe
rfor
min
g 10
th o
r abo
ve
all t
hree
ye
ars
Tota
l
Cou
nt
%
Cou
nt
%
Cou
nt
%
Cou
nt
%
Cou
nt
%
Gra
de 5
Ala
bam
a Fe
mal
e 27
146
%46
742
%1,
313
47%
15
,909
51%
17,9
6050
%M
ale
317
54%
644
58%
1,47
653
%
15,2
6949
%17
,706
50%
Haw
aii
Fem
ale
9554
%14
245
%35
948
%
4,73
252
%5,
328
51%
Mal
e 81
46%
176
55%
386
52%
4,
401
48%
5,04
449
%S
outh
Dak
ota
Fem
ale
7150
%11
653
%24
853
%
3,11
651
%3,
551
51%
Mal
e 71
50%
102
47%
220
47%
3,
023
49%
3,41
649
%
Wis
cons
in
Fem
ale
579
59%
802
57%
1,54
355
%
20,5
0351
%23
,427
51%
Mal
e 40
141
%60
743
%1,
264
45%
19
,878
49%
22,1
5049
%
Gra
de 8
Ala
bam
a Fe
mal
e 22
343
%63
442
%1,
707
46%
16
,061
52%
18,6
2551
%M
ale
292
57%
870
58%
2,00
854
%
14,5
4048
%17
,710
49%
Haw
aii
Fem
ale
4438
%10
939
%35
146
%
4,52
552
%5,
029
51%
Mal
e 72
62%
173
61%
419
54%
4,
257
48%
4,92
149
%S
outh
Dak
ota
Fem
ale
8446
%13
748
%26
753
%
3,39
650
%3,
884
50%
Mal
e 99
54%
147
52%
238
47%
3,
426
50%
3,91
050
%
Wis
cons
in
Fem
ale
556
59%
688
57%
1,32
154
%
22,7
5751
%25
,322
52%
Mal
e 38
541
%52
743
%1,
114
46%
21
,570
49%
23,5
9648
%

45NCEO
Tab
le A
5. P
erce
nta
ge
of
Stu
den
ts in
th
e S
pec
ial E
du
cati
on
Po
pu
lati
on
by
Gen
der
an
d D
iffe
ren
t P
erfo
rman
ce G
rou
p o
n t
he
Mat
h
Ass
essm
ent
acro
ss S
tate
s
12‐8‐11 KL and
BC with
new
con
clusion
51
Tabl
e A
5. P
erce
ntag
e of
Stu
dent
s in
the
Spec
ial E
duca
tion
Popu
latio
n by
Gen
der a
nd D
iffer
ent P
erfo
rman
ce G
roup
on
the
Mat
h A
sses
smen
t acr
oss
Stat
es
Gra
de
Stat
e G
ende
r
Pers
iste
ntly
lo
w
perf
orm
ing
Pote
ntia
lly
pers
iste
ntly
lo
w
perf
orm
ing
Low
pe
rfor
min
g 10
th o
r abo
ve
all t
hree
ye
ars
Tota
l
Cou
nt%
Cou
nt%
Cou
nt%
Cou
nt%
Cou
nt
%
Gra
de 5
Ala
bam
a Fe
mal
e 35
735
%24
737
%22
836
%
380
30%
1,21
234
%M
ale
671
65%
429
63%
401
64%
86
670
%2,
367
66%
Haw
aii
Fem
ale
127
36%
6224
%61
25%
76
23%
326
28%
Mal
e 22
864
%19
276
%18
475
%
249
77%
853
72%
Sou
thD
akot
a Fe
mal
e 74
38%
5737
%62
37%
15
129
%34
433
%M
ale
121
62%
9663
%10
563
%
362
71%
684
67%
Wis
cons
in
Fem
ale
492
45%
370
40%
374
34%
93
027
%2,
166
33%
Mal
e 59
955
%54
460
%73
366
%
2,50
973
%4,
385
67%
Gra
de 8
Ala
bam
a Fe
mal
e 22
433
%35
133
%30
533
%
378
33%
1,25
833
%M
ale
462
67%
708
67%
620
67%
75
767
%2,
547
67%
Haw
aii
Fem
ale
103
31%
9530
%79
28%
10
426
%38
129
%M
ale
231
69%
227
70%
205
72%
29
274
%95
571
%S
outh
Dak
ota
Fem
ale
9041
%70
38%
5936
%
9429
%31
335
%M
ale
129
59%
116
62%
106
64%
22
971
%58
065
%
Wis
cons
in
Fem
ale
747
44%
500
40%
371
33%
79
826
%2,
416
34%
Mal
e 94
256
%74
460
%75
467
%
2,29
974
%4,
739
66%

46 NCEO
Tab
le A
6. P
erce
nta
ge
of
Stu
den
ts in
th
e N
on
-Sp
ecia
l Ed
uca
tio
n P
op
ula
tio
n b
y R
ace/
Eth
nic
ity
and
Dif
fere
nt
Per
form
ance
Gro
up
on
th
e R
ead
ing
Ass
essm
ent
acro
ss S
tate
s
12‐8‐11 KL and
BC with
new
con
clusion
52
Tabl
e A
6. P
erce
ntag
e of
Stu
dent
s in
the
Non
-Spe
cial
Edu
catio
n Po
pula
tion
by R
ace/
Ethn
icity
and
Diff
eren
t Per
form
ance
Gro
up o
n th
eR
eadi
ng A
sses
smen
t acr
oss
Stat
es
Gra
de
Stat
e R
ace/
Ethn
icity
Pers
iste
ntly
lo
w
perf
orm
ing
Pote
ntia
lly
pers
iste
ntly
lo
w
perf
orm
ing
Low
pe
rfor
min
g 10
th o
r abo
ve
all t
hree
ye
ars
Tota
l
Cou
nt
%
Cou
nt
%
Cou
nt
%
Cou
nt
%
Cou
nt
%
Gra
de 5
Ala
bam
a W
hite
20
437
%34
336
%1,
001
45%
22
,342
70%
23,8
9067
%N
on-W
hite
35
363
%60
264
%1,
227
55%
9,
640
30%
11,8
2233
%
Haw
aii
Whi
te
64%
197%
416%
1,
275
14%
1,34
113
%N
on-W
hite
13
896
%25
393
%62
294
%
8,02
386
%9,
036
87%
Sou
thD
akot
a W
hite
75
48%
142
59%
376
72%
5,
309
89%
5,90
285
%N
on-W
hite
81
52%
9741
%14
728
%
689
11%
1,01
415
%
Wis
cons
in
Whi
te
321
46%
644
53%
1,45
860
%
34,1
9283
%36
,615
81%
Non
-Whi
te
382
54%
560
47%
976
40%
6,
934
17%
8,85
219
%
Gra
de 8
Ala
bam
a W
hite
21
133
%43
241
%1,
082
44%
22
,327
69%
24,0
5266
%N
on-W
hite
43
667
%63
359
%1,
369
56%
9,
936
31%
12,3
7434
%
Haw
aii
Whi
te
44%
146%
446%
1,
095
12%
1,15
712
%N
on-W
hite
10
896
%22
894
%70
194
%
7,76
188
%8,
798
88%
Sou
thD
akot
a W
hite
62
39%
148
57%
409
76%
6,
138
90%
6,75
787
%N
on-W
hite
95
61%
112
43%
131
24%
69
810
%1,
036
13%
Wis
cons
in
Whi
te
211
26%
463
40%
1,29
556
%
37,8
8985
%39
,858
81%
Non
-Whi
te
592
74%
681
60%
1,02
044
%
6,78
515
%9,
078
19%

47NCEO
Tab
le A
7. P
erce
nta
ge
of
Stu
den
ts in
th
e S
pec
ial E
du
cati
on
Po
pu
lati
on
by
Rac
e/E
thn
icit
y an
d D
iffe
ren
t P
erfo
rman
ce G
rou
p o
n t
he
Rea
din
g A
sses
smen
t ac
ross
Sta
tes
12‐8‐11 KL and
BC with
new
con
clusion
53
Tabl
e A
7. P
erce
ntag
e of
Stu
dent
s in
the
Spec
ial E
duca
tion
Popu
latio
n by
Rac
e/Et
hnic
ity a
nd D
iffer
ent P
erfo
rman
ce G
roup
on
the
Rea
ding
Ass
essm
ent a
cros
s St
ates
Gra
de
Stat
e R
ace/
Ethn
icity
Pers
iste
ntly
lo
w
perf
orm
ing
Pote
ntia
lly
pers
iste
ntly
lo
w
perf
orm
ing
Low
pe
rfor
min
g 10
th o
r abo
ve
all t
hree
ye
ars
Tota
l
Cou
nt
%
Cou
nt
%
Cou
nt
%
Cou
nt
%
Cou
nt
%
Gra
de 5
Ala
bam
a W
hite
59
849
%33
453
%33
960
%
887
76%
2,15
860
%N
on-W
hite
62
351
%29
447
%22
740
%
277
24%
1,42
140
%
Haw
aii
Whi
te
4310
%33
14%
2713
%
6621
%16
914
%N
on-W
hite
37
990
%20
386
%17
687
%
255
79%
1,01
386
%S
outh
Dak
ota
Whi
te
109
58%
130
73%
155
82%
39
586
%78
978
%N
on-W
hite
79
42%
4927
%33
18%
64
14%
225
22%
Wis
cons
in
Whi
te
935
62%
714
72%
749
75%
2,
441
85%
4,83
976
%N
on-W
hite
56
238
%28
328
%25
625
%
443
15%
1,54
424
%
Gra
de 8
Ala
bam
a W
hite
51
347
%37
752
%42
859
%
899
70%
2,21
758
%N
on-W
hite
58
253
%34
548
%29
741
%
390
30%
1,61
442
%
Haw
aii
Whi
te
3810
%34
11%
3714
%
6917
%17
813
%N
on-W
hite
32
890
%26
489
%22
386
%
342
83%
1,15
787
%S
outh
Dak
ota
Whi
te
145
66%
116
70%
156
89%
29
990
%71
680
%N
on-W
hite
75
34%
4930
%19
11%
34
10%
177
20%
Wis
cons
in
Whi
te
1,09
156
%78
972
%88
678
%
2,54
186
%5,
307
74%
Non
-Whi
te
863
44%
304
28%
247
22%
41
914
%1,
833
26%

48 NCEO
Tab
le A
8. P
erce
nta
ge
of
Stu
den
ts in
th
e N
on
-Sp
ecia
l Ed
uca
tio
n P
op
ula
tio
n b
y R
ace/
Eth
nic
ity
and
Dif
fere
nt
Per
form
ance
Gro
up
on
th
e M
ath
Ass
essm
ent
acro
ss S
tate
s
12‐8‐11 KL and
BC with
new
con
clusion
54
Tabl
e A
8. P
erce
ntag
e of
Stu
dent
s in
the
Non
-Spe
cial
Edu
catio
n Po
pula
tion
by R
ace/
Ethn
icity
and
Diff
eren
t Per
form
ance
Gro
up o
n th
eM
ath
Ass
essm
ent a
cros
s St
ates
Gra
de
Stat
e R
ace/
Ethn
icity
Pers
iste
ntly
lo
w
perf
orm
ing
Pote
ntia
lly
pers
iste
ntly
lo
w
perf
orm
ing
Low
pe
rfor
min
g 10
th o
r abo
ve
all t
hree
ye
ars
Tota
l
Cou
nt
%
Cou
nt
%
Cou
nt
%
Cou
nt
%
Cou
nt
%
Gra
de 5
Ala
bam
a W
hite
22
338
%42
438
%1,
332
48%
21
,863
70%
23,8
4267
%N
on-W
hite
36
562
%68
862
%1,
457
52%
9,
320
30%
11,8
3033
%
Haw
aii
Whi
te
116%
186%
7810
%
1,23
414
%1,
341
13%
Non
-Whi
te
165
94%
300
94%
667
90%
7,
899
86%
9,03
187
%S
outh
Dak
ota
Whi
te
5438
%11
452
%32
068
%
5,45
489
%5,
942
85%
Non
-Whi
te
8862
%10
448
%14
832
%
685
11%
1,02
515
%
Wis
cons
in
Whi
te
385
39%
684
49%
1,74
062
%
33,8
2784
%36
,636
80%
Non
-Whi
te
595
61%
725
51%
1,06
738
%
6,55
416
%8,
941
20%
Gra
de 8
Ala
bam
a W
hite
16
732
%51
434
%1,
719
46%
21
,604
71%
24,0
0466
%N
on-W
hite
34
968
%99
166
%1,
997
54%
9,
010
29%
12,3
4734
%
Haw
aii
Whi
te
76%
135%
588%
1,
079
12%
1,15
712
%N
on-W
hite
10
994
%26
995
%71
292
%
7,70
488
%8,
794
88%
Sou
thD
akot
a W
hite
77
42%
144
51%
361
71%
6,
170
90%
6,75
287
%N
on-W
hite
10
658
%14
049
%14
429
%
652
10%
1,04
213
%
Wis
cons
in
Whi
te
259
28%
484
40%
1,36
456
%
37,7
3985
%39
,846
81%
Non
-Whi
te
682
72%
731
60%
1,07
144
%
6,58
815
%9,
072
19%
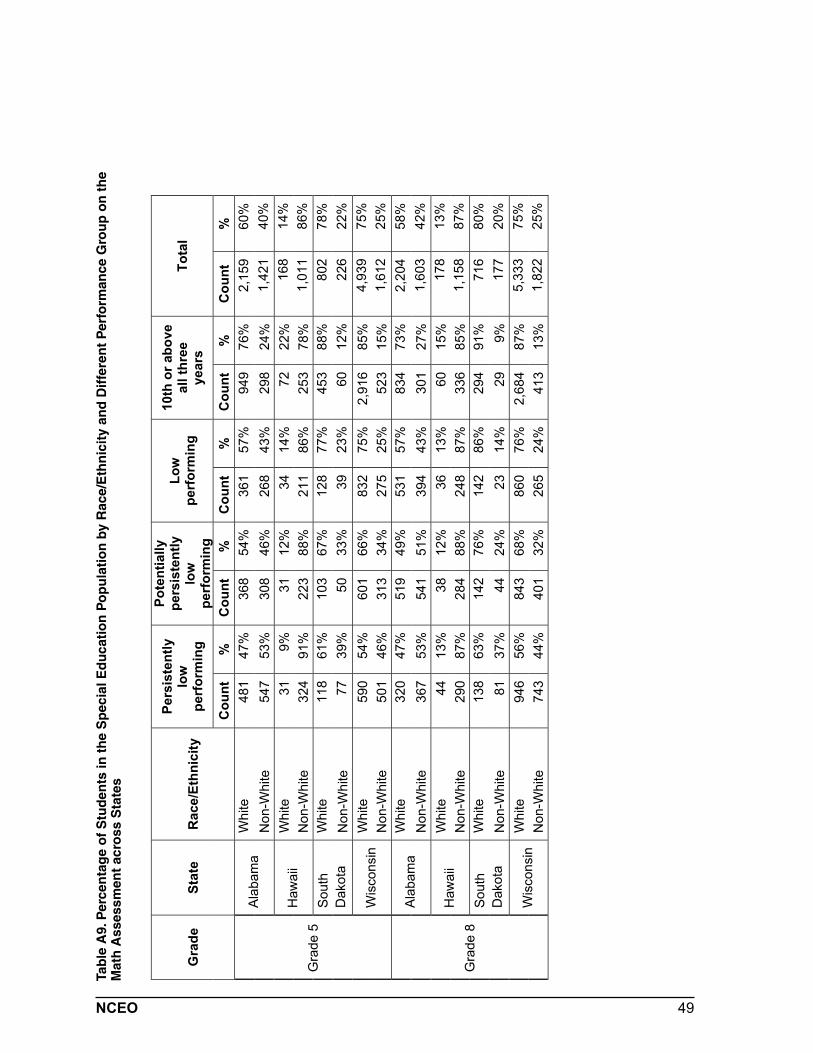
49NCEO
Tab
le A
9. P
erce
nta
ge
of
Stu
den
ts in
th
e S
pec
ial E
du
cati
on
Po
pu
lati
on
by
Rac
e/E
thn
icit
y an
d D
iffe
ren
t P
erfo
rman
ce G
rou
p o
n t
he
Mat
h A
sses
smen
t ac
ross
Sta
tes
12‐8‐11 KL and
BC with
new
con
clusion
55
Tabl
e A
9. P
erce
ntag
e of
Stu
dent
s in
the
Spec
ial E
duca
tion
Popu
latio
n by
Rac
e/Et
hnic
ity a
nd D
iffer
ent P
erfo
rman
ce G
roup
on
the
Mat
h A
sses
smen
t acr
oss
Stat
es
Gra
de
Stat
e R
ace/
Ethn
icity
Pers
iste
ntly
lo
w
perf
orm
ing
Pote
ntia
lly
pers
iste
ntly
lo
w
perf
orm
ing
Low
pe
rfor
min
g 10
th o
r abo
ve
all t
hree
ye
ars
Tota
l
Cou
nt
%
Cou
nt
%
Cou
nt
%
Cou
nt
%
Cou
nt
%
Gra
de 5
Ala
bam
a W
hite
48
147
%36
854
%36
157
%
949
76%
2,15
960
%N
on-W
hite
54
753
%30
846
%26
843
%
298
24%
1,42
140
%
Haw
aii
Whi
te
319%
3112
%34
14%
72
22%
168
14%
Non
-Whi
te
324
91%
223
88%
211
86%
25
378
%1,
011
86%
Sou
thD
akot
a W
hite
11
861
%10
367
%12
877
%
453
88%
802
78%
Non
-Whi
te
7739
%50
33%
3923
%
6012
%22
622
%
Wis
cons
in
Whi
te
590
54%
601
66%
832
75%
2,
916
85%
4,93
975
%N
on-W
hite
50
146
%31
334
%27
525
%
523
15%
1,61
225
%
Gra
de 8
Ala
bam
a W
hite
32
047
%51
949
%53
157
%
834
73%
2,20
458
%N
on-W
hite
36
753
%54
151
%39
443
%
301
27%
1,60
342
%
Haw
aii
Whi
te
4413
%38
12%
3613
%
6015
%17
813
%N
on-W
hite
29
087
%28
488
%24
887
%
336
85%
1,15
887
%S
outh
Dak
ota
Whi
te
138
63%
142
76%
142
86%
29
491
%71
680
%N
on-W
hite
81
37%
4424
%23
14%
29
9%17
720
%
Wis
cons
in
Whi
te
946
56%
843
68%
860
76%
2,
684
87%
5,33
375
%N
on-W
hite
74
344
%40
132
%26
524
%
413
13%
1,82
225
%

50 NCEO
Tab
le A
10. P
erce
nta
ge
of
Stu
den
ts in
th
e N
on
-Sp
ecia
l Ed
uca
tio
n P
op
ula
tio
n b
y In
com
e L
evel
an
d D
iffe
ren
t P
erfo
rman
ce G
rou
p o
n
the
Rea
din
g A
sses
smen
t ac
ross
Sta
tes
12‐8‐11 KL and
BC with
new
con
clusion
56
Tabl
e A
10. P
erce
ntag
e of
Stu
dent
s in
the
Non
-Spe
cial
Edu
catio
n Po
pula
tion
by In
com
e Le
vel a
nd D
iffer
ent P
erfo
rman
ce G
roup
on
the
Rea
ding
Ass
essm
ent a
cros
s St
ates
Gra
de
Stat
e In
com
e Le
vel
Pers
iste
ntly
lo
w
perf
orm
ing
Pote
ntia
lly
pers
iste
ntly
lo
w
perf
orm
ing
Low
pe
rfor
min
g 10
th o
r abo
ve
all t
hree
ye
ars
Tota
l
Cou
nt
%
Cou
nt
%
Cou
nt
%
Cou
nt
%
Cou
nt
%
Gra
de 5
Ala
bam
a N
ot in
Low
-Inco
me
N/A
N/A
N/A
N/A
N/A
N
/AN
/AN
/AN
/AN
/ALo
w-In
com
e N
/AN
/AN
/AN
/AN
/A
N/A
N/A
N/A
N/A
N/A
Haw
aii
Not
in L
ow-In
com
e 29
20%
7226
%24
4 37
%5,
607
60%
5,95
257
%Lo
w-In
com
e 11
580
%20
074
%41
9 63
%3,
691
40%
4,42
543
%S
outh
Dak
ota
Not
in L
ow-In
com
e 76
49%
120
50%
286
55%
4,26
171
%4,
743
69%
Low
-Inco
me
8051
%11
950
%23
7 45
%1,
737
29%
2,17
331
%
Wis
cons
in
Not
in L
ow-In
com
e 22
131
%47
640
%1,
110
46%
30,1
9673
%32
,003
70%
Low
-Inco
me
482
69%
728
60%
1,32
4 54
%10
,930
27%
13,4
6430
%
Gra
de 8
Ala
bam
a N
ot in
Low
-Inco
me
N/A
N/A
N/A
N/A
N/A
N
/AN
/AN
/AN
/AN
/ALo
w-In
com
e N
/AN
/AN
/AN
/AN
/A
N/A
N/A
N/A
N/A
N/A
Haw
aii
Not
in L
ow-In
com
e 36
32%
9439
%30
6 41
%5,
539
63%
5,97
560
%Lo
w-In
com
e 76
68%
148
61%
439
59%
3,31
737
%3,
980
40%
Sou
thD
akot
a N
ot in
Low
-Inco
me
7850
%13
452
%32
0 59
%5,
127
75%
5,65
973
%Lo
w-In
com
e 79
50%
126
48%
220
41%
1,70
925
%2,
134
27%
Wis
cons
in
Not
in L
ow-In
com
e 19
324
%36
832
%1,
067
46%
34,1
8477
%35
,812
73%
Low
-Inco
me
610
76%
776
68%
1,24
8 54
%10
,490
23%
13,1
2427
%
N/A
= A
laba
ma
free
or
redu
ced
lunc
h da
ta w
ere
not a
vaila
ble.

51NCEO
Tab
le A
11. P
erce
nta
ge
of
Stu
den
ts in
th
e S
pec
ial E
du
cati
on
Po
pu
lati
on
by
Inco
me
Lev
el a
nd
Dif
fere
nt
Per
form
ance
Gro
up
on
th
e R
ead
ing
Ass
essm
ent
acro
ss S
tate
s
12‐8‐11 KL and
BC with
new
con
clusion
57
Tabl
e A
11. P
erce
ntag
e of
Stu
dent
s in
the
Spec
ial E
duca
tion
Popu
latio
n by
Inco
me
Leve
l and
Diff
eren
t Per
form
ance
Gro
up o
n th
e R
eadi
ng A
sses
smen
t acr
oss
Stat
es
Gra
de
Stat
e In
com
e Le
vel
Pers
iste
ntly
lo
w
perf
orm
ing
Pote
ntia
lly
pers
iste
ntly
lo
w
perf
orm
ing
Low
pe
rfor
min
g 10
th o
r abo
ve
all t
hree
ye
ars
Tota
l
Cou
nt
%
Cou
nt
%
Cou
nt
%
Cou
nt
%
Cou
nt
%
Gra
de 5
Ala
bam
a N
ot in
Low
-Inco
me
N/A
N/A
N/A
N/A
N/A
N
/AN
/AN
/AN
/AN
/ALo
w-In
com
e N
/AN
/AN
/AN
/AN
/A
N/A
N/A
N/A
N/A
N/A
Haw
aii
Not
in L
ow-In
com
e 13
332
%88
37%
86
42%
169
53%
476
40%
Low
-Inco
me
289
68%
148
63%
117
58%
152
47%
706
60%
Sou
thD
akot
a N
ot in
Low
-Inco
me
8445
%70
39%
107
57%
268
58%
529
52%
Low
-Inco
me
104
55%
109
61%
81
43%
191
42%
485
48%
Wis
cons
in
Not
in L
ow-In
com
e 57
638
%46
847
%50
6 50
%1,
877
65%
3,42
754
%Lo
w-In
com
e 92
162
%52
953
%49
9 50
%1,
007
35%
2,95
646
%
Gra
de 8
Ala
bam
a N
ot in
Low
-Inco
me
N/A
N/A
N/A
N/A
N/A
N
/AN
/AN
/AN
/AN
/ALo
w-In
com
e N
/AN
/AN
/AN
/AN
/A
N/A
N/A
N/A
N/A
N/A
Haw
aii
Not
in L
ow-In
com
e 12
033
%11
539
%11
6 45
%22
855
%57
943
%Lo
w-In
com
e 24
667
%18
361
%14
4 55
%18
345
%75
657
%S
outh
Dak
ota
Not
in L
ow-In
com
e 11
854
%84
51%
88
50%
195
59%
485
54%
Low
-Inco
me
102
46%
8149
%87
50
%13
841
%40
846
%
Wis
cons
in
Not
in L
ow-In
com
e 72
637
%52
848
%62
9 56
%1,
927
65%
3,81
053
%Lo
w-In
com
e 1,
228
63%
565
52%
504
44%
1,03
335
%3,
330
47%
N/A
= A
laba
ma
free
or
redu
ced
lunc
h da
ta w
ere
not a
vaila
ble.

52 NCEO
Tab
le A
12. P
erce
nta
ge
of
Stu
den
ts in
th
e N
on
-Sp
ecia
l Ed
uca
tio
n P
op
ula
tio
n b
y In
com
e L
evel
an
d D
iffe
ren
t P
erfo
rman
ce G
rou
p o
n
the
Mat
h A
sses
smen
t ac
ross
Sta
tes
12‐8‐11 KL and
BC with
new
con
clusion
58
Tabl
e A
12. P
erce
ntag
e of
Stu
dent
s in
the
Non
-Spe
cial
Edu
catio
n Po
pula
tion
by In
com
e Le
vel a
nd D
iffer
ent P
erfo
rman
ce G
roup
on
the
Mat
h A
sses
smen
t acr
oss
Stat
es
Gra
de
Stat
e In
com
e Le
vel
Pers
iste
ntly
lo
w
perf
orm
ing
Pote
ntia
lly
pers
iste
ntly
lo
w
perf
orm
ing
Low
pe
rfor
min
g 10
th o
r abo
ve
all t
hree
ye
ars
Tota
l
Cou
nt
%
Cou
nt
%
Cou
nt
%
Cou
nt
%
Cou
nt
%
Gra
de 5
Ala
bam
a N
ot in
Low
-Inco
me
N/A
N/A
N/A
N/A
N/A
N
/AN
/AN
/AN
/AN
/ALo
w-In
com
e N
/AN
/AN
/AN
/AN
/A
N/A
N/A
N/A
N/A
N/A
Haw
aii
Not
in L
ow-In
com
e 46
26%
100
31%
264
35%
5,54
061
%5,
950
57%
Low
-Inco
me
130
74%
218
69%
481
65%
3,59
339
%4,
422
43%
Sou
thD
akot
a N
ot in
Low
-Inco
me
6143
%99
45%
236
50%
4,38
171
%4,
777
69%
Low
-Inco
me
8157
%11
955
%23
2 50
%1,
758
29%
2,19
031
%
Wis
cons
in
Not
in L
ow-In
com
e 28
329
%49
735
%1,
339
48%
29,9
1174
%32
,030
70%
Low
-Inco
me
697
71%
912
65%
1,46
8 52
%10
,470
26%
13,5
4730
%
Gra
de 8
Ala
bam
a N
ot in
Low
-Inco
me
N/A
N/A
N/A
N/A
N/A
N
/AN
/AN
/AN
/AN
/ALo
w-In
com
e N
/AN
/AN
/AN
/AN
/A
N/A
N/A
N/A
N/A
N/A
Haw
aii
Not
in L
ow-In
com
e 43
37%
124
44%
335
44%
5,46
962
%5,
971
60%
Low
-Inco
me
7363
%15
856
%43
5 56
%3,
314
38%
3,98
040
%S
outh
Dak
ota
Not
in L
ow-In
com
e 85
46%
130
46%
284
56%
5,15
676
%5,
655
73%
Low
-Inco
me
9854
%15
454
%22
1 44
%1,
666
24%
2,13
927
%
Wis
cons
in
Not
in L
ow-In
com
e 24
126
%40
233
%1,
096
45%
34,0
6277
%35
,801
73%
Low
-Inco
me
700
74%
813
67%
1,33
9 55
%10
,265
23%
13,1
1727
%
N/A
= A
laba
ma
free
or
redu
ced
lunc
h da
ta w
ere
not a
vaila
ble.
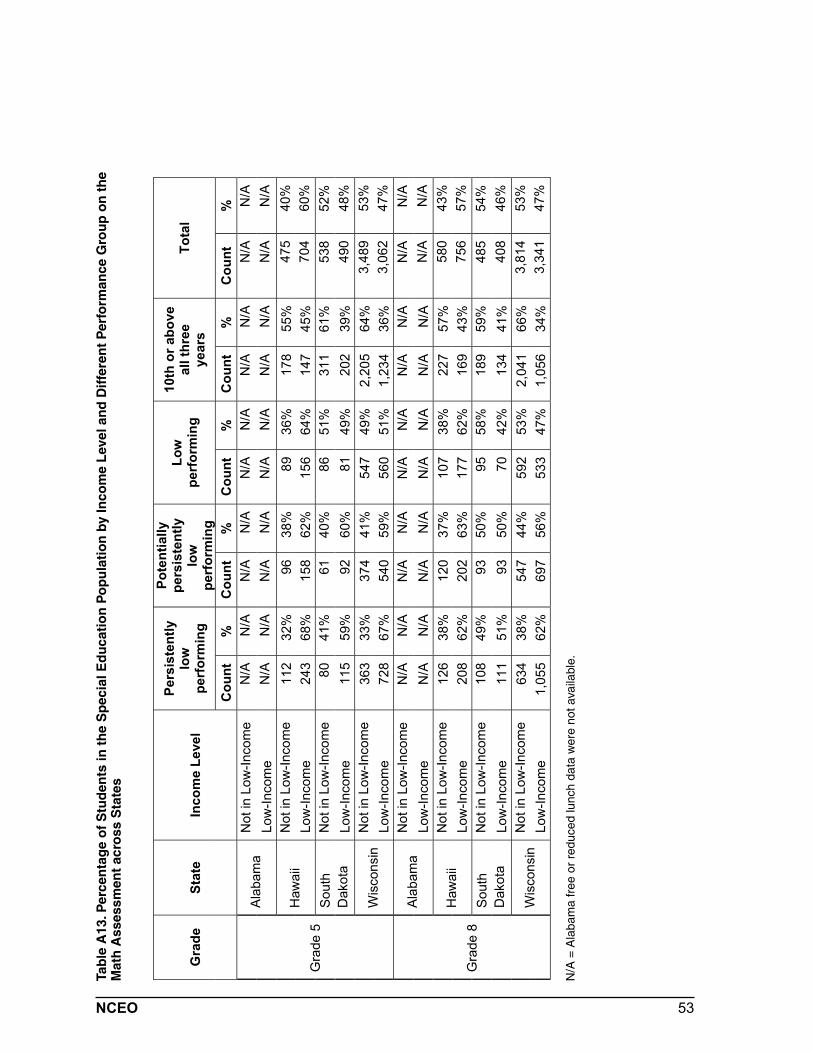
53NCEO
Tab
le A
13. P
erce
nta
ge
of
Stu
den
ts in
th
e S
pec
ial E
du
cati
on
Po
pu
lati
on
by
Inco
me
Lev
el a
nd
Dif
fere
nt
Per
form
ance
Gro
up
on
th
e M
ath
Ass
essm
ent
acro
ss S
tate
s
12‐8‐11 KL and
BC with
new
con
clusion
59
Tabl
e A
13. P
erce
ntag
e of
Stu
dent
s in
the
Spec
ial E
duca
tion
Popu
latio
n by
Inco
me
Leve
l and
Diff
eren
t Per
form
ance
Gro
up o
n th
e M
ath
Ass
essm
ent a
cros
s St
ates
Gra
de
Stat
e In
com
e Le
vel
Pers
iste
ntly
lo
w
perf
orm
ing
Pote
ntia
lly
pers
iste
ntly
lo
w
perf
orm
ing
Low
pe
rfor
min
g 10
th o
r abo
ve
all t
hree
ye
ars
Tota
l
Cou
nt
%
Cou
nt
%
Cou
nt
%
Cou
nt
%
Cou
nt
%
Gra
de 5
Ala
bam
a N
ot in
Low
-Inco
me
N/A
N/A
N/A
N/A
N/A
N
/AN
/AN
/AN
/AN
/ALo
w-In
com
e N
/AN
/AN
/AN
/AN
/A
N/A
N/A
N/A
N/A
N/A
Haw
aii
Not
in L
ow-In
com
e 11
232
%96
38%
89
36%
178
55%
475
40%
Low
-Inco
me
243
68%
158
62%
156
64%
147
45%
704
60%
Sou
thD
akot
a N
ot in
Low
-Inco
me
8041
%61
40%
86
51%
311
61%
538
52%
Low
-Inco
me
115
59%
9260
%81
49
%20
239
%49
048
%
Wis
cons
in
Not
in L
ow-In
com
e 36
333
%37
441
%54
7 49
%2,
205
64%
3,48
953
%Lo
w-In
com
e 72
867
%54
059
%56
0 51
%1,
234
36%
3,06
247
%
Gra
de 8
Ala
bam
a N
ot in
Low
-Inco
me
N/A
N/A
N/A
N/A
N/A
N
/AN
/AN
/AN
/AN
/ALo
w-In
com
e N
/AN
/AN
/AN
/AN
/A
N/A
N/A
N/A
N/A
N/A
Haw
aii
Not
in L
ow-In
com
e 12
638
%12
037
%10
7 38
%22
757
%58
043
%Lo
w-In
com
e 20
862
%20
263
%17
7 62
%16
943
%75
657
%S
outh
Dak
ota
Not
in L
ow-In
com
e 10
849
%93
50%
95
58%
189
59%
485
54%
Low
-Inco
me
111
51%
9350
%70
42
%13
441
%40
846
%
Wis
cons
in
Not
in L
ow-In
com
e 63
438
%54
744
%59
2 53
%2,
041
66%
3,81
453
%Lo
w-In
com
e 1,
055
62%
697
56%
533
47%
1,05
634
%3,
341
47%
N/A
= A
laba
ma
free
or
redu
ced
lunc
h da
ta w
ere
not a
vaila
ble.

54 NCEO

55NCEO
Ap
pen
dix
B
Tabl
es S
uppo
rtin
g R
esea
rch
Que
stio
n 2
Tab
le B
1. P
erce
nta
ge
of
No
n-S
pec
ial E
du
cati
on
an
d S
pec
ial E
du
cati
on
Lo
w P
erfo
rmin
g S
tud
ents
on
th
e R
ead
ing
Ass
essm
ent
by
Gra
de
acro
ss S
tate
s
12‐8‐11 KL and
BC with
new
con
clusion
60
App
endi
x B
Ta
ble
B1.
Per
cent
age
of N
on-S
peci
al E
duca
tion
and
Spec
ial E
duca
tion
Low
Per
form
ing
Stud
ents
on
the
Rea
ding
Ass
essm
ent b
y G
rade
ac
ross
Sta
tes
Gra
de
Gro
up
Perf
orm
ance
Gro
up
Ala
bam
a H
awai
i So
uth
Dak
ota
Wis
cons
in
Cou
nt
%
Cou
nt
%
Cou
nt
%
Cou
nt
%
Gra
de 5
Non
-Spe
cial
E
duca
tion
Per
sist
ently
low
per
form
ing
557
31%
144
27%
156
32%
703
28%
Low
per
form
ing
in y
ear 1
and
3
214
12%
75
14%
5712
%32
613
%Lo
w p
erfo
rmin
g in
yea
r 1 a
nd 2
32
018
%10
0 19
%10
221
%50
520
%In
itial
ly L
ow p
erfo
rmin
g 72
840
%21
8 41
%17
936
%97
739
%
Tota
l 1,
819
100 %
537
100 %
494
100 %
2,51
110
0%
Spe
cial
Edu
catio
n
Per
sist
ently
low
per
form
ing
1,22
166
%42
2 63
%18
852
%1,
497
55%
Low
per
form
ing
in y
ear 1
and
3
119
6%70
11
%39
11%
258
9%Lo
w p
erfo
rmin
g in
yea
r 1 a
nd 2
27
815
%96
14
%80
22%
471
17%
Initi
ally
Low
per
form
ing
234
13%
77
12%
5716
%50
218
%
Tota
l 1,
852
100 %
665
100 %
364
100 %
2,72
810
0%
Gra
de 8
Non
-Spe
cial
E
duca
tion
Per
sist
ently
low
per
form
ing
647
31%
112
23%
157
29%
803
32%
Low
per
form
ing
in y
ear 1
and
3
205
10%
72
15%
6813
%32
213
%Lo
w p
erfo
rmin
g in
yea
r 1 a
nd 2
45
121
%76
16
%12
122
%48
319
%In
itial
ly L
ow p
erfo
rmin
g 81
038
%22
1 46
%19
436
%88
936
%
Tota
l 2,
113
100 %
481
100 %
540
100 %
2,49
710
0%
Spe
cial
Edu
catio
n
Per
sist
ently
low
per
form
ing
1,09
559
%36
6 56
%22
058
%1,
954
61%
Low
per
form
ing
in y
ear 1
and
3
138
7%72
11
%46
12%
367
11%
Low
per
form
ing
in y
ear 1
and
2
374
20%
124
19%
6517
%39
012
%In
itial
ly L
ow p
erfo
rmin
g 25
414
%89
14
%46
12%
500
16%
Tota
l 1,
861
100 %
651
100 %
377
100 %
3,21
110
0%

56 NCEO
Tab
le B
2. P
erce
nta
ge
of
No
n-S
pec
ial E
du
cati
on
an
d S
pec
ial E
du
cati
on
Lo
w P
erfo
rmin
g S
tud
ents
on
th
e M
ath
Ass
essm
ent
by G
rad
e ac
ross
Sta
tes
12‐8‐11 KL and
BC with
new
con
clusion
62
Tabl
e B
2. P
erce
ntag
e of
Non
-Spe
cial
Edu
catio
n an
d Sp
ecia
l Edu
catio
n Lo
w P
erfo
rmin
g St
uden
ts o
n th
e M
ath
Ass
essm
ent b
y G
rade
ac
ross
Sta
tes
Gra
de
Gro
up
Perf
orm
ance
Gro
up
Ala
bam
a H
awai
i So
uth
Dak
ota
Wis
cons
in
Cou
nt%
C
ount
%
C
ount
%
Cou
nt%
Gra
de 5
Non
-Spe
cial
E
duca
tion
Per
sist
ently
low
per
form
ing
588
26%
176
28%
142
32%
980
32%
Low
per
form
ing
in y
ear 1
and
3
230
10%
104
17%
6615
%35
912
%Lo
w p
erfo
rmin
g in
yea
r 1 a
nd 2
44
520
%10
0 16
%73
17%
606
20%
Initi
ally
Low
per
form
ing
1,00
044
%24
9 40
%15
836
%1,
124
37%
Tota
l 2,
263
100%
629
100%
439
100%
3,06
910
0%
Spe
cial
Edu
catio
n
Per
sist
ently
low
per
form
ing
1,02
860
%35
5 61
%19
554
%1,
091
51%
Low
per
form
ing
in y
ear 1
and
3
163
9%68
12
%43
12%
244
11%
Low
per
form
ing
in y
ear 1
and
2
288
17%
96
16%
5816
%32
515
%In
itial
ly L
ow p
erfo
rmin
g 23
914
%65
11
%63
18%
463
22%
Tota
l 1,
718
100%
584
100%
359
100%
2,12
310
0%
Gra
de 8
Non
-Spe
cial
E
duca
tion
Per
sist
ently
low
per
form
ing
516
21%
116
24%
183
31%
941
35%
Low
per
form
ing
in y
ear 1
and
3
361
15%
67
14%
7513
%33
212
%Lo
w p
erfo
rmin
g in
yea
r 1 a
nd 2
60
625
%10
5 22
%12
722
%43
416
%In
itial
ly L
ow p
erfo
rmin
g 98
240
%19
0 40
%20
134
%97
336
%To
tal
2,46
510
0%47
8 10
0%58
610
0%2,
680
100%
Spe
cial
Edu
catio
n
Per
sist
ently
low
per
form
ing
687
38%
334
50%
219
55%
1,68
956
%Lo
w p
erfo
rmin
g in
yea
r 1 a
nd 3
24
013
%76
11
%44
11%
340
11%
Low
per
form
ing
in y
ear 1
and
2
556
31%
159
24%
7118
%54
118
%In
itial
ly L
ow p
erfo
rmin
g 31
217
%95
14
%61
15%
471
15%
Tota
l 1,
795
100%
664
100%
395
100%
3,04
110
0%

57NCEO
Tabl
es S
uppo
rtin
g R
esea
rch
Que
stio
n 3
Tab
le C
1. P
erce
nta
ge
of
Gra
de
5 N
on
-Sp
ecia
l Ed
uca
tio
n a
nd
Sp
ecia
l Ed
uca
tio
n L
ow
Per
form
ing
Stu
den
ts o
n t
he
Rea
din
g
Ass
essm
ent
by G
end
er a
cro
ss S
tate
s
Ap
pen
dix
C
12‐8‐11 KL and
BC with
new
con
clusion
63
App
endi
x C
Ta
ble
C1.
Per
cent
age
of G
rade
5 N
on-S
peci
al E
duca
tion
and
Spec
ial E
duca
tion
Low
Per
form
ing
Stud
ents
on
the
Rea
ding
Ass
essm
ent
by G
ende
r acr
oss
Stat
es
Gro
up
Gen
der
Perf
orm
ance
Gro
up
Ala
bam
a H
awai
i So
uth
Dak
ota
Wis
cons
in
Cou
nt
%
Cou
nt
%
Cou
nt
%
Cou
nt
%
Non
-Spe
cial
E
duca
tion
Mal
e
Per
sist
ently
low
per
form
ing
368
32%
98
29%
9033
%39
628
%Lo
w p
erfo
rmin
g in
yea
r 1 a
nd 3
12
511
%46
14
%24
9%18
313
%Lo
w p
erfo
rmin
g in
yea
r 1 a
nd 2
21
018
%63
19
%53
19%
281
20%
Initi
ally
Low
per
form
ing
440
39%
128
38%
109
40%
562
40%
Fem
ale
Per
sist
ently
low
per
form
ing
189
28%
46
23%
6630
%30
728
%Lo
w p
erfo
rmin
g in
yea
r 1 a
nd 3
89
13%
29
14%
3315
%14
313
%Lo
w p
erfo
rmin
g in
yea
r 1 a
nd 2
11
016
%37
18
%49
23%
224
21%
Initi
ally
Low
per
form
ing
288
43%
90
45%
7032
%41
538
%
Spe
cial
Edu
catio
n
Mal
e
Per
sist
ently
low
per
form
ing
867
68%
315
64%
118
51%
976
54%
Low
per
form
ing
in y
ear 1
and
3
756%
52
11%
2310
%18
310
%Lo
w p
erfo
rmin
g in
yea
r 1 a
nd 2
17
114
%73
15
%49
21%
315
17%
Initi
ally
Low
per
form
ing
157
12%
54
11%
4218
%34
819
%
Fem
ale
Per
sist
ently
low
per
form
ing
354
61%
107
63%
7053
%52
158
%Lo
w p
erfo
rmin
g in
yea
r 1 a
nd 3
44
8%18
11
%16
12%
758%
Low
per
form
ing
in y
ear 1
and
2
107
18%
23
14%
3124
%15
617
%In
itial
ly L
ow p
erfo
rmin
g 77
13%
23
14%
1511
%15
417
%

58 NCEO
Tab
le C
2. P
erce
nta
ge
of
Gra
de
5 N
on
-Sp
ecia
l Ed
uca
tio
n a
nd
Sp
ecia
l Ed
uca
tio
n L
ow
Per
form
ing
Stu
den
ts o
n t
he
Rea
din
g
Ass
essm
ent
by R
ace/
Eth
nic
ity
acro
ss S
tate
s
12‐8‐11 KL and
BC with
new
con
clusion
64
Tabl
e C
2. P
erce
ntag
e of
Gra
de 5
Non
-Spe
cial
Edu
catio
n an
d Sp
ecia
l Edu
catio
n Lo
w P
erfo
rmin
g St
uden
ts o
n th
e R
eadi
ng A
sses
smen
t by
Rac
e/Et
hnic
ity a
cros
s St
ates
Gro
up
Rac
e/
Ethn
icity
Pe
rfor
man
ce G
roup
A
laba
ma
Haw
aii
Sout
h D
akot
a W
isco
nsin
C
ount
%
C
ount
%
C
ount
%
C
ount
%
Non
-Spe
cial
E
duca
tion
Non
-Whi
te
Per
sist
ently
low
per
form
ing
353
32%
138
28%
81
40%
382
34%
Low
per
form
ing
in y
ear 1
and
3
140
13%
68
14%
23
11%
163
14%
Low
per
form
ing
in y
ear 1
and
2
208
19%
92
19%
41
20%
214
19%
Initi
ally
Low
per
form
ing
400
36%
195
40%
58
29%
370
33%
Whi
te
Per
sist
ently
low
per
form
ing
204
29%
--
7526
%32
123
%Lo
w p
erfo
rmin
g in
yea
r 1 a
nd 3
74
10%
--
3412
%16
312
%Lo
w p
erfo
rmin
g in
yea
r 1 a
nd 2
11
116
%-
-61
21%
291
21%
Initi
ally
Low
per
form
ing
328
46%
23
52%
12
142
%60
744
%
Spe
cial
Edu
catio
n
Non
-Whi
te
Per
sist
ently
low
per
form
ing
621
69%
379
65%
79
64%
562
65%
Low
per
form
ing
in y
ear 1
and
3
455%
56
10%
-
-79
9%Lo
w p
erfo
rmin
g in
yea
r 1 a
nd 2
13
115
%82
14
%
2319
%11
113
%In
itial
ly L
ow p
erfo
rmin
g 99
11%
67
12%
14
11%
109
13%
Whi
te
Per
sist
ently
low
per
form
ing
598
63%
43
53%
10
945
%93
550
%Lo
w p
erfo
rmin
g in
yea
r 1 a
nd 3
73
8%14
17
%
3113
%17
910
%Lo
w p
erfo
rmin
g in
yea
r 1 a
nd 2
14
715
%14
17
%
5724
%36
019
%In
itial
ly L
ow p
erfo
rmin
g 13
414
%10
12
%
4318
%39
321
%N
ote:
-=
cell
size
less
than
10.

59NCEO
Tab
le C
3. P
erce
nta
ge
of
Gra
de
5 N
on
-Sp
ecia
l Ed
uca
tio
n a
nd
Sp
ecia
l Ed
uca
tio
n L
ow
Per
form
ing
Stu
den
ts o
n t
he
Rea
din
g
Ass
essm
ent
by In
com
e L
evel
acr
oss
Sta
tes
12‐8‐11 KL and
BC with
new
con
clusion
65
Tabl
e C
3. P
erce
ntag
e of
Gra
de 5
Non
-Spe
cial
Edu
catio
n an
d Sp
ecia
l Edu
catio
n Lo
w P
erfo
rmin
g St
uden
ts o
n th
e R
eadi
ng A
sses
smen
t by
Inco
me
Leve
l acr
oss
Stat
es
Gro
up
Inco
me
Leve
l Pe
rfor
man
ce g
roup
A
laba
ma
Haw
aii
Sout
h D
akot
a W
isco
nsin
C
ount
%
C
ount
%
C
ount
%
C
ount
%
Non
-Spe
cial
E
duca
tion
Low
-Inco
me
Per
sist
ently
low
per
form
ing
115
31%
8033
%48
232
%Lo
w p
erfo
rmin
g in
yea
r 1 a
nd 3
53
14
%32
13%
208
14%
Low
per
form
ing
in y
ear 1
and
2
78
21%
5021
%29
720
%In
itial
ly L
ow p
erfo
rmin
g 13
1 35
%80
33%
533
35%
Not
inLo
w-In
com
e
Per
sist
ently
low
per
form
ing
29
18%
7630
%22
122
%Lo
w p
erfo
rmin
g in
yea
r 1 a
nd 3
22
14
%25
10%
118
12%
Low
per
form
ing
in y
ear 1
and
2
22
14%
5221
%20
821
%In
itial
ly L
ow p
erfo
rmin
g 87
54
%99
39%
444
45%
Spe
cial
Edu
catio
n
Low
-Inco
me
Per
sist
ently
low
per
form
ing
289
66%
104
52%
921
60%
Low
per
form
ing
in y
ear 1
and
3
48
11%
2412
%14
29%
Low
per
form
ing
in y
ear 1
and
2
58
13%
5025
%23
215
%In
itial
ly L
ow p
erfo
rmin
g 46
10
%21
11%
245
16%
Not
inLo
w-In
com
e
Per
sist
ently
low
per
form
ing
133
59%
8451
%57
649
%Lo
w p
erfo
rmin
g in
yea
r 1 a
nd 3
22
10
%15
9%11
610
%Lo
w p
erfo
rmin
g in
yea
r 1 a
nd 2
38
17
%30
18%
239
20%
Initi
ally
Low
per
form
ing
31
14%
3622
%25
722
%

60 NCEO
Tab
le C
4. P
erce
nta
ge
of
Gra
de
5 N
on
-Sp
ecia
l Ed
uca
tio
n a
nd
Sp
ecia
l Ed
uca
tio
n L
ow
Per
form
ing
Stu
den
ts o
n t
he
Mat
h A
sses
smen
t by
Gen
der
acr
oss
Sta
tes
12‐8‐11 KL and
BC with
new
con
clusion
66
Tabl
e C
4. P
erce
ntag
e of
Gra
de 5
Non
-Spe
cial
Edu
catio
n an
d Sp
ecia
l Edu
catio
n Lo
w P
erfo
rmin
g St
uden
ts o
n th
e M
ath
Ass
essm
ent b
y G
ende
r acr
oss
Stat
es
Gro
up
Gen
der
Perf
orm
ance
Gro
up
Ala
bam
a H
awai
i So
uth
Dak
ota
Wis
cons
in
Cou
nt%
C
ount
%
Cou
nt%
C
ount
%
Non
-Spe
cial
E
duca
tion
Mal
e
Per
sist
ently
low
per
form
ing
317
27%
8125
%71
35%
401
30%
Low
per
form
ing
in y
ear 1
and
3
147
13%
6620
%30
15%
172
13%
Low
per
form
ing
in y
ear 1
and
2
222
19%
5517
%33
16%
255
19%
Initi
ally
Low
per
form
ing
487
42%
127
39%
6733
%51
138
%
Fem
ale
Per
sist
ently
low
per
form
ing
271
25%
9532
%71
30%
579
34%
Low
per
form
ing
in y
ear 1
and
3
838%
3813
%36
15%
187
11%
Low
per
form
ing
in y
ear 1
and
2
223
21%
4515
%40
17%
351
20%
Initi
ally
Low
per
form
ing
513
47%
122
41%
9138
%61
335
%
Spe
cial
Edu
catio
n
Mal
e
Per
sist
ently
low
per
form
ing
671
61%
228
56%
121
55%
599
48%
Low
per
form
ing
in y
ear 1
and
3
111
10%
5213
%25
11%
153
12%
Low
per
form
ing
in y
ear 1
and
2
169
15%
7719
%35
16%
181
15%
Initi
ally
Low
per
form
ing
146
13%
5313
%41
19%
307
25%
Fem
ale
Per
sist
ently
low
per
form
ing
357
58%
127
73%
7454
%49
256
%Lo
w p
erfo
rmin
g in
yea
r 1 a
nd 3
52
8%16
9%18
13%
9110
%Lo
w p
erfo
rmin
g in
yea
r 1 a
nd 2
11
919
%19
11%
2317
%14
416
%In
itial
ly L
ow p
erfo
rmin
g 93
15%
127%
2216
%15
618
%

61NCEO
Tab
le C
5. P
erce
nta
ge
of
Gra
de
5 N
on
-Sp
ecia
l Ed
uca
tio
n a
nd
Sp
ecia
l Ed
uca
tio
n L
ow
Per
form
ing
Stu
den
ts o
n t
he
Mat
h A
sses
smen
t by
R
ace/
Eth
nic
ity
acro
ss S
tate
s
12‐8‐11 KL and
BC with
new
con
clusion
67
Tabl
e C
5. P
erce
ntag
e of
Gra
de 5
Non
-Spe
cial
Edu
catio
n an
d Sp
ecia
l Edu
catio
n Lo
w P
erfo
rmin
g St
uden
ts o
n th
e M
ath
Ass
essm
ent b
y R
ace/
Ethn
icity
acr
oss
Stat
es
Gro
up
Rac
e/
Ethn
icity
Pe
rfor
man
ce G
roup
A
laba
ma
Haw
aii
Sout
h D
akot
a W
isco
nsin
C
ount
%
C
ount
%
C
ount
%
C
ount
%
Non
-Spe
cial
E
duca
tion
Non
-Whi
te
Per
sist
ently
low
per
form
ing
364
27%
165
28%
88
42%
595
39%
Low
per
form
ing
in y
ear 1
and
3
145
11%
99
17%
37
18%
208
14%
Low
per
form
ing
in y
ear 1
and
2
280
21%
96
16%
31
15%
295
19%
Initi
ally
Low
per
form
ing
538
41%
230
39%
52
25%
441
29%
Whi
te
Per
sist
ently
low
per
form
ing
223
24%
11
28%
54
23%
385
25%
Low
per
form
ing
in y
ear 1
and
3
859%
--
2913
%15
110
%Lo
w p
erfo
rmin
g in
yea
r 1 a
nd 2
16
418
%-
-42
18%
311
20%
Initi
ally
Low
per
form
ing
461
49%
19
49%
10
646
%68
345
%
Spe
cial
Edu
catio
n
Non
-Whi
te
Per
sist
ently
low
per
form
ing
546
63%
324
62%
77
59%
501
61%
Low
per
form
ing
in y
ear 1
and
3
738%
60
12%
15
12%
9512
%Lo
w p
erfo
rmin
g in
yea
r 1 a
nd 2
13
716
%85
16
%
1915
%10
913
%In
itial
ly L
ow p
erfo
rmin
g 11
213
%54
10
%
1915
%11
514
%
Whi
te
Per
sist
ently
low
per
form
ing
481
57%
31
51%
11
852
%59
045
%Lo
w p
erfo
rmin
g in
yea
r 1 a
nd 3
90
11%
--
2812
%14
911
%Lo
w p
erfo
rmin
g in
yea
r 1 a
nd 2
14
818
%11
18
%
3917
%21
617
%In
itial
ly L
ow p
erfo
rmin
g 12
615
%11
18
%
4419
%34
827
%N
ote:
-=
cell
size
less
than
10.

62 NCEO
Tab
le C
6. P
erce
nta
ge
of
Gra
de
5 N
on
-Sp
ecia
l Ed
uca
tio
n a
nd
Sp
ecia
l Ed
uca
tio
n L
ow
Per
form
ing
Stu
den
ts o
n t
he
Mat
h A
sses
smen
t by
Inco
me
Lev
el a
cro
ss S
tate
s
12‐8‐11 KL and
BC with
new
con
clusion
68
Tabl
e C
6. P
erce
ntag
e of
Gra
de 5
Non
-Spe
cial
Edu
catio
n an
d Sp
ecia
l Edu
catio
n Lo
w P
erfo
rmin
g St
uden
ts o
n th
e M
ath
Ass
essm
ent b
y In
com
e Le
vel a
cros
s St
ates
Gro
up
Inco
me
Leve
l Pe
rfor
man
ce G
roup
A
laba
ma
Haw
aii
Sout
h D
akot
a W
isco
nsin
C
ount
%
C
ount
%
C
ount
%
C
ount
%
Non
-Spe
cial
E
duca
tion
Low
-Inco
me
Per
sist
ently
low
per
form
ing
130
31%
8135
%69
736
%Lo
w p
erfo
rmin
g in
yea
r 1 a
nd 3
65
15
%32
14%
241
13%
Low
per
form
ing
in y
ear 1
and
2
72
17%
3816
%38
420
%In
itial
ly L
ow p
erfo
rmin
g 15
7 37
%83
36%
601
31%
Not
inLo
w-In
com
e
Per
sist
ently
low
per
form
ing
46
22%
6130
%28
325
%Lo
w p
erfo
rmin
g in
yea
r 1 a
nd 3
39
19
%34
17%
118
10%
Low
per
form
ing
in y
ear 1
and
2
28
14%
3517
%22
219
%In
itial
ly L
ow p
erfo
rmin
g 92
45
%75
37%
523
46%
Spe
cial
Edu
catio
n
Low
-Inco
me
Per
sist
ently
low
per
form
ing
243
65%
115
56%
728
56%
Low
per
form
ing
in y
ear 1
and
3
43
12%
2613
%14
912
%Lo
w p
erfo
rmin
g in
yea
r 1 a
nd 2
52
14
%37
18%
194
15%
Initi
ally
Low
per
form
ing
34
9%28
14%
229
18%
Not
inLo
w-In
com
e
Per
sist
ently
low
per
form
ing
112
53%
8052
%36
344
%Lo
w p
erfo
rmin
g in
yea
r 1 a
nd 3
25
12
%17
11%
9512
%Lo
w p
erfo
rmin
g in
yea
r 1 a
nd 2
44
21
%21
14%
131
16%
Initi
ally
Low
per
form
ing
31
15%
3523
%23
428
%