characteristics of private schools in the united states
TRANSCRIPT

Characteristics of Private Schools in the United States: Results From the 2019–20 Private School Universe Survey
First LookNCES 2021-061U.S. DEPARTMENT OF EDUCATION
A Publication of the National Center for Education Statistics at IES

Characteristics of Private Schools in the United States: Results From the 2019–20 Private School Universe Survey
First Look
SEPTEMBER 2021
Stephen P. BroughmanNational Center for Education Statistics
Brian KincelJennifer WillingerJennifer PetersonU.S. Census Bureau
NCES 2021-061
U.S. DEPARTMENT OF EDUCATION

U.S. Department of Education Miguel Cardona Secretary
Institute of Education Sciences Mark Schneider Director
National Center for Education Statistics Peggy G. Carr Commissioner
Sample Surveys Division Christopher Chapman Associate Commissioner The National Center for Education Statistics (NCES) is the primary federal entity for collecting, analyzing, and reporting data related to education in the United States and other nations. It fulfills a congressional mandate to collect, collate, analyze, and report full and complete statistics on the condition of education in the United States; conduct and publish reports and specialized analyses of the meaning and significance of such statistics; assist state and local education agencies in improving their statistical systems; and review and report on education activities in foreign countries. NCES activities are designed to address high-priority education data needs; provide consistent, reliable, complete, and accurate indicators of education status and trends; and report timely, useful, and high-quality data to the U.S. Department of Education, the Congress, the states, other education policymakers, practitioners, data users, and the general public. Unless specifically noted, all information contained herein is in the public domain. We strive to make our products available in a variety of formats and in language that is appropriate to a variety of audiences. You, as our customer, are the best judge of our success in communicating information effectively. If you have any comments or suggestions about this or any other NCES product or report, we would like to hear from you. Please direct your comments to NCES, IES, U.S. Department of Education Potomac Center Plaza (PCP) 550 12th Street SW Washington, DC 20202 September 2021 The NCES Home Page address is http://nces.ed.gov/. The NCES Publications and Products address is http://nces.ed.gov/pubsearch. This publication is only available online. To download, view, and print the report as a PDF file, go to the NCES Publications and Products address shown above. Suggested Citation Broughman, S., Kincel, B., Willinger, J., and Peterson, J. (2021. Characteristics of Private Schools in the United States: Results From the 2019–20 Private School Universe Survey First Look (NCES 2021-061). U.S. Department of Education. Washington, DC: National Center for Education Statistics. Retrieved [date] from http://nces.ed.gov/pubsearch/pubsinfo.asp?pubid=2021061.
Content Contact Stephen Broughman (202) 245-8338 [email protected]

iii
Contents Page
Introduction ..................................................................................................................................... 1
Selected Findings ............................................................................................................................ 2
References ....................................................................................................................................... 4
Appendix A—Glossary ............................................................................................................... A-1
Appendix B—Technical Notes ................................................................................................... B-1
Appendix C—Tables .................................................................................................................. C-1
Appendix D—Standard Error Tables.......................................................................................... D-1

iv
List of Tables
Table Page
Appendix B—Technical Notes
B-1. Number of responding and nonresponding schools, out-of-scope cases, andschool response rate, by frame: 2019–20 ....................................................................... B-3
B-2. Summary of 2019–20 PSS nonresponse bias statistics ................................................. B-6
Appendix C—Tables C-1. Number and percentage distribution of private schools, students, and full-time
equivalent (FTE) teachers, by selected characteristics: United States, 2019–20 .......... C-2
C-2. Number and percentage distribution of private schools, students, and full-timeequivalent (FTE) teachers, by religious or nonsectarian orientation of school: United States, 2019–20 .................................................................................................. C-4
C-3. Percentage distribution of private schools, by program emphasis and selectedcharacteristics: United States, 2019–20 ......................................................................... C-5
C-4. Number and percentage distribution of private schools, by urbanicity type andselected characteristics: United States, 2019–20 .............................................................. C-6
C-5. Number and percentage distribution of private school students, by urbanicitytype and selected characteristics: United States, 2019–20 ................................................ C-8
C-6. Number and percentage distribution of private school students, by grade andprivate school typology: United States, 2019–20 ........................................................ C-10
C-7. Average private school size, by school level and selected characteristics: UnitedStates, 2019–20............................................................................................................ C-11
C-8. Number and percentage distribution of private schools, by school size andselected characteristics: United States, 2019–20 ......................................................... C-12
C-9. Percentage distribution of private school students, by racial/ethnic background and selected characteristics: United States, 2019–20 ............................................................. C-14
C-10. Percentage male enrollment in private schools and percentage distribution ofprivate schools, by sex of students and selected characteristics: United States, 2019–20 ....................................................................................................................... C-16
C-11. Number and percentage distribution of private school teachers (headcount), bywork status and selected characteristics: United States, 2019–20 ............................... C-18
C-12. Pupil/teacher ratio of private schools, by school level and selectedcharacteristics: United States, 2019–20 ....................................................................... C-20
C-13. Percentage of private schools with 12th-graders, number of graduates,graduation rate, and percentage of graduates who attended 4-year colleges, by selected characteristics: United States, 2018–19 ......................................................... C-21

v
Table Page C-14. Number of private schools, students, and teachers (headcount), by school
membership in private school associations: United States, 2019–20 .......................... C-23
C-15. Number of private schools, students, full-time equivalent (FTE) teachers, and 2018–19 high school graduates, by state: United States, 2019–20 ............................. C-24
Appendix D—Standard Error Tables D-1. Standard errors for Table C-1: Number and percentage distribution of private
schools, students, and full-time equivalent (FTE) teachers, by selected characteristics: United States, 2019–20 ......................................................................... D-2
D-2. Standard errors for Table C-2: Number and percentage distribution of private schools, students, and full-time equivalent (FTE) teachers, by religious or nonsectarian orientation of school: United States, 2019–20 ......................................... D-3
D-3. Standard errors for Table C-3: Percentage distribution of private schools, by program emphasis and selected characteristics: United States, 2019–20...................... D-4
D-4. Standard errors for Table C-4: Number and percentage distribution of private schools, by urbanicity type and selected characteristics: United States, 2019–20 ........ D-5
D-5. Standard errors for Table C-5: Number and percentage distribution of private school students, by urbanicity type and selected characteristics: United States, 2019–20 ......................................................................................................................... D-6
D-6. Standard errors for Table C-6: Number and percentage distribution of private school students, by grade and private school typology: United States, 2019–20.......... D-7
D-7. Standard errors for Table C-7: Average private school size, by school level and selected characteristics: United States, 2019–20 ........................................................... D-8
D-8. Standard errors for Table C-8: Number and percentage distribution of private schools, by school size and selected characteristics: United States, 2019–20 .............. D-9
D-9. Standard errors for Table C-9: Percentage distribution of private school students, by racial/ethnic background and selected characteristics: United States, 2019–20............................................................................................................ D-11
D-10. Standard errors for Table C-10: Percentage male enrollment in private schools and percentage distribution of private schools by sex of students and selected characteristics: United States, 2019–20 ....................................................................... D-12
D-11. Standard errors for Table C-11: Number and percentage distribution of private school teachers (headcount), by work status and selected characteristics: United States, 2019–20............................................................................................................ D-13
D-12. Standard errors for Table C-12: Pupil/teacher ratio of private schools, by school level and selected characteristics: United States, 2019–20 ......................................... D-15

vi
Table Page D-13. Standard errors for Table C-13: Percentage of private schools with 12th-
graders, number of graduates, graduation rate, and percentage of graduates who attended 4-year colleges, by selected characteristics: United States, 2018–19 ........... D-16
D-14. Standard errors for Table C-14: Number of private schools, students, and teachers (headcount), by school membership in private school associations: United States, 2019–20 ............................................................................................... D-17
D-15. Standard errors for Table C-15: Number of private schools, students, full-time equivalent (FTE) teachers, and 2018–19 high school graduates, by state: United States, 2019–20............................................................................................................ D-18

1
Introduction In 1988, the National Center for Education Statistics (NCES) developed a private school data collection that improved on the sporadic collection of private school data dating back to 1890 and at the same time developed an alternative to commercially available private school sampling frames. Since 1989, the U.S. Bureau of the Census has conducted the biennial Private School Universe Survey (PSS) for NCES. PSS is designed to generate biennial data on the total number of private schools, students, and teachers, and to build a universe of private schools to serve as a sampling frame of private schools for NCES sample surveys. For more information about the methodology and design of the PSS, please see the Technical Notes section in appendix B of this report.
The target population for the PSS is all schools in the 50 states and the District of Columbia that are not supported primarily by public funds, provide classroom instruction for one or more of grades kindergarten through 12 (or comparable ungraded levels), and have one or more teachers. Organizations or institutions that provide support for home schooling, but do not provide classroom instruction, are not included.
The 2019–20 PSS data were collected between October 2019 and July 2020. All data are for the 2019–20 school year except the high school graduate data, which are for the 2018–19 school year.
Because the purpose of this report is to introduce new NCES survey data through the presentation of tables containing descriptive information, only selected findings are listed below. These findings are purely descriptive in nature and are not meant to imply causality. These findings have been chosen to demonstrate the range of information available from the 2019–20 PSS rather than to discuss all of the observed differences, emphasize any particular issue, or make comparisons over time.
The tables in this report contain estimates that show how several measures relate to each other. However, the measures may have many more relationships than shown in the tables. These more complex relationships are not presented in the report. Relationships shown in the report should not be considered causal. Results are weighted to reflect the sampling and survey nonresponse. Comparisons in the findings were tested using Student’s t tests at a 0.05 level. No adjustments were made for multiple comparisons.

2
Selected Findings
• In the fall of 2019, there were 30,492 private elementary and secondary schools with 4,652,904 students and 481,200 full-time-equivalent (FTE) teachers in the United States (table C-1).
• Sixty-six percent of private schools, enrolling 76 percent of private school students and employing 68 percent of private school FTE teachers in 2019–20, had a religious orientation or purpose (table C-2).
• Approximately two-thirds of private schools in 2019–20 emphasized a regular elementary or secondary program and 10 percent emphasized early childhood programs. Less than 10 percent emphasized Montessori programs, special programs, special education programs, or alternative programs (table C-3).
• In 2019–20 there were 11,670 private schools in suburban locations, followed by those in cities (10,445), rural areas (5,901), and towns (2,476) (table C-4).
• The largest number of private school students in 2019–20 were enrolled in schools located in cities (2,057,808), followed by those in suburban schools (1,819,082), rural areas (506,957), and then by those in towns (269,057) (table C-5).
• More private school students in 2019–20 were enrolled in kindergarten (433,613) than in any other grade (table C-6).
• The average school size in 2019–20 was 152.6 students across all private schools. Private school size differed by instructional level. On average, elementary/middle schools had 106.1 students, secondary/high schools had 257.7 students, and combined/other schools had 215.8 students (table C-7).
• Forty-one percent of all private schools in 2019–20 enrolled less than 50 students (table C-8).
• Sixty-six percent of private school students in 2019–20 were White non-Hispanic; 12 percent were Hispanic, regardless of race; 9 percent were Black non-Hispanic; 7 percent were Asian non-Hispanic; 5 percent were of Two or more races non-Hispanic, 0.6 percent were American Indian non-Hispanic, and 0.7 percent were Pacific Islander non-Hispanic (table C-9).
• Ninety-five percent of all private schools in 2019–20 enrolled girls and boys while 2 to 3 percent enrolled either all girls or enrolled all boys (table C-10).
• Eighty percent of private school teachers in 2019–20 were full-time teachers. (table C-11).
• The pupil to teacher ratio in 2019–20 was 9.7 across private schools. This ratio ranged from 9.0 for combined schools to 10.2 for secondary and high schools (table C-12).
• Ninety-six percent of 12th-graders enrolled in private schools around October 1, 2018 graduated in 2018–19 and 64 percent of the graduates attended 4-year colleges by the fall of 2019 (table C-13).

3
• In 2019–20, there were 10,460 private schools that did not report membership in any private school association (table C-14).
• In 2019–20, there were 350,000 or more students enrolled in private schools in California, Florida, and New York (table C-15).

4
References Beller, N.D. (1984). Private Elementary and Secondary Education, 1983 Enrollment, Teachers,
and Schools (Bulletin). U.S. Department of Education. Washington, DC: National Center for Education Statistics.
Broughman, S., Kincel, B., Willinger, J., Peterson, J., and Mosina, S. (forthcoming). Private School Universe Survey (PSS): Survey Documentation for School Year 2019–20 (NCES 2021-065). U.S. Department of Education. Washington, DC: National Center for Education Statistics.
Geverdt, D. (2019). Education Demographic and Geographic Estimates Program (EDGE): Locale Boundaries File Documentation, 2017 (NCES 2018-115). U.S. Department of Education. Washington, DC: National Center for Education Statistics. Retrieved April 19, 2021, from https://nces.ed.gov/programs/edge/docs/EDGE_NCES_LOCALE.pdf .
U.S. Department of Education, National Center for Education Statistics. (2003). NCES Statistical Standards (NCES 2003-061). Washington, DC: U.S. Government Printing Office.
Wolter, K.M. (1985). Introduction to Variance Estimation. New York: Springer-Verlag.

A-1
Appendix A—Glossary

A-2
Item references in the appendix can be compared against original item wording in the questionnaire at https://nces.ed.gov/surveys/pss/pssdata.asp.
Full-time-equivalent (FTE) Full-time-equivalent (FTE) quantifies teachers in proportion to a full-time teacher. Private school teachers are assigned an FTE based on respondent-provided information on the number of teachers in each full-time and part-time work status category in item 10.
• FTE = 1.000: A teacher works full time.
• FTE = .875: A teacher works at least 3/4 time but less than full time.
• FTE = .625: A teacher works at least 1/2 time but less than 3/4 time.
• FTE = .375: A teacher works at least 1/4 time but less than 1/2 time.
• FTE = .125: A teacher works less than 1/4 time. The number of FTE teachers is calculated by summing the number of FTEs in each work status category.
Graduation rate The graduation rate is the number of 2018–19 graduates divided by the number of 12th-grade students enrolled around October 1, 2018.
Kindergarten-terminal school A school is kindergarten-terminal (K–terminal) if kindergarten is the highest grade offered at the school.
Private school A private school is a school that is not supported primarily by public funds. It must provide classroom instruction for one or more of grades K–12 (or comparable ungraded levels) and have one or more teachers. Organizations or institutions that provide support for home schooling but do not offer classroom instruction for students are not included.
Program emphasis Private schools are classified by respondents in item 11 according to one of seven types of program emphasis that best describes the school:
• Regular: The Private School Survey (PSS) questionnaire does not provide a definition of this term. Regular schools do not specialize in special, vocational/technical, or alternative education; or in having a Montessori or special program emphasis, although they may offer these programs in addition to the regular curriculum.
• Montessori: The PSS questionnaire does not provide a definition of this term. Montessori schools provide instruction using Montessori teaching methods.

A-3
• Special program emphasis: A science/mathematics school, a performing arts high school, a foreign language immersion school, and a talented/gifted school are examples of schools that offer a special program emphasis.
• Special education: Special education schools primarily serve students with disabilities.
• Career/Technical/Vocational: Career/technical/vocational schools primarily serve students who are being trained for occupations.
• Alternative: Alternative schools provide nontraditional education. They fall outside the categories of regular, special education, and vocational education.
• Early childhood: Early childhood program schools serve students in prekindergarten, kindergarten, transitional (or readiness) kindergarten, and/or transitional first (or prefirst) grade.
Race/ethnicity Private school students are classified by respondents in item 6 into seven categories:
• Hispanic or Latino: A person of Cuban, Mexican, Puerto Rican, South or Central American, or other Spanish culture or origin, regardless of race. Used interchangeably with the shortened term Hispanic.
• American Indian or Alaska Native: A person having origins in any of the original peoples of North and South America (including Central America), not of Hispanic origin. Used interchangeably with the shortened term American Indian.
• Asian: A person having origins in any of the original peoples of the Far East, Southeast Asia, or the Indian subcontinent, including, for example, Cambodia, China, India, Japan, Korea, Malaysia, Pakistan, the Philippine Islands, Thailand, and Vietnam, not of Hispanic origin.
• Black or African American: A person having origins in any of the Black racial groups of Africa, not of Hispanic origin. Used interchangeably with the shortened term Black.
• Native Hawaiian or Other Pacific Islander: A person having origins in any of the original peoples of Hawaii, Guam, Samoa, or other Pacific Islands, not of Hispanic origin. Used interchangeably with the shortened term Pacific Islander.
• White: A person having origins in any of the original peoples of Europe, the Middle East, or North Africa, not of Hispanic origin.
• Two or more races: A person identifying himself or herself as of two or more of the following race groups: American Indian, Asian, Black, Pacific Islander, or White, not of Hispanic origin.
Region Private schools are assigned to one of four geographic regions:
• Northeast: Maine, New Hampshire, Vermont, Massachusetts, Rhode Island, Connecticut, New York, New Jersey, and Pennsylvania.

A-4
• Midwest: Ohio, Indiana, Illinois, Michigan, Wisconsin, Minnesota, Iowa, Missouri, North Dakota, South Dakota, Nebraska, and Kansas.
• South: Delaware, Maryland, District of Columbia, Virginia, West Virginia, North Carolina, South Carolina, Georgia, Florida, Kentucky, Tennessee, Alabama, Mississippi, Arkansas, Louisiana, Oklahoma, and Texas; and
• West: Montana, Idaho, Wyoming, Colorado, New Mexico, Arizona, Utah, Nevada, Washington, Oregon, California, Alaska, and Hawaii.
School level Private schools are first classified using respondent-provided school grades into one of six instructional levels:
• Elementary: Grade Ungraded, Kindergarten, 1, 2, 3, or 4 offered, number of elementary grades greater than number of middle grades. If a school has the same number of grades offered at the elementary and middle level the assignment is Elementary.
• Middle: Grade 5, 6, 7, or 8 offered, number of middle grades greater than number of elementary or secondary grades.
• Secondary: Grade 9, 10, or 11 offered, number of secondary grades greater than number of middle grades, no grade 12 offered. If a school has the same number of grades offered at the middle and high or middle and secondary levels, the level assignment is High or Secondary, respectively.
• High: Grade 12 offered, if other secondary grades offered, number of secondary grades greater than number of middle grades
• Ungraded: Only ungraded offered.
• Other: Both elementary and secondary grades or grades in all 3 levels offered.
Schools that offer instruction in grades 9, 10, 11, and/or 12 that also offer grade PK or K (but instruction in no other grades) will be classified as Secondary or High.
Then the six instructional levels are combined to form three instructional levels:
• Elementary and Middle are aggregated to form Elementary/middle. • Secondary and High are aggregated to form Secondary/high. • Ungraded and Other are aggregated to form Combined/other.
Teacher Any full-time or part-time school staff member who teaches one or more regularly scheduled classes in any of grades K–12 (or comparable ungraded levels).
Transitional kindergarten or transitional first Extra year of school for either kindergarten-age children who are judged not ready for kindergarten, or for children who have attended kindergarten but have been judged not ready for the first grade.

A-5
Typology Private schools are assigned to one of three major categories (Catholic, other religious, or nonsectarian) and, within each major category, one of three subcategories based on the school’s religious affiliation provided by respondents in item 14.
• Catholic: Catholic schools are categorized according to governance, provided by Catholic school respondents in item 14c, into parochial, diocesan, and private schools.
• Other religious: Other religious schools have a religious orientation or purpose but are not Catholic. Other religious schools are categorized according to religious association membership, provided by respondents in item 15, into Conservative Christian, other affiliated and unaffiliated schools. Conservative Christian schools are those “Other religious” schools with membership in at least one of four associations: Accelerated Christian Education, American Association of Christian Schools, Association of Christian Schools International, or Oral Roberts University Education Fellowship. Other affiliated schools are those “Other religious” schools not classified as Conservative Christian with membership in at least 1 of 11 associations—Association of Christian Teachers and Schools, Christian Schools International, Evangelical Lutheran Education Association, Friends Council on Education, General Conference of the Seventh-Day Adventist Church, Islamic School League of America, National Association of Episcopal Schools, National Christian School Association, National Society for Hebrew Day Schools, Solomon Schechter Day School Association, Southern Baptist Association of Christian Schools—or indicating membership in “other religious school associations.” Unaffiliated schools are those “Other religious” schools that have a religious orientation or purpose but are not classified as Conservative Christian or affiliated.
• Nonsectarian: Nonsectarian schools do not have a religious orientation or purpose and are categorized according to program emphasis, provided by respondents in item 12a, into regular, special emphasis, and special education schools. Regular schools are those that have a regular elementary/secondary or early childhood program emphasis. Special emphasis schools are those that have a Montessori, career/technical/vocational, alternative, or special program emphasis. Special education schools are those that have a special education program emphasis.
Ungraded students Ungraded students are those who are not assigned to a particular grade level (kindergarten, first grade, second grade, etc.). For example, special education centers and alternative schools often classify their students as ungraded. Students in Montessori schools are also considered ungraded if the school assigns them to “primary” and “intermediate” levels instead of specific grades.
Urbanicity type Urbanicity type is derived from the 12-category, urban-centric locale code (ULOCALE). The urban-centric locale code is based on the school’s physical address (or mailing address if the physical address is not reported) and is a measure of a school’s location relative to populous areas (Geverdt 2019). For this report, the urban-centric locale codes were aggregated into four urbanicity types:

A-6
• City: The territory inside an urbanized area and inside a principal city, ULOCALE = 11, 12, or 13 (large, midsize, or small city);
• Suburb: The territory outside a principal city and inside an urbanized area, ULOCALE = 21, 22, or 23 (large, midsize, or small suburb);
• Town: Territory inside an urban cluster, ULOCALE = 31, 32, or 33 (fringe, distant, or remote town); and
• Rural: Census-defined rural territory, ULOCALE = 41, 42, or 43 (fringe, distant, or remote rural area).

B-1
Appendix B—Technical Notes

B-2
Background The Private School Universe Survey (PSS) is conducted by the National Center for Education Statistics (NCES) of the United States Department of Education to collect basic information on American private elementary and secondary schools. The PSS grew out of a proposal in 1988, to develop a private school data collection that would improve on the sporadic collection of private school data dating back to 1890 and improve on commercially available private school sampling frames. The PSS is currently designed to generate biennial data on the total number of private schools, teachers, and students, and to build a universe of private schools to serve as a sampling frame for the NCES sample surveys. The PSS was first collected by the U.S. Census Bureau in the 1989–90 school year, with data collections every two years since.
Target Population The target population for the PSS is all schools located in the 50 states and the District of Columbia that are not supported primarily by public funds, provide classroom instruction for one or more of grades kindergarten through 12 (or comparable ungraded levels), and have one or more teachers. Organizations or institutions that provide support for home schooling, but do not provide classroom instruction are not included.
Content The 2019–20 PSS instrument consisted of a single school questionnaire designed to be filled out by school administrators and is available on the PSS website at http://nces.ed.gov/surveys/pss. Data collected included enrollment by grade, enrollment by race/ethnicity and sex, number of high school graduates from the previous year, number of teachers, program emphasis, school religious orientation or affiliation, association membership, existence and type of kindergarten program, number of days in the school year and length of the school day, and whether the school has a library media center.
Frame Creation Because the PSS attempts to include every private school in the United States, a universe list of private schools meeting the PSS definition had to be created for the 2019–20 PSS. Since 1983, NCES has used a dual-frame approach for building its private school universe (Beller 1984). The dual frame consists of a list frame and an area frame.
List Frame
The list-building component was the primary means for improving coverage of private schools. The basis for the 2019–20 PSS list frame was the 33,786 private schools from the 2017–18 PSS list and area frames. In order to provide coverage of private schools founded since 2017 and to improve coverage of private schools existing in 2019, NCES received and processed membership lists from 29 private school associations and religious denominations. The departments of education from 51 states (including the District of Columbia) provided lists of private schools. Additional private schools that contacted NCES to be included in the PSS were added as list frame cases.
Beginning in 1995, the PSS private school definition was expanded to include schools for which kindergarten is the highest grade. This entailed a separate list-building operation (Early

B-3
Childhood Operation) to identify schools for which kindergarten was the highest grade (kindergarten terminal or K–terminal schools).
Schools on private school association membership lists and the state lists were compared to the base list, and any school that did not match a school on the base list was added to the universe list. A total of 40,682 schools were included in the 2019–20 list frame (table B-1).
Table B-1. Number of responding and nonresponding schools, out-of-scope cases, and school response rate, by frame: 2019–20
Response status List frame Area frame Total frame Total
Base-weighted 40,682 12,413 53,095 Unweighted 40,682 2,154 42,836
Response
Base-weighted 21,350 985 22,335 Unweighted 21,350 222 21,572
Nonresponse
Base-weighted 7,157 1,000 8,157 Unweighted 7,157 212 7,369
Out-of-scope
Base-weighted 12,175 10,428 22,603 Unweighted 12,175 1,720 13,895
Response rate
Base-weighted (percentage) 74.9 49.6 73.3 Unweighted (percentage) 74.9 51.2 74.5
Note: Weighted using the inverse of the probability of selection. SOURCE: U.S. Department of Education, National Center for Education Statistics, Private School Universe Survey (PSS), 2019–20.
Area Frame
To identify private schools that may have been overlooked in the list-building component, a group of geographic areas was selected to be searched for private schools. The United States is divided by the Census Bureau into 2,062 primary sampling units (PSUs), each PSU consisting of a single county, independent city, or group of contiguous counties. The area frame consists of a sample of these 2,062 PSUs.
A total of 124 distinct PSUs (165 counties) were in the 2019–20 PSS area frame sample (appendix table D-1). Within each of these PSUs, the Census Bureau attempted to find all eligible private schools. A block-by-block listing of all private schools in a sample of PSUs was not attempted. Rather, NPC staff created the frame by using such sources as online yellow pages (yp.com), local Catholic dioceses, local education agencies, and local government offices. The Census Bureau also obtained a list of eligible private schools from area frame sample PSUs from the Data Axle USA database, formerly known as InfoUSA.1 Once the area search lists were constructed, they were matched with the NCES private school universe list. Schools that did match the universe list were deleted from the area frame. A total of 2,154 schools were added to the universe from the area frame in 2019–20 (table B-1).
1 See https://www.dataaxleusa.com.
B-4
Data Collection The List Frame followed two data collection tracks: non-Amish schools that were offered an internet response option and schools that do not use internet or telephones (primarily Amish and Mennonite schools) that never receive any reference to an internet response option. The 2019–20 Private School Universe Survey (PSS) data collection began on October 1, 2019 with the internet instrument deployment, and the mailout of a letter to non-Amish schools describing how to respond to the 2019–20 PSS online with a User ID and password. For Amish schools, this first mailing included information about the PSS and their first paper questionnaire with a return envelope, there was no internet insert letter.
On October 15th, the second mail out occurred. Here, non-Amish schools received a paper questionnaire and Amish schools received their second paper questionnaire. Reminder postcards were mailed out to nonresponding Amish schools on October 28, 2019, and to nonresponding non-Amish schools on November 12, 2019.
Because Amish and Mennonite schools do not often possess telephones, a field nonresponse follow up effort targeting these schools ran from January 13 to March 13 (2020). Follow-up of nonresponding non-Amish schools was conducted first by computer-assisted telephone interviewing (CATI) January 13 to March 13 (2020). Both nonresponding list frame and nonresponding area frame cases were included in this CATI operation. Finally, a field nonresponse followup operation was to be conducted for cases that did not respond during the CATI operation, targeting all list frame and area frame nonresponse cases. However, this operation was cancelled due to safety concerns during the global pandemic of 2020. Instead, an e-mail operation was conducted, researching school e-mail addresses, and contacting them with reminder e-mails to respond through the PSS web instrument. Initial e-mails went out on April 15, 2020, with three reminders e-mailed until the final on June 17, 2020. Data collection officially concluded on July 6, 2020, after extending close-out to allot more time for schools to respond online.
Of the 42,836 schools included in the 2019–20 PSS, 13,895 cases were considered as out-of-scope (not eligible for the PSS). A total of 21,572 private schools completed a PSS interview, while 7,369 schools failed to respond. Accounting for differences in probability of selection, the base-weighted response rate was 73.3 percent, which is just under a 7 percent decrease from 2017–18 PSS.
Unit nonresponse bias analysis Because NCES Statistical Standard 4-4 requires analysis of unit nonresponse bias for any survey stage with a base-weighted response rate of less than 85 percent, the 2019–20 PSS data file was evaluated for potential bias (Broughman et al. forthcoming). Comparisons between the frame and respondent populations were made before and after the nonresponse weighting adjustments were applied to evaluate first the amount of bias measured, and second the extent to which the adjustments reduced or eliminated nonresponse bias. The following section explains the methodology and summarizes the conclusions.
As outlined in appendix B of the NCES Statistical Standards, the degree of nonresponse bias is a function of two factors: the nonresponse rate and how much the respondents and nonrespondents

B-5
differ on survey variables of interest. The mathematical formulation to estimate bias for a sample mean of variable y is as follows:
( ) ( )MRT
MTRR yy
nnyyyB −
=−=
where
Ty = the estimated mean based on all eligible sample cases
Ry = the estimated mean based only on respondent cases
My = the estimated mean based only on nonrespondent cases
Tn = the estimated number of cases (i.e., MRT nnn += )
Mn = the estimated number of nonrespondents
Rn = the estimated number of respondents
A variable-free estimate of the bias, referred to as a relative bias, was used to compare biases across all variables included in the analysis. The relative bias for an estimated mean, Ry , is calculated using the following formula:
( ) ( )RR
R
B yRelB y
y=
Relative bias was estimated for variables known for respondents and nonrespondents. The variables used were affiliation, grade level of school, enrollment, community type, region, and source of school (list or area frame. There is a very limited amount of information available about nonresponding private schools.
The following steps were followed to compute the relative bias. First, the nonresponse bias was estimated and tested to determine if the bias is significant at the 5 percent level. Second, nonresponse adjustments were applied. The nonresponse adjustments, which are included in the weights, were designed to significantly reduce, or eliminate unit nonresponse bias for variables included in the models. Third, after the weights were computed, any remaining bias was estimated for the variables listed above and statistical tests were performed to check the remaining significant nonresponse bias. For this comparison, nonresponse bias was calculated as the difference between the base-weighted sample proportion and the nonresponse-adjusted respondent proportion, which evaluates the effectiveness of each nonresponse adjustment in mitigating nonresponse bias. Schools found to be ineligible for the PSS were excluded from the analysis.
As shown in table B-2, the weighting adjustments eliminated some significant bias. For all respondents, approximately 88 percent of the variable categories were significantly biased before nonresponse weighting adjustments, and approximately 41 percent were significantly biased after adjustments. The average bias was reduced by 70 percent, from 10 percent to 3 percent.

B-6
Table B-2. Summary of 2019–20 PSS nonresponse bias statistics
Nonresponse bias statistic Total
Before nonresponse adjustment1 Mean estimated absolute percent relative bias 10.31 Median estimated absolute percent relative bias 5.78 Percent of variable categories significantly biased 87.50 After nonresponse adjustment2 Mean estimated absolute percent relative bias 2.58 Median estimated absolute percent relative bias 1.45 Percent of variable categories significantly biased 40.63 1The difference between the base-weighted respondents and the base-weighted sample. 2The difference between the nonresponse adjusted respondents and the base-weighted sample. SOURCE: U.S. Department of Education, National Center for Education Statistics, “Private School Survey (PSS) Data File,” 2019–20.
Quality Control and Editing
Data from the interviews went through several edits; the edits consisted of
• range check to eliminate out-of-range entries; • pre-edits to check for anomalous results; • consistency edits to compare data in different fields for consistency; • edits to verify that skip patterns on the questionnaire had been followed; and • logic edits where data was added to the questionnaire using information from the same
PSS record or from the previous PSS record. Logic Edits
In the logic edits, data were added to questionnaire records when information was missing or incomplete from these sources:
• Other items on the 2019–20 PSS—Based on entries from related items on the questionnaire, assumptions were made about how the respondent should have answered items with missing values. For example, if the respondent did not answer item 9a (length of school day for kindergarten, transitional kindergarten, transitional first grade) and item 4 indicated that the school did not have students enrolled in any of those grades, zero (school does not offer kindergarten) was assigned to item 9a.
• Data from the 2017–18 PSS—Data from the 2017–18 PSS were used to fill the items with missing values whenever possible. For example, if the type of school was not reported in item 11 and it had been reported on the 2017–18 PSS, the 2017–18 response was copied to item 11.
In addition to filling items where values were missing, some inconsistencies between items were corrected by ratio adjustment. For records where the number of students in item 6 (students by race) did not equal the enrollment in item 5, excluding prekindergarten, the item 6 entries were
B-7
adjusted to be consistent with item 5 (i.e., each entry in item 6 was multiplied by the ratio of the student count in item 6 to the enrollment in item 5, excluding prekindergarten).
Weighting The survey data from the area-frame component were weighted to reflect the sampling rates (probability of selection) of the PSUs. There were 21,572 interviews and 7,369 cases that were noninterviews. After applying the PSU weight, these became 22,335 interviews and 8,157 noninterviews—the base-weighted response rate was 73.3 percent (table B-1).
Imputation Item Response
The weighted item response rates for the variables used in this report are all greater than 89 percent. Values were imputed to items with missing data to compensate for item nonresponse. The imputation flags are available on the data file so researchers can review the imputation approaches taken.
Imputation
Items still blank after the logic edit were imputed using donor imputation. The imputation process used a hot-deck imputation methodology by extracting data from the record for a school (donor) similar to the nonrespondent. Variables that describe certain characteristics of the schools (e.g., religious affiliation, size, instructional level) were created and used to sort the records and to match incomplete records to those with complete data. Items 12b (whether or not the school was located in a private home that was used primarily as a family residence) and 14 (school association membership) did not go through the donor imputation program. If, after the logic edit, the item was still incomplete, the assumption was made for item 12b that the school was not in a private home, and for item 14 that the school did not belong to any associations. Items 13a and 13c (religious orientation and affiliation) did not go through the donor imputation program. Rather, if values were still missing after the logic edit, the records were reviewed and imputed by an analyst.
Analyst Imputation
For a few items, there were cases where entries were imputed by analysts during data review. The data record, sample file record, and the questionnaire were reviewed and an entry consistent with the information from those sources was imputed. This procedure was used when (1) there was no suitable donor found, (2) the computer method produced an imputed entry that was unacceptable, and (3) the nature of the item required an actual review of the data rather than a computer-generated value.
Sampling Error The standard error indicates how much variability there is in the population of possible estimates of a parameter for a given sample size. Standard errors are used as a measure of the precision expected from a particular sample. If all possible samples were surveyed under similar conditions, intervals of 1.96 standard errors below to 1.96 standard errors above a particular statistic would include the true population parameter being estimated in about 95 percent of the samples. This is a 95 percent confidence interval.

B-8
Estimates of standard errors were computed using a technique known as half-sample replication. As with any replication method, half-sample replication involves constructing a number of subsamples (replicates) from the full sample and computing the statistic of interest for each replicate. The mean squared error of the replicate estimates around the full sample provides an estimate of the variance of the statistic (Wolter 1985). A computer program (SUDAAN), developed by Research Triangle Institute, was used to calculate the estimates of standard errors. For PSS, only the area frame contributes to the standard error. Since all list-frame cases are included in the PSS, the list frame component of the standard error is always zero (0). Standard errors for statistics in each table are presented in corresponding tables in Appendix D.
Tests of Significance
The tests of significance used in this analysis are based on Student’s t statistics. The t statistic between estimates from various independent subgroups presented in the tables can be computed by using the following formula:
22
21
21
SESExxt+
−=
where x1 and x2 are the estimates to be compared (e.g., the means of two groups) and SE1 and SE2 are their corresponding standard errors.
As the number of comparisons that are conducted at the same significance increases, it becomes more likely that at least one of the estimated differences becomes significant merely by chance, that is, will be erroneously identified as significantly different from zero. Even when there is no statistical difference between the estimates or percentages being compared, there is a 5 percent chance of getting a significant t value of 1.96 from sampling error alone. As the number of comparisons increases, the incidence of this type of error also increases. Adjustments were not made to the significance tests for multiple comparisons.
Nonsampling Error Survey estimates are also subject to errors of reporting and errors made in the collection of the data. These errors, called nonsampling errors, can sometimes bias the data. Nonsampling errors may include such things as differences in the respondents’ interpretation of the meaning of the questions, differences related to the particular time the survey was conducted, or errors in data preparation. While sampling theory can be used to estimate the sampling variability of an estimate, nonsampling errors usually require either an experiment conducted as part of the data collection procedure or use of data external to the study.
Undercoverage in the list and area frames is another possible source of nonsampling error. To reduce the possible bias caused by undercoverage in the list frame, the area frame was used to complement the list frame through the identification of schools missing from the list frame.
Publication Criteria for PSS Estimates NCES criteria for the publication of an estimate are based on two category types: (1) surveys based on a sample from the frame or (2) surveys based on the entire frame (universe surveys). To publish an estimate for a sample survey, at least 30 cases must be used in developing the

B-9
estimate; for a universe survey, at least three cases must be used in developing the estimate. PSS has pieces of both categories: (1) an area-frame sample of 124 PSUs which collects data on schools not on the list frame and (2) a complete census of schools belonging to the list frame. Since a significant component of a PSS estimate comes from the census of the list frame, the criterion of at least 30 cases seems unnecessarily high. However, since the area-frame component of an estimate can have a large sampling error, some indication of a large sampling error is appropriate. Based on these two concerns, the estimates reported in a PSS table must be based on at least 15 schools. Some of the estimates in this report are footnoted with “Interpret data with caution. The coefficient of variation for this estimate is between 30 and 50 percent (i.e., the standard error is at least 30 percent and less than 50 percent of the estimate).” The coefficient of variation measures the precision of an estimate and is defined as the standard error of an estimate divided by the value of the estimate.

C-1
Appendix C—Tables

C-2
Table C-1. Number and percentage distribution of private schools, students, and full-time equivalent (FTE) teachers, by selected characteristics: United States, 2019–20
Selected Schools Students FTE teachers characteristic Number Percent Number Percent Number Percent Total 30,492 100.0 4,652,904 100.0 481,200 100.0 Private school typology Catholic 6,449 21.2 1,742,968 37.5 139,996 29.1 Parochial 2,196 7.2 493,142 10.6 38,473 8.0 Diocesan 3,081 10.1 833,231 17.9 65,198 13.5 Private 1,172 3.8 416,595 9.0 36,324 7.5 Other religious 13,794 45.2 1,812,687 39.0 185,988 38.7 Conservative Christian 3,698 12.1 590,997 12.7 57,680 12.0 Other affiliated 3,134 10.3 572,256 12.3 61,711 12.8 Unaffiliated 6,962 22.8 649,434 14.0 66,597 13.8 Nonsectarian 10,249 33.6 1,097,249 23.6 155,217 32.3 Regular 4,985 16.3 750,327 16.1 98,789 20.5 Special emphasis 3,470 11.4 227,108 4.9 32,944 6.8 Special education 1,794 5.9 119,815 2.6 23,484 4.9 School level1 Elementary/middle 18,890 61.9 2,003,418 43.1 198,383 41.2 Secondary/high 3,479 11.4 896,318 19.3 87,620 18.2 Combined/other 8,124 26.6 1,753,168 37.7 195,198 40.6 Program emphasis Regular elementary/ secondary 21,083 69.1 4,145,030 89.1 403,777 83.9 Montessori 2,566 8.4 98,631 2.1 17,758 3.7 Special program emphasis 929 3.0 149,666 3.2 17,478 3.6 Special education 2,025 6.6 133,136 2.9 25,761 5.4 Vocational/technical ‡ ‡ ‡ ‡ ‡ ‡ Alternative 843 2.8 75,994 1.6 7,638 1.6 Early childhood 3,033 9.9 49,244 1.1 8,630 1.8 Size (number of students) Less than 50 12,636 41.4 270,534 5.8 48,372 10.1 50–149 8,223 27.0 757,820 16.3 95,329 19.8 150–299 5,271 17.3 1,106,966 23.8 108,689 22.6 300–499 2,460 8.1 939,168 20.2 86,770 18.0 500–749 1,064 3.5 643,984 13.8 60,676 12.6 750 or more 838 2.7 934,433 20.1 81,365 16.9 Region Northeast 6,739 22.1 982,265 21.1 114,510 23.8 Midwest 7,057 23.1 1,062,916 22.8 97,337 20.2 South 10,671 35.0 1,695,730 36.4 180,843 37.6 West 6,025 19.8 911,994 19.6 88,510 18.4 See notes at end of table.

C-3
Table C-1. Number and percentage distribution of private schools, students, and full-time equivalent (FTE) teachers, by selected characteristics: United States, 2019–20—Continued
Selected Schools Students FTE teachers characteristic Number Percent Number Percent Number Percent Urbanicity type City 10,445 34.3 2,057,808 44.2 210,716 43.8 Suburban 11,670 38.3 1,819,082 39.1 188,092 39.1 Town 2,476 8.1 269,057 5.8 27,199 5.7 Rural 5,901 19.4 506,957 10.9 55,194 11.5 ‡ Reporting standards not met. There are fewer than 15 sample cases. 1 Schools are assigned to one of three school level categories in the 2019-20 PSS: Elementary/middle, High/ secondary, and Combined/other. Elementary/middle schools are defined as schools that enroll students in more of grades K through 4 than in higher grades or that enroll students in more of grades 5 through 8 than in higher or lower grades. High/secondary schools are defined as schools that enroll students in more of grades 9 through 12 than in lower grades. Combined/other schools include all other combinations of grades, including K–12 schools. School level categories in the 2019–20 PSS differ from those in previous survey administrations; caution should be exercised when comparing estimates by level over time. For more information, see Appendix A: Glossary. NOTE: Detail may not sum to totals because of rounding or missing values in cells with too few sample cases. These estimates include private schools which provide instruction for one or more of grades kindergarten through twelve (or comparable ungraded levels). SOURCE: U.S. Department of Education, National Center for Education Statistics, Private School Universe Survey (PSS), 2019–20.

C-4
Table C-2. Number and percentage distribution of private schools, students, and full-time equivalent (FTE) teachers, by religious or nonsectarian orientation of school: United States, 2019–20
Religious or Schools Students FTE teachers nonsectarian orientation Number Percent Number Percent Number Percent Total 30,492 100.0 4,652,904 100.0 481,200 100.0
Religious orientation 20,241 66.4 3,555,570 76.4 325,971 67.7 Roman Catholic 6,449 21.2 1,742,968 37.5 139,996 29.1 African Methodist Episcopal ‡ ‡ ‡ ‡ ‡ ‡
Amish 1,408 4.6 42,208 0.9 2,480 0.5 Assembly of God 198 0.7 27,945 0.6 2,577 0.5 Baptist 1,763 5.8 198,097 4.3 20,387 4.2
Brethren 49 0.2 4,578 0.1 433 0.1 Calvinist 108 0.4 27,719 0.6 2,246 0.5 Christian (unspecified) 4,451 14.6 697,175 15.0 69,837 14.5 Church of Christ 121 0.4 24,779 0.5 2,273 0.5 Church of God 57 0.2 8,257 0.2 722 0.1 Church of God in Christ
‡ ‡ ‡ ‡ ‡ ‡ Church of the Nazarene 49 0.2 5,205 0.1 489 0.1 Disciples of Christ ‡ ‡ ‡ ‡ ‡ ‡ Episcopal 386 1.3 102,024 2.2 13,444 2.8 Friends 79 0.3 17,989 0.4 2,481 0.5
Greek Orthodox 41 ! 0.1 ! 4,140 0.1 474 ! 0.1 ! Islamic 284 0.9 43,420 0.9 5,303 1.1 Jewish 1,067 3.5 264,895 5.7 31,000 6.4 Latter Day Saints ‡ ‡ ‡ ‡ ‡ ‡ Lutheran Church—Missouri Synod 942 3.1 118,178 2.5 9,990 2.1
Evangelical Lutheran Church in America 102 0.3 8,514 0.2 829 0.2 Wisconsin Evangelical Lutheran Synod 318 1.0 31,846 0.7 2,518 0.5
Other Lutheran 71 0.2 4,777 0.1 438 0.1 Mennonite 474 1.6 25,445 0.5 2,533 0.5 Methodist 306 1.0 14,258 0.3 1,910 0.4
Pentecostal 314 1.0 20,906 0.4 2,211 0.5 Presbyterian 207 0.7 37,282 0.8 3,697 0.8 Seventh-Day Adventist 724 2.4 48,370 1.0 3,742 0.8 Other 232 0.8 30,685 0.7 3,547 0.7
Nonsectarian 10,251 33.6 1,097,334 23.6 155,229 32.3 # Rounds to zero. ! Interpret data with caution. The coefficient of variation for this estimate is between 30 and 50 percent (i.e., thestandard error is at least 30 percent and less than 50 percent of the estimate).‡ Reporting standards not met. There are fewer than 15 sample cases.NOTE: Detail may not sum to totals because of rounding or missing values in cells with too few sample cases. Theseestimates include private schools which provide instruction for one or more of grades kindergarten through twelve (orcomparable ungraded levels).SOURCE: U.S. Department of Education, National Center for Education Statistics, Private School Universe Survey(PSS), 2019–20.

C-5
Table C-3. Percentage distribution of private schools, by program emphasis and selected characteristics: United States, 2019–20
Selected characteristic
Regular elementary/
secondary
Montessori
Special program
emphasis
Special
education
Vocational/ technical
programs
Alternative
Early
childhood
Total 69.1 8.4 3.0 6.6 ‡ 2.8 9.9 Private school typology Catholic 95.9 0.8 0.9 0.8 ‡ 0.4 1.1 Parochial 97.4 ‡ 0.9 0.0 ‡ ‡ 1.3 Diocesan 96.8 ‡ 0.7 1.2 ‡ ‡ ‡ Private 91.0 2.6 ‡ ‡ ‡ ‡ 2.3 Other religious 84.7 1.5 2.1 1.3 ‡ 1.7 8.6 Conservative Christian 93.0 ‡ 1.4 1.1 ‡ 1.7 2.3 Other affiliated 86.0 1.3 3.5 0.7 ‡ 1.2 7.2 Unaffiliated 79.6 2.2 1.8 1.6 ‡ 2.0 12.7 Nonsectarian 31.4 22.5 5.7 17.5 ‡ 5.6 17.3 Regular 64.5 † † † † † 35.5 Special emphasis † 66.5 16.7 † ‡ 16.6 † Special education † † † 100.0 † † † School level1 Elementary/middle 65.5 12.7 2.6 1.9 ‡ 1.3 16.0 Secondary/high 74.3 ‡ 4.1 11.1 ‡ 9.7 † Combined/other 75.3 1.8 3.7 15.8 ‡ 3.2 ‡ Size (number of students) Less than 50 46.1 15.3 2.4 8.7 ‡ 4.2 23.2 50–149 76.8 6.3 4.1 9.1 ‡ 2.8 1.0 150–299 91.2 1.8 3.1 2.8 ‡ 0.7 ‡ 300–499 94.1 ‡ 3.2 1.3 ‡ ‡ ‡ 500–749 97.3 0.0 ‡ ‡ ‡ ‡ 0.0 750 or more 94.4 ‡ 3.5 0.0 ‡ ‡ 0.0 Region Northeast 66.4 6.1 2.4 10.9 ‡ 2.6 11.6 Midwest 80.4 7.3 1.9 3.4 ‡ 1.4 5.4 South 66.5 8.0 3.2 7.2 ‡ 3.0 12.0 West 63.6 12.9 4.8 4.7 ‡ 4.1 9.8 Urbanicity type City 67.8 9.3 3.8 6.9 ‡ 2.9 9.1 Suburban 60.0 10.9 3.0 8.3 ‡ 2.8 15.0 Town 83.8 5.1 2.2 2.7 ‡ 1.9 4.3 Rural 83.5 3.3 2.1 4.6 ‡ 2.9 3.7 † Not applicable. ‡ Reporting standards not met. There are fewer than 15 sample cases. 1 Schools are assigned to one of three school level categories in the 2019–20 PSS: Elementary/middle, High/secondary, and Combined/other. Elementary/middle schools are defined as schools that enroll students in more of grades K through 4 than in higher grades or that enroll students in more of grades 5 through 8 than in higher or lower grades. High/secondary schools are defined as schools that enroll students in more of grades 9 through 12 than in lower grades. Combined/other schools include all other combinations of grades, including K–12 schools. School level categories in the 2019–20 PSS differ from those in previous survey administrations; caution should be exercised when comparing estimates by level over time. For more information, see Appendix A: Glossary. NOTE: Detail may not sum to totals because of rounding or missing values in cells with too few sample cases. These estimates include private schools which provide instruction for one or more of grades kindergarten through twelve (or comparable ungraded levels). SOURCE: U.S. Department of Education, National Center for Education Statistics, Private School Universe Survey (PSS), 2019–20.

C-6
Table C-4. Number and percentage distribution of private schools, by urbanicity type and selected characteristics: United States, 2019–20
Selected characteristic
Total City Suburban Town Rural Number Percent Number Percent Number Percent Number Percent Number Percent
Total 30,492 100.0 10,445 100.0 11,670 100.0 2,476 100.0 5,901 100.0 Private school typology Catholic 6,449 21.2 2,630 25.2 2,418 20.7 898 36.3 503 8.5 Parochial 2,196 7.2 829 7.9 842 7.2 367 14.8 157 2.7 Diocesan 3,081 10.1 1,226 11.7 1,179 10.1 450 18.2 226 3.8 Private 1,172 3.8 575 5.5 397 3.4 81 ! 3.3 ! 120 2.0 Other religious 13,794 45.2 4,086 39.1 4,359 37.4 1,179 47.6 4,170 70.7 Conservative Christian 3,698 12.1 1,045 10.0 1,273 10.9 456 18.4 924 15.7 Other affiliated 3,134 10.3 1,244 11.9 1,127 9.7 266 10.7 497 8.4 Unaffiliated 6,962 22.8 1,796 17.2 1,958 16.8 458 18.5 2,749 46.6 Nonsectarian 10,249 33.6 3,730 35.7 4,893 41.9 398 16.1 1,228 20.8 Regular 4,985 16.3 1,773 17.0 2,432 20.8 171 6.9 608 10.3 Special emphasis 3,470 11.4 1,322 12.7 1,608 13.8 166 6.7 374 6.3 Special education 1,794 5.9 634 6.1 853 7.3 61 2.5 246 4.2 School level1 Elementary/middle 18,890 61.9 6,445 61.7 7,560 64.8 1,555 62.8 3,329 56.4 Secondary/high 3,479 11.4 1,437 13.8 1,226 10.5 189 7.7 626 10.6 Combined/other 8,124 26.6 2,563 24.5 2,884 24.7 731 29.5 1,946 33.0 Program emphasis Regular elementary/ secondary 21,083 69.1 7,086 67.8 6,998 60.0 2,074 83.8 4,925 83.5 Montessori 2,566 8.4 974 9.3 1,273 10.9 126 5.1 193 3.3 Special program emphasis 929 3.0 397 3.8 352 3.0 55 2.2 125 2.1 Special education 2,025 6.6 723 6.9 966 8.3 67 2.7 269 4.6 Vocational/technical ‡ ‡ ‡ ‡ ‡ ‡ ‡ ‡ ‡ ‡ Alternative 843 2.8 305 2.9 321 2.8 47 1.9 169 2.9 Early childhood 3,033 9.9 954 9.1 1,755 15.0 106 4.3 217 3.7 Size (number of students) Less than 50 12,636 41.4 3,476 33.3 4,820 41.3 844 34.1 3,497 59.3 50–149 8,223 27.0 2,690 25.8 2,988 25.6 1,071 43.3 1,473 25.0 150–299 5,271 17.3 2,161 20.7 2,086 17.9 420 17.0 603 10.2 300–499 2,460 8.1 1,098 10.5 1,033 8.8 108 4.4 221 3.7 500–749 1,064 3.5 534 5.1 441 3.8 23 0.9 66 1.1 750 or more 838 2.7 486 4.7 303 2.6 ‡ ‡ 41 0.7 See notes at end of table.
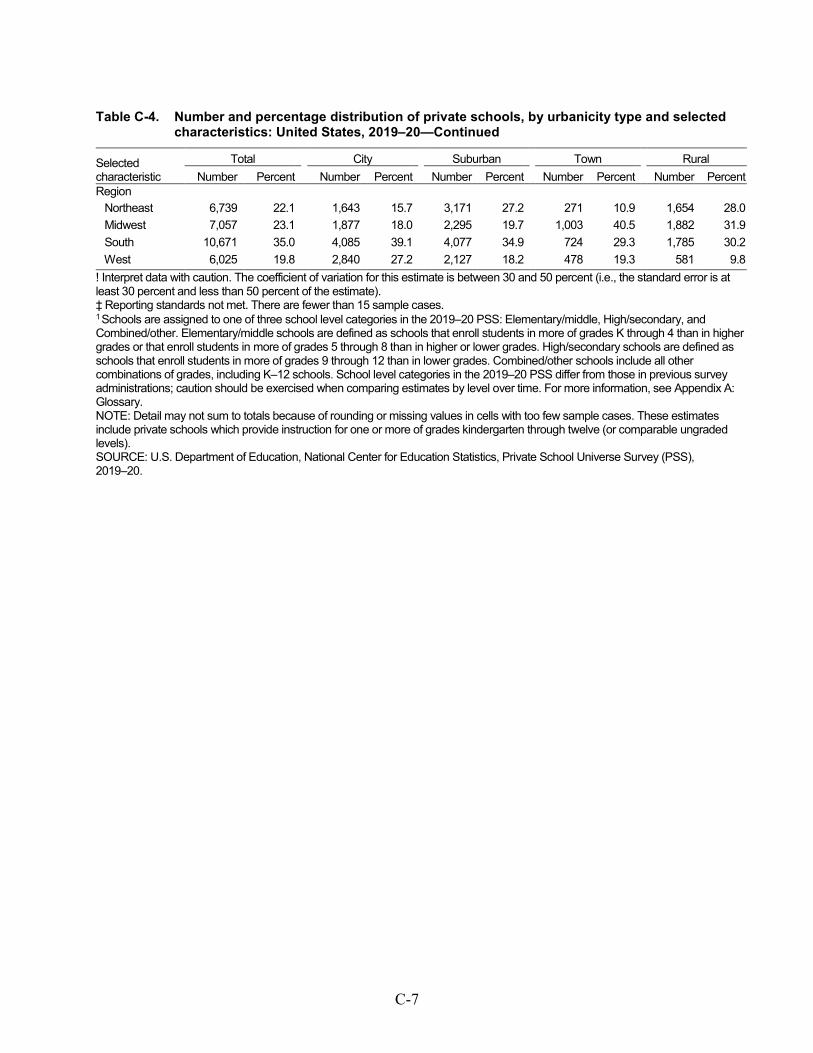
C-7
Table C-4. Number and percentage distribution of private schools, by urbanicity type and selected
characteristics: United States, 2019–20—Continued
Selected characteristic
Total City Suburban Town Rural
Number Percent Number Percent Number Percent Number Percent Number Percent Region
Northeast 6,739
22.1
1,643
15.7
3,171
27.2
271
10.9
1,654
28.0
Midwest 7,057
23.1
1,877
18.0
2,295
19.7
1,003
40.5
1,882
31.9
South 10,671
35.0
4,085
39.1
4,077
34.9
724
29.3
1,785
30.2
West 6,025
19.8
2,840
27.2
2,127
18.2
478
19.3
581
9.8
! Interpret data with caution. The coefficient of variation for this estimate is between 30 and 50 percent (i.e., the standard error is at least 30 percent and less than 50 percent of the estimate). ‡ Reporting standards not met. There are fewer than 15 sample cases.
1 Schools are assigned to one of three school level categories in the 2019–20 PSS: Elementary/middle, High/secondary, and Combined/other. Elementary/middle schools are defined as schools that enroll students in more of grades K through 4 than in higher grades or that enroll students in more of grades 5 through 8 than in higher or lower grades. High/secondary schools are defined as schools that enroll students in more of grades 9 through 12 than in lower grades. Combined/other schools include all other combinations of grades, including K–12 schools. School level categories in the 2019–20 PSS differ from those in previous survey administrations; caution should be exercised when comparing estimates by level over time. For more information, see Appendix A: Glossary.
NOTE: Detail may not sum to totals because of rounding or missing values in cells with too few sample cases. These estimates include private schools which provide instruction for one or more of grades kindergarten through twelve (or comparable ungraded levels). SOURCE: U.S. Department of Education, National Center for Education Statistics, Private School Universe Survey (PSS), 2019–20.
C-8
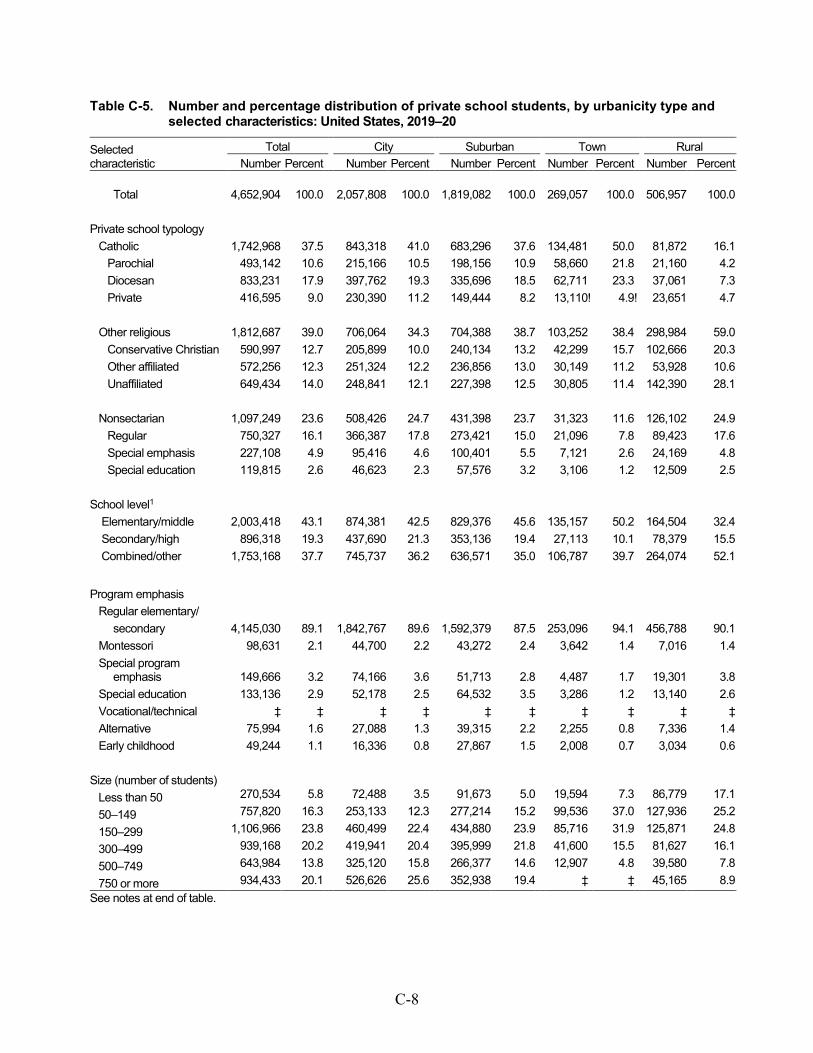
Table C-5. Number and percentage distribution of private school students, by urbanicity type and selected characteristics: United States, 2019–20
Selected characteristic
Total City Suburban Town Rural Number Percent Number Percent Number Percent Number Percent Number Percent
Total 4,652,904
100.0
2,057,808
100.0
1,819,082
100.0
269,057
100.0
506,957
100.0
Private school typology
Catholic 1,742,968
37.5
843,318
41.0
683,296
37.6
134,481
50.0
81,872
16.1
Parochial 493,142
10.6
215,166
10.5
198,156
10.9
58,660
21.8
21,160
4.2
Diocesan 833,231
17.9
397,762
19.3
335,696
18.5
62,711
23.3
37,061
7.3
Private 416,595
9.0
230,390
11.2
149,444
8.2
13,110 ! 4.9 ! 23,651
4.7
Other religious 1,812,687
39.0
706,064
34.3
704,388
38.7
103,252
38.4
298,984
59.0
Conservative Christian 590,997
12.7
205,899
10.0
240,134
13.2
42,299
15.7
102,666
20.3
Other affiliated 572,256
12.3
251,324
12.2
236,856
13.0
30,149
11.2
53,928
10.6
Unaffiliated 649,434
14.0
248,841
12.1
227,398
12.5
30,805
11.4
142,390
28.1
Nonsectarian 1,097,249
23.6
508,426
24.7
431,398
23.7
31,323
11.6
126,102
24.9
Regular 750,327
16.1
366,387
17.8
273,421
15.0
21,096
7.8
89,423
17.6
Special emphasis 227,108
4.9
95,416
4.6
100,401
5.5
7,121
2.6
24,169
4.8
Special education 119,815
2.6
46,623
2.3
57,576
3.2
3,106
1.2
12,509
2.5
School level1
Elementary/middle 2,003,418
43.1
874,381
42.5
829,376
45.6
135,157
50.2
164,504
32.4
Secondary/high 896,318
19.3
437,690
21.3
353,136
19.4
27,113
10.1
78,379
15.5
Combined/other 1,753,168
37.7
745,737
36.2
636,571
35.0
106,787
39.7
264,074
52.1
Program emphasis
Regular elementary/
secondary 4,145,030 89.1 1,842,767 89.6 1,592,379 87.5 253,096 94.1 456,788 90.1
Montessori 98,631 2.1 44,700 2.2 43,272 2.4 3,642 1.4 7,016 1.4
Special program emphasis 149,666 3.2 74,166 3.6 51,713 2.8 4,487 1.7 19,301 3.8
Special education 133,136 2.9 52,178 2.5 64,532 3.5 3,286 1.2 13,140 2.6
Vocational/technical ‡ ‡ ‡ ‡ ‡ ‡ ‡ ‡ ‡ ‡
Alternative 75,994 1.6 27,088 1.3 39,315 2.2 2,255 0.8 7,336 1.4
Early childhood 49,244 1.1 16,336 0.8 27,867 1.5 2,008 0.7 3,034 0.6
Size (number of students)
Less than 50 270,534
5.8
72,488
3.5
91,673
5.0
19,594
7.3
86,779
17.1
50–149 757,820
16.3
253,133
12.3
277,214
15.2
99,536
37.0
127,936
25.2
150–299 1,106,966
23.8
460,499
22.4
434,880
23.9
85,716
31.9
125,871
24.8
300–499 939,168
20.2
419,941
20.4
395,999
21.8
41,600
15.5
81,627
16.1
500–749 643,984
13.8
325,120
15.8
266,377
14.6
12,907
4.8
39,580
7.8
750 or more 934,433
20.1
526,626
25.6
352,938
19.4
‡
‡
45,165
8.9
See notes at end of table.

C-9
Table C-5. Number and percentage distribution of private school students, by urbanicity type and selected characteristics: United States, 2019–20—Continued
Selected characteristic
Total City Suburban Town Rural
Number Percent Number Percent Number Percent Number Percent Number Percent Region
Northeast 982,265
21.1
364,454
17.7
493,358
27.1
22,453
8.3
101,999
20.1
Midwest 1,062,916
22.8
407,389
19.8
398,998
21.9
126,445
47.0
130,084
25.7
South 1,695,730
36.4
781,380
38.0
617,821
34.0
79,335
29.5
217,194
42.8
West 911,994
19.6
504,584
24.5
308,906
17.0
40,824
15.2
57,680
11.4
! Interpret data with caution. The coefficient of variation for this estimate is between 30 and 50 percent (i.e., the standard error is at least 30 percent and less than 50 percent of the estimate). ‡ Reporting standards not met. There are fewer than 15 sample cases. 1 Schools are assigned to one of three school level categories in the 2019-20 PSS: Elementary/middle, High/secondary, and Combined/other. Elementary/middle schools are defined as schools that enroll students in more of grades K through 4 than in higher grades or that enroll students in more of grades 5 through 8 than in higher or lower grades. High/secondary schools are defined as schools that enroll students in more of grades 9 through 12 than in lower grades. Combined/other schools include all other combinations of grades, including K–12 schools. School level categories in the 2019-20 PSS differ from those in previous survey administrations; caution should be exercised when comparing estimates by level over time. For more information, see Appendix A: Glossary. NOTE: Detail may not sum to totals because of rounding or missing values in cells with too few sample cases. These estimates include private schools which provide instruction for one or more of grades kindergarten through twelve (or comparable ungraded levels). SOURCE: U.S. Department of Education, National Center for Education Statistics, Private School Universe Survey (PSS), 2019–20.

C-10
Table C-6. Number and percentage distribution of private school students, by grade and private school typology: United States, 2019–20
Private school typology
Kindergarten1 First grade Second grade Third grade Fourth grade Number Percent Number Percent Number Percent Number Percent Number Percent
Total 433,613 100.0 339,219 100.0 330,731 100.0 333,461 100.0 331,301 100.0 Catholic 132,847 30.6 120,848 35.6 119,749 36.2 122,542 36.7 122,701 37.0 Parochial 54,364 12.5 48,427 14.3 47,665 14.4 48,978 14.7 48,881 14.8 Diocesan 66,261 15.3 61,139 18.0 60,829 18.4 61,471 18.4 61,569 18.6 Private 12,222 2.8 11,283 3.3 11,256 3.4 12,092 3.6 12,251 3.7 Other religious 181,936 42.0 151,261 44.6 146,564 44.3 145,905 43.8 143,574 43.3 Conservative Christian 56,155 13.0 46,739 13.8 45,914 13.9 45,572 13.7 45,074 13.6 Other affiliated 56,235 13.0 46,622 13.7 46,015 13.9 45,755 13.7 45,233 13.7 Unaffiliated 69,547 16.0 57,900 17.1 54,635 16.5 54,577 16.4 53,266 16.1 Nonsectarian 118,830 27.4 67,110 19.8 64,418 19.5 65,014 19.5 65,026 19.6 Regular 77,222 17.8 45,806 13.5 44,090 13.3 44,273 13.3 45,053 13.6 Special emphasis 38,830 9.0 18,788 5.5 16,747 5.1 15,782 4.7 14,106 4.3 Special education 2,777 0.6 2,516 0.7 3,581 1.1 4,959 1.5 5,867 1.8 Private school typology
Fifth grade Sixth grade Seventh grade Eighth grade Ninth grade Number Percent Number Percent Number Percent Number Percent Number Percent
Total 339,650 100.0 359,076 100.0 358,824 100.0 360,513 100.0 357,811 100.0 Catholic 127,481 37.5 133,138 37.1 134,229 37.4 135,138 37.5 149,698 41.8 Parochial 49,934 14.7 50,373 14.0 48,986 13.7 47,557 13.2 12,134 3.4 Diocesan 63,600 18.7 64,907 18.1 64,205 17.9 64,801 18.0 66,484 18.6 Private 13,948 4.1 17,858 5.0 21,039 5.9 22,780 6.3 71,080 19.9 Other religious 143,868 42.4 148,928 41.5 145,209 40.5 142,157 39.4 118,005 33.0 Conservative Christian 45,812 13.5 48,234 13.4 47,620 13.3 46,577 12.9 41,556 11.6 Other affiliated 45,043 13.3 46,973 13.1 46,686 13.0 45,808 12.7 37,224 10.4 Unaffiliated 53,013 15.6 53,720 15.0 50,903 14.2 49,772 13.8 39,225 11.0 Nonsectarian 68,301 20.1 77,011 21.4 79,387 22.1 83,218 23.1 90,108 25.2 Regular 47,598 14.0 53,877 15.0 56,848 15.8 58,980 16.4 66,718 18.6 Special emphasis 13,712 4.0 14,755 4.1 13,550 3.8 14,367 4.0 13,366 3.7 Special education 6,992 2.1 8,379 2.3 8,989 2.5 9,872 2.7 10,024 2.8
Private school typology
Tenth grade Eleventh grade Twelfth grade Ungraded Number Percent Number Percent Number Percent Number Percent
Total 357,216 100.0 353,073 100.0 347,351 100.0 51,065 100.0 Catholic 148,704 41.6 146,453 41.5 144,761 41.7 4,679 9.2 Parochial 11,664 3.3 11,783 3.3 11,645 3.4 753 1.5 Diocesan 65,732 18.4 65,112 18.4 64,463 18.6 2,658 5.2 Private 71,308 20.0 69,558 19.7 68,653 19.8 1,268 2.5 Other religious 116,586 32.6 111,887 31.7 108,072 31.1 8,738 17.1 Conservative Christian 41,137 11.5 40,032 11.3 38,572 11.1 2,003 3.9 Other affiliated 37,654 10.5 36,018 10.2 34,611 10.0 2,380 4.7 Unaffiliated 37,795 10.6 35,837 10.2 34,888 10.0 4,356 8.5 Nonsectarian 91,926 25.7 94,734 26.8 94,519 27.2 37,647 73.7 Regular 68,024 19.0 69,154 19.6 68,417 19.7 4,267 8.4 Special emphasis 13,803 3.9 15,196 4.3 14,391 4.1 9,714 19.0 Special education 10,100 2.8 10,384 2.9 11,711 3.4 23,666 46.3 1The count for kindergarten students also includes transitional kindergarten and transitional first grade students. NOTE: Detail may not sum to totals because of rounding or missing values in cells with too few sample cases. These estimates include private schools which provide instruction for one or more of grades kindergarten through twelve (or comparable ungraded levels). SOURCE: U.S. Department of Education, National Center for Education Statistics, Private School Universe Survey (PSS), 2019–20.

C-11
Table C-7. Average private school size, by school level and selected characteristics: United States, 2019–20
Selected Average number of students characteristic Total Elementary/middle1 Secondary/high1 Combined/other1 Total 152.6 106.1 257.7 215.8 Private school typology Catholic 270.3 210.6 502.5 361.2 Parochial 224.6 210.9 359.4 359.5 Diocesan 270.4 218.0 514.2 350.0 Private 355.3 170.4 522.8 369.0 Other religious 131.4 81.6 159.8 200.5 Conservative Christian 159.8 100.6 142.6 187.0 Other affiliated 182.6 118.8 192.0 313.0 Unaffiliated 93.3 62.3 143.4 162.1 Nonsectarian 107.1 53.7 131.9 223.4 Regular 150.5 63.6 196.2 396.5 Special emphasis 65.4 41.8 106.0 181.0 Special education 66.8 53.4 38.8 79.8 Program emphasis Regular elementary/ secondary 196.6 144.7 318.3 250.2 Montessori 38.4 34.3 ‡ 103.3 Special program emphasis 161.1 102.8 171.2 250.3 Special education 65.8 54.4 38.4 77.1 Vocational/technical ‡ ‡ ‡ ‡ Alternative 90.2 45.6 95.1 125.8 Early childhood 16.2 16.2 † ‡ Size (number of students) Less than 50 21.4 19.7 23.7 26.9 50–149 92.2 93.7 87.5 90.5 150–299 210.0 206.6 219.4 214.3 300–499 381.8 378.4 389.1 382.7 500–749 605.3 587.0 607.4 613.9 750 or more 1114.4 1086.9 1069.6 1145.5 Region Northeast 145.8 102.4 257.4 190.9 Midwest 150.6 115.6 316.2 201.7 South 158.9 97.0 223.9 228.7 West 151.4 110.5 252.9 220.1 Urbanicity type City 197.0 135.7 304.6 291.0 Suburban 155.9 109.7 288.0 220.7 Town 108.7 86.9 143.1 146.2 Rural 85.9 49.4 125.2 135.7 † Not applicable. ‡ Reporting standards not met. There are fewer than 15 sample cases. 1 Schools are assigned to one of three school level categories in the 2019–20 PSS: Elementary/middle, High/ secondary, and Combined/other. Elementary/middle schools are defined as schools that enroll students in more of grades K through 4 than in higher grades or that enroll students in more of grades 5 through 8 than in higher or lower grades. High/secondary schools are defined as schools that enroll students in more of grades 9 through 12 than in lower grades. Combined/other schools include all other combinations of grades, including K–12 schools. School level categories in the 2019–20 PSS differ from those in previous survey administrations; caution should be exercised when comparing estimates by level over time. For more information, see Appendix A: Glossary. NOTE: These estimates include private schools which provide instruction for one or more of grades kindergarten through twelve (or comparable ungraded levels). SOURCE: U.S. Department of Education, National Center for Education Statistics, Private School Universe Survey (PSS), 2019–20.

C-12
Table C-8. Number and percentage distribution of private schools, by school size and selected characteristics: United States, 2019–20
Selected characteristic
Less than 50 students
50–149 students
150–299 students
300–499 students
500–749 students
750 or more students
Number Percent Number Percent Number Percent Number Percent Number Percent Number Percent
Total 12,636 41.4 8,223 27.0 5,271 17.3 2,460 8.1 1,064 3.5 838 2.7 Private school typology Catholic 360 5.6 1,732 26.9 2,428 37.6 1,175 18.2 447 6.9 307 4.8 Parochial 102 4.6 647 29.5 945 43.0 378 17.2 105 4.8 ‡ ‡ Diocesan 123 4.0 838 27.2 1,175 38.1 598 19.4 210 6.8 137 4.4 Private 135 11.5 246 21.0 308 26.3 199 17.0 131 11.2 152 13.0 Other religious 6,289 45.6 3,999 29.0 1,966 14.3 848 6.1 387 2.8 304 2.2 Conservative Christian 1,179 31.9 1,267 34.3 704 19.0 312 8.4 144 3.9 91 2.5 Other affiliated 1,011 32.2 1,003 32.0 597 19.1 265 8.5 134 4.3 123 3.9 Unaffiliated 4,100 58.9 1,728 24.8 664 9.5 271 3.9 108 1.6 90 1.3 Nonsectarian 5,986 58.4 2,492 24.3 877 8.6 437 4.3 230 2.2 227 2.2 Regular 2,666 53.5 1,016 20.4 544 10.9 347 7.0 215 4.3 197 3.9 Special emphasis 2,350 67.7 822 23.7 199 5.7 58 1.7 ‡ 0.3 30 0.9 Special education 971 54.1 654 36.5 134 7.5 32 1.8 ‡ 0.2 0 0.0 School level1 Elementary/middle 9,113 48.2 4,975 26.3 3,264 17.3 1,209 6.4 262 1.4 67 0.4 Secondary/high 1,143 32.9 744 21.4 499 14.3 474 13.6 327 9.4 292 8.4 Combined/other 2,380 29.3 2,504 30.8 1,508 18.6 777 9.6 475 5.9 480 5.9 Program emphasis Regular elementary/ secondary 5,824 27.6 6,312 29.9 4,806 22.8 2,315 11.0 1,035 4.9 791 3.8 Montessori 1,938 75.5 517 20.2 95 3.7 ‡ ‡ 0 0.0 ‡ ‡ Special program emphasis 305 32.8 334 36.0 165 17.8 79 8.5 ‡ ‡ 29 3.1 Special education 1,097 54.2 744 36.8 149 7.3 32 1.6 ‡ ‡ 0 0.0 Vocational/ technical ‡ ‡ ‡ ‡ ‡ ‡ ‡ ‡ ‡ ‡ ‡ ‡ Alternative 534 63.4 229 27.1 35 4.1 ‡ ‡ ‡ ‡ ‡ ‡ Early childhood 2,931 96.6 83 2.7 ‡ ‡ ‡ ‡ 0 0.0 0 0.0 See notes at end of table.

C-13
Table C-8. Number and percentage distribution of private schools, by school size and selected characteristics: United States, 2019–20—Continued
Selected characteristic
Less than 50 students
50–149 students
150–299 students
300–499 students
500–749 students
750 or more students
Number Percent Number Percent Number Percent Number Percent Number Percent Number Percent Region Northeast 3,042 45.1 1,698 25.2 1,126 16.7 461 6.8 244 3.6 167 2.5 Midwest 2,604 36.9 2,144 30.4 1,326 18.8 604 8.6 232 3.3 146 2.1 South 4,540 42.5 2,771 26.0 1,674 15.7 896 8.4 421 3.9 369 3.5 West 2,451 40.7 1,609 26.7 1,144 19.0 498 8.3 167 2.8 156 2.6 Urbanicity type City 3,476 33.3 2,690 25.8 2,161 20.7 1,098 10.5 534 5.1 486 4.7 Suburban 4,820 41.3 2,988 25.6 2,086 17.9 1,033 8.8 441 3.8 303 2.6 Town 844 34.1 1,071 43.3 420 17.0 108 4.4 23 0.9 ‡ ‡ Rural 3,497 59.3 1,473 25.0 603 10.2 221 3.7 66 1.1 41 0.7 ‡ Reporting standards not met. There are fewer than 15 sample cases. 1 Schools are assigned to one of three school level categories in the 2019–20 PSS: Elementary/middle, High/secondary, and Combined/other. Elementary/middle schools are defined as schools that enroll students in more of grades K through 4 than in higher grades or that enroll students in more of grades 5 through 8 than in higher or lower grades. High/secondary schools are defined as schools that enroll students in more of grades 9 through 12 than in lower grades. Combined/other schools include all other combinations of grades, including K–12 schools. School level categories in the 2019–20 PSS differ from those in previous survey administrations; caution should be exercised when comparing estimates by level over time. For more information, see Appendix A: Glossary. NOTE: Detail may not sum to totals because of rounding or missing values in cells with too few sample cases. These estimates include private schools which provide instruction for one or more of grades kindergarten through twelve (or comparable ungraded levels). SOURCE: U.S. Department of Education, National Center for Education Statistics, Private School Universe Survey (PSS), 2019–20.

C-14
Table C-9. Percentage distribution of private school students, by racial/ethnic background and selected characteristics: United States, 2019–20
Selected characteristic
Race/Ethnicity1 American
Indian, non-
Hispanic
Asian,
non-Hispanic
Black,
non-Hispanic
Hispanic,
regardless of race
Pacific Islander,
Islander, non-Hispanic
White,
non-Hispanic
Two or more races,
non-Hispanic
Total 0.6 6.6 9.4 11.8 0.7 65.6 5.3 Private school typology Catholic 0.5 5.1 8.3 17.3 0.6 63.0 5.1 Parochial 0.3 4.6 6.8 17.1 0.6 65.5 5.0 Diocesan 0.4 5.1 7.7 17.7 0.6 63.5 5.1 Private 1.0 5.9 11.4 16.6 0.7 59.1 5.4 Other religious 0.6 5.1 10.3 8.1 0.8 71.1 4.0 Conservative Christian 0.7 5.3 11.2 9.2 0.8 68.6 4.3 Other affiliated 0.3 5.5 8.8 7.4 0.7 73.2 4.1 Unaffiliated 0.6 4.5 10.9 7.7 0.9 71.6 3.8 Nonsectarian 0.6 11.5 9.8 9.2 0.7 60.6 7.6 Regular 0.5 12.0 9.0 8.1 0.7 61.7 8.0 Special emphasis 1.0 13.9 8.1 10.4 0.6 57.8 8.3 Special education 0.7 3.8 18.2 14.3 0.4 58.5 4.0 School level2 Elementary/middle 0.5 5.9 8.9 13.7 0.6 65.1 5.4 Secondary/high 0.5 7.7 9.5 14.0 0.5 62.7 5.2 Combined/other 0.7 6.9 10.1 8.5 0.9 67.7 5.2 Program emphasis Regular elementary/ secondary 0.5 6.3 9.2 11.8 0.7 66.4 5.2 Montessori 0.9 13.1 7.2 10.7 0.9 59.7 7.6 Special program emphasis 0.7 14.0 8.6 9.8 0.4 58.3 8.1 Special education 0.8 3.7 17.9 14.4 0.4 59.0 3.8 Vocational/technical ‡ ‡ ‡ ‡ ‡ ‡ ‡ Alternative 1.1 5.7 13.1 12.7 1.1 60.3 6.0 Early childhood 0.5 8.7 10.3 12.3 0.7 62.7 4.7 Size (number of students) Less than 50 0.9 5.3 12.1 10.6 0.7 ! 66.6 3.8 50–149 0.8 5.3 12.2 12.4 0.6 64.3 4.3 150–299 0.5 6.3 10.4 15.1 0.6 61.7 5.4 300–499 0.6 6.7 8.9 12.0 0.6 66.0 5.2 500–749 0.4 6.7 7.3 9.0 0.5 70.4 5.6 750 or more 0.5 8.2 7.3 9.4 1.2 67.3 6.1 Region Northeast 0.3 6.3 9.1 8.8 0.3 70.9 4.4 Midwest 0.5 4.1 9.3 8.8 0.2 73.2 3.9 South 0.4 5.1 12.4 12.7 0.4 64.9 4.2 West 1.1 12.8 4.6 16.9 2.2 52.4 9.9 See notes at end of table.

C-15
Table C-9. Percentage distribution of private school students, by racial/ethnic background and selected characteristics: United States, 2019–20—Continued
Selected characteristic
Race/Ethnicity1 American
Indian, non-
Hispanic
Asian,
non-Hispanic
Black,
non-Hispanic
Hispanic,
regardless of race
Pacific Islander,
Islander, non-Hispanic
White,
non-Hispanic
Two or more races,
non-Hispanic
Urbanicity type City 0.4 7.5 11.1 13.4 0.8 60.7 6.1 Suburban 0.5 7.0 9.6 12.7 0.5 64.4 5.3 Town 0.9 2.6 4.1 6.7 1.2 81.8 2.8 Rural 1.3 3.7 5.1 5.2 0.5 81.2 3.1 ‡ Reporting standards not met. There are fewer than 15 sample cases. ! Interpret data with caution. The coefficient of variation for this estimate is between 30 and 50 percent (i.e., the standard error is at least 30 percent and less than 50 percent of the estimate). 1 Hispanic includes Latino, American Indian includes Native American, Black includes African American, and Pacific Islander includes Native Hawaiian. 2 Schools are assigned to one of three school level categories in the 2019–20 PSS: Elementary/middle, High/secondary, and Combined/other. Elementary/middle schools are defined as schools that enroll students in more of grades K through 4 than in higher grades or that enroll students in more of grades 5 through 8 than in higher or lower grades. High/secondary schools are defined as schools that enroll students in more of grades 9 through 12 than in lower grades. Combined/other schools include all other combinations of grades, including K–12 schools. School level categories in the 2019–20 PSS differ from those in previous survey administrations; caution should be exercised when comparing estimates by level over time. For more information, see Appendix A: Glossary. NOTE: Detail may not sum to totals because of rounding or missing values in cells with too few sample cases. These estimates include private schools which provide instruction for one or more of grades kindergarten through twelve (or comparable ungraded levels). SOURCE: U.S. Department of Education, National Center for Education Statistics, Private School Universe Survey (PSS), 2019–20.

C-16
Table C-10. Percentage male enrollment in private schools and percentage distribution of private schools, by sex of students and selected characteristics: United States, 2019–20
Selected Sex of students characteristic Male enrollment Coed schools All-girls schools All-boys schools Total 51.8 95.3 2.1 2.6 Private school typology Catholic 51.5 93.1 3.5 3.4 Parochial 51.1 99.0 ‡ ‡ Diocesan 50.7 97.7 1.1 1.2 Private 53.5 69.8 15.4 14.9 Other religious 51.3 95.5 1.9 2.6 Conservative Christian 51.7 99.0 ‡ 0.6 Other affiliated 51.7 92.4 3.6 4.1 Unaffiliated 50.7 95.0 2.0 3.1 Nonsectarian 53.0 96.6 1.4 2.0 Regular 50.7 96.1 1.8 2.1 Special emphasis 52.4 97.5 1.0 1.5 Special education 69.0 96.3 ‡ 2.9 School level1 Elementary/middle 51.4 98.4 0.7 0.9 Secondary/high 52.4 74.3 11.4 14.2 Combined/other 51.9 97.3 1.2 1.6 Program emphasis Regular elementary/ secondary 51.4 94.5 2.5 3.0 Montessori 50.6 99.5 ‡ ‡ Special program emphasis 51.2 94.3 ‡ 3.6 Special education 68.3 95.8 ‡ 3.3 Vocational/technical ‡ ‡ ‡ ‡ Alternative 50.6 88.3 4.0 7.7 Early childhood 43.9 99.5 ‡ ‡ Size (number of students) Less than 50 53.1 96.8 1.3 1.9 50–149 53.7 96.4 1.2 2.4 150–299 51.1 95.7 2.3 2.0 300–499 49.9 92.8 4.6 2.5 500–749 49.5 85.2 8.2 6.7 750 or more 54.1 81.5 5.1 13.4 Region Northeast 52.3 90.0 4.2 5.8 Midwest 51.4 97.2 1.2 1.5 South 52.3 96.6 1.4 2.0 West 50.7 96.8 1.7 1.4 See notes at end of table.

C-17
Table C-10. Percentage male enrollment in private schools and percentage distribution of private schools, by coeducational category and selected characteristics: United States, 2019–20—Continued
Selected characteristic
Sex of students Male enrollment Coed schools All-girls schools All-boys schools
Urbanicity type City 51.1 93.5 3.2 3.3 Suburban 52.3 95.8 1.8 2.5 Town 52.1 98.9 ‡ ‡ Rural 52.3 96.4 1.2 2.5 ‡ Reporting standards not met. There are fewer than 15 sample cases or the coefficient of variation for this estimate is 50 percent or greater. 1 Schools are assigned to one of three school level categories in the 2019-20 PSS: Elementary/middle, High/ secondary, and Combined/other. Elementary/middle schools are defined as schools that enroll students in more of grades K through 4 than in higher grades or that enroll students in more of grades 5 through 8 than in higher or lower grades. High/secondary schools are defined as schools that enroll students in more of grades 9 through 12 than in lower grades. Combined/other schools include all other combinations of grades, including K–12 schools. School level categories in the 2019–20 PSS differ from those in previous survey administrations; caution should be exercised when comparing estimates by level over time. For more information, see Appendix A: Glossary. NOTE: Detail may not sum to totals because of rounding or missing values in cells with too few sample cases. These estimates include private schools which provide instruction for one or more of grades kindergarten through twelve (or comparable ungraded levels). SOURCE: U.S. Department of Education, National Center for Education Statistics, Private School Universe Survey (PSS), 2019–20.

C-18
Table C-11. Number and percentage distribution of private school teachers (headcount), by work status and selected characteristics: United States, 2019–20
Selected characteristic
Work status 3/4 time but
less than 100 1/2 time but
less than 3/4 1/4 time but
less than 1/2 Less than
1/4 time Total Full time Number Percent Number Percent Number Percent Number Percent Number Percent Number Percent
Total 529,574 100.0 421,228 79.5 25,227 4.8 43,401 8.2 22,240 4.2 17,477 3.3 Private school typology Catholic 149,332 100.0 127,033 85.1 5,530 3.7 9,643 6.5 4,553 3.0 2,574 1.7 Parochial 41,315 100.0 34,609 83.8 1,538 3.7 2,943 7.1 1,514 3.7 711 1.7 Diocesan 69,290 100.0 59,081 85.3 2,777 4.0 4,497 6.5 1,919 2.8 1,016 1.5 Private 38,728 100.0 33,343 86.1 1,216 3.1 2,202 5.7 1,121 2.9 846 2.2 Other religious 211,745 100.0 155,683 73.5 11,477 5.4 23,138 10.9 12,050 5.7 9,397 4.4 Conservative Christian 64,781 100.0 49,794 76.9 3,143 4.9 5,621 8.7 3,252 5.0 2,972 4.6 Other affiliated 71,276 100.0 50,513 70.9 3,758 5.3 9,071 12.7 4,862 6.8 3,072 4.3 Unaffiliated 75,688 100.0 55,375 73.2 4,576 6.0 8,446 11.2 3,937 5.2 3,354 4.4 Nonsectarian 168,497 100.0 138,513 82.2 8,220 4.9 10,620 6.3 5,637 3.3 5,506 3.3 Regular 105,889 100.0 88,926 84.0 4,876 4.6 6,543 6.2 3,118 2.9 2,426 2.3 Special emphasis 37,494 100.0 28,019 74.7 2,368 6.3 2,982 8.0 1,787 4.8 2,337 6.2 Special education 25,114 100.0 21,568 85.9 976 3.9 1,095 4.4 732 2.9 743 3.0 School level1 Elementary/middle 218,553 100.0 171,113 78.3 11,761 5.4 20,422 9.3 8,672 4.0 6,586 3.0 Secondary/high 97,087 100.0 77,059 79.4 4,246 4.4 7,229 7.4 4,896 5.0 3,657 3.8 Combined/other 213,934 100.0 173,056 80.9 9,220 4.3 15,750 7.4 8,672 4.1 7,235 3.4 Program emphasis Regular elementary/ secondary 442,294 100.0 354,997 80.3 20,061 4.5 36,134 8.2 18,248 4.1 12,854 2.9 Montessori 19,802 100.0 15,285 77.2 1,302 6.6 1,467 7.4 718 3.6 1,030 5.2 Special program emphasis 20,607 100.0 14,499 70.4 1,173 5.7 2,020 9.8 1,269 6.2 1,646 8.0 Special education 27,631 100.0 23,463 84.9 1,188 4.3 1,341 4.9 820 3.0 819 3.0 Vocational/technical ‡ ‡ ‡ ‡ ‡ ‡ ‡ ‡ ‡ ‡ ‡ ‡ Alternative 9,195 100.0 5,884 64.0 707 7.7 1,191 13.0 833 9.1 579 6.3 Early childhood 9,875 100.0 6,975 70.6 766 7.8 1,243 12.6 342 3.5 548 5.5 Size (number of students) Less than 50 56,919 100.0 39,420 69.3 4,201 7.4 5,401 9.5 3,396 6.0 4,502 7.9 50–149 109,064 100.0 79,665 73.0 6,267 5.7 11,034 10.1 6,774 6.2 5,324 4.9 150–299 119,713 100.0 94,063 78.6 6,275 5.2 10,631 8.9 5,361 4.5 3,383 2.8 300–499 92,930 100.0 78,644 84.6 3,302 3.6 6,354 6.8 2,638 2.8 1,991 2.1 500–749 64,094 100.0 55,370 86.4 2,691 4.2 3,626 5.7 1,501 2.3 907 1.4 750 or more 86,854 100.0 74,066 85.3 2,492 2.9 6,355 7.3 2,571 3.0 1,371 1.6 See notes at end of table.

C-19
Table C-11. Number and percentage distribution of private school teachers (headcount), by work status and selected characteristics: United States, 2019–20—Continued
Selected characteristic
Work status
3/4 time but less than 100
1/2 time but less than 3/4
1/4 time but less than 1/2
Less than 1/4 time Total Full time
Number Percent Number Percent Number Percent Number Percent Number Percent Number Percent Region Northeast 127,773 100.0 98,149 76.8 6,196 4.8 12,715 10.0 6,412 5.0 4,301 3.4 Midwest 107,399 100.0 85,450 79.6 4,679 4.4 8,876 8.3 4,568 4.3 3,826 3.6 South 196,020 100.0 161,584 82.4 8,463 4.3 13,591 6.9 6,901 3.5 5,482 2.8 West 98,382 100.0 76,046 77.3 5,890 6.0 8,219 8.4 4,360 4.4 3,869 3.9 Urbanicity type City 229,996 100.0 186,399 81.0 10,267 4.5 17,661 7.7 8,965 3.9 6,705 2.9 Suburban 207,673 100.0 162,659 78.3 10,960 5.3 18,692 9.0 8,583 4.1 6,779 3.3 Town 30,521 100.0 23,691 77.6 1,323 4.3 2,447 8.0 1,660 5.4 1,398 4.6 Rural 61,385 100.0 48,479 79.0 2,677 4.4 4,601 7.5 3,032 4.9 2,596 4.2 ‡ Reporting standards not met. There are fewer than 15 sample cases. 1 Schools are assigned to one of three school level categories in the 2019–20 PSS: Elementary/middle, High/secondary, and Combined/other. Elementary/middle schools are defined as schools that enroll students in more of grades K through 4 than in higher grades or that enroll students in more of grades 5 through 8 than in higher or lower grades. High/secondary schools are defined as schools that enroll students in more of grades 9 through 12 than in lower grades. Combined/other schools include all other combinations of grades, including K–12 schools. School level categories in the 2019–20 PSS differ from those in previous survey administrations; caution should be exercised when comparing estimates by level over time. For more information, see Appendix A: Glossary. NOTE: Detail may not sum to totals because of rounding or missing values in cells with too few sample cases. The teacher estimates in this table are headcounts. These estimates include private schools which provide instruction for one or more of grades kindergarten through twelve (or comparable ungraded levels). SOURCE: U.S. Department of Education, National Center for Education Statistics, Private School Universe Survey (PSS), 2019–20.
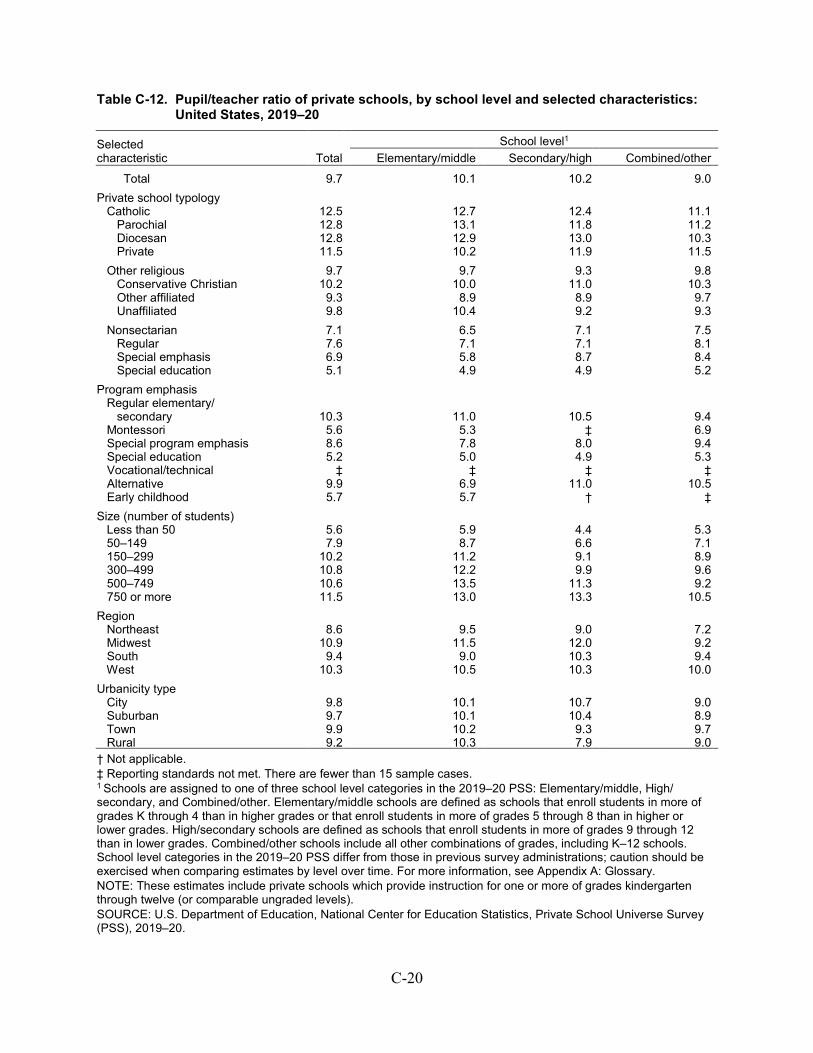
C-20
Table C-12. Pupil/teacher ratio of private schools, by school level and selected characteristics: United States, 2019–20
Selected characteristic
Total
School level1 Elementary/middle Secondary/high Combined/other
Total 9.7 10.1 10.2 9.0 Private school typology Catholic 12.5 12.7 12.4 11.1 Parochial 12.8 13.1 11.8 11.2 Diocesan 12.8 12.9 13.0 10.3 Private 11.5 10.2 11.9 11.5 Other religious 9.7 9.7 9.3 9.8 Conservative Christian 10.2 10.0 11.0 10.3 Other affiliated 9.3 8.9 8.9 9.7 Unaffiliated 9.8 10.4 9.2 9.3 Nonsectarian 7.1 6.5 7.1 7.5 Regular 7.6 7.1 7.1 8.1 Special emphasis 6.9 5.8 8.7 8.4 Special education 5.1 4.9 4.9 5.2 Program emphasis Regular elementary/ secondary 10.3 11.0 10.5 9.4 Montessori 5.6 5.3 ‡ 6.9 Special program emphasis 8.6 7.8 8.0 9.4 Special education 5.2 5.0 4.9 5.3 Vocational/technical ‡ ‡ ‡ ‡ Alternative 9.9 6.9 11.0 10.5 Early childhood 5.7 5.7 † ‡ Size (number of students) Less than 50 5.6 5.9 4.4 5.3 50–149 7.9 8.7 6.6 7.1 150–299 10.2 11.2 9.1 8.9 300–499 10.8 12.2 9.9 9.6 500–749 10.6 13.5 11.3 9.2 750 or more 11.5 13.0 13.3 10.5 Region Northeast 8.6 9.5 9.0 7.2 Midwest 10.9 11.5 12.0 9.2 South 9.4 9.0 10.3 9.4 West 10.3 10.5 10.3 10.0 Urbanicity type City 9.8 10.1 10.7 9.0 Suburban 9.7 10.1 10.4 8.9 Town 9.9 10.2 9.3 9.7 Rural 9.2 10.3 7.9 9.0 † Not applicable. ‡ Reporting standards not met. There are fewer than 15 sample cases. 1 Schools are assigned to one of three school level categories in the 2019–20 PSS: Elementary/middle, High/ secondary, and Combined/other. Elementary/middle schools are defined as schools that enroll students in more of grades K through 4 than in higher grades or that enroll students in more of grades 5 through 8 than in higher or lower grades. High/secondary schools are defined as schools that enroll students in more of grades 9 through 12 than in lower grades. Combined/other schools include all other combinations of grades, including K–12 schools. School level categories in the 2019–20 PSS differ from those in previous survey administrations; caution should be exercised when comparing estimates by level over time. For more information, see Appendix A: Glossary. NOTE: These estimates include private schools which provide instruction for one or more of grades kindergarten through twelve (or comparable ungraded levels). SOURCE: U.S. Department of Education, National Center for Education Statistics, Private School Universe Survey (PSS), 2019–20.
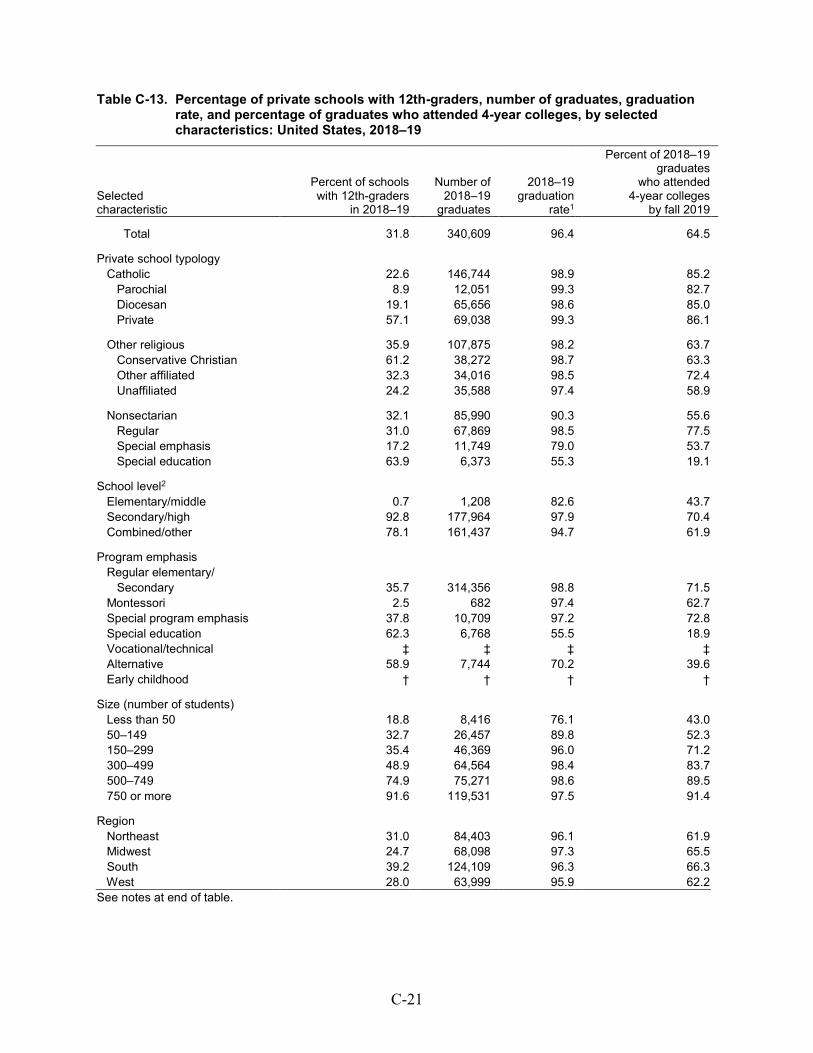
C-21
Table C-13. Percentage of private schools with 12th-graders, number of graduates, graduation rate, and percentage of graduates who attended 4-year colleges, by selected characteristics: United States, 2018–19
Selected characteristic
Percent of schools with 12th-graders
in 2018–19
Number of 2018–19
graduates
2018–19 graduation
rate1
Percent of 2018–19 graduates
who attended 4-year colleges
by fall 2019
Total 31.8
340,609
96.4
64.5
Private school typology
Catholic 22.6
146,744
98.9
85.2
Parochial 8.9
12,051
99.3
82.7
Diocesan 19.1
65,656
98.6
85.0
Private 57.1
69,038
99.3
86.1
Other religious 35.9
107,875
98.2
63.7
Conservative Christian 61.2
38,272
98.7
63.3
Other affiliated 32.3
34,016
98.5
72.4
Unaffiliated 24.2
35,588
97.4
58.9
Nonsectarian 32.1
85,990
90.3
55.6
Regular 31.0
67,869
98.5
77.5
Special emphasis 17.2
11,749
79.0
53.7
Special education 63.9
6,373
55.3
19.1
School level2
Elementary/middle 0.7
1,208
82.6
43.7
Secondary/high 92.8
177,964
97.9
70.4
Combined/other 78.1
161,437
94.7
61.9
Program emphasis
Regular elementary/
Secondary 35.7
314,356
98.8
71.5
Montessori 2.5
682
97.4
62.7
Special program emphasis 37.8
10,709
97.2
72.8
Special education 62.3
6,768
55.5
18.9
Vocational/technical ‡
‡
‡
‡
Alternative 58.9
7,744
70.2
39.6
Early childhood †
†
†
†
Size (number of students)
Less than 50 18.8
8,416
76.1
43.0
50–149 32.7
26,457
89.8
52.3
150–299 35.4
46,369
96.0
71.2
300–499 48.9
64,564
98.4
83.7
500–749 74.9
75,271
98.6
89.5
750 or more 91.6
119,531
97.5
91.4
Region
Northeast 31.0
84,403
96.1
61.9
Midwest 24.7
68,098
97.3
65.5
South 39.2
124,109
96.3
66.3
West 28.0 63,999 95.9 62.2
See notes at end of table.

C-22
Table C-13. Percentage of private schools with 12th-graders, number of graduates, graduation rate, and percentage of graduates who attended 4-year colleges, by selected characteristics: United States, 2018–19—Continued
Selected Characteristic
Percent of schools with 12th-graders
in 2018–19
Number of 2018–19
graduates
2018–19 graduation
rate1
Percent of 2018–19 graduates
who attended 4-year colleges
by fall 2019
Urbanicity type
City 32.9
161,464
97.3
70.1
Suburban 29.8
128,726
95.4
64.1
Town 31.0
13,462
97.9
59.0
Rural 34.3
36,958
95.2
57.6
† Not applicable. ‡ Reporting standards not met. There are fewer than 15 sample cases. 1 The 2018–19 graduation rate is the percent of 12th graders enrolled around October 1, 2018 who graduated in 2018–19. 2 Schools are assigned to one of three school level categories in the 2019-20 PSS: Elementary/middle, High/ secondary, and Combined/other. Elementary/middle schools are defined as schools that enroll students in more of grades K through 4 than in higher grades or that enroll students in more of grades 5 through 8 than in higher or lower grades. High/secondary schools are defined as schools that enroll students in more of grades 9 through 12 than in lower grades. Combined/other schools include all other combinations of grades, including K–12 schools. School level categories in the 2019–20 PSS differ from those in previous survey administrations; caution should be exercised when comparing estimates by level over time. For more information, see Appendix A: Glossary. NOTE: Detail may not sum to totals because of rounding or missing values in cells with too few sample cases. These estimates include private schools which provide instruction for one or more of grades kindergarten through twelve (or comparable ungraded levels). SOURCE: U.S. Department of Education, National Center for Education Statistics, Private School Universe Survey (PSS), 2019–20.

C-23
Table C-14. Number of private schools, students, and teachers (headcount), by school membership in private school associations: United States, 2019–20
Association Schools Students Teachers
Total 30,492 4,652,904 529,574
None 10,460 858,417 103,281
Religious Accelerated Christian Education 772 37,022 4,802 American Association of Christian Schools 711 82,452 9,843 Association of Christian Schools International 2,345 486,539 51,911 Association of Christian Teachers and Schools 164 24,286 2,803 Association of Classical and Christian Schools 259 43,072 5,601
Christian Schools International 316 85,377 8,389 Council of Islamic Schools in North America 56 11,242 1,441 Evangelical Lutheran Education Association 141 13,376 1,430 Friends Council on Education 57 13,088 2,009 General Conference of the Seventh-Day Adventist Church 472 34,727 2,990 Islamic School League of America 94 17,117 2,248
Jesuit Secondary Education Association 70 49,916 4,339 National Association of Episcopal Schools 278 79,503 11,180 National Catholic Educational Association 4,785 1,352,463 114,892 National Christian School Association 141 37,379 3,706 National Society of Hebrew Day Schools 298 95,301 12,598
Oral Roberts University Educational Fellowship 49 10,473 1,117 Prizmah: Center for Jewish Day Schools 212 53,194 9,792 Southern Baptist Association of Christian Schools 123 43,652 4,372 Other religious school associations 1,599 294,350 32,274
Special emphasis American Montessori Society 1,256 57,044 11,927 Association Montessori International 684 30,126 4,202 Other Montessori associations 614 23,275 5,049 Association of Military Colleges and Schools 26 6,864 868 Association of Waldorf Schools of North America 132 18,573 3,265
National Association of Private Special Education Centers 248 21,648 3,481 Other associations for exceptional children ‡ ‡ ‡ European Council for International Schools 8 4,386 741 National Association for the Education of Young Children ‡ ‡ ‡ National Association of Laboratory Schools 24 ! 3,728 433 National Coalition of Girls’ Schools 124 51,704 6,960 Other special emphasis school associations 783 120,749 16,210 Other school associations or organizations Alternative School Network 31 1,684 272 National Association of Independent Schools 1,614 667,679 95,058 State or regional independent school association 1,946 588,984 75,932 National Independent Private School Association 198 30,298 3,884 The Association of Boarding Schools 250 94,319 14,079 Other school associations 4,454 866,167 100,236 ! Interpret data with caution. The coefficient of variation for this estimate is between 30 and 50 percent (i.e., the standard error is at least 30 percent and less than 50 percent of the estimate). ‡ Reporting standards not met. There are fewer than 15 sample cases. NOTE: Details do not sum to total because private schools may belong to more than one association. These estimates include private schools which provide instruction for one or more of grades kindergarten through twelve (or comparable ungraded levels). SOURCE: U.S. Department of Education, National Center for Education Statistics, Private School Universe Survey (PSS), 2019–20.

C-24
Table C-15. Number of private schools, students, full-time equivalent (FTE) teachers, and 2018–19 high school graduates, by state: United States, 2019–20
State
Schools
Students
FTE teachers
High school graduates 2018–19
United States 30,492 4,652,904 481,200 340,609 Alabama 403 64,810 6,362 5,003 Alaska 43 3,058 387 ‡ Arizona 402 59,171 5,631 4,152 Arkansas 171 24,234 2,662 1,684 California 3,222 541,646 51,344 38,851 Colorado 358 45,900 5,100 3,206 Connecticut 315 53,047 7,309 6,920 Delaware 139 ! 20,199 2,120 1,300 District of Columbia 72 14,752 1,929 1,387 Florida 2,506 395,043 37,480 27,085 Georgia 858 145,135 17,031 11,096 Hawaii 165 41,191 3,756 3,305 Idaho 155 15,084 1,423 878 Illinois 1,282 191,454 17,905 12,649 Indiana 869 115,421 9,580 6,849 Iowa 217 42,573 4,096 2,713 Kansas 216 41,014 3,669 2,575 Kentucky 409 72,565 7,160 5,417 Louisiana 406 117,465 11,050 10,196 Maine 152 18,357 2,084 2,998 Maryland 705 129,476 14,424 10,551 Massachusetts 657 104,405 15,217 11,303 Michigan 798 125,206 11,093 8,664 Minnesota 521 71,734 6,556 5,120 Mississippi 183 37,015 3,651 2,978 Missouri 642 94,062 9,502 6,681 Montana 121 8,350 949 414 Nebraska 194 35,456 2,804 2,473 Nevada 130 20,626 1,776 1,424 New Hampshire 209 17,934 2,573 2,174 New Jersey 1,068 162,354 19,014 13,432 New Mexico 174 18,201 1,956 1,194 New York 1,656 355,784 40,008 26,890 North Carolina 757 121,525 13,358 8,252 North Dakota 57 9,552 904 ‡ Ohio 1,290 195,894 18,809 12,640 Oklahoma 177 32,650 3,421 2,239 Oregon 375 45,487 4,415 3,440 Pennsylvania 2,458 245,171 25,276 18,130 Rhode Island 112 16,071 1,825 1,606 South Carolina 427 50,367 5,597 3,401 South Dakota 80 11,563 1,007 763 Tennessee 566 99,832 11,547 8,336 Texas 1,738 246,706 28,563 16,788 Utah 169 16,223 1,790 1,388 See notes at end of table.

C-25
Table C-15. Number of private schools, students, full-time equivalent (FTE) teachers, and 2018–19 high school graduates, by state: United States, 2019–20—Continued
State
Schools
Students
FTE teachers
High school graduates 2018–19
Vermont 112 9,142 1,205 952 Virginia 1,024 111,427 13,116 7,560 Washington 672 94,937 9,682 5,552 West Virginia 130 12,530 1,373 838 Wisconsin 890 128,987 11,412 6,549 Wyoming 40 2,120 301 ‡ ! Interpret data with caution. The coefficient of variation for this estimate is between 30 and 50 percent (i.e., the standard error is at least 30 percent and less than 50 percent of the estimate). ‡ Reporting standards not met. There are fewer than 15 sample cases. NOTE: Detail may not sum to totals because of rounding or missing values in cells with too few sample cases. These estimates include private schools which provide instruction for one or more of grades kindergarten through twelve (or comparable ungraded levels). SOURCE: U.S. Department of Education, National Center for Education Statistics, Private School Universe Survey (PSS), 2019–20.
D-1
Appendix D—Standard Error Tables

D-2
Table D-1. Standard errors for Table C-1: Number and percentage distribution of private schools, students, and full-time equivalent (FTE) teachers, by selected characteristics: United States, 2019–20
Selected Characteristic
Schools Students FTE teachers Number Percent Number Percent Number Percent
Total 191.7 † 31,309.8 † 3,060.3 † Private school typology Catholic 52.1 0.2 16,326.1 0.3 1,140.8 0.2 Parochial 43.1 0.1 10,001.1 0.2 795.1 0.2 Diocesan 18.0 0.1 4,428.1 0.2 204.3 0.1 Private 12.7 0.0 11,483.4 0.2 626.9 0.1 Other religious 153.0 0.3 23,796.8 0.3 2,246.6 0.3 Conservative Christian 103.7 0.3 17,302.9 0.3 1,651.8 0.3 Other affiliated 46.0 0.2 5,926.8 0.1 694.1 0.1 Unaffiliated 101.8 0.3 13,730.3 0.3 1,129.2 0.2 Nonsectarian 108.7 0.3 8,816.9 0.2 1,461.1 0.3 Regular 79.4 0.3 6,828.3 0.2 1,150.8 0.3 Special emphasis 67.1 0.2 4,875.7 0.1 785.5 0.1 Special education 43.7 0.1 1,545.3 0.0 307.6 0.1 School level Elementary/middle 138.5 0.3 15,717.4 0.3 1,374.6 0.3 Secondary/high 64.2 0.2 10,675.8 0.2 1,226.7 0.2 Combined/other 125.8 0.3 23,237.3 0.4 2,130.9 0.3 Program emphasis Regular elementary/secondary 138.4 0.2 28,396.8 0.1 2,550.4 0.2 Montessori 64.4 0.2 1,227.2 0.0 259.5 0.1 Special program emphasis 10.5 0.0 4,805.3 0.1 713.9 0.1 Special education 43.7 0.1 1,545.3 0.0 307.6 0.1 Vocational/technical † † † †
† †
Alternative 17.4 0.1 1,622.3 0.0 159.4 0.0 Early childhood 68.8 0.2 1,859.0 0.0 310.5 0.1 Size (number of students) Less than 50 150.6 0.3 3,743.9 0.1 603.3 0.1 50–149 97.6 0.3 10,346.4 0.2 993.2 0.2 150–299 26.9 0.1 5,981.9 0.2 404.4 0.2 300–499 28.5 0.1 10,543.2 0.2 792.4 0.2 500–749 22.7 0.1 14,004.7 0.3 1,595.9 0.3 750 or more 24.2 0.1 21,414.2 0.4 1,771.2 0.3 Region Northeast 62.3 0.2 10,777.3 0.2 921.1 0.2 Midwest 101.2 0.3 8,604.4 0.2 862.7 0.2 South 132.4 0.3 23,384.7 0.4 2,174.0 0.3 West 71.5 0.2 15,597.2 0.3 1,745.3 0.3 Urbanicity type City 171.8 0.5 27,659.3 0.4 2,765.3 0.4 Suburban 147.2 0.4 14,899.4 0.3 1,308.8 0.3 Town 60.4 0.2 8,670.5 0.2 831.6 0.2 Rural 108.3 0.4 8,262.3 0.2 753.1 0.2 † Not applicable. SOURCE: U.S. Department of Education, National Center for Education Statistics, Private School Universe Survey (PSS), 2019–20.

D-3
Table D-2. Standard errors for Table C-2: Number and percentage distribution of private schools, students, and full-time equivalent (FTE) teachers, by religious or nonsectarian orientation of school: United States, 2019–20
Religious or nonsectarian orientation
Schools Students FTE teachers Number Percent Number Percent Number Percent
Total 191.7 † 31,309.8 † 3,060.3 † Religious orientation 162.2 0.30 30,577.8 0.22 2,712.0 0.28 Roman Catholic 52.1 0.17 16,326.1 0.28 1,140.8 0.21 African Methodist Episcopal † † † † † † Amish 29.9 0.10 1,074.7 0.02 59.7 0.01 Assembly of God 0.0 # 0.0 # 0.0 # Baptist 86.5 0.27 11,686.7 0.24 1,013.8 0.20
Brethren 0.0 # 0.0 # 0.0 # Calvinist 0.0 # 0.0 # 0.0 # Christian (unspecified) 102.3 0.34 14,292.8 0.27 1,412.1 0.25 Church of Christ 0.0 # 0.0 # 0.0 # Church of God 0.0 # 0.0 # 0.0 #
Church of God in Christ † † † † † † Church of the Nazarene 0.0 # 0.0 # 0.0 # Disciples of Christ † † † † † † Episcopal 20.2 0.07 2,611.7 0.05 571.2 0.11 Friends 0.0 # 0.0 # 0.0 #
Greek Orthodox 14.1 0.05 1,208.8 0.03 174.3 0.04 Islamic 0.0 0.01 0.0 0.01 0.0 0.01 Jewish 26.9 0.09 10,653.1 0.22 862.4 0.17 Latter Day Saints † † † † † † Lutheran Church—Missouri Synod 21.0 0.07 2,995.8 0.06 243.7 0.05
Evangelical Lutheran Church In America 0.0 # 0.0 # 0.0 # Wisconsin Evangelical Lutheran Synod 0.0 0.01 0.0 # 0.0 # Other Lutheran 0.0 # 0.0 # 0.0 # Mennonite 19.1 0.06 534.6 0.01 38.2 0.01 Methodist 75.7 0.25 1,211.9 0.03 151.5 0.03
Pentecostal 37.3 0.12 3,547.2 0.08 242.8 0.05 Presbyterian 0.0 # 0.0 0.01 0.0 # Seventh-Day Adventist 5.6 0.02 446.0 0.01 8.9 0.01 Other 8.2 0.03 2,906.3 0.06 237.6 0.05
Nonsectarian 108.7 0.30 8,816.9 0.22 1,461.1 0.28 † Not applicable. # Rounds to zero. SOURCE: U.S. Department of Education, National Center for Education Statistics, Private School Universe Survey (PSS), 2019–20.

D-4
Table D-3. Standard errors for Table C-3: Percentage distribution of private schools, by program emphasis and selected characteristics: United States, 2019–20
Selected characteristic
Regular elementary/
secondary
Montessori
Special program
emphasis
Special
education
Vocational/ technical
programs
Alternative
Early
childhood
Total 0.21 0.19 0.04 0.14 † 0.06 0.21 Private school typology Catholic 0.13 0.01 0.01 0.01 † # 0.13 Parochial 0.39 † 0.02 0.00 † † 0.39 Diocesan 0.02 † # 0.01 † † † Private 0.10 0.03 † † † † 0.02
Other religious 0.24 0.04 0.02 0.01 † 0.04 0.25 Conservative Christian 0.20 † 0.04 0.03 † 0.05 0.06 Other affiliated 0.81 0.02 0.05 0.01 † 0.02 0.86 Unaffiliated 0.40 0.08 0.03 0.02 † 0.07 0.37
Nonsectarian 0.42 0.55 0.10 0.40 † 0.16 0.53 Regular 0.84 † † † † † 0.84 Special emphasis † 0.74 0.42 † † 0.51 † Special education † † † 0.00 † † †
School level Elementary/middle 0.33 0.31 0.05 0.10 † 0.04 0.33 Secondary/high 1.26 † 0.15 1.38 † 0.48 † Combined/other 0.45 0.03 0.06 0.43 † 0.08 #
Size (number of students) Less than 50 0.50 0.46 0.08 0.33 † 0.14 0.45 50–149 0.35 0.07 0.05 0.21 † 0.10 0.20 150–299 0.17 0.01 0.02 0.01 † # † 300–499 0.21 † 0.04 0.02 † † † 500–749 0.06 0.00 † † † † 0.00 750 or more 0.56 † 0.58 0.00 † † 0.00
Region Northeast 0.32 0.17 0.02 0.18 † 0.12 0.16 Midwest 0.54 0.54 0.13 0.34 † 0.02 0.39 South 0.40 0.28 0.04 0.33 † 0.13 0.49 West 0.43 0.53 0.06 0.06 † 0.06 0.31
Urbanicity type City 0.46 0.38 0.08 0.37 † 0.09 0.63 Suburban 0.43 0.39 0.08 0.35 † 0.13 0.52 Town 0.43 0.23 0.05 0.07 † 0.05 0.11 Rural 1.02 0.06 0.04 0.67 † 0.05 0.95 † Not applicable. # Rounds to zero. SOURCE: U.S. Department of Education, National Center for Education Statistics, Private School Universe Survey (PSS), 2019–20.

D-5
Table D-4. Standard errors for Table C-4: Number and percentage distribution of private schools, by urbanicity type and selected characteristics: United States, 2019–20
Selected Total City Suburban Town Rural characteristic Number Percent Number Percent Number Percent Number Percent Number Percent Total 191.7 † 171.8 † 147.2 † 60.4 † 108.3 † Private school typology Catholic 52.1 0.17 21.4 0.43 22.5 0.29 59.9 1.55 14.6 0.25 Parochial 43.1 0.13 8.2 0.15 16.1 0.13 36.3 1.15 14.6 0.24 Diocesan 18.0 0.08 17.2 0.25 12.7 0.17 18.1 0.38 0.0 0.07 Private 12.7 0.05 17.0 0.17 9.9 0.10 25.0 0.98 0.0 0.04 Other religious 153.0 0.35 164.2 1.00 59.8 0.40 5.6 1.16 95.6 0.77 Conservative Christian 103.7 0.31 87.0 0.70 14.7 0.17 25.7 1.09 34.1 0.56 Other affiliated 46.0 0.17 34.4 0.33 33.1 0.30 0.0 0.26 0.0 0.15 Unaffiliated 101.8 0.28 77.7 0.50 55.8 0.38 20.1 0.97 89.3 0.94 Nonsectarian 108.7 0.30 57.7 0.70 114.4 0.57 5.1 0.43 44.2 0.67 Regular 79.4 0.26 32.0 0.41 70.3 0.49 0.0 0.17 15.5 0.28 Special emphasis 67.1 0.20 38.2 0.39 56.3 0.39 5.1 0.25 0.0 0.12 Special education 43.7 0.14 39.1 0.37 44.8 0.35 0.0 0.06 41.4 0.68 School level Elementary/middle 138.5 0.27 95.5 0.38 108.8 0.47 60.4 0.91 84.9 0.90 Secondary/high 64.2 0.22 42.7 0.44 19.0 0.19 0.0 0.19 41.4 0.65 Combined/other 125.8 0.33 87.1 0.52 73.7 0.48 0.0 0.72 53.0 0.80 Program emphasis Regular elementary/ secondary 138.4 0.21 94.8 0.46 67.3 0.43 60.2 0.43 79.0 1.02 Montessori 64.4 0.19 39.0 0.38 54.4 0.39 5.1 0.23 0.0 0.06 Special program emphasis 10.5 0.04 5.1 0.08 9.2 0.08 0.0 0.05 0.0 0.04 Special education 43.7 0.14 39.1 0.37 44.8 0.35 0.0 0.07 41.4 0.67 Vocational/technical † † † † † † † † † † Alternative 17.4 0.06 8.0 0.09 15.5 0.13 0.0 0.05 0.0 0.05 Early childhood 68.8 0.21 79.4 0.63 67.2 0.52 0.0 0.11 57.9 0.95 Size (number of students) Less than 50 150.6 0.33 163.1 1.08 120.7 0.60 20.8 1.23 89.2 0.83 50–149 97.6 0.26 36.3 0.50 44.7 0.33 60.2 1.63 55.9 0.81 150–299 26.9 0.15 21.7 0.37 17.0 0.26 25.0 0.92 0.0 0.19 300–499 28.5 0.09 14.1 0.20 19.9 0.16 0.0 0.11 14.6 0.24 500–749 22.7 0.08 18.3 0.18 7.7 0.08 0.0 0.02 0.0 0.02 750 or more 24.2 0.08 22.5 0.21 5.1 0.05 † † 0.0 0.01 Region Northeast 62.3 0.21 14.1 0.28 44.4 0.43 0.0 0.27 44.8 0.72 Midwest 101.2 0.28 12.8 0.31 71.9 0.54 54.4 1.38 45.3 0.75 South 132.4 0.32 165.6 0.98 110.2 0.68 25.0 0.97 85.1 1.06 West 71.5 0.22 41.4 0.52 49.0 0.41 7.6 0.53 20.8 0.36 † Not applicable. SOURCE: U.S. Department of Education, National Center for Education Statistics, Private School Universe Survey (PSS), 2019–20.

D-6
Table D-5. Standard errors for Table C-5: Number and percentage distribution of private school students, by urbanicity type and selected characteristics: United States, 2019–20
Selected characteristic
Total City Suburban Town Rural Number Percent Number Percent Number Percent Number Percent Number Percent
Total 31,309.8 † 27,659.3 † 14,899.4 † 8,670.5 † 8,262.3 † Private school typology Catholic 16,326.1 0.28 16,459.9 0.56 8,643.3 0.32 8,250.1 1.61 4,605.8 0.79 Parochial 10,001.1 0.20 3,131.2 0.18 7,005.4 0.34 4,464.3 1.25 4,605.8 0.87 Diocesan 4,428.1 0.15 4,399.8 0.32 2,333.0 0.19 1,832.9 0.53 0.0 0.12 Private 11,483.4 0.22 15,915.2 0.68 4,452.2 0.22 5,330.0 1.89 0.0 0.08 Other religious 23,796.8 0.34 18,423.6 0.65 9,496.7 0.32 2,667.2 1.33 6,707.2 0.78 Conservative Christian 17,302.9 0.33 14,921.0 0.66 2,015.4 0.13 3,653.5 1.29 3,543.9 0.63 Other affiliated 5,926.8 0.13 3,823.5 0.18 4,672.9 0.25 0.0 0.36 0.0 0.17 Unaffiliated 13,730.3 0.26 6,206.4 0.27 7,781.0 0.36 986.3 0.60 5,694.4 0.87 Nonsectarian 8,816.9 0.22 8,308.1 0.43 3,175.3 0.23 5.1 0.38 994.0 0.42 Regular 6,828.3 0.19 6,598.7 0.36 1,733.4 0.14 0.0 0.25 286.2 0.28 Special emphasis 4,875.7 0.09 4,785.5 0.22 733.2 0.05 5.1 0.09 0.0 0.08 Special education 1,545.3 0.04 1,245.0 0.07 1,639.2 0.09 0.0 0.04 951.9 0.19 School level Elementary/middle 15,717.4 0.31 5,444.2 0.44 12,175.9 0.39 8,670.5 1.61 7,366.6 1.01 Secondary/high 10,675.8 0.19 6,761.3 0.33 4,470.2 0.21 0.0 0.33 951.9 0.30 Combined/other 23,237.3 0.36 22,538.3 0.66 4,347.6 0.28 0.0 1.29 3,618.3 0.84 Program emphasis Regular elementary/ secondary 28,396.8 0.13 26,308.5 0.25 13,984.3 0.12 8,670.5 0.19 8,097.0 0.27 Montessori 1,227.2 0.03 1,045.5 0.06 657.0 0.04 5.1 0.04 0.0 0.02 Special program emphasis 4,805.3 0.09 4,794.0 0.22 329.4 0.03 0.0 0.05 0.0 0.06 Special education 1,545.3 0.04 1,245.0 0.07 1,639.2 0.09 0.0 0.04 951.9 0.19 Vocational/technical † † † † † † † † † † Alternative 1,622.3 0.03 355.3 0.02 1,582.9 0.08 0.0 0.03 0.0 0.02 Early childhood 1,859.0 0.04 1,545.2 0.07 1,648.0 0.09 0.0 0.02 848.3 0.17 Size (number of students) Less than 50 3,743.9 0.09 3,248.7 0.16 2,997.8 0.16 986.3 0.49 1,897.2 0.40 50–149 10,346.4 0.19 2,803.3 0.16 4,561.8 0.21 7,280.3 1.92 6,509.6 0.99 150–299 5,981.9 0.22 3,414.7 0.26 3,752.3 0.23 5,330.0 1.57 0.0 0.41 300–499 10,543.2 0.21 4,663.5 0.28 8,258.1 0.35 0.0 0.50 4,605.8 0.79 500–749 14,004.7 0.27 10,831.0 0.45 5,645.9 0.28 0.0 0.16 0.0 0.13 750 or more 21,414.2 0.37 19,918.5 0.70 4,415.0 0.22 † † 0.0 0.15 Region Northeast 10,777.3 0.23 4,368.5 0.29 6,620.8 0.33 0.0 0.27 904.8 0.36 Midwest 8,604.4 0.21 1,960.7 0.28 6,385.8 0.32 6,297.2 1.62 3,703.3 0.66 South 23,384.7 0.36 25,875.4 0.80 9,159.9 0.40 5,330.0 1.58 6,753.5 0.86 West 15,597.2 0.29 8,518.9 0.44 7,312.7 0.35 2,667.2 0.96 2,850.0 0.53 † Not applicable. # Rounds to zero. SOURCE: U.S. Department of Education, National Center for Education Statistics, Private School Universe Survey (PSS), 2019–20.

D-7
Table D-6. Standard errors for Table C-6: Number and percentage distribution of private school students, by grade and private school typology: United States, 2019–20
Private school typology
Kindergarten First grade Second grade Third grade Fourth grade Number Percent Number Percent Number Percent Number Percent Number Percent
Total 2,613.1 †
2,314.1 †
2,049.9 †
2,318.6 †
2,089.5 † Catholic 1,591.1 0.31
1,337.3 0.32
993.7 0.29
1,220.8 0.34
1,085.5 0.31
Parochial 1,513.6 0.31
1,161.0 0.30
971.7 0.27
1,149.6 0.31
995.4 0.27 Diocesan 412.6 0.14
542.0 0.18
435.2 0.18
507.5 0.19
528.4 0.20
Private 221.4 0.05
83.2 0.04
115.3 0.04
119.9 0.05
263.4 0.08 Other religious 2,004.9 0.34
1,896.5 0.36
1,860.1 0.34
2,074.3 0.38
1,918.7 0.36
Conservative Christian 1,282.4 0.27
1,251.0 0.34
1,404.2 0.38
1,527.0 0.41
1,300.3 0.35 Other affiliated 991.0 0.21
606.1 0.19
577.4 0.18
607.8 0.19
586.8 0.18
Unaffiliated 1,264.1 0.27
1,496.2 0.38
1,248.4 0.33
1,466.0 0.39
1,398.8 0.37 Nonsectarian 1,197.9 0.27
477.2 0.20
463.5 0.19
399.4 0.19
401.1 0.19
Regular 1,151.8 0.25
369.8 0.16
384.2 0.15
357.0 0.16
357.2 0.16 Special emphasis 498.7 0.12
253.1 0.08
215.8 0.07
134.1 0.05
140.1 0.05
Special education 137.4 0.03 116.1 0.03 115.4 0.03 114.5 0.03 112.6 0.03 Private school typology
Fifth grade Sixth grade Seventh grade Eighth grade Ninth grade Number Percent Number Percent Number Percent Number Percent Number Percent
Total 2,214.0 †
2,970.1 †
3,173.6 †
3,180.7 †
3,437.9 † Catholic 1,232.2 0.33
1,582.7 0.37
1,791.8 0.39
1,923.5 0.40
2,236.8 0.40
Parochial 1,198.8 0.32
1,230.0 0.31
1,309.9 0.33
1,201.2 0.32
0.0 0.03 Diocesan 514.9 0.19
530.6 0.21
546.1 0.21
538.9 0.21
0.0 0.18
Private 87.6 0.04
815.4 0.21
1,007.6 0.26
1,421.1 0.36
2,236.8 0.49 Other religious 1,950.9 0.36
2,278.6 0.41
2,350.2 0.43
2,200.9 0.41
1,740.5 0.39
Conservative Christian 1,429.6 0.37
1,632.1 0.40
1,564.2 0.38
1,536.3 0.38
1,127.9 0.29 Other affiliated 599.4 0.18
671.9 0.20
776.0 0.22
787.4 0.21
0.0 0.10
Unaffiliated 1,321.2 0.34
1,512.8 0.37
1,305.0 0.31
1,176.7 0.29
1,011.2 0.23 Nonsectarian 509.5 0.21
841.3 0.25
837.1 0.27
945.6 0.29
1,120.4 0.27
Regular 501.3 0.19
575.3 0.21
580.0 0.23
757.1 0.26
670.4 0.25 Special emphasis 68.1 0.03
577.2 0.15
586.0 0.15
555.8 0.14
882.0 0.23
Special education 137.2 0.04 206.9 0.06 152.0 0.05 204.0 0.06 229.3 0.07 Private school typology
Tenth grade Eleventh grade Twelfth grade Ungraded Number Percent Number Percent Number Percent Number Percent
Total 3,368.0 †
3,494.9 †
3,438.2 †
1,095.8 †
Catholic 1,853.5 0.35
2,427.9 0.43
2,313.8 0.43
0.0 0.20
Parochial 0.0 0.03
0.0 0.03
0.0 0.03
0.0 0.03
Diocesan 0.0 0.17
0.0 0.18
0.0 0.18
0.0 0.11
Private 1,853.5 0.40
2,427.9 0.54
2,313.8 0.53
0.0 0.05
Other religious 2,073.4 0.43
1,724.2 0.40
1,782.7 0.41
0.0 0.37
Conservative Christian 1,468.9 0.37
1,199.8 0.31
1,298.4 0.34
0.0 0.08
Other affiliated 0.0 0.10
0.0 0.10
0.0 0.10
0.0 0.10
Unaffiliated 985.7 0.22
924.3 0.22
828.9 0.20
0.0 0.18
Nonsectarian 1,093.6 0.27
1,014.6 0.27
1,073.5 0.29
1,095.8 0.56
Regular 680.3 0.25
657.5 0.25
698.2 0.26
66.2 0.22
Special emphasis 815.2 0.21
745.0 0.19
646.4 0.17
303.8 0.62
Special education 290.2 0.08
228.4 0.07
562.0 0.16
1,050.7 1.14
† Not applicable. SOURCE: U.S. Department of Education, National Center for Education Statistics, Private School Universe Survey (PSS), 2019–20.
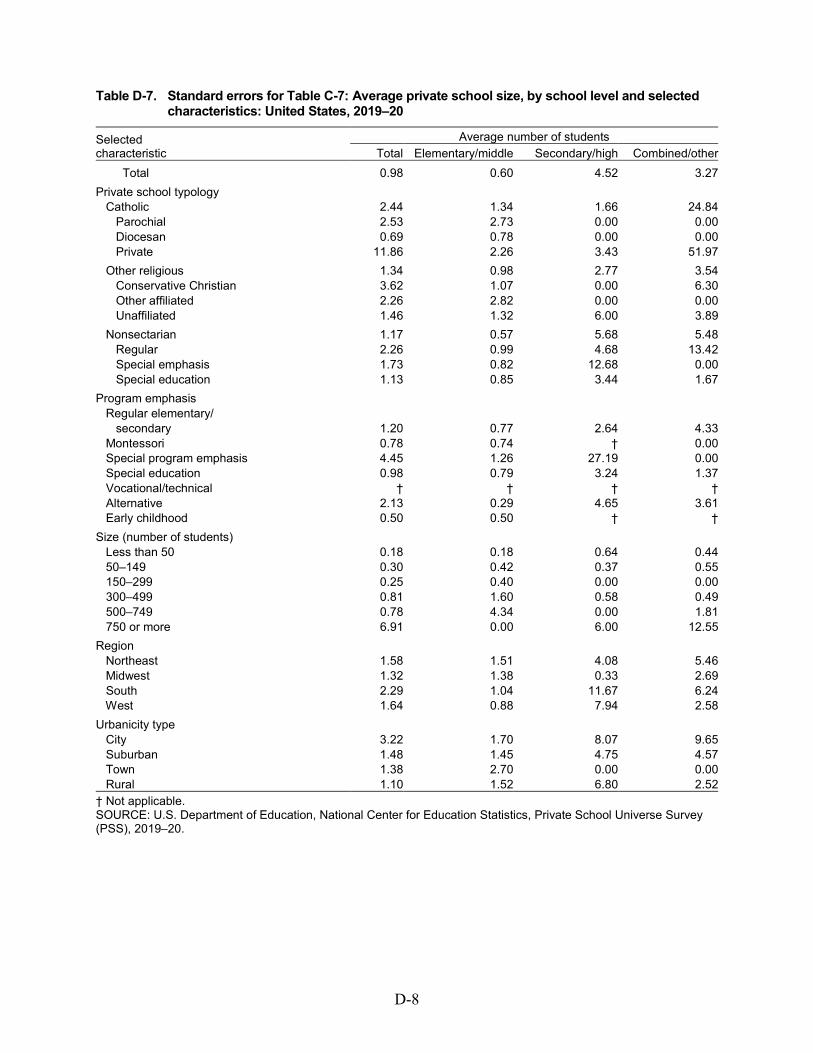
D-8
Table D-7. Standard errors for Table C-7: Average private school size, by school level and selected characteristics: United States, 2019–20
Selected characteristic
Average number of students Total Elementary/middle Secondary/high Combined/other
Total 0.98 0.60 4.52 3.27 Private school typology Catholic 2.44 1.34 1.66 24.84 Parochial 2.53 2.73 0.00 0.00 Diocesan 0.69 0.78 0.00 0.00 Private 11.86 2.26 3.43 51.97 Other religious 1.34 0.98 2.77 3.54 Conservative Christian 3.62 1.07 0.00 6.30 Other affiliated 2.26 2.82 0.00 0.00 Unaffiliated 1.46 1.32 6.00 3.89 Nonsectarian 1.17 0.57 5.68 5.48 Regular 2.26 0.99 4.68 13.42 Special emphasis 1.73 0.82 12.68 0.00 Special education 1.13 0.85 3.44 1.67 Program emphasis Regular elementary/ secondary 1.20 0.77 2.64 4.33 Montessori 0.78 0.74 † 0.00 Special program emphasis 4.45 1.26 27.19 0.00 Special education 0.98 0.79 3.24 1.37 Vocational/technical † † † † Alternative 2.13 0.29 4.65 3.61 Early childhood 0.50 0.50 † † Size (number of students) Less than 50 0.18 0.18 0.64 0.44 50–149 0.30 0.42 0.37 0.55 150–299 0.25 0.40 0.00 0.00 300–499 0.81 1.60 0.58 0.49 500–749 0.78 4.34 0.00 1.81 750 or more 6.91 0.00 6.00 12.55 Region Northeast 1.58 1.51 4.08 5.46 Midwest 1.32 1.38 0.33 2.69 South 2.29 1.04 11.67 6.24 West 1.64 0.88 7.94 2.58 Urbanicity type City 3.22 1.70 8.07 9.65 Suburban 1.48 1.45 4.75 4.57 Town 1.38 2.70 0.00 0.00 Rural 1.10 1.52 6.80 2.52 † Not applicable. SOURCE: U.S. Department of Education, National Center for Education Statistics, Private School Universe Survey (PSS), 2019–20.

D-9
Table D-8. Standard errors for Table C-8: Number and percentage distribution of private schools, by school size and selected characteristics:
United States, 2019–20
Selected characteristic
Less than 50 students
50–149 students
150–299 students
300–499 students
500–749 students
750 or more students
Number Percent Number Percent Number Percent Number Percent Number Percent Number Percent Total 150.6 0.33 97.6 0.26 26.9 0.15 28.5 0.09 22.7 0.08 24.2 0.08 Private school typology Catholic 0.0 0.05 54.4 0.68 33.3 0.60 21.7 0.30 5.1 0.09 17.7 0.28 Parochial 0.0 0.09 37.4 1.27 13.2 0.95 20.3 0.82 5.1 0.24 † † Diocesan 0.0 0.02 18.1 0.56 16.8 0.51 7.6 0.16 0.0 0.04 0.0 0.03 Private 0.0 0.13 8.5 0.59 25.0 1.97 0.0 0.18 0.0 0.12 17.7 1.59 Other religious 115.8 0.55 76.5 0.45 25.6 0.22 17.9 0.13 18.9 0.13 13.8 0.09 Conservative Christian 75.7 1.53 59.5 1.21 5.1 0.54 0.0 0.24 11.0 0.31 13.8 0.34 Other affiliated 40.2 0.90 0.7 0.47 17.0 0.51 14.6 0.44 0.0 0.06 0.0 0.06 Unaffiliated 66.4 0.63 57.8 0.61 18.4 0.28 14.3 0.21 15.4 0.22 0.0 0.02 Nonsectarian 104.6 0.45 25.1 0.30 0.0 0.09 0.0 0.05 11.4 0.11 5.1 0.05 Regular 75.5 0.73 17.5 0.41 0.0 0.17 0.0 0.11 11.4 0.23 0.0 0.06 Special emphasis 67.6 0.68 7.6 0.51 0.0 0.11 0.0 0.03 † † 5.1 0.15 Special education 40.7 1.15 16.3 1.01 0.0 0.18 0.0 0.04 † † 0.0 0.00 School level Elementary/middle 94.5 0.32 81.8 0.33 26.9 0.20 25.8 0.12 9.3 0.05 0.0 -1.00 Secondary/high 61.5 1.22 13.0 0.50 0.0 0.27 11.0 0.37 0.0 0.17 10.2 0.30 Combined/other 113.1 1.01 44.5 0.58 0.0 0.29 5.1 0.16 17.6 0.22 21.9 0.26 Program emphasis Regular elementary/ secondary 104.6 0.41 94.3 0.36 28.4 0.21 28.0 0.14 22.7 0.11 22.5 0.10 Montessori 64.4 0.62 0.0 0.51 0.0 0.09 † † 0.0 0.00 † † Special program emphasis 9.2 0.69 0.0 0.41 0.0 0.20 0.0 0.10 † † 5.1 0.53 Special education 40.7 1.02 16.3 0.90 0.0 0.16 0.0 0.03 † † 0.0 0.00 Vocational/technical † † † † † † † † † † † † Alternative 17.8 1.18 7.6 1.03 0.0 0.09 † † † † † † Early childhood 65.1 0.60 16.7 0.54 8.5 0.28 † † 0.0 0.00 0.0 0.00 See notes at end of table.

D-10
Table D-8. Standard errors for Table C-8: Number and percentage distribution of private schools, by school size and selected characteristics: United States, 2019–20—Continued
Selected characteristic
Less than 50 students
50–149 students
150–299 students
300–499 students
500–749 students
750 or more students
Number Percent Number Percent Number Percent Number Percent Number Percent Number Percent Region Northeast 62.3 0.61 15.5 0.28 15.8 0.28 0.0 0.06 15.4 0.22 0.0 0.02 Midwest 58.9 0.51 69.1 0.65 16.0 0.42 13.2 0.21 0.0 0.05 0.0 0.03 South 113.9 0.72 63.5 0.51 8.0 0.21 23.1 0.20 15.8 0.17 21.9 0.20 West 48.7 0.48 21.8 0.32 12.5 0.25 10.3 0.17 5.1 0.07 10.2 0.15 Urbanicity type City 163.1 1.08 36.3 0.50 21.7 0.37 14.1 0.20 18.3 0.18 22.5 0.21 Suburban 120.7 0.60 44.7 0.33 17.0 0.26 19.9 0.16 7.7 0.08 5.1 0.05 Town 20.8 1.23 60.2 1.63 25.0 0.92 0.0 0.11 0.0 0.02 † † Rural 89.2 0.83 55.9 0.81 0.0 0.19 14.6 0.24 0.0 0.02 0.0 0.01 † Not applicable. SOURCE: U.S. Department of Education, National Center for Education Statistics, Private School Universe Survey (PSS), 2019–20.

D-11
Table D-9. Standard errors for Table C-9: Percentage distribution of private school students, by
racial/ethnic background and selected characteristics: United States, 2019–20
Race/Ethnicity
Selected characteristic
American Indian,
non-Hispanic
Asian, non-
Hispanic
Black, non-
Hispanic
Hispanic, regardless
of race
Pacific Islander, Islander,
non-Hispanic
White, non-
Hispanic
Two or
more races, non-
Hispanic
Total # 0.04 0.07 0.08 0.01 0.13 0.03 Private school typology Catholic # 0.06 0.14 0.19 0.01 0.21 0.05 Parochial 0.01 0.05 0.18 0.30 0.01 0.40 0.10 Diocesan # 0.10 0.05 0.24 # 0.27 0.07 Private 0.01 0.13 0.46 0.33 0.02 0.11 0.09 Other religious 0.01 0.05 0.12 0.11 0.04 0.23 0.05 Conservative Christian 0.02 0.09 0.22 0.18 0.02 0.39 0.07 Other affiliated # 0.03 0.14 0.17 0.01 0.26 0.05 Unaffiliated 0.02 0.11 0.28 0.35 0.09 0.64 0.10
Nonsectarian # 0.07 0.05 0.06 0.01 0.19 0.04 Regular # 0.11 0.03 0.06 0.01 0.24 0.06 Special emphasis 0.01 0.23 0.08 0.16 0.01 0.43 0.05 Special education 0.01 0.17 0.30 0.15 0.01 0.47 0.09
School level Elementary/middle # 0.05 0.10 0.16 0.03 0.23 0.05 Secondary/high 0.01 0.03 0.12 0.23 0.01 0.29 0.06 Combined/other 0.01 0.07 0.12 0.06 0.01 0.18 0.04
Program emphasis Regular elementary/ secondary # 0.04 0.08 0.08 0.02 0.15 0.03 Montessori 0.01 0.12 0.09 0.13 0.01 0.24 0.13 Special program emphasis 0.01 0.37 0.10 0.22 0.02 0.59 0.07 Special education 0.01 0.15 0.27 0.14 0.01 0.42 0.08 Vocational/technical † † † † † † † Alternative 0.10 0.02 0.27 0.20 0.02 0.50 0.13 Early childhood 0.03 0.50 0.39 0.82 0.08 1.23 0.25
Size (number of students) Less than 50 0.01 0.10 0.39 0.14 0.22 0.56 0.11 50–149 0.01 0.10 0.26 0.14 0.01 0.39 0.05 150–299 # 0.07 0.05 0.17 # 0.16 0.04 300–499 0.01 0.04 0.15 0.23 0.01 0.32 0.07 500–749 0.01 0.13 0.11 0.14 0.01 0.45 0.10 750 or more 0.01 0.13 0.24 0.11 0.02 0.25 0.08
Region Northeast # 0.06 0.10 0.06 0.01 0.25 0.04 Midwest # 0.03 0.09 0.23 # 0.32 0.04 South # 0.06 0.15 0.12 0.01 0.23 0.04 West # 0.11 0.03 0.24 0.07 0.31 0.05
Urbanicity type City # 0.08 0.10 0.13 0.01 0.18 0.06 Suburban 0.01 0.04 0.10 0.13 0.01 0.20 0.04 Town 0.03 0.05 0.08 0.10 0.24 0.41 0.03 Rural 0.02 0.06 0.09 0.06 0.01 0.20 0.05 # Rounds to zero. † Not applicable. SOURCE: U.S. Department of Education, National Center for Education Statistics, Private School Universe Survey (PSS), 2019–20.

D-12
Table D-10. Standard errors for Table C-10: Percentage male enrollment in private schools and percentage distribution of private schools by sex of students and selected characteristics: United States, 2019–20
Selected characteristic Male enrollment
Sex of students Coed schools All-girls schools All-boys schools
Total # 0.10 0.05 0.08
Private school typology Catholic # 0.28 0.03 0.27 Parochial # 0.02 † † Diocesan # 0.01 0.01 0.01 Private 1.86 1.68 0.17 1.56
Other religious # 0.15 0.11 0.06 Conservative Christian # 0.03 † 0.02 Other affiliated # 0.34 0.34 0.06 Unaffiliated # 0.25 0.16 0.11
Nonsectarian # 0.13 0.01 0.13 Regular # 0.27 0.03 0.27 Special emphasis # 0.05 0.02 0.03 Special education # 0.09 † 0.07
School level Elementary/middle # 0.07 0.07 0.01 Secondary/high # 0.56 0.32 0.32 Combined/other # 0.26 0.02 0.27
Program emphasis Regular elementary/ secondary # 0.13 0.06 0.11 Montessori # 0.01 † † Special program emphasis # 0.06 † 0.04 Special education # 0.09 † † Vocational/technical † † † 0.00 Alternative # 0.24 0.08 0.16 Early childhood 0.71 0.37 † †
Size (number of students) Less than 50 # 0.16 0.11 0.11 50–149 # 0.10 0.01 0.10 150–299 # 0.02 0.01 0.01 300–499 # 0.08 0.05 0.03 500–749 # 0.56 0.62 0.14 750 or more 0.78 1.69 0.15 1.78
Region Northeast # 0.21 0.11 0.11 Midwest # 0.13 0.12 0.02 South # 0.23 0.11 0.20 West # 0.04 0.02 0.02
Urbanicity type City # 0.19 0.11 0.16 Suburban # 0.19 0.10 0.13 Town # 0.03 † † Rural # 0.07 0.02 0.05 † Not applicable. # Rounds to zero. SOURCE: U.S. Department of Education, National Center for Education Statistics, Private School Universe Survey (PSS), 2019–20.

D-13
Table D-11. Standard errors for Table C-11: Number and percentage distribution of private school teachers (headcount), by work status and
selected characteristics: United States, 2019–20
Selected characteristic
Work status
Total
Full time 3/4 time but
less than 100 1/2 time but
less than 3/4 1/4 time but
less than 1/2 Less than
1/4 time Number Percent Number Percent Number Percent Number Percent Number Percent Number Percent
Total 3,314.2 † 2,708.1 0.07 216.1 0.03 452.5 0.07 240.6 0.04 105.3 0.02
Private school typology Catholic 1,207.3 † 1,050.0 0.05 62.6 0.03 72.5 0.04 76.1 0.04 50.6 0.04 Parochial 862.5 † 721.9 0.24 43.9 0.08 78.1 0.14 65.8 0.13 43.1 0.09 Diocesan 213.0 † 182.3 0.05 22.9 0.02 17.3 0.03 0.0 0.01 26.5 0.04 Private 655.8 † 592.3 0.10 20.5 0.05 31.5 0.07 35.4 0.05 0.0 0.04
Other religious 2,472.9 † 1,943.3 0.14 135.9 0.06 430.8 0.13 188.1 0.08 72.4 0.04 Conservative Christian 1,835.7 † 1,369.3 0.32 59.4 0.06 382.0 0.37 69.2 0.08 13.8 0.11 Other affiliated 760.5 † 589.4 0.18 114.9 0.13 109.9 0.17 79.7 0.09 42.6 0.05 Unaffiliated 1,191.5 † 1,072.5 0.34 41.5 0.10 106.7 0.15 160.7 0.20 47.8 0.08
Nonsectarian 1,537.1 † 1,333.8 0.11 126.0 0.04 80.0 0.06 126.7 0.07 61.5 0.03 Regular 1,174.3 † 1,047.2 0.09 115.2 0.06 30.7 0.07 28.8 0.04 44.7 0.05 Special emphasis 833.7 † 736.2 0.40 34.7 0.09 31.9 0.12 91.5 0.22 33.9 0.12 Special education 341.8 † 273.7 0.48 29.5 0.08 64.7 0.24 74.3 0.27 0.0 0.04
School level Elementary/middle 1,578.1 † 1,196.5 0.21 142.7 0.06 415.5 0.17 191.2 0.07 65.6 0.03 Secondary/high 1,317.5 † 1,106.0 0.19 82.2 0.04 106.2 0.10 130.3 0.12 56.5 0.05 Combined/other 2,180.4 † 2,013.6 0.12 117.7 0.05 110.8 0.05 35.0 0.04 39.7 0.04
Program emphasis Regular elementary/ secondary 2,746.0 † 2,241.0 0.08 192.2 0.03 421.8 0.07 212.2 0.04 85.3 0.02 Montessori 261.8 † 254.4 0.29 22.2 0.12 14.1 0.11 5.1 0.05 5.1 0.07 Special program emphasis 748.3 † 666.1 0.68 25.6 0.08 27.2 0.23 20.5 0.12 10.2 0.24 Special education 341.8 † 273.7 0.43 29.5 0.08 64.7 0.22 74.3 0.25 0.0 0.04 Vocational/technical † † † † † † † † † † † † Alternative 195.5 † 155.3 1.01 6.3 0.19 8.9 0.27 87.9 0.86 30.2 0.26 Early childhood 319.3 † 308.4 1.25 53.4 0.55 81.0 0.86 14.2 0.16 18.9 0.22 See notes at end of table.

D-14
Table D-11. Standard errors for Table C-11: Number and percentage distribution of private school teachers (headcount), by work status and selected characteristics: United States, 2019–20—Continued
Selected characteristic
3/4 time but less than 100
1/2 time but less than 3/4
1/4 time but less than 1/2
Less than 1/4 time Total Full time
Number Percent Number Percent Number Percent Number Percent Number Percent Number Percent Size (number of students) Less than 50 645.1 † 602.9 0.43 60.3 0.13 108.5 0.21 144.8 0.24 55.7 0.10 50–149 1,167.8 † 815.6 0.35 77.0 0.05 375.9 0.28 164.0 0.11 25.7 0.05 150–299 433.8 † 383.3 0.08 102.7 0.09 85.7 0.07 20.0 0.02 28.4 0.02 300–499 899.1 † 712.5 0.10 37.1 0.04 67.5 0.04 83.5 0.08 73.0 0.06 500–749 1,624.2 † 1,489.0 0.18 118.8 0.12 65.7 0.12 35.9 0.08 0.0 0.04 750 or more 1,829.0 † 1,685.9 0.16 46.1 0.05 79.5 0.08 42.5 0.03 10.2 0.03 Region Northeast 954.4 † 877.7 0.12 10.9 0.04 71.2 0.03 13.2 0.04 39.7 0.04 Midwest 935.8 † 787.0 0.13 28.5 0.03 144.5 0.12 108.5 0.08 48.8 0.05 South 2,374.4 † 1,871.2 0.18 175.4 0.07 415.5 0.16 185.2 0.09 70.7 0.03 West 1,886.6 † 1,562.8 0.12 122.6 0.03 78.2 0.12 108.0 0.03 46.2 0.03 Urbanicity type City 2,898.8 † 2,528.7 0.11 174.9 0.04 180.0 0.06 107.0 0.04 58.5 0.03 Suburban 1,503.9 † 1,146.2 0.21 90.7 0.04 388.2 0.16 193.1 0.08 79.8 0.03 Town 889.7 † 752.5 0.25 18.1 0.09 90.1 0.11 54.4 0.12 0.0 0.13 Rural 766.1 † 723.0 0.22 29.7 0.04 63.2 0.11 20.5 0.07 5.1 0.05 † Not applicable. SOURCE: U.S. Department of Education, National Center for Education Statistics, Private School Universe Survey (PSS), 2019–20.

D-15
Table D-12. Standard errors for Table C-12: Pupil/teacher ratio of private schools, by school level and selected characteristics: United States, 2019–20
Selected characteristic
School level Total Elementary/middle Secondary/high Combined/other
Total 0.02 0.03 0.03 0.05
Private school typology Catholic 0.04 0.04 0.01 0.35 Parochial 0.06 0.07 0.00 0.00 Diocesan 0.03 0.05 0.00 0.00 Private 0.14 0.01 0.01 0.69
Other religious 0.03 0.08 0.08 0.04 Conservative Christian 0.04 0.10 0.00 0.06 Other affiliated 0.06 0.13 0.00 0.00 Unaffiliated 0.07 0.11 0.20 0.09
Nonsectarian 0.02 0.03 0.02 0.03 Regular 0.03 0.03 # 0.06 Special emphasis 0.04 0.06 0.37 0.00 Special education 0.01 0.09 0.12 0.02
Program emphasis Regular elementary/secondary 0.02 0.03 0.02 0.05 Montessori 0.06 0.06 † 0.00 Special program emphasis 0.08 0.02 0.31 0.00 Special education 0.01 0.07 0.12 0.02 Vocational/technical † † † † Alternative 0.09 0.09 0.28 0.06 Early childhood 0.09 0.09 † †
Size (number of students) Less than 50 0.05 0.05 0.10 0.15 50–149 0.04 0.04 0.02 0.07 150–299 0.03 0.06 0.00 0.00 300–499 0.03 0.04 0.05 0.01 500–749 0.10 0.04 0.00 0.13 750 or more 0.07 0.00 0.23 0.10
Region Northeast 0.04 0.05 0.02 0.06 Midwest 0.03 0.05 # 0.05 South 0.04 0.07 0.05 0.08 West 0.03 0.05 0.12 0.01
Urbanicity type City 0.03 0.04 0.08 0.10 Suburban 0.02 0.05 0.02 0.02 Town 0.02 0.03 0.00 0.00 Rural 0.06 0.09 # 0.09 † Not applicable. # Rounds to zero. SOURCE: U.S. Department of Education, National Center for Education Statistics, Private School Universe Survey (PSS), 2019–20.
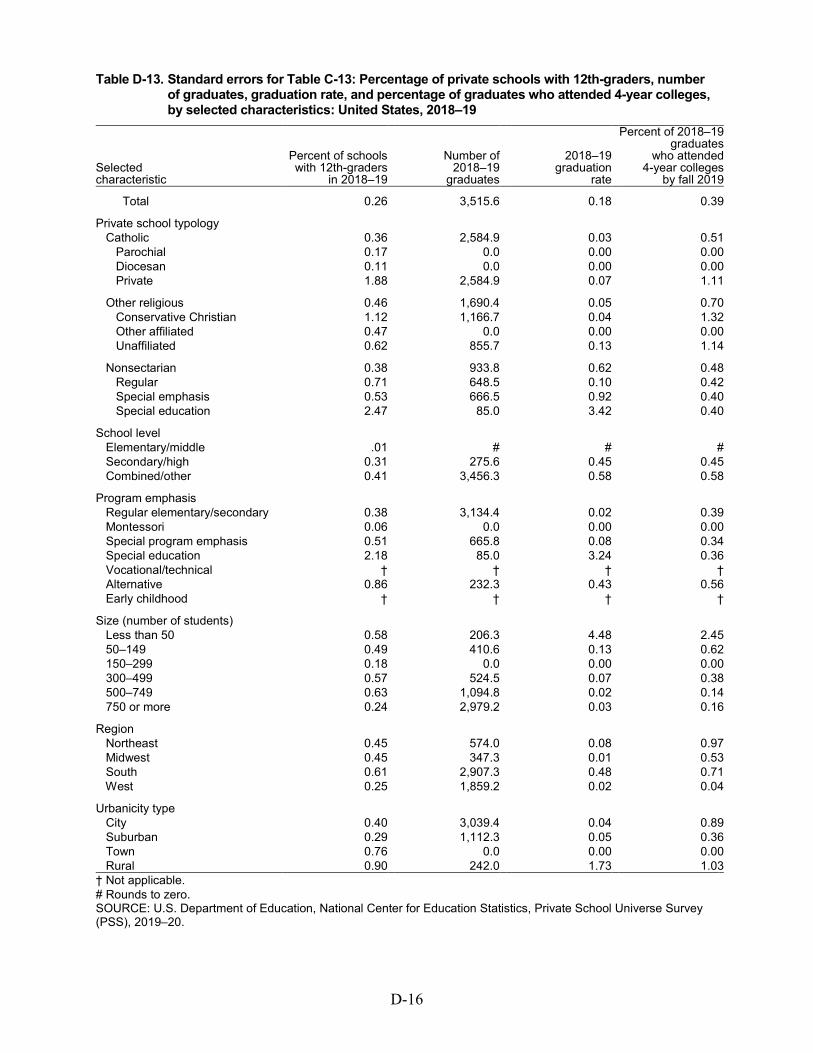
D-16
Table D-13. Standard errors for Table C-13: Percentage of private schools with 12th-graders, number of graduates, graduation rate, and percentage of graduates who attended 4-year colleges, by selected characteristics: United States, 2018–19
Selected characteristic
Percent of schools with 12th-graders
in 2018–19
2018–19 graduation
rate
Percent of 2018–19 graduates
who attended 4-year colleges
by fall 2019
Number of 2018–19
graduates
Total 0.26 3,515.6 0.18 0.39
Private school typology Catholic 0.36 2,584.9 0.03 0.51 Parochial 0.17 0.0 0.00 0.00 Diocesan 0.11 0.0 0.00 0.00 Private 1.88 2,584.9 0.07 1.11
Other religious 0.46 1,690.4 0.05 0.70 Conservative Christian 1.12 1,166.7 0.04 1.32 Other affiliated 0.47 0.0 0.00 0.00 Unaffiliated 0.62 855.7 0.13 1.14
Nonsectarian 0.38 933.8 0.62 0.48 Regular 0.71 648.5 0.10 0.42 Special emphasis 0.53 666.5 0.92 0.40 Special education 2.47 85.0 3.42 0.40
School level Elementary/middle .01 # # # Secondary/high 0.31 275.6 0.45 0.45 Combined/other 0.41 3,456.3 0.58 0.58
Program emphasis Regular elementary/secondary 0.38 3,134.4 0.02 0.39 Montessori 0.06 0.0 0.00 0.00 Special program emphasis 0.51 665.8 0.08 0.34 Special education 2.18 85.0 3.24 0.36 Vocational/technical † † † † Alternative 0.86 232.3 0.43 0.56 Early childhood † † † †
Size (number of students) Less than 50 0.58 206.3 4.48 2.45 50–149 0.49 410.6 0.13 0.62 150–299 0.18 0.0 0.00 0.00 300–499 0.57 524.5 0.07 0.38 500–749 0.63 1,094.8 0.02 0.14 750 or more 0.24 2,979.2 0.03 0.16
Region Northeast 0.45 574.0 0.08 0.97 Midwest 0.45 347.3 0.01 0.53 South 0.61 2,907.3 0.48 0.71 West 0.25 1,859.2 0.02 0.04
Urbanicity type City 0.40 3,039.4 0.04 0.89 Suburban 0.29 1,112.3 0.05 0.36 Town 0.76 0.0 0.00 0.00 Rural 0.90 242.0 1.73 1.03 † Not applicable. # Rounds to zero. SOURCE: U.S. Department of Education, National Center for Education Statistics, Private School Universe Survey (PSS), 2019–20.

D-17
Table D-14. Standard errors for Table C-14: Number of private schools, students, and teachers (headcount), by school membership in private school associations: United States, 2019–20
Association Schools Students Teachers
Total 191.7 31,309.8 3,314.2
None 145.0 14,189.3 1,304.5
Religious Accelerated Christian Education 77.0 1,833.2 228.9 American Association of Christian Schools 0.0 0.0 0.0 Association of Christian Schools International 60.7 16,452.0 1,798.2 Association of Christian Teachers and Schools 0.0 0.0 0.0 Association of Classical and Christian Schools 0.0 0.0 0.0
Christian Schools International 13.2 4,615.9 422.0 Council of Islamic Schools in North America 0.0 0.0 0.0 Evangelical Lutheran Education Association 8.5 1,250.7 118.3 Friends Council on Education 0.0 0.0 0.0 General Conference of the Seventh-Day Adventist Church 25.7 540.3 51.5 Islamic School League of America 0.0 0.0 0.0
Jesuit Secondary Education Association 0.0 0.0 0.0 National Association of Episcopal Schools 20.2 2,611.7 587.8 National Catholic Educational Association 40.8 18,827.7 1,338.7 National Christian School Association 0.0 0.0 0.0 National Society of Hebrew Day Schools 14.6 548.0 215.3
Oral Roberts University Educational Fellowship 0.0 0.0 0.0 Prizmah: Center for Jewish Day Schools 9.2 530.7 210.5 Southern Baptist Association of Christian Schools 13.8 10,975.9 952.6 Other religious school associations 27.3 2,484.1 203.8
Special emphasis American Montessori Society 33.5 178.0 133.6 Association Montessori International 36.3 1,244.1 67.7 Other Montessori associations 0.0 0.0 0.0 Association of Military Colleges and Schools 0.0 0.0 0.0 Association of Waldorf Schools of North America 0.0 0.0 0.0
National Association of Private Special Education Centers 20.0 925.8 143.2 Other associations for exceptional children † † † European Council for International Schools 0.0 0.0 0.0 National Association for the Education of Young Children † † † National Association of Laboratory Schools 7.9 189.0 15.8 National Coalition of Girls’ Schools 0.0 0.0 0.0 Other special emphasis school associations 7.9 189.0 15.8
Other school associations or organizations Alternative School Network 0.0 0.0 0.0 National Association of Independent Schools 0.0 0.0 0.0 State or regional independent school association 30.2 12,079.1 1,314.1 National Independent Private School Association 0.0 0.0 0.0 The Association of Boarding Schools 0.0 0.0 0.0 Other school associations 47.8 7,414.1 1,009.5 † Not applicable. SOURCE: U.S. Department of Education, National Center for Education Statistics, Private School Universe Survey (PSS), 2019–20.

D-18
Table D-15. Standard errors for Table C-15: Number of private schools, students, full-time equivalent (FTE) teachers, and 2018–19 high school graduates, by state: United States, 2019–20
State
Schools
Students FTE
teachers High school
graduates 2018–19
United States 191.7 31,309.8 3,060.3 3,515.6
Alabama 41.4 951.9 124.2 0.0 Alaska 0.0 0.0 0.0 † Arizona 51.5 4,193.8 342.2 0.0 Arkansas 0.0 0.0 0.0 0.0 California 37.6 776.0 124.7 0.0
Colorado 0.0 0.0 0.0 0.0 Connecticut 0.0 0.0 0.0 0.0 Delaware 43.9 4,752.0 504.4 29.2 District of Columbia 0.0 0.0 0.0 0.0 Florida 74.4 14,108.8 1,239.8 652.9
Georgia 75.5 8,731.5 693.8 41.3 Hawaii 40.3 3,824.3 241.5 0.0 Idaho 0.0 0.0 0.0 0.0 Illinois 72.6 7,023.1 704.1 0.0 Indiana 47.0 4,376.9 285.9 238.5
Iowa 0.0 0.0 0.0 0.0 Kansas 0.0 0.0 0.0 0.0 Kentucky 45.3 8,084.3 1,213.2 626.6 Louisiana 34.0 18,496.9 1,589.8 2,445.9 Maine 0.0 0.0 0.0 0.0
Maryland 25.0 5,330.0 533.0 0.0 Massachusetts 0.0 0.0 0.0 0.0 Michigan 64.2 5,667.1 570.9 251.3 Minnesota 0.0 0.0 0.0 0.0 Mississippi 0.0 0.0 0.0 0.0
Missouri 64.1 4,529.4 644.2 27.5 Montana 0.0 0.0 0.0 0.0 Nebraska 0.0 0.0 0.0 0.0 Nevada 0.0 0.0 0.0 0.0 New Hampshire 0.0 0.0 0.0 0.0
New Jersey 46.0 10,351.8 805.3 566.9 New Mexico 25.2 1,033.8 176.5 0.0 New York 42.0 1,181.0 390.5 42.0 North Carolina 41.3 332.6 100.5 0.0 North Dakota 0.0 0.0 0.0 †
Ohio 46.6 3,440.5 558.9 50.7 Oklahoma 0.0 0.0 0.0 0.0 Oregon 15.1 135.7 28.6 0.0 Pennsylvania 2.2 2,756.0 217.8 79.7 Rhode Island 0.0 0.0 0.0 0.0
South Carolina 39.0 507.8 55.7 0.0 South Dakota 0.0 0.0 0.0 0.0 Tennessee 32.9 11,470.7 1,230.3 1,281.8 Texas 56.0 840.2 89.6 0.0 Utah 16.7 837.2 33.5 0.0
Vermont 0.0 0.0 0.0 0.0 Virginia 156.7 2,814.8 380.9 75.7 Washington 66.6 15,652.2 1,757.3 1,859.2 West Virginia 0.0 0.0 0.0 0.0 Wisconsin 19.4 2,584.4 216.8 0.0 Wyoming 0.0 0.0 0.0 † † Not applicable. SOURCE: U.S. Department of Education, National Center for Education Statistics, Private School Universe Survey (PSS), 2019–20.