characteristics of the newborn and health status: a ... of the newborn and health status: a...
TRANSCRIPT

Characteristics of the newborn and health status: acongested two-frontier approach
Marie VANDRESSE1
Abstract
Frontier analysis is extended to evaluate the effect of characteristics of thenewborn on its health status. Rather than the expectation of the health statusof the newborn conditional on characteristics of the newborn and of itsparents, the support of the joint distribution of the two sets of variables isestimated. The model focuses on extreme rather than average values, andhighlights the negative influence of extreme characteristics of the newborn orof its parents on its health status. A case study based on Hungarian data ispresented. Results show that parental ages, as well as the reproductive historyof the mother, are related to the health status of the newborn.
Keywords: health status of the newborn, characteristics of the newborn,extreme values, double-frontier analysis.
1 Docteur en Démographie, Institut de démographie, Université catholique deLouvain, Place Montesquieu, n°1, Bte 17, 1348 Louvain-la-Neuve,Belgium, e-mail : [email protected], [email protected]
I am grateful to C. Gourbin, G. Masuy-Stroobant, M. Mouchart and G.Wunsch for comments leading to clarifications of the different arguments andto substantial improvements in the presentation. Financial support from theFSR of the Catholic University of Louvain (project: "Fécondité tardive etmorbidité/mortalité foeto-infantile") is also acknowledged. I would like tothank Prof. Peter Jozan (HCSO) and Ms Eva Gardos M.Sc., Head of thePopulation, Health and Welfare Statistics Department (HCSO), for the dataset and valuable information on the latter.

2 Marie VANDRESSE
1. Introduction
Usually, when studying of the determinants of the health status of a child atbirth with a structural model, a conceptual or causal diagram is defined andtested with adequate statistical models. The statistical model is based on theexpectation of the variable of interest conditional on a set of explanatoryvariables. The interpretation of the results is based on the mean and thedeviation from this mean. Extreme values are not considered. But in certaincontexts and in the medical field in particular, the study of the mean values ofa population of interest is of lesser interest in the sense that an individual witha normal health status does not require special care involving high financialcosts for the society. Let us take one particular example related to the casestudy presented in this paper. Infants born with a low birth weight (<2500 g),a very low birth weight (<1500 g) or an extremely low birth weight (<1000 g)cost markedly more to the family and to the society than newborns weighingat least 2500 g As an example, Matsuo (2005) mentions that hospital cost forbabies weighing less than 1000 g at birth were 75 percent higher on averagethan those occurred by babies weighing 1000-1499 g More, the cost ofchildren with a low birth weight is not restricted to the time spent after birthat the hospital. There are long run costs due to the consequences of low birthweight on the future development of the child. From a public policy point ofview, it is consequently of interest to look at the extreme values of the healthstatus and its determinants, rather than the average values, as done amongothers by classical multivariate regression models. In such a context, analternative approach focusing on extreme values is even more interesting thatthe proportion of low birth weight has increased over the last 30 years(Matsuo, 2005).
Furthermore, the traditional approach based on multivariate regression isconfronted with problems of exogeneity. Consider a regression estimating theexpectation of weight at birth with respect to duration of gestation, potentialmultiple births, presence of congenital anomalies and an error term includingunobservable variables influencing weight, such as alcohol. If alcoholaddiction, which is assumed unobservable, is a common cause of bothcongenital anomalies (explanatory variable) and of the weight at birth(dependent variable), congenital anomalies are not exogenous and theestimated coefficient is biased (Thomas 1997, chap. 8 and 12).
The main objective of the proposed method is not to detect the effect of eachcharacteristic -net of all other effects- of the newborn on her or his healthstatus. This could be done by a multivariate regression controlling forspurious associations (Vandresse, 2008). The objective here is rather to dealwith extreme values and endogeneity, for reasons mentioned above. Moreprecisely, we estimate the support of the joint distribution of the variables(smallest closed set whose complement has probability zero) instead ofestimating the parameters of a conditional expectation of the variable of
Characteristics of the newborn: two-frontier approach 3
interest. From the estimation of this support, we look at (more details in thenext sections):
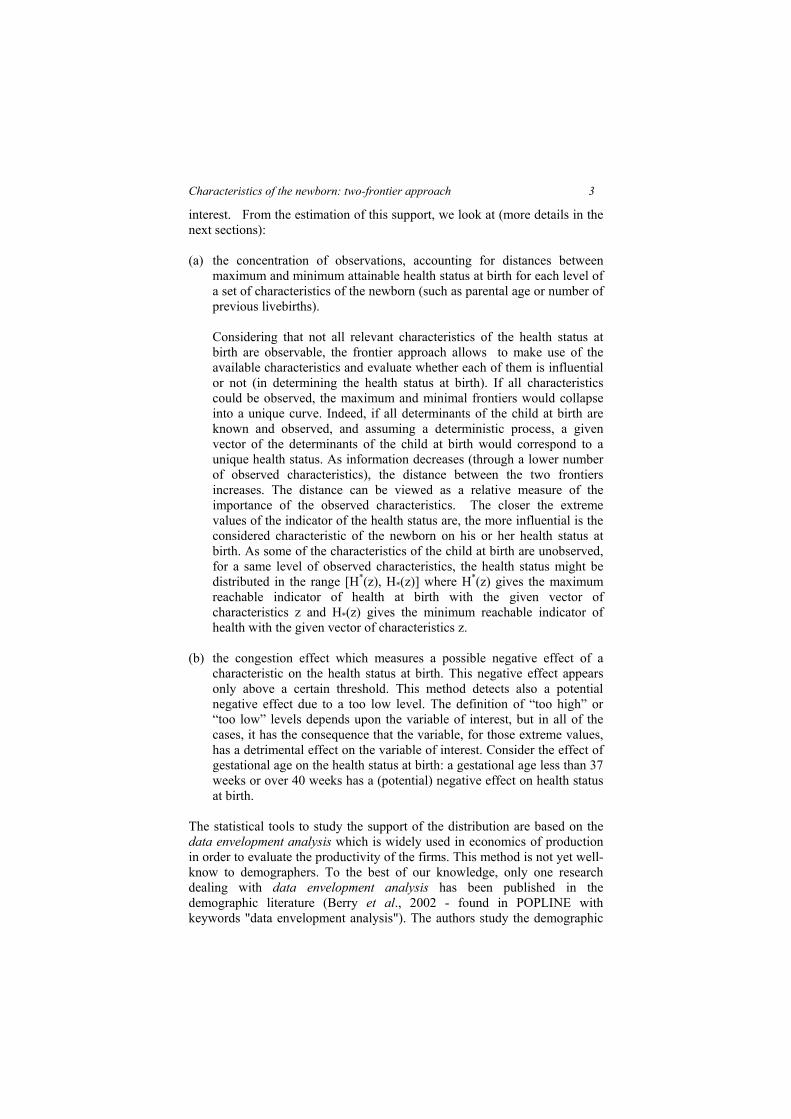
(a) the concentration of observations, accounting for distances betweenmaximum and minimum attainable health status at birth for each level ofa set of characteristics of the newborn (such as parental age or number ofprevious livebirths).
Considering that not all relevant characteristics of the health status atbirth are observable, the frontier approach allows to make use of theavailable characteristics and evaluate whether each of them is influentialor not (in determining the health status at birth). If all characteristicscould be observed, the maximum and minimal frontiers would collapseinto a unique curve. Indeed, if all determinants of the child at birth areknown and observed, and assuming a deterministic process, a givenvector of the determinants of the child at birth would correspond to aunique health status. As information decreases (through a lower numberof observed characteristics), the distance between the two frontiersincreases. The distance can be viewed as a relative measure of theimportance of the observed characteristics. The closer the extremevalues of the indicator of the health status are, the more influential is theconsidered characteristic of the newborn on his or her health status atbirth. As some of the characteristics of the child at birth are unobserved,for a same level of observed characteristics, the health status might bedistributed in the range [H*(z), H*(z)] where H*(z) gives the maximumreachable indicator of health at birth with the given vector ofcharacteristics z and H*(z) gives the minimum reachable indicator ofhealth with the given vector of characteristics z.
(b) the congestion effect which measures a possible negative effect of acharacteristic on the health status at birth. This negative effect appearsonly above a certain threshold. This method detects also a potentialnegative effect due to a too low level. The definition of “too high” or“too low” levels depends upon the variable of interest, but in all of thecases, it has the consequence that the variable, for those extreme values,has a detrimental effect on the variable of interest. Consider the effect ofgestational age on the health status at birth: a gestational age less than 37weeks or over 40 weeks has a (potential) negative effect on health statusat birth.
The statistical tools to study the support of the distribution are based on thedata envelopment analysis which is widely used in economics of productionin order to evaluate the productivity of the firms. This method is not yet well-know to demographers. To the best of our knowledge, only one researchdealing with data envelopment analysis has been published in thedemographic literature (Berry et al., 2002 - found in POPLINE withkeywords "data envelopment analysis"). The authors study the demographic

4 Marie VANDRESSE
efficiency of a set of countries and justify their approach by the fact thatdifferences among countries at any level of development may be real, not theresults of measurement error or random disturbance, as assumed by thetraditional least squares model. Their article gives consequently additionalarguments to show the interests of a frontier approach in demography. Notethat Berry and Kim focus their analysis on the upper frontier while thepresent paper considers a two frontier approach (upper and lower). The two-frontier approach has been developed by Mouchart and Vandresse (2007) inthe context of a Belgian survey on the criteria of quality in the modal choicefor freight transport. The motivation for developing the two-frontier approachcomes from the observation that price and qualities (e.g. door-to-doortransport time, flexibility, reliability) of the mode of transport aresimultaneously bargained. The price is consequently not a function of thequalities of the mode of transport. The simultaneous bargaining process onprice and characterized does not allow, from a statistical point of view, toconsider a causal relationship satisfying the exogeneity condition. In the fieldof demography, the interest for the two-frontier approach should be foundamong others in the social and financial costs of extreme values such as latefertility, low birth weight or premature birth to be supported by the child,the parents and the society
Section 2 presents the main arguments of the model. The theoretical structureof the model is explained in section 3. Section 4 presents a case study wherea health index of the newborn is evaluated with respect to a vector ofcharacteristics of the child and its parents. The weight at birth which isconsidered as the most important predictor of neonatal mortality (Institute ofMedicine, 1985) is selected here as health indicator; mathematicallyspeaking, it is continuous and not upper bounded. The results take also intoaccount the marital status and the activity of the mother, survival of the infantat one year, its gender and if singleton or coming from a multiple delivery.
2. Frontiers and Congestion
In order to highlight the role of extreme values, and more particularlydistances between extreme values, the model estimates the support of amultivariate distribution composed of the health status at birth and a set of Kcharacteristics of the newborn. The multivariate distribution is considered asa volume ∈ R+
K+1 and is called the Potential Birth Set (PBS). The PBS isdelimited by minimal and maximal frontiers. The information of interest isthe distance between the two frontiers. The distance between the maximalfrontier and the minimal frontier is based on the decomposition, within thespace of characteristics, of the volume generated by the set of potential births.As I am more interested in health status variation for a given level of the setof characteristics of the child at birth than in characteristics variation for agiven health status, the distance is computed along the axis of the healthstatus.

Characteristics of the newborn: two-frontier approach 5
Compared to an approach where the multivariate distribution would beprojected into a two-dimensional space and where distances would beanalyzed in this two-dimensional space, the frontier approach does notoverwhelms into the two-dimensional space the volume representing amultivariate distribution. The frontier approach estimates first theenvelopment surface of the volume composed of the set of observations andthen estimates the distance between each observation and the envelopmentsurface. The distance measures the difference between one particularobservation and the corresponding point located on the envelopment surface.This corresponding point is a projection of the observation on theenvelopment surface. The projection is made with respect to the axis ofinterest; in the present case the health status axis.
In the sequel of this section, we assume that the potential births arecharacterized by the health status at birth and only one observedcharacteristic of the child at birth. This simplification allows representing thedifferent concepts of the methodology in a two-dimensional space.
2.1 Concentration of observations
Let us define ξp= (η, ζ) ∈ R+2 representing one potential birth where η ∈ R+
is the health status at birth and ζ ∈ R+ a characteristic of the child at birth.The set of potential births, the Potential Birth Set (PBS), includes all potentialbirths ξp= (η, ζ) (p=1,..,P).
The Potential Births Set and its maximum and minimum frontiers arerepresented in Figure 1. The maximum health indicator frontier gives themaximum health indicator a child can reach at birth for a given level of thecharacteristic ζ. Similarly, the minimum health indicator frontier gives theminimum health indicator a child can reach at birth for a given level of thecharacteristic ζ.

6 Marie VANDRESSE
FIGURE 1: Potential Births Set and health frontiers
Let us define ζ1 and ζ2 as two different levels of the characteristic ζ with ζ1 <ζ2. For example, ζ is paternal age with ζ1 corresponding to 25 years of age andζ2 corresponding to 45 of age. The concentration of observations isrepresented by the distance Dj (with j representing the level of thecharacteristic) between the maximum health frontier and the minimumhealth frontier for a given ζj (Figure 2). A large distance Dj means that thecharacteristic ζ at level j has less effect on the health status at birth. At theopposite, a short distance Dj means that the characteristic ζ at level jinfluences markedly the level of the health status compared to largerdistances. Indeed, a large distance at level j implies a large variance of thehealth indicator at this level; a short distance at level j implies a smallvariance at this level. The interpretation of a distance is always relative to thedistances for other levels of the same characteristic. Note that there is oneexception in the interpretation of the distances between extreme values. If thedistances between extreme values are identical for all levels of thecharacteristic and if the level of the health index is also identical for all levelsof the characteristic, this characteristic has no influence on the healthindicator, even if the distance between extreme values is low.
Potential Births Set
ζCharacteristic
Health Indicator η
Maximum health indicator frontier
Minimum health indicator frontier

Characteristics of the newborn: two-frontier approach 7
FIGURE 2 : Concentration of the observations
In Figure 2, the first graph represents the joint distribution of the health statusat birth and of the paternal age. At lower levels of paternal age, paternal ageinfluences less the health indicator than at an upper level. The distance D1between the lowest and the highest observations is large. On the contrary, D2is shorter, meaning that paternal age, at this level, has a more influentialeffect on the health status at birth compared to young fathers. In the secondgraph, low birthweight is a crucial characteristic of the health status, allobservations are concentrated around a low health status (the variance of thehealth status is small). On the contrary, a higher weight will be reflected by ahigher health status, but with less concentration of the data, which meansthat, at a high level of weight, other non-observed factors also influence thehealth status of the baby. From this point of view, the distance betweenextreme values can also be viewed as the relative importance of the othercharacteristics of the child at birth on the health status.
2.2 The effect of congestion
The risks of child’s death or morbidity are repeatedly reported to be higherfor the younger and older mothers (Cramer, 1987; Friede et al.,1988; Spira etal.,1993; Eurocat, 1995). With a frontier approach, such a case is translatedinto an increasing (beneficial) effect of the characteristics of the child at birthon its health status followed by a decreasing (detrimental) effect. The latteris called the congestion effect characterized by a maximum health frontierwhich is first increasing, and then decreasing. Let us define the healthindicator at birth Ih between 0 and 1 (with 1 representing the best score) andthe maternal age MAge (from 15 to 50) as the only observed characteristic ofthe child at birth (Figure 3). Maternal age should have a positive increasingeffect on the health indicator in the age group [15-30], but the effect isnegative thereafter, because of congenital anomalies among others. In Figure3, this congestion effect is represented by the decreasing part of themaximum health indicator frontier.

8 Marie VANDRESSE
FIGURE 3: The congestion effect
2.3 The effect of outlying observations
The estimation of the support of a distribution is sample-sensitive. Indeed,the presence of at least one outlier in the database drastically influences theestimation of the frontiers, and consequently of the distance between thefrontiers. In Figure 4(a), the database includes one outlier; in Figure 4(b), theoutlier was withdrawn. By withdrawing the outlier all observations are closerto the frontier and the distance between both frontiers is shorter. Thequestion is whether the outlier must be rejected or not from the database. Itcould be an encoding mistake, a voluntary erroneous response from theinterviewed person or a true case which is meaningful but very different fromthe rest of the sample. In each of the three cases, it makes sense to deletethese observations.
FIGURE 4: Frontier with and without outliers
(a) (b)
.
. .. . .
.
. ...
. .
. .
. ...
.
. . .
. . .
Frontier with one outlier Frontier without outlier
outlier
Characteristic ofthe child at birth
Characteristic ofthe child at birth
Indicator of thehealth at birth
Indicator of thehealth at birth
Maternal age
Indicator ofthe health atbirth
Potential Births Set
Congestion effect

Characteristics of the newborn: two-frontier approach 9
Different and complementary methods are available for detecting outliers.One is to look at the empirical distribution of each variable searching for thepresence of extreme values. A second method is to use statistical criteria asin Simar (2003). The idea is to estimate, for the upper (resp. lower) frontieran expected frontier by expected maximum (resp. minimum) values obtainedon the basis of randomly selected sub-samples of the observations.Observations above (resp. below) the upper (resp. lower) expected frontierare considered as outliers. A third method proceeds in two steps. The firststep consists in estimating frontiers with the full sample while the second stepconsists in estimating frontiers with the same sample excluding observationsdetected in the first step as being on the frontiers. If the distance computed inthe first and second steps are very different, the observations detected on thefrontiers in the first step are considered as outliers (Mouchart and Vandresse2007).
3. The model
The theoretical framework is an extension of Data Envelopment Analysis(DEA) used in economics for the analysis of production efficiency (Färe etal., 1984; Fried et al., 1993; Simar et al. 2003).
Let us define the Potential Births Set, PBS ∈ R+K+1, as the convex compact
and bounded set of potentially observable births. The potential births set iscomposed of potential births characterized by the health status at birth, η ∈R+
and the vector of characteristics of the child at birth, ζ ∈ R+K. The
maximal health function, H*(ζ), gives the maximum reachable health statuswith a given vector of characteristics ζ. It is represented by the upper frontierof the potential births set. Similarly, the minimum health function, H*(ζ),gives the minimum reachable health status with the vector of characteristicsζ. It is represented by the lower frontier of the potential births set (Figure 1).If we observe a same concentration of the data for all levels of ζ, theestimated health functions should be equidistant for all ζ. On the contrary,different concentrations of the data for each level of the vector ofcharacteristics ζ should be observed by a distance Dj = (H*(ζj)- H*(ζj))between the two health functions depending on ζj. The concentration is thenrepresented by the vertical distance between the two health functions.
The two health functions, H*(ζj) and H*(ζj), represent the upper and lowerfrontiers of the convex closure of the set of potential births. The minimumhealth frontier is composed of the set of births ξ*= (η*, ζ) representing theminimal health status η* reached for a vector of characteristics ζ. Similarly,the maximum health frontier is made of the set of births ξ*= (η*, ζ)representing the maximal health status η* reached for a vector ofcharacteristics ζ. Formally:
H*(ζ)= min{ η | (η, ζ) ∈ PHS} (1)

10 Marie VANDRESSE
H*(ζ)= max{ η | (η, ζ) ∈PHS} (2)
In practice, the estimation of the two frontiers is based on a sample ofobserved births characterized by the health indicator at birth and thecharacteristics of the child at birth, modeled as i.i.d. observations from ajoint distribution. The potential births ξp= (η, ζ) are then replaced, for theestimation, by the set of observed births x=(y,z). For estimating themaximum (resp. minimum) health indicator function, we define, for a givenobservation xi=(yi,zi), a factor of dilatation (resp. contraction), αi (resp. βi),that brings yi up to the frontier H*(z)={x*=(y*,z)}(resp. H*(z)={x*=(y*,z) }):
α (y,z)= max{a | ay ≤ ^
H *(z)} α ∈ [1,∞ ) and y ×α (y,z) = y* (3)
β (y,z)= min{b | by ≥^
H *(z)} β ∈ (0,1] and y × β (y,z) = y* (4)
When these observations are identified empirically, the minimum andmaximum health indicator functions are interpolated linearly.
For each observation xi, the value of the functions α(yi,zi) and β(yi,zi) can beestimated by linear programming and the distance between the minimum andmaximum health functions are estimated as:
^D (yi,zi) =
^H *(yi,zi) -
^H *(yi,zi)
= ^α ( yi,zi) × yi -
^β ( yi,zi) × yi
= [^α ( yi,zi) -
^β ( yi,zi)] × yi (5)
The presence of congestion affects the maximal health function and thedistance function. The congested maximal health function remains defined byEq.(2). The difference will appear in the linear programming where thecondition of monotonicity is suppressed under the congestion hypothesis.
Remark: For a same health indicator at birth yi there are as many distances asthe number of combinations between the different levels of the set ofcharacteristics of the child at birth.
4. Case study
Remark: The data analysis was generated using R 2.1.1 software (Ihaka andGentleman, 1996).
Characteristics of the newborn: two-frontier approach 11
4.1 The database
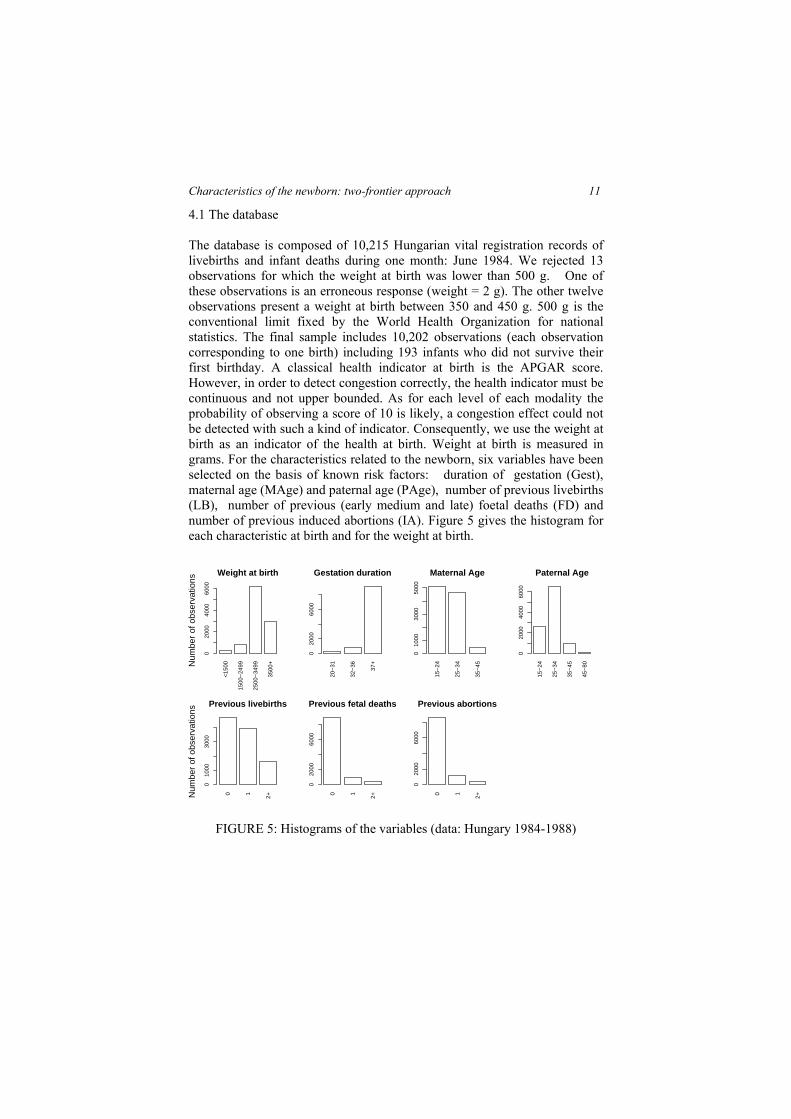
The database is composed of 10,215 Hungarian vital registration records oflivebirths and infant deaths during one month: June 1984. We rejected 13observations for which the weight at birth was lower than 500 g. One ofthese observations is an erroneous response (weight = 2 g). The other twelveobservations present a weight at birth between 350 and 450 g. 500 g is theconventional limit fixed by the World Health Organization for nationalstatistics. The final sample includes 10,202 observations (each observationcorresponding to one birth) including 193 infants who did not survive theirfirst birthday. A classical health indicator at birth is the APGAR score.However, in order to detect congestion correctly, the health indicator must becontinuous and not upper bounded. As for each level of each modality theprobability of observing a score of 10 is likely, a congestion effect could notbe detected with such a kind of indicator. Consequently, we use the weight atbirth as an indicator of the health at birth. Weight at birth is measured ingrams. For the characteristics related to the newborn, six variables have beenselected on the basis of known risk factors: duration of gestation (Gest),maternal age (MAge) and paternal age (PAge), number of previous livebirths(LB), number of previous (early medium and late) foetal deaths (FD) andnumber of previous induced abortions (IA). Figure 5 gives the histogram foreach characteristic at birth and for the weight at birth.
<15
00
1500
−24
99
2500
−34
99
3500
+
Weight at birth
Num
ber
of o
bser
vatio
ns
020
0040
0060
00
20−
31
32−
36
37+
Gestation duration
020
0060
00
15−
24
25−
34
35−
45
Maternal Age
010
0030
0050
00
15−
24
25−
34
35−
45
45−
80
Paternal Age
020
0040
0060
00
0 1
2+
Previous livebirths
Num
ber
of o
bser
vatio
ns
010
0030
00
0 1
2+
Previous fetal deaths
020
0060
00
0 1
2+
Previous abortions
020
0060
00
FIGURE 5: Histograms of the variables (data: Hungary 1984-1988)

12 Marie VANDRESSE
4.2 Concentration and congestion
4.2.1 The concentration model
Preliminary remark: in a two-dimensional space, there is one unique distancefor each level of the characteristic. In higher dimensional space, there are asmany distances as the number of combinations between all levels of allcharacteristics. In order to interpret the distances for each level of eachcharacteristic, the distributions of the distances for each level of a givencharacteristic are compared.
The results are presented by means of empirical densities of the differentvalues of interest, with respect to different levels of each characteristic of thechild at birth. For parental age, we defined four levels for paternal age (15-24, 25-34, 35-44, 45-80) and three levels for maternal age (15-24, 25-34, 35-44). These classifications are generally those found in the epidemiologic anddemographic studies evaluating the effect of parental age on infant morbidityand mortality. For the number of previous foetal deaths, of previous inducedabortions and of previous livebirths, we define three levels: 0, 1, 2+. Indeveloped countries, where the total number of pregnancies per women islow, on average, it seems reasonable to make such a classification. Finally,the duration of gestation (in weeks) is divided in three main categories (<32,32-36, 37+). The distances, measured in the same unit as the weightvariables (grams), have been estimated by taking simultaneously the sixcharacteristics into account and are a function in the seven-dimensional space(six characteristics and weight). For each level of each characteristic, thenumber of estimated distances corresponds to the number of possiblecombinations between each value of the other five characteristics. Thisallows us to detect a potential individual effect of the characteristic whateverthe level of the other characteristics. This also means that we do not have aunique distance for one level of a characteristics as in the two dimensionalcase presented in section 2.
Duration of gestation. Figure 6 presents the bivariate plot of the distance andthe duration of gestation (graph (a)), of the empirical densities of birthweight(graph (b)) and of the empirical densities of the distances with respect to theduration of gestation (graph (c)). Figure 6(b) shows the tendency for lowbirth weight in case of gestational age less than 37 weeks. The averageweight is 1,269 g for a 20 to 31 weeks duration of gestation and 2,489 g for a32 to 36 weeks duration of gestation. In addition, Figure 6(c) shows that theconcentration around the weight is denser for lower gestational age. Theaverage distance is 2,190 for duration of gestation between 20 and 31 weeks,2,130 for gestation between 32 and 36 weeks and 3,497 for a gestational ageover 36 weeks. Both results show the importance of gestational age in thedetermination of the weight: a higher concentration around a lower weightfor duration of gestation lower than 37 weeks. The effect is higher forduration of gestation less than 31 weeks.

Characteristics of the newborn: two-frontier approach 13
20 25 30 35 40
010
0030
00
Dis
tanc
e
(a) Gestational Age
Gestational Age
0 2000 4000 60000 e
+00
4 e
−04
8 e
−04
20−31 32−3637+
(b) Density: W | Gest
weight
0 1000 3000 50000 e
+00
6 e
−04
20−31 32−3637+
(c) Density: Distance | Gest
Distance
FIGURE 6: Concentration with respect to gestational age
Parental Age. Figure 7 presents empirical densities of weight (W) at birthand of distances with respect to paternal and maternal ages (PAge and MAgerespectively). It also includes bivariate plots of distances and parental age.For each category of maternal age, the distances between the upper and lowerobservations are relatively high. The distances increase until 30 years old,then decrease (Figure 7(a)). Looking at the empirical densities of thedistances with respect to categories of maternal age (Figure 7(e)), the densityfor high values is lower for categories 15-24 and 35-44 than for category 25-34. This suggests a higher concentration of the data for the lower and uppercategories. Consequently, the effect of being a young (<25) or old (>34)mother not only decreases the weight of the child (Figure 7(c)), but alsoincreases the density around the lower weight. Maternal age seems to bemore influential at a lower or upper age. A similar reasoning is done forpaternal age (Figures 7(b), (d), (f)). However, the effect of the category 45-80seems to be quite important on the decrease of the distance (theconcentration is even denser). Maternal age and paternal age are highlycorrelated but it has already been stressed that graphs represent thedistribution of the distances conditional on selected characteristics and thatdistances include simultaneous information on all characteristics. Anindividual effect is consequently detected by interpreting the differentfigures, namely comparing the conditional empirical densities of the distancefor each category of the selected characteristic.

14 Marie VANDRESSE
FIGURE 7: Concentration with respect to parental age
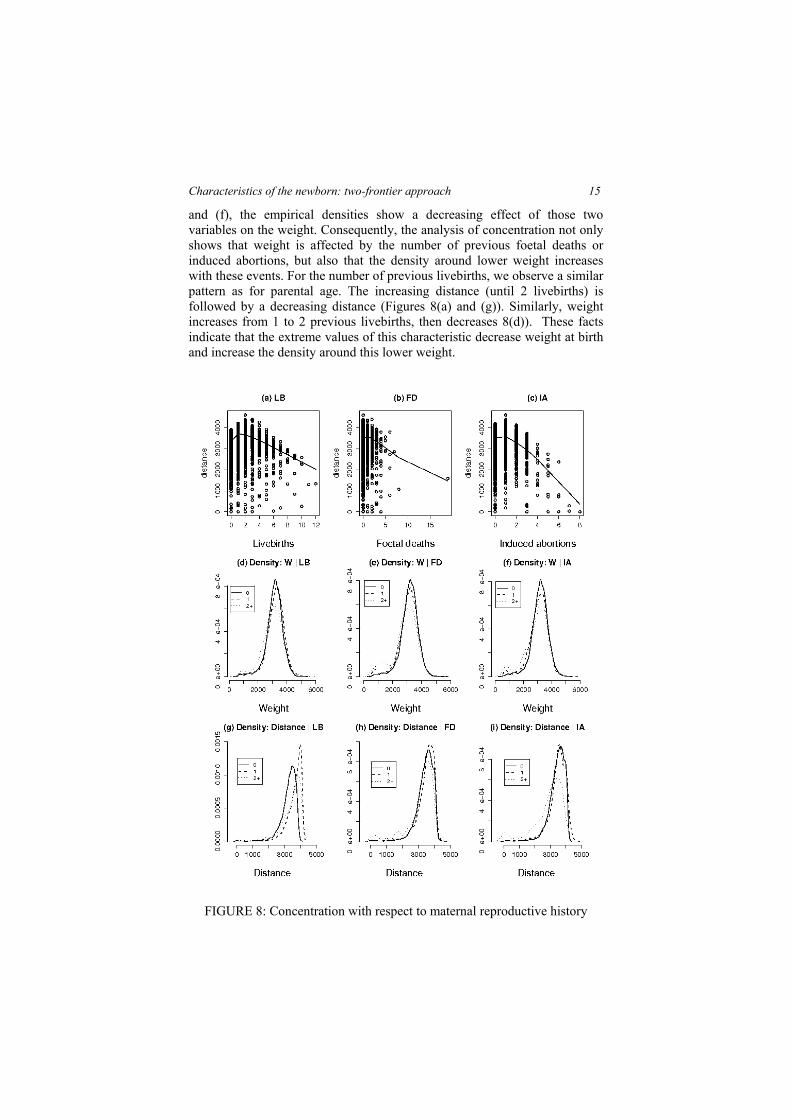
Number of previous livebirths (LB), foetal deaths (FD) and inducedabortions (IA). The number of previous foetal deaths and of previousinduced abortions present a similar pattern. The graphs corresponding tothese two variables indicate a direct decreasing distance with the number ofprevious foetal deaths and of previous induced abortions, controlling for theother variables (Figures 8(b) and (c)). The more the number of events isimportant, the more the characteristic influences the weight level, particularlyfor events appearing twice or more. Indeed, as shown in Figures 8(h) and (i),the estimated distances are lower for the third category (2+). In Figures 7(e)
Characteristics of the newborn: two-frontier approach 15
and (f), the empirical densities show a decreasing effect of those twovariables on the weight. Consequently, the analysis of concentration not onlyshows that weight is affected by the number of previous foetal deaths orinduced abortions, but also that the density around lower weight increaseswith these events. For the number of previous livebirths, we observe a similarpattern as for parental age. The increasing distance (until 2 livebirths) isfollowed by a decreasing distance (Figures 8(a) and (g)). Similarly, weightincreases from 1 to 2 previous livebirths, then decreases 8(d)). These factsindicate that the extreme values of this characteristic decrease weight at birthand increase the density around this lower weight.
FIGURE 8: Concentration with respect to maternal reproductive history

16 Marie VANDRESSE
4.2.2 The congested concentration model
Duration of gestation. Figure 9 shows the sensitivity of the gestational age toa congestion effect. Although the effect of gestation on the factor ofdilatation (Figure 9(a)) is relatively weak, consequences on the distances arenoteworthy (Figure 9(b)). The median of the factor of dilation is 0.69 withoutcongestion and 0.70 with congestion but the median of the distances is 3,619without congestion and 2,736 with congestion, thus a difference of 883 g.
0.0 0.2 0.4 0.6 0.8 1.0
01
23
4
(a) Gest>39
factor of dilatation
Den
sity
without congestion with congestion
0 1000 3000 50000 e
+00
4 e
−04
8 e
−04
(b) Gest>39
distance
Den
sity
without congestion with congestion
FIGURE 9: Congestion vs non congestion: gestational age
Parental age. Figure 10 compares empirical densities of distances and theinverse of the factor of dilation (upper H, Eq.(3)) one without congestion andone with it. Figures 10(a) and (b) represent results for observationscharacterized by mothers older than 30 years. Figures 10 (c) and (d) consideronly fathers older than 38 years. Indeed, a maternal age of 30 years and apaternal age of 38 years have been detected as the starting points of apotential congestion effect.
Presence of maternal congestion should be reflected by smaller factors ofdilatation. In order to belong to interval ]0,1], factors of dilatation werereplaced by their inverse. Maternal congestion can consequently be observedin Figure 10(a) by a shift of the empirical density of the inverses of thedilatation factors to the right when congestion is taken into account. Themedian of the inverses of dilatation factor varies from 0.68 withoutcongestion to 0.70 with congestion. The presence of congestion decreases thedistances to the upper frontier, and consequently between the two frontiers.This is reflected by a shift of the empirical density of the distances to the leftwhen congestion enters into the model (Figure 10(b)). For the category > 30

Characteristics of the newborn: two-frontier approach 17
years old, the median of the distances without congestion is 3,635 g and2,676 g when including congestion, i.e. a difference of 959 g.
Concerning paternal age, the effect of congestion seems more important.Figure 10(c) shows that inverses of the factor of dilatation increase for thecategory [> 38 years old] when congestion is taken in account (shift of theempirical density to the right). The median varies from 0.68 withoutcongestion to 0.75 with congestion. As a consequence, the median ofdistances, for the category [> 38 years old], decreases from 3,398 g withoutcongestion to 2,242 g with congestion, a difference of 1,156 g. The effect onthe distances pushes the empirical density to the left (10(d)).
0.0 0.2 0.4 0.6 0.8 1.0
0.0
1.0
2.0
3.0
(a) MAge>30
factor of dilatation
Den
sity
without congestion with congestion
0.0 0.2 0.4 0.6 0.8 1.0
0.0
1.0
2.0
(c) PAge>38
factor of dilatation
Den
sity
without congestionwith congestion
0 1000 3000 50000 e
+00
6 e
−04
(b) MAge>30
distance
Den
sity
without congestionwith congestion
0 1000 3000 50000 e
+00
4 e
−04
8 e
−04
(d) PAge>38
distance
Den
sity
without congestionwith congestion
FIGURE 10 : Congestion vs non congestion: parental age
Number of previous livebirths, foetal deaths and induced abortions. Figure11 presents the results of congestion with respect to the number of previouslivebirths, the number of previous foetal deaths and the number of previousinduced abortions. For each variable, the empirical density of the distancesand of the inverses of the factor of dilatations are represented, one withcongestion, one without. Concerning previous foetal deaths the median of thedistances decreases, for the category "1+", from 3,555 g to 2,743 g (adifference of 812 g). For the number of previous livebirths, the differencebetween the median of both distances is 828 g (2,767 g without congestion;1,939 g with congestion). Finally, for the number of previous induced

18 Marie VANDRESSE
abortions, the difference between the medians, for the category "1+", is 804 g(3,492 g without congestion; 2,688 g with congestion).
0.0 0.4 0.8
0.0
1.0
2.0
(a) NLive>3
factor of dilatation
Den
sity
without congestionwith congestion
0.0 0.4 0.8
0.0
1.0
2.0
3.0
(c) Fetal>0
factor of dilatation
Den
sity
without congestionwith congestion
0.0 0.4 0.8
0.0
1.0
2.0
3.0
(e) NAbort>0
factor of dilatation
Den
sity
without congestionwith congestion
0 2000 4000 60000 e
+00
6 e
−04
(b) NLive>3
distance
Den
sity
without congestionwith congestion
0 2000 4000 60000 e
+00
6 e
−04
(d) Fetal>0
distance
Den
sity
without congestionwith congestion
0 2000 4000 60000 e
+00
6 e
−04
(f) NAbort>0
distance
Den
sity
without congestionwith congestion
FIGURE 11: Congestion vs non congestion: maternal reproductive history
The presence of congestion might be due to a lack of observations for certaincategories of the variables, and for extreme categories in particular.Congestion might be upward biased.
4.3 Effect of outlying data
Considering the low frequency of some events (Table 1), it seems useful todetermine the validity of those observations and their effect on theestimation, in the spirit of section 2.3. Observations over six inducedabortions or over four previous foetal deaths or over seven previous livebirthswere extracted from the data.

Characteristics of the newborn: two-frontier approach 19
TABLE 1: Reproductive history: outlying observations(data: Hungary June 1984)
Total number of previous events0 1 2 3 4 5 6 7 8 9 10 11 12 19
Livebirths 4674 3902 1069 298 125 50 35 23 13 6 4 1 1 0Induced
abortions8568 1207 299 85 19 13 5 3 2 0 0 0 0 0
Foetaldeaths
8850 993 265 57 22 5 5 2 1 0 0 0 0 1
Concerning observations with seven or more previous livebirths they arecharacterized by an average maternal age of 35 years (for an average of 25years in the complete sample). Education of both parents is also relativelylow in this case for all these observations (no secondary degree). Thesesituations are also characterized by low prenatal care. These facts suggest thatobservations associated with a lot of previous livebirths are not erroneous(encoding mistake, voluntary untrue answer...) but apparently linked to anunfavorable social context.
Many induced abortions are also associated with older mothers, compared tothe complete sample. These observations are also characterized by highernumber of previous livebirths. This could reflect the use of induced abortionas a contraceptive method, and consequently not as an erroneous response.Following the same reasoning, we do not find any indication for consideringobservations with many foetal deaths as erroneous responses (except the casewith 19 previous feotal deaths). Many of these events are again linked toolder maternal age and we observe a comparatively lower weight at birth forthese observations. This suggests that these observations represent motherswith less efficient reproductive capacity.
As already mentioned, outlying data do not include only erroneous data.They also consist of particular situations, less frequently observed but stillmeaningful. The distances are recomputed without these outlying data. Thesub-sample includes 10,153 observations. Results are summarized in TableA.1. For making comparison easier, Table A.1 includes also the statistics forthe complete sample. No difference appears between the estimations basedon the two different samples, which is not surprising. As we are interested inthe variation of the weight with respect to the characteristics of the child, thefactors of contraction and dilatation and the distances between frontiersdepend on the weight distribution, and not on the distribution of thecharacteristics of the child. The deletion of the observations does not alter theweight distribution, and the two samples are similar. When events arenumerous in the reproductive history of the mother they do not appear asinfluential.

20 Marie VANDRESSE
4.4 Biological and socio-economic heterogeneity
As underlined in Mosley et al. (1984), biological and socio-economiccharacteristics do not influence the newborn’s health status in the same way.Biological characteristics are defined as proximate determinants in the sensethat they have a direct effect on the variable of interest, while socio-economiccharacteristics have an indirect effect. Several socio-economic variables andsome biological variables are qualitative and less immediately included intothe model. A possibility consists of evaluating the distance Dj within sub-samples, these sub-samples being defined by socio-economic variables. Forexample, we separate the sample according to the status of the mother, andthen compare the results obtained in each sub-sample with those from thecomplete sample. By creating sub-samples, we decrease the sample size. Inorder to simplify the presentation of the article, graphical representations ofthe results are presented in Appendix B.
4.4.1 Biological heterogeneity
Gender and multiple births are factors of weight differentiation. A strongrelation is also observed between weight at birth and infant mortality (Table 2based on the Hungarian database). Median and average weight at birth aredifferent according to the selected sample. Sub-samples characterized eitherby single births, by survivals at one year or by male births present an higheraverage and a higher median than the other sub-samples characterized eitherby multiple births, by deaths within the first year, or by female births. Thedifference according to gender seems however less marked. As the sub-samples present different weight distributions, the distances measured inweight between minimal and maximal health functions can accordingly bedifferent. As mentioned previously, discrete variables such as gender orsurvival at one year cannot be introduced directly into the model.Consequently, discrete variables are integrated into the model using sub-samples. The distances obtained with the complete sample are then comparedwith six sub-samples: girls, boys; single birth vs. multiple births, infantdeaths and infants surviving their first birthday.

Characteristics of the newborn: two-frontier approach 21
TABLE 2: Biological heterogeneity: descriptive statistics(data: Hungary June 1984)
Weightat birth
(g)
Completesample
Boys Girls Surving1st
birthyear
Infantdeaths
Singlebirth
Multiplebirth
Median 3,200 3,250 3,100 3,200 1,700 3,200 2,300Mean 3,135 3,203 3,062 3,159 1,883 3,157 2,178Min 530 550 530 530 530 530 600Max 5,600 5,600 5,200 5,600 4,370 5,600 3,600
St. dev. 615 628 593 580 976 596 663Num.obs*
10,202 5,262 4,937 10,009 193 9974 228
*Num. obs. = number of observations in the selected sampleMedians and means between each sub-sample are statistically different
Infant mortality. Figure B.1 shows the empirical densities of the distancesbetween the maximum and minimum weights, of the factors of contractionfor the minimum health function, and of the factors of dilatation for themaximum health function. For those three elements, the empirical densitiesare computed separately for the complete sample, for the sub-sampleincluding only infants who survive the first year of life, and for the sub-sample including infants who did not survive the first year of life. Thesefigures indicate that the distribution of distances is more concentrated (themedian of the distance is 2,928 for the sample including only infants who didnot survive their first year and 4,119 for those who survived) and the weightsare closer (resp. more distant) to the minimum (resp. max) health functions.This is especially observed for the median of the factors of contraction (resp.dilatation) for the sample including infants who do not survive (0.51) (resp.0.50) which is greater (resp. lower) than the one obtained from the sampleincluding infants who did survive (0.24). Infant mortality is then associatedwith low birth weight. The concentration model shows a higher densityaround this lower median weight. As the estimation of the distances includesthe other five biological characteristics of the child at birth, the association isobserved whatever the level of those characteristics. The differences betweenthe complete sample and the sample including surviving infants only aresimilar. Their empirical densities are identical and overlap in the figures.
Multiple Birth. Figure B.2 presents a similar pattern as infant mortality:differences are observed when estimating the distances on sub-samples. Thedistances between the maximum and minimum health functions are shorter inthe case of multiple births (a median of 2,053 for multiple births and of 4,023for single birth): for multiple births, weights at birth have a lower mean(Table 2) and are more concentrated around this lower mean. Multiple birthsare consequently a factor of health discrimination, whatever the level of theother child's characteristics at birth.
22 Marie VANDRESSE
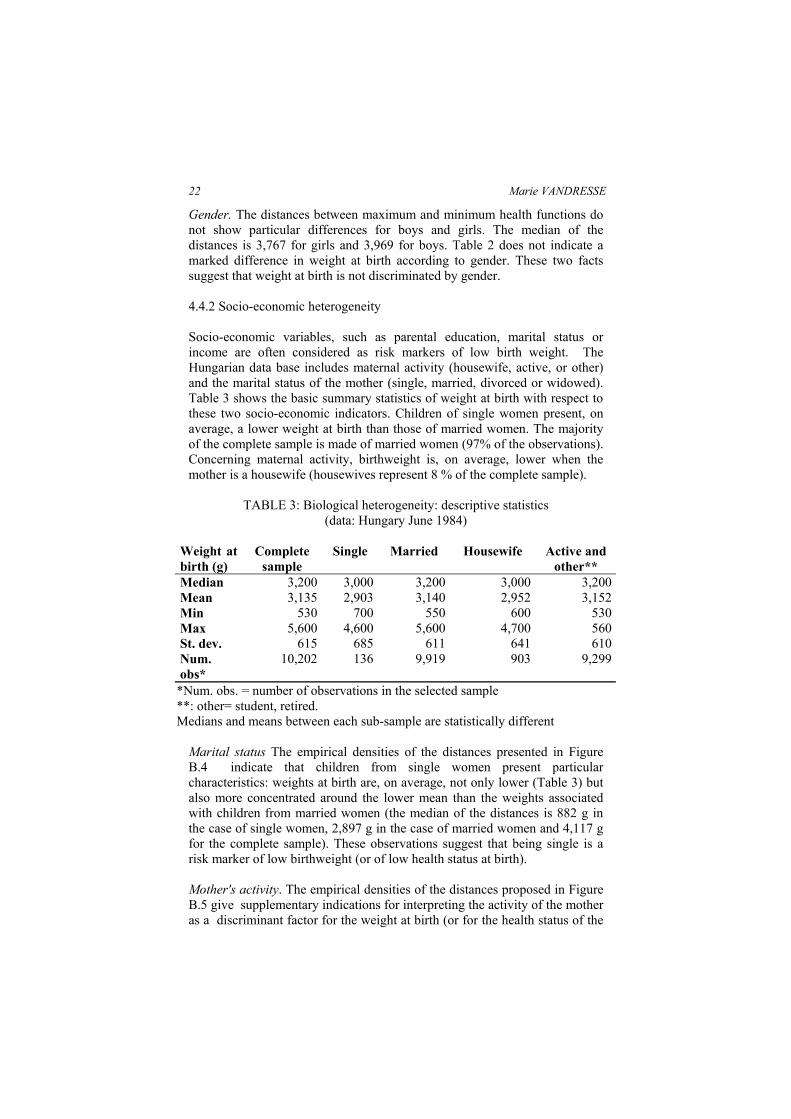
Gender. The distances between maximum and minimum health functions donot show particular differences for boys and girls. The median of thedistances is 3,767 for girls and 3,969 for boys. Table 2 does not indicate amarked difference in weight at birth according to gender. These two factssuggest that weight at birth is not discriminated by gender.
4.4.2 Socio-economic heterogeneity
Socio-economic variables, such as parental education, marital status orincome are often considered as risk markers of low birth weight. TheHungarian data base includes maternal activity (housewife, active, or other)and the marital status of the mother (single, married, divorced or widowed).Table 3 shows the basic summary statistics of weight at birth with respect tothese two socio-economic indicators. Children of single women present, onaverage, a lower weight at birth than those of married women. The majorityof the complete sample is made of married women (97% of the observations).Concerning maternal activity, birthweight is, on average, lower when themother is a housewife (housewives represent 8 % of the complete sample).
TABLE 3: Biological heterogeneity: descriptive statistics(data: Hungary June 1984)
Weight atbirth (g)
Completesample
Single Married Housewife Active andother**
Median 3,200 3,000 3,200 3,000 3,200Mean 3,135 2,903 3,140 2,952 3,152Min 530 700 550 600 530Max 5,600 4,600 5,600 4,700 560St. dev. 615 685 611 641 610Num.obs*
10,202 136 9,919 903 9,299
*Num. obs. = number of observations in the selected sample**: other= student, retired.Medians and means between each sub-sample are statistically different
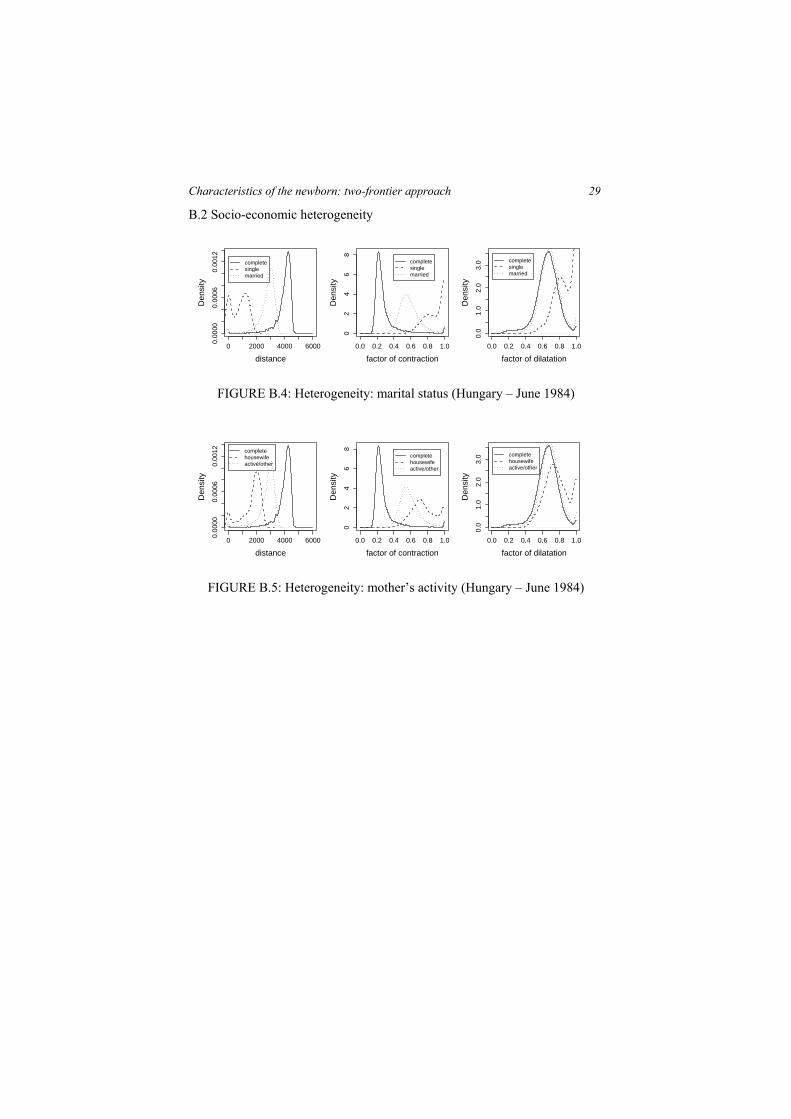
Marital status The empirical densities of the distances presented in FigureB.4 indicate that children from single women present particularcharacteristics: weights at birth are, on average, not only lower (Table 3) butalso more concentrated around the lower mean than the weights associatedwith children from married women (the median of the distances is 882 g inthe case of single women, 2,897 g in the case of married women and 4,117 gfor the complete sample). These observations suggest that being single is arisk marker of low birthweight (or of low health status at birth).
Mother's activity. The empirical densities of the distances proposed in FigureB.5 give supplementary indications for interpreting the activity of the motheras a discriminant factor for the weight at birth (or for the health status of the

Characteristics of the newborn: two-frontier approach 23
newborn). Table 3 not only indicates a lower median birthweight associatedwith being a housewife (3,000 g) compared to active mothers (3,200 g) butthe empirical density in Figure B.5 shows that the distances between theminimal and maximal observation are shorter (a median of 1,895 g forhousewife and of 2,896 g for active mothers). Being a housewife in thissample has a particularly detrimental effect on the weight of the newborn.
5. Conclusion
We computed the distances between extreme observations in order to detectthe importance of each level of characteristics on the health indicator. Themodel of concentration has shown that the distances between the frontiers arerelatively important for each characteristic of the newborn, meaning that aunique characteristic cannot determine alone the level of health. For extremevalues, the median health status represented by the weight at birth is lower,and observations are more concentrated around this lower median. Theextreme values of a characteristic are detrimental for the health status.Concentration can consequently indicate the intensity of the relationshipbetween the child's characteristics and its health status at birth. For parentalage and the number of previous livebirths, the distances between the frontiersare first increasing, then decreasing (from 30 years old for the mother, 38years old for the father and from 2 livebirths onwards). The decreasing effectis more marked for paternal age than for maternal age. The more the numberof previous foetal deaths, the higher the concentration of the weight at birth.The median of the weight at birth decreases immediately too. We found thatpaternal age and the number of previous foetal deaths are the most sensitivecharacteristics for congestion. Biological heterogeneity shows that multiplebirths and infant mortality are characterized by a higher density around alower weight at birth. Sex at birth does not appear as a factor ofdiscrimination. Offspring of single women or of housewives have a lowermedian weight at birth, with a greater density around this lower median.
This study does not present new or opposite results to those generallyreported in the literature on infant morbidity, but this was not the mainobjective of the research. As already mentioned in the introduction of thechapter, the main objective was to develop a methodology which is inaccordance with the problem of interest: the endogeneity of thecharacteristics of the newborn and the interest for extreme values rather thanaverage values. In this perspective, the results of this study are encouragingfor further developments. The absence of contradictory results compared toprevious results found in the literature and based on conditional expectationsmight be viewed as a sort of test of validity for this methodology.The model has some drawbacks. First of all, in the case of the Hungariandata, the sample size is particularly important but for extreme values of thecharacteristics, the number of observations is markedly lower. Father havingtheir offspring at 45 years or older are far less numerous than those aged 25to 35. Similarly, it is more likely to observe a woman having none or only

24 Marie VANDRESSE
one previous foetal death rather than three. This fact (fewer observations forextreme values) might be part of the explanation for the congestion effect.Congestion might be upward biased. The problem of the number ofobservations is not proper to the frontier approach. In a classical multivariateregression, a too small number of observations leads to less precision in theestimations and would increase the standard error of the regressionparameters. Confidence intervals could be obtained using a bootstrapmethodology adapted for nonparametric frontier approaches (Simar et al.,1998). However, application of a bootstrap method in this context is not yetadequate and provides wide confidence intervals (Kneip et al., 1998).Secondly, this model has been constructed without a conceptual frameworkwhere causal relations are clearly identified; therefore, results should beinterpreted in terms of association rather than causality.
As a final comment, and from a methodological point of view, we would liketo point out the interest of the frontier approach. Compared to classicalstatistical methods, and multivariate regression in particular, the frontierapproach evaluates all observations with respect to extreme observationswhile in classical multivariate regression, observations are evaluated withrespect to average values. Interest for extreme values in the present contexthas been highlighted in the introduction. A study of the congestion effectwould also not be feasible through classical multivariate regression except iftheoretical knowledge suggests introducing non linear effects. This isconfirmed, in the present context, by comparing the analysis of the OLSregression of weight at birth conditional to parental age, considering parentalage as a continuous variable or as categorical variable. In the first case,congestion is not detected (a linear effect is assumed) while in the secondcase congestion is detected by comparing the values of the parameters of theregression associated to each category. Multivariate regression deals morewith confirmatory analysis while the frontier approach has to be viewed as anexploratory analysis. In the latter case, there is no assumption on the type ofrelation between variables of interest. Both approaches are complementary toeach other.
References
BERRY, B. J. AND K. HEJA (2002), “Demographic efficiency: Concept andestimation”, Population and Environment, 23, 3.
CRAMER, J. (1987), “Social factors and infant mortality: identifying high-riskgroups and proximate causes”. Demography, 24 (3), 299–322.
EUROCAT (1995), Report 6 - Surveillance of congenital anomalies inEurope, 1980-1992, Institute of Hygiene and Epidemiololgy, Brussels.

Characteristics of the newborn: two-frontier approach 25
FÄRE, R., S. GROSSKOPF, AND C. LOVELL (1984), The Measurement ofEfficiencies of Production, Kluwer-Nihoff Publishing, Boston.
FRIED, H., C. LOVELL, AND S. SCHMIDT (1993), The Measurement ofProductive Efficiency: Techniques and Applications, Oxford UniversityPress, New York.
FRIEDE, A., W. BALDWAIN, P. RHODES, J. BUEHLER, AND L. STRAUSS(1988), “Older maternal age and infant mortality in the United States”.Obstetrics and Gynecology, 72 (2), 152–157.
IHAKA, R., AND GENTLEMAN, R. (1996), R: A Language for data analysisand graphics, Journal of Computational and Graphical Statistics, 5(3), 299-314.
INSTITUTE OF MEDICINE (1985), Preventing low birthweight, NationalAcademy Press Washington, D.C.
KNEIP, A., B. PARK, AND L. SIMAR (1998), “A note on the convergence ofnonparametric DEA estimators for production efficiency scores”,Econometric Theory, 14, 783–793.
MATSUO, H. (2005), The health consequences of low birth weight: literaturereview and critique, Document de travail du SPED, n°25, Département desSciences de la Population et du Développement, Université catholique deLouvain, Louvain-la-Neuve.
MOSLEY, H. W. AND L. C. CHEN (1984), “An analytical framework for thestudy of child survival in developing countries”, Population andDevelopment Review, Supplements: Child Survival: Strategies for Research,10, 25–45.
MOUCHART, M. AND M. VANDRESSE (2007), “Bargaining powers andmarket segmentaiton in freight transport”, Journal of Applied Econometrics,22(7), 1295-1313.
SIMAR, L. (2003), “Detecting outliers in frontiers models: A simpleapproach”, Journal of Productivity Analysis, 20, 391–424.
SIMAR, L. AND P. WILSON (1998), “Sensitivity analysis of efficiency scores:How to bootstrap in nonparametric frontier models”, Management Science,44, 49–61.
SIMAR, L. AND P. WILSON (2003), Efficiency Analysis: The StatisticalApproach, Lecture Notes, Institut de statistique, Université catholique deLouvain, Louvain-la-Neuve.

26 Marie VANDRESSE
SPIRA, A. ET AL. (1993), “Conception probability and pregnancy outcome inrelation to age, cycle regularity, and timing of intercourse”, In R. Gray, H.Leridon, and A. Spira (Eds.), Biomedical and Demographic Determinants ofReproduction, Clarendon Press, Oxford, UK, 271-274.
THOMAS, R. (1997), Modern Econometrics, An Introduction. Addison-Wesley, Chichester, England.
VANDRESSE, M. (2008), Estimation of a structural model of the determinantsof neonatal mortality in Hungary, 1984-88 and 1994-88, Population Studies,62(1), 85-111.

Characteristics of the newborn: two-frontier approach 27
Appendix:
A Outlying observations: comparative statisticsTABLE A.1: Estimation of distances: comparative statistics with and without
outliers, Hungary - June 1984 Complete sample Sample without outliers mean median sr.dev min max mean median sr.dev min Maxwithoutcongestion Β 0.42 0.42 (lower 0.39 0.39 frontier) 0.13 0.13 0.17 0.17 1 11/α 0.66 0.66 (upper 0.66 0.66 frontier) 0.11 0.13 0.17 0.17 1 1Distance 3432 3425 3542 3515 534 449 0 0 4614 4613withcongestion Β 0.59 0.59 (lower 0.56 0.57 frontier) 0.13 0.14 0.25 0.25 1 11/α 0.68 0.69 (upper 0.68 0.68 frontier) 0.11 0.13 0.18 0.18 1 1Distance 2749 2711 2895 2865 607 597 0 0 3730 3730
β : factor of contraction ; α : factor of contractionB Biological and socio-economic heterogeneity: graphical results

28 Marie VANDRESSE
B.1 Biological heterogeneity
0 2000 4000 60000 e
+00
6 e
−04
distance
Den
sity
completesurvivaldeath
0.0 0.2 0.4 0.6 0.8 1.00
12
34
factor of contraction
Den
sity
completesurvivaldeath
0.0 0.2 0.4 0.6 0.8 1.0
01
23
factor of dilatation
Den
sity
completesurvivaldeath
FIGURE B.1: Heterogeneity: survival status at 1 year (Hungary – June 1984)
0 2000 4000 60000 e
+00
6 e
−04
distance
Den
sity
completesinglemult
0.0 0.2 0.4 0.6 0.8 1.0
01
23
4
factor of contraction
Den
sity
completesinglemult
0.0 0.2 0.4 0.6 0.8 1.0
01
23
factor of dilatation
Den
sity
completesinglemult
FIGURE B.2: Heterogeneity: multiple births (Hungary – June 1984)
0 2000 4000 60000 e
+00
6 e
−04
distance
Den
sity
completemalefemale
0.0 0.2 0.4 0.6 0.8 1.0
01
23
4
factor of contraction
Den
sity
completemalefemale
0.0 0.2 0.4 0.6 0.8 1.0
01
23
factor of dilatation
Den
sity
completemalefemale
FIGURE B.3: Heterogeneity: gender (Hungary – June 1984)
Characteristics of the newborn: two-frontier approach 29
B.2 Socio-economic heterogeneity
0 2000 4000 6000
0.00
000.
0006
0.00
12
distance
Den
sity
completesinglemarried
0.0 0.2 0.4 0.6 0.8 1.00
24
68
factor of contraction
Den
sity
completesinglemarried
0.0 0.2 0.4 0.6 0.8 1.0
0.0
1.0
2.0
3.0
factor of dilatation
Den
sity
completesinglemarried
FIGURE B.4: Heterogeneity: marital status (Hungary – June 1984)
0 2000 4000 6000
0.00
000.
0006
0.00
12
distance
Den
sity
completehousewifeactive/other
0.0 0.2 0.4 0.6 0.8 1.0
02
46
8
factor of contraction
Den
sity
completehousewifeactive/other
0.0 0.2 0.4 0.6 0.8 1.0
0.0
1.0
2.0
3.0
factor of dilatation
Den
sity
completehousewifeactive/other
FIGURE B.5: Heterogeneity: mother’s activity (Hungary – June 1984)