characterization and detection of building patterns in
TRANSCRIPT

CHARACTERIZATION AND DETECTION OF BUILDING PATTERNS INCARTOGRAPHIC DATA: TWO ALGORITHMS
Xiang Zhang a,b,∗, Tinghua Ai b, Jantien Stoter c,d
aITCt University of Twente,he [email protected]
bSchool of Resource and Environment Sciences, Wuhan University, Chinatinghua [email protected]
cDelft University of Technology, the NetherlandsdKadaster, Apeldoorn, the Netherlands
KEY WORDS: Pattern Recognition, Building Pattern, Map Generalization, Delaunay Triangulation, Minimum Spanning Tree, Algo-rithm, Graph Theory
ABSTRACT:
Building patterns are important features in applications like automated generalization and spatial data mining. Many previous workhas however focused on a few specific patterns (i.e. collinear pattern), while many others are less discussed. This paper proposes acomprehensive typology of available building patterns through the study of existing maps, and discusses their characteristics. Thistypology includes collinear, curvilinear, align-along-road, grid-like and unstructured patterns. Two algorithms are presented to detectalign-along-road and unstructured building patterns, which are tested against a topographic dataset of the Netherlands.
1 INTRODUCTION
Building patterns are important features in urban and rural ar-eas. The automated detection of visually significant building pat-terns is required for applications like automated map generaliza-tion, automated evaluation of generalized output, semantic en-richment of spatial databases, and spatial data mining. For exam-ple, collinear patterns have been extensively investigated (Bof-fet and Rocca Serra, 2001, Christophe and Ruas, 2002) in orderto simplify and typify building groups. An approach to detecthigher-level semantics like terraced house (Luscher et al., 2009)made use of detected building alignments; the detection approachis however not widely applicable as the buildings in their case wastopologically adjacent, which is not commonly the case. There-fore, a more comprehensive view of which building patterns areavailable, and a generic approach to detect and characterize themare required.
As for the detection techniques, a remarkable and comprehen-sive investigation has been made on the use of minimum spanningtrees (MST) in the field of pattern recognition (Zahn, 1971). Afterbeing successfully applied to some classical clustering problemsfor point sets, this technique was applied to detect building clus-ters for generalization purposes (Regnauld, 1996). Nevertheless,no interesting building patterns is recognized with this techniqueexcept some general tree-like clusters.
This paper firstly proposes a typology of building patterns bymainly studying existing topographic maps (Section 2). ThenSection 3 develops a Graph-theoretic based approach to the de-tection and characterization of two common patterns of the ty-pology. The proposed algorithms are implemented and tested inSection 4. This paper ends with conclusions (Section 5).
2 TYPOLOGY AND CHARACTERISTICS OFBUILDING PATTERNS
A typology of building patterns is needed as it formalizes ourknowledge on building structures available in geospatial domain.The typology of all building patterns that occurred in the studied
∗Corresponding author. Email: [email protected]
maps and previous literature are identified and characterized inSection 2.1, and then we focus specifically on align-along-roadpattern, discussing its relationships to other linear patterns (Sec-tion 2.2).
2.1 Identifying and characterizing the typology
Building clusters
Linear alignments
Nonlinear clusters
Collinear Curvilinear Align-along-road Grid-like Unstructured
Figure 1: Typology and schematic examples of building patterns
The building patterns discussed in this paper are categorizedas low-level, localized visual patterns, because they are importantconsiderations in map generalization. The typology (Figure 1) isstructured as follows. We define building patterns at top level asbuilding clusters of spatially proximate objects with similar geo-metrical (e.g. spacing, size, orientation and shape) and semanticproperties, extended from the definition of point patterns (Zahn,1971). At an intermediate level, we refine the building clustersinto linear alignments and nonlinear clusters in terms of ‘groupshape’. In general, the linear alignments appear to be more elon-gated and their constituent buildings can be organized by a linearpath, while the nonlinear ones appear to stretch in two dimen-sions. At a finer level, the linear alignments are subdivided intocollinear, curvilinear, and align-along-road patterns; the nonlin-ear clusters consist of grid-like and unstructured patterns.
We identify this typology from several sources. First, Gestaltprinciple of visual perception (Wertheimer, 1923) is used to de-fine building patterns in general (proximity for general clusters)and specific (e.g. good continuity for linear alignments). As a
The International Archives of the Photogrammetry, Remote Sensing and Spatial Information Sciences, Vol. 38, Part II
261

result, this typology is generic in the sense that all visual buildingpatterns are clusters. Second, by comparing with those proposedby others we find that this typology is more comprehensive andgeneric. As mentioned before, collinear alignment has been ac-knowledged in the literature; grid-like pattern, though being lessstudied, has been discussed once for typification (Anders, 2006).He (Anders, 2006) also proposed a typology consisting of lin-ear, circular, grid, star and irregular patterns. His linear pattern isenriched by our collinear and curvilinear alignments; meanwhile,his circular is a special case of curvilinear pattern and the star pat-tern are a combination of two crossing collinear alignments. Wepropose a further type (i.e. align-along-road) which integratesthe relationship to surrounding roads. The typology proposed inthis paper is regarded to be generic as all of the pattern typesare confirmed by studying the maps (of the Netherlands, France,and Spain) in the EuroSDR generalization study (Stoter et al.,2009a), and maps of China, examples are shown in Figure 2.Other higher-level or global pattern can be seen as spatial com-bination of these low-level patterns and the integration of thesepatterns with other information such as semantics.
The typology is characterized as follows. According to previ-ous work (Boffet and Rocca Serra, 2001, Christophe and Ruas,2002, Ruas and Holzapfel, 2003), the homogeneities of generalclusters can be realized using standard deviations of all the prop-erties. In our approach, we improve this calculation by adoptingthe concept of coefficient of variance (CV = Std/Mean):
Homogeneity(P ) =
√(pi −Mean(P ))2
Mean(P ), (1)
where P represents the properties of spacing, size, orientation,shape, and semantics of the cluster; pi ∈ P denotes the valuesmeasured from or between the cluster’s elements.
The use of CV applies to the properties of spacing, size, shapeand semantics. This is not because we want to normalize theproperties but rather because CV is a dimensionless number. Itmeans that the homogeneities become then relative numbers in-variant to the choice of measurement, which is also consistentwith our perception about building patterns. For example, if twopatterns have the same standard deviation of size, the one withlarger mean size (i.e. smaller CV ) is more homogeneous in termsof size property. However, CV cannot be applied to orientationas it is meaningless to calculate CV for a cyclic variable. There-fore, the homogeneity of orientation is calculated using standarddeviation.
The homogeneities (Equation 1) are common characteristicsshared by all types of building patterns. In addition, most of thespecific types of building patterns have their own characteristics.In the case of collinear alignments, the patterns are characterizedby straightness describing the sinuosity degrees of the paths andmain angle describing the directions of the paths. For curvilinearalignments, smoothness of the paths and their curvature descrip-tions should be emphasized. Align-along-road patterns should beattached to the roads along which they are aligned. Besides, ithas an extra homogeneity, that is the homogeneity of distances tothe aligned road. This property reflects the degree to which thepattern are parallel to the road. For the two nonlinear clusters, un-structured clusters have no specific property while grid patternscan be further characterized by squareness and parallelism. If weconnect proximate buildings in a grid pattern together, we shouldget two sets of parallel lines, which intersect each other approx-imately right-angled. All patterns of the typology are illustratedusing existing maps (Figure 2(a)-2(d)).
(a) Curvilinear alignments (b) Grid and unstructured clusters
(c) Collinear alignments (d) Align-along-road patterns
Figure 2: Examples of different building patterns as a result ofstudying existing mapsr
2.2 Align-along-road pattern and its relationship to otherlinear alignments
As a result of studying existing topographic maps, we find that thealign-along-road patterns are one of the most common featureswhich are visually significant in urban and rural structures; wealso find that the distinction between align-along-road patternsand another two linear (i.e. collinear and curvilinear) alignmentsis not always clear. On the one hand, it is common cases thatbuildings are located near roads and streets, and therefore suchcollinear and curvilinear alignments (as shown in Figure 2(c)and 2(a)) are also align-along-road patterns. On the other hand,collinear and curvilinear alignments may be parts of align-along-road patterns, because normally align-along-road patterns are notregular in terms of curvatures. This sometimes means that aalign-along-road pattern can be segmented into pieces of collinearand/or curvilinear alignments. Of course, there are also situationswhere collinear and curvilinear patterns are independent of roads.
We therefore limit ourselves to the detection and characteri-zation of two patterns, i.e., the align-along-road and unstructuredpatterns. Some of the other patterns have been discussed by pre-vious authors. For example, the collinear pattern by (Christopheand Ruas, 2002) and the grid pattern by (Anders, 2006).
3 DETECTION AND AUTOMATICCHARACTERIZATION METHOD
In this section, we propose two Graph-theoretic based detectionalgorithms for align-along-road and unstructured patterns. Cur-rently, semantics of buildings (e.g. detached/terraced house) isnot available in most topographic datasets (Stoter et al., 2009b),and the semantic information is thus not discussed in this paper.It is nevertheless possible to integrate such information to refinedetection results in future work.
This section first introduces the preliminary work which willbe used by the subsequent detection and characterization (Sec-tion 3.1). Then the detection and automatic characterization foralign-along-road (Section 3.2) and unstructured (Section 3.3) pat-terns are presented.
3.1 Basic computational toolsRefined constrained Delaunay triangulation The constrainedDelaunay triangulation (CDT) plays an important role in the fol-lowing detection and characterization, and hence some funda-mental computations based on the CDT are introduced at first.
The International Archives of the Photogrammetry, Remote Sensing and Spatial Information Sciences, Vol. 38, Part II
262

(a) (b)
(c)
(d)
Initial GraphFigure 3: (a) Constrained Delaunay Triangulation takes buildings(grey polygons) and roads (bold lines) as constrained objects; (b)distances defined on the incident triangles between proximate ob-jects; (c) segments of a road along which the building aligns andan illustration of the normal direction of this part of the road (thelongest red arrow); (d) the initial proximity graph from (a)
As shown in Fig. 3(a), the CDT is built on buildings and roads,taking their outlines as constrained lines. The CDT is refined byinserting extra points to the constrained lines, and the interval be-tween inserted points is based on the minimal distance betweenall data points. Two objects are considered as neighbors onlywhen they are connected by edges of the triangles; the proximityrelationship between two buildings, and between buildings androads are explicitly modeled by this structure.
Based on the proximity relationship between buildings, an ini-tial graph (Fig. 3(d)) can be generated from which the MinimumSpanning Tree (MST) can be automatically derived (see next sec-tion). Note that in the initial graph, and in the derived MST aswell, all edges is actually weighted based on the proximity be-tween building outlines, although for graphic presentations theedges connecting the centroids of buildings (i.e. vertices of thegraph) are delineated. This means that the weights stored in theedges are calculated by the nearest distances between buildingoutlines, instead of building centroids.
Several benefits can be drawn from the above CDT. Althoughbeing less efficient, it enables a better representation of proximityrelationship than building a CDT on the centroids of buildingsbecause it takes the shapes of buildings into account. In addition,because road centerlines are also involved in the CDT, the initialgraph is automatically segmented in the sense that no graph edgeintersects any dead end within a partition formed by the roads(Fig. 4).
As for the computational efficiency, the theoretical efficiencyfor the whole detection procedure (including constructing initialgraph, deriving MST, detecting and characterizing building pat-terns) can be compensated for by the refined CDT. For example,the calculation of the nearest distance between two proximate ob-jects can make use of their incident triangles (white triangles inFig. 3(a), (b) and (c)), enabling a faster computation. That is, foreach incident triangle between two objects, a distance (di) canbe computed from the triangle edge that coincides with one ofthe objects to the third vertex; the nearest distance between thetwo objects is the minimum amongst all distances (Min({di})).The time complexity of this calculation is O(t), where t is thenumber of incident triangles between two objects; while a triv-ial computation of the nearest distance between two buildings (aswas used in Regnauld, 1996) takes O(nm) time, where n and mare the numbers of the points of the two buildings respectively.This speeds up greatly the nearest distance calculation betweentwo buildings (Fig. 3(b)) and especially between a building anda nearby road (Fig. 3(c)), since t is generally much smaller thannm that can be expected for two spatial objects.
Other required calculations are as follows. First, the wallstatistical weighting method (Duchene et al., 2003) was imple-mented for computing building orientation; they showed that this
Inconsistent Edge
Figure 4: Initial graph, its derived MST and inconsistent edges
method suits well for describing the orientations of typical man-made features (see also the crosses in the buildings in Fig. 3(a)).Second, the normal direction of a portion of a road (the longest ar-row in Fig. 3(c)) is computed based on the average of all the seg-ments normal vectors (three shorter arrows in Fig. 3(c)) weightedby segment lengths. The two calculations are crucial for the de-tection of align-along-road patterns. The last calculation is shapeindex (AGENT, 1999), which is required to characterize the ho-mogeneity of shape.
Minimum Spanning Trees In graph theory, a spanning tree ofan undirected graph G is a tree that contains all vertices of G; theweight of a tree is defined as the sum of the weights of all its con-stituent edges. A minimum spanning tree of G is then a spanningtree whose weight is the minimum among all spanning trees ofG. Since a graph may not necessarily be connected (Fig. 3a), ithas a union of minimum spanning trees for its connected compo-nents (Fig. 3b). In this work, the vertices of G represent buildingfeatures; the edges record their proximity relationships and areweighted by the nearest distances. Prim’s algorithm (Prim, 1957)which is more efficient than Kruskal’s algorithm (Zahn, 1971)was implemented to derive MST from initial graph.
A core concept for MST in pattern recognition is so-calledinconsistent edge proposed by Zahn (1971), where he providedevidence that MST and inconsistent edge are perceptually signif-icant in the point set clustering. In general, an inconsistent edgeis an edge of MST whose weight is significantly larger than themean of nearby edge weights on both sides of the edge (e.g. boldedges in Fig. 4). It can be defined as follows:
edgei =
{inconsistent, if wi > Il ∩ wi > Ir
consistent, otherwise, (2)
where I is a measure that can be defined on both left (Il) andright (Ir) sides of edgei:
I = max {f ·meanweight, meanweight + n · sdweight} .
An edge is said to be inconsistent if its weight exceeds themean weight (meanweight) of its neighboring edges (within pdepth) on both sides by n units of standard deviation (sdweight)and further more if it is at least f times as large as both 2.0nweights (Zahn, 1971, p. 82). Given a normal distribution, there isless than 1% chance that an edge weight would exceed meanweight
by 3 unit of sdweight. Therefore, n ≥ 3 is regarded to be statis-tically significant. In some cases where sdweight approaches tozero, the factor f > 1 ensures that the inconsistent edge is still‘outstanding’ compared with meanweight. A detailed discussionon the parameterization issue refers to Zahn (1971).
However, inconsistent edge alone is not sufficient for detectingbuilding patterns. We did experiments and found that no matterhow to adjust and combine the parameters, most of the buildingpatterns do not automatically show themselves up by simply cut-ting the inconsistent edges off the MST except for some roughclusters. The reason is mainly that the MST-based techniques,which only enforce the proximity principle (Zahn, 1971), do notalways lead to a result that resembles human perception. There-
The International Archives of the Photogrammetry, Remote Sensing and Spatial Information Sciences, Vol. 38, Part II
263

fore other principles of perceptual organization must also be inte-grated for further processing depending on the kind of pattern tobe detected. For the detection of collinear or curvilinear patterns,the principle of good continuity is much preferred.
The parameterization of inconsistent edge seems to be notvery critical in our work. Since further processing is required fordetecting specific patterns anyway, a conservative set of parame-ters was primarily used in this work (i.e. p = 2, n = 3, and f =2.0), making sure that some very significant edges are prunedwhile other less significant ones are kept for further decisions.However, our experiments show also that the use of other sets ofparameter values with small variations makes little difference forthe final detection results, as the difference caused in the pruningstep can be made up for by refined processes (see Section 3.2).
3.2 Align-along-road building pattern
aß
vi
vi-1
vi+1vi+2
(a) concepts for the detection ofalign-along-road pattern
BORN
(b) concepts for the characteriza-tion of align-along-road pattern
Figure 5: Related concepts for detecting and characterizing align-along-road pattern
There is a general Graph-theoretic based framework for thedetection of all linear alignments in our work, that is, the de-tection is achieved by tracing paths in the previously obtainedMST, and the trace of the paths has to conform to different setsof constraints appropriate for the detection of each type of pat-terns. Formally, a path is defined here as a sequence of verticesin a MST (e.g. the bottom line going through the buildings in Fig-ure 5(a)); and the path angle at vertex vi is defined by the angle ofvector(vi−1, vi) and vector(vi, vi+1) in that path (Figure 5(a)).
Detection of the align-along-road pattern The basic idea ofdetecting align-along-road patterns is that a path should be tracedfrom the pruned MST and the buildings on the path should beclose enough to a nearby road. Therefore, we formulate the de-tection of the align-along-road pattern as a path tracing procedurethat advocates the same aligned road, proximity, size similarityand path angle constraints (Algorithm 1). This choice of con-straints set is justified as follows.
As a result of studying existing maps, we find that shape andorientation are not as dominant as aligned road, proximity, andsize in determining a collinear group. First, that buildings alignalong the same road can be recognized as a align-along roadpattern is a fundamental constraint, which should never be vi-olated. Second, most buildings have similar man-made shapes;those with complex shapes are usually much bigger than the or-dinary buildings, and thus they can easily be filtered out by sizesimilarity in the first place. In addition, a generic shape measure-ment for map generalization is still not available; commonly usedshape measures (e.g. compactness, shape index) describe specificaspects of shape and thus are not sufficient for our case. Third,the theoretically maximum deviation of building orientation com-puted with the wall statistical weighting method is 45° (Ducheneet al., 2003), which has much less impact on the perception ofalign-along-road patterns than proximity constraint. Consequently,we discarded the use of shape and orientation constraints in ourdetection algorithm of align-along-road pattern in the experiments.Nevertheless, these two aspects are integrated in the characteriza-tion of this pattern.
Algorithm 1: Detecting the align-along-road patternInput: buildings; partition roads; constraintsOutput: Collection of align-along-road patterns (AARP )
1: calculate CDT and then MST for the input data;2: prune the inconsistent edges from the MST;3: trace paths in the pruned MST as follows:foreach v0 = vertex of degree 1 or vertex of degree 3 in MST do
loop “initialize AARP ”v1 = adjacent vertex of v0;if v0,v1 align along the same closer road then
initialize AARP with edge(v0, v1);break;
elsev0 = v1;
endloop;loop “add new buildings to AARP ”
if v1 is of degree 1 thenadd AARP to Collection if AARP contains morethan 3 buildings;break;
if v1 is of degree 3 thenselect a vertex v2 with which the edge(v1, v2)forms larger path angle with its predecessor edge.
elsev2 = adjacent vertex of v1
check edge(v1, v2) w.r.t. the constraints for AARP ;if edge(v1, v2) exists then
add edge(v1, v2) to AARP ;v0 = v1; v1 = v2; v2 = NULL;
elseadd AARP to collection if AARP contains morethan 3 buildings;empty AARP ; renew AARP with edge(v1, v2) ifthe two vertices share a road;v0 = v1; v1 = v2; v2 = NULL;
endloop;4: combine the detected AARP if possible;
The mechanism how the selected constraints work is describedas follows. These constraints work on a new edge occurringin the tracing process in 1, determining if the new edge can beadded to an existing alignment. Aligned road is firstly checkedusing the information stored as a result of constructing refinedCDT. If buildings connected by the new edge share the sameroad, then the tracing proceeds; and vice versa. The proximityconstraint is based on the idea of inconsistent edge introduced inSection 3.1: if the weight of the new edge is inconsistent con-cerning the existing pattern, it cannot be added to the existingpattern. Finally, the size similarity constraint ensures that thesize contrast between the two buildings at both ends of the newedge should not be too large (i.e. bigger building/smaller build-ing < size contrast). It has to be mentioned that in the itera-tion step where there are more than one new edges available (e.g.edge(vi; vi+1) and edge(vi; vi+2) in Figure 5(a)), an edge withlarger path angle (α, β ∈ [0◦, 180◦]; β > α) should be selectedand added to the existing pattern in order to keep good continuityprinciple (Wertheimer, 1923).
In the step 4 of Algorithm 1, a combination is recommended inthe cases of two detected groups approach to each other at theirends. This combination can be done by introducing a connect-ing edge consisting of two vertices at the proximate ends of bothgroups, if on the one hand the two groups align along the sameroad and on the other the distance of the introduced connectingedge is not too long. The parameter showing promising results
The International Archives of the Photogrammetry, Remote Sensing and Spatial Information Sciences, Vol. 38, Part II
264
Algorithm 2: Detecting unstructured clustersInput: buildings; partition roads [optional]; postconditionsOutput: Collection of unstructured clusters (UC)
1: calculate CDT and then MST for the input data;2: prune the inconsistent edges from the MST;3: prune the edges connecting buildings whose size difference> size contrast; if FragRatio > 0.5, the edges should not bepruned;4: organize connected subgraphs and populate UC with them;5: filter out those UC that cannot pass postconditions, and addremaining UC to Collection;
for align-along-road pattern (Section 4) is size contrast = 3.2.
Characterization of the align-along-road pattern The char-acterization of align-along-road building patterns is by applyingEquation 1 to spacing, size, shape, and distance to the alignedroad. For these homogeneities, mean values are firstly calculatedfor the properties and then the homogeneity is computed. It isworth noting that both spacing (i.e. inter distance between build-ings) and distance to the aligned road are computed using thenearest distance calculation forth mentioned in Section 3.1.
The calculation of the homogeneity concerning the orientationis described as follows. The orientation is considered to be moreregular if the buildings change their orientations right accordingto the normal directions (e.g. RN in Figure 5(b)) of the local roadsegments that they align. For each building in the pattern, an an-gle deviation ∈ [0◦, 45◦] is calculated between RN (Normal ofRoad segments) and BO (Building Orientation), the calculationof the two is presented in Section 3.1; the homogeneity of ori-entation is then computed from the standard deviation of all thedeviations.
3.3 Unstructured clusters
Detection of unstructured clusters Unstructured clusters arealso a common feature on topographic maps, especially at largerscales (1:10k-1:50k).
The method (Algorithm 2) detecting this type of building pat-tern is realized simply through pruning edges that are inconsis-tent and edges that connect two buildings whose size differenceexceeds size contrast, and grouping the connected subgraphsfrom the pruned MST. Those subgraphs, however, are just candi-dates which have to tested against several postconditions. t Thefirst postcondition is the number of buildings contained. in ourexperiments, we define that at least three buildings form a clusteror pattern, as only in this case the calculation of mean and stan-dard deviation required by the detection and characterization ismeaningful. A second postcondition is so-called black-and-whiteratio, which is defined as follows:
BWRatio =
∑Area(bi)
Area(ConvexHull(UC)),
where bi ∈ UC. This postcondition protects some wrigglinglinear alignments from being recognized as unstructured clus-ters (Figure 6(a)). A final postcondition is termed fragmenta-tion ratio (FragRatio), which is the ratio between the number ofpruned edges and the number of total edges in an initial cluster.This postcondition should be applied in step 3 (see Algorithms 2)to prevent clusters from being over-fragmented, as in the caseswhere small and big buildings are arranged alternately (e.g. Fig-ure 6(b)).
Characterization of unstructured clusters Despite the homo-geneity of orientation which is calculated based on absolute ori-
buildingcluster
(a) (b)
Figure 6: Bad examples of unstructured clusters
entations of buildings, the homogeneity of spacing, size, shapeis exactly the same to those calculated for align-along-road pat-terns. The algorithms for the detection and characterization wereimplemented and results are presented in Section 4.
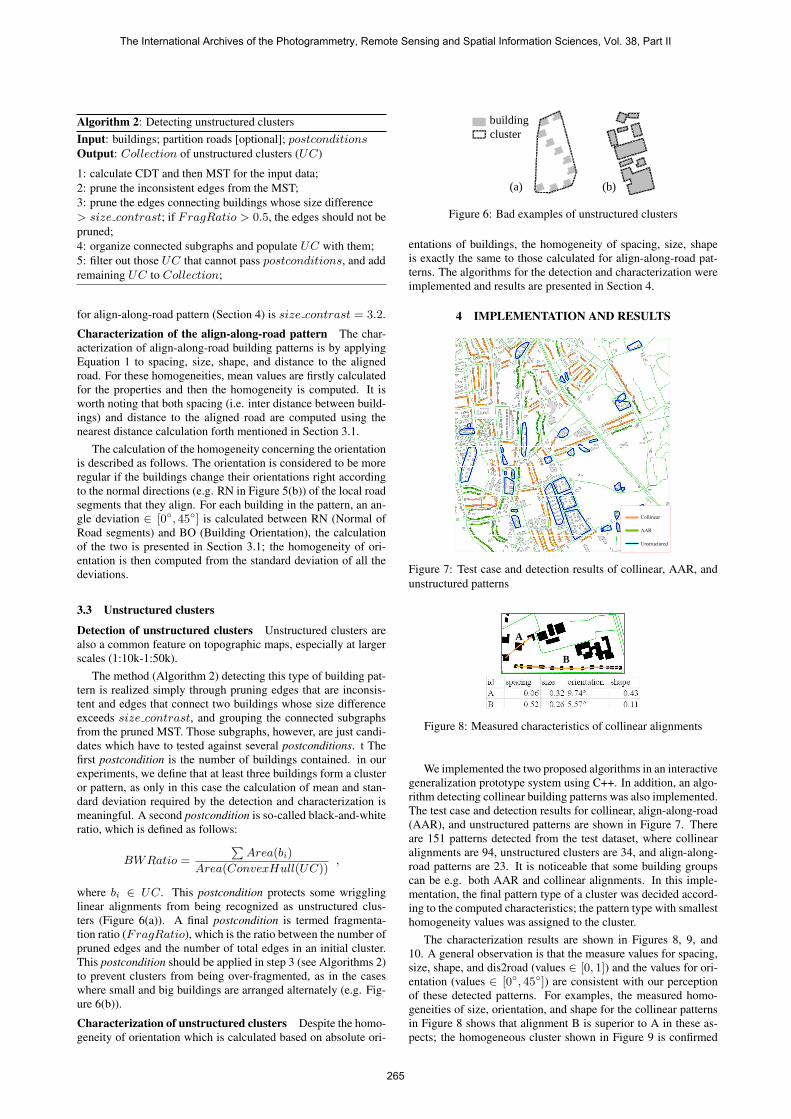
4 IMPLEMENTATION AND RESULTS
Collinear
AAR
Unstructured
Figure 7: Test case and detection results of collinear, AAR, andunstructured patterns
A
B
Figure 8: Measured characteristics of collinear alignments
We implemented the two proposed algorithms in an interactivegeneralization prototype system using C++. In addition, an algo-rithm detecting collinear building patterns was also implemented.The test case and detection results for collinear, align-along-road(AAR), and unstructured patterns are shown in Figure 7. Thereare 151 patterns detected from the test dataset, where collinearalignments are 94, unstructured clusters are 34, and align-along-road patterns are 23. It is noticeable that some building groupscan be e.g. both AAR and collinear alignments. In this imple-mentation, the final pattern type of a cluster was decided accord-ing to the computed characteristics; the pattern type with smallesthomogeneity values was assigned to the cluster.
The characterization results are shown in Figures 8, 9, and10. A general observation is that the measure values for spacing,size, shape, and dis2road (values ∈ [0, 1]) and the values for ori-entation (values ∈ [0◦, 45◦]) are consistent with our perceptionof these detected patterns. For examples, the measured homo-geneities of size, orientation, and shape for the collinear patternsin Figure 8 shows that alignment B is superior to A in these as-pects; the homogeneous cluster shown in Figure 9 is confirmed
The International Archives of the Photogrammetry, Remote Sensing and Spatial Information Sciences, Vol. 38, Part II
265

A
Figure 9: Measured characteristics of an unstructured cluster
A B CFigure 10: Measured characteristics of align-along-road patterns
by the measured homogeneities of this unstructured cluster, as allthe homogeneity values are relatively low (below a quarter).
For the align-along-road patterns as shown in Figure 10, sev-eral observations can be made. First, ‘dis2road’ column confirmsthat this characteristic is more homogeneous for A and C than B,as B is aligned along the road to its left. Second, an extra orien-tation (‘ori2’) is calculated based on absolute values, in order forthe readers to compare it with the orientation change with alignedroads (‘ori1’). The results show that ‘ori1’ is generally less than‘ori2’, as we can also observe in Figure 10 that although the in-dividual orientations are rather fluctuated the orientations indeedchange according to their aligned roads respectively. This obser-vation confirms that orientation varying according to the alignedroad is well suited for characterizing align-along-road pattern.
5 DISCUSSION AND CONCLUSION
This paper proposes a typology of building patterns available incartographic and geospatial domain based on the study of existingtopographic maps and related literatures. In this typology, funda-mental visual patterns have been identified and their characteris-tics been discussed. This is an important step towards formalizingour knowledge on the building patterns in this field. Then, twoGraph-theoretic based algorithms are presented in order to detecttwo pattern types of the typology, namely the align-along-roadand unstructured patterns. The detection and characterizationmethod was implemented and tested using Dutch topographicdatasets. The results appear to be promising.
The proposed approach is generic in the sense that visuallyimportant building patterns can be detected and characterized nomatter the buildings are topologically adjacent or not, even if thespatial objects are represented by points, since all these cases canbe handled by the refined CDT. This approach can be further ap-plied to detecting the patterns of archipelago, by adjusting someof the constraints or postconditions of the algorithms.
Although we argue in this paper that in most cases collinearand curvilinear alignments can be replaced by align-alogn-roadpatterns, the characterization of align-along-road patterns is stilltoo general. That is, some important characteristics, like thestraightness and main angle of collinear alignments, and smooth-ness and curvature descriptions of curvilinear patterns, would belost if those linear patterns were recognized as align-along-roadpatterns. Therefore, future work will be focus on the detectionand characterization of curvilinear alignments.
Further testing of the proposed approach against non-Dutchdatasets will be carried out in order to confirm the claimed gener-ality. Also noted that another work on the automated evaluationof building pattern preservation constraint (Zhang et al., 2010) iscarrying out based on the detection results reported in this paper.
ACKNOWLEDGEMENTS
The work was partially supported by the National High-Tech Re-search and Development Plan of China under the grant No. 2007-AA12Z209, and the National Science Foundation, China underthe grant No. 40971242. International Institute for GeoInforma-tion Science and Earth Observation (ITC), University of Twente,which funds the first author as a PhD student is gratefully ac-knowledged.
REFERENCES
AGENT, 1999. Selection of basic measures, deliverable c1. Tech-nical report.
Anders, K.-H., 2006. Grid typification. In: Progress in SpatialData Handling, pp. 633–642.
Boffet, A. and Rocca Serra, S., 2001. Identification of spatialstructures within urban block for town qualification. In: ICC,Vol. 3, Beijing, pp. 1974–1983.
Christophe, S. and Ruas, A., 2002. Detecting building alignmentsfor generalisation purposes. In: D. E. Richardson and P. vanOosterom (eds), Advances in Spatial Data Handling (SDH 2002),Springer Verlag, Berlin, pp. 419–432.
Duchene, C., Bard, S., Barillot, X., Ruas, A., Trevisan, J. andHolzapfel, F., 2003. Quantitative and qualitative description ofbuilding orientation. In: 5th Workshop on Progress in AutomatedMap Generalization, Pairs.
Luscher, P., Weibel, R. and Burghardt, D., 2009. Integrating on-tological modelling and bayesian inference for pattern classifi-cation in topographic vector data. Computers, Environment andUrban Systems 33(5), pp. 363–374.
Regnauld, N., 1996. Recognition of building clusters for gener-alization. In: M. J. Kraak and M. Molenaar (eds), Advances inGIS Research II (Proceedings of 6th SDH’96, Delft), Taylor &Francis, London, pp. 4B.1–4B.14.
Ruas, A. and Holzapfel, F., 2003. Automatic characterisation ofbuilding alignments by means of expert knowledge. In: ICC,Durban, pp. 1604–1515.
Stoter, J., Burghardt, D., Duchene, C., Baella, B., Bakker, N.,Blok, C., Pla, M., Regnauld, N., Touya, G. and Schmid, S.,2009a. Methodology for evaluating automated map generaliza-tion in commercial software. Computers, Environment and UrbanSystems 33(5), pp. 311–324.
Stoter, J., van Smaalen, J., Bakker, N. and Hardy, P., 2009b. Spec-ifying map requirements for automated generalization of topo-graphic data. Cartographic Journal, The 46(3), pp. 214–227.
Wertheimer, M., 1923. Laws of organization in perceptual forms.In: W. D. Ellis (ed.), A Source Book of Gestalt Psychology, Rout-ledge & Kegan Paul, pp. 71–88.
Zahn, C. T., 1971. Graph-theoretical methods for detecting anddescribing gestalt clusters. Computers, IEEE Transactions on C-20(1), pp. 68–86.
Zhang, X., Stoter, J., Ai, T. and Kraak, M.-J., 2010. Formal-ization and data enrichment for automated evaluation of build-ing pattern preservation. In: Joint International Conference onTheory, Data Handling and Modelling in GeoSpatial InformationScience (SDH’ 2010). to appear.
The International Archives of the Photogrammetry, Remote Sensing and Spatial Information Sciences, Vol. 38, Part II
266