characterization and functional beverage development · pdf filefood science and technology...
TRANSCRIPT
Characterization and Functional Beverage Development using
Coenzyme Q10-Impregnated Beta-glucan
by
Nian Liu
A thesis submitted in partial fulfillment of the requirements for the degree of
Master of Science
in
Food Science and Technology
Department of Agricultural, Food and Nutritional Science
University of Alberta
© Nian Liu, 2017
ii
Abstract
Pressurized gas-expanded liquid (PGX) technology is a supercritical fluid technique used for
producing micro/nano-particles, agglomerates and fibers from an aqueous solution of a high
molecular weight biopolymer, which can also be employed for encapsulation or impregnation.
PGX-processed beta-glucan (BG) and CoQ10-impregnated beta-glucan (iBG) were investigated,
in terms of their physicochemical properties and potential as nutraceutical ingredients for
functional beverages. Helium ion microscope, differential scanning calorimeter, X-ray
diffractometer, AutoSorb iQ and rheometer were used to determine the particle morphology,
thermal properties, crystallinity, surface area and viscosity, respectively. Results showed that
both BG (7.7 μm) and iBG (6.1 μm) were produced as micrometer-scale particles, while CoQ10
nanoparticles were present in iBG with the average diameter of 92 nm; CoQ10 was successfully
impregnated onto BG using the PGX process without interrupting the porous structure and
viscosity of BG; and CoQ10 present in iBG was in its amorphous form adsorbed on the porous
structure of BG. In addition, the effects of shear rate (1.29 s-1 to 129 s-1), concentration (0.15%,
0.2%, 0.3% w/v) and temperature (0 oC to 80 oC) on the viscosity of BG and iBG solutions were
investigated. As expected, viscosity increased with concentration, and decreased with
temperature. However, shear rate had no effect on the viscosity of both BG and iBG solutions,
demonstrating Newtonian behavior at these concentrations.
The formulation of an orange-flavored functional beverage containing BG or iBG and
sweetened with stevia extract was developed and the quality of the beverages was evaluated by
iii
sensory panels. There was no overall difference between the beverages prepared with BG and
iBG. Ideal profile method (IPM) was applied to evaluate the overall consumer acceptance of the
beverages prepared with 0.2% iBG. The effect of providing health information was also tested,
and the positive effect of health information of ingredients including stevia extract, beta-glucan
and CoQ10 on overall acceptance was demonstrated.
Determination of the physicochemical properties contributes to the fundamental
understanding of the behavior of the bioactive combination, CoQ10 and BG in powder form. As
well, the prototype functional beverage developed demonstrated the potential use of
PGX-processed BG and iBG as nutraceutical ingredients in beverage products.
iv
Preface
This thesis is an original work by Nian Liu under the supervision of Dr. Feral Temelli,
comprised of five chapters: Chapter 1 provides background information and overall objectives of
this thesis research; Chapter 2 is a literature review on several topics related to this research work;
Chapter 3 is about the physicochemical characterization of beta-glucan and CoQ10-impregnated
bet-glucan; Chapter 4 focuses on functional beverage development using these ingredients and
sensory evaluation of the beverages; and Chapter 5 gives conclusions and recommendations. The
research project reported in Chapter 4, received research ethics approval on October 18th, 2016,
from the University of Alberta Research Ethics Board, “Sensory characteristics and consumer
acceptance of orange-flavoured functional beverage sweetened with stevia extract and fortified
with beta-glucan and CoQ10”, No. Pro00065010. Dr. Wendy Wismer and Ha Nguyen provided
guidance in experimental design and data analysis for the work reported in Chapter 4.

v
Acknowledgements
This research and thesis would not have been possible without the great support of my thesis
supervisor, Dr. Feral Temelli who has been constantly providing insightful advice, knowledge,
patience, encouragement, guidance and support throughout my graduate study. Thank you
Dr.Temelli, I think you are the best supervisor. I highly appreciate your excellent advice for not
only my research project but also personal development. You told me “Jump out of your comfort
zone, you will figure out how much more you can do,” and that will be my motto to encourage me
to go far in my future research and development.
Thank you Dr. Wendy Wismer for being my supervisory committee member and giving great
support and valuable guidance. Also, I appreciate Dr. Lynn McMullen to be an examining
committee member and to give me great advice and feedback for this thesis.
Furthermore, I am grateful to Alberta Innovates Biosolutions and Ceapro Inc. for their financial
support of this project.
Thanks to Drs. Paul Moquin and Bernhard Seifried, Ceapro Inc. for providing the beta-glucan
and CoQ10-impregnated beta-glucan ingredients and their insights.
In addition, I thank Peng Li and Dr. Shihong Xu from nanoFAB for the technical support on
helium ion microscopy. Thanks to Dr. Lingyun Chen for providing equipment for my particle size
analysis. Thanks to Jun Gao for the help and support on beta-glucan content and viscosity
determination. Thanks a lot to Dr. Ricardo Tomas Do Couto for his constant help with my
experiments and enlightening discussions on my choices in life. Thanks to Dr. Ozan Nazim Ciftci
vi
who was the first person to bring me into the research field. Thanks to Ha Nguyen for her help on
statistical analysis. I also would like to thank my lab colleagues and friends, Jiayue Chen, Yujia
Zhao, Carla Valdivieso, Eileen Santos, Yuanyao Chen, Rodrigo Araya Olguin, Karina Araus
Sermiento, Robert Mukiibi, Guangyu Liu, Zhiqiang Jiu, Yussef Esparza and Eduardo Rodriguez
Martinez for their motivation, help and support in many aspects throughout the past years.
Finally, I would like to thank my family and all my friends for giving me support,
understanding, positive energy and love. Particularly to my parents, who always cheer me up when
I need it. I would not be where I am today without their unconditional love and support.

vii
Table of Contents
Chapter 1: Introduction and objectives………………………………………………………..1
Chapter 2: Literature review…………………………………………………………………...4
2.1 Beta-glucan………………………………………………………………………………4
2.1.1 Sources and structure……………………………………………….……………..4
2.1.2 Extraction of beta-glucan………………………………………………………….7
2.1.3 Physicochemical properties………………………………………………………11
2.1.4 Health benefits……………………………………………………………………16
2.1.5 Applications in food………………………………………………………………20
2.2 Coenzyme Q10…………………………………………………………………………..23
2.2.1 Sources and structure……………………………………………………………..23
2.2.2 Health benefits……………………………………………………………………28
2.3 Delivery systems involving CoQ10 and beta-glucan………………………….…….…..31
Chapter 3: Characterization of beta-glucan and coenzyme Q10 impregnated beta-glucan
generated by pressurized gas-expanded liquid (PGX) technology………………....……….40
3.1 Introduction……………………………………………………………………………..40
3.2 Materials and methods….................................................................................................42
3.2.1 Materials………………………………………………………………………….42
3.2.2 Proximate analysis……………………………………………………………......43
3.2.2.1 Moisture content…………………………………………………………...43
3.2.2.2 Protein content………………………………………………………….….43
3.2.2.3 Lipid content……………………………………………………………….44
3.2.2.4 Ash content…………………………………………………………….…..44
3.2.2.5 Carbohydrate content…………………………………………………...….44
3.2.3 Beta-glucan content…………………………………………………………...….45
3.2.4 Particle size and morphology……………………………………………...……...46
3.2.5 Surface area and pore size analysis………………………………………....…….46
3.2.6 Differential scanning calorimetry (DSC) analysis…………………………..……47
3.2.7 X-ray diffraction (XRD) analysis………………………………………..….……47
3.2.8 CoQ10 loading content…………………………………………………..…….…47
3.2.9 Viscosity………………………………………………………………………….48
3.2.10 Color…………………………………………………………….………………49
3.2.11 Statistical analysis……………………………………...………………………..50
3.3 Results and discussion……………………………………………………………….….51
3.3.1 Chemical composition and particle characteristics……………………………….51
3.3.2 Crystallinity and thermal analysis……………………………..………………….54

viii
3.3.3 Color……………………………………….……………………..……..………..57
3.3.4 Viscosity………………………………………………………………………….59
3.4 Conclusions……………………………………………………………………..……….63
Chapter 4: Development of an orange-flavored functional beverage formulated with
beta-glucan and coenzyme Q10-impregnated beta-glucan …………………….……………65
4.1 Introduction……………………………………………………………………………...65
4.2 Materials and methods……………………………………..……………………………67
4.2.1 Materials…………………………………………………….……………………67
4.2.2 Beverage formulation development………………………………….…………...68
4.2.3 Determination of physicochemical properties……………………………………69
4.2.3.1 Viscosity………………………………………………………..………….70
4.2.3.2 Color………………………………………….……………………………71
4.2.4 Sensory evaluation………………………………………………………………..71
4.2.4.1 Experimental design…………………………………………………….….71
4.2.4.2 Trained panel…………………………………………………….………...72
4.2.4.3 Triangle test……………………………………………….……………….74
4.2.4.4 Consumer panel……………………………………………………………74
4.2.5 Statistical analysis………………………………………………………………...76
4.3 Results and discussion…..……………………………………….……………………...77
4.3.1 Beverage formulation development………………………………………………77
4.3.2 Physicochemical properties of beverages…………………………………...........79
4.3.3 Sensory evaluation………………………………………………………………..84
4.3.3.1 Trained panel…………………………………………...………………….84
4.3.3.2 Triangle test................……………………………….…………………….85
4.3.3.3 Consumer panel………………………………………………….…….…..86
4.4 Conclusions………………………………………………………………………..…….96
Chapter 5: Conclusions and Recommendations…………………………………..………….98
5.1 Summary of key findings…..…………………………….……………………………...98
5.2 Recommendations for future work…………………….………………………………100
Bibliography…………………………………………………………………………………...102
Appendix A: Questionnaires…………………………………………………………...…….124
A.1 Trained panel screening questionnaire………………………………………………..124
A.2 Trained panel evaluation questionnaire………………….........................……………126
A.3 Triangle test questionnaire………………………………................................…….....134
A.4 Consumer panel questionnaire………………………………………………………...135
ix
Appendix B: Trained panel…………………………………………………………………..144
B.1 Objective……………………………………………………………………………....144
B.2 Methods………………………………………………………………………………..144
A.2.1 Screening procedure…………………………………………………………….144
A.2.2 Training……………………………………..………………..………………....145
A.2.3 Evaluation……………………………………...…………..…………………...145
B.3 Results……………………………………………..…………………….…………….146
B.4 Recommendations……………………………………………………………………..150
Appendix C: PCA on the target group of 47 participants………………..………………...151
x
List of Tables
Table 2-1. Beta-glucan incorporation into various food and beverage products……………….22
Table 2-2. Particle formations with CoQ10 as the bioactive or beta-glucan as the carrier in the
past decade………………………………………………………………………………....35
Table 3-1. Solution preparation for viscosity measurements………….......................................49
Table 3-2. Proximate composition of BG sample....................................................................…51
Table 3-3. Viscosity of HBG, BG and iBG solutions at 51 s-1...…………..........................…....61
Table 4-1. Beverage formulations………………………………………………………………68
Table 4-2. Standard solutions used for training in the use of scales for the different attributes
evaluated................…………………………………………………………………….......73
Table 4-3. The provided health benefits information regarding beta-glucan, CoQ10 and stevia
extract. ……………………………………………………………………………………..76
Table 4-4. Demographic information of the consumer panel (n=102).........................................87
Table 4-5. Attributes of beverages and ideal product evaluated by the consumer panel (n=91)..88
Table 4-6. Loadings of 7 attributes on three significant principal components (n=91)................89
Table 4-7. Loadings of 4 products on three significant principal components (n=91).................91
Table 4-8. Attributes of beverages and ideal product evaluated by the target group (n=47)…....95
Table B-1. ANOVA P-values………………………………………………………………….148
Table B-2. The intensity of orange flavor and viscosity of beverages prepared with four
concentrations of BG and served at 25 oC and 4 oC……………………………...……….149
Table B-3. The sweetness intensity of beverages made with four concentrations of BG……...149
Table B-4. The sourness intensity of beverages served at 25 oC and 4 oC…………………......149
xi
List of Figures
Figure 2-1. The structure of beta (1 → 3) (1 → 6) beta-glucan.…………….........…………...….6
Figure 2-2. Generalised structure of cereal beta-glucans and their debranching with lichenase;
dotted arrows indicate the lichenase hydrolysis sites on the polysaccharide chain. G:
beta-D-glucopyranosyl unit; DP3: 3-O-beta-cellobiosyl-D-glucose; DP4: 3-O-beta-cellotrio-
syl-D-glucose; DP⩾5: cellodextrin-like oligosaccharides containing more than three
consecutive 4-O-linked glucose residues. Reprinted from Lazaridou and Biliaderis (2007)
with permission from Elsevier.................................................................................................6
Figure 2-3. The molecular structure of coenzyme Q10, where Q refers to the quinone ring and 10
refers to the number of subunits in its side chain…………………………………...……...25
Figure 2-4. CoQ10 acts as an electron acceptor at the level of mitochondria. ADP, adenosine
dipohosphate; Cyt c, cytochrome c; Pi, inorganic phosphate. Reprinted from Yang et al.
(2015) with permission from Elsevier……….................................................................…..25
Figure 3-1. Visual appearance of (A) BG and (B) iBG. samples ………………….......……….52
Figure 3-2. Helium ion microscopy images of (A), (C) BG and (B), (D) iBG. Scale bars
represent 500 nm in (A) and (B) and 200 nm in (C) and (D). …………………………......53
Figure 3-3. DSC thermograms of BG, CoQ10, iBG and physical mixture (PM, 4% CoQ10) at
the heating rate of 10 oC/min. ……………………………………………………………...55
Figure 3-4. XRD spectra of BG, CoQ10, iBG and physical mixture (PM, 4% CoQ10)..............56
Figure 3-5. XRD spectra of 1% and 2% physical mixtures (PM) and lichenase-digested iBG....56
Figure 3-6. Total color difference (∆E), yellowness index (YI) and whiteness index (WI) of BG
and iBG in (A) powder form and (B) 0.2% (w/v) solution. Bars for each parameter with
different letters are significantly different at p<0.05. …………………………………...…58
Figure 3-7. Viscosity at 4 oC as a function of shear rate. Data were presented as mean values and
error bars based on duplicate measurements. …………………………...........................…60
Figure 3-8. Viscosity at 25 oC as a function of shear rate. Data were presented as mean values
and error bars based on duplicate measurements. ………………………….........................60
Figure 3-9. Viscosity at 50 s-1as a function of temperature. Data were presented as mean values
and error bars based on duplicate measurements. ………………………….........................63
Figure 4-1. Protocol for the laboratory scale preparation of 1 L orange-flavored functional
beverage containing 0.2% (w/v) BG or iBG. ………………………………………………70
Figure 4-2. Visual comparison between the laboratory-scale orange-flavored beverage without
BG/iBG and Vitaminwater®.……………………………………........................................79
Figure 4-3. Viscosity of beverages prepared with 0.15% (∆), 0.2% (O) and 0.3% ( ) BG (blue)
or iBG (yellow) as a function of shear rate at (A) 25oC, with citric acid; (B) 25oC, without
citric acid; (C) 4oC, with citric acid; (D) 4oC, without citric acid. ……...............................81

xii
Figure 4-4. Viscosity of beverages prepared with 0.15% (∆), 0.2% (O) and 0.3% ( ) BG (blue)
or iBG (yellow) as a function of temperature, at a shear rate of 50 s-1 (A) with citric acid; (B)
without citric acid……………………………………..........................................................82
Figure 4-5. Helium ion microscopy images of food-grade iBG. Scale bars represent (A) 500 nm
and (B) 200 nm.………………………………………………………….....………………83
Figure 4-6. Total color difference (∆E) and yellowness index (YI) of beverage samples prepared
with 0.2% (w/v) BG and iBG (p>0.05).……………………………………………………........84
Figure 4-7. Principal component analysis (PCA) of the data of ideal product (green),
Vitaminwater® (blue), 0% iBG beverage (red) and 0.2% iBG beverage (black), in terms of
(A) individual description with individual scores (•) and means ( ); (B) confidence ellipses
of mean points; and (C) variable factor map.……………………………………………....91
Figure 4-8. Frequency distribution of overall acceptability difference for consumer panel scores
(on a 9-point hedonic scale) for beverages with 0.2% (w/v) iBG and 0% iBG. The
difference was calculated as “post-information acceptance” minus “pre-information
acceptance”. Positive values=like more; zero=no change; negative values=like less..…….93
Figure 4-9. Sensory profiles of the beverage samples and ideal product. Means of 47 evaluations.
* indicates statistically significant difference p<0.05............................................................96
Figure B-1. Panel performance sorted by product p-value. …………………………………...147
Figure C-1. Principal component analysis (PCA) on (A) individual description with individual
scores (•) and means ( ); (B) confidence ellipses of mean points; and (C) variable factor
map.…..................................................................................................................................151

xiii
List of Abbreviations
A Absorbance
a Hunter color index a, red-green
ANOVA Analysis of variance
ATP Adenosine triphosphate
b Hunter color index b, blue -yellow
BG Beta-glucan produced by the pressurized gas-expanded liquid technology
CO2 Carbon dioxide
CoQ10 Coenzyme Q10
DSC Differential scanning calorimeter
DP3 (1,4)-beta-linked cellotriosyl
DP4 (1,4)-beta-linked cellotetraosyl
EE Entrapment efficiency
ESI Electron spray ionization
FT-IR Fourier Transform Infrared spectrophotometry
Glc D-glucopyranosyl residues
HBG High viscosity oat beta-glucan
HiM Helium ion microscopy
HPLC High-performance liquid chromatography
iBG CoQ10 impregnated beta-glucan
IPM Ideal profile method
L Hunter color index L, lightness
m Mass
MW Molecular weight
PCA Principal component analysis
PGX Pressurized gas-expanded liquid
SCCO2 Supercritical carbon dioxide
SCF Supercritical fluid
SD Standard deviation
T Temperature
UV Ultraviolet light
V Volume
WI Whiteness index
XRD X-Ray diffraction
YI Yellowness index
𝜌 Density
𝜂 Viscosity
1
Chapter 1: Introduction and objectives
Supercritical fluid (SCF) is a pure component (i.e. carbon dioxide, nitrogen, ethanol or
others) that is heated above its critical temperature and compressed to a pressure above its
critical pressure but below the pressure needed for solidification. Under these conditions, a SCF
has no surface tension, enhanced mass transfer, liquid-like density and gas-like diffusivity and
viscosity. SCF technology, known as an environmentally friendly process, has been studied over
the past decades to extract high-value components at mild conditions, and to generate
micro/nano-meter sized particles for pharmaceutical and food applications. Pressurized
gas-expanded liquid (PGX) technology invented by Temelli and Seifried (2016) is a SCF
technique to produce micro/nano-particles, agglomerates and fibers from an aqueous biopolymer
solution of a high molecular weight (MW=70,000 Da to over 1,000,000 Da) biopolymer, and can
encapsulate or impregnate bioactive components into the agglomerates or onto the
micro/nano-particles, which includes the step of spraying a mixture of the aqueous solution,
compressible gas and a water-soluble co-solvent/antisolvent (i.e. ethanol, acetone or isopropanol)
into a pre-pressurized chamber.
The biopolymer investigated in this research was beta-glucan, which is a soluble dietary
fiber component found in common cereals including oats (3-8 g per 100 g dry weight) and barley
(2-20 g per 100 g dry weight) (Wood and Beer, 1998). This polysaccharide plays an important
role in health promotion and prevention of diseases, focusing on the normalization of the gut
microbial compositions, regulation of blood cholesterol levels and blood pressure, attenuation of

2
blood postprandial glycemic and insulinemic responses, prevention of central obesity, and
promotion of skin health (Pins and Kaur, 2006; Aleixandre and Miguel, 2008; Khoury et al.,
2012; Daou and Zhang, 2012; Du et al., 2014a). The daily amount of 3 g oat beta-glucan was
recommended by Health Canada in 2010 to support healthy glucose metabolism and reduce the
risk of coronary heart disease (Health Canada, 2010). However, earlier in 1997, the Food and
Drug Administration (FDA) of the United States claimed that oat products containing 0.75 g of
beta-glucan per serving may reduce the risk of heart disease (Federal Register, 1997).
The bioactive material studied in this research was Coenzyme Q10 (CoQ10), which is a
natural antioxidant present in both animal and plant cellular membranes. Pure CoQ10 is an
orange crystalline powder, which is sensitive to environmental conditions including light,
oxygen and heat. It functions as an electron carrier and proton transporter to generate a proton
gradient in the mitochondrial ATP synthesis, and consequently plays an important role in energy
generation in the body (Mitchell, 1990; Turunen et al., 2004). The daily dosage of 30 to 100 mg
recommended by Health Canada is claimed to maintain cardiovascular health (Health Canada,
2007). However, due to its lipophilicity and high molecular weight, CoQ10 is insoluble in water,
which limits the fortification of aqueous foods. Recently, liposomal aggregation, 𝜅-carrageenan
coated oil-in-water emulsion, maize starch dispersion and nano-encapsulation with octenyl
succinic anhydride modified starch have been successfully applied to increase the water
solubility of CoQ10 (Xia et al., 2006; Chan et al., 2013; Yoon et al., 2014; Cheuk et al., 2015).

3
But these products were all generated in liquid form, which could lead to problems upon
long-term storage, transportation and aqueous food applications.
PGX technology could be an alternative to impregnate CoQ10 on beta-glucan at mild
conditions and generate ingredients in powder form. The properties of micro/nanoparticles or
agglomerates produced by the PGX technology includes large surface area, low bulk density and
high porosity, which may promote easier handling and dispersion, and faster dissolution in water,
compared to the powder of the same material(s) produced by conventional methods like spray
drying or freeze drying. However, the literature lacks information on the characteristics of
CoQ10-impregnated beta-glucan particles and its potential product applications. Therefore, the
overall goal of this thesis research was to: i) characterize the physicochemical properties of the
beta-glucan powder (BG) and CoQ10-impregnated BG powder (iBG) produced by the PGX
technology, and ii) to develop an appealing and nutritious prototype functional drink formulation
based on iBG.
To achieve this main objective, the specific objectives were:
i) to determine the properties of BG powder and iBG powder generated by the PGX
technology, in terms of morphology, impregnation yield, melting behavior,
crystallinity, viscosity, surface area and pore size (Chapter 3); and
ii) to evaluate the overall acceptance of the functional beverage formulated with iBG
using trained and consumer panels (Chapter 4).

4
Chapter 2: Literature review
2.1 Beta-glucan
2.1.1 Sources and structure
Beta-glucan is a non-digestible glucose polymer, originating from the cell walls of
mushrooms, algae, bacteria and some commercially important cereals, such as oat, barley, rye
and wheat (Lazaridou and Biliaderis, 2007; Iorio et al., 2008). The fungal and microbial glucans
are mostly water-insoluble (Iorio et al., 2008). Mushroom is low in dry matter content, but a
great source of beta-glucan. Beta-glucan content of mushrooms varies widely from 7.8 g to 60.8
g per 100 g dry weight, depending on the species (Sari et al., 2017). Beta-glucan content (g per
100 g dry weight) of common cereals generally ranges from 0.13 g in rice, 0.5-1.0 g in wheat,
0.8-1.7 g in maize, 1.3-2.7 g in rye and 1.1-6.2 g in sorghum, to 3-8 g (82% is water-soluble
fraction) in oats and 2-20 g (65% is water-soluble fraction) in barley (Wood and Beer, 1998;
Skendi et al., 2003; Ragaee et al., 2008; Bacic et al., 2009). Herrera et al. (2016) found that the
beta-glucan content of oats was influenced by the oat cultivar, growing location and the
interaction between cultivar and location, although the latter two factors had a minimal effect.
They evaluated eight oat cultivars including Derby (4.37% w/w), Furlong (4.59% w/w), CDC
Dancer (4.68% w/w), Morgan (4.71% w/w), Jordan (5.03% w/w), Leggett (5.25% w/w), SW
Betania (5.39% w/w) and HiFi (5.82% w/w) grown in Canada, and indicated that growing
location, oat cultivar, and their interaction also significantly affected the beta-glucan solubility
and viscosity (Herrera et al., 2016).
5
In oats, beta-glucan is mainly present in the aleurone layers, while it is more uniformly
distributed in the barley endosperm. On the contrary, the highest concentration of beta-glucan
that can be found in wheat is located in the subaleurone layer, and the remaining small amount is
distributed in the starchy endosperm (Izydorczyk et al., 2000; Lazaridou and Biliaderis, 2007).
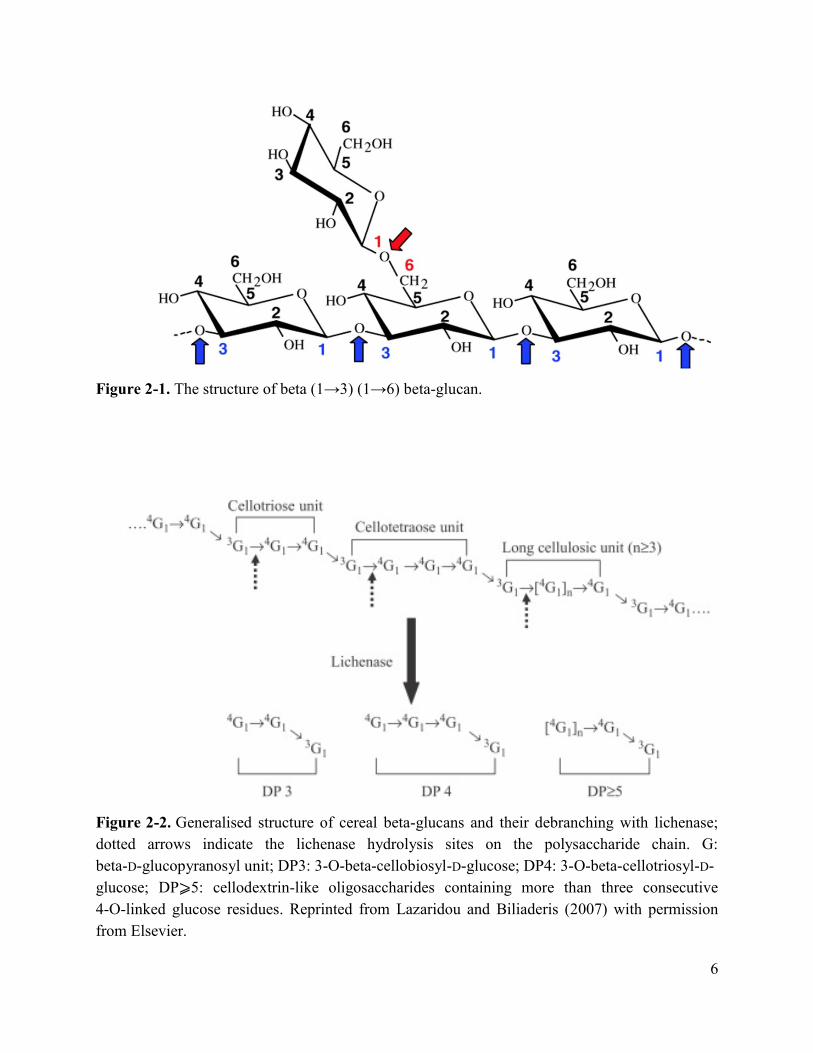
Beta-glucans from different sources have different structures. Beta-glucans derived from baker’s
yeast or mushrooms are polysaccharides of D-glucose residues linked via mixed beta-(1,3) and
(1,6) linkages (Fig. 2-1). However, cereal beta-glucan is a linear homopolysaccharide comprised
of D-glucopyranosyl residues (Glc) linked by a mixture of beta-(1,3) and beta-(1,4) linkages
(Herrera et al., 2016). Unlike cellulose, which is made of beta-(1,4) linked D-glucose units,
beta-glucan is composed of (1,3)-linked cellotriosyl (DP3) and cellotetraosyl (DP4) segments
(Fig. 2-2). On average, the beta-(1,4) linkages are present in sequences of 2 or 3, resulting in the
oligomeric cellulose units, whereas the beta-(1,3) linkages only occur singly in a molecule.
Nevertheless, longer units linked via beta-(1,4) linkages of up to 14 glucosyl units still exist
occasionally (Cui, 2001; Wood, 2001; Skendi et al., 2003). Particularly, some previous research
point out that wheat (3.0-3.8) has the highest ratio of DP3 to DP4, followed by barley (2.8-3.4)
and then oats (2.1-2.4), and they also predict that the longer sequences of beta-(1,4) linkages
would decrease the water-solubility of beta-glucan due to the intermolecular interactions
(Woodward et al., 1983; Cui and Wood, 2000; Wood, 2011).
6
Figure 2-1. The structure of beta (1→3) (1→6) beta-glucan.
Figure 2-2. Generalised structure of cereal beta-glucans and their debranching with lichenase;
dotted arrows indicate the lichenase hydrolysis sites on the polysaccharide chain. G:
beta-D-glucopyranosyl unit; DP3: 3-O-beta-cellobiosyl-D-glucose; DP4: 3-O-beta-cellotriosyl-D-
glucose; DP⩾5: cellodextrin-like oligosaccharides containing more than three consecutive
4-O-linked glucose residues. Reprinted from Lazaridou and Biliaderis (2007) with permission
from Elsevier.

7
2.1.2 Extraction of beta-glucan
To break the cell-wall structure and release the beta-glucan, there are two major techniques
that are commonly employed: dry and wet separation processes. In dry methods, grain meal from
dry milling or flour from dry milling and sieving is air-classified, based on the size and density
differences between particles. The beta-glucan content of the fiber concentrate obtained was as
high as 30% by adjusting the feed rate, air flow rate and classifier wheel speed (Vasanthan and
Bhatty, 1995; Vasanthan and Temelli, 2008). Although dry separation processes are widely
applied in the industry due to their simplicity, reasonable cost and avoidance of applying
solvents, the beta-glucan yield of less than 30% (w/w, on dry weight basis) is relatively low
(Vasanthan and Bhatty, 1995; Hu et al., 2015). The high lipid content of oat was believed to be
the main reason for dry processes to be unable to yield highly concentrated beta-glucan fractions,
because lipids could agglomerate oat meal and clog the screens during the sieving step
(Vasanthan and Temelli, 2008). In addition, around 65% of the lipids is recovered in the bran
fractions (Doehlert and Moore, 1997). In order to remove the lipid, Sibakov et al. (2011) used
supercritical carbon dioxide (SCCO2) to produce defatted oats, which were then used as the raw
material for the subsequent fine milling and air classification operations. The highest beta-glucan
concentration in the cell wall-enriched fraction was 33.9%, which was almost double that
obtained without lipid removal (17.1%). The lipid removal with SCCO2 performed by Sibakov et
al. (2011) enhanced the separation of oat beta-glucan, but highly concentrated beta-glucan
fractions still could not be obtained by conventional dry separation processes.

8
In order to increase the concentration of beta-glucan, wet separation processing was
developed by Wood et al. (1989) who obtained an oat gum containing 78% beta-glucan by
extracting it with sodium carbonate at pH 10. Generally, beta-glucan could be concentrated by
solubilizing it in water or separating it in a solvent system that contains water and alcohol, which
are also referred to as aqueous solvent system and semi-alcoholic solvent system, respectively.
Unlike water in which beta-glucan is solubilized, alcohol concentration in the semi-alcoholic
solvent system is usually kept high to make sure beta-glucan remains insoluble and stays within
the cell wall, while other components, such as starch, protein and lipid, are removed. Extraction
and purification techniques of beta-glucan from various sources, such as barley, oat and yeast,
were reviewed by Vasanthan and Temelli (2008) and Ahmad et al. (2012). Also, US patents
issued on beta-glucan production technologies were provided by Zhu et al. (2016).
Four basic steps are generally included in the wet separation processes: i) inactivation of
endogenous enzymes (cellulase and beta-glucanase) by ethanol refluxing or thermal treatment; ii)
extraction of beta-glucan by solubilizing in hot water or alkaline solutions; iii) separation of the
dissolved proteins by adding acids to achieve isoelectric precipitation; iv) precipitation of the
beta-glucan by ammonium sulfate, 2-propanol, ethanol, heating or freezing-thawing (Wood et al.,
1978; Wood et al., 1989; Potter et al., 2016; Morgan, 2016; Vasanthan and Temelli, 2008; Zhu et
al., 2016). Cellulase and beta-glucanase are responsible for the degradation of beta-glucan,
resulting in the decrease of its molecular weight and in turn its viscosity, which is a critical
parameter for beta-glucan health benefits. Additionally, lipase is naturally present within oats,

9
which leads to development of rancidity. Therefore, steaming and kiln drying are commonly
applied in the industry to inactivate those endogenous enzymes. Refluxing with ethanol is also
usually used to decrease enzyme activity, but such a step adds to the processing cost (Burkus and
Temelli, 1998). However, endo-(1-3)-beta-D-glucanase is stable at 60 oC for 40 min, so the
treatment temperature is usually set above 60 oC, which is the gelatinisation temperature of
starch (Ballance and Meredith, 1976; Burkus and Temelli, 1998), and thus, starch polymers
could be co-extracted with beta-glucan at temperatures above 60 oC. In order to minimize the
amount of starch, mild extraction conditions are employed or thermostable alpha-amylase is
applied to digest starch.
The effect of extraction conditions on beta-glucan recovery and functionality has been studied
extensively. A positive relationship between temperature and beta-glucan content was found by
Temelli (1997) who investigated the effect of temperature (40-55 oC) and pH (7-10) on
beta-glucan recovery by alkaline extraction and its functional properties. The optimal extraction
condition was found to be pH 7.0 and 55 oC, under which 86.5% of the beta-glucan was
recovered with 89.1% purity, maximum emulsion stability and viscosity. The method described
by Temelli (1997) was also studied by Limberger-Bayer et al. (2014); however, the maximum
beta-glucan concentration obtained was 53.4% with mainly starch and protein as impurities.
Other than temperature and pH, Benito-Román et al. (2011) also identified extraction time,
particle size, stirring rate and solvent:flour ratio as the critical parameters that affect the
extraction of beta-glucan from barley, and they obtained the highest extraction yield of 73.4% at

10
55 oC, pH close to neutrality, particle size of 100 𝜇m, solvent:flour ratio of 5, stirring rate at
1000 rpm and extraction time of 3 h.
In order to minimize the degradation of beta-glucan under the alkaline, acidic and hot water
extraction conditions, a new fractionation technology based on the use of enzymes in aqueous
ethanol medium was introduced by Vasanthan and Temelli (2009). This method concentrates
beta-glucan by enzymatically digesting the other grain components, and thus beta-glucan with its
native structural characteristics can be obtained (Ghotra et al., 2008). Enzymatic extraction
methods were also studied by Irakli et al. (2004) to isolate beta-glucan from different Greek
barley cultivars by applying termamyl and pancreatin. Beta-glucan with a purity of more than 93%
on dry basis was obtained with water extraction at 47 oC, enzymatic removal of protein and
starch and precipitation with ammonium sulfate saturation. Compared to the alkaline and acidic
extractions, enzymatic extraction was found to be the best method, resulting in the high yield,
removal of more starch, fat and pentosans, and producing beta-glucan with good water binding
capacity, viscosity and whippability properties (Ahmad et al., 2010). Relatively less starch and
protein impurities remaining after enzymatic extraction was also observed by Ahmad et al.
(2009). However, hot water extraction resulted in higher yield and recovery of beta-glucan, when
it was included for comparison.
New fractionation methods for beta-glucan isolation have been under development over the
past decade. Accelerated solvent extraction (ASE) was applied to extract beta-glucan from the
bran of hull-less barley, and the extraction yield of 16% was obtained at 70 oC and 10 MPa in

11
just 9 min (Du et al., 2014b). A high purity beta-glucan concentrate (greater than 70%) was
extracted by the combination of ultrasound-assisted extraction, enzymatic hydrolysis and
diafiltration (Benito-Román et al., 2014). Moreover, a high molecular weight beta-glucan (up to
500 kDa) with 52.4% yield was generated in a fixed-bed extractor using pressurized hot water as
solvent at 155 oC, 2 MPa and a flow rate of 4 g/min (Benito-Román et al., 2013). Recently,
Benito-Román et al. (2016) added supercritical carbon dioxide (SCCO2) (8.5 MPa) to the
pressurized hot water (155 oC; 1 mL/min water; a solvent-to-solid ratio of 40 mL/g) throughout
the extraction of beta-glucan from Ganoderma lucidum. The addition of SCCO2 enhanced the
extraction yield of beta-glucan, which was calculated as beta-glucan content of liquid extract
divided by that in G. lucidum, up to 72.5% (w/w).
2.1.3 Physicochemical properties
The physicochemical properties of cereal beta-glucans, in particular molecular weight,
molecular structure (i.e. the ratio of DP3 to DP4) and rheological characteristics, including
gelling capacity and viscosity in water solution have been investigated extensively in the past
decades (Lazaridou and Biliaderis, 2007). The molecular weight (MW) of beta-glucan was found
to be positively correlated with viscosity, which contributes to its physiological benefits like
lowering of serum cholesterol or glucose (Varum and Smidsrod, 1988; Wood et al., 1994).
Recently, beta-glucan with a higher molecular weight or increased viscosity was shown to have a
better alleviating effect on hyperlipidemia and oxidative stress of diabetic mice (Zhao et al.,

12
2014). Therefore, investigation of the physicochemical properties of beta-glucan is needed to
obtain a better understanding of its behavior under physiological conditions.
Beta-glucans from different sources apparently vary in terms of their molecular weight and
structure. The average MW of beta-glucan extracted from oat, wheat and barley was reported as
172 kDa, 635 kDa and 742 kDa, respectively (Zhao et al., 2014). Due to the relatively higher
MW, wheat and barley beta-glucan showed shear thinning behavior, and barley beta-glucan had
the highest viscosity. Wheat beta-glucan with the highest value of DP3: DP4 ratio had no gelling
property at the concentration of 5% (w/v) due to its lower MW, but barley beta-glucan at the
same concentration formed a weak gel (Zhao et al., 2014). However, beta-glucan with a higher
MW of up to 239 kDa did not show any tendency to form a gel, but lower MW beta-glucan with
short chains had a better gelation property due to its higher mobility and greater possibility of
forming junctions with neighboring chains (Doublier and Wood, 1995; Li et al., 2006). Also,
shorter gelation time and higher gelation rate were observed for the low molecular weight oat
beta-glucan (Skendi et al., 2003).
Shear-thinning behavior and gelling capacity are also highly dependent on the concentration
of beta-glucan. As the concentration increases, the gelation rate increases (Skendi et al., 2003).
Beta-glucan solution at the low concentration of 0.2-3% showed shear-thinning behavior, while
at a higher concentration, it was more likely to form a gel (Cui, 2001; Lazaridou et al., 2003).
The effect of beta-glucan concentration on gel behavior was also examined by Burkus and
Temelli (1999), reporting that beta-glucan concentrates extracted from non-waxy Condor and
13
waxy barley gelled at the concentration of ≥ 5% (w/w) and gel strength increased as
concentration increased. Furthermore, Mikkelsen et al. (2010) and Ryu et al. (2012) compared
the properties of beta-glucans from barley and oat. Both of these studies reported that at the same
concentration, the viscosity of oat beta-glucan was much higher (~100 fold) than that of barley
beta-glucan due to the higher MW, and suggested that MW and molecular structure would be the
major contributors to the rheological properties of beta-glucan. Different from what was
observed by Zhao et al. (2014), Mikkelsen et al. (2010) characterized barley beta-glucan with the
molecular weight of 126 kDa as a low-viscosity beta-glucan showing Newtonian flow behavior,
while oat beta-glucan with the molecular weight of 355 kDa as a high-viscosity beta-glucan with
shear-thinning flow behavior. However, identical lower molecular weight of 98.4-99.2 kDa was
found for both barley and oat beta-glucan by Ryu et al. (2012), who also observed a strong
shear-thinning behavior for all barley and oat beta-glucans. Within the oat group, cultivar played
an important role on the rheological properties of beta-glucan, especially the rate of viscosity
increase with concentration. Five new oat cultivars with increased beta-glucan concentrations
(6-7.8% dry basis) and one traditional cultivar with 4.4% beta-glucan were evaluated by
Colleoni-Sirghie et al. (2003). They found that beta-glucan from the traditional line had a low
MW, leading to less entanglement with an increase in concentration, which consequently had the
least sensitivity to the changes in concentration. In contrast, new cultivars with increased
beta-glucan concentrations produced high-MW beta-glucan, which could form a more viscous
solution than the traditional oat beta-glucan at the same concentration (Colleoni-Sirghie et al.,
14
2003). Therefore, evaluation of the viscosity of beta-glucans from different cultivars could be
used as a criterion for selecting new oat cultivars.
Pre-preparation, extraction process and food production process would affect molecular,
structural and functional properties (i.e. viscosity, water binding capacity and solubility) of
beta-glucan, leading to changes in the sensory attributes of the food products it is incorporated
into as well as the physiological benefits of beta-glucan. Firstly, the impact of extraction methods
of beta-glucan including acidic, alkaline and enzymatic processes on the physicochemical
properties needs to be considered. Ahmad et al. (2010) indicated that among the three methods,
acidic extraction could produce beta-glucan with the highest water binding capacity, while the
enzymatic method could result in an increase in viscosity. Both alkaline and acidic extraction
methods reduced the whippability and viscosity of the extracted beta-glucan gum, because
extreme pH can cause an unfavorable effect on the molecular structure, especially on the
beta-(1,3) linkages. Panahi et al. (2007) compared the beta-glucans concentrated using aqueous
and enzymatic methods, and reported that the viscosity of beta-glucan was highly preserved by
the enzymatic method, which improved postprandial glycemic control when incorporated into a
fiber drink.
Extrusion cooking of hull-less barley using a twin-screw extruder increased the water
solubility index of beta-glucan, when the feed moisture was decreased or the extrusion
temperature was increased. The highest water binding capacity was found after high temperature
and high moisture extrusion (180 oC, 20% moisture) (Sharma and Gujral, 2013). Therefore, the

15
enhancement of the extractability of beta-glucan by extrusion cooking is mainly due to the
significant increase in its water solubility. However, the main concern regarding extrusion
cooking is the viscosity decrease caused by the shear force and the high extrusion temperature
(150-180 oC). In bread baking, increased mixing and fermentation time could result in decreased
molecular weight of beta-glucan without affecting the DP3-to-DP4 ratio (Andersson et al., 2004).
However, molecular weight was not affected by the fermentation with lactic acid bacteria, but a
decrease in the beta-glucan content and maximum viscosity were observed by Lambo et al.
(2005). Also, solubilizing beta-glucan prior to dough formulation was found to decrease its
solubility and viscosity by Moriartey et al. (2011), who also recommended to bake the dough at a
temperature as high as possible to ensure adequate beta-glucan solubility to confer health
benefits. Furthermore, the molecular weight, solubility and viscosity of beta-glucan in oat bran
bread could be stable for 3 days at room temperature (Gamel et al., 2013). When the same bread
was frozen at -80oC, the viscosity of extracted beta-glucan significantly decreased, due to the
decrease in solubility, but no change was observed on the molecular weight. The decline in the
solubility of beta-glucan upon frozen storage was also observed by Beer et al. (1997) who
evaluated the effects of cooking and storage on the amount and molecular weight of beta-glucan
extracted from oat bran, oat bran muffins and oat porridge. Beer et al. (1997) explained that as
the water crystallizes, beta-glucan is concentrated and retreats to the cell wall with extensive
hydrogen bonding, resulting in the decrease in its solubility. Gamel et al. (2013) also suggested
that liquid nitrogen could be used to freeze oat bran bread and porridge for shipping and storage
16
purposes, because this method did not significantly change the viscosity, so that the
physiological benefits of beta-glucan would be maintained; however, the cost of such a treatment
should also be taken into consideration.
2.1.4 Health benefits
Beta-glucans, particularly from barley and oat play an important role in health promotion and
prevention of diseases. As a dietary fiber component, beta-glucan cannot be digested in the
human body, so it can be used as a prebiotic helping the modulation of the gut microbial
composition. Additionally, beta-glucan is able to lower blood cholesterol levels and blood
pressure, attenuate blood postprandial glycemic and insulinemic responses, reduce the risk of
cardiovascular diseases and cancer, stimulate immune functions, regulate appetite, prevent
abdominal obesity, and promote skin health, and such health benefits of beta-glucan have been
reviewed recently (Pins and Kaur, 2006; Aleixandre and Miguel, 2008; Khoury et al., 2012;
Daou and Zhang, 2012; Du et al., 2014a).
Dietary beta-glucan could prevent central obesity, but the mechanism is still unclear. One
possible mechanism could be associated with the effect of beta-glucan intake on appetite. After
the intake of beta-glucan, the viscosity of the gastrointestinal chime would be increased, which
delays gastric emptying and reduces enzymatic activity and mucosal absorption, thus slows
down the absorption of glucose. These physiological effects could lead to early satiety sensations,
which helps to decrease the overall energy intake (Jenkins et al., 1978; Isaksson et al., 1982;

17
Marciani et al., 2001). In addition, the fermentation of beta-glucan in caecum and colon could
produce short-chain fatty acids, which are responsible for appetite regulation (Cummings et al.,
1987; Topping and Clifton, 2001). The effect on appetite largely depends on the
physicochemical properties of beta-glucan, intake dosage and carrier food form. Beverages with
2.5 g or 5 g of oat beta-glucan significantly increased the feeling of satiety (Lyly et al., 2009;
Lyly et al., 2010). Increased postprandial satiety was also reported for the beverages with 1.2%
w/v barley beta-glucan or 1.6% w/w oat bran (Lumaga et al., 2012; Pentikainen et al., 2014).
However, no significant effect on satiety or gastric emptying was observed with beta-glucan
enriched meal replacement bars, hot cereal with yogurt or muffins (Kim et al., 2006; Peters et al.,
2009; Willis et al., 2009). Kirkmeyer and Mattes (2000) and Khoury et al. (2012) explained that
solid or semi-solid foods may mask the satiating potential of beta-glucan, because compared to
liquid foods, solid or semi-solid foods could decrease hunger and increase satiety more
effectively.
Consumption of beta-glucan could lower fasting and postprandial glucose and insulin
response, which was attributed to its viscosity and fermentability. Beta-glucan can increase the
viscosity of digesta, which slows down enzyme diffusion and increasing the thickness of the
unstirred water layer adjacent to the mucosa, thus decreasing glucose transport to enterocytes
(Jenkins et al., 1978). On the other hand, short chain fatty acids produced by fermentation of
beta-glucan in the colon are also responsible for a decrease in postprandial plasma glucose and
insulin.

18
The dose of beta-glucan resulting in significant effects varies depending on the subjects. For
example, on type 2 diabetic patients, addition of 6.2 g beta-glucan in a bar, 7.3 g in a breakfast
cereal and 9.4 g in flour significantly decreased the peak and average increases in glucose and
insulin after consumption (Jenkins et al., 2002; Tapola et al., 2005). However, for healthy
individuals, incorporation of 1.5, 3 and 6 g of beta-glucan into snack bars did not show any
additional glucose-lowering benefits, compared to the control snack bar containing 11.9 g total
dietary fiber but 0 g beta-glucan (Panahi et al., 2014). In hypertensive individuals, consumption
of oat cereals containing 7.7 g beta-glucan for 12 weeks significantly lowered fasting insulin,
while no decrease was observed with oat cereals containing 5.5 g beta-glucan (Davy et al., 2002;
Maki et al., 2007). Moreover, 5 g oat beta-glucan per day over a 5-week period and 10 g barley
beta-glucan could improve postprandial glycemic and insulin responses in hypercholesterolemic
individuals and obese women, respectively (Biorklund et al., 2005; Kim et al., 2009). However,
only 4 g of oat beta-glucan was sufficient for healthy subjects to decrease their levels of glucose
and insulin (Granfeldt et al., 2008; Hlebowicz et al., 2008). In addition, the carrier food form also
plays an important role in glycemic regulation by beta-glucan. Low glycemic foods like rye
bread or wheat pasta did not significantly lower postprandial glucose level, because these foods
already have a very low glycemic response, which could attenuate the effect of beta-glucan on
the postprandial glycemic response (Holm et al., 1992; Juntunen et al., 2002). Similar to the
effect of beta-glucan on appetite regulation, beverages would be the best form for the delivery of
beta-glucan to achieve the physiological benefits.
19
Beta-glucan is a dietary fiber component responsible for lowering serum cholesterol, and
thus decreasing the risk of cardiovascular disease. Daily consumption of 5 g significantly
decreases the serum total and low-density lipoprotein (LDL) cholesterol levels (Naumann et al.,
2006; Theuwissen and Mensink, 2007). There are two main probable mechanisms: 1) increased
viscosity of digesta could entrap whole micelles containing bile acids by forming a gel-like
network, consequently increasing the bile acid excretion, which may have led to an induction of
the cholesterol-7-alpha-hydrolase gene, thus lowering the reabsorption of bile acids and
accelerating the transportation to the large intestine; and 2) propionate produced by the
fermentation of beta-glucan in the colon could inhibit cholesterol synthesis (Zhang et al., 1992;
Amaral et al., 1992; Goel et al., 1999; Khoury et al., 2012). Serum cholesterol reduction was
reported with the consumption of muffins, cereals, shakes, beverage, bread and ready-meal soup
containing 2 to 6 g beta-glucan (Davidson et al., 1991; Biorklund et al., 2005; Reyna-Villasmil et
al., 2007; Biorklund and Holm, 2008). However, soup containing 3.5 g of oat beta-glucan and
daily consumption of 8.1-11.9 g barley beta-glucan did not show any effect on lowering serum
cholesterol levels (Keogh et al., 2003; Cugnet-Anceau et al., 2010). This could be due to the
different physicochemical properties, especially MW of beta-glucan obtained from various
sources.
The skin health effects of beta-glucan were recently reviewed by Du et al. (2014a). They
found that beta-glucan could contribute to antioxidant activity, anti-wrinkle activity,
anti-ultraviolet light, wound healing, moisturizing effect and skin permeation absorption.
20
However, beta-glucans with these functions were mostly from mushrooms, yeast and fungus.
Only oat beta-glucan was shown to reduce wrinkle depth and height and overall skin roughness
after an 8-week treatment (Pilai et al., 2005a; 2005b).
2.1.5 Applications in food
Concentrated beta-glucans from different cereals have been commercially produced, such as
“Oatrim” (oat beta-glucan concentrate), “Nutrim” (barley beta-glucan concentrate) and “Ricetrim”
(soluble fibers obtained by co-processing rice bran and barley flour) (Hallfrisch and Behall, 1997;
Inglett, 2000; Hallfrisch et al., 2003; Inglett et al., 2004). Other commercially available
beta-glucan products were reviewed by Zhu et al. (2016). A daily dose of 3 g oat beta-glucan is
recommended by Health Canada to help reduce cholesterol, support healthy glucose metabolism
and maintain a healthy digestive system (Health Canada, 2010). In order to reach the daily
amount, beta-glucan has been incorporated into breakfast cereals, pasta, noodles and bakery
products including muffins, bread, cake and cookies. Additionally, due to its functional
properties such as thickening, stabilizing, emulsification and gelation, beta-glucan has been also
added into reduced-fat dairy and meat products, beverages, salad dressings and soups. In bread
making, incorporation of beta-glucan could result in reduced loaf volume and increased firmness,
because large amounts of water could be bound by beta-glucan and the remaining amount of
water is not enough for the development of gluten network (Pomeranz et al., 1977). However,
this can be overcome by adding gluten and extra water into the formulation (Moriartey et al.,

21
2011). Moreover, beta-glucan can be used as a fat replacer owing to its high apparent viscosity,
water holding capacity and emulsion stabilizing property. Barley beta-glucan was incorporated
into reduced-fat breakfast sausages by Morin et al. (2002), who reported that the sausage product
containing 0.3% (w/w) beta-glucan was comparable to the high-fat control, which is in
agreement with Hughes et al. (1997), who studied the incorporation of oat beta-glucan into
low-fat frankfurters. Thammakiti et al. (2004) used beta-glucan from brewer’s yeast as a fat
replacer in mayonnaise, and finally, they produced reduced fat mayonnaise with low energy
content, high water content, but pale and dense appearance. However, such studies on cereal
beta-glucans are limited. Recently, oat beta-glucan was used as a partial salt replacer in high
pressure processed (400-600 MPa, 40 oC) chicken breast meat to generate a gel-type product
with desired structure (Omana et al., 2011). The color and gel hardness of samples with
beta-glucan were comparable to those of NaCl containing samples, and chicken meat with
beta-glucan had lower lipid oxidation levels, which were due to the water binding capacity of
beta-glucan. In addition, an orange juice containing 0.25-2% (w/w) oat beta-glucan was
developed by Lyly et al. (2003), and 0.3-0.7% (w/w) barley beta-glucan was incorporated into an
orange-flavored beverage by Temelli et al. (2004). A reduced serum concentration of total and
LDL cholesterol was observed by Naumanaa et al. (2006) who incorporated 5 g oat beta-glucan
into an apple/pear fruit drink (250 mL). More examples of cereal beta-glucan applied in food and
beverage products are listed in Table 2-1.

22
Table 2-1. Beta-glucan incorporation into various food and beverage products.
Type Product Effect along with health benefits Reference
Oat Chocolate
breakfast flakes
Decrease water activity;
Prolong durability;
Protect a gut-friendly probiotic bacteria
Saarela et al.
(2006)
Oat Breakfast bar No negative effect on sensory properties Jenkins et al.
(2002)
Barley Bread No negative effect on sensory
properties;
Reduced starch breakdown
Cavallero et al.
(2002);
Symons and
Brennan
(2004)
Oat Bread Improved crust color, softness and taste;
Increased firmness of the bread crumb
Gormley and
Morrissey
(1999);
Lazaridou et
al. (2007)
Nutrim-5
(oat)
Pasta Improved the overall strength Inglett et al.
(2005)
Nutrim (oat) Low-fat cheddar
cheeses
Softer texture;
Decreased melting time;
Lower sensory properties
Konuklar et al.
(2004)
Oat White low-fat
cheeses
Improved texture;
Negatively affected appearance, taste
and odor
Volikakis et al.
(2004)
Oat Low-fat ice
cream
Function as a fat replacer;
Increased the viscosity;
Brennan et al.
(2002)
- Low-fat yogurt Function as a fat replacer;
Increased the viscosity;
Decreased the separation of whey
Sahan et al.
(2008)
Oat Probiotic
milk-based drinks
Increased stability Angelov et al.
(2006)
Oat Milk beverage No effect on sensory properties Biorklund et
al. (2005)
Oat Beverage Increased thickness Lyly et al.
(2003)
Barley Orange-flavored
beverage
Increased viscosity Temelli et al.
(2004)

23
Table 2-1. (cont’d).
Type Product Effect along with health benefits Reference
Oat Low-fat beef
burgers
Improved cooking yield, moisture and
fat retention;
Better influence on emulsion stability,
lightness and hardness
Troy et al.
(1999);
Pinero et al.
(2008);
Álvarez and
Barbut (2013);
Oat Low-fat sausages Reduced cook loss;
Increased both water holding capacity
and emulsion stability
Hughes et al.
(1997)
Barley Reduced-fat
(12%) breakfast
sausages
Function as a fat replacer:
No significant effect on product texture
or flavor if added at the level of 0.3%
(w/w)
Morin et al.
(2002)
Oat High pressure
processed
chicken breast
Function as a partial salt replacer;
No effect on color characteristics;
Lower lipid oxidation levels
Omana et al.
(2011)
Oat Beverages;
Ready-to-eat
shrimp soup
Thicker, more extensible, grainier and
slimier;
Thicker, more powdery and slimy
Lyly et al.
(2007)
Oat Yellow alkaline
noodle
Decreased firmness, elasticity, surface
smoothness and flavor;
Inhibition of linoleic peroxidation in
noodles
Choo and Aziz
(2010)
2.2 Coenzyme Q10
2.2.1 Sources and structure
Coenzyme Q10 (CoQ10, 2,3-dimethoxy-5-methyl-6-multiprenyl-1,4-benzoquinone) is a
natural lipophilic compound that is present in all living cells in humans and most animals,

24
specifically located in the hydrophobic domain of the phospholipid bilayer of cellular
membranes (Lenaz et al., 1999). CoQ10 is a 1,4-benzoquinone linked to a polyisoprenoid side
chain consisting of 10 isoprenyl chemical subunits (MW=863.37 Da), as shown in Fig. 2-3. The
melting point of CoQ10 at atmospheric pressure is 48-51.3 oC, and it can be
spectrophotometrically measured at 275 nm (Nehilla et al., 2008; Yoon et al., 2014; Zhou et al.,
2014; Tarate and Bansal, 2015). The redox active benzoquinone ring gives three alternate redox
states of CoQ10: fully oxidized (ubiquinone), semiquinone (ubisemiquinone) and fully reduced
(ubiquinol). Therefore, CoQ10 can act as a one-electron carrier between semiquinone and
ubiquinone or ubiquinol, and as a two-electron carrier between the fully oxidized form and the
fully reduced form. This capacity contributes to its primary biochemical function to participate in
the mitochondrial electron-transfer process of cellular respiration and energy production. At the
level of mitochondria (Fig. 2-4), CoQ10 works as a mobile electron carrier that shuttles electrons
from complexes I and II to complex III, producing ubisemiquinone for the energy conservation
at coupling site 2 of the respiratory chain (Mitchell, 1975). Meanwhile, CoQ10 can regulate the
opening of transition pores on the mitochondrial membrane to counteract adenosine triphosphate
(ATP) depletion, DNA fragmentation and release of cytochrome c into the cytosol (Papucci et al.,
2003). In addition to its function in the mitochondria, other functions of CoQ10 have been
summarized by Turunen et al. (2004) and Bentinger et al. (2010), including the improvement of
endothelial dysfunction by stimulating endothelial release of nitric oxide, anti-atherosclerotic
properties like regulation of the amount of beta-2-integrin CD11b (a multiligand macrophage

25
Figure 2-3. The molecular structure of coenzyme Q10, where Q refers to the quinone ring and 10
refers to the number of subunits in its side chain.
Figure 2-4. CoQ10 acts as an electron acceptor at the level of mitochondria. ADP, adenosine
dipohosphate; Cyt c, cytochrome c; Pi, inorganic phosphate. Reprinted from Yang et al. (2015)
with permission from Elsevier.
26
receptor with recognition specificity) on the surface of blood monocytes, anti-inflammatory
effects achieved by influencing the expression of NFkB1-dependent genes and acting as
endogenous enzyme cofactor for lipid-soluble antioxidant synthesis.
Since CoQ10 is an obligatory ingredient in the formation of ATP, it can be synthesized in
the human body, and mainly found in the most active organs like heart (114 𝜇g/g), kidney (67
𝜇g/g), liver (55 𝜇g/g), muscle (40 𝜇g/g) and pancreas (33 𝜇g/g) (Kalen et al., 1989; Aberg et al.,
1992). More than 95% of the CoQ10 in the body is present in its reduced form (ubiquinol),
which can be explained by its antioxidant property; however, CoQ10 present in the lungs and
brain is predominantly in the oxidized form (Aberg et al., 1992; Challem, 2005). The amount of
CoQ10 in the body increases with age until the age of 20 years, and then gradually decreases.
Generally, the decrease would be more evident in mitochondria, rather than in the homogenate of
human tissues (Sohal and Forster, 2007). In total, there are around 2 g CoQ10 present in an adult
human body, but 0.5 g would be replaced daily by endogenous synthesis or food intake (Kalen et
al., 1989).
Various amounts of CoQ10 can be found in meats and processed meat products, fish and
shellfish, eggs, oils, cereals, pulses and their processed products like tofu and some vegetables
like parsley, but it is rarely found in most fruits and berries. An overview of the CoQ10 content
of various foods was provided by Pravst et al. (2010). CoQ10 is high in oils, meats and fishes,
due to its lipophilic property. In oils, CoQ10 amount ranges from 109 to 279 mg/kg in
commercially available oils like soybean, corn and olive oils. In meats, the highest CoQ10

27
amount could be found in pork heart (118.1-282 mg/kg), and then chicken heart (92.3-192
mg/kg), followed by beef heart (113.3 mg/kg), since heart is one of the most active organs. In
fish and shellfish, the CoO10 content is in the range of 0.3 to 148.4 mg/kg depending on the
species. Additionally, CoQ10 can be found in most dairy products like cheese, butter, yogurt and
milk, but in very low amounts ranging from 0.3 to 7.1 mg/kg. Among these dairy products,
butter is the richest source of CoQ10 (7.1 mg/kg), which is probably due to its high fat content.
For the same reason, avocado is high in CoQ10, 9.5 mg/kg, but most fruits have very low
concentration of CoQ10. Therefore, foods with high levels of fat and mitochondria can be a great
source of CoQ10. However, geographical origin should be also taken into consideration when
determining the CoQ10 content of various foods (Pravst et al., 2010).
To obtain more precise values on the CoQ10 content of various sources, analytical methods
have been under development over the past decade. In 2004, a reversed-phase high performance
liquid chromatography (HPLC) with coulometric detection method was developed for measuring
mouse tissue concentrations of reduced and oxidized CoQ10 (Tang et al., 2004). This method
was accurate, sensitive and reproducible with the detection limit from 15 𝜇g/L to 20 mg/L and
the analytical recoveries of 90-104%. Using this method, Tang et al. (2004) found that the
reduced form of CoQ10 was mostly present in mouse liver, heart and muscle tissues, while the
oxidized form was mainly present in the brain, which is comparable to previous studies. Later, a
liquid chromatography tandem mass spectrometry with electron spray ionization (ESI) method
was studied by Ruiz-Jimenez et al. (2007) to rapidly and simultaneously determine the reduced

28
and oxidized forms of CoQ10 in human serum without any alteration. This method had very low
quantification limits for oxidized (5.49 ng/mL) and reduced (15.80 ng/mL) CoQ10. By applying
this quantification method, it was shown that the ratio of reduced CoQ10 to oxidized CoQ10
could be used as a marker to evaluate the oxidative stress in healthy middle-aged women
(Ruiz-Jimenez et al., 2007). Recently, HPLC with electrochemical detection and Fourier
Transform Infrared (FT-IR) spectrophotometry were also applied to determine the CoQ10 status
in swine tissue and CoQ10 pharmaceutical formulations, respectively (Niklowitz et al., 2013;
Bunaciu et al., 2015).
2.2.2 Health benefits
CoQ10 is recommended by Health Canada for maintaining cardiovascular health and
migraine prophylaxis with the daily consumptions of 30-100 mg and 75-100 mg, respectively
(Health Canada, 2007). The physiological benefits of CoQ10 are based primarily on its
antioxidant property, which continues to attract research interest. Cardiovascular disorder is
generally considered to be a result of impaired mitochondrial function and oxidative stress.
CoQ10, an electron carrier at the level of mitochondria, could act as an antioxidant to slow down
the progression of this disease.
Oxidative stress is the damage on the basic cellular constituents like lipids, proteins and
DNA, caused by reactive oxygen species (ROS) such as superoxide radical (O2•), hydrogen
peroxide (H2O2) and hydroxyl radical (OH•), where ROS are produced by the reduction of

29
oxygen via enzymatic processes or non-enzymatic pathways (Ernster, 1993; Bentinger et al.,
2007). Generally, three main steps are involved in lipid oxidation: 1) initiation with the
production of alkyl radical (L•) and peroxyl radical (LOO•); 2) propagation with the production
of alkyl radical (L•) and lipid hydroperoxide (LOOH), which can regenerate alkoxyl radical
(LO•) and peroxyl radical (LOO•); and 3) termination with the production of a stable lipid
alcohol (LOH) (Ernster, 1993). CoQ10 in fully reduced form could effectively inhibit the
formation of lipid peroxyl radicals during initiation, producing ubisemiquinone and H2O2.
Similarly, in protein oxidation, CoQ10 works as a chain-breaking antioxidant to prevent
propagation by quenching the initiating perferryl radicals (Bentinger et al., 2007). Furthermore,
CoQ10 is also effective in preventing DNA oxidation, particularly DNA in mitochondria, by
decreasing the amount of ADP-Fe3+, which is responsible for DNA strand breaks (Ernster and
Dallner, 1995; Bentinger et al., 2007).
Oxidative stress has a significant effect on the development of myocardial structural and
functional abnormalities, and consequently influences cardiac function, by producing
renin-angiotensin-aldosterone system (RAAS) via the interaction between ROS and protein,
DNA and cell membranes (Bergamini et al., 2009; Yang et al., 2015). However, due to the effect
of the antioxidant activity on the initiation process, CoQ10 can effectively prevent the
development of diastolic dysfunction and the activation of apoptosis, and subsequently has an
alleviating effect on cardiovascular disorder (Rocha et al., 2002; Groneberg et al., 2005). In
addition, since chronic cardiovascular disease is usually associated with chronic inflammation,

30
the alleviating effect on the disease indicates the anti-inflammatory effect of CoQ10. This effect
was explained as the result of decreasing the level of nitric oxide by Jun et al. (2009). Moreover,
nitric oxide also contributes to the development of arterial hypertension, so CoQ10 also plays an
important role in the regulation of blood pressure (Lyamina et al., 2011; Yang et al., 2015).
Furthermore, CoQ10 was found to enhance bone regeneration through transcription factor
activity and have an inhibitory effect on osteoclastogenesis by scavenging the intracellular ROS,
indicating the potential for its application in the treatment of osteoporosis and other bone
diseases associated with excessive bone resorption (Moon et al., 2013). Despite all these benefits,
the amount of CoQ10 in the human body declines with aging and the average daily intake from
the diet is just around 3-5 mg, which is substantially lower than the recommended daily amount
of 30-100 mg (Weber et al., 1997).
In order to respond to the recommended amount, CoQ10 supplements and CoQ10-enriched
food products are on the rise in the market. Most commercial formulations are in the form of soft
gel, hard capsules, tablets and powder, while some are in syrup form. Schulz et al. (2006)
evaluated five supplements where CoQ10 is in crystalline powder, oil dispersions and
solubilizates encapsulated in hard gelatin or soft gel capsules. They found that all formulations
resulted in higher CoQ10 plasma level, but a novel SoluTM Q10 solubilizate had the best
bioavailability and absorption characteristics. Additionally, in order to optimize the functionality
of CoQ10, Evans et al. (2009) encapsulated reduced CoQ10 (CoQH-CF) in soft gel and
compared the plasma concentration in individuals over 60 years of age, with those who were

31
treated with a commercial formulation (CoQ10 hard capsule). As a result, significantly higher
plasma concentration of CoQ10 was found in the group who took CoQH-CF soft gels. Since
CoQ10 was well solubilized in the soft gel, the rate of absorption in the intestine significantly
increased, consequently resulting in greater bioavailability. Therefore, solubilized
reduced-CoQ10 in soft gel would be the best source for CoQ10 supplements to meet the daily
demand.
CoQ10 can be also incorporated into food and beverage products to enhance the intake.
Ercan and El (2012) developed CoQ10-enriched yogurt where CoQ10 was in the form of
emulsified CoQ10, 𝛾-cyclodextrin/CoQ10 complex or nanoparticles, and found that the yogurt
fortified with CoQ10 nanoparticles had the highest bioavailability (73.81%), indicating the
potential application of nano-technology in food product development. Furthermore, grapefruit
juice was reported to inhibit the activity of P-glycoprotein which works as a medium for efflux
transportation of CoQ10 in the human intestinal cell line; therefore, the combination of CoQ10
and grapefruit juice could increase the uptake of CoQ10 (Itagaki et al., 2010).
2.3 Delivery systems involving CoQ10 and beta-glucan
In pure form, CoQ10 is a thermosensitive crystalline powder with low aqueous solubility (<
4 ng/mL) and high molecular weight (863 Da), which limits its incorporation into foods and
presents challenges for its oral delivery (Swarnakar et al., 2011). In order to increase its water
solubility and protect CoQ10 from degradative effects, a number of different approaches have

32
been developed, including oily solution, emulsion, cyclodextrin complexes, solid dispersions,
micro/nano-encapsulation (bioactive coated by a polymer), impregnation (bioactive loaded onto
a polymer) and a self-emulsifying drug delivery system and others (Kommuru et al., 1999; Terao
et al., 2006; Bhandari et al., 2007; Onoue et al., 2012). Initially, various oils, surfactants and
co-surfactant were used to synthesize self-emulsifying drug delivery systems of CoQ10 to
improve its bioavailability. However, there are safety concerns associated with the use of some
surfactants. Therefore, Zhou et al. (2014) developed a novel lipid-free nano-formulation to
minimize the surfactant content. In this study, CoQ10 powder was melted and dissolved into
glycerol aqueous solution with 1 g surfactant (Kollidon 30) to produce a CoQ10-suspension,
which was then characterized in terms of particle size, zeta potential, particle morphology,
physical state of CoQ10 in the particle and in vivo bioavailability of CoQ10 in rats. In the end,
nano-scale CoQ10 was obtained with the particle size of 66-93 nm, and the CoQ10 in the particle
was in a supercooled state, which provided physicochemical stability without crystallization. The
results obtained by Zhou et al. (2014) indicated that this novel lipid-free system significantly
enhanced the plasma concentration, and could be used for improving oral bioavailability of
CoQ10. Although the above lipid-free nano-formulation succeeded in bioavailability
improvement, the presence of 1 g surfactant raises concerns about potential toxicity, and thus
polymeric nanoparticles without surfactant have been investigated. Among various polymers,
starch and dextrin have been successfully applied for stabilizing dispersions of CoQ10 in water,
due to their hydrophilic property (Moldenhauer and Cully, 2003). In addition, poly

33
(lactic-co-glycolic acid) (PLGA) draws increasing attention due to its biocompatibility,
biodegradation and non-toxicity. Nehilla et al. (2008) produced CoQ10-loaded PLGA
nanoparticles with the particle size of sub-200 nm and 50% entrapment efficiency (EE) by a
nano-precipitation method. These nanoparticles were stable for 2 months with a 2-week steady
CoQ10 release, which indicates the potential implication as a sustained drug delivery system.
Moreover, CoQ10-loaded PLGA particles (CoQ10-NP) with smaller size (~100 nm) and higher
EE (~92%) were obtained using the emulsion-diffusion-evaporation technique by Swarnakar et
al. (2011). CoQ10 inside the CoQ10-NP was present in amorphous form rather than the
crystalline form based on the characteristic peaks of pure CoQ10, PLGA, CoQ10-NP and a
physical mixture of PLGA and CoQ10 in X-ray diffraction (XRD) patterns (Swarnakar et al.,
2011). In an animal study, CoQ10-NP showed improved oral bioavailability and higher
anti-inflammatory activity as compared to the free CoQ10.
Considering the high manufacturing cost and poor industrial scalability, alternative
cost-effective liposomal formulations have been successfully developed by Xia et al. (2006;
2012). Liposomes are hydrophilic vesicles with phospholipid bilayers surrounding an aqueous
core. The unique structure enhanced the absorption of water-insoluble nutrients from the
intestinal lumen fluids into enteric cells (Keller, 2001). By applying ethanol injection and
sonication, CoQ10 nano-liposomes were produced with a size of 68 nm and greater than 95% EE,
which was relatively stable at 4 oC in the dark for 90 days. Also, this method has been scaled up
to a pilot plant level to produce CoQ10 nano-liposomes in a large quantity with the same quality

34
and stability obtained in the laboratory (Xia et al., 2006). Another method that was used to
produce CoQ10 proliposomes was supercritical anti-solvent (SAS) technique, which is known as
a non-toxic and environmentally friendly process. This technique was used to obtain CoQ10
loaded liposomes in powder form at mild conditions (35 oC, 8 MPa), so that particles would be
produced with good quality (particle size of 50 nm; 82.28% EE) and less thermal damage (Xia et
al., 2012).
Overall, liposomal aggregation, 𝜅-carrageenan coated oil-in-water emulsion, maize starch
dispersion and nano-encapsulation with octenyl succinic anhydride modified starch have been
successfully applied to increase the water-dispersibility of CoQ10 as summarized in Table 2-2.
However, only a limited number of studies evaluated the use of beta-glucan as a carrier (Table
2-2). As discussed previously, beta-glucan is a linear polysaccharide with a large molecular
weight, providing health benefits mainly on the regulation of blood glucose level, serum
cholesterol level and blood pressure. All these properties indicate the great potential of
beta-glucan for use as an encapsulating material in particle formation. Generally, previous
studies have modified cereal beta-glucans into aerogels or micelles, before using them for
encapsulation or impregnation, owing to their unique structures. Micelles, also called nano-scale
core-shell self-aggregates, whose structure is like liposomes, consists of a lipophilic core for
capturing lipophilic ingredients and a hydrophilic shell for dispersing in aqueous media (Owen et
al., 2012). Liu et al. (2013) generated octenylsuccinate oat beta-glucan (OSG) micelles by
incubat
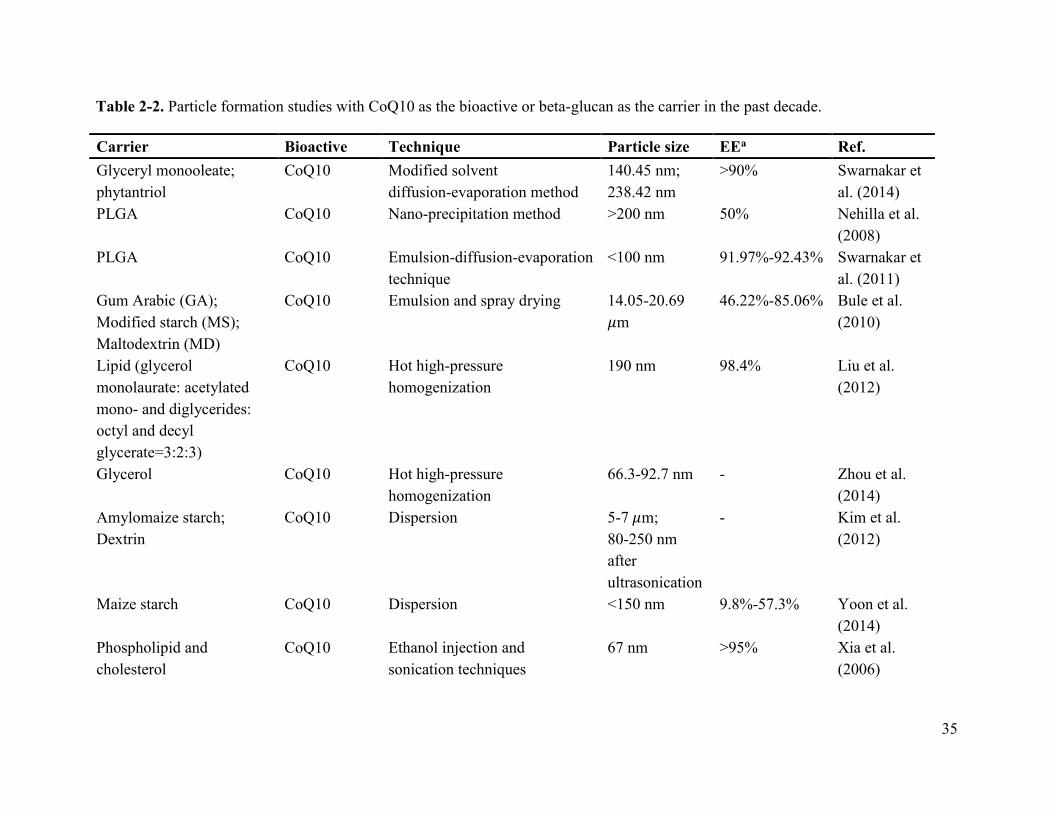
35
Table 2-2. Particle formation studies with CoQ10 as the bioactive or beta-glucan as the carrier in the past decade.
Carrier Bioactive Technique Particle size EEa Ref.
Glyceryl monooleate;
phytantriol
CoQ10 Modified solvent
diffusion-evaporation method
140.45 nm;
238.42 nm
>90% Swarnakar et
al. (2014)
PLGA CoQ10 Nano-precipitation method >200 nm 50% Nehilla et al.
(2008)
PLGA CoQ10 Emulsion-diffusion-evaporation
technique
<100 nm 91.97%-92.43% Swarnakar et
al. (2011)
Gum Arabic (GA);
Modified starch (MS);
Maltodextrin (MD)
CoQ10 Emulsion and spray drying 14.05-20.69
𝜇m
46.22%-85.06% Bule et al.
(2010)
Lipid (glycerol
monolaurate: acetylated
mono- and diglycerides:
octyl and decyl
glycerate=3:2:3)
CoQ10 Hot high-pressure
homogenization
190 nm 98.4% Liu et al.
(2012)
Glycerol CoQ10 Hot high-pressure
homogenization
66.3-92.7 nm - Zhou et al.
(2014)
Amylomaize starch;
Dextrin
CoQ10 Dispersion 5-7 𝜇m;
80-250 nm
after
ultrasonication
- Kim et al.
(2012)
Maize starch CoQ10 Dispersion <150 nm 9.8%-57.3% Yoon et al.
(2014)
Phospholipid and
cholesterol
CoQ10 Ethanol injection and
sonication techniques
67 nm >95% Xia et al.
(2006)

36
a 𝐸𝑛𝑡𝑟𝑎𝑝𝑚𝑒𝑛𝑡 𝐸𝑓𝑓𝑖𝑐𝑖𝑒𝑛𝑐𝑦 (𝐸𝐸) = (𝐸𝑛𝑡𝑟𝑎𝑝𝑒𝑑 𝐶𝑜𝑄10 𝑇𝑜𝑡𝑎𝑙 𝐶𝑜𝑄10)⁄ × 100%;
b 𝐶𝑢𝑟𝑢𝑚𝑖𝑛 𝑙𝑜𝑎𝑑𝑖𝑛𝑔 𝑐𝑎𝑝𝑎𝑐𝑖𝑡𝑦 (𝜇𝑔/𝑚𝑔) = 𝑚𝑎𝑠𝑠 𝑜𝑓 𝑙𝑜𝑎𝑑𝑒𝑑 𝑐𝑢𝑟𝑐𝑢𝑚𝑖𝑛 𝑖𝑛 1 𝑚𝐿 𝑂𝑆𝐺 𝑠𝑜𝑙𝑢𝑡𝑖𝑜𝑛 (𝜇𝑔) 𝑚𝑎𝑠𝑠 𝑜𝑓 𝑢𝑠𝑒𝑑 𝑂𝑆𝐺 𝑖𝑛 1 𝑚𝐿 𝑂𝑆𝐺 𝑠𝑜𝑙𝑢𝑡𝑖𝑜𝑛 (𝑚𝑔)⁄ ;
c Probiotic bacterial cultures Lactobacillus plantarum (NCDC 012), Lactobacillus casei (NCDC 297), and Lactobacillus brevis (NCDC 021)
Table 2-2. (cont’d)
Carrier Bioactive Technique Particle size EEa Ref.
Cholesterol and soya bean
phosphatidylcholine
CoQ10 Supercritical anti-solvent (SAS)
technique
50 nm 82.28% Xia et al.
(2012)
Octenyl succinic
anhydride modified starch
CoQ10 High pressure homogenisation 200-300 nm 98.2% Cheuk et al.
(2015)
Octenylsuccinate oat
beta-glucan (OSG)
micelles
Curcumin Suspension and
homogenization
308 nm 4.21𝜇g/mgb Liu et al.
(2014)
Octenylsuccinate oat
beta-glucan (OSG)
micelles
Beta-carotene Suspension and
homogenization
~400 nm >85% Ma et al.
(2016)
Barley beta-glucan Probiotic
bacterial
culturesc
Emulsion - 74.01% Shah et al.
(2016)
Barley beta-glucan;
lecithin
Resveratrol;
Tebuconazole
Emulsion with spray drying,
particle from gas saturated
solutions-drying (PGSS-drying)
or supercritical anti-solvent
(SAS)
10-100 𝜇m 57-94% Salgado et al.
(2015)
Barley beta-glucan
aerogels
Flax oil Supercritical CO2 drying - 47.79%-60.96% Comin et al.
(2012)

37
incubating oat beta-glucan with 2-octen-1-ylsuccinic anhydride at 45 oC for 2 h. By adjusting the
volume of 2-octen-1-ylsuccinic anhydride, OSG with different degrees of substitution was
obtained. Then, this micelle was used for impregnating curcumin and beta-carotene by
homogenization (Liu et al., 2014; Ma et al., 2016). Both of these studies indicated that molecular
weight and the degree of substitution of OSG as well as the input power during stirring were the
key parameters for determining the solubility and loading capacity of the bioactive. Moreover,
barley beta-glucan aerogels were investigated for carrying flax oil via SCCO2 drying by Comin
et al. (2012). In this study, hydrogels were first turned into alcogels, and then ethanol was
removed by SCCO2 to form aerogels. Due to the rapid removal of ethanol under supercritical
conditions, aerogels maintained the network structure of the original hydrogels, and were high in
porosity but very low in density (Mehling et al., 2009; Haimer et al., 2010; Comin et al., 2012).
In the end, flax oil impregnated beta-glucan aerogel was obtained with the loading capacity of
65.39% via a dynamic SCCO2 impregnation process at 40 oC and 15 MPa. Other than optimizing
the pressure, temperature and process type (dynamic or static), oil loading could be also
increased by adjusting the flow rate and the point of oil addition during the process (Comin et al.,
2012).
Recently, barley beta-glucan was applied to encapsulate probiotic bacterial cultures (74.01%
EE) by emulsion to protect probiotics from gastrointestinal tract conditions (Shah et al., 2016).
An improvement on tolerance to heat treatment and simulated gastrointestinal conditions and
storage was consequently found with the encapsulated probiotics (Shah et al., 2016). In addition,

38
linear beta-1,3-glucan from seaweeds was used to encapsulate resveratrol for the improvement of
its anti-fungal property (Salgado et al., 2015). The effect of three different drying methods
including spray drying, particle from gas saturated solutions-drying (PGSS-drying) and SAS
drying, on particle characteristics was determined. PGSS-drying and SAS drying both are based
on supercritical fluid technology, which are performed at a lower temperature than spray drying.
In PGSS-drying, a suspension containing a bioactive and a polymer is firstly saturated with
SCCO2 until equilibrium is reached. Then, particles are formed upon sudden decompression
through a nozzle. In SAS, polymer and bioactive are firstly solubilized or dispersed into an
organic solvent, which should be highly soluble in SCCO2. When the solution or suspension is
sprayed via a nozzle together with SCCO2, the organic solvent gets saturated with SCCO2, and
consequently the solute precipitates to form particles (Rodríguez-Rojo, 2012). However, SAS did
not result in particle formation, while encapsulated particles in amorphous state were obtained
with both spray drying and PGSS-drying (Salgado et al., 2015). In addition, resveratrol in
amorphous state was identified as having enhanced antifungal activity against Botrytis cinerea.
Therefore, beta-glucan could be utilized as an encapsulating agent to protect bioactives from
conditional stress, improve the functionality and enhance their bioavailability.
Pressurized gas-expanded liquid (PGX) technology, invented by Temelli and Seifried
(2016), is a supercritical fluid technique used for producing micro-/nano-particles, agglomerates
and fibers from an aqueous solution of a high molecular weight biopolymer, which could also be
applied for encapsulation or impregnation. Briefly, the process is based on spraying a mixture of
39
the aqueous biopolymer solution, compressible gas (i.e. carbon dioxide) and a water soluble
co-solvent/antisolvent (i.e. ethanol, acetone or isopropanol) into a pre-pressurized chamber.
Beta-glucan obtained by PGX drying maintains its native linear structure and high molecular
weight, and shows high water-solubility, which could be used as an encapsulating material to
carry CoQ10 for protection from the environmental conditions such as heat, light and oxygen
and improvement of bioavailability. Moreover, impregnation with PGX technology could be
performed at mild conditions (32-80 oC, 8-40 MPa) and generate products in powder form, so
that impregnated particles would have lower risk of degradation upon long-term storage,
transportation and thermo-degradation, compared to other particle formation methods like spray
drying or emulsion. Furthermore, to the author’s knowledge, there are no studies that use oat
beta-glucan as the carrier to impregnate CoQ10. Therefore, PGX beta-glucan and PGX-produced
CoQ10 impregnated beta-glucan are the focus of investigation in the following chapters in terms
of their physicochemical properties and their potential utilization in functional beverage
development.
40
Chapter 3: Characterization of beta-glucan and coenzyme Q10-impregnated
beta-glucan generated by pressurized gas-expanded liquid (PGX) technology
3.1 Introduction
Coenzyme Q10 (CoQ10) is an ubiquinone, known as a natural antioxidant present in both
animal and plant cellular membranes (Lenaz et al., 1999). Pure CoQ10 is an orange colored
crystalline powder, which is sensitive to environmental conditions like light, oxygen and heat.
CoQ10 is recommended by Health Canada for maintaining cardiovascular health and migraine
prophylaxis with the daily consumption of 30-100 mg and 75-100 mg, respectively (Health
Canada, 2007). However, the amount of CoQ10 in the human body declines with aging, while
the daily intake from the diet is only around 3-5 mg, which is much less than the recommended
daily amount (Weber et al., 1997). Therefore, CoQ10 supplements in the form of soft gel, hard
capsules and powder, as well as CoQ10-enriched foods like CoQ10-enriched yoghurt and
grapefruit juice have been introduced in the market. However, due to its lipophilicity and high
molecular weight, CoQ10 is insoluble in water, which when combined with its crystalline nature
decreases its bioavailability and limits the fortification in aqueous foods. Alternatively, a
water-soluble biopolymer can be used as a carrier to impregnate or encapsulate CoQ10 to
increase its dispersibility in water. Recently, liposomal aggregation, 𝜅 -carrageenan coated
oil-in-water emulsion, maize starch dispersion and nano-encapsulation with octenyl succinic
anhydride modified starch have been successfully applied to increase the water solubility of
CoQ10, but these products were in liquid form, which would create limitations upon long-term

41
storage, transportation and food applications (Xia et al., 2006; Chan et al., 2013; Yoon et al.,
2014; Cheuk et al., 2015). An alternative approach is to impregnate CoQ10 onto beta-glucan by
using pressurized gas-expanded liquid (PGX) technology, which was invented by Temelli and
Seifried (2016).
Beta-glucan is a soluble dietary fiber mainly found in oat and barley, which plays an
important role in health promotion and prevention of diseases, as discussed in Chapter 2.
Recently, oat beta-glucan micelles and barley beta-glucan aerogels have been used as a delivery
system for curcumin, beta-carotene, probiotic bacterial cultures and flax oil (Comin et al., 2012;
Liu et al., 2014; Ma et al., 2016; Shah et al., 2016). However, the literature lacks information on
the use of oat beta-glucan as a carrier for the delivery of CoQ10. Such a combination will
provide the health benefits of both beta-glucan and CoQ10. For successful delivery of such an
ingredient, it is essential to characterize its properties. Better understanding of the properties and
functionality will lead to its incorporation into various product formulations. Therefore, the
objective of this study was to determine the physicochemical properties of beta-glucan powder
(BG) and CoQ10-impregnated beta-glucan (iBG) obtained using the PGX process, in terms of its
proximate composition, morphology, impregnation yield, melting behavior, crystallinity,
viscosity, surface area and pore size.

42
3.2 Materials and Methods
3.2.1 Materials
Samples of BG and iBG were provided by Ceapro Inc (Edmonton, AB, Canada). BG (batch
no. 15-E1) was food-grade, which was extracted from oat and dried using the PGX process. iBG
(batch no. 15-D1) was obtained by impregnating the BG with CoQ10 in a second step using
supercritical carbon dioxide (SCCO2). Hexane, purchased from Fisher Scientific (Ottawa, ON,
Canada), was used as the solvent in CoQ10 loading and lipid content determinations. Anhydrous
ethanol (Sigma-Aldrich, St. Louis, MO, USA) was used to disperse particles in beta-glucan
content determination. High viscosity oat beta-glucan (HBG, >94% purity, molecular weight
(MW) of 361,000 Da, Megazyme Pty. Ltd., Chicago, IL, USA) was used as the reference for
comparison in the viscosity measurements. Beta-glucan assay kit (mixed linkage) including
lichenase, beta-glucosidase, GOPOD reagent buffer, GOPOD reagent enzymes and D-glucose
standard solution, was purchased from Megazyme Inc. (Chicago, IL, USA) to determine the
purity of BG. Nitrogen with a purity of 99.998% that was used in lipid content determination was
purchased from Praxair (Edmonton, AB, Canada). CoQ10 powder (98.34% purity) was
purchased from PureBulk (Roseburg, OR, USA). Sodium azide ( ≥ 99.5% purity) from
Sigma-Aldrich (Oakville, ON, Canada) was used to prevent microbial growth in beta-glucan
solutions.

43
3.2.2 Proximate analysis
Proximate analysis was performed on the BG sample using standard methods to determine its
moisture, protein, lipid, ash and carbohydrate contents. All measurements were done in triplicate.
3.2.2.1 Moisture content
The moisture content was determined according to the AACC method 44-16 (AACC
International, 2000a). A sample of BG (around 1 g) was dried in an oven (Model 655G, Isotemp
Oven, Fisher Scientific, Ottawa, ON) at 105 oC for 2 days, and the moisture content was
calculated using the following equation:
𝑀𝑜𝑖𝑠𝑡𝑢𝑟𝑒 % = (𝐹𝑟𝑒𝑠ℎ 𝑠𝑎𝑚𝑝𝑙𝑒 𝑤𝑒𝑖𝑔ℎ𝑡−𝐷𝑟𝑖𝑒𝑑 𝑠𝑎𝑚𝑝𝑙𝑒 𝑤𝑒𝑖𝑔ℎ𝑡
𝐹𝑟𝑒𝑠ℎ 𝑠𝑎𝑚𝑝𝑙𝑒 𝑤𝑒𝑖𝑔ℎ𝑡) × 100% (3.1)
3.2.2.2 Protein content
The protein content was determined according to the AACC method 46-09 (AACC
International, 2000b). A sample of BG (around 0.1 g) was made into a pellet, and then its
nitrogen content was determined using the Leco TruSpec N/C analyzer (Leco Corp., St. Joseph,
MI, USA). Protein content was calculated by using a conversion factor of 5.8 (i.e., nitrogen
conversion factor for wheat and most cereals) (Merrill and Watt, 1973).

44
3.2.2.3 Lipid content
The method of determining lipid content of BG was modified from Baümler et al. (2010). A
sample of BG (2-3 g) and hexane (40 mL) were mixed in a 50-mL test tube with a cap. Test
tubes were stored in the dark for 1-2 days with occasional shaking to extract the lipids. Then, test
tubes containing the sample and hexane were centrifuged (J-6M centrifuge, Beckman Coulter,
Mississauga, ON, Canada) at 1500 rpm for 10 min. Around 20 mL of supernatant was transferred
into a pre-weighed vial, and dried under nitrogen. The weight difference between the empty vial
and the vial after nitrogen drying was recorded as the lipid content. Hexane (40 mL) without
sample was used as the blank.
3.2.2.4 Ash content
The ash content was determined according to the AACC method 08-01 (AACC International,
2000c). A sample of BG (around 0.5 g) was burnt in a muffle furnace (Barnstead/Thermolyne®
Muffle Furnaces, Waltham, MA, USA) at 600 oC for 7 days, and the ash content was calculated
according to the following equation:
𝐴𝑠ℎ % = (𝐵𝑢𝑟𝑛𝑡 𝑠𝑎𝑚𝑝𝑙𝑒 𝑤𝑒𝑖𝑔ℎ𝑡
𝐹𝑟𝑒𝑠ℎ 𝑠𝑎𝑚𝑝𝑙𝑒 𝑤𝑒𝑖𝑔ℎ𝑡) × 100% (3.2)
3.2.2.5 Carbohydrate content
Carbohydrate content was determined by difference according to the following equation:
𝐶𝑎𝑟𝑏𝑜ℎ𝑦𝑑𝑟𝑎𝑡𝑒 % = 100% − 𝐴𝑠ℎ% − 𝑀𝑜𝑖𝑠𝑡𝑢𝑟𝑒% − 𝐿𝑖𝑝𝑖𝑑% − 𝑃𝑟𝑜𝑡𝑒𝑖𝑛% (3.3)

45
3.2.3 Beta-glucan content
The purity of BG was determined according to the AACC method 32-23.01 (AACC
International, 2000d), using the beta-glucan assay kit (Megazyme Inc., Chicago, IL, USA).
Around 0.03 g BG was mixed with 1 mL 50% (v/v) ethanol and 5 mL sodium phosphate buffer
(pH=6.5) and incubated in boiling water for 10 min. The cooled mixture was mixed with 4 mL
water and 0.2 mL lichenase. After one-hour digestion at 50 oC in a water bath (WNB 29,
Memmert, Schwabach, FRN, Germany), 20 mL water was added to adjust the total volume to 30
mL. An aliquot of 2 mL was centrifuged (accuSpinTM Micro, Fisher Scientific, Ottawa, ON,
Canada) at 7500 rpm for 5 min. Then, 100 µL of supernatant was mixed with 100 µL
beta-glucanase in sodium acetate buffer (pH=4.0, 50 mM) and incubated at 50 oC for 20 min.
Another 20-min incubation at 50 oC was applied after adding 3 mL GOPOD reagent. Absorbance
of the solution was determined using a spectrophotometer (Model 6305, Jenway, Stone, SFD,
UK) at 510 nm. The sample was prepared in quadruplicate, and the sample prepared without
beta-glucanase was treated as the blank. The beta-glucan content (% w/w) was calculated
according to the following equation:
𝐵𝑒𝑡𝑎 − 𝑔𝑙𝑢𝑐𝑎𝑛 (% 𝑤 𝑤) = ∆𝐴 ×⁄𝐹
𝑊× 27 (3.4)
where, ∆A is the absorbance after beta-glucanase treatment (reaction) minus reaction blank
absorbance, W is the weight of the sample in mg and F is the factor for the conversion of
absorbance values to µg of glucose (100 µg D-glucose / absorbance of 100 µg D-glucose), which
is 1.065 in this study.
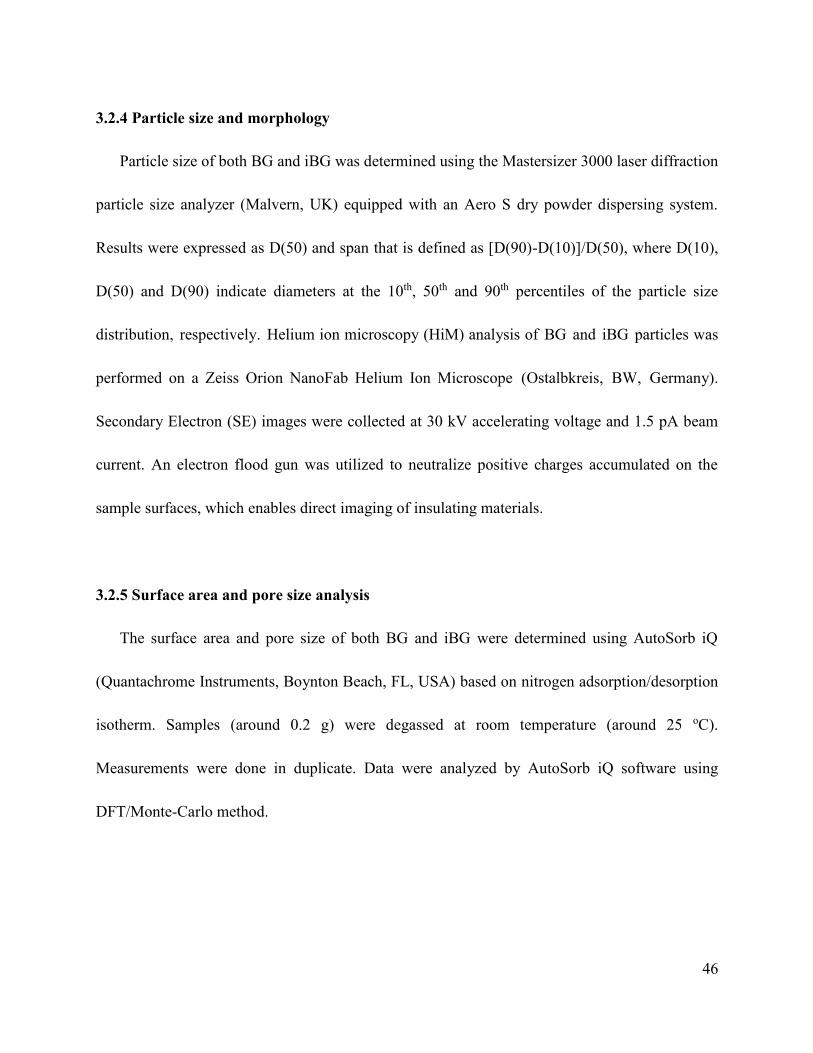
46
3.2.4 Particle size and morphology
Particle size of both BG and iBG was determined using the Mastersizer 3000 laser diffraction
particle size analyzer (Malvern, UK) equipped with an Aero S dry powder dispersing system.
Results were expressed as D(50) and span that is defined as [D(90)-D(10)]/D(50), where D(10),
D(50) and D(90) indicate diameters at the 10th, 50th and 90th percentiles of the particle size
distribution, respectively. Helium ion microscopy (HiM) analysis of BG and iBG particles was
performed on a Zeiss Orion NanoFab Helium Ion Microscope (Ostalbkreis, BW, Germany).
Secondary Electron (SE) images were collected at 30 kV accelerating voltage and 1.5 pA beam
current. An electron flood gun was utilized to neutralize positive charges accumulated on the
sample surfaces, which enables direct imaging of insulating materials.
3.2.5 Surface area and pore size analysis
The surface area and pore size of both BG and iBG were determined using AutoSorb iQ
(Quantachrome Instruments, Boynton Beach, FL, USA) based on nitrogen adsorption/desorption
isotherm. Samples (around 0.2 g) were degassed at room temperature (around 25 oC).
Measurements were done in duplicate. Data were analyzed by AutoSorb iQ software using
DFT/Monte-Carlo method.

47
3.2.6 Differential scanning calorimetry (DSC) analysis
DSC analysis of the BG, CoQ10, iBG and a physical mixture (PM) of CoQ10 (4% w/w) and
BG was performed using a DSC Q2000 system (TA Instruments, Mississauga, ON, USA)
calibrated with indium standards. Around 3-4 mg sample was weighed into an aluminum pan.
Empty pans were treated as blank. Measurements were carried out at the heating rate of 10
oC/min from 0 to 200 oC. Data interpretation was done using Advantage software.
3.2.7 X-ray diffraction (XRD) analysis
The XRD patterns of BG, CoQ10, iBG and the 4% physical mixture (PM) were investigated
using a Rigaku Geigerflex Powder Diffractometer (Ultima IV, Rigaku, Tokyo, Japan) equipped
with a cobalt tube, graphite monochromator and scintillation detector. Measurements were
carried out at a voltage of 38 kV and 38 mA. Samples were continuously scanned from 5 to 90
degrees at 2 degrees 2θ per minute with a step size of 0.02. Data interpretation was done using
JADE 9.6 software.
3.2.8 CoQ10 loading content
iBG (20 mg) was mixed with 10 mL hexane and then incubated in a water bath at 58 oC for
15 min. The mixture was then centrifuged (accuSpinTM 400, Fisher Scientific, Ottawa, ON,
Canada) at 3000 rpm for 10 min. The absorbance of the supernatant was measured at 270 nm
using a UV spectrophotometer (Model 6305, Jenway, Stone, SFD, UK) to determine the

48
concentration of CoQ10 based on the 9-point standard curve (0.008, 0.012, 0.02, 0.035, 0.06,
0.07, 0.098, 0.12, 0.14 mg/mL) established using pure CoQ10. Measurements were done in
quadruplicate. The R2 value of the standard curve was 0.99556. Absorbance maximum for
CoQ10 in hexane was determined to be at 270 nm after scanning the range from 200 to 700 nm
using a UV spectrophotometer (SpectraMax®M3 Multi-Mode Microplate Reader, Molecular
Devices, Sunnyvale, CA, USA). The CoQ10 loading percentage was calculated as follows:
𝐶𝑜𝑄10 𝑙𝑜𝑎𝑑𝑖𝑛𝑔 % =𝐶𝑜𝑄10 𝑎𝑚𝑜𝑢𝑛𝑡 (𝑚𝑔)
𝑖𝐵𝐺 𝑎𝑚𝑜𝑢𝑛𝑡 (𝑚𝑔)× 100% (3.5)
3.2.9 Viscosity
The viscosity of BG, iBG and HBG solutions were determined using a rheometer (Discovery
HR-1, TA Instrument, Mississauga, ON, USA) with a cup (Peltier Concentric Cylinder) and
rotor attachment, over a shear rate (𝛾) range of 1.29-129 s-1 at temperatures of 4 oC and 25 oC.
The shear rate range was selected according to Ghotra et al. (2009). The temperature effect on
viscosity was evaluated at a fixed shear rate of 50 s-1 over a temperature range of approximately
0-80 oC. Solutions (25 mL) were prepared in duplicate at different concentrations as listed in
Table 3-1. HBG, BG and iBG samples required different extents of boiling at 97 oC with stirring
on a hot plate (Model SP131325, Barnstead/Thermolyne Cimarec® Digital Hot Plates, Thermo
Fisher Scientific, Ottawa, ON, Canada) to ensure complete dissolution as indicated in Table 3-1.
The weight of solution was adjusted back to the initial level by adding water to make up for
evaporative losses during the heating step. Then, 0.02% (w/w) sodium azide was added to

49
prevent microbial growth. Prior to viscosity measurements, a two-piece cover was placed on the
cup edge to prevent evaporative loses during measurement.
Table 3-1. Solution preparation for viscosity measurements
Sample Mass
(g)
Water
(mL)
Solution solids
conc. (%, w/v)
Actual beta-glucan
conc. (%, w/v)*
Heating time
(min)
HBG 0.0375 25 0.15 0.14 0.5
0.05 25 0.2 0.19 0.5
0.075 25 0.3 0.28 0.5
BG 0.0375 25 0.15 0.13 10
0.05 25 0.2 0.17 10
0.075 25 0.3 0.25 10
iBG 0.0375 25 0.15 0.13 1
0.05 25 0.2 0.17 1
0.075 25 0.3 0.25 1
* Actual beta-glucan concentration was calculated by multiplying the solids concentration in solution by the purity
of the sample, which is 83.6% for BG and iBG, and 94% for HBG.
3.2.10 Color
BG and iBG powder and 0.2% (w/v) solutions of each were used for color measurement,
according to the ASTM D2244 method (ASTM, 2011). A Hunter Lab colorimeter
(CR-400/CR-410, Konica Minolta, Ramsey, NJ, USA) with a D65 illuminant with an opening of
14 mm and a 10° standard observer was used to determine the values of L (0 = black, 100 =
white), a (negative = green, positive = red) and b (negative = blue, positive = yellow). The
colorimeter was calibrated with a standard white plate (L* = 97.31, a* = 0.05, b* =4.38). For

50
powder samples, the color measurements were performed by placing a Petri dish (35×10 mm
Style, Corning®, Corning, NY, USA), containing enough sample to cover the bottom of the Petri
dish, under the colorimeter. The tube-like end of the colorimeter created the dark area by placing
the sensor lens directly over the area of the specimen to be measured. Measurements were
performed in triplicate by recording the values of 3 portions from one powder sample. Solution
samples were prepared as described for viscosity measurements, but without sodium azide. An
aliquot of solution (around 5 mL) enough to cover the bottom of the dish was transferred and the
color measurement was performed by placing the dish under the colorimeter. Total color
difference (ΔE), yellowness index (YI), and whiteness index (WI) were calculated according to
Boun and Huxsoll (1991):
∆𝐸 = √(𝐿∗ − 𝐿)2 + (𝑎∗ − 𝑎)2 + (𝑏∗ − 𝑏)2 (3.6)
𝑊𝐼 = 100 − [(100 − 𝐿)2 + 𝑎2 + 𝑏2]0.5 (3.7)
𝑌𝐼 = 142.86 𝑏/𝐿 (3.8)
where, L*, a* and b* are the color values of the white standard tile and L, a and b are the
measured color parameters of the BG and iBG samples.
3.2.11 Statistical analysis
Statistical analyses were performed using R 3.2.3 with the car and agricolae packages (R
Core Team, 2015; Mendiburu, 2015; Fox and Weisberg, 2011). Analysis of variance (ANOVA)

51
was performed and means were compared by paired t-test of least square means with
significance defined at p<0.05.
3.3 Results and discussion
3.3.1 Chemical composition and particle characteristics
The proximate composition of BG is presented in Table 3-2. On wet basis, the beta-glucan
content of the BG sample was 83.6%, which was around 4% (w/w) lower than the total
carbohydrate content, indicating the presence of other carbohydrates, anticipated to be mostly
starch. In addition, the BG sample contained 1.5% (w/w) protein and 2.9% (w/w) ash.
Furthermore, the moisture content of the BG sample was around 7.4% (w/w). Therefore, to
preserve the water-soluble polymer, storing in a dry place with desiccant is necessary.
Table 3-2. Proximate composition of BG sample.
Proximate composition (%, w/w, as is basis)*
Moisture 7.4±0.1
Protein 1.5±0.1
Fat 0
Carbohydrate 88.0
Beta-glucan 83.6±1.1
Ash 2.9±0.3
* Data were presented as mean ± standard deviation based on triplicate measurements.

52
Visually, BG is white fine fibrils, while iBG is a yellowish powder (Fig. 3-1). The loading
percentage of CoQ10 in iBG was 1.4% (w/w). The particle morphology of both BG and iBG was
investigated using a helium ion microscope that can directly image insulating materials,
eliminating the need for any coating material like gold, typically used in scanning electron
microscopy. The delicate porous structures of both particles were apparent in the images
obtained at two magnifications depicted in Fig. 3-2, which confirmed that the PGX process could
create highly porous structures. Pores on the fibrils of BG and iBG as well as the distinct CoQ10
particles on iBG could be clearly observed. Based on the microscopic images, CoQ10
nanoparticles were spherical shaped with the average diameter of 92 nm (range of 35-160 nm),
dispersed uniformly throughout the BG fibrils.
Figure 3-1. Visual appearance of (A) BG and (B) iBG samples.

53
Figure 3-2. Helium ion microscopy images of (A), (C) BG and (B), (D) iBG. Scale bars
represent 500 nm in (A) and (B), and 200 nm in (C) and (D).
Surface area and pore size of BG and iBG were also analyzed. Samples were firstly
outgassed overnight under vacuum at room temperature (approximately 25 oC) to avoid melting
C D
A B

54
of CoQ10. Then, after a 4-hour N2 adsorption/desorption analysis, it was found that both BG and
iBG had similar pore sizes (half pore width = 27.9 nm), which indicates that CoQ10 was
impregnated onto BG without damaging its porous structure. Generally, larger surface area is
associated with smaller particle size. By comparing their visual appearance, iBG, yellowish
powder, was predicted to have smaller particle size and larger surface area than BG, which was
white fine fibrils (Fig. 3-1). In fact, the average particle size of BG was larger than that of iBG
(7.7 vs. 6.1 μm), which confirmed the above prediction. However, the surface area of BG (24.1
m2/g) was almost twice as large as that of iBG (12.9 m2/g). The unexpected smaller surface area
of iBG could be explained by the presence of CoQ10 nanoparticles that occupied some surface.
3.3.2 Crystallinity and thermal analysis
The thermal behavior of BG, CoQ10, iBG and their physical mixture were analyzed using
DSC (Fig. 3-3). Pure CoQ10 gave a sharp endothermic peak at around 50 oC in the DSC
thermogram, indicating melting of crystals. Such a peak was also present for the physical
mixture but absent for iBG, which indicated the possibility that the CoQ10 impregnated onto the
BG particles may be in the amorphous form. The same four samples were also analyzed by XRD
to investigate the extent of crystallinity. The characteristic peaks of the pure CoQ10 were not
present for the iBG sample in the XRD spectra, shown in Fig. 3-4. This finding seemed to
confirm the possibility that CoQ10 was present inside the iBG particles in amorphous form
rather than crystalline form. However, it is also possible that the CoQ10 peaks may be hidden

55
Figure 3-3. DSC thermograms of BG, CoQ10, iBG and physical mixture (PM, 4% CoQ10) at
the heating rate of 10 oC/min.
under the broad peak of beta-glucan due to the low concentration of CoQ10. In order to further
confirm the absence of the characteristic peaks of CoQ10, the iBG sample was digested with the
lichenase enzyme to hydrolyze beta-glucan. In addition, physical mixtures of lower CoQ10
content (1% and 2%) were included for comparison. In this case, some CoQ10 peaks became
apparent as depicted in Fig. 3-5. Thus, it is concluded that the crystalline nature of CoQ10 is
preserved to a small extent in the iBG particles. A similar conclusion was reached by Swarnakar
et al. (2011) who loaded CoQ10 on poly (lactic-co-glycolic acid) (PLGA) particles using an
emulsion-diffusion-evaporation method. Swarnakar et al. (2011) also suggested that having
CoQ10 in its amorphous form on the polymer confirmed its formulation excipients for
pharmaceutical applications, because amorphous solids have higher solubility, dissolution rate
and thus better bioavailability, compared to corresponding crystals (Yu, 2001).

56
Figure 3-4. XRD spectra of BG, CoQ10, iBG and physical mixture (PM, 4% CoQ10).
Figure 3-5. XRD spectra of 1% and 2% physical mixtures (PM) and lichenase-digested iBG.

57
3.3.3 Color
The data for the color of BG and iBG are presented in Fig. 3-6. The total color difference was
observed for both powder and solution samples. Specifically, iBG in powder form has a
significantly higher yellowness index, which indicates the successful impregnation of CoQ10.
Additionally, the yellowness of 0.2% (w/v) iBG solution indicates the presence of CoQ10 after
boiling, which suggested that BG could protect CoQ10 from severe conditions. In a previous
study, 64% of CoQ10 in the CoQ10 + cyclodextrin complex remained unchanged after 120 min
of exposure to heat at 80 oC and UV light (Fir et al., 2009). In the present study, the total time
from adding iBG into 25 mL water at room temperature to complete dissolution was around 1
min, which means CoQ10 was exposed to boiling temperature for less than 1 min, and it is
expected that most of CoQ10 in iBG was preserved. Additionally, while evaluating the CoQ10
content of the average Danish diet, Weber et al. (1997) found that 14-32% of CoQ10 in food
would be degraded by frying, but no degradation was detected upon boiling. To confirm the
preservation of CoQ10 in the iBG after the boiling step employed in this study, it is
recommended to perform high performance liquid chromatography (HPLC) analysis.

58
Figure 3-6. Total color difference (∆E), yellowness index (YI) and whiteness index (WI) of BG
and iBG in (A) powder form and (B) 0.2% (w/v) solution. Bars for each parameter with different
letters are significantly different at p<0.05.
Furthermore, lower YI of solution samples, compared to that of powder samples, could be
explained by the low concentration of CoQ10, because when placing the sample on the dish,
more powder sample was needed to cover the bottom of the dish, while around 5 mL solution

59
was enough to do so. For the same reason, WI(s) of BG and iBG solutions were closer, compared
with that of BG and iBG powders, even though they were still statistically different.
3.3.4 Viscosity
The viscosity of BG and iBG solutions prepared at different concentrations (0.15%, 0.2% and
0.3% w/v) as a function of shear rate at temperatures of 4 oC and 25 oC is shown in Figs. 3-7 and
3-8, respectively. The shear rate was increased logarithmically from 1.29 to 129 s-1. The
instability at very low shear rates (1.29-5.13 s-1) was due to the limitations of the instrument.
These two temperatures were chosen for potential application of BG and iBG in beverage
products. For ease of comparison, the viscosity at 51 s-1 is presented in Table 3-3, because the
oral perception of liquid and semi-solid foods has been found to correlate to viscosity
measurements performed at shear rates around 50 s-1 (Wood, 1968). For the same reason, the
temperature effect on viscosity behavior was determined at the fixed shear rate of 50 s-1. Based
on the health claims approved by the US Food and Drug Administration and Health Canada, the
three concentrations adopted in this study were calculated to provide 0.75 g beta-glucan per
serving sizes of 500 mL, 375 mL and 250 mL of a potential beverage product.
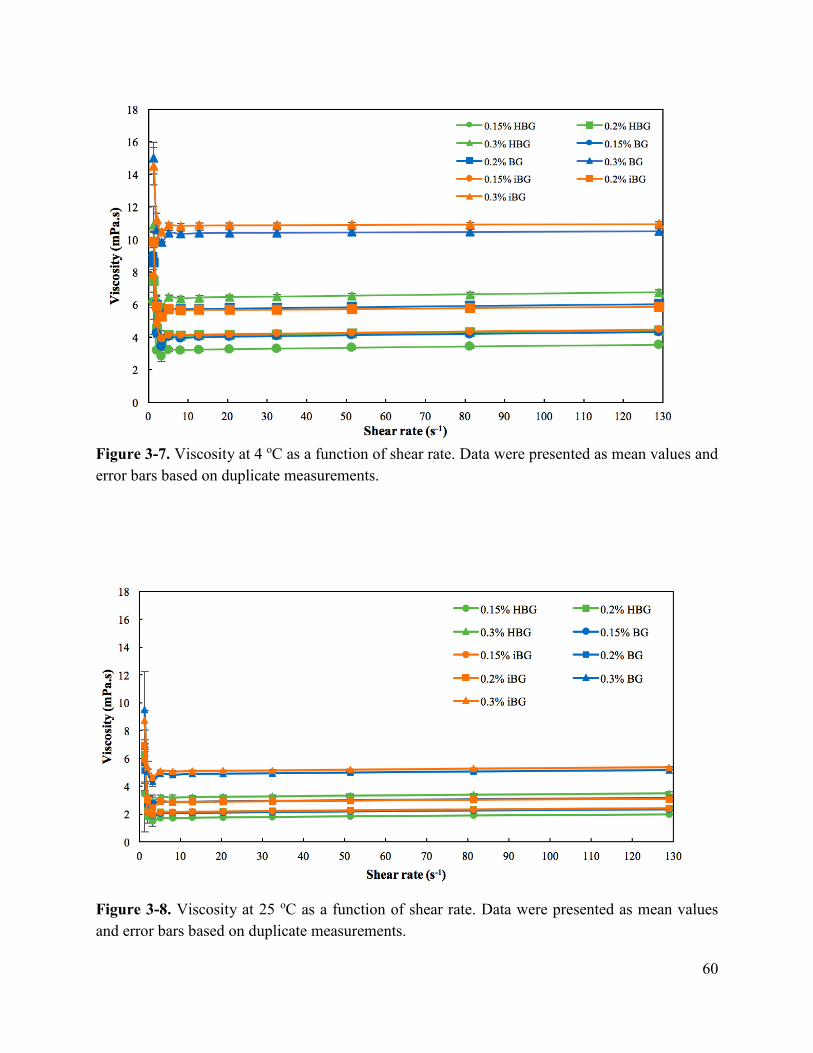
60
Figure 3-7. Viscosity at 4 oC as a function of shear rate. Data were presented as mean values and
error bars based on duplicate measurements.
Figure 3-8. Viscosity at 25 oC as a function of shear rate. Data were presented as mean values
and error bars based on duplicate measurements.
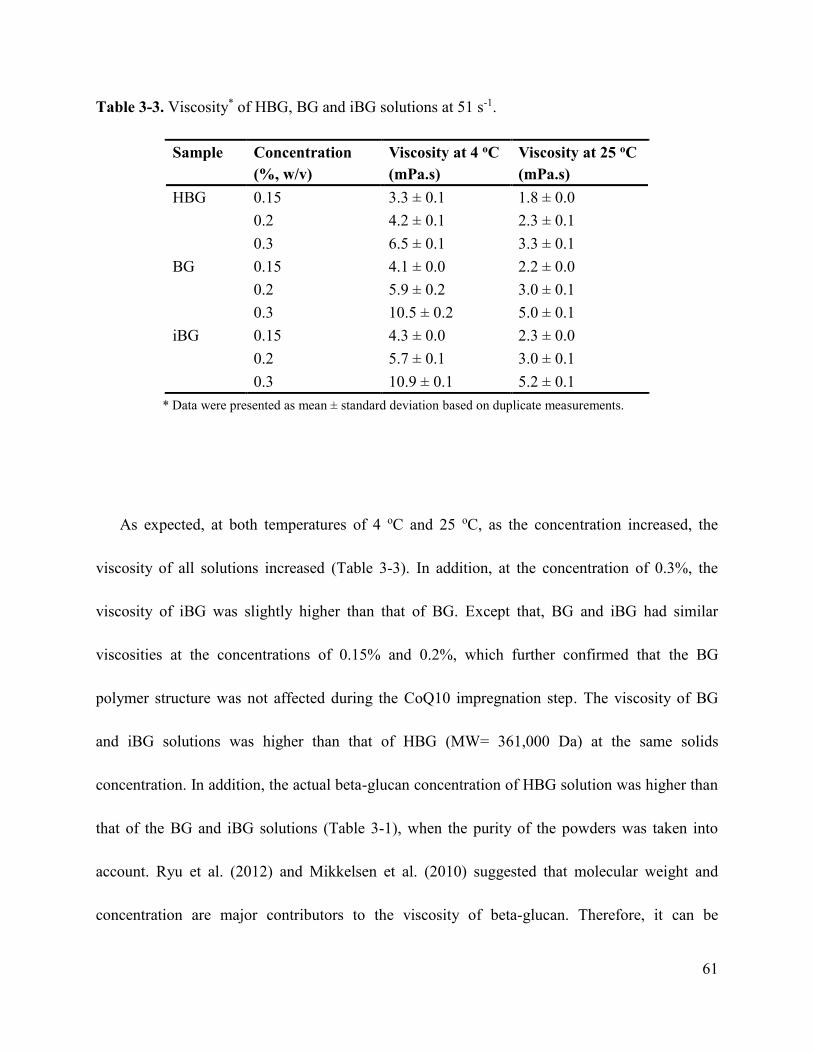
61
Table 3-3. Viscosity* of HBG, BG and iBG solutions at 51 s-1.
Sample Concentration
(%, w/v)
Viscosity at 4 oC
(mPa.s)
Viscosity at 25 oC
(mPa.s)
HBG 0.15 3.3 ± 0.1 1.8 ± 0.0
0.2 4.2 ± 0.1 2.3 ± 0.1
0.3 6.5 ± 0.1 3.3 ± 0.1
BG 0.15 4.1 ± 0.0 2.2 ± 0.0
0.2 5.9 ± 0.2 3.0 ± 0.1
0.3 10.5 ± 0.2 5.0 ± 0.1
iBG 0.15 4.3 ± 0.0 2.3 ± 0.0
0.2 5.7 ± 0.1 3.0 ± 0.1
0.3 10.9 ± 0.1 5.2 ± 0.1
* Data were presented as mean ± standard deviation based on duplicate measurements.
As expected, at both temperatures of 4 oC and 25 oC, as the concentration increased, the
viscosity of all solutions increased (Table 3-3). In addition, at the concentration of 0.3%, the
viscosity of iBG was slightly higher than that of BG. Except that, BG and iBG had similar
viscosities at the concentrations of 0.15% and 0.2%, which further confirmed that the BG
polymer structure was not affected during the CoQ10 impregnation step. The viscosity of BG
and iBG solutions was higher than that of HBG (MW= 361,000 Da) at the same solids
concentration. In addition, the actual beta-glucan concentration of HBG solution was higher than
that of the BG and iBG solutions (Table 3-1), when the purity of the powders was taken into
account. Ryu et al. (2012) and Mikkelsen et al. (2010) suggested that molecular weight and
concentration are major contributors to the viscosity of beta-glucan. Therefore, it can be

62
concluded that the production of BG and iBG by the PGX process preserved the native structure
of beta-glucan, having a molecular weight higher than 361,000 Da. Furthermore, with an
increase in shear rate, the viscosity of all solutions stayed almost constant, which indicates their
Newtonian behavior at the concentrations tested. A similar result was obtained by Temelli (1997)
who worked with 1% (w/v) barley beta-glucan dispersions over the shear rate range of 600 to
5000 s-1. Differently, Dongowski et al. (2005) observed shear-thinning flow behavior of 2% and
4% beta-glucan solutions prepared from oat bran. Also, they indicated that the shear-thinning
behavior was dependent on the molecular weight and concentration of the polymer, which was in
agreement with the conclusions reached by Lazaridou et al. (2003) and Skendi et al. (2003). The
reason for the Newtonian behaviors observed in the present study is the low concentration of
beta-glucan (0.13%-0.25%) in the solutions tested. However, it was found that low concentration
(0.2-3%) solutions of oat beta-glucan with the molecular weight of 355,000 Da exhibited
shear-thinning flow behavior (Mikkelsen et al. 2010; Cui, 2001).
Viscosity behavior of BG and iBG solutions at the shear rate of 50 s-1 over the temperature
range of 0 oC and 80 oC is shown in Fig. 3-9. The temperature range of 0 oC and 80 oC was
chosen to predict the viscosity behavior of beverages potentially prepared with BG and iBG and
consumed as hot or cold. Viscosity increase of all solutions with concentration was also observed.
Additionally, viscosity decrease with increasing temperature was demonstrated as expected,
because as temperature rises, hydrogen bonds between beta-glucan molecules would be broken.
Moreover, the viscosities of BG and iBG showed similar decreasing trends, but were still higher
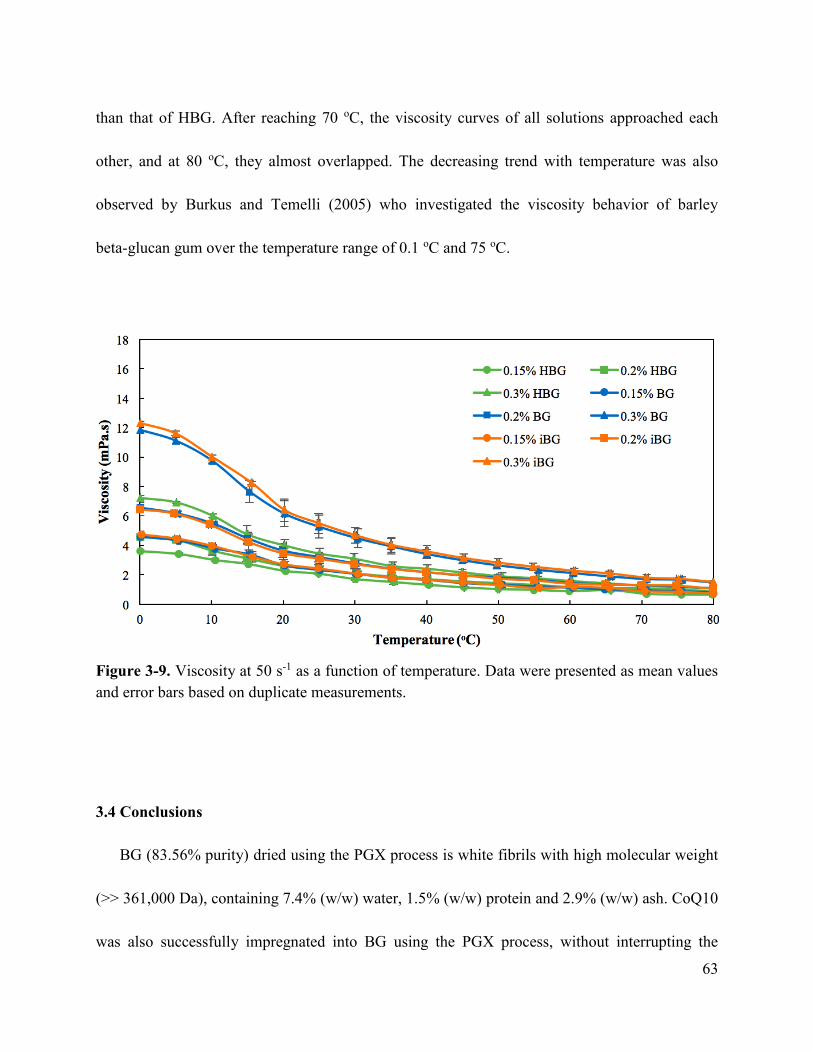
63
than that of HBG. After reaching 70 oC, the viscosity curves of all solutions approached each
other, and at 80 oC, they almost overlapped. The decreasing trend with temperature was also
observed by Burkus and Temelli (2005) who investigated the viscosity behavior of barley
beta-glucan gum over the temperature range of 0.1 oC and 75 oC.
Figure 3-9. Viscosity at 50 s-1 as a function of temperature. Data were presented as mean values
and error bars based on duplicate measurements.
3.4 Conclusions
BG (83.56% purity) dried using the PGX process is white fibrils with high molecular weight
(>> 361,000 Da), containing 7.4% (w/w) water, 1.5% (w/w) protein and 2.9% (w/w) ash. CoQ10
was also successfully impregnated into BG using the PGX process, without interrupting the

64
porous structure and viscosity of BG. iBG is a yellowish powder with 1.4% (w/w) CoQ10
mainly in its amorphous form. Both BG (7.7 μm) and iBG (6.1 μm) were produced in
micrometer sized particles, while CoQ10 nanoparticles present in iBG had an average diameter
of 92 nm. After a quick boiling step to prepare solutions, the yellowness of iBG was still present,
indicating that CoQ10 was well dispersed in the water. The viscosity of BG and iBG solutions
increased as the concentration increased from 0.15% to 0.3% (w/v), while exhibiting Newtonian
behavior with a constant viscosity through the shear rate range of 1.29 s-1 to 129 s-1. Also, a
decrease in the viscosity of BG and iBG solutions was observed at the shear rate of 50 s-1 when
temperature was increased from 0 oC to 80 oC. iBG had a similar viscosity behavior to BG,
indicating that the impregnation of BG particles with CoQ10 using the PGX process did not
affect the viscosity of BG. Overall, the physicochemical properties determined in this study
would provide feedback for the fine-tuning of the operating conditions of the PGX process, and
guidance for the development of a functional beverage formulation in the next chapter.

65
Chapter 4: Development of an orange-flavored functional beverage
formulated with beta-glucan and coenzyme Q10-impregnated beta-glucan
4.1 Introduction
Beta-glucan is a soluble dietary fiber component that is mainly present in the starchy
endosperm with the rest in the aleurone layers of oats and barley (Izydorczyk and Biliaderis,
2000; Herrera et al., 2016). After extraction from the cereal grains, beta-glucan is usually
obtained in liquid or suspension form, which leads to issues in terms of storage, transportation
and potential applications and therefore drying is needed to resolve these issues. But, as known,
beta-glucan forms highly viscous solutions and therefore it is challenging to use conventional
drying methods like freeze drying or spray drying to obtain beta-glucan powder. Alternatively,
beta-glucan solution could be dried by the pressurized gas-expanded liquid (PGX) technology
(Temelli and Seifried, 2016). This technology was designed to produce dry particles,
agglomerates and/or fibers from highly viscous aqueous solutions of high molecular weight
biopolymers. The produced micro- or nanoparticles are generally low in bulk density, high in
porosity and large in surface area, which facilitate 99% reduction in shipping weights and ease of
handling and dispersion in water. Additionally, PGX-produced beta-glucan (BG) could maintain
its high molecular weight, resulting in a high viscosity, which contributes to its physiological
benefits like serum cholesterol or glucose lowering (Varum and Smidsrod, 1988; Wood et al.,
1994).

66
The PGX process can also be used to impregnate bioactive materials onto the dried particles
to not only protect the bioactive components from atmospheric conditions such as light, heat and
oxygen, but also enhance their dispersibility in water and consequently bioavailability. In this
study, Coenzyme Q10 (CoQ10) was the bioactive material impregnated onto the PGX-dried
beta-glucan (iBG). CoQ10 is a natural antioxidant present in both animal and plant cellular
membranes, which has anti-inflammatory effect, regulates blood pressure and enhances bone
regeneration (Jun et al., 2009; Lyamina et al., 2011; Yang et al., 2015). Due to its hydrophobicity,
application of CoQ10 in food and beverage products is limited. Recently, CoQ10 has been
incorporated into a dairy product like yoghurt, due to its high fat content (Ercan and El, 2012).
However, functional beverage products containing CoQ10 are not available.
With the growing attention to body health and lifestyle, functional beverages, which contain
health-benefiting ingredients, have been receiving increased demand since the early 21th century
(Szakály et al., 2012). In the present study, a functional beverage formulated with iBG was
targeted, where the health benefits of both beta-glucan and CoQ10 would be provided. The basic
formulation was adopted from a previous study by Temelli et al. (2004), who developed an
orange-flavored barley beta-glucan beverage. In addition, stevia extract (steviol glycosides) and
ground annatto seeds were used as the sweetener and colorant, respectively, to meet the
consumer demand for “natural ingredients” and “low/no sugar content” in the functional
beverage market. However, different from the conventional sugar, beverages sweetened with
stevia extract are usually associated with a bitter taste and off flavour (Cadena et al., 2013). On

67
the other hand, an increasing addition of oat and barley beta-glucans was found to decrease the
perception of saltiness and sharpness of tomato soup, and sourness of fruit beverages (Lyly et al.,
2004; Mielby et al., 2016). However, reports on the impact of beta-glucan on the bitterness and
aftertaste of stevia are lacking. Furthermore, health claims or nutrition information labels are
established to communicate the benefits of products to consumers to help them make
better-informed choices. A positive increase was found in the overall liking of açaí fruit juices by
providing such information (Sabbe et al., 2009). Thus, more information is needed on the effect
of providing health information on the overall acceptance of functional beverages.
Therefore, the objectives of this study were: i) to develop a formulation of a functional
beverage incorporating BG or iBG, ii) to study the effect of BG concentration and storage
temperature on the sensory attributes of the functional beverage using a trained panel, ii) to
determine if there is a difference between beverages prepared with BG and iBG, iv) to evaluate
the sensory quality and acceptability of the beverage formulated with iBG in comparison to a
commercial product using a consumer panel, and v) to evaluate the effect of health information
on the overall acceptance of the beverage.
4.2 Materials and methods
4.2.1 Materials
Food-grade BG (batch no. 15-E1, 83.6%, w/w, as is basis) extracted from oat, iBG (batch no.
15-D1, 1.4%, w/w CoQ10) and food-grade iBG (batch no. 16-J3) were provided by Ceapro Inc

68
(Edmonton, AB, Canada). Citric acid (anhydrous) and stevia extract (Truvia®, Stevia
rebaudiana) were provided by Cargill Inc. (Wayzata, MN, USA). Orange flavor powder was
provided by Gold Coast Ingredients Inc. (Commerce, CA, USA). Orange color powder (Annatto
seeds) was purchased from Natures Flavors (Orange, CA, USA). Serving containers (2.5 oz.,
Conex® Complements™ Portion Containers) were purchased from Dart Inc. (Mississauga, ON,
Canada). Commercial products used for sensory panels were purchased from a local grocery
store. Chemicals involved in characterization were similar to those specified in Chapter 3
(Section 3.2.1).
4.2.2 Beverage formulation development
Beverage formulations (Table 4-1) were initially developed without the addition of BG or
iBG to obtain a base product with color and flavor similar to that of Vitaminwater® (Orange
flavor, Rise Zero, Glacéau, New York City, NY, USA), using laboratory scale trials. Colleagues
in the food lab were invited to evaluate the trial products to help with formulation development.
Table 4-1. Beverage formulations.
Ingredients Amount (g/mL, w/v)
BG or iBG 0%, 0.15%, 0.2%, or 0.3%
Citric acid 0.2%
Stevia extract 0.015%
Orange flavor powder 0.1%
Orange food colorant powder 0.05%

69
After the initial base formulation was developed, BG was added while keeping the concentration
of other ingredients constant. Beverages were formulated with 0.15%, 0.2% and 0.3% (w/v) BG
targeting to meet the FDA recommendation of providing 0.75 g beta-glucan per serving sizes of
500 mL, 375 mL and 250 mL, respectively. However, considering the purity of beta-glucan in
BG, the final actual concentrations were 0.13%, 0.17% and 0.25% (w/v), requiring serving sizes
of 576 mL, 441 mL and 300 mL, respectively, to ensure the delivery of 0.75 g beta-glucan per
serving. The protocol for the preparation of 1 L of beverage containing, for example, 0.2% (w/v)
BG or iBG is shown in Fig. 4-1. This protocol was adopted after trying different approaches to
blending of ingredients. Water was added slowly while stirring manually and vigorously into the
beaker containing BG or iBG. It took up to 1 h of heating for the complete dissolution of BG,
while around 15 min was sufficient for the iBG.
4.2.3 Determination of physicochemical properties
Physicochemical properties of food-grade iBG (batch no. 16-J3) were determined, in terms of
particle morphology, surface area and CoQ10 loading amount, according to the protocols
described in Chapter 3 (Sections 3.2.4, 3.2.5, 3.2.8)

70
Figure 4-1. Protocol for the laboratory scale preparation of 1 L orange-flavored functional
beverage containing 0.2% (w/v) BG or iBG.
4.2.3.1 Viscosity
Prior to receiving the food-grade iBG (batch no. 16-J3), non-food grade iBG (batch no.
15-D1) and food-grade BG (batch no. 15-E1) were used to formulate preliminary beverages. The
effects of concentration (0.15%, 0.2% and 0.3%, w/v), temperature (4 oC and 25 oC), shear rate
(1.29-129 s-1) and the presence of citric acid on the viscosity of beverages prepared with BG or
iBG were evaluated. Sample preparation for viscosity measurements was similar to that

71
described in Chapter 3 (Section 3.2.9). After BG or iBG solutions were cooled, water was added
to make up for evaporation losses and to adjust the concentration. Stevia extract, orange flavor
powder and colorant were added. Citric acid was added, depending on the treatment. In addition,
the viscosity of the beverage containing 0.2% food-grade iBG was evaluated to determine if the
two batches of iBG were comparable.
4.2.3.2 Color
Beverages prepared with 0.2% (w/v) BG and iBG powder were used for color measurement
as described in Chapter 3 (Section 3.2.10) and the total color difference (∆E) and yellowness
index (YI) were calculated according to Equations (3.6) and (3.8).
4.2.4 Sensory evaluation
4.2.4.1 Experimental design
The sensory attributes of orange-flavored beverages prepared at three concentrations (0.15%,
0.2% and 0.3%, w/v) of BG, served at room temperature (~25 oC) and refrigerator temperature
(~4 oC) were evaluated by a trained panel. Based on the feedback of participants in the trained
panel, one concentration and one temperature (0.2%, 4 oC) were chosen to prepare the beverages
containing iBG for the consumer panel to evaluate the overall acceptance. In between, a triangle
test was performed to determine if there was an overall difference between beverages formulated
with BG and iBG. All samples were served in 30 mL portions in plastic containers with sealable

72
lids and coded with randomized three-digit numbers. All participants recruited for the three
panels were students and staff of the University of Alberta. The experimental protocols were
approved by the Research Ethics Board of the University of Alberta.
4.2.4.2 Trained panel
Descriptive analysis was conducted according to the “General guidance for the selection,
training and monitoring of selected and expert assessors” (BS ISO 8589, 2014). One screening
session was held first to determine impairment and sensory acuity, and also to evaluate a
candidate’s potential for describing and communicating sensory perceptions (Appendix A.1).
Based on the screening results, 12 participants (11 women, age 18-29 years) were recruited for
training, prior to the evaluation of beverages. Seven training sessions were held over two weeks
to train the panelists on the assessment of 7 attributes, including orange flavor, sweetness,
sourness, aftertaste, metallic taste, bitterness and viscosity. In each session, participants were
trained on one attribute. The next session started with a refresher of the attributes previously
trained before moving on to a new attribute. Participants were trained on how to evaluate
samples on a 15-point category scale during the first session. Water was used as the reference
sample to represent “None”, and solutions prepared with different concentrations of ingredients
were used as standard solutions (Table 4-2) for the training in the use of scales for the different
attributes.
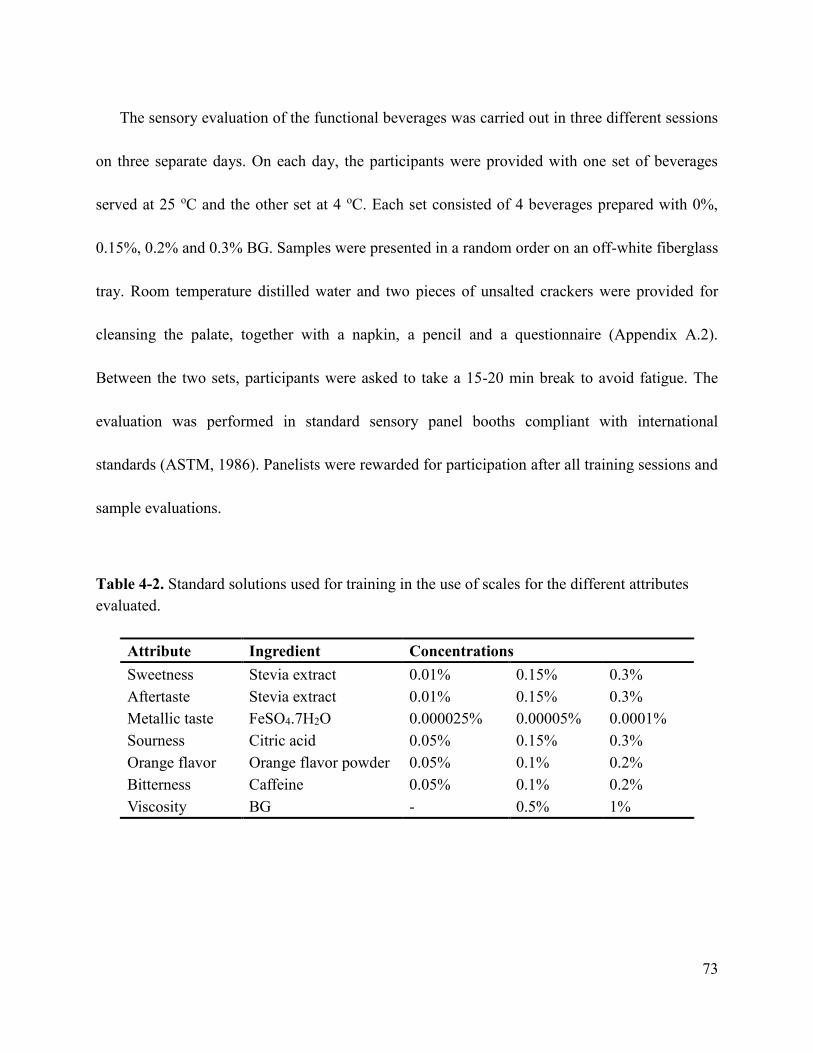
73
The sensory evaluation of the functional beverages was carried out in three different sessions
on three separate days. On each day, the participants were provided with one set of beverages
served at 25 oC and the other set at 4 oC. Each set consisted of 4 beverages prepared with 0%,
0.15%, 0.2% and 0.3% BG. Samples were presented in a random order on an off-white fiberglass
tray. Room temperature distilled water and two pieces of unsalted crackers were provided for
cleansing the palate, together with a napkin, a pencil and a questionnaire (Appendix A.2).
Between the two sets, participants were asked to take a 15-20 min break to avoid fatigue. The
evaluation was performed in standard sensory panel booths compliant with international
standards (ASTM, 1986). Panelists were rewarded for participation after all training sessions and
sample evaluations.
Table 4-2. Standard solutions used for training in the use of scales for the different attributes
evaluated.
Attribute Ingredient Concentrations
Sweetness Stevia extract 0.01% 0.15% 0.3%
Aftertaste Stevia extract 0.01% 0.15% 0.3%
Metallic taste FeSO4.7H2O 0.000025% 0.00005% 0.0001%
Sourness Citric acid 0.05% 0.15% 0.3%
Orange flavor Orange flavor powder 0.05% 0.1% 0.2%
Bitterness Caffeine 0.05% 0.1% 0.2%
Viscosity BG - 0.5% 1%

74
4.2.4.3 Triangle test
Triangle test was conducted according to ISO 4120 (2004) to determine if there is an overall
difference between the beverages prepared with 0.2% (w/v) iBG and BG. The panel consisted of
30 assessors (18 women, aged 18-49 years). The three beverages presented were either two iBG
beverages and one BG beverage, or two BG beverages and one iBG beverage. They were served
at 4 oC and presented in a balanced order with 5 blocks. Participants were also provided with
room temperature distilled water, two pieces of unsalted crackers, a napkin, a pencil and a
questionnaire (Appendix A.3). The evaluation was performed in standard sensory panel booths
with red light to avoid interference due to beverage color. The proportion distinguished (pd) was
calculated as follows:
𝑝𝑑 = [1.5(𝑥𝑛⁄ ) − 0.5] = 1.5𝑧𝛽√(𝑛𝑥 − 𝑥2)/𝑛3 (4.1)
where x is the number of correct answers, n is the number of assessors and zβ varies as follows:
1.28 for β = 0.10, 1.64 for β = 0.05, 2.33 for β = 0.01, and 3.09 for β = 0.001.
4.2.4.4 Consumer panel
Ideal profile method (IPM) was applied for the consumer panel. In this method, panelists
were asked to rate not only the perceived intensity of a list of attributes for each product tested,
but also the ideal intensity of those attributes, which could help with improving the existing
products (Worch et al., 2012). A total of 102 participants (60 women, 94% aged 18-39 years and
75
6% aged 40-59 years) were recruited at the Agriculture/Forestry Centre, University of Alberta.
General information about the project was explained to the potential participants. Once they
agreed to participate, panelists were guided into a sensory panel booth, where an off-white
fiberglass tray containing beverages, a glass of room temperature distilled water, two pieces of
unsalted crackers, a napkin, a pencil and a questionnaire (Appendix A.4) were provided.
Beverages were provided in two sets served at 4oC. The first set included one beverage without
iBG, one beverage with 0.2% iBG and one Vitaminwater®. Participants informed one of the
panel coordinators after they finished the first set, and then the second set including one beverage
with 0.2% iBG and one beverage with 0% iBG was provided. Beverages served in the second set
were identical to those in the first set, but the panelists had to read the provided health benefits
information regarding beta-glucan, CoQ10 and stevia extract prior to evaluation (Table 4-3). The
overall acceptance of beverages scored by participants without any health information in the first
set was treated as “pre-information acceptance”, while that scored after health information was
provided was referred to as “post-information acceptance”. The difference in the overall
acceptance was calculated as “post-information acceptance” minus “pre-information acceptance”,
with positive values identified as “like more”, zero as “no change” and negative values as “like
less”. The order of beverages was balanced according to Williams square design (Williams,
1949). Participants evaluated the intensity of orange flavor, sweetness, sourness, aftertaste,
bitterness, metallic taste and thickness on a nine-point scale with “Weak” scored as 1 and
“Strong” scored as 9. In addition, a nine-point hedonic scale (1=Dislike extremely, 2=Dislike

76
Table 4-3. The provided health benefits information regarding beta-glucan, CoQ10 and stevia
extract.
Beverage containing 0.2% iBG Beverage containing 0% iBG
Stevia Extract (Rebaudioside A):
non-sugar sweetener
natural sweetener
zero calories
Beta-glucan:
soluble dietary fiber
0.75g per serving beta-glucan helps
reduce/lower cholesterol, a risk factor
for heart disease
health claim approved by Health
Canada
Coenzyme Q10:
vitamin-like antioxidant
help maintain cardiovascular health
Stevia Extract (Rebaudioside A):
non-sugar sweetener
natural sweetener
zero calories
very much, 3=Dislike moderately, 4=Dislike slightly, 5=Neither like nor like, 6=Like slightly,
7=Like moderately, 8=Like very much, 9=Like extremely) was used to evaluate the overall
acceptance of each beverage. Participants were also asked to score their ideal intensity for all of
the above attributes at the end. All consumer panelists were offered sweet treats after
participation.
4.2.5 Statistical analysis
Evaluation of each beverage by the trained panel was performed in triplicate. Panelists
participating in the triangle test and consumer panel performed a single evaluation. Color of the
0.2% iBG and 0.2% BG beverages, and viscosity of all treatments were measured in duplicate.

77
CoQ10 loading amount was determined in triplicate. Analyses were performed in R 3.2.3 using
the car, agricolae, lsmeans and SensoMineR packages (R Core Team, 2015; Mendiburu, 2015;
Fox and Weisberg, 2011; Lenth 2016; Husson et al., 2014). For the results of the trained and
consumer panels, analysis of variance (ANOVA) was conducted. Tukey’s test was performed for
the multiple comparison of the means with significance defined at p<0.05. Specifically, for the
trained panel data, a two-way ANOVA was performed for each attribute by specifying serving
temperature, BG concentration and their interaction as the fixed effects and participants as the
random effect. However, for the consumer panel data, a one-way ANOVA was performed for
each attribute by specifying beverages as the fixed effect and both participants and sample order
as the random effects. Principal component analysis (PCA) was also performed on the consumer
panel data to evaluate the product space among 0% iBG beverage, 0.2% iBG beverage,
Vitaminwater® and ideal product. For the results of the triangle test, means were compared by
paired t-test of least square means with significance defined at p<0.05.
4.3 Results and discussion
4.3.1 Beverage formulation development
With the increased awareness of the link between diet and health, the functional foods market
is continually growing since it was first introduced in the mid-1980s (Ozen et al., 2012). The
functional beverages sector is a sub-sector of the functional foods, where the beverages not only
hydrate one’s body, but also provide overall nutritional well-being. It remains the first choice for

78
the functional foods category among consumers, due to its convenience and the possibility to
meet consumer demand for health-benefiting ingredients, size and appearance (Corbo et al.,
2014). In addition, fiber, vitamins, antioxidants, omega-3s, green tea extract and probiotics have
been the most popular ingredients in functional beverages in the 2010s (Sloan and Hutt, 2012).
Meanwhile, with the fast spreading condition of obesity and diabetes, artificial sweeteners such
as non-caloric sweeteners or low glycaemic index sweeteners have been used as an alternative to
decrease the intake of sugar. In 2005, around 50% of the new food and drink products were
manufactured with sucralose, while 32% and 20% contained aspartame and Acesulfame K,
respectively (Mintel Group I, 2005). However, there is ongoing debate over whether such
extensive usage of these artificial sweetener could lead to health problems (i.e., dysregulation of
food intake) (Swithers et al., 2006). Recently, a zero-calorie natural sweetener, which is an
extract from Stevia rebaudiana leaves, received much attention. Vitaminwater® (Zero) is one of
the popular functional beverages in the market, which is sweetened with stevia and provides
vitamins and minerals; therefore, it was selected as the reference in this study to develop the
prototype functional beverage formulated with iBG and stevia. Also, orange flavor still remains a
highly popular beverage flavor, according to “2016 flavor trends for food and beverage”
(Grebow, 2016). Therefore, an orange-flavored functional beverage sweetened with stevia was
the first prototype in the current study to explore the potential of iBG as a functional ingredient
in beverage products.
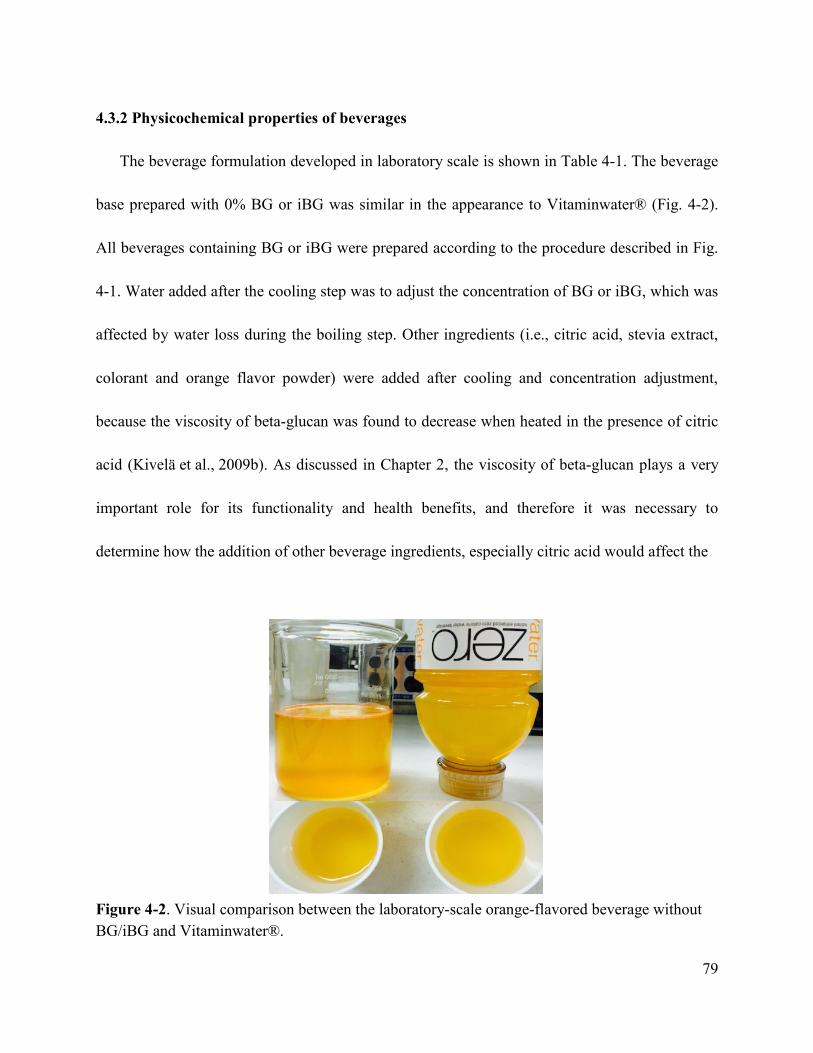
79
4.3.2 Physicochemical properties of beverages
The beverage formulation developed in laboratory scale is shown in Table 4-1. The beverage
base prepared with 0% BG or iBG was similar in the appearance to Vitaminwater® (Fig. 4-2).
All beverages containing BG or iBG were prepared according to the procedure described in Fig.
4-1. Water added after the cooling step was to adjust the concentration of BG or iBG, which was
affected by water loss during the boiling step. Other ingredients (i.e., citric acid, stevia extract,
colorant and orange flavor powder) were added after cooling and concentration adjustment,
because the viscosity of beta-glucan was found to decrease when heated in the presence of citric
acid (Kivelä et al., 2009b). As discussed in Chapter 2, the viscosity of beta-glucan plays a very
important role for its functionality and health benefits, and therefore it was necessary to
determine how the addition of other beverage ingredients, especially citric acid would affect the
Figure 4-2. Visual comparison between the laboratory-scale orange-flavored beverage without
BG/iBG and Vitaminwater®.

80
viscosity of the beverage, which is also responsible for mouthfeel. In addition, the effects of BG
or iBG concentration (0.15%, 0.2% and 0.3%, w/v), temperature (0-80 oC) and shear rate
(1.29-129 s-1) on beverage viscosity were evaluated. The beverages used for viscosity
measurements were prepared with non-food-grade iBG (batch no. 15-D1).
The results of viscosity measurements are presented in Figs. 4-3 and 4-4. The viscosity of
iBG beverages was similar to that of BG beverages under all conditions tested, which indicated
that neither impregnation using the PGX process nor the addition of CoQ10 induced any effect
on the structure of BG. In addition, the presence of citric acid had no effect on the viscosity of
beverages, which was in agreement with Kivelä et al. (2009b) who reported that only ascorbic
acid caused an immediate decrease in the viscosity of beta-glucan, compared with citric and malic
acids, because ascorbic acid can participate in oxidative cleavage by reducing dissolved oxygen to
produce OH-radicals, which induced depolymerisation of beta-glucan (Kivelä et al., 2009a).
Furthermore, as expected, the effects of temperature and shear rate on beverage viscosity were
similar to those found in Chapter 3 for BG and iBG solutions: i) increased temperature caused a
decrease in viscosity, and ii) viscosity did not change with increased shear rate.
After receiving the food-grade iBG (batch no. 16-J3), all viscosity measurements were repeated
for the beverage containing 0.2% food-grade iBG, and the results indicated that these two iBG
samples had similar viscosity behavior and, thus, the viscosity data generated with non-food grade
iBG could be used to predict the behavior of the beverages prepared with food-grade iBG.
Additionally, food-grade iBG had a surface area of 21.8 m2/g. Its particle morphology was also

81
Figure 4-3. Viscosity of beverages prepared with 0.15% (∆), 0.2% (O) and 0.3% ( ) BG (blue) or iBG (yellow) as a function of
shear rate at (A) 25 oC, with citric acid; (B) 25 oC, without citric acid; (C) 4 oC, with citric acid; (D) 4 oC, without citric acid. Data
were presented as mean values and error bars based on duplicate measurements.
0
2
4
6
8
10
12
14
0 10 20 30 40 50 60 70 80 90 100 110 120 130
Vis
cosi
ty (
mP
a.s
)
Shear rate (s-1)
A
0
2
4
6
8
10
12
14
0 10 20 30 40 50 60 70 80 90 100 110 120 130
Vis
cso
sity
(m
Pa
.s)
Shear rate (s-1)
B
0
2
4
6
8
10
12
14
0 10 20 30 40 50 60 70 80 90 100 110 120 130
VIs
cosi
ty (
mP
a.s
)
Shear rate (s-1)
C
0
2
4
6
8
10
12
14
0 10 20 30 40 50 60 70 80 90 100 110 120 130
Vis
cosi
ty (
mP
a.s
)
Shear rate (s-1)
D

82
Figure 4-4. Viscosity of beverages prepared with 0.15% (∆), 0.2% (O) and 0.3% ( ) BG (blue) or iBG (yellow) as a function of
temperature, at a shear rate of 50 s-1 (A) with citric acid; (B) without citric acid. Data were presented as mean values and error bars
based on duplicate measurements.
0
2
4
6
8
10
12
14
0 10 20 30 40 50 60 70 80
Vis
cosi
ty (
mP
a.s
)
Temperature (℃)
A
0
2
4
6
8
10
12
14
0 10 20 30 40 50 60 70 80
Vis
cosi
ty (
mP
a.s
)
Temperature (℃)
B
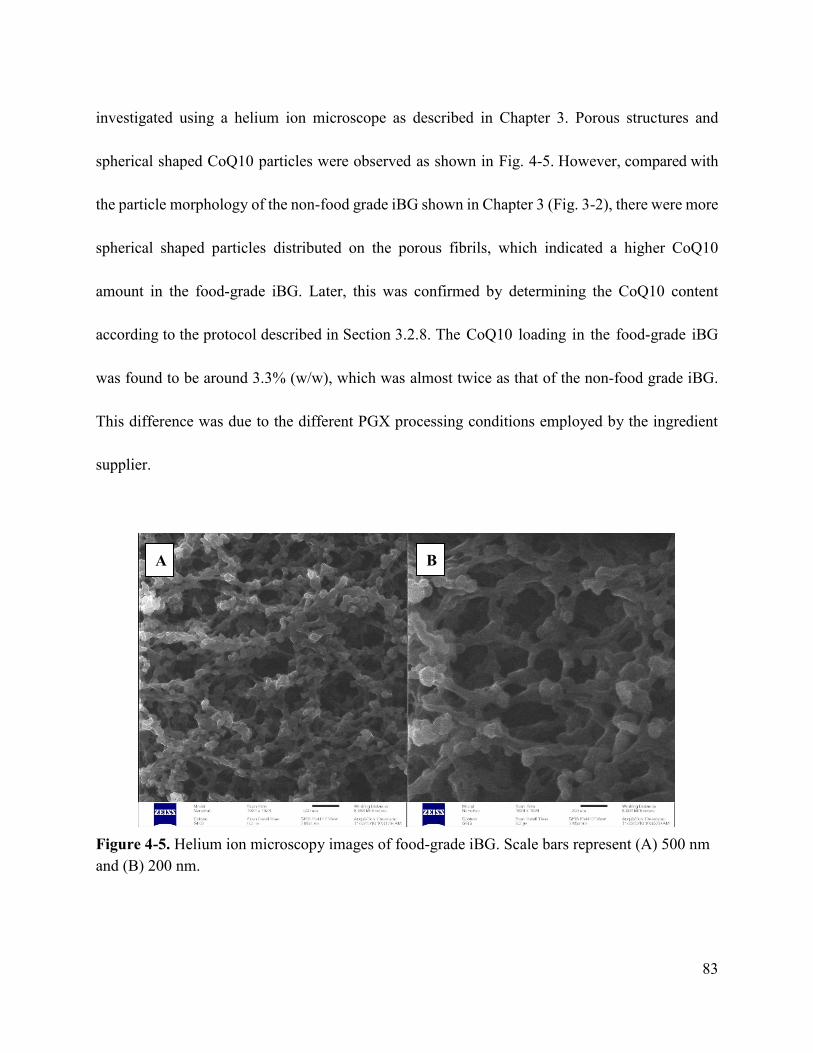
83
investigated using a helium ion microscope as described in Chapter 3. Porous structures and
spherical shaped CoQ10 particles were observed as shown in Fig. 4-5. However, compared with
the particle morphology of the non-food grade iBG shown in Chapter 3 (Fig. 3-2), there were more
spherical shaped particles distributed on the porous fibrils, which indicated a higher CoQ10
amount in the food-grade iBG. Later, this was confirmed by determining the CoQ10 content
according to the protocol described in Section 3.2.8. The CoQ10 loading in the food-grade iBG
was found to be around 3.3% (w/w), which was almost twice as that of the non-food grade iBG.
This difference was due to the different PGX processing conditions employed by the ingredient
supplier.
Figure 4-5. Helium ion microscopy images of food-grade iBG. Scale bars represent (A) 500 nm
and (B) 200 nm.
A B

84
The color of these 0.2% BG and 0.2% iBG beverages were measured to see if there is any
difference in appearance. Total color difference and yellowness index were calculated and
presented in Fig. 4-6, which showed the similarity of the two beverages, indicating that the
orange colorant dominated the yellow color induced by iBG.
Figure 4-6. Total color difference (∆E) and yellowness index (YI) of beverage samples prepared
with 0.2% (w/v) BG and iBG (p>0.05).
4.3.3 Sensory evaluation
4.3.3.1 Trained panel
The beverage product had complex interactions between its various attributes evaluated
(orange flavor, sweetness, sourness, aftertaste, metallic taste, bitterness and viscosity). It was
anticipated to quantify and describe such interactions using the trained panel; however, upon data
0
5
10
15
20
25
30
35
BG iBG
Ind
ex
Beverages
Total color difference (△E)
Yellowness index (YI)

85
analysis, it became apparent that 7 sessions of training were not sufficient and no solid
conclusions could be drawn due to significant panelist effect. The results obtained, problems and
recommendation for future research are presented in Appendix B. Regardless, this semi-trained
panel indicated that they liked the 0.2% BG product served at 4 oC the best, and therefore these
levels were adopted for the consumer panel.
4.3.3.2 Triangle test
Triangle test was performed to determine if consumers could distinguish between BG and
iBG beverages. The orange colorant used was physically ground annatto seeds, and its
dispersibility in water was not uniform due to impurities, therefore red light was used to avoid
any interference due to the beverage appearance. A total of 6 out of the 30 assessors correctly
identified the odd sample in the test. Therefore, it could be concluded with 99% certainty (i.e. β
= 0.01) that no more than 5.5% of the population are able to detect a difference between the
beverages prepared with 0.2% iBG and 0.2% BG. The addition of this small amount (3.3%, w/w)
of CoQ10 would not affect the beverage flavor. Overall, no difference in the sensory attributes,
including taste and appearance could be detected between the orange-flavored functional
beverages prepared with iBG and BG.
86
4.3.3.3 Consumer panel
The beverage formulated with 0.2% iBG and served at 4 oC was selected for the consumer
panel, based on the feedback given by the semi-trained panel. They found that the sourness and
aftertaste were less intense at the cold temperature. In addition, the viscosity of 0.2% iBG
beverage at 4 oC contributed to a smooth mouthfeel, while the 0.3% iBG beverage was described
as slimy. For the consumer panel, Vitaminwater®, which is one of the popular functional
beverages in the market, was taken as the reference. Also, a beverage without iBG was provided
to determine whether consumers accepted the addition of iBG or not.
IPM was applied in the consumer panel to generate a beverage profile, an ideal product
profile and overall acceptance of beverages. A total of 102 participants were recruited, and their
demographic information is provided in Table 4-4. However, 11 participants were removed prior
to data analysis, because they indicated that they have never consumed functional beverages
before. The attribute intensities of beverages and ideal product evaluated by the consumer panel
(n=91) are shown in Table 4-5. Overall, all three beverages were weak in bitterness, metallic
taste and thickness, but moderate in orange flavor, sweetness, sourness and aftertaste.
Vitaminwater® was similar to the ideal product in terms of all the attributes other than metallic
taste, which explained its popularity. As expected, the 0.2% iBG beverage was thicker than that
without iBG, due to the presence of soluble dietary fiber. There was no significant difference
between 0% iBG and 0.2% iBG beverages, in terms of orange flavor, sweetness, aftertaste,
sourness, bitterness and metallic taste.

87
Table 4-4. Demographic information of the consumer panel (n=102).
Question Category Frequency
Gender Male 59%
Female 41%
Age 18-39 94%
40-59 6%
Frequency of consuming a functional drink
Once or more per day
5%
Once per week 20%
Once per month 25%
Several times per year 39%
Never 11%
Ingredient(s) that is looked for, when consuming
functional beverages (select all that apply)
Dietary fiber
22%
Vitamin 81%
Low calories or zero calorie 40%
Protein 21%
Caffeinated 22%
Minerals 40%
Sweetener(s) consumed/purchased in the past 6
months (select all that apply)
White granulated sugar
75%
High fructose corn syrup 23%
Aspartame 23%
Sucralose 17%
Saccharin 10%
Acesulfame K 1%
Stevia extract 12%
Consistency preferred in a functional beverage
Watery
56%
Medium 24%
Thick, smoothie-type 20%
Flavour(s) preferred in functional beverages
(select all that apply)
Orange
74%
Berry 34%
Pineapple 37%
Apple 36%
Peach 47%
Cherry 23%
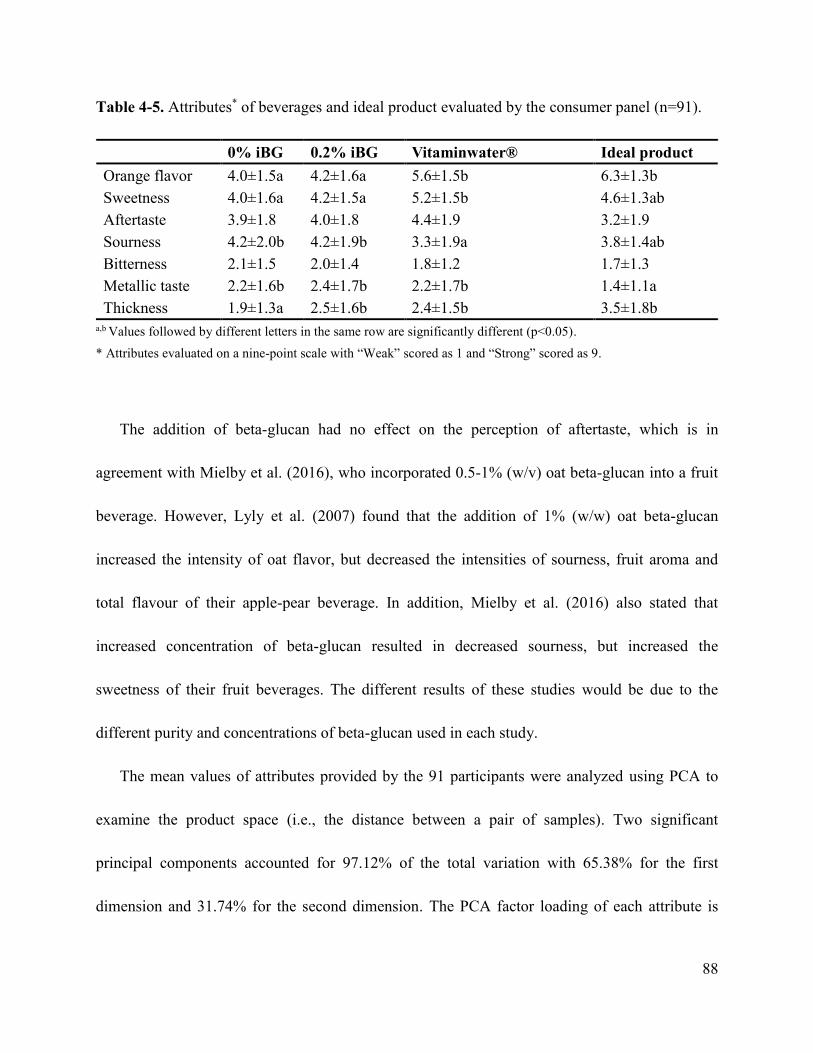
88
Table 4-5. Attributes* of beverages and ideal product evaluated by the consumer panel (n=91).
0% iBG 0.2% iBG Vitaminwater® Ideal product
Orange flavor 4.0±1.5a 4.2±1.6a 5.6±1.5b 6.3±1.3b
Sweetness 4.0±1.6a 4.2±1.5a 5.2±1.5b 4.6±1.3ab
Aftertaste 3.9±1.8 4.0±1.8 4.4±1.9 3.2±1.9
Sourness 4.2±2.0b 4.2±1.9b 3.3±1.9a 3.8±1.4ab
Bitterness 2.1±1.5 2.0±1.4 1.8±1.2 1.7±1.3
Metallic taste 2.2±1.6b 2.4±1.7b 2.2±1.7b 1.4±1.1a
Thickness 1.9±1.3a 2.5±1.6b 2.4±1.5b 3.5±1.8b a,b Values followed by different letters in the same row are significantly different (p<0.05).
* Attributes evaluated on a nine-point scale with “Weak” scored as 1 and “Strong” scored as 9.
The addition of beta-glucan had no effect on the perception of aftertaste, which is in
agreement with Mielby et al. (2016), who incorporated 0.5-1% (w/v) oat beta-glucan into a fruit
beverage. However, Lyly et al. (2007) found that the addition of 1% (w/w) oat beta-glucan
increased the intensity of oat flavor, but decreased the intensities of sourness, fruit aroma and
total flavour of their apple-pear beverage. In addition, Mielby et al. (2016) also stated that
increased concentration of beta-glucan resulted in decreased sourness, but increased the
sweetness of their fruit beverages. The different results of these studies would be due to the
different purity and concentrations of beta-glucan used in each study.
The mean values of attributes provided by the 91 participants were analyzed using PCA to
examine the product space (i.e., the distance between a pair of samples). Two significant
principal components accounted for 97.12% of the total variation with 65.38% for the first
dimension and 31.74% for the second dimension. The PCA factor loading of each attribute is

89
presented in Table 4-6. All the variance of the seven attributes was explained with three
significant principal components, indicating that some attributes were highly associated.
Evaluation of each participant showed that except for a few outliers, most participants evaluated
each sample quite consistently (Fig. 4-7A). The product space is presented in Fig. 4-7B, showing
that the ideal product had a higher factor loading on the negative half of the first dimension,
while 0.2% iBG and 0% iBG beverages were located close to each other on the positive half of
the first dimension (Table 4-7). Vitaminwater® was characterized in the positive half of the
second principle component (Table 4-7). By combining the attribute information on the variable
factor map (Fig. 4-7C), it was found that Vitaminwater® had higher factor loading for “sweet”,
while the attribute for the ideal product was “thick”. Additionally, “bitter”, “sour” and to a
smaller extent “metallic taste” were attributes that characterized both 0.2% iBG and 0% iBG
beverages. The interpretation from PCA was consistent with the findings in Table 4-5.
Table 4-6. Loadings of 7 attributes on three significant principal components (n=91).
Attribute Dim.1 Dim.2 Dim.3
Orange flavor -0.99 0.08 -0.08
Sweetness -0.69 0.73 0.01
Aftertaste 0.46 0.88 0.08
Sourness 0.68 -0.73 0.10
Bitterness 0.99 -0.08 -0.12
Metallic taste 0.85 0.46 0.25
Thickness -0.85 -0.42 0.32

90
-10 0 10 20
-15
-10
-50
510
15
Dim 1 (65.38%)
Dim
2 (
31
.74%
)
0.2% iBG Beverage0% iBG BeverageIdeal product
Vitamin water
Individual description
-4 -2 0 2 4
-20
24
Dim 1 (65.38%)
Dim
2 (
31
.74%
)
Confidence ellipses for the mean points
0.2% iBG Beverage
0% iBG Beverage
Ideal product
Vitamin water
A
B

91
Figure 4-7. Principal component analysis (PCA) of the data of ideal product (green),
Vitaminwater® (blue), 0% iBG beverage (red) and 0.2% iBG beverage (black), in terms of (A)
individual description with individual scores (•) and means ( ); (B) confidence ellipses of mean
points; and (C) variable factor map.
Table 4-7. Loadings of 4 products on three significant principal components (n=91).
Dim.1 Dim.2 Dim.3
0% iBG beverage 2.39 -0.63 -0.56
0.2% iBG beverage 1.60 -0.35 0.70
Vitaminwater® -0.99 2.48 -0.08
Ideal product -3.00 -1.51 -0.05
-1.5 -1.0 -0.5 0.0 0.5 1.0 1.5
-1.0
-0.5
0.0
0.5
1.0
Variables factor map (PCA)
Dim 1 (65.38%)
Dim
2 (
31.7
4%
)
Orange
Sweet
Sour
Bitter
Aftertaste
Metallic
Thick
Orange
Sweet
Sour
Bitter
Aftertaste
Metallic
Thick
C

92
The perception of bitterness, aftertaste and metallic taste induced by stevia extract would
have a negative effect on the sensory satisfaction of the targeted beverages, but a health claim
was reported to have a higher potential added value on the overall acceptance of a product with
negative attributes (Tuorila and Cardello, 2002; Sabbe et al., 2009). Therefore, the effect of
health information (Table 4-3) on the overall acceptance was evaluated. There was no significant
difference between the pre-information (5.1±1.6) and the post-information (5.3±1.6) acceptance
of the beverage without iBG. But a positive effect of the provided health information on the
overall acceptance was found for the 0.2% iBG beverage with the pre-information acceptance of
5.2±1.5 and the post-information acceptance of 5.9±1.4.
By evaluating the overall acceptability difference (Fig. 4-8), over half of the participants
(52%) liked the 0.2% iBG beverage more after providing health information, while 33% did not
change their mind, probably because they were not interested in the ingredients in these
beverages. Among these 30 participants who did not change their mind, 83% of them selected
“vitamin” as their ingredient of interest in a functional beverage, while only 4 participants chose
“dietary fiber”. In addition, there was almost 2.5 times as many participants who liked the 0%
iBG beverage less after reading the provided health information, compared with the 0.2% iBG
beverage. Health information for these two beverages were provided side by side in the current
study, and thus a potential comparison between beverages could exist, such that the beverage
with more ingredients providing health benefits would reduce the acceptance of the beverage
with fewer healthy ingredients for participants who responded favorably to the information.

93
Figure 4-8. Frequency distribution of the overall acceptability difference for consumer panel
scores (on a 9-point hedonic scale) for beverages with 0.2% (w/v) iBG and 0% iBG. The
difference was calculated as “post-information acceptance” minus “pre-information acceptance”.
Positive values=like more; zero=no change; negative values=like less.
In a study of fruit juices with different concentrations of açaí, overall acceptance was highly
influenced by participant gender, age, personal characteristics (i.e., food neophobia) and
education background (Sabbe et al., 2009). Women and elder people were reported as the group
who cared the most about the health-promoting ingredients, especially fiber and antioxidants,
and a higher overall acceptance was generally associated with this group when rating a
functional product with provided ingredient information (Ares et al., 2009). Also, health and
0
5
10
15
20
25
30
35
-4 -3 -2 -1 0 1 2 3 4 5
Fre
qu
ency
(%
)
Overall Acceptability Difference
0% iBG Beverage
0.2% iBG Beverage

94
nutrition claims were only positively perceived by specific target consumers who are interested
in the ingredient, understand the benefits, and expect the product with such claims to help them
in reaching their overall health goals (Buul and Brouns, 2015). Thus, in the present study, a
target group comprised of 47 participants who scored higher on post-information acceptance
(overall acceptance difference = 1, 2, 3, 4) was selected to determine how they evaluated the
target beverages, which would help with beverage formulation improvement. In this target group,
there were 30 women, which could explain the reason for positive values of the overall
acceptance difference. However, a total of 40 out of the 47 participants were 18-29 years of age,
which was not in agreement with the previous findings. The main reason would be the location
of recruitment. All participants were recruited at the Agriculture/Forestry Centre, University of
Alberta, so most were highly educated university students. Evaluation of the influence of
demographic factors on product acceptance cannot be done with this convenience sample of
university students. However, as this group of educated individuals responded positively to
health messages, they may be a target market for these functional beverage products and their
insight on the product attributes is valuable. Furthermore, the format of the health information
presentation was also found to have an effect on the overall product acceptance in a previous
study, stating that disease-related health benefits with a healthy image or health positioning
history could result in a preference of a functional product (Kleef et al., 2005).
To improve the beverage formulation, attribute intensity of beverages and the ideal product
evaluated by the target group of 47 participants was assessed further (Table 4-8). The product

95
space among samples (Appendix C) was similar to that generated with the data of 91 participants
(Fig. 4-7). In contrast to the evaluation of the whole group of 91 consumers (Table 4-5), the
target group of 47 consumers found the 0.2% iBG beverage to be similar to their ideal product in
terms of metallic taste (Table 4-8). Even though the thickness of the ideal product was not
significantly different from that of the 0.2% iBG beverage, the radar chart (Fig. 4-9) indicated
Table 4-8. Attributes* of beverages and ideal product evaluated by the target consumer group
(n=47)
0% iBG 0.2% iBG Vitaminwater® Ideal product
Orange flavor 4.0±1.6a 3.9±1.6a 5.7±1.5b 6.4±1.2b
Sweetness 3.7±1.5a 4.1±1.7ab 5.0±1.5c 4.8±1.3bc
Aftertaste 3.8±1.5 4.3±1.9 4.4±2.1 3.3±1.9
Sourness 4.4±2.1b 4.3±2.1b 3.4±1.8a 3.8±1.3ab
Bitterness 1.6±1.6 2.3±1.5 1.9±1.2 1.8±1.3
Metallic taste 2.4±1.7 2.7±1.8 2.4±1.8 1.5±1.0
Thickness 1.8±1.1a 2.6±1.6b 2.4±1.5ab 3.6±1.7b
a,b Values followed by different letters in the same row are significantly different (p<0.05).
* Attributes evaluated on a nine-point scale with “Weak” scored as 1 and “Strong” scored as 9.
that there was still opportunity to incorporate a higher concentration of iBG, because from a
health perspective, a higher concentration of beta-glucan is desired. When it is indicated that
dietary fiber is added to a beverage, the consumers would expect a more viscous mouthfeel to
confirm its presence; therefore, they sought a thicker beverage in this study, although around 55%
of the 91 participants stated they prefer the consistency of water for functional beverages.
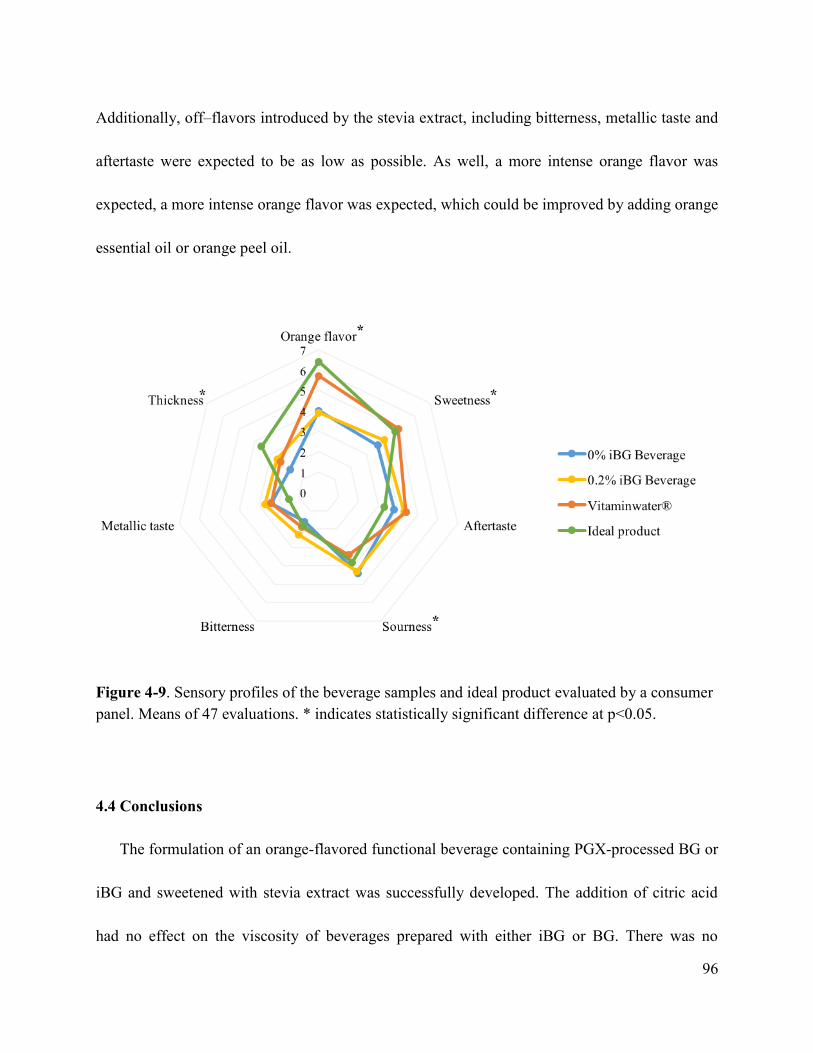
96
Additionally, off–flavors introduced by the stevia extract, including bitterness, metallic taste and
aftertaste were expected to be as low as possible. As well, a more intense orange flavor was
expected, a more intense orange flavor was expected, which could be improved by adding orange
essential oil or orange peel oil.
Figure 4-9. Sensory profiles of the beverage samples and ideal product evaluated by a consumer
panel. Means of 47 evaluations. * indicates statistically significant difference at p<0.05.
4.4 Conclusions
The formulation of an orange-flavored functional beverage containing PGX-processed BG or
iBG and sweetened with stevia extract was successfully developed. The addition of citric acid
had no effect on the viscosity of beverages prepared with either iBG or BG. There was no

97
detectable difference between iBG and BG beverages, indicating that the presence of 3.3% (w/w)
CoQ10 did not introduce any effect on the sensory attributes of the functional beverages. Also,
the addition of 0.2% iBG had no effect on any of the sensory attributes evaluated other than
thickness when compared with the 0% iBG beverage. Providing health information regarding the
ingredients yielded a positive overall acceptance for the 0.2% iBG beverage. The formulation
can be further improved with the addition of a higher iBG concentration and orange essential oil
in the future to satisfy the sensory expectations of the target group of consumers. Overall, the
potential use of both PGX-processed BG and iBG as nutraceutical ingredients in functional
beverages was demonstrated in this study.

98
Chapter 5: Conclusions and recommendations
5.1 Summary of key findings
Beta-glucan obtained from oat and barley is a linear polysaccharide with a large molecular
weight, indicating its great potential for use as a carrier of other bioactive components in particle
formation as delivery systems. However, only a limited number of studies have evaluated this
aspect. In this thesis research, the physicochemical properties of the oat beta-glucan powder (BG)
and CoQ10 impregnated BG powder (iBG) produced by the pressurized gas-expanded liquid
(PGX) technology were studied to characterize such ingredients and explore their potential for
product applications. BG powder was white fibrils with a porous structure (half pore width =
27.9 nm) and high molecular weight (>> 361,000 Da). The purity of BG was 83.6% (w/w) with
impurities including 7.4% (w/w) moisture, 1.5% (w/w) protein, 2.9% (w/w) ash and 4.6% (w/w)
other carbohydrate components. The viscosity of BG solution increased as the concentration
increased from 0.15% to 0.3% (w/v), while exhibiting Newtonian behavior with a constant
viscosity through the shear rate range of 1.29 s-1 to 129 s-1. Also, a decrease in viscosity was
observed at the shear rate of 50 s-1 when temperature was increased from 0 oC to 80 oC.
Furthermore, it was shown that impregnation of BG particles with CoQ10 using the PGX process
did not interrupt the porous structure or affect the viscosity of BG. Compared with BG, iBG was
a yellowish powder, due to the presence of 1.4% (w/w) CoQ10 in its amorphous form. Both BG
(7.7 μm) and iBG (6.1 μm) particles were micrometer-sized particles, while CoQ10 in iBG had a

99
spherical shape and a particle size between 35 nm and 160 nm with the average diameter of 92
nm.
Another major goal of this thesis research was to utilize iBG as a functional ingredient in a
beverage product. An orange-flavored functional beverage formulated with the PGX-processed
BG or iBG, and sweetened with stevia extract was developed. The addition of citric acid had no
effect on the viscosity of beverages prepared with either iBG or BG. The sensory quality of the
beverages was assessed by three different panels. A semi-trained panel (n=12) recommended the
beverage formulated with 0.2% iBG served at 4 oC. The overall difference between beverages
prepared with 0.2% iBG and BG was determined by a triangle test (n=30), and there was 99%
certainty (i.e. β = 0.01) that no more than 5.5% of the population are able to detect a difference
between these two beverages. Ideal profile method was applied to evaluate the consumer
acceptance (n=91) of the 0.2% iBG beverage served at 4 oC. The addition of 0.2% iBG had no
effect on all the sensory attributes evaluated (i.e., orange flavor, sourness, sweetness, bitterness,
metallic taste and aftertaste) other than thickness, when compared with the beverage without iBG.
The effect of health information on the overall acceptance of beverages was also evaluated. After
providing the health information for stevia extract for the beverage without iBG and that for
stevia extract plus beta-glucan and CoQ10 for the 0.2% iBG beverage, around 52% of the
participants liked the 0.2% iBG beverage more (n=47), while 15% of participants liked the
product less. However, for the beverage without iBG, 41% of participants liked it more, while 37%
liked it less after providing health information. Principle component analysis demonstrated the

100
distinction between iBG beverage and the ideal beverage. Based on a comparison with the ideal
product, improvements can be made on the formulation to make the iBG beverage closer to the
ideal product of consumers, including an increase in orange flavor, sweetness and thickness.
Overall, this thesis presents fundamental characterization of iBG and BG ingredients
produced using the PGX process, which should be useful for optimizing the impregnation
conditions and developing novel combinations for the delivery of different bioactives. In
addition, the prototype functional beverage developed exhibited the potential of iBG as a
functional ingredient for incorporation into beverages, and may inspire new applications in food
products or natural health products.
5.2 Recommendations for future work
Based on the findings, it would be worthwhile to investigate the following aspects in future
research:
More analysis, including the proximate composition of iBG, molecular weight of BG, the
effect of boiling on iBG, especially CoQ10 should be done in the future.
The bioavailability of CoQ10 in the iBG should be evaluated to determine if the
impregnation of CoQ10 onto the BG powder helps increase its bioavailability.
The stability of the beverage containing 0.2% iBG, specifically the stability of the
bioactives over the shelf life of the beverage should be evaluated.
The addition of beta-glucan was anticipated to have a masking effect on the off-flavor

101
introduced by stevia extract. Due to the insufficient training of the panelists, it was not
possible to assess this effect fully. Therefore, the potential masking effect of beta-glucan
on the off-flavor of stevia can be evaluated in the future.
For the trained panel, more training time is needed to obtain well-trained panelists and
avoid the panelist effect on the results. Despite the efforts to add more training time in
this study, it was not possible. Alternatively, other methods requiring shorter time, like
free-choice profiling method could be used to do quantitative descriptive analysis.
Recruitment location for the consumer panel could be varied to reflect the product
acceptance of the public. Alternatively, the location could be very specific, like a gym or
physical fitness facility, because the target population of functional beverages is
commonly those who care about their dietary and life style.

102
Bibliography
AACC International. 2000a. Approved Methods of Analysis, 10th Ed. Method 44-16.
Moisture-air-oven (aluminum-plate) method. Approved November 3, 1999. AACC
International, St. Paul, MN, U.S.A.
AACC International. 2000b. Approved Methods of Analysis, 10th Ed. Method 46-09. Crude
protein-automated colorimetric method. Approved November 3, 1999. AACC International,
St. Paul, MN, U.S.A.
AACC International. 2000c. Approved Methods of Analysis, 10th Ed. Method 08-01. Ash-basic
method. Approved November 3, 1999. AACC International, St. Paul, MN, U.S.A.
AACC International. 2000d. Approved Methods of Analysis, 10th Ed. Method 32-23.01.
Beta-glucan content of barley and oats- rapid enzymatic procedure. Approved November 3,
1999. AACC International, St. Paul, MN, U.S.A.
Aberg F, Appelkvist EL, Dallner G, Ernster L. 1992. Distribution and redox state of ubiquinones
in rat and human tissues. Archives of Biochemistry and Biophysics 295: 230–4.
Ahmad A, Anjum FM, Zahoor T, Nawaz H, Dilshad SMR. 2012. Beta glucan: A valuable
functional ingredient in foods. Critical Reviews in Food Science and Nutrition 52(3):
201-12.
Ahmad A, Anjum FM, Zahoor T, Nawaz H, Ahmed Z. 2010. Extraction and characterization of
beta-D-glucan from oat for industrial utilization. International Journal of Biological
Macromolecules 46: 304–9.
Ahmad A, Anjum FM, Zahoor T, Nawaz H, Din A. 2009. Physicochemical and functional
properties of barley beta-glucan as affected by different extraction procedures. International
Journal of Food Science and Technology 44: 181–7.
Aleixandre A, Miguel M. 2008. Dietary fiber in the prevention and treatment of metabolic
syndrome: a review. Critical Reviews in Food Science and Nutrition 48:905–12.
Álvarez D, Barbut S. 2013. Effect of inulin, beta-glucan and their mixtures on emulsion stability,
color, and textural parameters of cooked meat batters. Meat Science 94: 320–7.

103
Amaral L, Morgan D, Stephen AM, Whiting S. 1992. Effect of propionate on lipid-metabolism
in healthy-human subjects. FASEB Journal 6: A1655.
Andersson AAM, Armo E, Grangeon E, Fredriksson H, Andersson R, Aman P. 2004. Molecular
weight and structure units of (1/3, 1/4)-beta-glucans in dough and bread made from hull-less
barley milling fractions. Journal of Cereal Science 40: 195–204.
Angelov A, Gotcheva V, Kuncheva R, Hristozova T. 2006. Development of a new oat-based
probiotic drink. International Journal of Food Microbiology 112(1):75–80.
Ares G, Giménez A, Gámbaro A. 2009. Consumer perceived healthiness and willingness to try
functional milk desserts. Influence of ingredient, ingredient name and health claim. Food
Quality and Preference 20: 50–6.
ASTM D2244-11. 2011. Standard practice for calculation of color tolerances and color
differences from instrumentally measured color coordinates, ASTM International, West
Conshohocken, PA.
ASTM, Committee E-18. 1986. Physical requirement guidelines for sensory evaluation
laboratories. In J. Eggerti, & K. Zook (Eds.), American Society for Testing and Materials.
Philadelphia, PA: ASTM Special Technical Publication 913.
Bacic A, Fincher GB, Stone BA. 2009. Chemistry, biochemistry, and biology of
(1-3)-[beta]-glucans and related polysaccharides. Academic Press/Elsevier, Amsterdam,
The Netherlands, 1st edition.
Ballance GM, Meredith WOS. 1976. Purification and partial characterization of an
endo-beta-1,3-glucanase from green malt. Journal of the Institute of Brewing 82: 64-7.
Baümler ER, Crapiste GH, Carelli AA. 2010. Solvent extraction: kinetic study of major and
minor compounds. Journal of American Oil Chemists’ Society 87: 1489-95.
Beer MU, Wood PJ, Weisz John, Fillion N. 1997. Effect of cooking and storage on the amount
and molecular weight of (1,3)(1,4)-beta-D-glucan extracted from oat products by an in vitro
digestion system. Cereal chemistry 74(6): 705-9.
Benito-Román Ó, Alonso E, Cocero MJ, Goto M. 2016. Beta-glucan recovery from Ganoderma
lucidum by means of pressurized hot water and supercritical CO2. Food and Bioproducts
Processing 98: 21–8.

104
Benito-Román Ó, Alonso E, Palacio L, Prádanos P, Cocero MJ. 2014. Purification and isolation
of beta-glucans from barley: downstream process intensification. Chemical Engineering and
Processing 84: 90–7.
Benito-Román Ó, Alonso E, Gairola K, Cocero MJ. 2013. Fixed-bed extraction of beta-glucan
from cereals by means of pressurized hot water. Journal of Supercritical Fluids 82: 122–8.
Benito-Román Ó, Alonso E, Lucas S. 2011. Optimization of the beta-glucan extraction
conditions from different waxy barley cultivars. Journal of Cereal Science 53: 271-6.
Bentinger M, Brismar K, Dallner G. 2007. The antioxidant role of coenzyme Q. Mitochondrion
7S: S41–50
Bentinger M, Tekle M, Dallner G. 2010. Coenzyme Q – biosynthesis and functions. Biochemical
and Biophysical Research Communications 396: 74–9.
Bergamini C, Cicoira M, Rossi A, Vassanelli C. 2009. Oxidative stress and hyperuricaemia:
pathophysiology, clinical relevance, and therapeutic implications in chronic heart failure.
European Journal of Heart Failure 11: 444–52.
Bhandari KH, Newa M, Kim JA, Yoo BK, Woo JS, Lyoo WS, Lim HT, Choi HG, Yong CS.
2007. Preparation, characterization and evaluation of coenzyme Q10 binary solid
dispersions for enhanced solubility and dissolution. Biological and Pharmaceutical Bulletin
30 (6): 1171−6.
Biorklund M, Holm J. 2008. Serum lipids and postprandial glucose and insulin levels in
hyperlipidemic subjects after consumption of an oat β-glucan-containing ready meal.
Annals of Nutrition and Metabolism 52(2): 83–90.
Biorklund M, van Rees A, Mensink RP, Onning G. 2005. Changes in serum lipids and
postprandial glucose and insulin concentrations after consumption of beverages with
β-glucans from oats or barley: a randomised dose-controlled trial. European Journal of
Clinical Nutrition 59(11): 1272–81.
Bokkelen R. 2012. Reduced-calorie beverages with stevia. FST South African Food Science and
Technology: 17–8.
Boun HR, Huxsoll CC. 1991. Control of minimally processed carrot (Daucus carota) surface
discoloration caused by abrasion peeling. Journal of Food Science 56(2): 416-18.

105
Brennan CS, Tudorica CM, Kuri V. 2002. Soluble and insoluble dietary fibers (non-starch
polysaccharides) and their effects on food structure and nutrition. Food Ind. J. 5: 261–272.
Bule MV, Singhal RS, Kennedy JF. 2010. Microencapsulation of ubiquinone-10 in carbohydrate
matrices for improved stability. Carbohydrate Polymers 82: 1290–6.
Bunaciu AA, Aboul-Enein HY, Fleschin S.2007. FT-IR Spectrophotometric analysis of
coenzyme Q10 (CoQ10) and its pharmaceutical formulations. Preparative Biochemistry &
Biotechnology 37: 59–65.
Burkus Z, Temelli F. 1998. Effect of extraction conditions on yield, composition, and viscosity
stability of barley beta-glucan gum. Cereal chemistry 75(6): 805-9.
Burkus Z, Temelli F. 1999. Gelation of barley beta-glucan concentrate. Journal of Food Science
64(2): 198-201.
Buul V, Brouns F.2015. Nutrition and health claims as marketing tools. Critical reviews in food
science and nutrition 55: 1552-60.
Cavallero A, Empilli S, Brighenti F, Stanca AM. 2002. High (1→3,1→4)- β-glucan barley
fractions in bread making and their effects on human glycemic response. Journal of Cereal
Science 36: 59–66.
Challem J. 2005. Nutrients that enhance energy and prevent DNA damage. In: Feed Your Genes
Right. John Wiley & Sons, Inc. pp. 41–53.
Chan SW, Mirhosseini H, Taip FS, Ling TC, Tan CP. 2013. Stability of CoQ10-loaded
oil-in-water (o/w) emulsion: effect of carrier oil and emulsifier type. Food Biophysics 8:
273-81.
Charpentier PA, Jia M, Lucky RA. 2008. Study of the RESS process for producing
beclomethasone-17, 21-dipropionate particles suitable for pulmonary delivery. AAPS
PharmSciTech 9: 39–46.
Cheuk SY, Shih FF, Champagne ET, Daigle KW, Patindol JA, Mattison CP, Boue SM. 2015.
Nano-encapsulation of coenzyme Q10 using octenyl succinic anhydride modified starch.
Food Chemistry 174: 585-90.

106
Choo CL, Aziz NAA. 2010. Effects of banana flour and beta-glucan on the nutritional and
sensory evaluation of noodles. Food Chemistry 119: 34-40.
Colleoni-Sirghie M, Kovalenko IV, Briggs JL, Fulton B, White PJ. 2003. Rheological and
molecular properties of water soluble(1,3) (1,4)-beta-D-glucans from high- β -glucan and
traditional oat lines. Carbohydrate Polymers 52: 439–47.
Comin LM, Temelli F, Saldaña MDA. 2012. Barley beta-glucan aerogels as a carrier for flax oil
via supercritical CO2. Journal of Food Engineering 111: 625–31.
Corbo MR, Bevilacqua A, Petruzzi L, Casanova FP, Sinigaglia M. 2014. Functional beverages:
the emerging side of functional foods: commercial trends, research, and health implications.
Comprehensive Reviews in Food Science and Food Safety 13: 1192-206.
Cugnet-Anceau C.; Nazare JA, Biorklund M, Le Coquil E, Sassolas A, Sothier M, Holm J,
Landin-Olsson M, Onning G, Laville M, Moulin P. 2010. A controlled study of
consumption of beta-glucan-enriched soups for 2 months by type 2 diabetic free-living
subjects. British Journal of Nutrition 103: 422-8.
Cui SW. 2001. Polysaccharides gums from agricultural products: processing, structure and
functionality, Technomic Publishing Company Inc, Lancaster, USA.
Cui W, Wood PJ. 2000. Relationships between structural features, molecular weight and
rheological properties of cereal beta-D-glucans. In: Nishinari K. (Eds.) Hydrocolloids
Physical Chemistry and Industrial Applications of Gels, Polysaccharides, and Proteins.
Elsevier, Amsterdam. pp. 159–168,
Cummings JH, Pomare EW, Branch WJ, Naylor CPE, Macfarlane GT. 1987. Short chain fatty
acids in human large intestine, portal, hepatic and venous blood. Gut 28(10): 1221–7.
Daou C, Zhang H. 2012. Oat Beta-Glucan: its role in health promotion and prevention of
diseases. Comprehensive Reviews in Food Science and Food Safety (11): 355-65.
Davidson MH, Dugan LD, Burns JH, Bova J, Story K, Drennan KB. 1991. The
hypocholesterolemic effects of β-glucan in oatmeal and oat bran. A dose-controlled study.
Journal of the American Medical Association 265(14): 1833–9.
Davy BM, Melby CL, Beske SD, Ho RC, Davrath LR, Davy KP. 2002. Oat consumption does
not affect resting causal and ambulatory 24-h arterial blood pressure in men with
high-normal blood pressure to stage I hypertension. Journal of Nutrition 132:394–8.
107
Doehlert DC, Moore WR. 1997. Composition of oat bran and flour prepared by three different
mechanisms of dry milling. Cereal Chemistry 74:403-6.
Dongowski G, Drzikova B, Senge B, Blochwitz R, Gebhardt E, Habel A. 2005. Rheological
behaviour of β-glucan preparations from oat products. Food Chemistry 93: 279–91.
Doublier JL, Wood PJ. 1995. Rheological properties of aqueous solutions of (1→3), (1→4)- β
-D-glucan from oats (Avena sativa L.). Cereal Chemistry 72: 335–40.
Du B, Bian Z, Xu B. 2014a. Skin health promotion effects of natural beta-glucan derived from
cereals and microorganisms: a review. Phytotherapy Research 28: 159–66.
Du B, Zhu F, Xu B. 2014b. Beta-glucan extraction from bran of hull-less barley by accelerated
solvent extraction combined with response surface methodology. Journal of Cereal Science
59: 95-100
Ercan P, El SN. 2012. In vitro bioaccessibility of coenzyme Q10 in enriched yoghurts.
International Journal of Food Science and Technology 47: 1986–92.
Ernster L, Dallner G. 1995. Biochemical, physiological and medical aspects of ubiquinone
function. Biochimica et Biophysica Acta 1271: 195– 204.
Ernster L. 1993. Lipid peroxidation in biological membranes: Mechanism and implications. In:
Active Oxygens, Lipid Peroxides, and Antioxidants. CRC Press, Boca Raton.
Federal Register. 1997. Food labeling; health claims; oats and coronary heart disease. Final Rule
Federal Register Doc. 97-1598.
Fir MM, Smidovnik A, Milivojevic L, Zmitek J, Prosek M. 2009. Studies of CoQ10 and
cyclodextrin complexes: solubility, thermo- and photo-stability. Journal of Inclusion
Phenomena and Macrocyclic Chemistry 64: 225.
Fox J, Weisberg S. 2011. An {R} Companion to Applied Regression, Second Edition. Thousand
Oaks CA:Sage. URL:http://socserv.socsci.mcmaster.ca/jfox/Books/Companion. (accessed
on Dec. 20, 2016)
Fulcher RG, Miller SS. 1993. Structure of oat bran and distribution of dietary fiber components. In:
Oat Bran. Wood PJ. (Ed.) American. Association of Cereal Chemists, St. Paul. MN, pp.1.
108
García-Corzo L, Luna-Sánchez M, Doerrier C, Ortiz F, Escames G, Acuña-Castroviejo D, López,
LC. 2014. Ubiquinol-10 ameliorates mitochondrial encephalopathy associated with CoQ
deficiency. Biochimica et Biophysica Acta 1842: 893-901.
Gamel TH, Badali K, Tosh SM. 2013. Changes of beta-glucan physicochemical characteristics in
frozen and freeze dried oat bran bread and porridge. Journal Cereal Science 58: 104-9.
Ghotra BS, Vasanthan T, Temelli F. 2008. Structural characterization of barley beta-glucan
extracted using a novel fractionation technique. Food Research International 41: 957–63.
Ghotra BS, Vasanthan T, Temelli F. 2009. Rheological properties of aqueous blends of high
purity barley beta-glucan with high purity commercial food gums. Food Chemistry 117:
417–25.
Goel V, Cheema SK, Agellon LB, Ooraikul B, Basu TK. 1999. Dietary rhubarb (Rheum
rhaponticum) stalk fibre stimulates cholesterol 7α-hydroxylase gene expression and bile
acid excretion in cholesterol-fed C57BL/6J mice. British Journal of Nutrition 81(1): 65–
71.
Gormley TR, Morrissey A. 1999. A note on the evaluation of wheaten breads containing oat
flour or oat flakes. Irish Journal of Agricultural and Food Research 32: 205–9.
Granfeldt Y, Nyberg L, Björck I. 2008. Muesli with 4 g oat beta-glucans lowers glucose and
insulin responses after a bread meal in healthy subjects. European Journal of Clinical
Nutrition 62:600–7.
Grebow J. 2016. 2016 Flavor trends for food and beverage. Nutritional Outlook magazine 19(1)
40-4.
Groneberg DA, Kindermann B, Althammer M, Klapper M, Vormann J, Littarru GP, Doring F.
2005. Coenzyme Q10 affects expression of genes involved in cell signalling, metabolism
and transport in human CaCo-2 cells. International Journal of Biochemistry & Cell Biology
37: 1208–18.
Haimer E, Wendland M, Schlufter K, Frankenfeld K, Miethe P, Potthast A, Rosenau T, Liebner
F. 2010. Loading of bacterial cellulose aerogels with bioactive compounds by antisolvent
precipitation with supercritical carbon dioxide. Macromolecular Symposia 294 (2): 64–74.
109
Hallfrisch J, Behall KM. 1997. Evaluation of foods and physiological responses to menus in
which fat content was lowered by replacement with Oatrim. Cereal Foods World 43: 100–
3.
Hallfrisch J, Schofield DJ, Behall KM. 2003. Physiological responses of men and women to
barley and oat extracts (NutrimX). II. Comparison of glucose and insulin responses. Cereal
Chemistry 80: 80–3.
Health Canada. 2007. Coenzyme Q10 (Ubiquinone-10). Ottawa, ON: Health Canada.
Health Canada. 2010. Oat products and blood cholesterol lowering: summary of assessment of a
health claim about oat products and blood cholesterol lowering. Ottawa, ON: Health
Canada.
Herrera MP, Gao J, Vasanthan T, Temelli F, Henderson K. 2016. β-Glucan content, viscosity,
and solubility of Canadian grown oat as influenced by cultivar and growing location.
Canadian Journal of Plant Science 96: 183–96.
Hlebowicz J, Darwiche G,Björgell O, Almér LO. 2008. Effect of muesli with 4 g oat β-glucan on
postprandial blood glucose, gastric emptying and satiety in healthy subjects: a randomized
crossover trial. Journal of the American College of Nutrition 27(4): 470–5.
Holm J, Koellreutter B, Wursch P. 1992. Influence of sterilization, drying and oat bran
enrichment of pasta on glucose and insulin responses in healthy subjects and on the rate and
extent of in vitro starch digestion. European Journal of Clinical Nutrition 46(9): 629–40.
Hu X, Zhao J, Zhao Q, Zheng J. 2015. Structure and characteristic of β-glucan in cereal: a review.
Journal of Food Processing and Preservation 39: 3145-53.
Hughes E, Cofrades S, Troy DJ. 1997. Effects of fat level, oat fibre and carrageenan on
frankfurters formulated with 5, 12 and 30% fat. Meat Science 45(3): 273–81.
Husson F, Le S, Cadoret M. 2014. SensoMineR: Sensory data analysis with R. R package version
1.20. https://CRAN.Rproject.org/package=SensoMineR (accessed on Dec. 20, 2016)
Inglett, GE. 2000. Soluble Hydrocolloid Food Additives and Method of Making. U.S. Patent No.
6,060,519. 9.

110
Inglett GE, Carriere CJ, Maneepun S, Tungtrakul P. 2004. A soluble fiber gel produced from rice
bran and barley flour as a fat replacer in Asian foods. International Journal of Food Science
and Technology 39: 1–10.
Inglett GE, Peterson SC, Carriere CJ, Maneepun S. 2005. Rheological, textural, and sensory
properties of Asian noodles containing an oat cereal hydrocolloid. Food Chemistry 90(1-2):
1-8.
Iorio E, Torosantucci A, Bromuro C, Chiani P, Ferretti A, Giannini M, Cassone A, Podo,F. 2008.
Candida albicans cell wall comprises a branched beta-D-(1-6)-glucan with
beta-D-(1-3)-side chains. Carbohydrate Research 343:1050–61.
Irakli M, Biliaderis CG,
Izydorczyk MS, Papadoyannis IN. 2004. Isolation, structural features
and rheological properties of water-extractable β-glucans from different Greek barley
cultivars. Journal of the Science of Food and Agriculture 84: 1170–8.
Isaksson G, Lundquist I, Ihse I. 1982. Effect of dietary fiber on pancreatic enzyme in vitro,
Gastroenterology 82(5): 918–24.
ISO. 2004. ISO 4120: Sensory analysis -Methodology-Triangle test. Geneva, Switzerland:
ISO/IEC.
ISO. 2014. ISO 8586: Sensory analysis – General guidelines for the selection, training and
monitoring of selected assessors and expert sensory assessors. Geneva, Switzerland:
ISO/IEC.
Itagaki S, Ochiai A, Kobayashi M, Sugawara M, Hirano T, Iseki K. 2010. Grapefruit juice
enhance the uptake of coenzyme Q10 in the human intestinal cell-line Caco-2. Food
Chemistry 120: 552-5.
Izydorczyk MS, Storsley J, Labossiere D, MacGregor AW, Rossnagel BG. 2000. Variation in
total and soluble b-glucan content in hulless barley: effects of thermal, physical, and
enzymic treatments. Journal of Agricultural and Food Chemistry 48: 982–9.
Jenkins AL, Jenkins DJA, Zdravkovic U, Würsch P, Vuksan V. 2002. Depression of the
glycemic index by high levels of β-glucan fiber in two functional foods tested in type-2
diabetes. European Journal of Clinical Nutrition 56: 622–8.
Jenkins DJA, Wolever TMS, Leeds AR. 1978. Dietary fibres, fibre analogues, and glucose
tolerance: importance of viscosity. British Medical Journal 1(6124): 1392–4.

111
Jung HJ, Park FH, Lim CJ. 2009. Evaluation of anti-angiogenic, anti-inflammatory and
antinociceptive activity of coenzyme Q(10) in experimental animals. Journal of Pharmacy
and Pharmacology 61: 1391–5.
Juntunen KS, Niskanen LK, Liukkonen KH, Poutanen KS, Holst JJ, Mykkänen HM. 2002.
Postprandial glucose, insulin, and incretin responses to grain products in healthy subjects.
American Journal of Clinical Nutrition 75(2): 254–62.
Kalen A, Appelkvist EL, Dallner G. 1989. Age-related changes in the lipid compositions of rat
and human tissues. Lipids 24: 579–84.
Keller BC. 2001. Liposomes in nutrition. Trends in Food Science Technology 12: 25-31.
Keogh GF, Cooper GJS, Mulvey TB, McArdle BH, Coles GD, Monro JA, Poppitt SD. 2003.
Randomized controlled crossover study of the effect of a highly beta-glucan-enriched barley
on cardiovascular disease risk factors in mildly hypercholesterolemic men. American
Journal of Clinical Nutrition 78: 711-8.
Khoury DE, Cuda C, Luhovyy BL, Anderson GH. 2012. Beta-glucan: health benefits in obesity
and metabolic syndrome. Journal of Nutrition and Metabolism 2012:1-28.
Kim EA, Kim JY, Chung HJ, Lim ST. 2012. Preparation of aqueous dispersions of coenzyme
Q10 nanoparticles with amylomaize starch and its dextrin. LWT - Food Science and
Technology 47: 493-9.
Kim H, Stote KS, Behall KM, Spears K, Vinyard B, Conway JM. 2009. Glucose and insulin
responses to whole grain breakfasts varying in soluble fiber, beta-glucan. European Journal
of Nutrition 48:170–5.
Kim H, Behall KM, Vinyard B, Conway JM. 2006. Short-term satiety and glycemic response
after consumption of whole grains with various amounts of beta-glucans. Cereal Food
World 51: 29–33.
Kirkmeyer SV, Mattes RD. 2000. Effects of food attributes on hunger and food intake.
International Journal of Obesity 24(9):1167–75.
Kivelä R, Gates F, Sontag-Strohm T. 2009a. Degradation of cereal beta-glucan by ascorbic acid
induced oxygen radicals. Journal of Cereal Science 49: 1-3.

112
Kivelä R, Nyström L, Salovaara H, Sontag-Strohm T. 2009b. Role of oxidative cleavage and acid
hydrolysis of oat beta-glucan in modelled beverage conditions. Journal of Cereal Science 50:
190–7.
Kleef E, Trijp H, Luning P. 2005. Functional foods: health claim-food product compatibility and
the impact of health claim framing on consumer evaluation. Appetite 44: 299–308.
Kommuru TR, Ashraf M, Khan MA, Reddy IK. 1991. Stability and bioequivalence studies of
two marketed formulations of coenzyme Q10 in beagle dogs. Chemical and Pharmaceutical
Bulletin (Tokyo) 47 (7): 1024− 28.
Konuklar G, Inglett GE, Warner K, Carriere CJ. 2004. Use of a β-glucan hydrocolloidal
suspension in the manufacture of low-fat cheddar cheeses: textural properties by
instrumental methods and sensory panels. Food Hydrocolloids 18: 535–45.
Lambo AM, Oste R, Nyman M. 2005. Dietary fibre in fermented oat and barley beta-glucan rich
concentrates. Food Chemistry 89: 283–93.
Lazaridou A, Biliaderis CG. 2007. Molecular aspects of cereal beta-glucan functionality:
Physical properties, technological applications and physiological effects. Journal of Cereal
Science 46: 101–18.
Lazaridou A, Duta D, Papageorgiou M, Belc N, Biliaderis, CG. 2007. Effects of hydrocolloids
on dough rheology and bread quality parameters in gluten-free formulations. Journal of
Food Engineering 79: 1033–47.
Lazaridou A, Biliaderis CG, Izydorczyk MS. 2003. Molecular size effects on rheological
properties of oat b-glucans in solution and gels. Food Hydrocolloids 17: 693–712.
Lenaz G, Fato R, Di Bernardo, S, Jarreta D, Costa A, Genova ML, Parenti Castelli G. 1999.
Localization and mobility of coenzyme Q in lipid bilayers and membranes. Biofactors 9:
87–93.
Lenth RV. 2016. Least-Squares Means: The R Package lsmeans. Journal of Statistical Software
69(1): 1-33.
Li W, Cui SW, Kakuda Y. 2006. Extraction, fractionation, structural and physical
characterization of wheat β-D -glucans. Carbohydrate Polymers 63: 408–16.

113
Limberger-Bayer VM, de Francisco A, Chan A, Oro T, Ogliari PJ, Barreto PLM. 2014. Barley
beta-glucans extraction and partial characterization. Food Chemistry 154: 84–9.
Liu GY, Wang JM, Xia Q. 2012. Application of nanostructured lipid carrier in food for the
improved bioavailability. European Food Research and Technology 234: 391–8.
Liu J, Chen F, Tian W, Ma Y, Li J, Zhao G. 2014. Optimization and characterization of
curcumin loaded in octenylsuccinate oat β‐glucan micelles with an emphasis on degree of
substitution and molecular weight. Journal of Agricultural and Food Chemistry 62:
7532−40.
Liu J, Li J, Ma Y,
Chen F, Zhao G. 2013. Synthesis, characterization, and aqueous self-assembly
of octenylsuccinate oat β‐glucan. Journal of Agricultural and Food Chemistry 61:
12683−91.
Lumaga RB, Azzali D, Fogliano V, Scalfi L, Vitaglione P. 2012. Sugar and dietary fibre
composition influence, by different hormonal response, the satiating capacity of a
fruit-based and a beta-glucan- enriched beverage. Food & Function 3: 67–75.
Lyamina NP, Lyamina SV, Senchiknin VN, Mallet DT, Downey HF, Manukhina EB. 2011.
Normobaric hypoxia conditioning reduces blood pressure and normalizes nitric oxide
synthesis in patients with arterial hypertension, Journal of Hypertension 29: 2265–72.
Lyly M, Ohls N, Lähteenmäki L, Salmenkallio-Marttila M, Liukkonen K-H, Karhunen L,
Poutanen K. 2010. The effect of fibre amount, energy level and viscosity of beverages
containing oat fibre supplement on perceived satiety. Food & Nutrition Research 54:
2149-57.
Lyly M, Liukkonen K-H, Salmenkallio-Marttila M, Karhunen L, PoutanenK, Lähteenmäki L.
2009. Fibre in beverages can enhance perceived satiety. European Journal of Nutrition 48:
251–8.
Lyly M, Roininen K, Honkapaa K, Poutanen K, Lahteenmaki L. 2007. Factors influencing
consumers willingness to use beverages and ready-to-eat frozen soups containing oat
beta-glucan in Finland, France and Sweden. Food Quality and Preference 18: 242–55.
114
Lyly M, Salmenkallio-Marttila M, Suortti T, Autio K, Poutanen K, Lähteenmäki L. 2004. The
sensory characteristics and rheological properties of soups containing oat and barley
β-glucan before and after freezing. LWT — Food Science and Technology 37: 749–61.
Lyly M, Salmenkallio M, Suortti M, Autio K, Poutanen K, Lahteenmaki L. 2003. Influence of
oat β-glucan preparations on the perception of mouth feel and rheological properties in
beverage prototypes. Cereal Chemistry 80: 536–41.
Ma Y, Liu J, Ye F, Zhao G. 2016. Solubilization of beta-carotene with oat beta-glucan
octenylsuccinate micelles and their freeze-thaw, thermal and storage stability. LWT - Food
Science and Technology 65: 845-51.
Maki KC, Galant R, Samuel P, Tesser J, Witchger MS, Ribaya-Mercado JD, Blumberg JB,
Geohas J. 2007. Effects of consuming foods containing oat b-glucan on blood pressure,
carbohydrate metabolism and biomarkers of oxidative stress in men and women with
elevated blood pressure. European Journal of Clinical Nutrition 61:786–95.
Marciani L, Gowland PA, Spiller RC, Manoj P, Moore RJ, Young P, Fillery-Travis AJ.2001.
Effect of meal viscosity and nutrients on satiety, intragastric dilution, and emptying
assessed by MRI. American Journal of Physiology- Gastrointestinal and Liver Physiology
280: G1227–33.
Mehling T, Smirnova I, Guenther U, Neubert RHH. 2009. Polysaccharide-based aerogels as drug
carriers. Journal of Non-Crystalline Solids 355 (50–51): 2472– 79.
Mendiburu F. 2015. Agricolae: Statistical Procedures for Agricultural Research. R package
version 1.2-3. https://CRAN.R-project.org/package=agricolae (accessed on Dec. 20, 2016)
Merrill AL, Watt BK. 1973. Energy value of foods: basis and derivation. Human Nutrition
Research Branch, Agricultural Research Service; for sale by the Supt. of Docs., U.S. Govt.
Print. Off., Washington
Mielby LH, Andersen BV, Jensen S, Kildegaard H, Kuznetsova A, Eggers N, Brockhoff PB,
Byrne DV. 2016. Changes in sensory characteristics and their relation with consumers'
liking, wanting and sensory satisfaction: Using dietary fibre and lime flavour in Stevia
rebaudiana sweetened fruit beverages. Food Research International 82: 14–21.
115
Mikkelsen MS, Jespersen BM, Moller BL, Laerke HN, Larsen FH, Engelsen SB. 2010.
Comparative spectroscopic and rheological studies on crude and purified soluble barley and
oat β-glucan preparations. Food Research International 43: 2417–24.
Mintel Group I. 2005. The impact of flavours on the global food market.
Sweeteners-International-September 2005. Mintel Group, Inc.
Mitchell P. 1990. The classical mobile carrier function of lipophilic quinones in the
osmochemistry of electron-driven proton trans- location. In: Lenaz G, Barnabei O, Rabbi A,
Battino M (eds) Highlights in ubiquinone research. Taylor and Francis, London, pp 77–82.
Mitchell P. 1975. Protonmotive redox mechanism of the cytochrome b–c1 complex in the
respiratory chain: protonmotive ubiquinone cycle, FEBS Letters 56: 1–6.
Moldenhauer JP, Cully J. 2003. Method for producing a coenzyme Q10/gamma-cyclodextrin
complex. U.S. Patent No. 6,861,447.
Moon HJ, Ko WK, Jung MS, Kim JH, Lee WJ, Park KS, Heo JK, Bang JB, Kwon IK. 2013.
Coenzyme Q10 regulates osteoclast and osteoblast differentiation. Journal of Food Science
78 (5): H785-91.
Morgan KR. 2016. Beta-glucan products and extraction processes from cereals. European Patent
No. EP0928196.
Moriartey S, Temelli F, Vansanthan T, Gänzle M. 2011. Viscosity and solubility of beta-glucan
extracted under in vitro conditions from barley beta-glucan-fortified bread and evaluation of
loaf characteristics. Cereal Chemistry 88(4): 421-8.
Morin LA, Temelli F, McMullen L. 2002. Physical and sensory characteristics of reduced-fat
breakfast sausages formulated with barley beta-glucan. Journal of Food Science 67(6):
2391-6.
Naumann E, van Rees AB, Onning G, Oste R. Wydra M, Mensink RP. 2006. Beta-glucan
incorporated into a fruit drink effectively lowers serum LDL-cholesterol concentrations.
American Journal of Clinical Nutrition 83: 601-5.
Nehilla BJ, Bergkvist M, Popat KC, Desai TA. 2008. Purified and surfactant-free coenzyme
Q10-loaded biodegradable nanoparticles. International Journal of Pharmaceutics 348:107–
14.

116
Niklowitz P, Döring F, Paulussen M, Menke T. 2013. Determination of coenzyme Q10 tissue
status via high-performance liquid chromatography with electrochemical detection in swine
tissues (Sus scrofa domestica) Analytical Biochemistry 437: 88-94.
Omana DA, Plastow G, Betti M. 2011. Effect of different ingredients on color and oxidative
characteristics of high pressure processed chicken breast meat with special emphasis on use
of β-glucan as a partial salt replacer. Innovative Food Science and Emerging Technologies
12: 244–54.
Onoue S, Uchida A, Kuriyama K, Nakamura T, Seto Y, Kato M, Hatanaka J, Tanaka T, Miyoshi
H, Yamada S. 2012. Novel solid self-emulsifying drug delivery system of coenzyme Q(10)
with improved photochemical and pharmacokinetic behaviors. European Journal of
Pharmaceutical Sciences 46 (5): 492−9.
Owen SC, Chan DPY, Shoichet MS. 2012. Polymeric micelle stability. Nano Today 7(1): 53-65.
Ozen AE, Pons A, Tur JA. 2012. Worldwide consumption of functional foods: a systematic
review. Nutrition Reviews 70(8): 472-81.
Panahi S, Ezatagha A, Jovanovski E, Jenkins A, Temelli F, Vasanthan T, Vuksan V. 2014.
Glycemic effect of oat and barley beta-glucan when incorporated into a snack bar: A dose
escalation study. Journal of the American College of Nutrition 33(6): 442-9.
Panahi S, Ezatagha A, Temelli F, Vasanthan T, Vuksan V. 2007. Beta-glucan from two sources
of oat concentrates affect postprandial glycemia in relation to the level of viscosity. Journal
of the American College of Nutrition 26(6): 639-44.
Papucci L, Schiavone N, Witort E, Donnini M, Lapucci A, Tempestini A, Formigli L,
Zecchi-Orlandini S, Orlandini G, Carella G, Brancato R, Capaccioli S. 2003. Coenzyme q10
prevents apoptosis by inhibiting mitochondrial depolarization independently of its free
radical scavenging property. Journal of Biological Chemistry 278: 28220–8.
Pentikäinen S, Karhunen L, Flander L, Katina K, Meynier A, Aymard P, Vinoy S, Poutanen K.
2014. Enrichment of biscuits and juice with oat β-glucan enhances postprandial satiety.
Appetite 75:150–6.

117
Peters HP, Boers HM, Haddeman E, Melnikov SM, Ovyjt F. 2009. No effect of added b-glucan
or of fructooligosaccharide on appetite or energy intake. American Journal of Clinical
Nutrition 89: 58–63.
Pillai R, Redmond M, Roding J. 2005a. Anti-wrinkle therapy: significant new findings in the
non-invasive cosmetic treatment of skin wrinkles with beta-glucan. International Journal of
Cosmetic Science 27: 292.
Pillai S, Oresajo C, Hayward J. 2005b. Ultraviolet radiation and skin aging: roles of reactive
oxygen species, inflammation and protease activation, and strategies for prevention of
inflammation- induced matrix degradation. International Journal of Cosmetic Science 27:
17–34.
Pinero MP, Parra K, Huerta-Leidenz N, Arenas de Moreno L, Ferrer M, Araujo S, Barboza Y.
2008. Effect of oat’s soluble fibre (beta-glucan) as a fat replacer on physical, chemical,
microbiological, and sensory properties of low-fat beef patties. Meat Science 80 (3): 675–
80.
Pins J, Kaur H. 2006. A review of the effects of barley beta-glucan on cardiovascular and
diabetic risk. Cereal Foods World 51(1) ProQuest Business Collection pp. 8.
Pomeranz Y, Shogern MD, Finney KF, Bechtel DB. 1977. Fiber in bread making-effects on
functional properties. Cereal Chemistry 54: 25–41.
Potter R, Fisher P, Hash K, Neidt J. 2016. Method for concentrating beta-glucan film. U.S.
Patent No. 6,624,300.
Pravst I, Žmitek K, Žmitek J. 2010. Coenzyme Q10 contents in foods and fortification strategies.
Critical Reviews in Food Science and Nutrition 50:269–80.
R Core Team (2015). R: A language and environment for statistical computing. R Foundation for
Statistical Computing, Vienna, Austria. URL: https://www.R-project.org/. (accessed on Dec.
20, 2016)
Ragaee SM, Wood PJ, Wang Q, Tosh SM, Brummer Y, Huang X. 2008. Isolation, fractionation,
and structural characteristics of alkali-extractable β-glucan from rye whole meal. Cereal
Chemistry. 85(3):289–94.

118
Reyna-Villasmil N, Bermudez-Pirela V, Mengual-Moreno E, Arias N, Cano-Ponce C,
Leal-Gonzalez E, Souki A, Inglett GE, Israili ZH, Hernández-Hernández R, Valasco M,
Arraiz N. 2007. Oat-derived β-glucan significantly improves HDLC and diminishes LDLC
and non-HDL cholesterol in over- weight individuals with mild hypercholesterolemia.
American Journal of Therapeutics 14(2): 203–12.
Rocha R, Martin-Berger CL, Yang P, Scherrer R, Delyani J, McMahon E. 2002. Selective
aldosterone blockade prevents angiotensin II/salt-induced vascular inflammation in the rat
heart. Endocrinology 143: 4828–36.
Rodríguez-Rojo S, Martín Á, Cocero MJ. 2013. Encapsulation methods with supercritical carbon
dioxide: basis and applications. Encapsulation Nanotechnologies. John Wiley & Sons, Inc.,
pp. 391–424.
Ruiz-Jimenez J, Priego-Capote F, Mata-Granados JM, Quesada JM, Luque de Castro MD. 2007.
Determination of the ubiquinol-10 and ubiquinone-10 (coenzyme Q10) in human serum by
liquid chromatography tandem mass spectrometry to evaluate the oxidative stress. Journal
of Chromatography A 1175: 242–8.
Ryu JH, Lee S, You SG, Shim JH, Yoo SH. 2012. Effects of barley and oat -glucan structures on
their rheological and thermal characteristics. Carbohydrate Polymers 89: 1238–43.
Saarela M, Virkajarvi I, Nohynek L, Vaari A, Matto J. 2006. Fibres as carriers for Lactobacillus
rhamnosus during freeze-drying and storage in apple juice and chocolate-coated breakfast
cereals. International Journal of Food Microbiology 112(2) :171–8.
Sabbe S, Verbeke W, Deliza R, Matta V, Van Damme P. 2009. Effect of a health claim and
personal characteristics on consumer acceptance of fruit juices with different concentrations
of açaía (Euterpe oleracea Mart.) Appetite 53: 84–92
Sahan N, Yasar K, Hayaloglu AA. 2008. Physical, chemical, and flavor quality of nonfat yogurt
as affected by a β-glucan hydrocolloidal composite during storage. Food Hydrocolloid 22
(7): 1291-7.
Salgado M, Rodríguez-Rojo S, Alves-Santos FM, Cocero MJ. 2015. Encapsulation of resveratrol
on lecithin and b-glucans to enhance its action against Botrytis cinerea. Journal of Food
Engineering 165: 13–21.
Sari M, Prange A, Lelley JI, Hambitzer R. 2017. Screening of beta-glucan contents in
commercially cultivated and wild growing mushrooms Food Chemistry 216: 45–51.
119
Schulz C, Obermüller-Jevic UC, Hasselwander O, Bernhardt J, Biesalski HK. 2006. Comprison
of the relative bioavailability of different coenzyme Q10 formulations with a novel
solubilizate (SoluTM Q10). International Journal of Food Sciences and Nutrition 57(7/8):
546-55.
Sharma P, Gujral HS. 2013. Extrusion of hulled barley affecting β-glucan and properties of
extrudates. Food and Bioprocess Technology 6: 1374–89.
Shah A, Gani A, Ahmad M, Ashwar BA, Masoodi FA. 2016. Beta-glucan as an encapsulating
agent: Effect on probiotic survival in simulated gastrointestinal tract. International Journal
of Biological Macromolecules 82: 217-22.
Sibakov J, Myllymäki O, Holopainen U, Kaukovirta-Norja A, Hietaniemi V, Pihlava JM,
Poutanen K, Lehtinen P. 2011. Lipid removal enhances separation of oat grain cell wall
material from starch and protein. Journal of Cereal Science 54: 104-9.
Skendi A, Biliaderis CG, Lazaridou A, Izydorczyk MS. 2003. Structure and rheological
properties of water soluble b-glucans from oat cultivars of Avena sativa and Avena
bysantina. Journal of Cereal Science 38: 15–31.
Sloan E, Hutt CA. 2012. Beverage trends in 2012 and beyond. Agro FOOD Industry Hi Tech
23(4): 8-12.
Sohal RS, Forster MJ. 2007. Coenzyme Q, oxidative stress and aging. Mitochondrion 7S:
S103-11.
Staudte RG, Woodward JR, Fincher GB, Stone BA. 1983. Water-soluble (1→3),
(1→4)-β-d-glucans from barley (Hordeum vulgare) endosperm. III. Distribution of
cellotriosyl and cellotetraosyl residues. Carbohydrate Polymers 3: 299–312.
Swarnakar NK, Thanki K, Jain S. 2014. Lyotropic liquid crystalline nanoparticles of CoQ10:
implication of lipase digestibility on oral bioavailability, in vivo antioxidant activity, and in
vitro−in vivo relationships. Molecular Pharmaceutics 11: 1435−49.
Swarnakar NK, Jain AK, Singh RP, Godugu C, Das M, Jain S. 2011. Oral bioavailability,
therapeutic efficacy and reactive oxygen species scavenging properties of coenzyme
Q10-loaded polymeric nanoparticles. Biomaterials 32: 6860-74.
120
Swithers SE, Doerflinger A, Davidson TL. 2006. Consistent relationships between sensory
properties of savory snack foods and calories influence food intake in rats. International
Journal of Obesity 30: 1685-92.
Szakály Z, Szente V, Kövér G, Polereczki Z, Szigeti O. 2012. The influence of lifestyle on health
behavior and preference for functional foods. Appetite 58: 406.
Tang PH, Miles MV, Miles L, Quinlan J, Wong B, Wenisch A, Bove K. 2004. Measurement of
reduced and oxidized coenzyme Q9 and coenzyme Q10 levels in mouse tissues by HPLC
with coulometric detection. Clinica Chimica Acta 341: 173-184
Tapola N, Karvonen H, Niskanen L, Mikola M, Sarkkinen E. 2005. Glycemic responses of oat
bran products in type 2 diabetic patients. Nutrition, Metabolism and Cardiovascular
Diseases 15(4): 255–61.
Tarate B, Bansal AK. 2015. Characterization of CoQ10-lauric acid eutectic system.
Thermochimica Acta 605: 100-6.
Temelli F, Seifried B. 2016. Supercritical fluid treatment of high molecular weight
biopolymers. U.S. Patent No. 9,249,266.
Temelli F, Bansema CB, Stobbe KS. 2004. Development of an orange-flavored barley β-Glucan
beverage. Cereal Chemistry 81(4):499–503.
Temelli, F. 1997. Extraction and functional properties of barley beta-glucan as affected by
temperature and pH. Journal of Food Science 62: 1194–8.
Terao K, Nakata D, Fukumi H, Schmid G, Arima H, Hirayama F, Uekama K. 2006.
Enhancement of oral bioavailability of coenzyme Q10 by complexation with
[gamma]-cyclodextrin in healthy adults. Nutrition Research (N.Y.) 26 (10): 503−8.
Thammakiti S, Suphantharika M, Phaesuwan T, Verduyn C. 2004. Preparation of spent brewer’s
yeast β-glucans for potential applications in the food industry. International Journal of Food
Science & Technology 39 (1): 21–9.
Theuwissen E, Mensink RP. 2007. Simultaneous intake of beta-glucan and plant stanol esters
affects lipid metabolism in slightly hypercholesterolemic subjects. Journal of Nutrition 137:
583-8.

121
Topping DL, Clifton PM. 2002. Short-chain fatty acids and human colonic function: roles of
resistant starch and non- starch polysaccharides. Physiological Reviews 81(3): 1031–64.
Troy DJ, Desmond EM, Buckley DJ. 1999. Eating quality of low-fat beef burgers containing
fat-replacing functional blends. Journal of the Science of Food and Agriculture 79(4): 507–
16.
Tuorila H, Cardello A. 2002. Consumer responses to an off-flavor in juice in the presence of
specific health claims. Food Quality and Preference 13: 561–9.
Turunen M, Olsson J, Dallner G. 2004. Metabolism and function of coenzyme Q. Biochimica et
Biophysica Acta 1660: 171-99.
Varum KM, Smidsrod O.1988. Partial chemical and physical characterization of
(1-3),(1-4)-beta-D-glucans from oat (Avena sativa L.) aleurone. Carbohydrate polymers 9:
103-17.
Vasanthan T, Bhatty RS. 1995. Starch purification after pin milling and air classification of waxy,
normal, and high amylose. Cereal Chemistry 72(4): 379–84.
Vasanthan T, Temelli F. 2008. Grain fractionation technologies for cereal beta-glucan
concentration. Food Research International 41: 876–81.
Vasanthan T, Temelli F. 2009. Grain fractionation methods and products. U.S. Patent 7,566,470
B2.
Volikakis P, Biliaderis CG, Vamvakas C, Zerfiridis GK. 2004. Effects of a commercial
oat-β-glucan concentrate on the chemical, physicochemical and sensory attributes of a
low-fat white-brined cheese product. Food Research International 37(1): 83–94.
Weber C, Bysted A, Holmer G. 1997. Coenzyme Q10 in the diet daily intake and relative
bioavailability. Molecular Aspects of Medicine 18(Suppl): S251-4.
Weber C, Bysted A, Holmer, GK. 1996. The coenzyme Q10 content of the average Danish diet.
International Journal for Vitamin and Nutrition Research 67: 123-7.
Williams EJ. 1949: Experimental designs balanced for the estimation of residual effects of
treatments. Australian Journal of Scientific Research A2: 149-68.
122
Willis HJ, Eldridge AL, Beiseigel J, Thomas W, Slavin JL. 2009. Greater satiety response with
resistant starch and corn bran in human subjects. Nutrition Research 29: 100–5.
Wood FW. 1968. Psychophysical studies on the consistency of liquid foods. In: SCI Monograph
No. 27. Rheology and Texture of Foodstuffs. Society of Chemical Industry, London, pp. 40.
Wood PJ, Beer MU. 1998. Functional oat products. In: Mazza G, Shi J, Le Mayuer M. (Eds.).
Functional Foods: Biochemical and Processing Aspects, vol. 2. Technomic Publishing Co,
Lancaster, PA, USA, pp. 1-37.
Wood PJ, Braaten JA, Scott FD, Riedel KD, Wolynetz MS, Collins MW. 1994. Effect of dose
and modification of viscous oat gum on plasma glucose and insulin following an oral
glucose load. British Journal of Nutrition 72: 731–43.
Wood PJ, Siddiqui IJ, Paton D. 1978. Extracting of high-viscosity gums from oats. Cereal
Chemistry 55: 1038-49.
Wood PJ, Weisz J, Fedec P, Burrows, VD. 1989. Large-scale preparations and properties of oat
fractions enriched in (1→3) (1→4) -β-D glucans. Cereal Chemistry 66: 97–103.
Wood PJ. 2011. Oat β-glucan: Properties and Function. In: Webster FH, Wood PJ. (Eds.), Oats:
Chemistry and Technology, 2nd Ed. American Association of Cereal Chemistry, St. Paul,
MN, pp. 219–54.
Wood PJ. 2007. Cereal beta-glucans in diet and health. Journal of Cereal Science 46: 230–8.
Wood PJ. 2001. Cereal beta-glucans: structure, properties and health claims. In: McCleary BV,
Prosky L. (Eds.), Advanced Dietary Fibre Technology. Blackwell Science, London, pp.
315–27.
Woodward JR, Fincher GB, Stone BA. 1983.Water-soluble (1→3), (1→4)- β-glucan from barley
(Hordeum vulgare) endosperm II. Finestructure. Carbohydrate Polymers 3: 207–25.
Worch T, Lê S, Punter P, Pagès J. 2012. Extension of the consistency of the data obtained with the
Ideal Profile Method: Would the ideal products be more liked than the tested products? Food
Quality and Preference 26: 74–80.
Xia F, Jin H, Zhao Y, Guo X. 2012. Preparation of coenzyme Q10 liposomes using supercritical
anti-solvent technique. Journal of Microencapsulation 29(1): 21–9.

123
Xia S, Xu S, Zhang X. 2006. Optimization in the preparation of coenzyme Q10 nanoliposomes.
Journal of Agricultural Food Chemistry 54(17): 6358–66.
Yang YK, Wang LP, Chen L, Yao XP, Yang KQ, Gao LG, Zhou XL. 2015. Coenzyme Q10
treatment of cardiovascular disorders of ageing including heart failure, hypertension and
endothelial dysfunction. Clinica Chimica Acta 450: 83–9.
Yoon HK, Seo TR, Lim ST. 2014. Stabilization of aqueous dispersion of CoQ10 nanoparticles
using maize starches. Food Hydrocolloids 35: 144-9.
Yu L. 2001. Amorphous pharmaceutical solids: preparation, characterization and stabilization.
Advanced Drug Reviews 48: 27-42.
Zhang JX, Hallmans G, Andersson H, Bosaeus I, Aman P, Tidehag P, Stenling R, Lundin E,
Dahlgren S.1992. Effect of oat bran on plasma cholesterol and bile acid excretion in nine
subjects with ileostomies. American Journal of Clinical Nutrition 56(1) 99–105.
Zhao Q, Hu X, Guo Q, Cui SW, Xian Y, You S, Chen X, Xu C, Gao X. 2014. Physicochemical
properties and regulatory effects on db/db diabetic mice of β-glucans extracted from oat,
wheat and barley. Food Hydrocolloids 37: 60-8.
Zhou H, Liu G, Zhang J,
Sun N,
Duan M,
Yan Z,
Xia Q. 2014. Novel lipid-free nanoformulation
for improving oral bioavailability of coenzyme q10. BioMed Research International 2014,
793879.
Zhu F, Du B, Xu B. 2016. A critical review on production and industrial applications of beta-
glucans. Food Hydrocolloids 52: 275-88.

124
Appendix A: Questionnaires
A.1 Trained panel screening questionnaire

125

126
A.2 Trained panel evaluation questionnaire

127
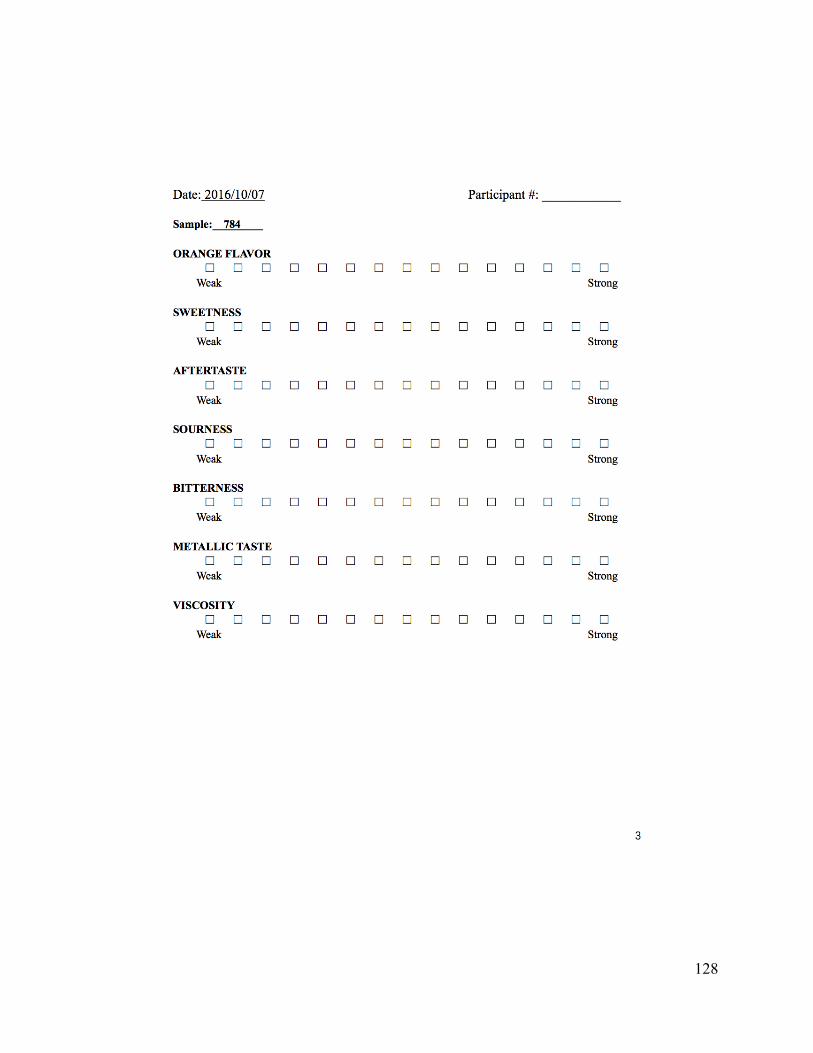
128
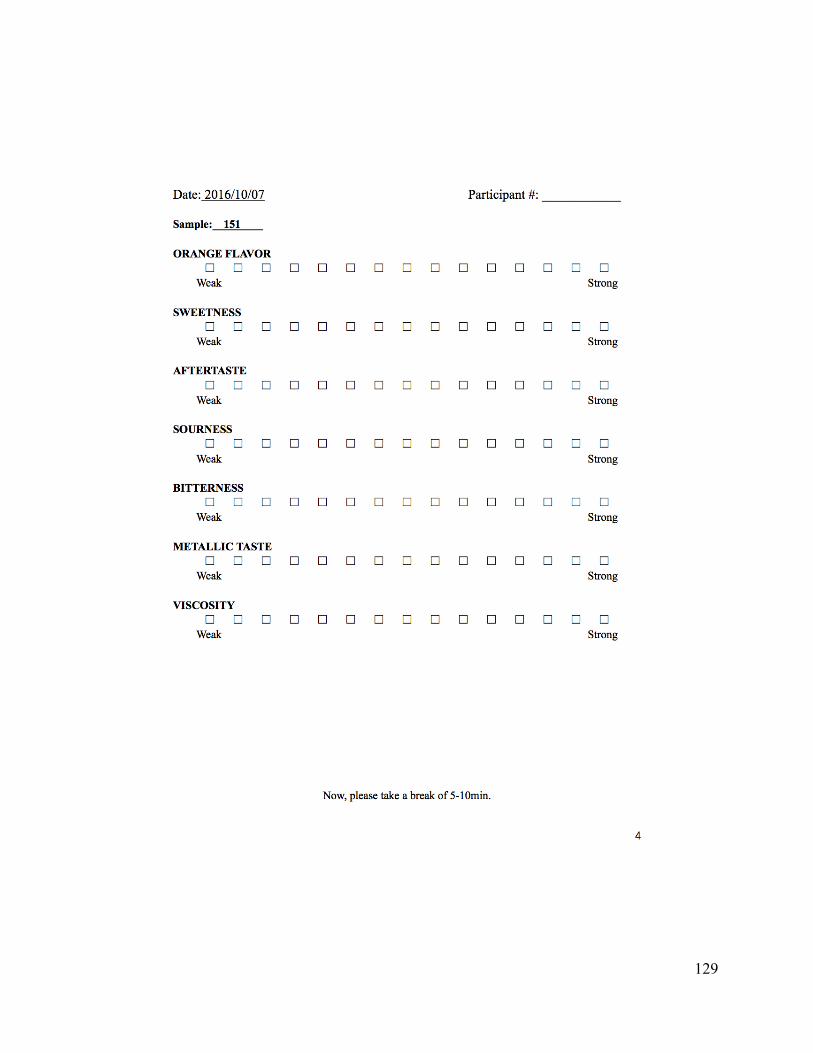
129

130
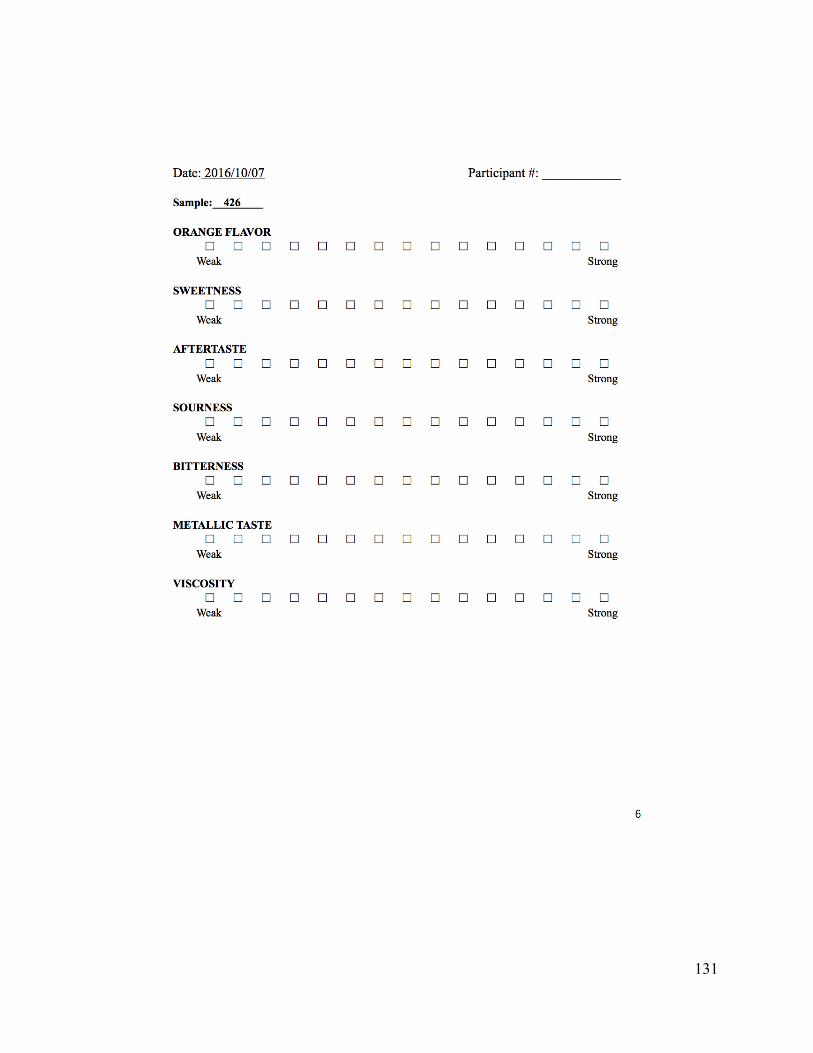
131

132

133

134
A.3 Triangle test questionnaire
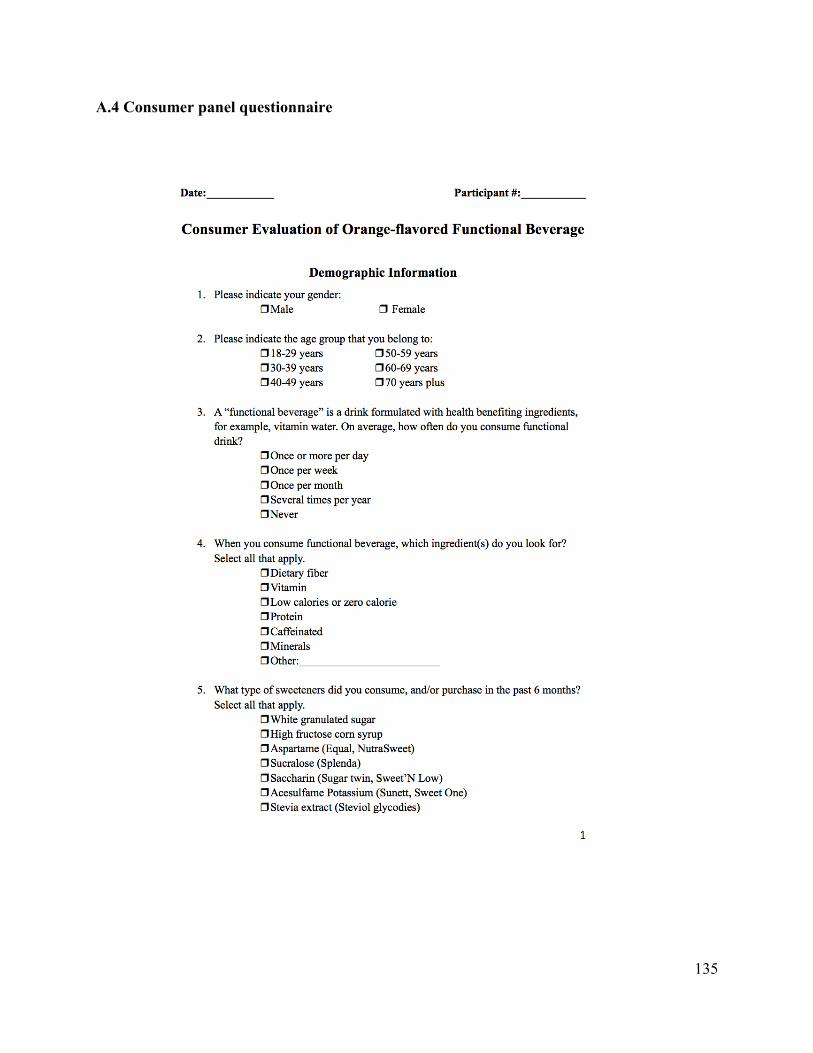
135
A.4 Consumer panel questionnaire
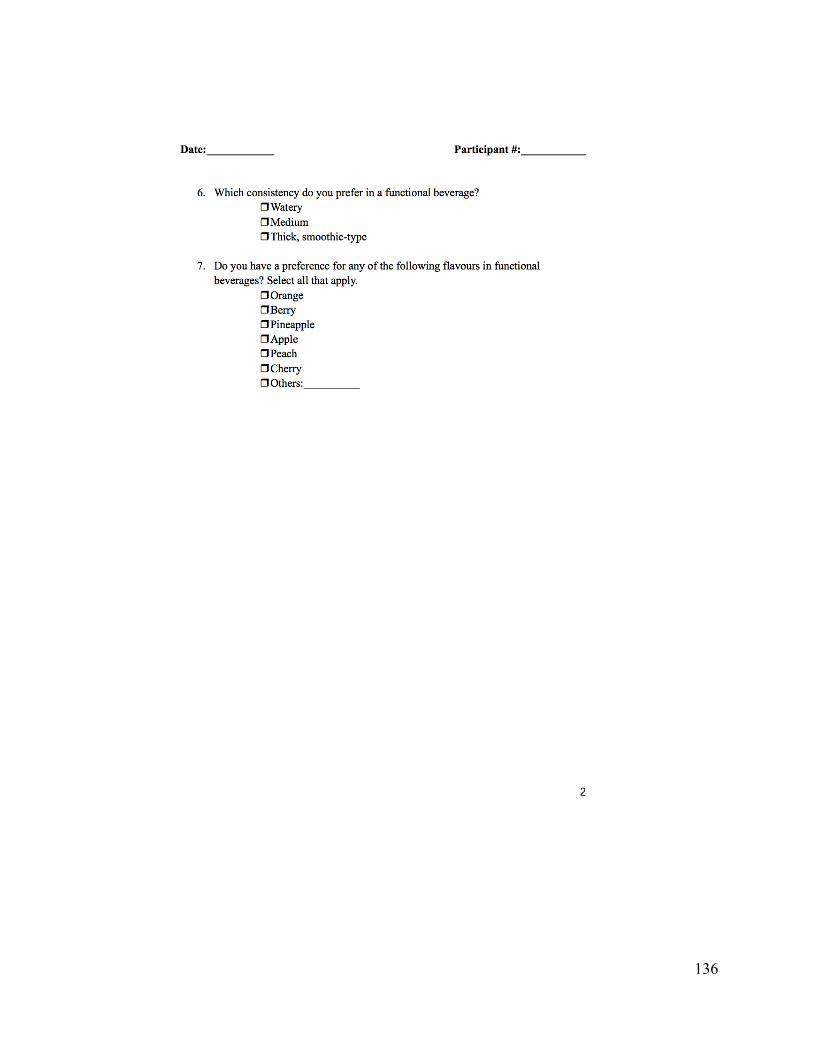
136

137

138

139

140

141

142

143

144
Appendix B: Trained panel
B.1 Objective
The objective of this study was to determine the effect of beta-glucan (BG) concentration
(0.15%, 0.2%, 0.3% w/v) and storage temperature (25 oC or 4 oC) on the sensory characteristics
(sweetness, sourness, aftertaste, mouthfeel, orange flavor, bitterness and metallic taste) of
stevia-sweetened orange-flavored beverage.
B.2 Methods
B.2.1 Screening procedure
An online registration form was firstly sent to potential participants to collect their contact
information, demographic information, availability, and experience with functional beverages
and non-sugar sweeteners. Then participants were invited to a screening session which involved
4 sensory tests: 1) color vision test; 2) taste identification test; 3) odor identification test; and 4)
texture test. In the color vision test, participants were asked to rank 7 orange solutions in terms of
color intensity. The result helped to determine their color vision and judgement. In the taste
identification test, participants were asked to identify the taste of four solutions (sweet, metallic
taste, bitter and sour). This part was designed to determine their sensitivity to substances, which
may be present in small concentrations in the products. In odor identification test, participants
were asked to identify the odor of three materials. This part could help detect anosmia or
possible lack of sensitivity. In texture test, participants were asked to rank three different

145
solutions in terms of mouthfeel. This part was to determine their ability to discriminate the
intensity of a texture property. Participants who passed the screening session with more than 80%
correct answers were invited to participate in the following training sessions.
B.2.2 Training
A total of 12 panelists (11 females, aged from 18 to 29 years) were selected for training. In
total, 7 training sessions were held to help participants: 1) familiarize with basic principles of
sensory evaluation, test procedures and scaling methods; 2) improve their ability to recognize
and identify seven important sensory attributes of the test beverages, including sweetness,
sourness, aftertaste, bitterness, aftertaste, metallic taste and orange flavor; and 3) improve
sensitivity and memory to make consistent sensory judgments while evaluating samples. Each
session focused on one of the attributes. Participants were instructed on how to evaluate the
attributes individually and rate the intensity for each attribute. For each attribute, two extremely
intense samples were provided to help participants have a general idea of the scaling on this
attribute.
B.2.3 Evaluation
After training, participants were asked to attend three evaluation sessions. In each session, 8
beverages at two different temperatures (4 samples at 25 oC and 4 samples at 4 oC) were
evaluated on their sweetness, sourness, aftertaste, bitterness, aftertaste, metallic taste and orange
146
flavor using the scale adopted during the training sessions. At each temperature, four beverages
containing beta-glucan at the concentrations of 0%, 0.15%, 0.2% and 0.3% (w/v) were provided.
Participants started with the 4 samples at 25 oC, then after a 15 min rest, they were asked to
evaluate the other 4 samples at 4 oC.
B.3 Results
The performance of the trained panel was shown in Fig. B-1, with product p-values provided.
Generally, a well-trained panel should have no colored box shown under the column of
“Participant”, indicating no significant participant effect. However, in this study, the p values
under that column were much smaller than 0.05, which indicated that participants evaluated the
samples differently from each other. Removing certain outlier participants did not improve the
overall panel performance. Therefore, in this study, participants did not all agree with the scale
they developed and they required further training, but unfortunately, it was not possible to extend
the training time due to unavailability of the participants.
However, a two-way ANOVA was still applied to determine the effect of temperature and
BG concentration and their interaction on the sensory attributes of the orange-flavored functional
beverages. The model applied in ANOVA was:
Beverage=Concentration*Temperature + Random effect (Participant).
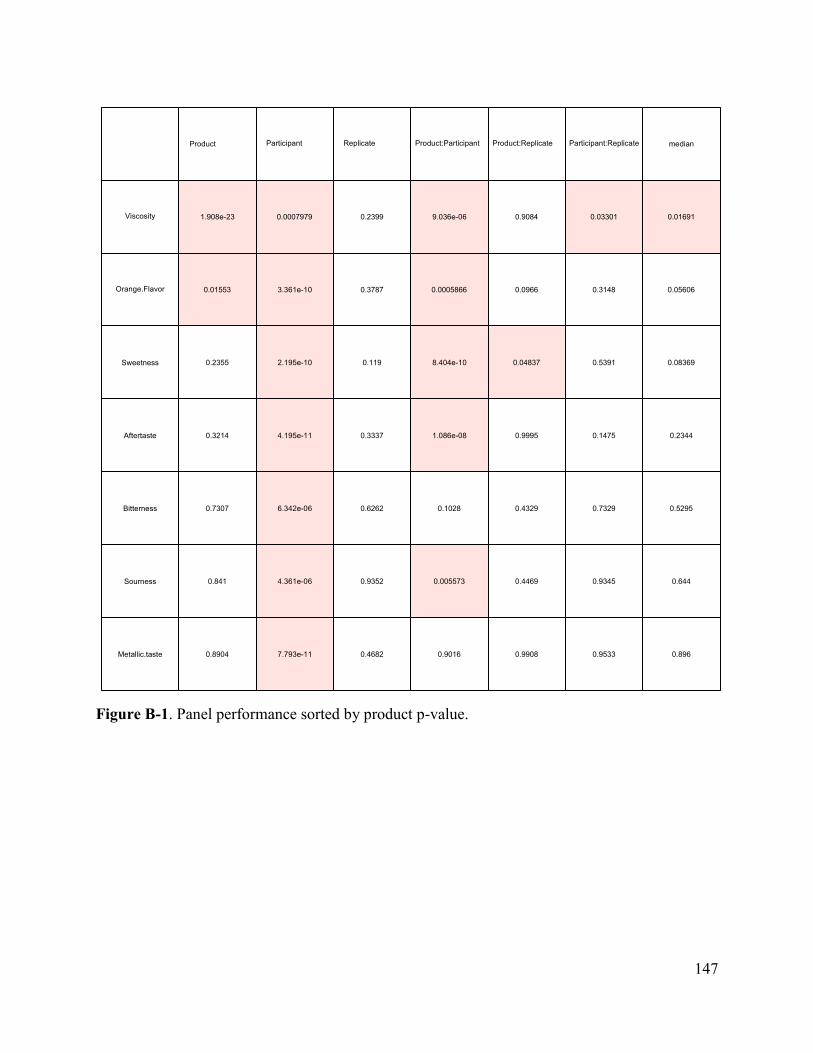
147
Figure B-1. Panel performance sorted by product p-value.
Panel performance (sorted by product P-value)
Viscosity
Orange.Flavor
Sweetness
Aftertaste
Bitterness
Sourness
Metallic.taste
1.908e-23 0.0007979 0.2399 9.036e-06 0.9084 0.03301 0.01691
0.01553 3.361e-10 0.3787 0.0005866 0.0966 0.3148 0.05606
0.2355 2.195e-10 0.119 8.404e-10 0.04837 0.5391 0.08369
0.3214 4.195e-11 0.3337 1.086e-08 0.9995 0.1475 0.2344
0.7307 6.342e-06 0.6262 0.1028 0.4329 0.7329 0.5295
0.841 4.361e-06 0.9352 0.005573 0.4469 0.9345 0.644
0.8904 7.793e-11 0.4682 0.9016 0.9908 0.9533 0.896
Product Participant Replicate Product:Participant Product:Replicate Participant:Replicate median

148
The results of the ANOVA were presented in Table B-1. BG concentration, serving
temperature and their interaction had significant effects on orange flavor and viscosity of
beverages (Table B-2), while sweetness (Table B-3) and sourness (Table B-4) were significantly
affected by only concentration or temperature, respectively. It was found that beverages served at
4 oC had a higher sourness intensity. The sweetness intensity increased by the addition of BG,
but was not affected by the increased concentration of BG. The beverage prepared with 0.3% BG
and served at 4 oC had the strongest orange flavor. Furthermore, viscosity detected by
participants reflected the same trend as instrumentally measured values: viscosity increased as
temperature decreased and as BG concentration increased. Considering the significant panelist
effect on the results obtained from the trained panel, no solid conclusion could be drawn; but this
semi-trained panel provided some direction for the product selection (0.2% BG product served at
4 oC) for the subsequent consumer panel.
Table B-1. ANOVA P-values.
Concentration Temperature Interaction
Orange flavor 0.0001* 0.0011* 0.0017*
Sweetness <0.0001* 0.8686 -
Aftertaste 0.0559 0.7393 -
Sourness 0.4321 <0.0001* -
Bitterness 0.2094 0.8366 -
Metallic taste 0.9738 0.6375 -
Viscosity <0.0001* <0.0001* <0.0001*
* indicates significant effect at p<0.05.

149
Table B-2. The intensity* of orange flavor and viscosity of beverages prepared with four
concentrations of BG and served at 25 oC and 4 oC.
BG concentration Orange flavor Viscosity
T=25oC 0% 7.7±1.1a 1.4±0.9a
0.15% 8.5±0.7bc 4.9±0.7b
0.2% 7.9±1.2ab 7.5±1.4c
0.3% 8.1±0.8ab 10.9±1.2d
T=4oC 0% 8.1±0.8ab 1.1±0.4a
0.15% 8.3±1.2ab 4.4±0.6b
0.2% 8.3±0.9ab 7.6±1.0c
0.3% 8.9±1.0c 13.5±0.5e a-e Values followed by different letters in the same column are significantly different at p<0.05.
* Intensity evaluated on a 15-point scale with “Weak” scored as 1 and “Strong” scored as 15.
Table B-3. The sweetness intensity* of beverages prepared with four concentrations of BG.
BG concentration Sweetness
0% 7.3±1.3a
0.15% 7.9±1.1b
0.2% 7.9±1.0b
0.3% 8.2±1.2b
a,b Values followed by different letters are significantly different at p<0.05.
* Intensity evaluated on a 15-point scale with “Weak” scored as 1 and “Strong” scored as 15.
Table B-4. The sourness intensity* of beverages served at 25 oC and 4 oC.
Temperature(oC) Sourness
25 8.4±1.4a
4 9.2±1.4b
a,b Values followed by different letters are significantly different at p<0.05.
* Intensity evaluated on a 15-point scale with “Weak” scored as 1 and “Strong” scored as 15.

150
B.4 Recommendations
Panelists should develop their own descriptors for beverages.
More sessions are needed to train participants. After several sessions, the panel
performance should be evaluated, and then one or more sessions could be arranged for
retaining certain attributes if necessary. Until all participants reach an agreement and
consistency on the use of the scale, participants are not considered to be well-trained to
evaluate the test samples.
Other than crackers and water, weak green tea could also be provided for participants to
clean palate.
During evaluation, sample order should be balanced, because carry-over from the first
sample would affect the evaluation of the second sample.

151
Appendix C: PCA on the target group of 47 participants
-10 -5 0 5 10 15
-10
-50
51
01
5
Dim 1 (70.36%)
Dim
2 (
24
.77
%)
0.2% iBG Beverage
0% iBG BeverageIdeal product
Vitamin water
Individual description
-4 -2 0 2 4
-20
24
Dim 1 (70.36%)
Dim
2 (
24
.77%
)
Confidence ellipses for the mean points
0.2% iBG Beverage
0% iBG Beverage
Ideal product
Vitamin water
B
A

152
Figure C-1. Principal component analysis (PCA) on (A) individual description with individual
scores (•) and means ( ); (B) confidence ellipses of mean points; and (C) variable factor map.
-1.5 -1.0 -0.5 0.0 0.5 1.0 1.5
-1.0
-0.5
0.0
0.5
1.0
Variables factor map (PCA)
Dim 1 (70.36%)
Dim
2 (
24.7
7%
)
Orange
Sweet
Sour
Bitter
Aftertaste
Metallic
Thick
Orange
Sweet
Sour
Bitter
Aftertaste
Metallic
Thick
C