characterization and performance analysis of a pedal
TRANSCRIPT

Characterization and Performance Analysis of a Pedal
Electric-Assisted Bicycle
Joao [email protected]
Instituto Superior Tecnico, Lisboa, Portugal
June 2019
Abstract
In the last decade, large urban environments have attempted to combat air pollution, usinglegislation to prohibit the circulation of internal combustion vehicles. Recently, the electric bicycle hasbecome a new alternative in the market. This alternative consists of equipping a traditional bicyclewith an electric propulsion system, so that it promotes work, and assists the driver in his trips. Thiswork aims to estimate the efficiency of the electric system of an electric bicycle, by comparing theelectric power consumed and the mechanical power required for the vehicle to move, within a testcircuit. The results show that the efficiency of the electric system studied is very low, less than 10 %,making it infeasible to use these bicycles as an alternative to cars, motorcycles and public transportvehicles.Keywords: Electric drive system, bicycle, power, efficiency.
1. Introduction
Despite being a topic that is not new, electricvehicles continue to be a relevant area. With thegrowing environmental concern at European leveland with the measures announced in recent years,both at the level of taxes and at the legislative level,there are efforts to make electric powered vehiclesan integral part of society and to reduce the numberof traditional vehicles driven by oil fuel [1, 2].
This work concerns another type of vehicle,namely an electric bicycle, which appears not tobe as well publicized as electric cars, although ef-forts are already being made to implement it forcity wide mobility. This type of vehicle can be ap-pealing to the task at hand, mobility in the city,due to the low cost of acquisition when comparedto a car or a motorcycle, as well as the cost of sup-plying the battery, and the ease in finding a parkingspot. However, when compared to a classic bicycle,the electric bicycle may not be offer a better option,due to higher prices, more complex and expensivemaintenance, lack of efficiency and fear of theft.
2. Background
A social survey [3] was performed in Europe in2015-2016 to understand what made people buyan e-bike and what was the perception of the bi-cycle owners social environment’s opinions towardse-bikes. 24 people were interviewed, with age rang-ing from the early forties to the sixties. Half of the
population was from the Netherlands, an Europeancountry know for having a strong cycling culture,with roughly 27% of all trips being done by bicycle[3], while the other half of the population was fromthe United Kingdom, a country with a much lowerpercentage of trips done by bicycle, roughly 1% [3].
The main reason for acquiring an e-bike arehealth issues or declining physical abilities. Thepurchase of e-bikes increased the users’ overall phys-ical activity, and in some cases replaced car rideswith bicycle rides, providing a sense of well-beingto the user.
Concerns of e-bike users consist in the higherspeed achieved when compared to the classic bi-cycle, technical reasons associated with purchaseprice and battery performance, associated with fearof not having enough charge to fulfil a trip, socialstigma and potential theft.
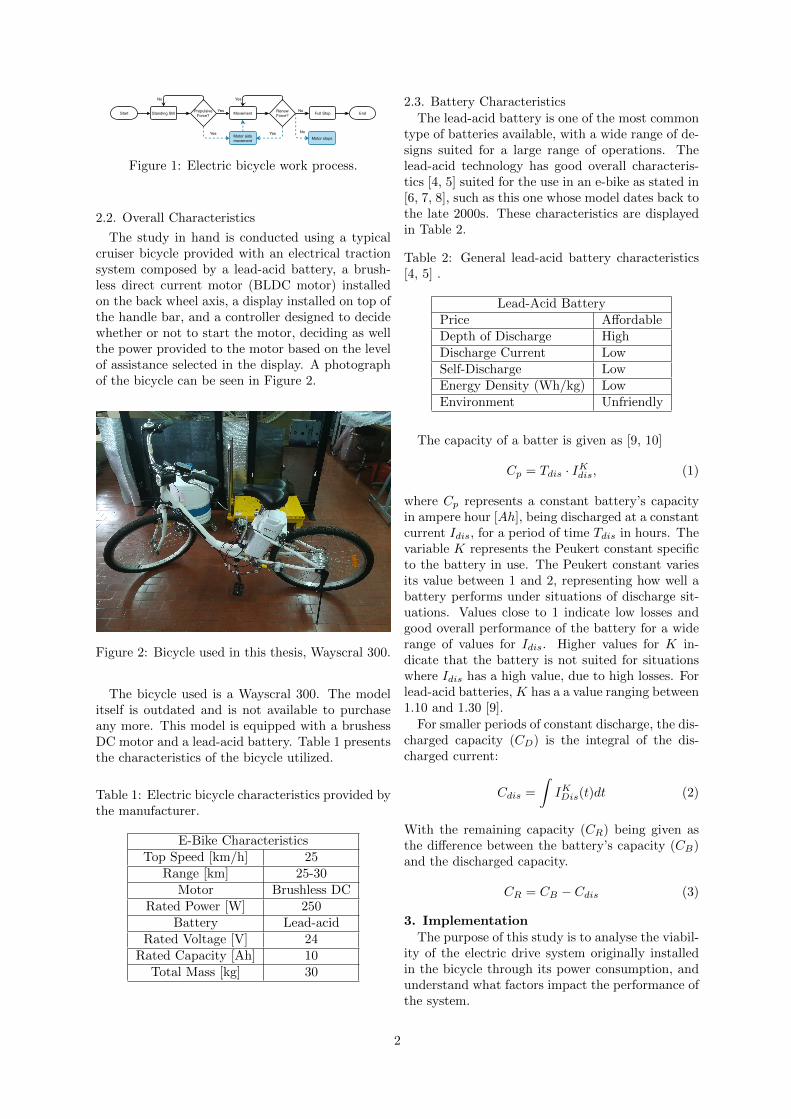
2.1. E-Bike Work Process
The electric bicycle work process differs due tothe existence of an electric drive system, aiding themovement. The electric drive system does not workisolated, the rider must provide the initial propul-sive force for the system to move, hence the char-acterization of this type of vehicle as an electricalassisted vehicle. The electric bicycle work processis described in Figure 1.
1
Start Standing Still Movement Full Stop EndPropulsiveForce?
Yes
No
No
Yes RenewForce?
Motor aidsmovement Motor stops
Yes NoYes
Figure 1: Electric bicycle work process.
2.2. Overall Characteristics
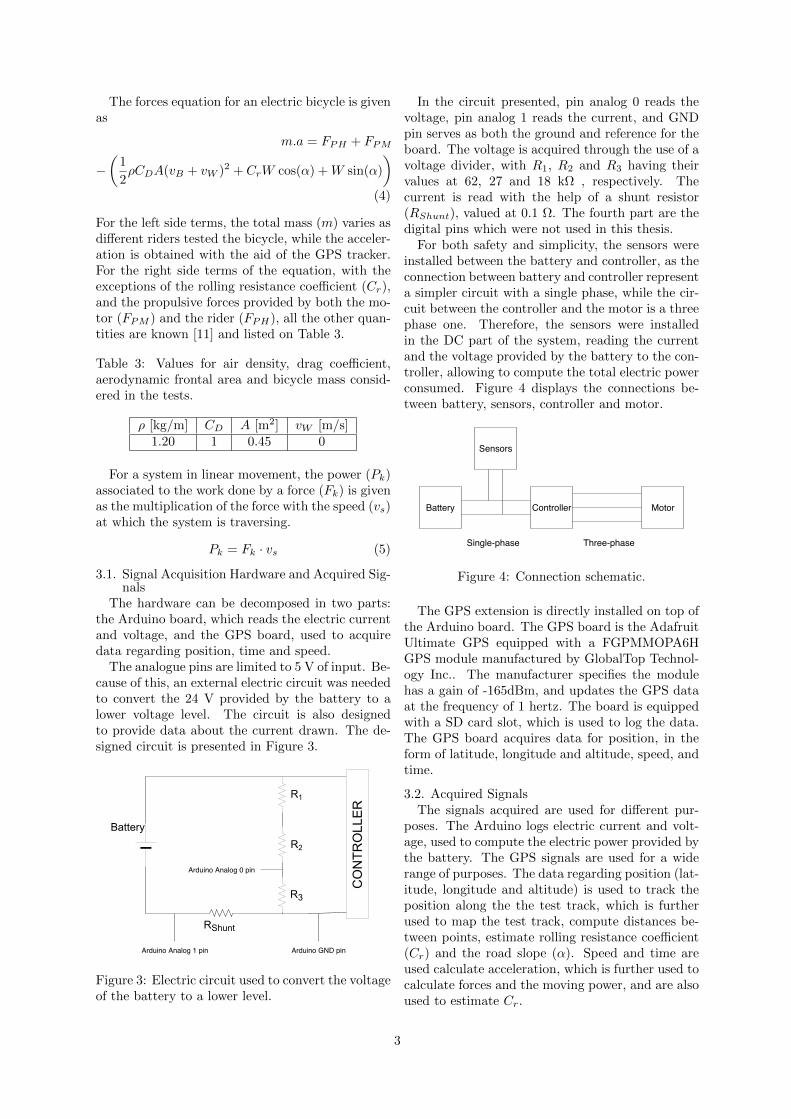
The study in hand is conducted using a typicalcruiser bicycle provided with an electrical tractionsystem composed by a lead-acid battery, a brush-less direct current motor (BLDC motor) installedon the back wheel axis, a display installed on top ofthe handle bar, and a controller designed to decidewhether or not to start the motor, deciding as wellthe power provided to the motor based on the levelof assistance selected in the display. A photographof the bicycle can be seen in Figure 2.
Figure 2: Bicycle used in this thesis, Wayscral 300.
The bicycle used is a Wayscral 300. The modelitself is outdated and is not available to purchaseany more. This model is equipped with a brushessDC motor and a lead-acid battery. Table 1 presentsthe characteristics of the bicycle utilized.
Table 1: Electric bicycle characteristics provided bythe manufacturer.
E-Bike CharacteristicsTop Speed [km/h] 25
Range [km] 25-30Motor Brushless DC
Rated Power [W] 250Battery Lead-acid
Rated Voltage [V] 24Rated Capacity [Ah] 10
Total Mass [kg] 30
2.3. Battery CharacteristicsThe lead-acid battery is one of the most common
type of batteries available, with a wide range of de-signs suited for a large range of operations. Thelead-acid technology has good overall characteris-tics [4, 5] suited for the use in an e-bike as stated in[6, 7, 8], such as this one whose model dates back tothe late 2000s. These characteristics are displayedin Table 2.
Table 2: General lead-acid battery characteristics[4, 5] .
Lead-Acid BatteryPrice AffordableDepth of Discharge HighDischarge Current LowSelf-Discharge LowEnergy Density (Wh/kg) LowEnvironment Unfriendly
The capacity of a batter is given as [9, 10]
Cp = Tdis · IKdis, (1)
where Cp represents a constant battery’s capacityin ampere hour [Ah], being discharged at a constantcurrent Idis, for a period of time Tdis in hours. Thevariable K represents the Peukert constant specificto the battery in use. The Peukert constant variesits value between 1 and 2, representing how well abattery performs under situations of discharge sit-uations. Values close to 1 indicate low losses andgood overall performance of the battery for a widerange of values for Idis. Higher values for K in-dicate that the battery is not suited for situationswhere Idis has a high value, due to high losses. Forlead-acid batteries, K has a a value ranging between1.10 and 1.30 [9].
For smaller periods of constant discharge, the dis-charged capacity (CD) is the integral of the dis-charged current:
Cdis =
∫IKDis(t)dt (2)
With the remaining capacity (CR) being given asthe difference between the battery’s capacity (CB)and the discharged capacity.
CR = CB − Cdis (3)
3. ImplementationThe purpose of this study is to analyse the viabil-
ity of the electric drive system originally installedin the bicycle through its power consumption, andunderstand what factors impact the performance ofthe system.
2
The forces equation for an electric bicycle is givenas
m.a = FPH + FPM
−(
1
2ρCDA(vB + vW )2 + CrW cos(α) +W sin(α)
)(4)
For the left side terms, the total mass (m) varies asdifferent riders tested the bicycle, while the acceler-ation is obtained with the aid of the GPS tracker.For the right side terms of the equation, with theexceptions of the rolling resistance coefficient (Cr),and the propulsive forces provided by both the mo-tor (FPM ) and the rider (FPH), all the other quan-tities are known [11] and listed on Table 3.
Table 3: Values for air density, drag coefficient,aerodynamic frontal area and bicycle mass consid-ered in the tests.
ρ [kg/m] CD A [m2] vW [m/s]1.20 1 0.45 0
For a system in linear movement, the power (Pk)associated to the work done by a force (Fk) is givenas the multiplication of the force with the speed (vs)at which the system is traversing.
Pk = Fk · vs (5)
3.1. Signal Acquisition Hardware and Acquired Sig-nals
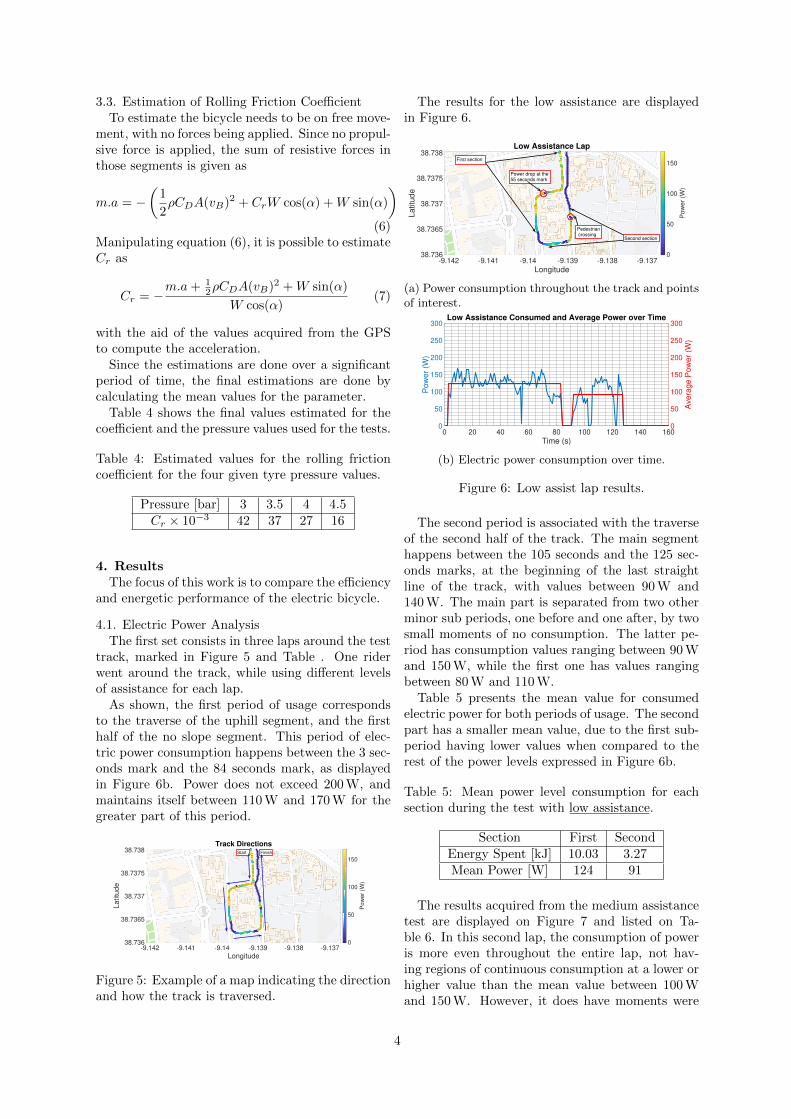
The hardware can be decomposed in two parts:the Arduino board, which reads the electric currentand voltage, and the GPS board, used to acquiredata regarding position, time and speed.
The analogue pins are limited to 5 V of input. Be-cause of this, an external electric circuit was neededto convert the 24 V provided by the battery to alower voltage level. The circuit is also designedto provide data about the current drawn. The de-signed circuit is presented in Figure 3.
BatteryR2
R1
R3
RShunt
CONTR
OLLER
Arduino Analog 1 pin Arduino GND pin
Arduino Analog 0 pin
Figure 3: Electric circuit used to convert the voltageof the battery to a lower level.
In the circuit presented, pin analog 0 reads thevoltage, pin analog 1 reads the current, and GNDpin serves as both the ground and reference for theboard. The voltage is acquired through the use of avoltage divider, with R1, R2 and R3 having theirvalues at 62, 27 and 18 kΩ , respectively. Thecurrent is read with the help of a shunt resistor(RShunt), valued at 0.1 Ω. The fourth part are thedigital pins which were not used in this thesis.
For both safety and simplicity, the sensors wereinstalled between the battery and controller, as theconnection between battery and controller representa simpler circuit with a single phase, while the cir-cuit between the controller and the motor is a threephase one. Therefore, the sensors were installedin the DC part of the system, reading the currentand the voltage provided by the battery to the con-troller, allowing to compute the total electric powerconsumed. Figure 4 displays the connections be-tween battery, sensors, controller and motor.
Battery Controller Motor
Sensors
Single-phase Three-phase
Figure 4: Connection schematic.
The GPS extension is directly installed on top ofthe Arduino board. The GPS board is the AdafruitUltimate GPS equipped with a FGPMMOPA6HGPS module manufactured by GlobalTop Technol-ogy Inc.. The manufacturer specifies the modulehas a gain of -165dBm, and updates the GPS dataat the frequency of 1 hertz. The board is equippedwith a SD card slot, which is used to log the data.The GPS board acquires data for position, in theform of latitude, longitude and altitude, speed, andtime.
3.2. Acquired SignalsThe signals acquired are used for different pur-
poses. The Arduino logs electric current and volt-age, used to compute the electric power provided bythe battery. The GPS signals are used for a widerange of purposes. The data regarding position (lat-itude, longitude and altitude) is used to track theposition along the the test track, which is furtherused to map the test track, compute distances be-tween points, estimate rolling resistance coefficient(Cr) and the road slope (α). Speed and time areused calculate acceleration, which is further used tocalculate forces and the moving power, and are alsoused to estimate Cr.
3
3.3. Estimation of Rolling Friction CoefficientTo estimate the bicycle needs to be on free move-
ment, with no forces being applied. Since no propul-sive force is applied, the sum of resistive forces inthose segments is given as
m.a = −(
1
2ρCDA(vB)2 + CrW cos(α) +W sin(α)
)(6)
Manipulating equation (6), it is possible to estimateCr as
Cr = −m.a+ 1
2ρCDA(vB)2 +W sin(α)
W cos(α)(7)
with the aid of the values acquired from the GPSto compute the acceleration.
Since the estimations are done over a significantperiod of time, the final estimations are done bycalculating the mean values for the parameter.
Table 4 shows the final values estimated for thecoefficient and the pressure values used for the tests.
Table 4: Estimated values for the rolling frictioncoefficient for the four given tyre pressure values.
Pressure [bar] 3 3.5 4 4.5Cr × 10−3 42 37 27 16
4. ResultsThe focus of this work is to compare the efficiency
and energetic performance of the electric bicycle.
4.1. Electric Power AnalysisThe first set consists in three laps around the test
track, marked in Figure 5 and Table . One riderwent around the track, while using different levelsof assistance for each lap.
As shown, the first period of usage correspondsto the traverse of the uphill segment, and the firsthalf of the no slope segment. This period of elec-tric power consumption happens between the 3 sec-onds mark and the 84 seconds mark, as displayedin Figure 6b. Power does not exceed 200 W, andmaintains itself between 110 W and 170 W for thegreater part of this period.
-9.142 -9.141 -9.14 -9.139 -9.138 -9.137
Longitude
38.736
38.7365
38.737
38.7375
38.738
La
titu
de
Track Directions
0
50
100
150
Po
we
r (W
)
FinishStart
Figure 5: Example of a map indicating the directionand how the track is traversed.
The results for the low assistance are displayedin Figure 6.
-9.142 -9.141 -9.14 -9.139 -9.138 -9.137
Longitude
38.736
38.7365
38.737
38.7375
38.738
La
titu
de
Low Assistance Lap
0
50
100
150
Pow
er
(W)
Power drop at the55 seconds mark
Pedestrian crossing
Second section
First section
(a) Power consumption throughout the track and pointsof interest.
0 20 40 60 80 100 120 140 160
Time (s)
0
50
100
150
200
250
300
Po
we
r (W
)0
50
100
150
200
250
300
Ave
rag
e P
ow
er
(W)
Low Assistance Consumed and Average Power over Time
(b) Electric power consumption over time.
Figure 6: Low assist lap results.
The second period is associated with the traverseof the second half of the track. The main segmenthappens between the 105 seconds and the 125 sec-onds marks, at the beginning of the last straightline of the track, with values between 90 W and140 W. The main part is separated from two otherminor sub periods, one before and one after, by twosmall moments of no consumption. The latter pe-riod has consumption values ranging between 90 Wand 150 W, while the first one has values rangingbetween 80 W and 110 W.
Table 5 presents the mean value for consumedelectric power for both periods of usage. The secondpart has a smaller mean value, due to the first sub-period having lower values when compared to therest of the power levels expressed in Figure 6b.
Table 5: Mean power level consumption for eachsection during the test with low assistance.
Section First SecondEnergy Spent [kJ] 10.03 3.27Mean Power [W] 124 91
The results acquired from the medium assistancetest are displayed on Figure 7 and listed on Ta-ble 6. In this second lap, the consumption of poweris more even throughout the entire lap, not hav-ing regions of continuous consumption at a lower orhigher value than the mean value between 100 Wand 150 W. However, it does have moments were
4

it shows power spikes exceeding 150 W, specially inthe later part of the track, when the electric drivesystem is turned on.
-9.142 -9.141 -9.14 -9.139 -9.138 -9.137
Longitude
38.736
38.7365
38.737
38.7375
38.738
38.7385
Latitu
de
Medium Assistance Lap
0
50
100
150
200
250
Po
we
r (W
)
Power Spike at the
108 seconds mark
Power Spike at the
55 seconds mark
First section
Second section
Third section
(a) Power consumption throughout the track and pointsof interest.
0 20 40 60 80 100 120 140 160
Time (s)
0
50
100
150
200
250
300
Pow
er
(W)
0
50
100
150
200
250
300
Avera
ge P
ow
er
(W)
Medium Assistance Consumed and Average Power over Time
294 W Power spikeLow period
187 W Power spike
(b) Electric power consumption over time.
Figure 7: Medium assist lap results.
As verified in Figure 7b, the electric drive systemhas a first period of usage, which lasts for 55 secondsand coincides with the traverse through the uphilland the east to west straight line sections of thetrack. In between the first and second sections ofelectric power consumption, the rider stopped ped-alling and began pedalling for a very brief moment,originating the time period between the 55 and 60second marks with a power spike in it, as evidencedin 7b.
The electric drive system is triggered once againin the north to south straight line of the no slopepart of the track. Here, it is verified that the systemwas turned on during the first half of the straightline (light blue section of Figure 7a) and the electricpower consumption was even throughout its use,corresponding to the time period between the 60and 80 seconds marks shown in Figure 7b.
The last section is composed by two sub-periods.Most of the values acquired are similar to the onesoccurred in the first and second track sections. De-spite this, one can also observe a power spike hap-pening at the beginning of this section. This powerspike happens at the 95 seconds mark and its valueis measured at 187 W.
For the second sub-period, the acquired poweris also similar to previous periods. However, as inthe first sub-period, there is also a power spike atthe start of this second sub-period, around the 108seconds mark. This power spike is the biggest in
this test having been measured at 294 W.Between these two sub-periods exists a period of
low to none consumption, due to the rider not ped-alling as he approach to the final corner of the track.
Table 6: Mean power level consumption for eachsection during the test with the medium level.
Section First Second ThirdEnergy Spent [kJ] 6.54 2.31 3.43Mean Power [W] 128 136 115
Lastly, Figure 8 and Table 7 show the results ob-tained for the high assistance test. The evolutionfor electric power consumption is similar to the oneobserved in the test with the medium level of assis-tance, having most of the values obtained within therange of 100 W and 150 W. This test does howeverdiffer from the previous one in the fact that morepower spikes were recorded and appear to happenwhen the electric drive system is turned on.
-9.142 -9.141 -9.14 -9.139 -9.138 -9.137
Longitude
38.736
38.7365
38.737
38.7375
38.738
38.7385
La
titu
de
High Assistance Lap
0
50
100
150
200
250
Pow
er
(W)
Power Spike at the
beginning of the lap
Power Spikes at the 50 and
100 seconds mark, after
periods without consumption
(a) Power consumption throughout the track and pointsof interest.
0 20 40 60 80 100 120 140 160
Time (s)
0
50
100
150
200
250
300
Po
we
r (W
)
0
50
100
150
200
250
300
Ave
rag
e P
ow
er
(W)
High Assistance Consumed and Average Power over Time
294 W Power spike
217 W Power spike 225 W Power spike
(b) Electric power consumption over time.
Figure 8: High assist lap: a) electric power con-sumption throughout the track, b) electric powerconsumption over time (blue) and the mean powerover the consumption time periods (red).
Like the test with medium assistance, the firstsection starts in the uphill part, and stops at theend of the first straight line, in the no slope segment.In this period, the electric power values are within100 W and 150 W, with the exception of the powerspike at the beginning with a value of 217 W, anda value acquired at the 22 seconds mark with itsvalue being just slightly higher than 150 W, beingread as 157 W.
5

The second section goes from the 50 to the 68seconds mark. This section is similar to the firstone by the fact that all the electric power valuesrange within 100 W and 150 W, with the exceptionof the power spike as it was stated before. Withinthis section it is also observed a power spike at thebeginning with its value being much higher than themean value, measured at 225 W.
The final section of interest happens in a simi-lar way as observed before in the other tests, hav-ing two sub-periods where the system is turned on,separated by a small period where it is once againturned off. In this section. The computed valuesfor electric power float between the same values ob-served as in the first and second periods, with theexceptions of the power spike. The power spike inthis period happens at the 100 seconds mark, beingmeasured at 278 W.
Table 7: Mean power level consumption for eachsection during the test with high assistance level.
Section First Second ThirdEnergy Spent [kJ] 5.31 2.51 3.00Mean Power [W] 129 132 114
When comparing all three tests, it is verified thatthe medium and high assistance levels show simi-lar results, having their electric power divided inthree distinct periods with similar mean values val-ues. The lowest assistance seems to work in a morereserved manner. In the later part of the circuit,the lowest assistance presents the lowest average,while also not having power spikes. For the uphillpart of the track, all three assistance levels performsimilarly in that specific situation.
Despite the medium and high levels having simi-lar behaviour and values, it is also observed that thehigh level assistance test finishes around 10 secondsearlier than the medium level test. A few reasonscan be consider for this to happen, the first one isrelated to the existence of power spikes and howthey could apply a stronger acceleration. This sit-uation does not seem plausible as in the mediumtest there are also power spikes but the durationof this test and the low level test have the sameduration of 160 seconds. For this reason, the mostplausible motives for the high level test having asmaller duration of 150 seconds are associated withfavourable track conditions, and a more familiarityof the system and track by the rider.
Table 8 lists the elapsed time on each lap, the to-tal energy spent, and the mean power, for the dataacquired and for the mean value approach. The lastrow presents the difference between the acquireddata and the mean values.
4.2. Speed and Electric Power Correlation
It is important to understand what kind of im-pact the electric drive system has on the system.In order to do so, it is intended to see what kindof effect and correlation exist between the electricpower consumption and the bicycle’s speed.
Figure 9 displays both electric power and speedacquired during the three tests.
0 20 40 60 80 100 120 140 160
Time (s)
0
1
2
3
4
5
6
Sp
ee
d (
m/s
)
0
50
100
150
200
250
300
Po
we
r (W
)
Low Assistance
(a) Low assistance values for speed and electric power.
0 20 40 60 80 100 120 140 160
Time (s)
0
1
2
3
4
5
6
Sp
ee
d (
m/s
)
0
50
100
150
200
250
300
Po
we
r (W
)
Medium Assistance
Odd point. The system isturned on, but speed still falls.
(b) Medium assistance values for speed and electricpower.
0 20 40 60 80 100 120 140 160
Time (s)
0
1
2
3
4
5
6
Sp
ee
d (
m/s
)
0
50
100
150
200
250
300
Po
we
r (W
)
High Assistance
(c) High assistance values for speed and electric power.
Figure 9: Speed (blue) and consumed power (red)throughout the three laps.
In all three graphics presented, similar actionsoccur in the first part of the track. Speed risessteadily in the first seconds, stabilizing its value forthe rest of the uphill part. The differences betweenthe three levels come in the mean values computedfor the mean acceleration, which seem to increasewith the increase of assistance level. Since the meanacceleration gets higher for each assistance, it alsomeans the energy and power spent in this sectionare higher.
After the first period, once the bicycle reaches theend of the hill it is observed that speed once againincreases in all three tests. However, as discussed insection 4.1, the low level test presents a consump-
6
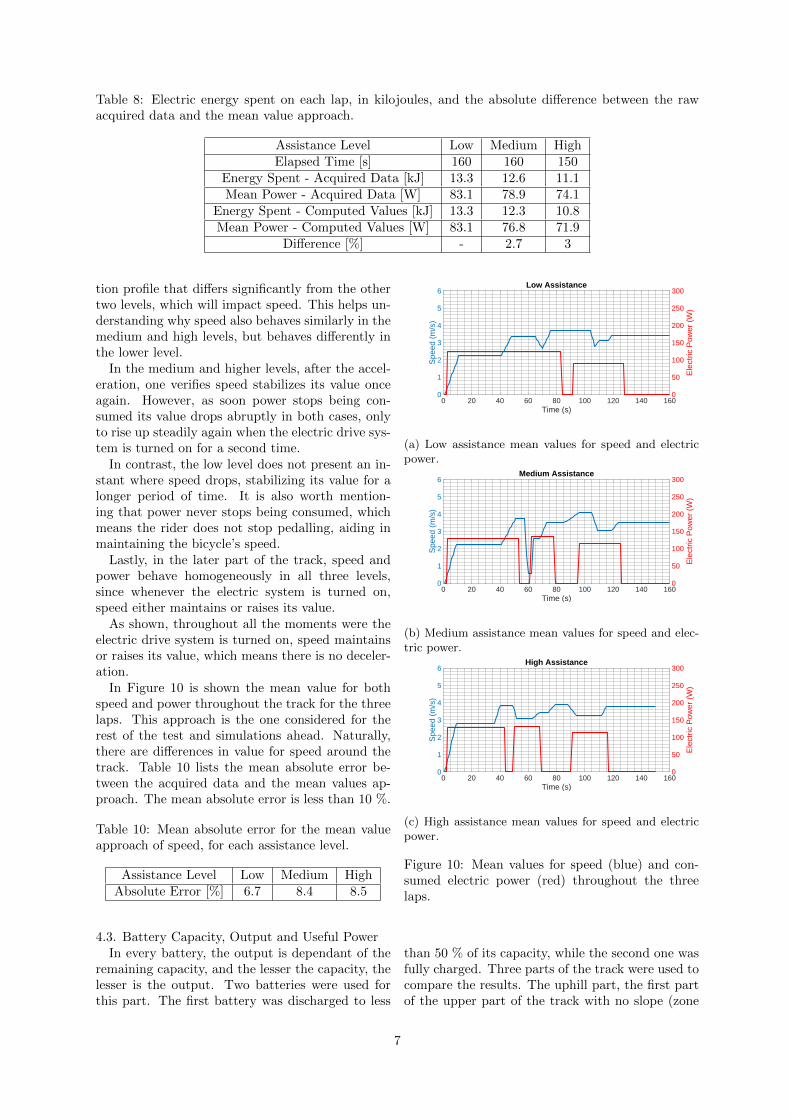
Table 8: Electric energy spent on each lap, in kilojoules, and the absolute difference between the rawacquired data and the mean value approach.
Assistance Level Low Medium HighElapsed Time [s] 160 160 150
Energy Spent - Acquired Data [kJ] 13.3 12.6 11.1Mean Power - Acquired Data [W] 83.1 78.9 74.1
Energy Spent - Computed Values [kJ] 13.3 12.3 10.8Mean Power - Computed Values [W] 83.1 76.8 71.9
Difference [%] - 2.7 3
tion profile that differs significantly from the othertwo levels, which will impact speed. This helps un-derstanding why speed also behaves similarly in themedium and high levels, but behaves differently inthe lower level.
In the medium and higher levels, after the accel-eration, one verifies speed stabilizes its value onceagain. However, as soon power stops being con-sumed its value drops abruptly in both cases, onlyto rise up steadily again when the electric drive sys-tem is turned on for a second time.
In contrast, the low level does not present an in-stant where speed drops, stabilizing its value for alonger period of time. It is also worth mention-ing that power never stops being consumed, whichmeans the rider does not stop pedalling, aiding inmaintaining the bicycle’s speed.
Lastly, in the later part of the track, speed andpower behave homogeneously in all three levels,since whenever the electric system is turned on,speed either maintains or raises its value.
As shown, throughout all the moments were theelectric drive system is turned on, speed maintainsor raises its value, which means there is no deceler-ation.
In Figure 10 is shown the mean value for bothspeed and power throughout the track for the threelaps. This approach is the one considered for therest of the test and simulations ahead. Naturally,there are differences in value for speed around thetrack. Table 10 lists the mean absolute error be-tween the acquired data and the mean values ap-proach. The mean absolute error is less than 10 %.
Table 10: Mean absolute error for the mean valueapproach of speed, for each assistance level.
Assistance Level Low Medium HighAbsolute Error [%] 6.7 8.4 8.5
4.3. Battery Capacity, Output and Useful PowerIn every battery, the output is dependant of the
remaining capacity, and the lesser the capacity, thelesser is the output. Two batteries were used forthis part. The first battery was discharged to less
0 20 40 60 80 100 120 140 160Time (s)
0
1
2
3
4
5
6
Spe
ed (
m/s
)
0
50
100
150
200
250
300
Ele
ctric
Pow
er (
W)
Low Assistance
(a) Low assistance mean values for speed and electricpower.
0 20 40 60 80 100 120 140 160Time (s)
0
1
2
3
4
5
6
Spe
ed (
m/s
)
0
50
100
150
200
250
300
Ele
ctric
Pow
er (
W)
Medium Assistance
(b) Medium assistance mean values for speed and elec-tric power.
0 20 40 60 80 100 120 140 160Time (s)
0
1
2
3
4
5
6
Spe
ed (
m/s
)
0
50
100
150
200
250
300
Ele
ctric
Pow
er (
W)
High Assistance
(c) High assistance mean values for speed and electricpower.
Figure 10: Mean values for speed (blue) and con-sumed electric power (red) throughout the threelaps.
than 50 % of its capacity, while the second one wasfully charged. Three parts of the track were used tocompare the results. The uphill part, the first partof the upper part of the track with no slope (zone
7

A), and the final part of the track with no slope(zone B). Figure 11 shows the three zones consid-ered.
-9.141 -9.14 -9.139 -9.138 -9.137
Longitude
38.7365
38.737
38.7375
38.738
Latitu
de
Test Track Zones Considered
Zone B
Uphill
Zone A
Figure 11: Zones of the track considered.
The mean power discharged for these situationsis presented in Table 11.
For both charged and below 50 % tests, the up-hill part of the track is the one where higher dis-charged power values are presented, and the lastpart is where discharged power presents the lowervalues. The difference between each test comes inthe discrepancy between these two situations, wherea lower charge level leads to a lesser discrepancy.For the middle test with charge below 75 %, the re-gion where a higher discharge happens is not on theuphill part, but after it, during the first part of theno slope region of the track(zone A). Despite this,in all assists both regions show very similar values,even having the same value for the lowest assist.The last part of the track remains the one withthe lowest values for the discharged power. Lastly,as the capacity of the battery fades, the dischargedpower between assist levels tends to equalize, whichin turn makes the usage of difference assist levelsbecomes meaningless at lower capacity levels.
The difference in output could provide a higherspeed achieved by the bicycle under similar tracksituations. In Table 12 is listed the mean speedachieved, and the needed mechanical power to moveat said speed.
In a preliminary analysis, a higher dischargedelectric power does not necessarily imply a higherspeed achieved, as the speed achieved in the testwith the least power discharge by the batterypresents values for speed greater than the ones ob-tained with the discharge power at a charge below75 %. It is also shown that the charged battery pro-vided enough output to impact the speed achieve,having this test achieved the greater values of allthree.
When also taking into consideration the resultsobtained for power, from all three scenarios, theworst one is the middle one with the charge below75 %, as it displays the lowest values for speeds withconsiderable values for discharged electric power. Incontrast, the best scenario is the charged scenario,
as power seems to influence the greater speedsachieved. In order to estimate what portion of theelectric power is useful, a comparison was madebetween the best and worst scenario, in both theno slope parts of the track. The lower charge testwas disregarded, mainly due to speed being similar,and sometimes higher, than the one achieved in the75 % test. Additionally, the power discharged inthe lower charge test is close in value to the neededmechanical power.
The uphill results display similar speed achievedthroughout all the charge levels and assists. Thisfact can imply that the overall output provided bythe electric system is fairly low, leading to low ef-ficiency. The results also lead to considering thefunctioning of this kind of vehicles does not providean equally distributed work load between the motorand person. Table 13 displays the results for all thetests conducted in this section, regarding the per-centage of the needed mechanical power that is pro-vided by the electric system, and what percentageof the discharged electric power is used. Consider-ing that most power is provided by the person, theresults selected for the simulation are the ones cor-responding to a workload distribution of 60-40 %,70-30 %, 80-20 % and 90-10 % between human andmotor. The results show that less than 10 % or theoriginal power drawn by the battery is used to aidthe rider.
4.4. Battery Evaluation and Number of TripsThe evaluation of the battery is done under the
simulation of four hypothetical situations. The firstthree emphasise on the use of a singular assist levelthroughout the entire use of the battery. The forthtest combines the use of different assist levels, tak-ing into consideration the remaining capacity of thebattery. The high assistance is used if the batteryis above 75 %, the medium assistance is used if thebattery is below 75 %, and the low assistance is usedif the battery is below 50 %.
For these tests, the remaining capacity is calcu-lated in a recursive way:
CK = CK−1 − Cdis, (8)
where CK is the battery’s capacity at iteration K,CK−1 is the battery’s capacity in the previous itera-tion, and Cdis is the discharged capacity, calculatedas seen in (2).
It is considered the battery is fully charged at thebeginning of each simulation, the battery is fullydischarged at the end, and a lap corresponds to aniteration. The results for the simulations are listedin Table 14.
The results show that increasing the Peukert con-stant (K) leads to less available trips. For everyvalue of K, the results show the low level assistance
8

Table 11: Discharged power by the battery in three situations on the track. In each charge situation,each row represents an assist level, with the first one being the lowest setting, the second one being themedium setting and the third one being the highest setting. All the values are measured in watt.
Battery AssistanceOutput Power [W]
UphillNo Slope(Zone A)
No Slope(Zone B)
ChargedLow 257 110 74
Medium 308 198 255High 309 300 257
Below 75 %Low 124 124 91
Medium 128 136 115High 129 132 114
Below 50 %Low 78 22 76
Medium 70 70 62High 62 62 56
Table 12: Speed and needed mechanical power, for each track part, charge level and assistance. For eachbattery, the first row represents the lowest assist level, the second row represents the medium assist level,and the third row represents the high assist level.
BatteryUphill Zone A Zone B
Speed [m/s] Power [W] Speed [m/s] Power [W] Speed [m/s] Power [W]
Charged2.73 199.64 3.64 22.65 4.16 30.493.31 244.73 4.87 44.08 4.96 46.003.16 233.40 4.67 39.85 5.50 59.46
Below 75 %2.25 162.99 3.33 18.79 3.11 16.362.24 162.23 3.72 23.75 3.02 15.432.78 203.38 3.86 25.75 3.27 18.10
Below 50 %2.76 201.77 3.75 24.18 3.33 18.743.00 220.34 4.06 28.85 3.67 23.272.86 209.64 3.75 24.11 2.87 13.95
Table 13: Percentage of electric power aiding the bicycle’s movement, taking into consideration the motorworkload, the battery charge, the assistance level and the track zones considered.
BatteryCapacity
MotorWorkload [%]
Low Medium HighZone A Zone B Zone A Zone B Zone A Zone B
Charged
40 8.24 % 16.48 % 8.91 % 7.22 % 5.31 % 9.25 %30 6.18 % 12.36 % 6.68 % 5.41 % 3.98 % 6.94 %20 4.12 % 8.24 % 4.45 % 3.61 % 2.66 % 4.63 %10 2.06 % 4.12 % 2.22 % 1.80 % 1.33 % 2.33 %
Below 75 %
40 6.06 % 7.19 % 6.99 % 5.37 % 7.80 % 6.35 %30 4.55 % 5.39 % 5.24 % 4.03 % 5.85 % 4.76 %20 3.03 % 3.60 % 3.49 % 2.68 % 3.90 % 3.18 %10 1.52 % 1.80 % 1.75 % 1.34 % 1.95 % 1.59 %
leads to more trips, the medium and high assistancehave similar values, lower than the low assistancelevel, and the combination test has its number oftrips between the low assistance and the other twolevels. Incrementing the assistance level lessens thenumber of trips at the charged and below 50 % ca-pacity. However, the number of trips for each assis-tance levels seems to increase when the capacity isbelow 75 %.
The results show this behaviour due to theamount of time where the electric drive system isused decreases, with the increase of assistance. Ifthe amount of time was similar for all assistance,then the number of trips would not increase.
Considering a person uses this kind of bicycle for2 daily trips, a month has 20 working days, lead-ing to 40 monthly trips, and also considering saidperson uses the medium or high level, the average
9
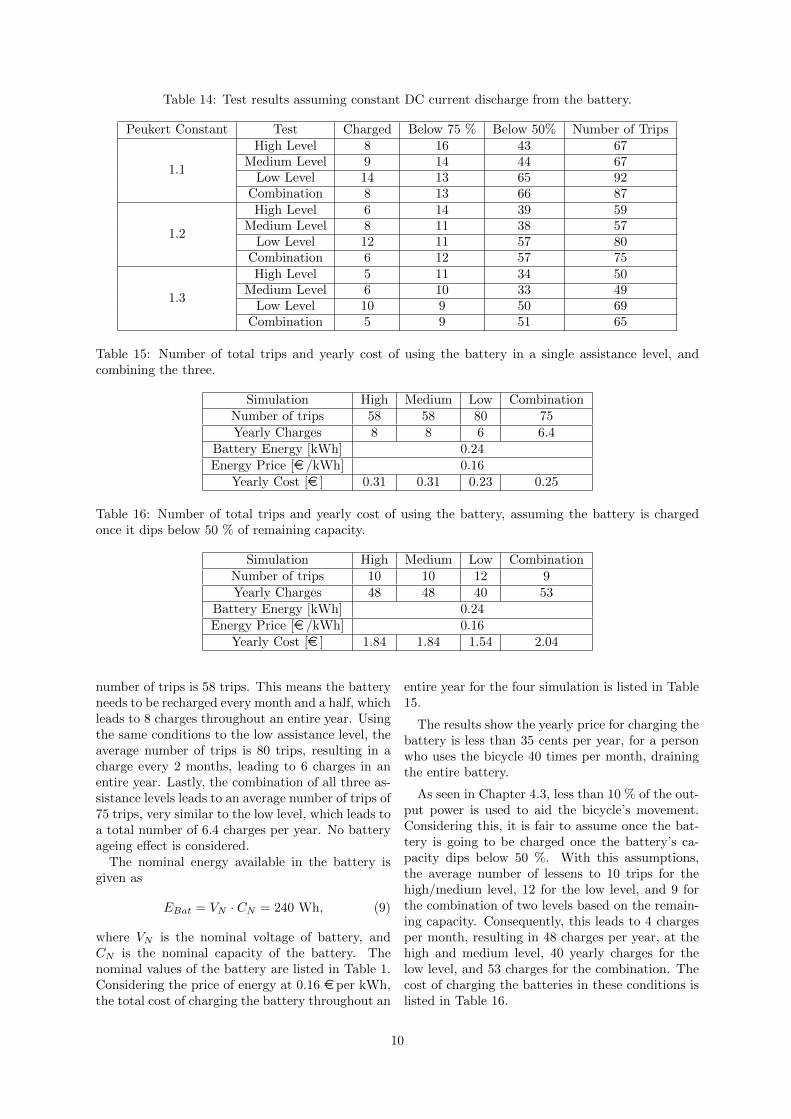
Table 14: Test results assuming constant DC current discharge from the battery.
Peukert Constant Test Charged Below 75 % Below 50% Number of Trips
1.1
High Level 8 16 43 67Medium Level 9 14 44 67
Low Level 14 13 65 92Combination 8 13 66 87
1.2
High Level 6 14 39 59Medium Level 8 11 38 57
Low Level 12 11 57 80Combination 6 12 57 75
1.3
High Level 5 11 34 50Medium Level 6 10 33 49
Low Level 10 9 50 69Combination 5 9 51 65
Table 15: Number of total trips and yearly cost of using the battery in a single assistance level, andcombining the three.
Simulation High Medium Low CombinationNumber of trips 58 58 80 75Yearly Charges 8 8 6 6.4
Battery Energy [kWh] 0.24Energy Price [e /kWh] 0.16
Yearly Cost [e ] 0.31 0.31 0.23 0.25
Table 16: Number of total trips and yearly cost of using the battery, assuming the battery is chargedonce it dips below 50 % of remaining capacity.
Simulation High Medium Low CombinationNumber of trips 10 10 12 9Yearly Charges 48 48 40 53
Battery Energy [kWh] 0.24Energy Price [e /kWh] 0.16
Yearly Cost [e ] 1.84 1.84 1.54 2.04
number of trips is 58 trips. This means the batteryneeds to be recharged every month and a half, whichleads to 8 charges throughout an entire year. Usingthe same conditions to the low assistance level, theaverage number of trips is 80 trips, resulting in acharge every 2 months, leading to 6 charges in anentire year. Lastly, the combination of all three as-sistance levels leads to an average number of trips of75 trips, very similar to the low level, which leads toa total number of 6.4 charges per year. No batteryageing effect is considered.
The nominal energy available in the battery isgiven as
EBat = VN · CN = 240 Wh, (9)
where VN is the nominal voltage of battery, andCN is the nominal capacity of the battery. Thenominal values of the battery are listed in Table 1.Considering the price of energy at 0.16 eper kWh,the total cost of charging the battery throughout an
entire year for the four simulation is listed in Table15.
The results show the yearly price for charging thebattery is less than 35 cents per year, for a personwho uses the bicycle 40 times per month, drainingthe entire battery.
As seen in Chapter 4.3, less than 10 % of the out-put power is used to aid the bicycle’s movement.Considering this, it is fair to assume once the bat-tery is going to be charged once the battery’s ca-pacity dips below 50 %. With this assumptions,the average number of lessens to 10 trips for thehigh/medium level, 12 for the low level, and 9 forthe combination of two levels based on the remain-ing capacity. Consequently, this leads to 4 chargesper month, resulting in 48 charges per year, at thehigh and medium level, 40 yearly charges for thelow level, and 53 charges for the combination. Thecost of charging the batteries in these conditions islisted in Table 16.
10
The price increase is significant, increasing 4.9times for the high and medium assistance, 5.7 timesfor the low assistance, and 7.16 times for a combi-nation of both high and medium assistances, basedon the remaining capacity.
5. Conclusions
The purpose of this work is to study the electricdrive system’s components, and their influence andimpact on the motion of the bicycle, and deliberateif the system is viable for city wide mobility.
As seen in (5), the higher the speed at which thebicycle moves, the higher the necessary mechanicalpower to move. However, the percentage of con-sumed electrical power that can be used in aidingthe motion is less than 10 %, and lower capacitylevels lead to a lesser percentage of usable electricpower, which ultimately leads to a meaningless as-sistance at high speed, and low battery capacities.
Electric components are known for having highpower efficiency, therefore, the loss in power comesin the transmission of power between the electricmotor and the back wheel axis.
For city wide mobility, this model of electric as-sisted bicycles is not a suitable alternative to con-ventional transportation methods, such as publictransportations (bus, subway, among others), forcities were the terrain has several uphill zones. Itdoes however provide an alternative to the regularbicycle, as the price of charging the batteries overa year is meaningless, and the price ranges between500 ¿ to 1200 ¿ for an after market bicycle, and itcan be as low as 1000 ¿ for a brand new one in of-ficial retailers. There are also services who provideelectric bicycles at the cost of a subscription thatcould be more beneficial for the consumer.
This study focused on the overall system as awhole. As such, it would be interesting to studyeach component of the electric system individu-ally, in order to develop an equivalent model foreach part, consolidating them together in a com-plete model of the electric drive system of the bi-cycle. The battery could be the first component tobe studied in a deeper way, estimating its chargethrough the use of dedicated sensors, allowing forestimations regarding the state of charge of the bat-tery, based on the voltage and current drawn fromit. Since no information is given regarding the con-troller, the development of a new controller shouldalso be considered.
References
[1] A. Bendix. 15 major cities around the worldthat are starting to ban cars, January 12 2019.(https://www.businessinsider.com/cities-going-car-free-ban-2018-12), last access onMay 20th.
[2] C. Harris, R. Cereceda, and M. Arm-strong. What are european cities doingto tackle air pollution?, Febuary 27 2019.(https://www.euronews.com/2019/02/27/what-are-european-cities-doing-to-tackle-air-pollution), last access on May 20th.
[3] T. Jones, L. Harms, and E. Heinen. Motives,perceptions and experiences of electric bicycleowners and implications for health, wellbeingand mobility. Journal of Transport Geography,May 2016.
[4] I. Buchmann. Batteries in a Portable World:A Handbook on Rechargeable Batteries forNon-Engineers, chapter 2, 6. Cadex Electron-ics Inc., second edition, 2001.
[5] W. H. Yeadon and A. W. Yeadon. Handbook ofSmall Electric Motors, chapter 4, 5. McGraw-Hill, 2001.
[6] S. M. A. S. Bukhari, J. Maqsood, and M. Q.Baig. Comparison of characteristics - lead acid,nickel based, lead crystal and lithium basedbatteries. 2015.
[7] J. Y. Yong, V. K. Ramachandaramurthy, K. M.Tan, and N. Mithulananthan. A review on thestate-of-the-art technologies of electric vehicle,its impacts and prospects. Renewable and Sus-tainable Energy Reviews 49, May 2015.
[8] J. X. Weinert, A. F. Burke, and X. Wei. Lead-acid and lithium-ion batteries for the chineseelectric bike market and implications on fu-ture techonology and advancement. Journalof Power Sources 172, May 2007.
[9] N. Omar, M. Daowd, P. van de Boss-che, O. Hegazy, J. Smekens, T. Coose-mans, and J. van Mierlo. Recharge-able energy storage systems for plug-in hy-brid electric vehicles - assessment of electri-cal characteristics. Energies, August 2012.(Available at https://www.mdpi.com/1996-1073/5/8/2952).
[10] D. Doerffel and S. A. Sharkh. A critical re-view of using the peukert equation for de-termining the remaining capacity of lead-acidand lithium-ion batteries. Journal of PowerSources 155, August 2005.
[11] D. G. Wilson. Bicycling Science, chapter 4, 5.The MIT Press, 2004.
11