characterization of a suspected …ufdcimages.uflib.ufl.edu/uf/e0/04/35/56/00001/berger_s.pdf · 1...
TRANSCRIPT

1
CHARACTERIZATION OF A SUSPECTED HERBICIDE TOLERANT HYBRID WATERMILFOIL (Myriophyllum spicatum x M. sibiricum)
By
SARAH BERGER
A THESIS PRESENTED TO THE GRADUATE SCHOOL OF THE UNIVERSITY OF FLORIDA IN PARTIAL FULFILLMENT
OF THE REQUIREMENTS FOR THE DEGREE OF MASTER OF SCIENCE
UNIVERSITY OF FLORIDA
2011

2
© 2011 Sarah Berger

3
To my friends and family

4
ACKNOWLEDGMENTS
For their support and input throughout my time at the University of Florida I would
like to thank my committee: Dr. Greg MacDonald, Dr. Mike Netherland, Dr. Bill Haller,
and Dr. Michael Kane. Specifically I would like to extend my appreciation to Dr. Mike
Netherland for additional assistance and guidance he offered. I appreciate Dr.
MacDonald for his advice and encouragement from the beginning. In addition, I would
like to thank Dr. Ferrell for sharing his thoughts and guidance throughout my tenure as a
Master‟s student. Fellow Weed Science graduate students have made this experience
enjoyable while also providing invaluable help.
I am grateful for the funding for this research provided by Florida Fish and Wildlife
Conservation Commission and support from the Center for Aquatic and Invasive Plants.
I appreciate my parents‟ support and encouragement to further my education and
appreciate all they have done to encourage me throughout the years. Finally, I would
like to thank Brandon Theisen for his support.

5
TABLE OF CONTENTS page
ACKNOWLEDGMENTS .................................................................................................. 4
LIST OF TABLES ............................................................................................................ 7
LIST OF FIGURES .......................................................................................................... 9
ABSTRACT ................................................................................................................... 10
CHAPTER
1 INTRODUCTION .................................................................................................... 12
Myriophyllum Biology .............................................................................................. 13
Impacts and Management of Invasive Watermilfoil Species ................................... 17
Fluridone Herbicide ................................................................................................. 20 PAM Fluorometery .................................................................................................. 25
2 EVALUATION OF SUSPECTED FLURIDONE TOLERANT HYBRID WATERMILFOIL UNDER STATIC MESOCOSM CONDITIONS ............................ 29
Materials and Methods............................................................................................ 31
Experiment 1 .................................................................................................... 31 Experiment 2 .................................................................................................... 32
Experiment 3 .................................................................................................... 34 Results and Discussion........................................................................................... 35
Experiment 1 .................................................................................................... 35
Experiment 2 .................................................................................................... 36 Experiment 3 .................................................................................................... 36
3 A COMPARISON OF METHODS FOR CHARACTERIZING HERBICIDAL EFFECTS ON SUBMERSED AQUATIC VASCULAR PLANTS ............................. 43
Materials and Methods............................................................................................ 47
Pigment Extraction Incubation Time ................................................................. 47 PAM Fluorometery ........................................................................................... 48 Shoot Length Response ................................................................................... 49
Results and Discussion........................................................................................... 50
Pigment Extraction Incubation Time ................................................................. 50 PAM Fluorometry ............................................................................................. 51 Shoot Length Response ................................................................................... 52
4 CHARACTERIZATION OF FLURIDONE TOLERANT HYBRID WATERMILFOIL ULTILIZING PIGMENT ANALYSIS AND PAM FLUOROMETERY ......................... 58

6
Materials and Methods............................................................................................ 63
Experiment 1 .................................................................................................... 63 Experiment 2 .................................................................................................... 64
Results and Discussion........................................................................................... 65 Experiment 1 .................................................................................................... 65 Experiment 2 .................................................................................................... 67
5 EVALUATION OF A HYBRID WATERMILFOIL RESPONSE TO PIGMENT SYNTHESIS INHIBITING HERBICIDES ................................................................. 73
Materials and Methods............................................................................................ 75 Results and Discussion........................................................................................... 76
Fluridone .......................................................................................................... 76 Norflurazon ....................................................................................................... 77
Topramezone ................................................................................................... 77
6 CONCLUSIONS ..................................................................................................... 83
LIST OF REFERENCES ............................................................................................... 85
BIOGRAPHICAL SKETCH ............................................................................................ 92

7
LIST OF TABLES
Table page 2-1 Invasive watermilfoil (Myriophyllum spp.) populations used in Experiment 2. .... 39
2-2 Invasive watermilfoil (Myriophyllum spp.) populations used in Experiment 3. .... 39
2-3 Fluorescence yield (Fv/Fm) in susceptible and Townline populations of invasive watermilfoils as a function of fluridone concentration 7 and 11 weeks after treatment (WAT). ........................................................................................ 39
2-4 Biomass of susceptible and Townline populations of invasive watermilfoils as a function of fluridone concentration 7 and 11 weeks after treatment (WAT). .... 39
3-1 Total chlorophyll and total carotenoids extracted from hydrilla and Eurasian watermilfoil (EWM) tissue in dimethyl sulfoxide as a function of 6 hour incubation time. .................................................................................................. 55
3-2 Total chlorophyll and total carotenoids extracted from hydrilla and Eurasian watermilfoil (EWM) tissue in dimethyl sulfoxide as a function of 1 hour incubation time. .................................................................................................. 55
3-3 EC50 values (± confidence intervals, α=0.05) for fluorescence yield, total chlorophyll, and total carotenoids for suspected fluridone-tolerant and fluridone-susceptible invasive watermilfoil populations. ...................................... 55
3-4 Fluorescence Yield (Fv/Fm) in Eurasian watermilfoil shoot lengths as a function of fluridone concentration 2 days after treatment. ................................. 56
3-5 Fluorescence Yield (Fv/Fm) in Eurasian watermilfoil shoot lengths as a function of fluridone concentration 6 days after treatment. ................................. 56
3-6 Fluorescence Yield (Fv/Fm) in Eurasian watermilfoil shoot lengths as a function of fluridone concentration 10 days after treatment. ............................... 56
3-7 Total chlorophyll in Eurasian watermilfoil shoot lengths as a function of fluridone concentration 10 days after treatment.................................................. 57
3-8 Total carotenoids in Eurasian watermilfoil shoot lengths as a function of fluridone concentration 10 days after treatment.................................................. 57
4-1 Populations of invasive watermilfoils used in Experiment 1. ............................... 68
4-2 Fluorescence yield (Fv/Fm) in Townline plants and 3 different populations of invasive watermilfoils after exposure to fluridone 3 days after treatment. ........... 68

8
4-3 Fluorescence yield (Fv/Fm) in Townline plants and 3 different populations of invasive watermilfoils after exposure to fluridone 5 days after treatment. ........... 68
4-4 Fluorescence yield (Fv/Fm) in Townline plants and 3 different populations of invasive watermilfoils after exposure to fluridone 7 days after treatment. ........... 69
4-5 Total chlorophyll in Townline plants and 3 different populations of invasive watermilfoils after exposure to fluridone 7 days after treatment. ........................ 69
4-6 Total carotenoids in Townline plants and 3 different populations of invasive watermilfoils after exposure to fluridone 7 days after treatment. ........................ 69

9
LIST OF FIGURES
Figure page 1-1 An example of two fluorescence induction curves measured by PAM
fluorometer ......................................................................................................... 28
2-1 Above ground biomass in susceptible and Townline invasive watermilfoil plants as a function of fluridone concentration 7 weeks after treatment. ............ 40
2-2 Fluorescence yield (Fv/Fm) and dry biomass of suspected fluridone tolerant hybrid watermilfoil and susceptible populations of invasive watermilfoils 6 weeks after treatment with fluridone. .................................................................. 41
2-3 Dry biomass of suspected fluridone tolerant hybrid watermilfoil and 4 combined populations of susceptible invasive watermilfoils 8 weeks after treatment with fluridone. ..................................................................................... 42
4-1 Fluorescence Yield (Fv/Fm) in Townline plants and nine different populations of susceptible invasive watermilfoils 7 days after treatment with fluridone. ........ 70
4-2 Total chlorophyll in Townline plants and nine different populations of susceptible invasive watermilfoils 7 days after treatment with fluridone. .......... 71
4-3 Total carotenoids in Townline plants and nine different populations of susceptible invasive watermilfoils 7 days after treatment with fluridone. ............ 72
5-1 Fluorescence yield (Fv/Fm)(a), total chlorophyll (b), and total carotenoids (c), in susceptible and Townline watermilfoil plants as a function of fluridone concentration 10 days after treatment. ............................................................... 80
5-2 Fluorescence yield (Fv/Fm)(a), total chlorophyll (b), and total carotenoids (c), in susceptible and Townline watermilfoil plants as a function of norflurazon concentration 10 days after treatment. ............................................................... 81
5-3 Fluorescence yield (Fv/Fm)(a), total chlorophyll (b), and total carotenoids (c), in susceptible and Townline watermilfoil plants as a function of topramezone concentration 10 days after treatment. ............................................................... 82

10
Abstract of Thesis Presented to the Graduate School of the University of Florida in Partial Fulfillment of the Requirements for the Degree of Master of Science
CHARACTERIZATION OF A SUSPECTED HERBICIDE TOLERANT HYBRID
WATERMILFOIL (Myriophyllum spicatum x M. sibiricum) By
Sarah Berger
December 2011
Chair: Gregory MacDonald Major: Agronomy
An invasive watermilfoil population from a lake in western Michigan was
documented as a hybrid between the native northern watermilfoil and the exotic
Eurasian watermilfoil (Myriophyllum sibiricum x M. spicatum). This population survived
normally lethal concentrations of fluridone herbicide; therefore studies were conducted
to elucidate the possibility and level of tolerance. Mesocosm studies showed a
differential response in biomass and fluorescence yield, measure by Pulse Amplitude
Modulated (PAM) fluorometery, to fluridone and this population was tolerant of the
maximum permitted concentration of fluridone in Michigan (6 μg L-1). Further laboratory
studies refined the use of the PAM fluorometer to document tolerance to fluridone while
comparing the tolerant population to 12 invasive watermilfoils from across the United
States. Simultaneous comparative pigment analysis confirmed the accuracy of the PAM
fluorometer in detecting the responses of fluridone to watermilfoil at concentrations up
to 48 μg L-1. The tolerant population was also found to respond similarly to norflurazon
and topramezone herbicides when compared to susceptible populations. This common
response to herbicides with differing mechanisms of action suggests the mechanism of
tolerance is fluridone in watermilfoil is not at the active enzymatic site of fluridone.

11
Collectively these studies confirmed herbicide tolerance and cross-tolerance in this
population of hybrid watermilfoil and also demonstrated the utility of PAM fluorometery
as a quick and reliable method to document fluridone plant responses.
12
CHAPTER 1 INTRODUCTION
Submersed aquatic vascular macrophytes are a unique group of plants that
display a wide range of physiological adaptations to life under water. These plants
comprise less than 1% of angiosperms, and most trace lineage to terrestrial ancestors.
Many have vestigial features such as a thin cuticle, poorly developed stomata and
xylem elements which are essentially functionless (Sculthorpe 1967). Submersed plants
are often desirable and beneficial in waterbodies for a number of reasons. Increased
diversity and abundance of aquatic flora directly correlates to an increase of aquatic
fauna (Rosine 1955) and beds of submersed aquatic plants have been found to provide
a rich foraging habitat for fish and greater protection from predators (Rozas and Odum
1988). In addition to biotic benefits, aquatic vegetation can also benefit abiotic factors
such as stabilization of sediment and improved water clarity (Madsen 2009a).
Although native submersed aquatic plants are desirable in aquatic ecosystems,
invasive submersed species have the potential to overtake native plant communities
and produce detrimental ecological effects. In Lake George, New York, an invasion of
Eurasian watermilfoil (Myriophyllum spicatum L.) caused a rapid decline in the number
of native aquatic plant species over a three year period (Madsen et al. 1988). Schmitz
and Osborne (1984) found that beneficial zooplankton abundance decreased with
increased hydrilla (Hydrilla verticillata [L.f] Royle) growth. Anthropogenic uses of
waterbodies are also impacted by invasive aquatic plants. Dense, often monotypic
infestations with surface canopies can impair commercial and recreational navigation,
disrupt flood control, and provide a habitat for vectors of disease. Rapidly growing

13
invasive aquatic plants are often managed to maintain the ecological balance and
recreational use of infested waters.
Management of aquatic plants differs from traditional weed control. Non-target
organisms such as native plants and wildlife will likely be exposed to submersed
herbicide applications and their response must be taken into consideration when
herbicide applications are made to water bodies. Whereas chemical terrestrial weed
control is focused on defined areas of land, water dynamics such as flow rate and
dilution complicate aquatic plant management efforts. Furthermore, large water bodies
that contain invasive plants requiring management are often public waters. Public
waters have many different stakeholders including resource managers, federal and
state agencies, residents with high value real estate, recreational end users, and other
special interest groups. he vast and varying opinions of these stakeholders must be
considered when formulating treatment plans for aquatic weeds in these types of water
bodies.
Myriophyllum Biology
The watermilfoils, contained in the genus Myriophyllum, are dicotyledonous
aquatic plants and members of the Haloragaceae family. Approximately 68 species
make up this genus, which are present on all continents excluding Antarctica with at
least seven species common between continents (Moody and Les 2010). Fourteen
watermilfoils are present in North America and include both native and invasive species.
Eurasian watermilfoil and parrotfeather (M. aquaticum [Vell.] Verd.) are invasive and
listed as noxious weeds in several states. Variable-leaf watermilfoil (M. heterophyllum
Michx.) is considered invasive outside of its original range of the Southeast and has
also invaded Europe and Asia (Les and Mehrhoff 1999; Yu et al. 2002). Two

14
hybridizations are known between species of this family. M. spicatum x M. sibiricum and
M. heterophyllum x M. laxum(Shuttlw. ex Chapm.) hybridization were first documented
by Moody and Les (2002). Species of interest in this document are Eurasian
watermilfoil, northern watermilfoil (M. sibiricum Kom.), and the hybrid from the genetic
cross of Eurasian and northern watermilfoil.
Northern watermilfoil is a native plant whose range stretches from California north
to the northern Canadian provinces and east to Maine and the eastern seaboard. It is
not found in the southeastern United States (USDA 2011). Eurasian watermilfoil has
been documented in every state in the U.S. and several Canadian provinces (Jacono
and Richerson 2011). This species is the most widely managed aquatic weed in the
country (Smith and Barko 1990). It was first documented in North America in the
Chesapeake river area in 1890 (Reed 1977) and introduction is speculated to be the
result of the aquarium trade or the shipping industry via ship ballasts (Madsen 2009b).
The hybrid of Eurasian x northern watermilfoil (hereafter referred to as „hybrid‟) has
been documented from Michigan to Washington in the northern part of the country
(Moody and Les 2002, 2007).
Northern watermilfoil, along with most Myriophyllum species, is a rooted
submersed aquatic plant that has pectinate leaves in whorls around a white or pink-
colored stem. Leaves consist of 6 to 11 pairs of leaflets (Aiken 1980). This species
reproduces through a variety of ways such as stem fragmentation, runners from root
crowns, seed, and axial turions, or winter buds, provide a dormancy mechanism in the
winter months (Aiken 1980). Northern watermilfoil is not considered to be a nuisance
species as it does not form dense canopies at the water surface (Aiken 1980). This

15
native species is considered excellent habitat for aquatic wildlife, specifically providing
necessary aquatic plant architecture for fisheries success (Valley et al. 2004).
Eurasian watermilfoil is a rooted submersed aquatic plant with pectinate leaves in
whorls of four around a submersed stem. Leaves consist of 14 to 21 pairs of leaflets. It
is closely related to the native northern watermilfoil although the two species rarely
coexist for extended durations due to the rapid growth rate and subsequent
displacement by the Eurasian species (Aiken 1980; Nichols 1992).
The plant also reproduces in a variety of ways including runners from root crowns,
stem fragmentation, and seed (Madsen 2009b). Vegetative means are considered the
major mechanism of wide-spread distribution (Madsen et al. 1988). Eurasian
watermilfoil has been shown to autofragment primarily after flowering and at the end of
the growing season (Madsen et al. 1988). This species, when compared with other
invasive aquatic plants, does not produce high levels of biomass (Grace and Wetzel
1978). While biomass production is not excessive, Eurasian watermilfoil has been
documented to form dense canopies (>80% cover) that shade out native vegetation,
reducing species diversity in as little as 2 years (Madsen et al. 1991).
Eurasian watermilfoil is photosynthetically a C3 plant. Van et al. (1976) found that
the ratio of Rubisco to Phosphophenylpyruvate (PEP) carboxylase was similar to that
found in spinach (Spinacia oleracea L.), a C3 plant. Another determinant of C3-
photosynthesis is the photorespiration pathway, documented by glycolate levels in the
plant. Eurasian watermilfoil was found to have glycolate levels lower than most C3
plants, but higher than observed in C4 plants (Stanley and Naylor 1972). Interestingly,
this plant does exhibit some form of Kranz-anatomy that is usually associated with C4

16
plants (Stanley and Naylor 1972). Several authors detail the preference of free CO2 as a
carbon source, but the plant has the ability to use bicarbonate at high pH levels
(Steeman Nielsen 1947; Stanley 1970; and Van et al. 1976). The ability of some aquatic
plants to use bicarbonate as a carbon source is advantageous in that free carbon
dioxide is usually limited in the freshwater environment. With an alternative carbon
source, such as bicarbonate, this species can continue to photosynthesize under low
carbon dioxide conditions (Prins and Elzenga 1987).
While present in Florida, Eurasian watermilfoil has never grown to problematic
levels of infestation. An article published in 1967- “Eurasian Watermilfoil-Florida‟s New
Underwater Menace” by Blackburn and Weldon (1967) described the potential
invasiveness of watermilfoil as the plant had invaded thousands of acres in the
Chesapeake Bay and Tennessee Valley Authority reservoirs. Although the plant
remains present in Florida, it has never reached nuisance levels requiring management.
Hybrid watermilfoil was first documented in 2002 by Moody and Les. Populations
previously thought to be the invasive Eurasian watermilfoil were found, through nuclear
ribosomal DNA analysis, to be hybrid populations from the parental species Eurasian
watermilfoil and northern watermilfoil (Moody and Les 2002). It is suspected that hybrids
went unnoticed for some time due to the morphological similarities between parental
species and the hybrid. The two parental species are visibly distinguished by number of
leaflet pairs (northern 6 to 11 pairs, Eurasian 14 to 21 pairs), stem diameter, and
presence of axial turions (Coffey and McNabb 1974; Crow and Helquist 2002).
However, the hybrid plant can exhibit a range of leaflet pairs similar to either parent and
have other characteristics similar to each parent. Hybrid watermilfoils present unique

17
challenges for management due to inherited traits such as invasiveness and rapid
growth rate from the Eurasian parent and the potential for turion formation in some
hybrid populations from the northern parent. There are differing reports as to the
dominance of a hybrid population compared to the Eurasian parent. Moody and Les
(2007) found that hybrids tend to overtake lakes so that the parental species are no
longer found. However, a more recent study by Sturtevant et al. (2009) found that
hybrids and Eurasian watermilfoil parents often co-existed in the same bodies of water.
It is important to note that numerous hybrid watermilfoil populations have arisen
independently and therefore traits associated with hybrids from one lake may be quite
different when compared with those from another lake (Sturtevant et al. 2009). These
genotypic and phenotypic differences that exist between populations of the hybrid plants
preclude the use of generalities regarding specific growth or management traits.
Repeated hybridization as well as back-crossing has also been documented in the field
(Moody and Les 2002). Therefore, it is important to refer to each hybrid population
independently.
Impacts and Management of Invasive Watermilfoil Species
Invasive watermilfoils (Eurasian and hybrid) are problematic weeds in many water
bodies. Plants grow to form dense canopies displacing native vegetation, inhibiting flood
control and obstructing recreational uses of waterways. Madsen et al. (1991) found that
Eurasian watermilfoil formed dense canopies on the water surface that shade out
desirable native plants. Dense canopy formation has been shown to negatively impact
water quality by reducing dissolved oxygen in water below the mat and increasing
surface temperatures and pH (Bowes et al. 1979). Submersed aquatic weeds have also
been shown to harbor algal species harmful to both wildlife and human health (Wilde et

18
al. 2005). When watermilfoil densities result in unfavorable conditions for wildlife and
fisheries, displace desirable native vegetation, and impact recreational access or
aesthetics, management of these plants is often required.
Preventative management is necessary to limit spread of invasive plants to
uninfested waterbodies. Practices such as removing fragments from boat trailers are
helpful in reducing human-vectored spread of the plants. Several states have highly
visible public education and outreach programs to educate the public on preventative
methods (UF/CAIP 2011, Cal-IPC 2011, ISDA 2011).
Mechanical control of invasive watermilfoils, like many submersed plants, is not
always an effective choice for management. Mechanical harvesters segment the plants,
increasing fragmentation and possibly assisting in the spread and intensity of the
invasion. This method is also non-selective and has the potential to also damage native
plant communities. Hand harvesting does limit fragmentation but requires a large
financial investment (Kelting and Laxson 2010). Despite the problems associated with
mechanical harvesting, there are numerous operational programs that continue to rely
on mechanical harvesters as a primary means of control.
Several biological controls are available for submersed Eurasian and hybrid
watermilfoils. Triploid grasscarp (Ctenopharyngodon idella Val.) are a common choice
to manage many submersed plant infestations. Although grasscarp are an attractive
choice in some situations, invasive watermilfoil management is not recommended
because the fish prefer native plants over the invasive watermilfoils (Stroganov 1963). A
native weevil, Euhrychiopsis lecontei (Dietz) does prefer the invasive watermilfoils to
native submersed plants and is sold commercially (Alwin et al. 2010). The use of this

19
biocontrol has been associated with seasonal declines but has not been shown to
provide sufficient control to eliminate an invasion (Newman et al. 2001). While there is a
large body of literature on Eurychiopsis and watermilfoil control, predictable and
consistent control remains a problem (Alwin et al. 2010).
Chemical control methods are also available for invasive watermilfoils. Herbicides
effective for control compromise several modes of action including plant growth
regulators such as 2,4-D ([2,4-dichlorophenoxy] acetic acid) and triclopyr ([3,5,6-
trichloro-2-pryidinyl]oxy acetic acid), the carotenoid biosynthesis inhibitor fluridone (1-
methyl-3-phenyl-5-[3-(trifluoromethyl)phenyl]-4(1H)-pyridinone), and cell membrane
disrupters such as diquat (6,7-dihydrodipyrido[1,2-α:2‟,1‟-c] pyrazinediium ion) and
endothall (7-oxabicyclo[2.2.1] heptanes-2,3-dicarboxylic acid). Diquat and endothall are
contact materials that do not translocate within the plant and typically provide short term
control of infestations. The systemic herbicides generally provide long term, season-
long or even multiple season control of invasive watermilfoils. Triclopyr and 2,4-D have
been used and are documented to provide control as long as exposure times are
sufficient (Netherland and Getsinger 1992; Green and Westerdahl 1990). Fluridone is
an attractive choice for water managers due to low use concentrations (<10 μgL-1),
native plant selectivity, ability to target watermilfoil in the entire lake, cost effectiveness,
and potential for multiple years of control from a single treatment. This herbicide is used
frequently by water managers to control Eurasian and hybrid watermilfoils on a whole-
lake or whole-system basis. There have been numerous claims of reduced herbicide
response by hybrid watermilfoils, however there is limited published information on this
topic. Triclopyr and 2,4-D amine were found to inhibit growth of both Eurasian and

20
hybrid watermilfoil accessions in a similar manner following exposure to labeled use
concentrations (Poovey et al. 2007). Recently, differences between Eurasian and hybrid
watermilfoil populations were noted following exposure to low continuous concentrations
of 2,4-D (Glomski and Netherland 2010). This shows the potential for increased
tolerance to fluridone.
Fluridone Herbicide
Fluridone was first described as having herbicidal effects in 1976. The compound
was discovered and evaluated by Eli Lilly & Company during greenhouse screening and
investigated as a selective herbicide for pre-emergence use in cotton (Waldrep and
Taylor 1976). It was found to have activity against both monocotyledonous and
dicotyledonous weeds such as redroot pigweed (Amaranthus retroflexus L.), sickelpod
(Cassia obtusifolia L.), johnsongrass (Sorghum halepense Pers.), and large crabgrass
(Digitaria sanguinalis [L.] Scop.), among others (Waldrep and Taylor 1976). Fluridone
was then evaluated for use on aquatic vascular plants and was found to provide
excellent control at low use concentrations on hydrilla, Eurasian watermilfoil, duckweed
(Lemna spp.), cabomba (Cabomba caroliniana Gray), and several other problematic
aquatic species (McCowen et al. 1979).
Fluridone was registered in the United States in 1986 for use in aquatic
environments by the U.S. Environmental Protection Agency. Several liquid and granular
formulations are available for use in both lotic and lentic waters to control a variety of
submersed and emergent aquatic vegetation.
Fluridone belongs to the substituted-tetrahydropyrimidinone class of herbicides
which are commonly referred to as the bleacher herbicides. Fluridone is an inhibitor of
the carotenoid biosynthesis pathway. Specifically, it is a noncompetitive inhibitor of the

21
phytoene desaturase (PDS) enzyme. The PDS enzyme catalyzes the desaturation of
phytoene in the rate-limiting step of this pathway (Chamovitz et al. 1993). When PDS is
inhibited, phytoene levels increase and carotenoid production in the cell is limited.
Carotenoids function to shield chlorophyll from excess light and help dissipate the
oxidative energy of singlet oxygen. In fluridone treated plants, carotenoids are not
present to quench the energy of oxygen radicals, allowing for the formation of lipid
radicals in chlorophyll molecules (Senseman 2007). This results in degradation of
chlorophyll, bleaching of new tissue and subsequent necrosis and plant death.
Fluridone is an attractive management tool in aquatic ecosystems for several
reasons. Use rates of fluridone in lentic waters are 5-20 μg L-1 and 10-40 μg L-1 in lotic
waters, which is significantly lower than the mg L-1 range typical of several other aquatic
herbicides. Large scale treatments of fluridone have the potential to provide multiple
years of control of submersed plants. Fluridone is also a fairly selective herbicide that
does not adversely impact many desirable native plants. At low use rates of 5 μg L-1,
fluridone was found to reduce the biomass of Eurasian watermilfoil while increasing the
biomass of native species such as vallisneria (Vallisneria Americana Michx.) and two
pondweed species (Potamogeton nodosus Poir. and P. pectinatus L.) over untreated
controls (Netherland et al. 1997). Field studies have shown that low use rates (5-6 μg L-
1) of fluridone applied on a whole-lake scale have controlled invasive watermilfoil
populations while leaving desirable native plant communities intact (Getsinger et al.
2001, Getsinger et al. 2002a, Getsinger et al. 2002b). For these reasons, resource
managers often use this herbicide to control undesirable aquatic vegetation while
preserving native vegetation in a wide range of aquatic ecosystems.

22
In addition to control of Eurasian watermilfoil, fluridone has been used to control
hydrilla since the late 1980s. Schmitz et al. (1987) describe using fluridone to control
hydrilla in a central Florida lake such that the plant could no longer be found in the water
body. Haller et al. (1990) successfully used fluridone to control hydrilla for one year in
the St. Johns River. As such, fluridone was heavily used for hydrilla control in public
waters of Florida from the late 1980‟s until the early 2000s. Between 1999 and 2001,
formerly susceptible hydrilla populations in several major lakes were not exhibiting the
level of control previously associated with fluridone use. Subsequent laboratory testing
documented that several populations of hydrilla had developed resistance to fluridone
(Michel et al. 2004, Arias et al. 2005, Puri et al. 2006). Specifically, an amino acid
substitution in the phytoene desaturase enzyme conferred 2 to 5 fold resistance to
fluridone in hydrilla (Michel et al. 2004).
Previous to this discovery, herbicide resistance in hydrilla was thought to be
unlikely due to the strictly vegetative reproduction exhibited by dioecious female hydrilla
in Florida. However, low use rates, extended exposure times, and repeated use of
fluridone led to tremendous selection pressure in these water bodies. Repeated
fluridone applications selected for plants that were resistant to typical use rates of the
herbicide. Since this time, resistance has developed in many water bodies throughout
the state and fluridone is no longer a widespread tool for hydrilla management in
Florida‟s public waters. To date, hydrilla is the only plant that has been confirmed to
have developed resistance to fluridone.
Herbicide resistance is defined as “the inherited ability of a plant to survive and
reproduce following exposure to a dose of herbicide normally lethal to the wild type”

23
(WSSA 1998). Herbicide tolerance “implies that there was no selection or genetic
manipulation to make the plant tolerant; it is naturally tolerant” (WSSA 1998). Some
discussion has occurred debating whether the fluridone resistance in hydrilla is actually
resistance or tolerance. Since resistant plants were selected following low use rates of
the herbicide, fluridone resistance is the proper term.
Fluridone has been used for the past 20 years for invasive watermilfoil
management. Watermilfoil control requires similar use patterns to that of hydrilla control.
Use rates ranging from 4 to 25 μg L-1 have been shown to provide watermilfoil control
given that sufficient exposure time is also met (Netherland and Getsinger 1995). Using
fluridone as a chemical tool to control Eurasian watermilfoil did meet some opposition
as concerns arose as to the effect of the herbicide on native plants and wildlife habitat
at a whole lake level. Getsinger et al. (2001) documented that after whole lake fluridone
treatments in Michigan, species diversity increased 1.5 to 2.3 fold from pre-treatment
measurements. Native plant cover was also not negatively impacted. Concerns over
native plant selectivity and economic factors continued to drive the use of lower rates.
Currently, use patterns in several states consist of an initial fluridone treatment between
5 to 10 μg L-1 followed by a subsequent application to return the fluridone concentration
to these levels. Although low use rates may be cost-effective and increase native plant
selectivity, these practices could have implications for resistance as well. In terrestrial
systems, low use rates of selective herbicides have been shown to cause rapid
development of resistance to those herbicides, as well as cross resistance, in annual
ryegrass (Lolium rigidum L.) (Neve and Powles 2005).

24
In May 2010, a 220 acre lake in western Michigan (Townline Lake) was treated
with 6 μg L-1 of fluridone, followed by a subsequent treatment to return the concentration
to the original level, which was permitted by the Michigan Department of Natural
Resources. The population of documented hybrid watermilfoil in the water body was not
controlled with this rate of the herbicide. Initial mesocosm studies found that the
Townline population of watermilfoil did not experience declines in biomass like that of
susceptible watermilfoil populations when exposed to several rates of fluridone (Thum
et al. submitted). The observation that a hybrid watermilfoil may show increased
tolerance to fluridone has fueled more speculation on the nature of watermilfoil hybrids
and their response to herbicides.
Pigment analysis has been used traditionally to document the biochemical
response of a plant to fluridone. Fluridone inhibits the phytoene desaturase enzyme of
the carotenoid biosynthesis pathway and by analyzing pigment levels in this pathway
the plant‟s response to fluridone can be studied. Sprecher et al. (1998) developed an
extraction method that measures absorbance spectrophotometrically to quantify
phytoene and β-carotene levels. In fluridone susceptible plants, phytoene levels
increase after fluridone treatments and β-carotene levels would be lower than control
plants. In fluridone resistant plants, phytoene and β-carotene levels are similar to those
of untreated control plants. Puri et al. (2006) used this technique to demonstrate
fluridone resistance in several hydrilla populations collected throughout Florida.
Chlorophyll analysis is an indirect method of determining fluridone resistance.
Although fluridone does not directly affect chlorophyll biosynthesis, the absence or
reduction of β-carotene leads to the destruction of chlorophyll molecules. Therefore, in a

25
susceptible plant exposed to fluridone, chlorophyll levels in new tissue will be lower than
those in control plants. Several extraction methods have been evaluated and utilized for
pigment analysis using various solvents (Iriyama et al. 1974, Hiscox and Isrealstam
1979, Moran and Porath 1979) but the non-macerated method of Wellborn (1994) using
dimethyl sulfoxide (DMSO) proved to be the most useful in these studies. This method
provides pigment analysis that is comprehensive in the study of fluridone response in
plants in that two pigments affected by fluridone can be quantified. Although pigment
analysis provides a method for determining herbicide activity in the plant, the methods
employ a destructive harvest of plant tissue. There is a need for non-destructive and
repeatable methods of analysis.
PAM Fluorometery
In functioning plants, energy from light, in the form of photons, comes into contact
with the various pigments of the plants in the light harvesting complexes. These
pigments, such as chlorophyll a, chlorophyll b, and the carotenoids, have many double
bonds which are capable of absorbing this energy and performing photochemistry to
pass an excited electron to the electron transport chain of photosynthesis. The
carotenoids function to absorb excess light energy in the light harvesting complexes
thereby protecting chlorophyll against this energy and conversion to radical oxygen.
When excess light is absorbed by chlorophyll in the light harvesting complex,
several events can occur. Energy can be reradiated as heat, energy can be transferred
to adjacent molecules via inductive resonance, photochemistry or charge separation
can pass an excited electron to the electron transport chain, or lastly energy can be
reradiated as fluorescence. Chlorophyll a and b molecules drive photosynthesis by
absorbing light energy, which causes excitation of electrons in those molecules, and

26
transfer this energy to adjacent molecules via inductive resonance. When chlorophyll is
damaged or not functioning properly due to a variety of reasons such as stress or
herbicidal effects, the chlorophyll will often emit the excess energy as reradiated light.
Measuring this reradiated light can give insight as to the efficiency and functionality of
chlorophyll and photosynthesis in the plant (Papageorgiou 1975).
Pulse-amplitude modulated (PAM) fluorometery is used to measure chlorophyll
fluorescence and works by focusing a saturating beam of light on the desired region of
the plant. Yield ratio is calculated by the instrument. Higher fluorescence yield ratio
indicates highly functioning chlorophyll whereas lower yield ratios indicate damaged or
non-functioning chlorophyll. Yield is a ratio of Fv/Fmax. Fmax is equal to the fluorescence
when the saturating pulse is applied to the tissue. Fv is equal to Fmax-F where F is the
fluorescence of the tissue with no light pulse applied. The plant fluoresces more when
chlorophyll is damaged, which indicates a higher Fmax value. However, the yield output
ratio is lower because damaged chlorophyll fluoresces more under ambient light
conditions (Figure 1-1). Therefore, a higher Y ratio value indicates chlorophyll that is
functioning normally where a lower Y value indicates damaged chlorophyll (Bolhar-
Nordenkampf et al. 1989).
PAM fluorometery has been used to study irradiance stress (Ralph et al. 1998),
salinity stress (Kamermans et al. 1999), and shoot-to-landscape differences in
photosynthesis in sea grasses (Durako and Kunzelman 2002). In situ measurement of
photosynthetic activity of Red Sea faviid corals has also been measured (Beer et al.
1998). This technique is useful because it is a non-destructive method of evaluating the
activity of chlorophyll and has also been used to evaluate herbicidal effects on plants.

27
Ireland et al. (1986) used fluorometery to document decreased fluorescence in wheat
(Triticum spp.) 30 minutes after exposure to glyphosate (N-[phosphonomethyl] glycine)
herbicide. The herbicide diuron (N‟-[3,4-dichlorophenyl]-N,N-dimethylurea), a
photosystem II inhibitor, was shown to reduce fluorescence yield ratio in sea grasses
two hours after exposure as measured with a diving-PAM (Haynes et al. 2000). Junea
et al. (2001) evaluated the effects of mercury and metolachlor (2-chloro-N-[2-ethyl-6-
methylphenyl]-N-[2-methoxy-1-methylethyl] acetamide), a mitosis inhibiting herbicide,
on six algal species.
This research investigates the suspected fluridone tolerance in a hybrid
watermilfoil population in Michigan and methods used to document response to
fluridone. Chapter 2 focuses on mesocosm-scale studies used to evaluate the response
several populations of invasive watermilfoil through PAM fluorometery and biomass
evaluations. While these studies are informative, they are limited by the significant
inputs of time and space required. Laboratory methods are needed to circumvent these
limitations, but specific methods to evaluate submersed plants‟ response to fluridone
have not been documented. Refinement of methods including pigment extraction
incubation time, using PAM fluorometery to evaluate fluridone response, and
determining optimal shoot length for these studies are discussed in Chapter 3. Chapter
4 employs these methods in small-scale laboratory evaluations of a number of invasive
watermilfoil populations from several states. Chapter 5 evaluates the potential cross-
tolerance of the fluridone tolerant Townline population to pigment synthesis inhibiting
herbicides with differing modes of action.

28
Figure 1-1. An example of two fluorescence induction curves measured by PAM fluorometer. The upper curve indicates damaged chlorophyll and the lower curve indicates functioning chlorophyll. Equations for Y ratio depicted in figure.

29
CHAPTER 2 EVALUATION OF SUSPECTED FLURIDONE TOLERANT HYBRID WATERMILFOIL
UNDER STATIC MESOCOSM CONDITIONS
Eurasian watermilfoil (Myriophyllum spicatum L.) and hybrid watermilfoil (M.
spicatum x M. sibiricum), are problematic invasive weeds in many water bodies
throughout the northern tier of the United States. Plants grow to form dense surface
canopies displacing native vegetation, altering water quality, and obstructing
recreational uses of waterways. Madsen et al. (1991) found that Eurasian watermilfoil
formed dense which can shade out desirable native plants in the ecosystem. Dense
canopy formation has been shown to negatively impact water quality by reducing
dissolved oxygen in water below the mat and increasing surface temperatures and pH
(Bowes et al. 1979). Submersed aquatic weeds have also been shown to harbor algae
species harmful to both wildlife and human health (Wilde et al. 2005). When
watermilfoils spread within waterbodies and result in unfavorable conditions for wildlife
and fisheries, displacement of desirable native vegetation, and impacts on recreational
access or aesthetics, management of these plants is often required.
Hybrid populations of watermilfoil were first documented in 2002 by Moody and
Les. Populations previously thought to be the invasive Eurasian watermilfoil were found,
through nuclear ribosomal DNA analysis, to be hybrids from the parental species
Eurasian watermilfoil and northern watermilfoil (Moody and Les 2002). Hybrid
watermilfoils may present unique challenges for management due to inherited traits
such as increased invasiveness, or hybrid vigor, and the potential to acquire a trait such
as turion formation from the northern parent that could confound management efforts. It
is important to note that numerous hybrid watermilfoil populations have arisen
independently and therefore traits associated with hybrids from one lake may be quite

30
different when compared with those from another lake (Sturtevant et al. 2009). The
extent of hybridization in natural lakes is unclear and currently being investigated.
Genotypic and phenotypic differences exist between populations of the hybrid plants
and generalities cannot be made regarding specific growth or management traits.
Repeated hybridization as well as back-crossing has been documented in the field
(Moody and Les 2002). Therefore, it is important to refer to each hybrid population
independently.
Chemical control methods are commonly used to manage invasive watermilfoils.
Fluridone (1-methyl-3-phenyl-5-[3-(trifluoromethyl)phenyl]-4(1H)-pyridinone) is an
attractive choice for water managers due to its low use rates, native plant selectivity,
ability to target watermilfoil in the entire lake, and potential for multiple years of control
from a single treatment. This herbicide is used frequently by water managers to control
Eurasian and hybrid watermilfoils. There have been numerous claims of reduced
herbicide response by hybrid watermilfoils, however there is limited published
information on this topic. Eurasian and northern parents are both highly susceptible to
low use rates typical of fluridone treatments (Crowell et al. 2006). Triclopyr ([3,5,6-
trichloro-2-pryidinyl]oxy acetic acid) and 2,4-D amine ([2,4-dichlorophenoxy] acetic acid)
were found to inhibit growth of both Eurasian and hybrid watermilfoil accessions in a
similar manner following exposure to labeled use rates (Poovey et al. 2007). Recently,
differences between Eurasian and hybrid watermilfoil biotypes were noted following
exposure to low continuous concentrations of 2,4-D (Glomski and Netherland 2010).
In May 2010, a 220 acre lake in western Michigan (Townline Lake) was treated
with a concentration of fluridone permitted by the Michigan Department of Natural

31
Resources. The population of documented hybrid watermilfoil in the water body was not
controlled with the legal rate of the herbicide. The observation that a hybrid watermilfoil
may show increased tolerance to fluridone has fueled more speculation on the nature of
hybrids and their response to herbicides. Mesocosm studies are needed to compare the
Townline population of watermilfoil to other watermilfoil populations when exposed to
fluridone. As fluridone is typically used to treat an entire lake, a failure to perform is
particularly notable due to costs, exposure of native plants (some quite sensitive to
fluridone) through the entire system, and subsequent requests to provide additional
herbicide treatments for summer relief from the watermilfoil infestation.
In order to determine if the hybrid watermilfoil population from Townline Lake
shows a unique response to fluridone compared to other watermilfoil accessions, a
series of mesocosm studies was conducted. The objective of these studies was to
evaluate the response of several different watermilfoil populations to a range of
fluridone concentrations to determine variation across a spectrum of watermilfoils (both
Eurasian and hybrid) against Townline, which is suspected to have increased tolerance
to fluridone.
Materials and Methods
Experiment 1
An initial screening study was conducted in a greenhouse at the Center for Aquatic
and Invasive Plants in Gainesville, Florida during the summer of 2010. The suspected
susceptible hybrid watermilfoil originating from Otter Lake, MN (hereafter referred to as
„Susceptible‟) was kept in outdoor culture and exposed to ambient light and
temperature. This population was confirmed as a hybrid watermilfoil through ITS
analysis (Thum et al. submitted). Shoot tips were harvested from this stock culture for

32
the study. Apical shoot tips of the suspected tolerant hybrid watermilfoil, a population
from Townline Lake, were obtained from Michigan for the study. Apical shoot tips 10-15
cm in length of Townline hybrid watermilfoil or Susceptible hybrid watermilfoil were
planted in 4.25 inch square pots containing top soil amended with osmocote (15-9-12)
fertilizer at a rate of 1g kg-1 (soil). Pots were capped with approximately 1 cm of sand
prior to planting. Each 95-L container contained one pot of Townline watermilfoil and
one pot of susceptible watermilfoil. Artificial light in the greenhouse provided a
photoperiod of 14 hour light: 10 hour dark. Plants were allowed to establish and grow for
2 weeks prior to treatment. After this initial time, each 95-L tank was treated with 0, 2, 4,
6, 8, 12, or 24 μg L-1 of fluridone (Sonar AS®, SePro Corporation, Carmel, IN). Each
treatment was replicated 5 times (5 95-L tanks per fluridone concentration) using a
completely randomized design. Plants were allowed to grow and respond to treatment
for 7 weeks until a destructive harvest of all shoot biomass was conducted. Harvested
biomass was dried for 3 days in a 70°C drying oven. Samples were weighed and results
analyzed using analysis of variance (ANOVA) and Fisher‟s Protected LSD (α=0.05) to
determine differences between populations at each concentration.
Experiment 2
Experiment 2 was conducted to compare the tolerant Townline population to a
greater geographical range of invasive watermilfoils that were collected from several
states. This study was conducted in an enclosed greenhouse at the Center for Aquatic
and Invasive Plants in Gainesville, Florida during the winter of 2010 and 2011. Townline
plants were harvested from outdoor stock cultures for the study. Plant material collected
from 3 populations of suspected fluridone susceptible watermilfoils was obtained for the
study (Table 2-1). One susceptible population was collected at Frog Lake in Wisconsin

33
and is a hybrid watermilfoil. The second population was obtained from Auburn Lake,
Minnesota and is Eurasian watermilfoil (EWM). The final population is an EWM
population from Texas. All populations‟ genotypes were confirmed as hybrid or EWM
through ITS analysis (Thum et al. submitted). As in the previous study, 10-15 cm apical
shoot tips were used for planting. A single apical shoot tip was planted in a 164 mL
cone-tainer containing topsoil amended with Osmocote and capped with sand. One
cone-tainer of each population was placed in a 4.5 inch square pot containing topsoil
amended with slow release fertilizer and again capped with sand prior to planting. Each
pot contained one container from each population. Two square pots were placed in
each 95-L tank so that biomass could be sampled at each of two harvest intervals by
removing a single pot. Plants were allowed to establish and grow for 2 weeks prior to
treatment. At this time, 6 replications of each treatment of 0, 5, 10, and 20 μg L-1 of
fluridone were added to the appropriate tanks. This study was conducted using a
completely randomized design. The first set of plants was harvested at 7 weeks after
treatment (WAT). The fluorescence of shoot tips were measured with a PAM
fluorometer and above ground biomass of each population was destructively harvested.
Biomass samples were dried for 3 days at 70°C. The second harvest occurred 11 WAT
and the same parameters were measured. Both fluorescence yield data and biomass
data were combined across all susceptible populations at each harvest since no
significant differences were found between these populations when data were subjected
to ANOVA (α=0.05). Non-linear regression was fitted to the data. Data from each
harvest were analyzed with ANOVA and Fisher‟s Protected LSD (α=0.05) to determine

34
significant differences between the combined susceptible populations and the Townline
population.
Experiment 3
Experiment 3 was designed to examine the response over time to fluridone by
several invasive watermilfoils as compared to Townline. This study was conducted in
outdoor mesocosms at the Center for Aquatic and Invasive Plants in Gainesville, Florida
during the spring and summer of 2011. Four populations of watermilfoils were harvested
from outdoor stock cultures of plants on site (Table 2-2). These populations were
Townline, Indian, Auburn and Texas. Townline, Auburn, and Texas populations are
identical to those in Experiment 2. The Indian population is from Indian Lake in
Michigan and has geographical and genetic similarities to Townline Lake. It is also a
hybrid and suspected to be tolerant to fluridone. One additional population of known
susceptible EWM was obtained from North Carolina. Populations were again confirmed
genetically as hybrid or EWM through ITS analysis (Thum, pers. comm.1). Apical shoots
were planted in an identical manner to that of Experiment 2. The study was designed to
allow for 3 harvesting dates, so 3 pots, each containing all populations, were added to
each mesocosm. Plants were allowed to grow for 2 weeks prior to treatment.
Treatments for this study included an untreated control, 3, 6, 9, 12, 18, and 36 μg L-1
with 4 replications each in a completely randomized design. Due to the potential
photodegradation of fluridone herbicide in outdoor mesocosms, water samples were
collected every 2 days to determine the half life of the herbicide in the mesocosms.
Samples were analyzed using ELISA Quanti-Plate kits (QuantiPlate Kit for Fluridone,
1 R. Thum, Grand Valley State University, Annis Water Resources Institute Muskegon, MI 49441.

35
Envirologix, Portland, ME) and half-life was determined to be 10 days. Therefore, every
ten days for the duration of the study, each mesocosm was treated with a half
concentration of the appropriate initial treatment. The first and second harvests
occurred at 3 and 6 weeks after treatment, respectively. PAM yield and above ground
biomass data were collected at each harvest. The final harvest occurred 8 weeks after
treatment with only above ground biomass data being collected. All biomass data from
this experiment was dried and weighed in the same manner as previous experiments.
All susceptible populations were again combined due to no treatment by experiment
significance as found with ANOVA. Non-linear regression was fitted to the data.
Fluorescence yield data and biomass data from each harvest were analyzed using
ANOVA and Fisher‟s Protected LSD (α=0.05) to detect differences between Townline
and the combined susceptible populations within each concentration.
Results and Discussion
Experiment 1
The initial study determined that the Townline hybrid watermilfoil had a different
response to fluridone herbicide at all concentrations used in the experiment (Figure 2-
1). The susceptible population had biomass reduced to less than 40% of untreated
control at 2 μg L-1 fluridone while Townline did not exhibit that level of reduction at even
the highest concentration. For reference, the maximum permitted concentration to treat
using fluridone for control of invasive watermilfoils in the state of Michigan is 6 μg L-1.
There was very limited reduction in biomass of Townline plants at the essentially
highest treatment it could be exposed to in the field. This initial screening study
indicated that Townline exhibits an increased tolerance or possibly resistance to the
herbicide fluridone and warrants further investigation.

36
Experiment 2
The second experiment resulted in differences in biomass and fluorescence yield
at 5 and 10 μg L-1 between Townline and the combined susceptible populations (Tables
2-3 and 2-4). At the first harvest fluorescence yield decreased by more than half in the
susceptible populations at 5 μg L-1 while Townline showed essentially no decrease in
fluorescence (Table 2-3). At 11 WAT, fluorescence yield was decreased to less than
20% of untreated plants at 5 μg L-1 in susceptible populations while Townline actually
showed increased fluorescence from untreated controls (Table 2-3). Dry biomass of
susceptible populations had decreased to less than 10% by 7 WAT at the lowest
concentration and decreased further to less than 5% at 11 WAT (Table 2-4). Townline
did not exhibit a decline lower than 80% of untreated control at either 5 or 10 μg L-1 at
either harvest. This experiment confirmed that the Townline population does not
respond to fluridone herbicide at the concentrations that would be legally permitted for
control in Michigan. Plants originating from locations throughout the country showed
little variation and results were combined. This speaks to the success and applicability
of fluridone as a tool to treat invasive watermilfoils at low use rates.
Experiment 3
The outdoor mesocosm experiment again demonstrated the response to fluridone
by the different populations of watermilfoils. Due to the slow acting nature of fluridone,
significant differences in fluorescence yield and biomass between susceptible and
Townline populations were limited at 3 WAT (data not shown).
The second harvest was conducted at 6 WAT and data from susceptible
populations was combined since no significant differences in response to fluridone were
found between populations. By this time, fluorescence yield differences were found at

37
all concentrations 6 μg L-1 and above (Figure 2-2a). Biomass differences existed at 3, 6,
9, and 12 μg L-1 for the susceptible populations when compared to Townline (Figure 2-
2b). Of note is the 200% increase in biomass of Townline plants from control to even
the lowest concentration of fluridone herbicide. It appears from this data that Townline
did not successfully compete with the other populations when no herbicide was present,
however when fluridone decreased biomass of other populations the Townline
population biomass increased dramatically.
By 8 WAT apical shoot tips were not present in many of the mesocosms so PAM
yield data was not collected. Biomass data from susceptible populations was combined
since no significant differences were found between populations. Townline plant
biomass again continued to increase to 400% of untreated mesocosms at the lowest
concentrations of fluridone (Figure 2-3). The combined susceptible populations showed
significant differences from Townline at all concentrations (Figure 2-3).
This study verified that Townline does not respond to fluridone herbicide in a
similar manner to any of the other analyzed populations. While the hybrid Indian Lake
plants are genetically similar to Townline, their response was significantly different by 8
WAT. Even though hybrid watermilfoils were geographically and genetically similar, as
with Townline and Indian Lake populations, herbicide response was distinct. Little
variation was found between all susceptible populations used in this study, which
allowed results to be combined. This limited variation in response and sensitivity to
fluridone is important to the success of fluridone as a tool to treat invasive watermilfoils
across the country.

38
Herbicide resistance is defined as “the inherited ability of a plant to survive and
reproduce following exposure to a dose of herbicide normally lethal to the wild type”
(WSSA 1998). Herbicide tolerance “implies that there was no selection or genetic
manipulation to make the plant tolerant; it is naturally tolerant” (WSSA 1998). Since
there is no „wild type‟ hybrid watermilfoil, the differing response to fluridone of hybrid
populations, specifically Townline population, cannot be referred to as herbicide
resistance. These populations of plants do, however, exhibit an increased tolerance to
fluridone. It is unknown if the Townline population was selected for by previous use of
fluridone herbicide or if this population developed tolerance for the herbicide during
hybridization.
Now that a fluridone tolerant population of hybrid watermilfoil has been confirmed,
it is important that resource managers take steps to prevent the spread of this unique
population to neighboring lakes. Townline Lake is located in central Michigan in the near
vicinity of numerous other bodies of water. The potential for spread to other water
bodies is highest in close proximity to the originally infested lake (Roley and Newman
2008). Resource managers should consider limiting public access to Townline Lake
until the population of plants is controlled and also monitor neighboring lakes to detect
any possible invasions of this unique hybrid watermilfoil.

39
Table 2-1. Invasive watermilfoil (Myriophyllum spp.) populations used in Experiment 2.
Population Species Location Tolerance
Townline Hybrid Michigan probable
Frog hybrid Wisconsin susceptible
Auburn EWM Minnesota susceptible
Texas EWM Texas susceptible
Note: Hybrid watermilfoil is a cross between northern watermilfoil (M. sibiricum) and Eurasian watermilfoil (EWM) (M. spicatum
Table 2-2. Invasive watermilfoil (Myriophyllum spp.) populations used in Experiment 3.
Population Species Location Tolerance
Townline hybrid Michigan probable Indian hybrid Michigan unknown Auburn EWM Minnesota susceptible Texas EWM Texas susceptible North Carolina EWM North Carolina susceptible
Note: Hybrid watermilfoil is a cross between northern watermilfoil (M. sibiricum) and Eurasian watermilfoil (EWM) (M. spicatum).
Table 2-3. Fluorescence yield (Fv/Fm), represented as percent of the untreated control, in susceptible and Townline populations of invasive watermilfoils as a function of fluridone concentration 7 and 11 weeks after treatment (WAT).
7 WAT 11 WAT
fluridone concentration
(μg L-1
) Susceptible Townline Susceptible Townline
5 44.9±10.0 * 98.1±2.2 15.4±5.8 *
124.6±9.1
10 13.9 ± 6.9 * 98.4±4.0 2.7 ± 2.7 * 119.2±13.7
20 5.3 ±3.9 23.5±14.9 0 0
Note: Values indicate means with standard error (n=6). Concentrations with significant differences between populations found using Fisher‟s Protected LSD (α=0.05) are marked with an asterisk.
Table 2-4. Biomass, represented as percent of the untreated control, in susceptible and
Townline populations of invasive watermilfoils as a function of fluridone concentration 7 and 11 weeks after treatment (WAT).
7 WAT 11 WAT
fluridone concentration
(μg L-1
) Susceptible Townline Susceptible Townline
5 9.3 ± 3.3 * 111.2±11.3 2.3 ± 0.9 * 91.1±4.4
10 2.0 ± 1.6 * 92.3±16.1 0.08±0.07 * 81.4±5.9
20 2.7 ±2.6 10.3±7.3 0 0
Note: Values indicate means with standard error (n=6). Concentrations with significant differences between populations found using Fisher‟s Protected LSD (α=0.05) are marked with an asterisk.

40
Figure 2-1. Above ground biomass, represented as percent of the untreated control, in susceptible and Townline invasive watermilfoil plants as a function of fluridone concentration 7 weeks after treatment. Symbols represent means and error bars indicate standard error (n=5). Curves represent nonlinear regression. Concentrations with significant differences as found using Fisher‟s Protected LSD (α=0.05) are denoted with an asterisk.
Fluridone Concentration (g L-1
)
0 10 20 30
Pe
rce
nt U
ntr
ea
ted
0
20
40
60
80
100
120
Townline f=101.8(-0.03*x)
R2
=0.9840
Susceptible f=100.8(-0.57*x)
R2
=0.9801
**
**
*
*

41
Figure 2-2. Fluorescence yield (Fv/Fm) (a) and dry biomass (b) of suspected fluridone tolerant Towline hybrid watermilfoil and 4 combined susceptible populations of invasive watermilfoils 6 weeks after treatment with fluridone, represented as percent of the untreated control. Symbols represent means and error bars indicate standard error (n=4). Curves indicate nonlinear regression. Significant differences within each concentration between Townline and susceptible populations, as found using Fisher‟s Protected LSD (α=0.05), are marked with an asterisk.
0 10 20 30 40
Pe
rce
nt U
ntr
ea
ted
0
100
200
300
Townline f=116.9(-0.007*x)
R2
=0.5591
Susceptible f=100.4(-0.15*x)
R2
=0.9704
* **
*
Fluridone Concentration (g L-1
)
0 10 20 30 40
Pe
rce
nt U
ntr
ea
ted
0
50
100
150
200
250
300
Townline
f=209.4(-0.5*((x-7.8)/6.8)2
R2
=0.7649
Susceptible
f=90.9(-0.14*x)
R2=0.8329
*
***
a
b

42
Figure 2-3. Dry biomass of suspected fluridone tolerant Townline hybrid watermilfoil and 4 combined populations of susceptible invasive watermilfoils 8 weeks after treatment with fluridone, represented as percent of the untreated control. Symbols represent means and error bars indicate standard error (n=6). Curves represent nonlinear regression. Significant differences within each concentration between Townline and the combined susceptible populations, as found using Fisher‟s Protected LSD (α=0.05), are marked with an asterisk.
Fluridone Concentration (g L-1
0 10 20 30 40
Pe
rce
nt U
ntr
ea
ted
0
100
200
300
400
500
600
Townline R2
=0.8744
f=48.3+431.7(-0.5((x-7.9)/4.9)2
Susceptible
f=96.3(-0.3*x)
R2
=0.9109
* * **
**

43
CHAPTER 3 A COMPARISON OF METHODS FOR CHARACTERIZING HERBICIDAL EFFECTS
ON SUBMERSED AQUATIC VASCULAR PLANTS
Although native submersed aquatic plants are often desirable in certain
ecosystems, invasive plants have the potential to overtake desirable plant communities
and have many other detrimental effects. In Lake George, New York, an invasion of
Eurasian watermilfoil (Myriophyllum spicatum L.) caused a rapid decline in the number
of aquatic plant species over a three year period (Madsen et al. 1988). Anthropogenic
uses of waterbodies are also negatively impacted by invasive aquatic plants. Heavy
infestations and dense surface canopies can impair commercial and recreational
navigation, disrupt flood control, and become a habitat for disease vectors. For this
reason, invasive aquatic plants are often managed to maintain a non-harmful level or
eradicated from a water body.
Many submersed aquatic plants have vestigial features from their terrestrial
heritage such as a thin cuticle, poorly developed stomata and xylem elements which are
essentially functionless (Sculthorpe 1967). Since submersed plants greatly differ from
their terrestrial counterparts, research methods to characterize these plants are often
vastly different than those developed for terrestrial plants. Research concerning
invasive submersed aquatic macrophytes has been ongoing for several decades both in
the field and in the lab (Haller and Sutton, 1973, Van et al. 1976, Bowes et al. 1977).
Laboratory techniques have been used to evaluate many aspects of these plants
including physiological characteristics, herbicide response, and metabolic activity
(Holladay and Bowes 1980, Kane and Gilman 1991, MacDonald et al. 1993). These
evaluations are advantageous due to the controlled nature of the laboratory

44
environment, smaller area needs compared to field or mesocosm studies, and speed of
determining outcomes.
Pigment analysis has been used traditionally to characterize the biochemical
response of a plant to fluridone (1-methyl-3-phenyl-5-[3-(trifluoromethyl)phenyl]-4(1H)-
pyridinone). Fluridone inhibits the phytoene desaturase enzyme of the carotenoid
biosynthesis pathway and by analyzing these pigment levels the plant‟s response to
fluridone can be elucidated. Sprecher et al. (1998) developed an extraction method that
measures absorbance spectrophotometrically to quantify phytoene and β-carotene
levels. In fluridone susceptible plants, phytoene levels increase after fluridone
treatments and β-carotene levels would be lower than control plants. In fluridone
resistant plants, phytoene and β-carotene levels are similar to those of untreated control
plants. Puri et al. (2006) used this technique to determine and document fluridone
resistance in several hydrilla (Hydrilla verticillata [L.f.] Royle) populations in Florida.
Chlorophyll analysis is an indirect method of determining fluridone resistance.
Although fluridone does not directly affect chlorophyll biosynthesis, the absence or
reduction of β-carotene leads to the destruction of chlorophyll. Therefore, in a
susceptible plant exposed to fluridone, chlorophyll levels in new tissue will be lower than
those in control plants. Hiscox and Israelstam (1979) developed a method of chlorophyll
extraction without maceration using dimethyl sulfoxide (DMSO). This study documented
that chlorophyll extracted in DMSO is a simple process that produces stable chlorophyll
extracts. A more recent study determined that chlorophyll a, chlorophyll b, and total
carotenoids could all be quantified by the same extract in DMSO and analyzed with a
spectrophotometer at different absorbances (Wellburn 1994). This method provides

45
pigment analysis that is comprehensive in the study of fluridone resistance or tolerance
and less complex than the previously described Sprecher method.
Hiscox and Israelstam (1979) used an incubation period of 6 hours in DMSO and a
65°C water bath for chlorophyll extraction in terrestrial plants with a developed cuticle.
This method has also been applied to submersed aquatic plants by several authors
(Netherland et al 1993, Netherland and Getsinger 1995, Bultemeier 2008). However,
since the thickness of the cuticle in the plant sample is determinant of the incubation
time, it is thought that incubation time for submersed plants could be significantly less
than 6 hours due to the poorly developed cuticle.
Although pigment analysis provides a method for determining herbicide activity in
the plant, the methods require a destructive harvest of plant tissue. There is a need for
non-destructive and repeatable methods of analysis on the same tissue source. Pulse-
amplitude modulated (PAM) fluorometery can give information as to chlorophyll
functionality by measuring chlorophyll fluorescence. A PAM fluorometer works by
focusing a saturating beam of light on the desired region of the plant. By measuring the
re-radiation, or fluorescence, a yield ratio is calculated by the instrument. Higher
fluorescence yield ratio indicates highly functioning chlorophyll whereas lower yield
ratios indicate damaged or non-functioning chlorophyll. Yield is a ratio of Fv/Fmax , where
Fmax is equal to the fluorescence when the saturating pulse is applied to the tissue. Fv is
equal to Fmax-F where F is the fluorescence of the tissue with no light pulse applied. The
plant fluoresces more when chlorophyll is damaged, which indicates a higher Fmax
value. However, the yield output ratio is lower because damaged chlorophyll also
fluoresces more under ambient light conditions. Therefore, a higher Y ratio value

46
indicates chlorophyll that is functioning normally where a lower Y value indicates
damaged chlorophyll (Bolhar-Nordenkampf et al. 1989).
PAM fluorometery has been used to study irradiance stress (Ralph et al. 1998),
salinity stress (Kamermans et al. 1999), and shoot-to-landscape differences in
photosynthesis in sea grasses (Durako and Kunzelman 2002). In situ measurement of
photosynthetic activity of Red Sea faviid corals has also been measured (Beer et al.
1998). This technique is useful because it is a non-destructive method of evaluating the
activity of chlorophyll and has also been used to evaluate herbicidal effects on plants.
Ireland et al. (1986) used fluorometery to document decreased fluorescence in wheat
(Triticum spp.) 30 minutes after exposure to glyphosate (N-[phosphonomethyl] glycine)
herbicide. The herbicide diuron (N‟-[3,4-dichlorophenyl]-N,N-dimethylurea), a
photosystem II inhibitor, was shown to reduce fluorescence yield ratio in sea grasses
two hours after exposure as measured with a diving-PAM (Haynes et al. 2000). Junea
et al. (2001) evaluated the effects of mercury and metolachlor (2-chloro-N-[2-ethyl-6-
methylphenyl]-N-[2-methoxy-1-methylethyl] acetamide), a mitosis inhibiting herbicide,
on six algal species. Using a PAM fluorometer to detect the effects of pigment synthesis
inhibiting herbicides such as fluridone has not been documented in aquatic plants, but
would potentially be a non-destructive method for evaluating fluridone activity in the
plant.
Several authors have studied invasive watermilfoils in the laboratory, but different
methods were used to evaluate herbicide response. Netherland (1995) used apical
shoot tips 10-15cm in length, while Forney and Davis (1981) documented using apical
shoot tips 7 cm in length. Shorter shoot segments are not expected to have the

47
carbohydrate reserves necessary to thrive for long periods in culture. However, these
shoot segments are thought to respond more quickly to herbicide application for this
same reason. On the other hand, longer shoots have the carbohydrate reserves to
thrive in culture, but it is speculated that they also can use these same reserves to
initially withstand the herbicide application.
A multitude of methods have been well published using small-scale laboratory
experiments to study aquatic plants, however, no studies report on pigment analysis
incubation periods, optimal shoot length for determining herbicide response in invasive
watermilfoils, or using pulse-amplitude modulated (PAM) fluorometry to evaluate
herbicide resistance or tolerance in aquatic plants.
Materials and Methods
Pigment Extraction Incubation Time
Stock plants of hydrilla and Eurasian watermilfoil (EWM) were maintained in 950-L
outdoor mesocosms at the Center for Aquatic and Invasive Plants in Gainesville, Florida
throughout the study period. These plants were exposed to ambient temperature and
photoperiod. Actively growing shoots were harvested for use in the study and washed
thoroughly with tap water to remove algae and microorganisms. Apical shoot tips
weighing 0.1 g were placed into 5 mL dimethyl sulfoxide (DMSO) in HDPE centrifuge
tubes and incubated in a 65°C water bath for 1 hour, 3 hours, or 6 hours. A second
experiment utilized shorter time intervals of 15 minutes, 30 minutes, and 1 hour. Both
experiments were conducted using a completely randomized design in a factorial
arrangement where each plant species received each incubation interval with 4
replications. At the designated time interval, a 2 mL aliquot of extract was analyzed
using a BioMate spectrophotometer (Thermo Scientific, Pittsburgh, PA) at 480, 649, and

48
665 nm to determine total carotenoids, chlorophyll a and chlorophyll b, respectively.
DMSO was used as a blank. Total chlorophyll was calculated with the following
equation: (12.19*absorbance at 665nm-3.45*absorbance at 649nm)+(21.99*absorbance
at 649nm-5.32*absorbance at 665nm). Total carotenoids were calculated as
(1000*absorbance at 480nm-2.14*chlorophyll a-70.12*chlorophyll b)/200. Experiments
were repeated. Data were converted to percent of longest incubation time and
subjected to analysis of variance (ANOVA). There was not a significant treatment by run
interaction for either experiment, therefore results were combined. Means were
separated using Fisher‟s Protected LSD (α=0.05).
PAM Fluorometery
Stock plants of EWM were maintained in 950-L outdoor mesocosms at the Center
for Aquatic and Invasive Plants in Gainesville, Florida throughout the study period.
These plants were exposed to ambient temperature and photoperiod. The first
population used in this study, a hybrid watermilfoil, originated from Townline Lake in
western Michigan, which is thought to have increased tolerance to the herbicide
fluridone. The second population used originated from Texas and is confirmed EWM
suspected to be susceptible to fluridone. This susceptible population is hereafter
referred to as „Susceptible‟. Actively growing shoots of each population were harvested
for use in the study and washed thoroughly with tap water to remove algae and
microorganisms. Apical shoots 6 cm in length were placed in glass culture tubes
containing 100mL Andrew‟s media, as described by Selim et al. (1989), supplemented
with 4 g L-1 sodium bicarbonate. Plants were treated with 0, 2.5, 5, 10, or 20 μg L-1
fluridone herbicide (Sonar AS®, SePRO Corporation, Carmel, IN), with 4 replications
per treatment in a completely randomized design. Plants were kept in a climate

49
controlled growth chamber for the duration of the experiment (23°C: 21°C day:night
temperature, 14 light:8 dark photoperiod, and 350 μmol/m2 light). Fluorescence was
measured at the growing point 7 days after treatment (DAT) using a PAM fluorometer
(Mini-PAM, Walz, Effetrich, Germany). New apical tissue was harvested for pigment
analysis as described previously. The experiment was repeated. There was not a
significant treatment by run interaction for either experiment, therefore results were
combined. Data were converted to percent of the untreated control and subjected to
nonlinear regression. Confidence intervals (α=0.05) of the means were used to compare
the effective concentration to reduce pigments by 50% (EC50) for fluorescence yield,
total chlorophyll, and total carotenoids for each population.
Shoot Length Response
Stock plants of fluridone-susceptible EWM were maintained in 950-L outdoor
mesocosms at the Center for Aquatic and Invasive Plants in Gainesville, Florida
throughout the study period. Established and thriving plants were harvested for use in
the study and washed thoroughly with tap water to remove algae and microorganisms.
The study was repeated using EWM plants harvested from the Chassahowitzka River in
Central Florida. Apical shoot tips were excised into 2, 4, 6, or 8 cm segments and
washed thoroughly in tap water to remove algae and microorganisms. These segments
were placed in glass culture tubes containing 150 mL of Andrew‟s media supplemented
with 4 g L-1 sodium bicarbonate. Each shoot tip size was then treated with 5, 10, or 20
μg L-1 fluridone herbicide. An untreated control of each shoot length was also included.
Plants were kept in a climate controlled growth chamber for the duration of the
experiment (23°C: 21°C day:night temperature, 14 light:8 dark photoperiod, and 350
μmol/m2 light). Fluorescence was measured at the growing point 2, 6, and 10 DAT using

50
a PAM fluorometer. At 10 DAT, 0.1 g of new growth from each shoot was harvested for
pigment analysis. The previously described method of total carotenoid and total
chlorophyll quantification was used. The study was conducted using a completely
randomized design with 4 replications. Data were converted to percent of the untreated
control, combined and subjected to ANOVA. There was not a significant treatment by
run interaction for either experiment, therefore results were combined. Means were
separated using Fisher‟s Protected LSD (α=0.05) to detect significant differences
between treatments within each shoot length.
Results and Discussion
Pigment Extraction Incubation Time
In the first experiment there were no significant differences in the levels of total
chlorophyll or carotenoids for either species, with the exception of slightly lower levels at
the 6 hour incubation time (Table 3-1). In fact, lower levels were measured at the longer
incubation times of 3 and 6 hours. Chlorophyll and carotenoids are known to degrade
when exposed to light (MacKinney 1941), and it is speculated that the longer incubation
times showed a loss of these pigments due to photodegradation. In the second
experiment, the total incubation time was 1 hour since Experiment 1 had previously
shown that this interval was sufficient incubation time. However, in this experiment a
significantly lower percentage of total chlorophyll was extracted for both hydrilla and
EWM at 15 and 30 minutes (Table 3-2). For total carotenoids, no significant differences
were shown for hydrilla at 30 minutes and 1 hour incubation time, however 15 minutes
was significantly lower. EWM exhibited significantly decreased total carotenoids at both
15 and 30 minutes compared to 1 hour.

51
These results indicated that the 6 hour incubation time period as suggested by
Hiscox and Israelstam and employed in aquatic plant research is not necessary. A 1
hour incubation time is sufficient, but shorter extraction periods are not long enough to
obtain complete pigment extraction. These results do not correspond to those of
Spencer and Ksander (1987) who found that a 20 minute incubation time at 65°C was
sufficient for chlorophyll analysis in hydrilla and EWM. However, due to the lag period
after extraction and spectrophotometric analysis some pigment degradation could have
occurred, thus compromising the actual pigment content. It is also possible that the
pigment concentration in these shoots was significantly lower, thus requiring a shorter
incubation time.
PAM Fluorometry
This study was conducted to evaluate the accuracy of three different methods of
determining fluridone response in watermilfoil. More specifically, PAM fluorometery was
compared to more traditional chemical analysis of pigment content, which is laborious,
expensive, time consuming, and requires destructive harvest of the tissue. Regression
analysis was used to interpret the response of the plants to fluridone as a function of
concentration. From this analysis, the effective concentration that would cause a
predicted reduction of 50% was calculated (EC50). To statistically compare each
method, 95% confidence intervals of the mean EC50 values were generated.
Fluorescence yield EC50 values for both the tolerant and susceptible populations
overlapped with EC50 values of total carotenoids and total chlorophyll (Table 3-3). These
results indicate that measuring fluorescence yield gives similar and statistically
equivalent results as that of the more complex and destructive pigment analysis. As
expected, fluorescence yield, total carotenoids, and total chlorophyll EC50 values of the
52
tolerant population were all significantly higher than those of the susceptible population
of Eurasian watermilfoil (Table 3-3).
Within each population, the EC50 values of fluorescence yield, chlorophyll, or
carotenoid content were not significantly different. This indicates that each method
provides a similar measure of fluridone response, and the ability to elucidate tolerance
or resistance, as shown by the differences between populations, is reliable. This finding
will greatly aid resource managers because PAM fluorometery determines results in a
much more time sensitive fashion without a requirement for destructive harvest of plant
tissue.
Shoot Length Response
One of the most challenging aspects of laboratory experimentation with aquatic
plants, especially submersed aquatic macrophytes, is the selection of uniform plant
material. Herbicide response studies further complicate this situation, because many
herbicides work only on new growth. Therefore, the growth status of the plant tissue and
the ability to have fairly uniform growth potential from plant material is critical. A key
factor for growth in these types of plants is thought to be initial shoot length. Therefore,
these studies were conducted to determine the optimal shoot length to provide accurate
results of fluridone response. PAM fluorometery was shown to provide an accurate
assessment of fluridone in the previous experiment and was thus used in this study to
measure response over time as a function of shoot length.
At 2 DAT, differences were observed at the lowest concentration (5 μg L-1) for
shoot lengths ≥ 4 cm (Table 3-4). At concentrations of 10 μg L-1 or higher, differences
were observed in all segment lengths. By 6 DAT, differences between the control and
all concentrations were observed regardless of shoot length (Table 3-5). In 2 cm and 4

53
cm shoots, differences were also observed between concentrations ≤ 5 μg L-1 and
concentrations ≥ 10 μg L-1. Differences were also observed at the lowest concentration
in all shoot lengths by 10 DAT (Table 3-6). This demonstrates the ability to determine
different responses to ≥ 10 μg L-1 of fluridone within 2 DAT if 4 cm or longer shoots are
utilized. To determine differences between lower concentrations over a longer period of
time, 2 cm shoot lengths provide the most consistent results of lengths studied.
Resource managers concerned with potentially fluridone tolerant or resistant EWM
populations would benefit from obtaining this knowledge as quickly as possible,
therefore 4 cm or 6 cm shoot segments lengths would be recommended in such
studies.
Total chlorophyll content was significantly lower at the highest concentration of
fluridone (20 μg L-1) in all shoot lengths while shoots 2 cm in length displayed no
difference in total chlorophyll at 0, 5, or 10 μg L-1 fluridone (Table 3-7). Shoots 4 cm, 6
cm, and 8 cm in length showed differences between the control and each concentration
of fluridone. Total carotenoids were also significantly lower at the highest concentration
in all shoot lengths (Table 3-8). Shoots 6 cm in length produced the most logical
differences between concentrations, and would likely be the best choice of shoot length
to determine pigment responses to fluridone in EWM.
Taking into consideration fluorescence yield data and pigment data, 6 cm shoot
length segments would provide the most accurate determination of fluridone response
in EWM. At all data collection intervals after treatment, 6 cm shoot tips produced
significant responses between the control and different concentrations. Pigment
analysis was also most informative with 6 cm shoot tips in that differences were

54
observed between the control and each concentration, and differences were also
observed between some concentrations. Based on visual observations from the study, 2
cm and 4 cm shoot lengths do not have enough carbohydrate reserves to produce the
biomass needed for effective pigment analysis. Shoots 8 cm in length did not exhibit
logical differences between rates in fluorescence yield or pigment analysis. This is likely
due to the excess reserves in the 8 cm shoot that allow it to initially withstand herbicide
treatment.
Refining and developing these methods are integral for herbicide response
research with submersed aquatic plants, specifically Eurasian and hybrid watermilfoils.
Decreasing incubation time during chlorophyll and carotenoid extraction not only is a
time saving measure, but reduces the likelihood of pigment degradation during
extended incubation times. Utilizing PAM fluorometery to document herbicide response
is also more efficient. This method is an improvement from destructive pigment analysis
in that plants remain intact. In turn, the analysis is able to be repeated over time to
provide more insight on specific populations‟ response to pigment synthesis inhibiting
herbicides. Choosing the optimal shoot length for laboratory experiments is essential to
obtaining accurate and rapid results. These methods will help resource managers to
efficiently evaluate potentially tolerant populations of invasive watermilfoils and allow for
more rapid decision making to occur.

55
Table 3- 1. Total chlorophyll and total carotenoids extracted from hydrilla and Eurasian watermilfoil (EWM) tissue in dimethyl sulfoxide as a function of 6 hour incubation time.
Total Chlorophyll Total Carotenoids
Incubation Time Hydrilla EWM Hydrilla EWM
1 hr 109.8ab 89.4a 113.5a 98.7a
3hr 115.0a 98.8a 110.3a 102.3a
6hr 100.0b 100.0a 100.0a 100.0b
LSD 12.3 11.4 9.2 6.3
Note: Values represent percentage of total (6 hour incubation) pigment extracted at each time interval (n=8). Letters indicate significant differences between incubation times within a column as found using Fisher‟s Protected LSD (α=0.05).
Table 3 2. Total chlorophyll and total carotenoids extracted from hydrilla and Eurasian
watermilfoil (EWM) tissue in dimethyl sulfoxide as a function of 1 hour incubation time.
Total Chlorophyll Total Carotenoids
Incubation Time Hydrilla EWM Hydrilla EWM
15 min 62.7c 48.7c 85.5b 56.7c 30 min 85.8b 78.6b 96.3a 83.1b 60 min 100.0a 100.0a 100.0a 100.0a
LSD 8.3 17.3 5.8 15.0
Note: Values represent percentage of total (1 hour incubation) pigment extracted at each time interval (n=8). Letters indicate significant differences between incubation times within each column as found using Fisher‟s Protected LSD (α=0.05).
Table 3-3. EC50 values (± confidence intervals, α=0.05) for fluorescence yield, total
chlorophyll, and total carotenoids for suspected fluridone-tolerant and fluridone-susceptible invasive watermilfoil populations.
Tolerant Population Susceptible Population
EC50 95% Confidence
Interval R2 value
EC50 95% Confidence
Interval R2 value
Fluorescence Yield 21.3 ± 6.3 0.7376 3.7 ± 0.5 0.8924
Carotenoids 25.4 ± 10.7 0.6064 7.4 ± 3.2 0.5531
Chlorophyll 24.9 ± 11.8 0.5648 7.4 ± 2.7 0.6772
Note: R2 values indicate the fit of the exponential-decay model (y=a*exp(-b*fluridone concentration)) with
n=8.

56
Table 3-4. Fluorescence Yield (Fv/Fm), as percent of the untreated control, in Eurasian watermilfoil shoot lengths as a function of fluridone concentration 2 days after treatment.
Fluridone Concentration
(μg L-1
)
Shoot Length
2 cm 4 cm 6 cm 8 cm
0 100.0 a 100.0 a 100.0 a 100.0 a 5 98.1 a 89.2 b 92.9 bc 94.2 b
10 89.3 b 88.2 bc 95.9 ab 87.1 c 20 91.1 b 80.4 c 87.9 b 90.0 bc
LSD 5.9 7.8 5.3 4.8
Note: Letters following percent of the untreated control values represent significant differences between concentrations in each shoot length according to Fisher‟s Protected LSD (α=0.05) with n=8.
Table 3-5. Fluorescence Yield (Fv/Fm), as percent of the untreated control, in Eurasian watermilfoil shoot lengths as a function of fluridone concentration 6 days after treatment.
Fluridone Concentration
(μg L-1
)
Shoot Length
2 cm 4 cm 6 cm 8 cm
0 100 a 100 a 100 a 100 a 5 80.9 b 66.7 b 68.0 b 72.8 bc
10 62.1 c 70.1 b 73.6 b 86.4 ab 20 53.4 c 55.2 c 69.4 b 62.2 c
LSD 14.1 10.1 12.2 19.3
Note: Letters following percent of the untreated control values represent significant differences between
concentrations in each shoot length according to Fisher‟s Protected LSD (α=0.05) with n=8. Table 3-6. Fluorescence Yield (Fv/Fm), as percent of the untreated control, in Eurasian
watermilfoil shoot lengths as a function of fluridone concentration 10 days after treatment.
Fluridone Concentration
(μg L-1
)
Shoot Length
2 cm 4 cm 6 cm 8 cm
0 100 a 100 a 100 a 100 a 5 72.9 b 57.9 b 57.1 b 65.5 bc
10 60.9 c 51.6 b 59.0 b 75.5 b 20 53.7 c 53.1 b 53.2 b 47.1 c
LSD 11.3 14.5 12.1 8.2
Note: Letters following percent of the untreated control values represent significant differences between concentrations in each shoot length according to Fisher‟s Protected LSD (α=0.05) with n=8.

57
Table 3-7. Total chlorophyll, represented as percent of the untreated control, in Eurasian watermilfoil shoot lengths as a function of fluridone concentration 10 days after treatment.
Fluridone Concentration
(μg L-1
)
Shoot Length
2 cm 4 cm 6 cm 8 cm
0 100 a 100 a 100 a 100 a
5 98.8a 70.6 b 79.1 b 52.8 bc
10 88.1 ab 76.0 b 63.1 bc 64.8 b
20 76.5 b 57.8 b 50.2 c 37.2 c
LSD 19.9 21.0 17.2 18.3
Note: Letters following percent of the untreated control values represent significant differences between concentrations in each shoot segment length according to Fisher‟s Protected LSD (α=0.05) with n=8.
Table 3-8. Total carotenoids, represented as percent of the untreated control, in
Eurasian watermilfoil shoot lengths as a function of fluridone concentration 10 days after treatment.
Fluridone Concentration
(μg L-1
)
Shoot Length
2 cm 4 cm 6 cm 8 cm
0 100 a 100 a 100 a 100 a
5 78.1 b 72.6 b 70.5 b 57.8 c
10 78.2 b 73.1 b 58.1 bc 73.2 b
20 66.3 b 61.9 b 50.1 c 41.4 d
LSD 13.4 16.8 13.9 15.0
Note: Letters following percent of the untreated control values represent significant differences between concentrations in each shoot segment length according to Fisher‟s Protected LSD (α=0.05) with n=8.

58
CHAPTER 4 CHARACTERIZATION OF FLURIDONE TOLERANT HYBRID WATERMILFOIL
ULTILIZING PIGMENT ANALYSIS AND PAM FLUOROMETERY
Invasive watermilfoils, Eurasian watermilfoil (Myriophyllum spicatum L.) and hybrid
watermilfoil (M. spicatum x M. sibiricum), are problematic weeds in many water bodies
they inhabit. Plants grow to form dense canopies displacing native vegetation, altering
water quality, and obstructing recreational uses of waterways. Madsen et al. (1991)
found that Eurasian watermilfoil formed dense canopies which can shade out desirable
native plants in the ecosystem. Dense canopy formation has been shown to negatively
impact water quality by reducing dissolved oxygen in water below the mat and
increasing surface temperatures and pH (Bowes et al. 1979). Submersed aquatic
weeds have also been shown to harbor algae species harmful to both wildlife and
human health (Wilde et al. 2005). When watermilfoils spread within waterbodies and
result in unfavorable conditions for wildlife and fisheries, displacement of desirable
native vegetation, and impacts on recreational access or aesthetics, management of
these plants is often required.
Hybrid watermilfoil was first documented in 2002 by Moody and Les. Populations
previously thought to be the invasive Eurasian watermilfoil were found, through nuclear
ribosomal DNA analysis, to be hybrid populations from the parental species Eurasian
watermilfoil and northern watermilfoil (Moody and Les 2002). Hybrid watermilfoils
present unique challenges for management due to inherited traits such as invasiveness
and rapid growth rate from the Eurasian parent and the potential for turion formation in
some hybrid populations from the northern parent. Once a hybrid population is
established in a water body, the gene combinations gained from parental species tend
to become incorporated in the hybrid population (Sturtevant et al. 2009). It is important

59
to note that numerous hybrid watermilfoil populations have arisen independently and
therefore traits associated with hybrids from one lake may be quite different when
compared with those from another lake. Genotypic and phenotypic differences exist
between populations of the hybrid plants and generalities cannot be made regarding
specific growth or management traits. Repeated hybridization as well as back-crossing
has been documented (Moody and Les 2002). Therefore, it is important to refer to each
hybrid population independently.
Chemical control methods are commonly used to manage invasive watermilfoils.
Fluridone (1-methyl-3-phenyl-5-[3-(trifluoromethyl)phenyl]-4(1H)-pyridinone) is an
attractive choice for water managers due to its low use rates, native plant selectivity,
ability to target watermilfoil in the entire lake, and potential for multiple years of control
from a single treatment. This herbicide is used frequently by water managers to control
Eurasian and hybrid watermilfoils. There have been numerous claims of reduced
herbicide response by hybrid watermilfoils; however there is limited published
information on this topic. Triclopyr ([3,5,6-trichloro-2-pryidinyl]oxy acetic acid) and 2,4-D
amine ([2,4-dichlorophenoxy] acetic acid) were found to inhibit growth of both Eurasian
and hybrid watermilfoil accessions in a similar manner following exposure to labeled use
rates (Poovey et al. 2007). Recently, differences between Eurasian and hybrid
watermilfoil biotypes were noted following exposure to low continuous concentrations of
2,4-D (Glomski and Netherland 2010).
Pigment Analysis
Fluridone is an inhibitor of the carotenoid biosynthesis pathway; specifically a
noncompetitive inhibitor of the phytoene desaturase (PDS) enzyme. The PDS enzyme

60
catalyzes the desaturation of phytoene in the rate-limiting step of this pathway
(Chamovitz et al. 1993). When PDS is inhibited, phytoene levels increase and
carotenoid production in the cell is limited. Carotenoids function to shield chlorophyll
from excess light and help dissipate the oxidative energy of singlet oxygen. In fluridone
treated plants, carotenoids are not synthesized in new tissue. Therefore, they are not
present to quench the energy of oxygen radicals, allowing for the formation of lipid
radicals in chlorophyll molecules (Senseman 2007). This results in degradation of
chlorophyll, bleaching of new tissue and subsequent necrosis and plant death. By
analyzing pigment levels in this pathway the plant‟s response to fluridone can be
studied. Sprecher et al. (1998) developed an extraction method that utilizes absorbance
spectroscopy to quantify phytoene and β-carotene levels. In fluridone susceptible
plants, phytoene levels increase after fluridone treatments and β-carotene levels are
less than control plants. In fluridone resistant plants, phytoene and β-carotene levels are
similar to those of untreated control plants. Puri et al. (2006) used this technique to
demonstrate resistance in several hydrilla (Hydrilla verticillata [L.f.] Royle) populations
collected throughout Florida.
Chlorophyll analysis is an indirect method of determining fluridone resistance.
Although fluridone does not directly affect chlorophyll biosynthesis, the absence or
reduction of β-carotene leads to the destruction of chlorophyll molecules. Therefore, in a
susceptible plant exposed to fluridone, chlorophyll levels in new tissue will be lower than
those in control plants. Several extraction methods have been evaluated and utilized for
pigment analysis using various solvents (Iriyama et al. 1974, Hiscox and Isrealstam

61
1979, Moran and Porath 1979) but the non-macerated method of Wellborn (1994) using
dimethyl sulfoxide (DMSO) proved to be the most useful in these studies.
Although pigment analysis provides a method for determining herbicide activity in
the plant, the methods employ a destructive harvest of plant tissue. Due to the
transitional nature of fluridone response, there is a need for non-destructive and
repeatable methods of analysis. Pulse-amplitude modulated (PAM) fluorometery can
give information as to chlorophyll functionality as a measure of chlorophyll fluorescence.
PAM fluorometery has been used to study irradiance stress (Ralph et al. 1998),
salinity stress (Kamermans et al. 1999), and shoot-to-landscape differences in
photosynthesis in sea grasses (Durako and Kunzelman 2002). In situ measurement of
photosynthetic activity of Red Sea faviid corals has also been measured (Beer et al.
1998). This technique is useful because it is a non-destructive method of evaluating the
activity of chlorophyll and has also been used to evaluate herbicidal effects on plants.
Ireland et al. (1986) used fluorometery to document decreased fluorescence in wheat
(Triticum spp.) 30 minutes after exposure to glyphosate (N-[phosphonomethyl] glycine)
herbicide. The herbicide diuron (N‟-[3,4-dichlorophenyl]-N,N-dimethylurea), a
photosystem II inhibitor, was shown to reduce fluorescence yield ratio in sea grasses
two hours after exposure as measured with a diving-PAM (Haynes et al. 2000). Junea
et al. (2001) evaluated the effects of mercury and metolachlor (2-chloro-N-[2-ethyl-6-
methylphenyl]-N-[2-methoxy-1-methylethyl] acetamide), a mitosis inhibiting herbicide,
on six algal species.
A PAM fluorometer works by focusing a saturating beam of light on the desired
region of the plant. Yield ratio is calculated by the instrument. Higher fluorescence yield

62
ratio indicates highly functioning chlorophyll whereas lower yield ratios indicate
damaged or non-functioning chlorophyll. Yield is a ratio of Fv/Fmax. Fmax is equal to the
fluorescence when the saturating pulse is applied to the tissue. Fv is equal to Fmax-F
where F is the fluorescence of the tissue with no light pulse applied. The plant
fluoresces more when chlorophyll is damaged, which indicates a higher Fmax value.
However, the yield output ratio is lower because damaged chlorophyll fluoresces more
under ambient light conditions which is noted in a higher F value. Therefore, a higher Y
ratio value indicates chlorophyll that is functioning normally where a lower Y value
indicates damaged chlorophyll (Bolhar-Nordenkampf et al. 1989).
In May 2010, a 220 acre lake in western Michigan (Townline Lake) was treated
with a rate of fluridone permitted by the Michigan Department of Natural Resources.
The population of documented hybrid watermilfoil in the water body was not controlled
with the legal rate of the herbicide. The observation that a hybrid watermilfoil may show
increased tolerance to fluridone has fueled more speculation on the nature of hybrids
and their response to herbicides.
The use of a PAM fluorometer to detect the effects of pigment synthesis inhibiting
herbicides such as fluridone has been documented in aquatic plants, but with limited
results (unpublished data). Fluorometery would potentially be a non-destructive method
for evaluating fluridone activity in specific plant tissues over a period of time. This
method will be compared to traditional pigment analysis when determining differential
responses of Townline and several susceptible invasive watermilfoil populations in
laboratory experiments. Although mesocosm studies have been used previously to
evaluate invasive watermilfoils‟ response to fluridone, these studies are labor intensive

63
and time consuming. Laboratory methods could potentially reduce the time needed to
document response from several weeks to several days. This reduction in lag time
could quickly provide resource managers with valuable information to efficiently treat
watermilfoil infestations in the field. This study focuses on further evaluating Townline
hybrid watermilfoil and implementing laboratory methods when making comparisons
with watermilfoil populations obtained from several states.
Materials and Methods
Experiment 1
Apical shoot tips 6 cm in length were harvested from outdoor stock cultures of
watermilfoil populations at the Center for Aquatic and Invasive Plants in Gainesville,
Florida. Populations used in this study included Townline, Indian, Auburn, and North
Carolina (Table 4-1). Townline is a hybrid watermilfoil suspected to be tolerant to
fluridone. The Indian population is also a hybrid and is closely related to Townline due
to similar geography and genetics (Thum, pers. comm.1). Both Auburn and North
Carolina populations are confirmed EWM populations.
Apical shoot tips were thoroughly washed with tap water and a single tip was
placed in a glass culture tube containing Andrew‟s media, as described by Selim et al.
(1989), supplemented with 4 g L-1 of sodium bicarbonate as an additional carbon
source. Plants were immediately treated with 0, 3, 6, 9, 12, 24, or 48 μg L-1 of fluridone
(Sonar AS, SePro Corporation, Carmel, IN). Culture tubes were maintained in a climate
controlled growth chamber for the duration of the experiment (23°C: 21°C day:night
temperature, 14 light:8 dark photoperiod, and 350 μmol/m2 light).
1 R. Thum, Grand Valley State University, Annis Water Resources Institute Muskegon, MI 49441.

64
Shoot tips were removed 3, 5, and 7 days after treatment (DAT) and new apical
growth was measured with a PAM fluorometer (Mini-PAM, Walz, Effetrich, Germany) to
determine fluorescence yield. After measurement, shoot tips were returned to their
respective culture tubes. At 7 DAT, 0.2 g of new apical shoot growth was harvested
from each shoot for pigment analysis. Total chlorophyll and total carotenoids were
quantified using methods described by Wellburn et al (1994). Harvested samples were
placed in plastic tubes with 5mL of dimethyl sulfoxide (DMSO) and incubated for 1 hour
in a 65°C water bath. Extract from each sample was analyzed spectrophotometrically
(BioMate 5, Thermo Scientific, Pittsburgh, PA) at 480nm for total carotenoids, 649 nm
for chlorophyll b and 665 nm for chlorophyll a. DMSO was used as a blank. Total
chlorophyll was calculated with the following equation: (12.19*absorbance at 665nm -
3.45*absorbance at 649nm) + (21.99*absorbance at 649nm - 5.32*absorbance at
665nm). Total carotenoids were calculated as (1000*absorbance at 480nm -
2.14*chlorophyll a - 70.12*chlorophyll b) / 200. Each treatment was replicated four times
and the entire study was repeated. Analysis of variance (ANOVA) was used to
determine mean effects and possible interactions. There was no experiment by
treatment interaction so the results from both experiments were combined. Fisher‟s
Protected LSD (α=0.05) was used to detect significant differences in response between
each individual population and Townline population.
Experiment 2
Plants with an unknown response to fluridone were obtained from 5 lakes in
Michigan and from 3 bays (Phelps, Gideon‟s, and Carman‟s) on 5800 ha Lake
Minnetonka, Minnesota to be compared to the response of Townline population. The
Michigan lakes tested were Missaukee, Cadillac, Shamrock, Ryerson, and Round
65
Lakes. All of these populations were confirmed as EWM. The study was identical to
Experiment 1 in methodology except that PAM yield was only measured at harvest (7
DAT). No significant differences were found between the 8 populations tested. Data
was combined and compared to Townline using ANOVA and Fisher‟s Protected LSD
(α=0.05) to detect significant differences within each concentration. Nonlinear
regression was fitted to the data.
Results and Discussion
Experiment 1
Chlorophyll fluorescence data showed limited differences at 3 DAT (Table 4-2).
However, by 5 DAT differences were detected between Townline and each population
at each concentration (Table 4-3). By 7 DAT, significant differences were still apparent
at most concentrations (Table 4-4). Total chlorophyll data did not exhibit the same level
of differences, while total carotenoids also showed fewer differences than fluorescence
data as well (Tables 4-5 and 4-6). The lack of differences found using pigment analysis
is most likely due to possible variation when using these methods. The PAM fluorometer
resulted in less variation in results at 5 and 7 DAT. These results suggest that using a
PAM fluorometer to measure fluorescence provides more distinguishable results than
typical pigment analysis.
Indian Lake is suspected to have a similar response to fluridone as that of
Townline Lake due to geographical proximity and genetic similarities between
populations. However, the fluorescence yield response differed at several
concentrations 3 DAT, all concentrations at 5 DAT, and all concentrations but the
highest concentration at 7 DAT (Tables 4-2, 4-3, and 4-4). Chlorophyll analysis showed
differences between the two populations at 9 and 12 μg L-1 while total carotenoids were

66
significantly different at all concentrations but the highest (Tables 4-5 and 4-6). Although
reported as being genetically similar to Townline Lake, the response of the hybrid Indian
Lake population to fluridone was different to that of Townline.
Fluorescence yield of Auburn differed from Townline at only the lowest and highest
concentrations 3 DAT, but differences were found at all concentrations at 5 and 7 DAT
(Tables 4-2, 4-3, and 4-4). This suggests that the PAM fluorometer does not detect a
quantifiable response to fluridone until at least 5 DAT. Chlorophyll and carotenoid data
did not exhibit the same distinguishable trends as fluorescence yield. Pigment data was
only significantly different from Townline at 9 μg L-1 for chlorophyll and 6 and 9 μg L-1 for
carotenoids (Tables 4-5 and 4-6). This is again evidence that the PAM fluorometer
provides more precise measurement when compared to pigment analysis. As
evidenced by the fluorescence yield results, Auburn and Townline plants had a different
response to fluridone, with Townline being less affected at each concentration.
The population of watermilfoil from North Carolina began to show significant
differences at several concentrations beginning at 3 DAT. At this time, differences were
found at 3, 6, 12 and 48 μg L-1 (Table 4-2). By 5 DAT, differences were found at each
concentration and this trend continued at 7 DAT (Tables 4-3 and 4-4). Differences were
found in total chlorophyll at all concentrations but the highest (Table 4-5). Differences
were found in total carotenoids at all concentrations tested (Table 4-6). North Carolina
plants also had a different response than Townline plants.
These results show the different responses of invasive watermilfoils to fluridone.
Although the product is labeled for identical use concentrations for all invasive
watermilfoils, differences in response could account for the varying levels of treatment
67
success observed in the field. Townline population has an increased tolerance for the
herbicide fluridone when compared to other known susceptible populations.
Experiment 2
Plants collected from 5 Michigan lakes and 3 bays in Lake Minnetonka, Minnesota
showed varying responses to fluridone when compared to Townline Lake. These
populations differ in history of fluridone exposure. Fisher‟s Protected LSD also
confirmed that the combined susceptible populations‟ response, as measured as
fluorescence yield, was different to that of Townline at all concentrations tested (Figure
4-1). Both total chlorophyll and total carotenoids were different between Townline and
susceptible at all concentrations but the highest (Figures 4-2 and 4-3).
This study demonstrates that Townline plants have an increased tolerance to
fluridone when compared to other invasive watermilfoils from several states. Use of a
PAM fluorometer was less variable than traditional pigment analysis and is a less
complex method to utilize. The limited variability between susceptible watermilfoils
collected across the country demonstrates the high level of sensitivity these species
often exhibit to fluridone. Fluridone has traditionally been a successful tool in controlling
watermilfoil invasions due in part to the widespread response of these plants. Townline
Lake is the first documented population of invasive watermilfoils that does not show
susceptibility to fluridone. This population should be carefully monitored by resource
managers to prevent spread to neighboring lakes. Lakes in close proximity need to be
monitored as well in order to rapidly detect any invasion of fluridone tolerant plants. The
use of PAM fluorometery in lab-scale studies is a promising tool for quickly evaluating
the response to fluridone of other populations of invasive watermilfoils.

68
Table 4-1. Populations of invasive watermilfoils used in Experiment 1. Population Species Location Tolerance
Townline hybrid Michigan probable Indian hybrid Michigan suspected Auburn EWM Minnesota susceptible North Carolina EWM North Carolina susceptible
Note: Hybrid watermilfoil is a cross between northern watermilfoil (Myriophyllum sibiricum) and Eurasian watermilfoil (EWM) (M. spicatum).
Table 4-2. Fluorescence yield (Fv/Fm), represented as percent untreated, in Townline plants and 3 different populations of invasive watermilfoils collected from three states after exposure to fluridone 3 days after treatment.
fluridone concentration (μg L
-1) Townline Indian Auburn North Carolina
3 102.1 98.3* 99.8* 95.5*
6 97.9 91.7 97.4 94.3*
9 96.6 91.9* 90.6 95.4*
12 93.4 91.2 88.8 85.2
24 87.7 88.3 87.2 86.0
48 91.1 84.3* 83.7* 81.2*
Note: Differences between each population compared to Townline within each concentration, found using Fisher‟s Protected LSD (α=0.05) are denoted with an asterisk with n=8.
Table 4-3. Fluorescence yield (Fv/Fm), represented as percent untreated, in Townline
plants and 3 different populations of invasive watermilfoils collected from three states after exposure to fluridone 5 days after treatment.
fluridone concentration (μg L
-1) Townline Indian Auburn North Carolina
3 104.4 96.5* 101.1* 96.9*
6 102.4 85.7* 93.8* 88.7*
9 101.8 84.7* 81.4* 89.7*
12 97.7 88.8* 82.3* 83.8*
24 91.2 75.9* 76.0* 73.9*
48 86.7 69.4* 72.1* 63.5*
Note: Differences between each population compared to Townline within each concentration, found using Fisher‟s Protected LSD (α=0.05) are denoted with an asterisk with n=8.

69
Table 4-4. Fluorescence yield (Fv/Fm), represented as percent untreated, in Townline plants and 3 different populations of invasive watermilfoils collected from three states after exposure to fluridone 7 days after treatment.
fluridone concentration
(μg L-1
) Townline Indian Auburn North Carolina
3 101.6 100.6 95.7* 98.2 6 99.2 85.8* 87.7* 82.4* 9 97.0 80.6* 67.7* 86.5*
12 97.5 80.3* 78.7* 77.2* 24 84.0 62.3* 69.5* 65.7* 48 70.0 59.1* 59.1* 41.3*
Note: Differences between each population compared to Townline within each concentration, found using Fisher‟s Protected LSD (α=0.05) are denoted with an asterisk with n=8.
Table 4-5. Total chlorophyll, represented as percent untreated, in Townline plants and
3 different populations of invasive watermilfoils collected from three states after exposure to fluridone 7 days after treatment.
fluridone concentration (μg L
-1) Townline Indian Auburn North Carolina
3 112.9 101.3 96.8 83.3*
6 106.5 98.0 85.7 75.3*
9 90.7 62.4* 78.2* 67.1*
12 93.1 72.0* 77.6 57.7*
24 79.1 60.1 64.1 48.5*
48 54.4 63.7 55.3 41.2
Note: Differences between each population compared to Townline within each concentration, found using Fisher‟s Protected LSD (α=0.05) are denoted with an asterisk with n=8.
Table 4-6. Total carotenoids, represented as percent untreated, in Townline plants and
3 different populations of invasive watermilfoils collected from three states after exposure to fluridone 7 days after treatment.
fluridone concentration (μg L
-1) Townline Indian Auburn North Carolina
3 107.3 93.2* 89.1 74.2*
6 98.4 76.7* 72.1* 65.2*
9 80.4 54.0* 68.9* 53.4*
12 81.0 62.0* 79.2 47.7*
24 69.6 51.3* 56.1 39.2*
48 51.2 62.9 56.8 39.4*
Note: Differences between each population compared to Townline within each concentration, found using Fisher‟s Protected LSD (α=0.05) are denoted with an asterisk with n=8.

70
Figure 4-1. Fluorescence Yield (Fv/Fm), represented as percent of the untreated control, in Townline plants and nine different populations of susceptible invasive watermilfoils collected from two states 7 days after treatment with fluridone. Symbols represent means at each concentration and error bars represent standard error (Townline n=8, Susceptible n=32). Curves indicate nonlinear regression. Concentrations with significant differences as found using Fisher‟s Protected LSD (α=0.05) are marked with an asterisk.
Fluridone Concentration (g L-1
)
0 20 40 60
Pe
rce
nt U
ntr
ea
ted
20
40
60
80
100
120
Townline f=103.4(-0.008*x)
R=0.9657
Susceptible f=92.1(-0.02*x)
R2=0.8986* * * *
*
*
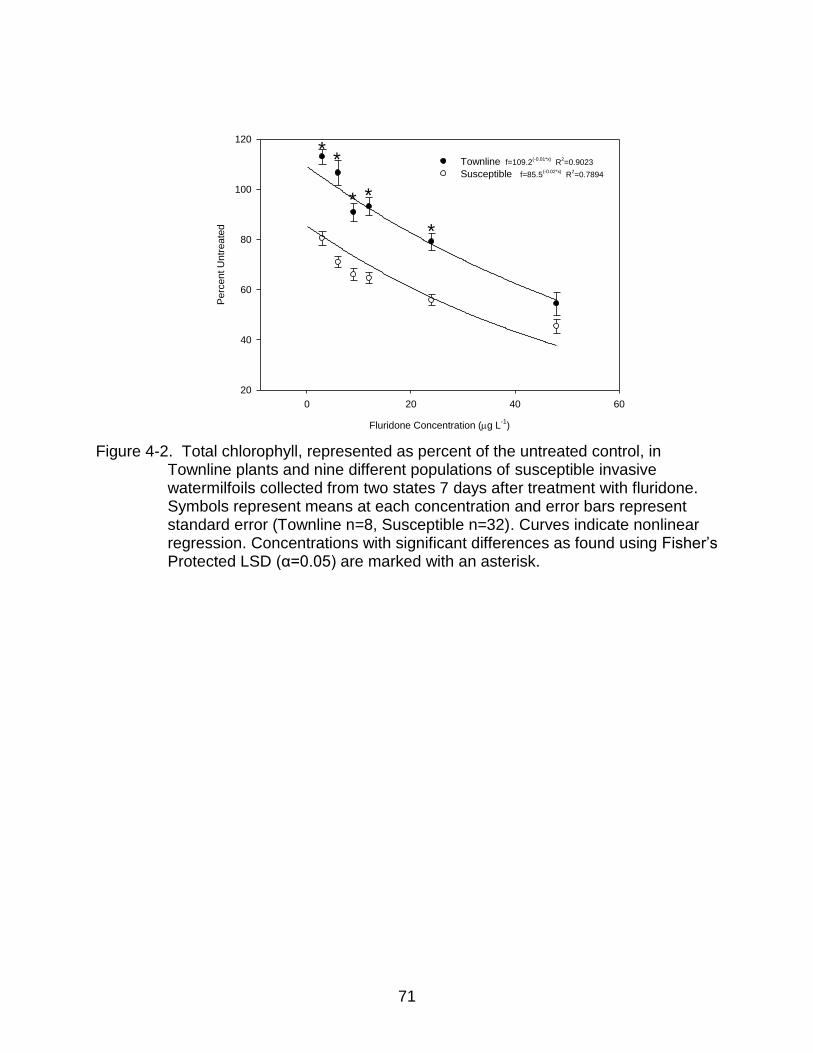
71
Figure 4-2. Total chlorophyll, represented as percent of the untreated control, in
Townline plants and nine different populations of susceptible invasive watermilfoils collected from two states 7 days after treatment with fluridone. Symbols represent means at each concentration and error bars represent standard error (Townline n=8, Susceptible n=32). Curves indicate nonlinear regression. Concentrations with significant differences as found using Fisher‟s Protected LSD (α=0.05) are marked with an asterisk.
Fluridone Concentration (g L-1
)
0 20 40 60
Pe
rce
nt U
ntr
ea
ted
20
40
60
80
100
120
Townline f=109.2(-0.01*x)
R2=0.9023
Susceptible f=85.5(-0.02*x)
R2=0.7894
*
**
**

72
Figure 4-3. Total carotenoids, represented as percent of the untreated control, in Townline plants and nine different populations of susceptible invasive watermilfoils collected from two states 7 days after treatment with fluridone. Symbols represent means at each Concentration and error bars represent standard error (Townline n=8, Susceptible n=32). Curves indicate nonlinear regression. Concentrations with significant differences as found using Fisher‟s Protected LSD (α=0.05) are marked with an asterisk.
Fluridone Concentration (g L-1
)
0 20 40 60
Pe
rce
nt U
ntr
ea
ted
20
40
60
80
100
120
Townline f=102.9(-0.02*x)
R2=0.9049
Susceptible f=80.1(-0.02*x)
R2=0.6439
**
* *
*

73
CHAPTER 5 EVALUATION OF A HYBRID WATERMILFOIL RESPONSE TO PIGMENT
SYNTHESIS INHIBITING HERBICIDES
Invasive watermilfoils, Eurasian watermilfoil (Myriophyllum spicatum L.) and hybrid
watermilfoil (M. spicatum x M. sibiricum), are problematic weeds in many water bodies
they inhabit. Plants grow to form dense canopies displacing native vegetation, inhibiting
flood control and obstructing recreational uses of waterways. Madsen et al. (1991)
found that Eurasian watermilfoil formed dense canopies on the water surface to shade
out desirable native plants in the ecosystem. Dense canopy formation has been shown
to negatively impact water quality by reducing dissolved oxygen in water below the mat
and increasing surface temperatures and pH (Bowes et al. 1979). Submersed aquatic
weeds have also been shown to harbor algae species harmful to both wildlife and
human health (Wilde et al. 2005). When watermilfoils spread within waterbodies and
result in unfavorable conditions, management of these plants is often required.
Fluridone herbicide (1-methyl-3-phenyl-5-[3-(trifluoromethyl)phenyl]-4(1H)-
pyridinone) has been used to control Eurasian watermilfoil and hydrilla (Hydrilla
verticillata [L.f.] Royle) since the late 1980s. Schmitz et al. (1987) describe using
fluridone to control hydrilla in a central Florida lake such that the plant could no longer
be found in the water body. Haller et al. (1990) successfully used fluridone to control
hydrilla for one year in the St. Johns River. As such, fluridone was heavily used for
hydrilla control in public waters of Florida from the late 1980‟s until the early 2000s.
Between 1999 and 2001, formerly susceptible hydrilla populations in several Florida
lakes were not exhibiting the level of control previously associated with fluridone use.
Subsequent laboratory testing documented that several populations of hydrilla had
developed resistance to fluridone (Michel et al. 2004, Arias et al. 2005, Puri et al. 2006).

74
Specifically, an amino acid substitution in the phytoene desaturase enzyme conferred 2
to 5 fold resistance to the herbicide fluridone in hydrilla (Michel et al. 2004).
Previous to this discovery, herbicide resistance in hydrilla was thought to be
unlikely due to the strictly vegetative reproduction exhibited by dioecious hydrilla in
Florida. However, low use rates, extended exposure times, and repeated use of
fluridone led to tremendous selection pressure on these waterbodies. Repeated
fluridone applications selected for plants that were resistant to typical use rates of the
herbicide fluridone. Since this time, resistance has developed in many water bodies
throughout the state and fluridone is no longer a widespread tool for hydrilla
management in Florida‟s public waters. To date, hydrilla is the only plant that has been
confirmed to show resistance to fluridone. Since the fluridone use patterns are almost
identical for hydrilla and invasive watermilfoils, the potential for resistance in
watermilfoils is expected.
In 2010, a population of hybrid watermilfoil in Townline Lake, Michigan was treated
with standard rates of fluridone herbicide. After a lack of response, the plants were
evaluated in controlled studies and found to be tolerant of fluridone rates exceeding the
maximum rate permitted by the Michigan Department of Natural Resources. Hydrilla
resistance to fluridone was found to be a conformational change in the target enzyme,
phytoene desaturase. Due to the specificity of this resistance, other pigment synthesis
inhibitors that target alternative enzymatic reactions are effective on both susceptible
and resistant populations. Moreover, studying the response of hydrilla to multiple
herbicide mechanisms of action allowed researchers to elucidate the primary
mechanism of resistance. Therefore, the objective of this research was to determine the

75
response of the tolerant Townline hybrid watermilfoil to phytoene desaturase inhibiting
herbicides, specifically norflurazon (4-chloro-5-[methylamino]-2-[3-(trifluoromethyl)
phenyl]-3[2H]-pyridazinone), and a pigment synthesis inhibiting herbicide with a different
mechanism of action, topramezone ([3-4,5-dihydro-isoxazol-3-yl)-4-methylsulfonyl-2-
methylphenyl](5-hydroxy-1-methyl-1H-pyrazole-4-yl)methanone), in an effort to
elucidate the possible mechanism of resistance and determine if alternative herbicides
would be effective in controlling this population.
Materials and Methods
Populations of hybrid and Eurasian watermilfoil were obtained and put into culture
at the Center for Aquatic and Invasive Plants in Gainesville, Florida outdoor mesocosm
tanks. Stock cultures of plants were exposed to ambient water and air temperature
throughout the culture period. For the first experiment, plants originating from Townline
Lake in central Michigan were used and compared to plants with a known susceptibility
to fluridone from a Texas population of watermilfoil. In the second study, the Townline
population of plants was compared to a population of fluridone susceptible Eurasian
watermilfoil originating from Auburn Lake in Minnesota.
Apical shoot tips 6 cm in length were harvested from stock cultures, cleaned
thoroughly with flowing tap wate,r and placed in 100mL of Andrew‟s culture medium
(Selim et al. 1989) supplemented with 4 g L-1 sodium bicarbonate. Plants were treated
with fluridone (Sonar AS®, SePRO Corporation, Carmel, IN), topramezone (BAS 670,
BASF, Raleigh, NC), or norflurazon (Solicam 80DF, Syngenta Crop Protection Inc.,
Greensboro, NC) at 0, 5, 10, 20, 40, or 80 μg L-1. Culture tubes were maintained in a
climate controlled growth chamber for the duration of the experiment (23°C: 21°C
day:night temperature, 14 light:8 dark photoperiod, and 350 μmol/m2 light).

76
Chlorophyll fluorescence was measured at 10 days after treatment (DAT) with a
PAM fluorometer (Mini-PAM, Walz, Effetrich, Germany). At this time, 0.1g of new apical
growth was harvested for total chlorophyll and total carotenoid analysis with methods
similar to those described by Wellburn (1994). Pigment extract in dimethyl sulfoxide
(DMSO) was analyzed at 480 nm, 649 nm, and 665 nm for quantification of total
carotenoids, chlorophyll b and chlorophyll a, respectively. DMSO was used as a blank.
Total chlorophyll was calculated with the following equation: (12.19*absorbance at
665nm - 3.45*absorbance at 649nm) + (21.99*absorbance at 649nm - 5.32*absorbance
at 665nm). Total carotenoids were calculated as (1000*absorbance at 480nm -
2.14*chlorophyll a - 70.12*chlorophyll b) / 200. Extracts were analyzed using a
spectrophotometer (Biomate 5, Thermo Scientific, Pittsburgh, PA).
Each treatment was replicated four times and the entire study was repeated.
Analysis of variance (ANOVA) was used to determine mean effects and possible
interactions. There was no experiment by treatment interaction so the results from both
experiments were combined. Fisher‟s Protected LSD (α=0.05) was used to detect
significant differences in response between the susceptible populations and Townline
population within each concentration.
Results and Discussion
Fluridone
Fluorescence yield showed differences in response to fluridone between Townline
and the susceptible population at 5, 10, and 20 μg L-1 (Figure 5-1a). Total chlorophyll
had differences at 5, 10, and 40 μg L-1 while total carotenoids showed differences at 5,
20, and 40 μg L-1 (Figures 5-1b and 5-1c). Differences were not expected at the two
highest concentrations since fluridone was previously documented to be lethal to

77
Townline plants between 20 and 30 μg L-1. The legally permitted rate in Michigan,
where Townline is located, is 6 μg L-1. Considering the differences between the two
populations at 5 μg L-1 in both at harvest fluorescence yield and pigment analysis, it is
logical to surmise that Townline would not be controlled at the legally permitted rate,
while the known susceptible population would be controlled.
Norflurazon
Differences in fluorescence yield were only found at 40 μg L-1 of norflurazon 10
DAT (Figure 5-2). The typically lethal concentration for norflurazon on watermilfoil is
unknown, hence the wide range of concentrations in this study. Total chlorophyll varied
in response at all concentrations but the highest and total carotenoids were different at
all concentrations (Figures 5-2b and 5-2c). It is possible that PAM fluorometry simply
does not sufficiently evaluate response to norflurazon as it does with fluridone. Pigment
analysis suggests that the Townline population appears to be tolerant or resistant to
norflurazon at concentrations up to 40 μg L-1. This would be understandable since
norflurazon and fluridone work on the same enzyme, PDS, in the carotenoid
biosynthesis pathway. Fluridone resistant hydrilla in Florida was also found to be cross-
resistant to norflurazon (Puri et al. 2009).
Topramezone
Fluorescence yield was different between Townline and susceptible plants 10 DAT
at 10, 20, and 40 μg L-1 (Figure 5-3). Total chlorophyll had differences at 5, 20, and 40
μg L-1 and total carotenoids had differences at 5, 10, 20, and 40 μg L-1 (Figures 5-3b
and 5-3c). The typically lethal rate for topramezone on watermilfoil is around 15 μg L-1. It
is apparent from these results that Townline is also tolerant of topramezone herbicide.
This herbicide does not directly act on PDS enzyme, but blocks synthesis of a cofactor

78
for this enzyme. The fluridone resistant hydrilla documented in Florida did not show
cross resistance to HPPD-inhibiting herbicides such as topramezone (Puri et al. 2009).
Fluridone and norflurazon inhibit the phytoene desaturase (PDS) enzyme in the
carotenoid biosynthesis pathway. With reduction in carotenoid biosynthesis, chlorophyll
molecules are not shielded from excess light and degrade. Topramezone is an HPPD-
inhibiting herbicide that blocks synthesis of a cofactor for the PDS enzyme.
These results suggest that the Townline population of hybrid watermilfoils have
some form of enhanced tolerance to, at minimum, the pigment synthesis inhibiting
herbicides tested in this trial. It is unlikely that a mutation in the phytoene desaturase
gene is a cause of this tolerance, as it was in hydrilla, since tolerance was also shown
to a herbicide with a different mechanism of action (topramezone). The increased
tolerance exhibited by Townline plants could be the result of several tolerance
mechanisms such as increased metabolism of the herbicides tested or decreased
uptake of the herbicides.
Herbicide resistance is defined as “the inherited ability of a plant to survive and
reproduce following exposure to a dose of herbicide normally lethal to the wild type”
(WSSA 1998). Herbicide tolerance “implies that there was no selection or genetic
manipulation to make the plant tolerant; it is naturally tolerant” (WSSA 1998). Some
discussion has occurred debating whether the fluridone response of hybrid watermilfoil
is actually resistance or tolerance. Since hybrid plants were not documented to be at
one time susceptible to fluridone, it is not appropriate to refer to them as “resistant.” The
Townline population of hybrid watermilfoil displays increased tolerance to the herbicides
tested. The results of this study confirm the observations of resource managers that

79
some hybrid watermilfoil populations do not have the same response to herbicides as
Eurasian watermilfoil.
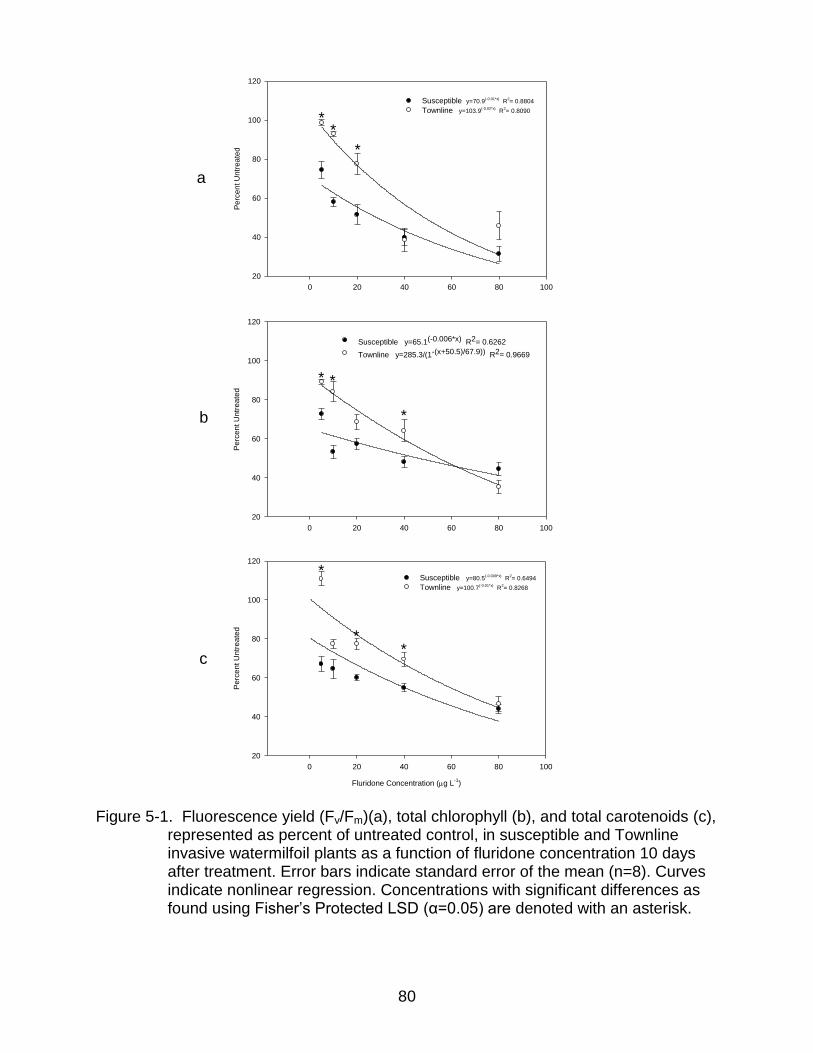
80
Figure 5-1. Fluorescence yield (Fv/Fm)(a), total chlorophyll (b), and total carotenoids (c), represented as percent of untreated control, in susceptible and Townline invasive watermilfoil plants as a function of fluridone concentration 10 days after treatment. Error bars indicate standard error of the mean (n=8). Curves indicate nonlinear regression. Concentrations with significant differences as found using Fisher‟s Protected LSD (α=0.05) are denoted with an asterisk.
0 20 40 60 80 100
Pe
rce
nt U
ntr
ea
ted
20
40
60
80
100
120
Susceptible y=70.9(-0.01*x)
R2= 0.8804
Townline y=103.9(-0.02*x)
R2= 0.8090
*
**
0 20 40 60 80 100
Perc
ent U
ntr
eate
d
20
40
60
80
100
120
Susceptible y=65.1(-0.006*x) R2= 0.6262
Townline y=285.3/(1-(x+50.5)/67.9)) R2= 0.9669
*
**
Fluridone Concentration (g L-1
)
0 20 40 60 80 100
Pe
rce
nt U
ntr
ea
ted
20
40
60
80
100
120
Susceptible y=80.5(-0.009*x)
R2= 0.6494
Townline y=100.7(-0.01*x)
R2= 0.8268
**
*
a
b
c

81
Figure 5-2. Fluorescence yield (Fv/Fm)(a), total chlorophyll (b), and total carotenoids (c), represented as percent of the untreated control, in susceptible and Townline invasive watermilfoil plants as a function of norflurazon concentration 10 days after treatment. Error bars indicate standard error of the mean (n=8). Curves indicate nonlinear regression. Concentrations with significant differences as found using Fisher‟s Protected LSD (α=0.05) are denoted with an asterisk.
0 20 40 60 80 100
Pe
rce
nt U
ntr
ea
ted
20
40
60
80
100
120
140
160
Susceptible y=105.9(-0.006*x)
R2=0.9851
Townline y=106.9(-0.005*x)
R2=0.8105
*
0 20 40 60 80 100
Pe
rce
nt U
ntr
ea
ted
20
40
60
80
100
120
140
160
Susceptible y=99.5(-0.01*x)
R2= 0.8785
Townline y=161.9(-0.02*x)
R2= 0.9659
*
**
*
Norflurazon Concentration (g L-1
0 20 40 60 80 100
Pe
rce
nt U
ntr
ea
ted
20
40
60
80
100
120
140
160
Susceptible y=90.2(-0.008*x) R2= 0.8727
Townline y=149.6/(1+(-(x-47.9)/-23.3))
R2= 0.9632
**
*
*
*
a
b
c

82
Figure 5-3. Fluorescence yield (Fv/Fm)(a), total chlorophyll (b), and total carotenoids (c), represented as percent of the untreated control, in susceptible and Townline invasive watermilfoil plants as a function of topramezone concentration 10 days after treatment. Error bars indicate standard error of the mean (n=8). Curves indicate nonlinear regression. Concentrations with significant differences as found using Fisher‟s Protected LSD (α=0.05) are denoted with an asterisk.
0 20 40 60 80 100
Perc
ent U
ntr
eate
d20
40
60
80
100
120
140
Susceptible y=102.1(-0.01*x) R2= 0.9760
Townline y=103.1/(1+(-(x-74.9)/-18.6)) R2= 0.9984
***
0 20 40 60 80 100
Perc
ent U
ntr
eate
d
20
40
60
80
100
120
140
Susceptible y=92.8(-0.008*x) R2= 0.9010
Townline y=106.9/(1+(-(x-84.9)/-16.8)) R2= 0.9246
**
*
Topramezone Concentration (g L-1
)
0 20 40 60 80 100
Pe
rce
nt U
ntr
ea
ted
20
40
60
80
100
120
140
Susceptible y=87.8(-0.008*x)
R2
= 0.7946
Townline y=104.5/(1+(-(x-84.5)/-11.5)
) R2
= 0.9376
*
*
* *
a
b
c

83
CHAPTER 6 CONCLUSIONS
Invasive watermilfoils grow rapidly and overtake water bodies through
displacement of native vegetation, inhibition of recreational use and obstruction of
natural water flow. Within the past 10-15 years genetically verified hybrids of the native
Northern watermilfoil (M. sibiricum Kom.) and the exotic invasive Eurasian watermilfoil
(M. spicatum L.) have been documented in the Midwestern United States. The hybrid
exhibits the invasive characteristics of Eurasian watermilfoil, thus requiring a similar
level of control. A number of herbicides have been used to control both the hybrid and
Eurasian watermilfoils, with the herbicide fluridone being a common choice by water
managers due to low use rates and minimal damage to desirable native plants.
Fluridone herbicide was also used extensively for hydrilla (Hydrilla verticillata [L.f.]
Royle) management in Florida, but the development of wide-spread resistance has
eliminated effectiveness.
In May 2010, a lake containing a documented hybrid watermilfoil was treated with
fluridone. The population of watermilfoil on this lake, Townline, survived normally lethal
rates of fluridone, raising serious concerns that fluridone resistance or tolerance has
developed in another submersed aquatic species. However, confirmation and
characterization of this phenomenon is needed. To characterize the level of resistance
or tolerance, suspected tolerant Townline plants and susceptible populations were
evaluated over a range of fluridone concentrations in both mesocosm and laboratory
studies. Mesocosm growth studies confirmed increased tolerance to fluridone as
compared to susceptible populations. A pulse-amplitude modulated (PAM) fluorometer
was used to measure fluorescence of treated plants in an attempt to develop a less time

84
consuming method of fluridone resistance confirmation. Pigment analysis of chlorophyll
and carotenoids confirmed the results of the PAM fluorometer and results were
comparable to those found utilizing biomass experimentation.
These studies demonstrate the utility of PAM fluorometery in detecting plant
tolerance to fluridone herbicide, and this method may be useful for detecting differences
with other herbicides. Confirmed fluridone tolerant hybrid watermilfoil plants were found
to also be tolerant to topramezone herbicide, which has a similar mode of activity but
different mechanism of action than fluridone, and norflurazon herbicide, which acts on
the same enzyme as fluridone. This indicates a different mechanism of resistance or
tolerance in this population of hybrid watermilfoil than was found in hydrilla. This
research has confirmed, characterized, and documented a herbicide tolerant hybrid
watermilfoil population from Townline Lake. This finding raises serious concerns with
management of this species, therefore, it is imperative that resource managers actively
limit the spread of this plant.

85
LIST OF REFERENCES
Aiken, S. G. 1980. A conspectus of Myriophyllum (Haloragaceae) in North America. Brittonia 33:57-69.
Alwin, T.G., M.G. Fox and K. S. Cheruvelil. 2010. Estimating lake-wide watermilfoil weevil (Euhrychiopsis lecontei) density: the roles of quadrat size, sample size, and effort. J. Aquat. Plant Manage. 48:96-102.
Arias, R.S., M.D. Netherland, B.E. Scheffler, A. Puri and F.E. Dayan. 2005. Molecular evolution of herbicide resistance to phytoene desaturase inhibitors in Hydrilla verticillata and its potential use to generate herbicide-resistant crops. Pest Manage. Sci. 61:258-268.
Beer, S., M. Ilan, A. Eschel, A. Weil and I. Brickner. 1998. Use of pulse-amplitdue modulated(PAM) fluoromtery for in situ measurements of photosynthesis in two Red Sea faviid corals. Mar. Biol. 131:607-612.
Blackburn, R.D. and L.W. Weldon. 1967. Eurasian watermilfoil- Florida‟s new underwater menace. J. Aquat. Plant Manage. 6:15-18.
Bohlhar-Nordenkampf, H.R., S.P. Long, N.R. Baker, G. Oquist, U. Schreibers and E.G. Lechner. 1989. Chlorophyll fluorescence as a probe of the photosynthetic competence of leaves in the field: a review of current instrumentation. Funct. Ecol. 3:497-514.
Bowes. G, T.K. Van, L.A. Garrard and W.T. Haller. 1977. Adaptation to low light levels by hydrilla. J. Aquat. Plant Manage. 15:32-35.
Bowes. G., A.S. Holaday and W.T. Haller. 1979. Seasonal variation in the biomass, tuber density, and photosynthetic metabolism of hydrilla in three Florida lakes. J. Aquat. Plant Manage. 17:61-65.
Bultemeier, B. W. 2008. The response of three cabomba populations to herbicides and environmental parameters: implications for taxonomy and management [dissertation]. Gainesville, Florida. University of Florida.
Cal-IPC. 2011. California Invasive Plant Council. (http://www.cal-ipc.org, 15 February 2011). California Invasive Plant Council, Berkley, CA 94709 USA.
Chamovitz, D., G. Sandmann and J. Hirschberg. 1993. Molecular and biochemical characterization of herbicide-resistant mutants of cyanobacteria reveals that phytoene desaturation is a rate-limiting step in carotenoid biosynthesis. J. Biol. Chem. 268:17348-17353.
Coffey, B.T. and C.D. McNabb. 1974. Eurasian watermilfoil in Michigan. Mich. Bot. 13:159-165.

86
Crow, G.E. and C.B. Helquist. 2002. Aquatic and wetland plants of northeastern North America. Volume one: pteridophytes, gymnosperms, and angiosperms: dicotyledons. University of Wisconsin press, Madison, WI. 480 pages.
Crowel, W.J., N.A. Proulx and C.H. Welling. 2006. Effects of repeated fluridone treatments over nine years to control Eurasian watermilfoil in a mesotrophic lake. J. Aquat. Plant Manage. 44: 133-136.
Durako, M.J. and J.I. Kunzelman. 2002. Photosynthetic characteristics of Thalassia testudinum measured in situ by pulse-amplitude modulated (PAM) fluorometery: methodological and scale-based considerations. J. Aquat. Bot. 73:173-185.
Forney, D. R. and D. E. Davis. 1981. Effects of low concentrations of herbicides on submersed aquatic plants. Weed Sci. 29:677-685.
Getsinger, K. D., J. D. Madsen, T. J. Koschnick, M. D. Netherland, R. M. Stewart, D.R. Honnel, A.G. Staddon and C.S. Owens. 2001. Whole lake applications of Sonar for selective control of Eurasian watermilfoil. Technical Report TR-07-1, U.S.Army Engineer Waterways Experiment Station, Vicksburg, M.S. 37pp.
Getsinger, K.D., J.D. Madsen, T.J. Koschnick and M.D. Netherland. 2002a. Whole lake fluridone treatments for selective control of Eurasian watermilfoil: I. Application strategy and herbicide residues. Lake Reserv. Manage. 18:181-190.
Getsinger, K.D., R.M. Stewart, J.D. Madsen, A.S. Way, C.S. Owens, H.A. Crosson and A.J. Burns. 2002b. Use of whole-lake fluridone treatments to selectively control Eurasian watermilfoil in Burr Pond and Lake Hortonia, Vermont. Technical Report TR-02-39, U.S. Army Engineer Waterways Experiment Station, Vicksburg, MS 79pp.
Glomski, L.M. and M.D. Netherland. 2010. Response of Eurasian and hybrid watermilfoil to low use rates and extended exposures of 2,4-D and triclopyr. J. Aquat. Plant Manage. 48:12-14.
Grace, J.B. and R.G. Wetzel. 1978. The production biology of Eurasian watermilfoil (Myriophyllum spicatum L.): A review. J. Aquat. Plant Manage. 16:1-11.
Green, W.R. and H.E. Westerdahl. 1990. Response of Eurasian watermilfoil to 2,4-D concentration and exposure times. J. Aquat. Plant Manage. 28:27-32.
Haller, W.T., A.M. Fox and D.G. Shilling. 1990. Hydrilla control program in the upper St. Johns River, Florida, USA. Proc. Eur. Weed Res. Soc. Symp. Aquat. Weeds. 8:111-116.
Haller, W.T. and D. L. Sutton. 1973. Factors affecting the uptake of endothall-14C by hydrilla. Weed Sci. 21:446-448.

87
Haynes, D., P. Ralph, J. Prange and B. Dennison. 2000. The impact of the herbicide diuron on photosynthesis in three species of tropical seagrass. Mar.Pollut. Bull. 41:288-293.
Hiscox, J.D. and G.F. Israelstam. 1979. A method for the extraction of chlorophyll from leaf tissue without maceration. Can. J. Bot. 57:1332-1334.
Holaday, A. S. and G. Bowes. 1980. C4 acid metabolism and dark CO2 fixation in a submersed aquatic macrophyte (Hydrilla verticillata). Plant Physiol. 65:331-335.
Ireland, C.R., M.P. Percival and N.R. Baker. 1986. Modification of the induction of photosynthesis in wheat by glyphosate, an inhibitor of amino acid metabolism. J. Ex. Bot. 37:299-308.
Iriyama, K., Ogura, N. and Takamiya, A. 1974. A simple method for extraction and partial purification of chlorophyll from plant material using dioxane. J. Biochem. 76:901-904.
ISDA, 2011. Idaho Invasive Species Council. (http:// www.agri.state.id.us/Categories/Environment/InvasiveSpeciesCouncil/indexInvSpCouncil.php, 15 February 2011). Idaho State Department of Agriculture, Boise, ID 83701 USA.
Jacono, C. J. and M.M. Richerson. 2011. Myriophyllum spicatum. United States Geological Service Nonindigenous Aquatic Species Database. Gainesville, FL.
Juneau, P., D. Dewez, S. Matsui, S. Kim and R. Popovic. 2001. Evaluation of different algal species sensitivity to mercury and metolachlor by PAM-fluorometry. Chemosphere 45:589-598.
Kamermans, P., M.A. Hemminga and D. J. deJong. 1999. Significance of salinity and silicon levels for growth of a formerly estuarine eelgrass (Zostera marina) population. Mar. Biol. 133:527-539.
Kane, M.E. and E. F. Gilman. 1991. In vitro propagation and bioassay systems for evaluating growth regulator effects on Myriophyllum species. J. Aquat. Plant Manage. 29:29-32.
Kelting, D.L. and C.L. Laxson. 2010. Cost and effectiveness of hand harvesting to control the Eurasian watermilfoil population in Upper Saranac Lake, New York. J. Aquat. Plant Manage. 48:1-5.
Les, D. H. and L.J. Mehroff. 1999. Introduction of nonindigenous aquatic vascular plants in southern New England: a historical perspective. Biological Invasions 1:281-300.
MacDonald, G.E., D.G. Shilling, R.L. Doong and W.T. Haller. 2003. Effects of fluridone on hydrilla growth and reproduction. J. Aquat. Plant Manage. 31:195-198.
88
MacKinney, G. 1941. Absorption of light by chlorophyll solutions. J. Biol. Chem. 140:315-322.
Madsen, J.D. 2009a. Chapter 1: Impact of invasive aquatic plants on aquatic biology, pp.1-8. In: Biology and control of aquatic plants: a best management practices handbook (Gettys, L.A., W. T. Haller and M. Bellaud, eds.) Aquatic Ecosystem Restoration Foundation, Marietta, GA. 210 pages.
Madsen, J. D. 2009b. Chapter 13.2: Eurasian watermilfoil, pp.95-98. In: Biology and control of aquatic plants: a best management practices handbook (Gettys, L.A., W. T. Haller and M. Bellaud, eds.) Aquatic Ecosystem Restoration Foundation, Marietta, GA. 210 pages.
Madsen, J.D., L.W. Eichler and C.W. Boylen. 1988. Vegetative spread of Eurasian watermilfoil in Lake George, New York. J. Aquat. Plant Manage. 26:47-50.
Madsen, J.D., J.W. Sutherland, J.A. Bloomfield, L.W. Eichler and C.W. Boylen. 1991. The decline of native vegetation under dense Eurasian watermilfoil canopies. J. Aquat. Plant Manage. 29:94-99.
McCowen, M.C., C.L. Young, S.D. West, S.J. Parka and W.R. Arnold. 1979. Fluridone, a new herbicide for aquatic plant management. J. Aquat. Plant Manage. 17:27-30.
Michel, A., R.S. Arias, B.E. Scheffler, S.O. Duke, M.D. Netherland and F.E. Dayan. 2004. Somatic mutation-mediated evolution of herbicide resistance in the nonindigenous invasive plant hydrilla (Hydrilla verticillata). Mol. Ecol. 13:3229-3237.
Moody, M. L. and D.H. Les. 2002. Evidence of hybridity in invasive watermilfoil (Myriophyllum) populations. P. Natl. Acad. Sci. USA 99:14867-14871.
Moody, M.L. and D.H. Les. 2007. Geographic distribution and genotypic composition of invasive hybrid watermilfoil (Myriophyllum spicatum x M. sibiricum) populations in North America. Biol. Invasions 9:559-570.
Moody, M. L. and D. H. Les. 2010. Systematic of the aquatic angiosperm genus Myriophyllum (Haloragaceae). Syst. Bot. 35:121-139.
Moran, R. and Porath, D. 1979. Chlorophyll determination in intact tissue using N,N-dimethylformamide. Plant Physiol. 65:478-479.
Netherland, M.D. and K.D. Getsinger. 1992. Efficacy of triclopyr on Eurasian watermilfoil: concentration and exposure time effects. J. Aquat. Plant Manage. 30:1-5.
Netherland, M.D. and K.D. Getsinger. 1995. Laboratory evaluation of threshold fluridone concentrations under static conditions for controlling hydrilla and Eurasian watermilfoil. J. Aquat. Plant Manage. 33:33-36.

89
Netherland, M.D., K.D. Getsinger and J.D. Skogerboe. 1997. Mesocosm evaluation of the species-selective potential of fluridone. J. Aquat. Plant Manage. 35:41-50.
Netherland, M.D., K.D. Getsinger and E. G. Turner. 1993. Fluridone concentration and exposure time requirements for control of hydrilla and Eurasian watermilfoil. J. Aquat. Plant Manage. 32:189-194.
Neve, P. and Powles, S. 2005. High survival frequencies at low herbicide use rates in populations of Lolium rigidum result in rapid evolution of herbicide resistance. Heredity 95:485-492.
Newman, R.M., D.W. Ragsdale, A. Milles and C.Oien. 2001. Overwinter habit and the relationship of overwinter to in-lake densities of the milfoil weevil, Euhrychiopsis lecontei, a Eurasian watermilfoil biological control agent. J. Aquat. Plant Manage. 39:63-67.
Nichols, S.A. 1992. Depth, substrate, and turbidity relationships of some Wisconsin lake plants. Trans. Wisc. Acad. Sci. Arts Lett. 80: 97-118.
Papageorgiu, G. 1975. Chlorophyll fluorescence. pp 320-366. An intrinsic probe of photosynthesis. In: Bioenergetics of photosynthesis (J. Amesz Govindjee ed.) Academic Press, New York, NY.
Poovey, A.G., J.G. Slade and M.D. Netherland. 2007. Susceptiblity of Eurasian watermilfoil (Myriophyllum spicatum) and a milfoil hybrid (M. spicatum x M. sibiricum) to triclopyr and 2, 4-D amine. J. Aquat. Plant Manage. 45:111-115.
Prins, H.B. and J.T. Elezenga. 1989. Bicarbonate utilization: function and mechanism. Aquat.Bot. 34:59-83.
Puri, A. W. T. Haller, and M. D. Netherland. 2009. Cross-resistance in fluridone-resistant hydrilla to other bleaching herbicides. Weed Sci. 57:482-488.
Puri, A., G.E. MacDonald, W.T. Haller and M.Singh. 2006. Phytoene and β-carotene response of fluridone-susceptible and –resistant hydrilla (Hydrilla verticillata) biotypes to fluridone. Weed Sci. 54:995-999.
Ralph, P. J., R. Gademann and W. C. Dennison. 1998. In situ seagrass photosynthesis measured using a submersible, pulse-amplitude modulated fluorometer. Mar. Biol. 132:367-373.
Reed, C.F. 1977. History and distribution of Eurasian watermilfoil in the United States and Canada. Phytologia 36:416-436.
Roley, S.S. and R.M. Newman. 2008. Predicting Eurasian watermilfoil invasions in Minnesota. Lake Reserv. Manage. 24:361-369.
90
Rosine, W. N. 1955. The distribution of invertebrates on submerged aquatic plant surfaces in Muskee Lake, Colorado. Ecology 36:308-314.
Rozas, L.P. and W.E. Odum. 1988. Occupation of submerged aquatic vegetation by fishes: testing the roles of food and refuge. Oecologia 77:101-106.
Schmitz, D.C., A.J. Leslie, L.E. Nall and J. A. Osborne. 1987. Hydrosoil residues and Hydrilla verticillata control in a central Florida lake using fluridone. Pest. Sci. 21:73-82.
Schmitz, D.C. and J.A. Osborne. 1984. Zooplankton densities in a Hydrilla infested lake. Hydrobiologia. 111:127-132.
Sculthorpe, C. D. 1967. The biology of aquatic vascular plants. Edward Arnold Publishers, London, England. 610 pages.
Selim, S.A., S.W. O‟Neal, M.A. Ross and C.A. Lembi. 1989. Bioassay of photosynthetic inhibitors in water and aqueous soil extracts with Eurasian watermilfoil (Myriophyllum spicatum). Weed Sci. 37:810-814.
Senseman, S.A. (ed.). 2007. Herbicide Handbook. 9th ed. Lawrence, KS: Weed Science Society of America.
Smith, C.S. and J.W. Barko. 1990. Ecology of Eurasian watermilfoil. J. Aquat. Plant Manage. 28:55-64.
Spencer, D. F. and G. G. Ksander. 1987. Comparison of three methods for extracting chlorophyll from aquatic macrophytes. J. Freshwater Ecol. 4:201-208.
Sprecher, S. L., M.D. Netherland and A.B. Stewart. 1998. Phytoene and carotene response of aquatic plants to fluridone under laboratory conditions. J. Aquat. Plant Manage. 36:111-120.
Stanley, R.A. 1970. Studies on nutrition, photosynthesis, and respiration in Myriophyllum spicatum L. Ph.D. Dissertation, Duke Univ., N. Carolina. 128 pages.
Stanley, R.A. and A.W. Naylor. 1972. Photosynthesis in Eurasian watermilfoil (Myriophyllum spicatum L.). Plant Physiol. 50:149-151.
Steemann Nielsen, E. 1947. Photosynthesis of aquatic plants with special reference to carbon sources. Dansk Bot. Ark. 12(8). 77 pages.
Stroganov, N.S. 1963. The food selectivity of the amur fishes. ppgs 181-191 In: Conference on fishery exploitation of the phytophagus fishes of the USSR. Ashkhabad Academy of Science, Turkmen Soviet Socialist Republic.

91
Sturtevant, A. P., N. Hatley, G.D. Pullman, R. Sheick, D. Shorez, A. Bordine, R. Mausolf, A. Lewis, R. Sutter and A. Mortimer. 2009. Molecular characterization of Eurasian watermilfoil, northern watermilfoil, and the invasive interspecific hybrid in Michigan lakes. J. Aquat. Plant Manage. 47:128-135.
Thum, R.A., M. Heilman, P. Hausler, L. Huberty, P. Tyning, D. Wcisel, M. Zuellig, S. Berger and M. Netherland. Field and laboratory documentation of reduced fluridone sensitivity by a hybrid watermilfoil biotype. Submitted to J. Aquat. Plant Manage.
UF, CAIP (University of Florida, Center for Aquatic and Invasive Plants). 2011. The Center for Aquatic and Invasive Plants. (http://plants.ifas.ufl.edu, 15 February 2011). Center for Aquatic and Invasive Plants, Gainesville, FL 32653 USA.
USDA, NRCS (United States Department of Agriculture, Natural Resources Conservation Service). 2011. The PLANTS database. (http://plants.usda.gov, 2 February 2011). National Plant Data Center, Baton Rouge, LA 70874-4490 USA.
Valley, R.D., T.K. Cross and P. Radmonski. 2004. The role of submersed aquatic vegetation as habitat for fish in Minnesota lakes, including the implications of non-native plant invasions and their management. Minnesota Department of Natural Resources. Special Publication 160.
Van, T.K., W.T. Haller and G. Bowes. 1976. Comparison of the photosynthetic characteristics of three submersed aquatic plants. Plant Physiol. 58:761-768.
Waldrep, T.W. and H.M. Taylor. 1976. 1-Methyl-3-phenyl-5-[3-trifluoromethyl)phenyl]-4(1H)-pyridinone, a new herbicide. J. Agr. Food Chem. 24:1250-1251.
Wellburn, A.R. 1994. The spectral determination of chlorophylls a and b, as well as total carotenoids, using various solvents with spectrophotometers of different resolution. J. Plant Physiol. 144:307-313.
Wilde, S.B., T.M. Murphy, C.P. Hope, S.K. Habrun, J. Kempton, A. Birrenkott, F. Wiley, W. W. Bowerman and A.J. Lewitus. 2005. Avian vacuolar myelinopathy linked to exotic aquatic plants and a novel cyanobacterial species. Environ. Toxicol. 20:348-353.
[WSSA] Weed Science Society of America. 1998. “Herbicide resistance” and “herbicide tolerance” defined. Weed Technol. 12:789.
Yu, D., W. Dong, L. Zhen-Yu and M. M. Funston. 2002. Taxonomic revision of the genus Myriophyllum (Haloragacea) in China. Rhodora 104:396-421.

92
BIOGRAPHICAL SKETCH
Sarah Berger was born in Fremont, Ohio in 1984 to William and Patricia Berger.
After graduating salutatorian from Fremont Ross High School in 2002 she attended
Ohio Northern University in Ada, Ohio. Sarah received a Bachelor of Science degree
majoring in biology and environmental studies in 2007. She then pursued a master‟s
degree beginning in the summer of 2009 at the University of Florida. Upon graduation in
2011, Sarah began to pursue a doctor of philosophy degree in Agronomy at the
University of Florida.