characterization of dried and torrefied arundo donax ... · summary ... 14 cross-section for...
TRANSCRIPT

PNNL-21690
Prepared for the U.S. Department of Energy under Contract DE-AC05-76RL01830
Characterization of Dried and Torrefied Arundo Donax Biomass for Inorganic Species Prior to Combustion J Matyáš BR Johnson JE Cabe August 2012

PNNL-21690
Characterization of Dried and Torrefied Arundo Donax Biomass for Inorganic Species Prior to Combustion J Matyáš BR Johnson JE Cabe August 2012 Prepared for the U.S. Department of Energy under Contract DE-AC05-76RL01830 Pacific Northwest National Laboratory Richland, Washington 99352

iii
Summary
Portland General Electric (PGE) potentially plans to replace the coal feedstock with torrefied Arundo donax (giant cane) for their Boardman coal-fired power plant by 2020. Since there is only a limited amount of experience with this high yield energy crop and its combustion for the generation of power, PGE would like to characterize dried and torrefied Arundo donax before a test burn and therefore avoid possible ash related operational problems such as slagging, deposit formation and corrosion.
This report describes the results from characterization of ground and cross-sectioned samples of dried and torrefied Arundo donax biomass with high-resolution scanning electron microscopy (SEM), and energy dispersive spectroscopy (EDS), and also includes analytical results from a short water-leaching test for concentrations of Ca, Mg, K, Na, S, and Cl in the non-leached and leached Arundo donax and leachates.
SEM-EDS analysis of torrefied Arundo donax revealed that condensation of volatile components K, Cl, and S during torrefaction can result in their undesirable re-deposition on the outside surfaces in the form of amorphous or crystallized clusters of salts KCl and K2SO4 with a size from a few micrometers to as large as 100 µm. A short exposure of Arundo donax to water resulted in an efficient removal of volatile species from the dried and torrefied Arundo donax, e.g., ~98 wt% of total K and Cl, and ~75 wt% of total S were removed from dried Arundo donax, and more than 90 wt% of total K and Cl, and 70 wt% of S from torrefied Arundo donax, suggesting that water-leaching of Arundo donax before combustion can be an effective pre-treatment method because high concentrations of Cl increase emissions of HCl, and in combination with K can form large amounts of KCl deposits on boiler surfaces and in combination with H2O or SO3 cause corrosion.


v
Contents
Summary ............................................................................................................................................... iii 1.0 Introduction .................................................................................................................................. 1
2.0 Material ......................................................................................................................................... 1
3.0 Experimental Methods .................................................................................................................. 1
3.1 SEM-EDS Analysis .............................................................................................................. 1
3.2 Leaching Test ....................................................................................................................... 2
4.0 Results .......................................................................................................................................... 4
4.1 Chemical Analysis of Arundo Donax .................................................................................. 4
4.2 SEM-EDS Analysis .............................................................................................................. 5
5.0 Conclusion .................................................................................................................................... 14
6.0 References .................................................................................................................................... 14
Figures
1 Optical Images of As-Received Dried and Torrefied Arundo Donax ........................................... 2
2 Optical Images of Ground Dried and Torrefied Arundo Donax ................................................... 2
3 SEM Images of K, Cl, and S-Rich Deposits on a Backbone of Ground Torrefied Arundo Donax ............................................................................................................................................ 6
4 SEM Image of K, Cl, and S-Rich Deposits on a Backbone of Ground Torrefied Arundo Donax ............................................................................................................................................ 7
5 SEM Image of KCl Condensate on a Backbone of Ground Torrefied Arundo Donax ................. 7
6 SEM Image of K, Cl, and S-Rich Deposits on a Backbone of Ground Torrefied Arundo Donax ............................................................................................................................................ 8
7 Elemental Dot Map of K, Cl, S-Rich Deposits for Ground Torrefied Arundo Donax .................. 9
8 SEM Image of a Backbone for Ground Dried Arundo Donax ...................................................... 9
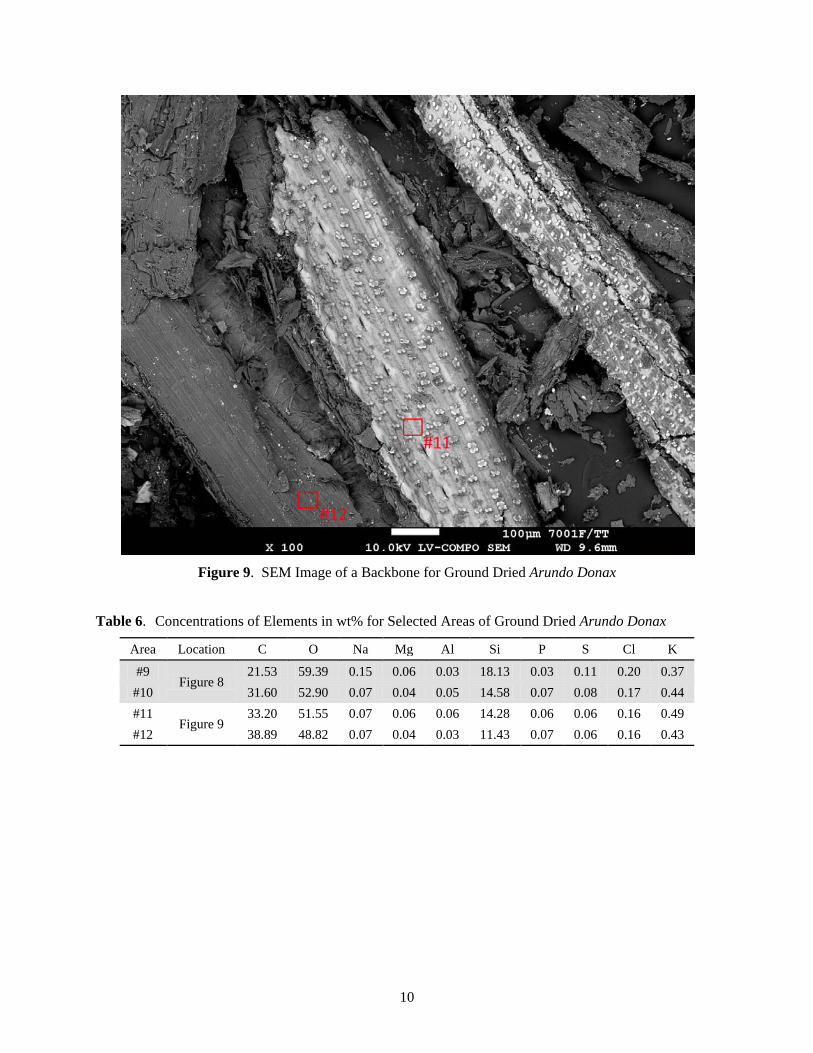
9 SEM Image of a Backbone for Ground Dried Arundo Donax ...................................................... 10
10 Cross-Section for As-Received Torrefied Arundo Donax (inside) ............................................... 11
11 Cross-Section for As-Received Torrefied Arundo Donax (side) .................................................. 11
12 Elemental Dot Map of SiO2 Skin in As-Received Torrefied Arundo Donax................................ 12
13 Cross-Section for As-Received Dried Arundo Donax (inside) ..................................................... 12
14 Cross-Section for As-Received Dried Arundo Donax (top skin) .................................................. 13
15 Cross-Section for As-Received Dried Arundo Donax (detail of top skin) .................................... 13

vi
Tables
1 Theorerical and Measured Concentrations in mg/kg and Percent Recoveries for Ca, Mg, P, K, Na, S, and Cl in the Lab Control Samples ............................................................................... 3
2 Theoretical and Measured Concentrations in mg/kg and Percent Recoveries for Ca, Mg, K, Na, S, and Cl in the Aqueous Lab Control Samples ..................................................................... 3
3 Concentrations of Ca, Mg, P, K, S, and Cl in mg/kg in the Dried and Torrefied Arundo Before and After Leaching in DIW .............................................................................................. 4
4 Concentrations of Ca, Mg, P, K, S, and Cl in mg/kg in the Leachates from Dried and Torrefied Arundo .......................................................................................................................... 4
5 Concentrations of Elements in wt% for Selected Areas of Ground Torrefied Arundo Donax ............................................................................................................................... 8
6 Concentrations of Elements in wt% for Selected Areas of Ground Dried Arundo Donax ........... 10

1
1.0 Introduction
Portland General Electric (PGE) potentially plans to replace the coal feedstock with torrefied biomass for their Boardman coal-fired power plant by 2020 or shut the plant down. They are considering Arundo donax (giant cane) as a fuel because of its high yield of 20–25 tons per acre (BG&E 2007), rapid growth of 5–10 cm per day (BG&E 2007; Quinn and Holt 2003), and high energy content of torrefied Arundo donax 10,000 Btu per pound (Lei 2012). But this herbaceous crop has the potential for high ash content, which can lead to problems in combustion, gasification, and pyrolysis (Dahl and Obernberger 2004). Since there is only a limited amount of experience with combusting or thermally deconstructing this high yield energy crop, PGE would like to characterize Arundo donax before a test burn and therefore avoid possible ash related operational problems such as slagging, deposit formation and corrosion.
This report describes the results from characterization of dried and torrefied Arundo donax samples with high-resolution scanning electron microscopy and energy dispersive spectroscopy (SEM-EDS). In addition, a short water-leaching test was performed at room temperature to determine the quantities of problematic elements, such as Ca, Mg, K, Na, S, and Cl, that can be removed from dried and torrefied Arundo donax before combustion.
2.0 Material
Idaho National Laboratory provided samples of dried and torrefied Arundo donax. Dried Arundo donax was produced from raw Arundo donax by a two-step process: grinding with a hammer mill and drying in a rotary drum dryer at 120°C for 15 min. Dried Arundo donax passed through the screen size of 25.4 mm, had a moisture content 5.11 wt%, and contained 44.97 wt% of carbon (C), 5.58 wt% of hydrogen (H), 1.87 wt% of nitrogen (N), and 47.3 wt% of oxygen (O). Torrefied Arundo donax which had a moisture content 0.63 wt% and contained 56.51, 4.41, 3.01, and 35.89 wt% of H, C, N, O, respectively, was produced by heat-treating a dried Arundo donax in a moving bed reactor at 270°C under N2 for 30 min. Figure 1 shows the morphology of samples for dried (A) and torrefied (B) Arundo donax. A coffee grinder with extra fine setting was used to ground as-received samples to pass through the screen size 1 mm (18 U.S. mesh size) for SEM-EDS analysis and leaching testing. The morphology of ground dried (A) and torrefied (B) Arundo donax is shown in the Figure 2.
3.0 Experimental Methods
3.1 SEM-EDS Analysis
Two sets of samples were investigated with SEM JSM-7001F/TTLS (JEOL Ltd., Tokyo, Japan) equipped with a field emission gun and capable of examining specimens under variable pressure conditions, allowing them to be evaluated without a conductive coating. The first set of samples were ground Arundo donax, which were analyzed directly without any preparation. The second set were cast in epoxy and prepared as polished cross-sections of as-received Arundo donax. The cross-sections were produced by mounting 2-cm straws of dried and torrefied Arundo donax into an epoxy puck, cutting the puck in half with a diamond saw to reveal their cross-sections and then polishing them using 6-, 3-, 1-,

2
and 0.25-µm diamond suspensions. The specimens were sputter-coated with Pd before the analysis. The samples were investigated with secondary electron and backscattered electron detectors to obtain optimum topological as well as atomic number contrast images. Elemental analysis was performed with EDS equipped with a peltier-cooled silicon drift detector (EDAX, Mahwah, New Jersey).
A B
Figure 1. Optical Images of As-Received Dried (A) and Torrefied (B) Arundo Donax (straws passed
through a 25.4-mm screen size)
A B
Figure 2. Optical Images of Ground Dried (A) and Torrefied (B) Arundo Donax (straws passed through
18 U.S. mesh size)
3.2 Leaching Test
Approximately 0.5-g samples of ground dried and torrefied Arundo donax (Samples #1 and #2) were transferred into 50-mL beakers containing 40 mL of deionized water (DIW). Samples were leached at room temperature and under periodic stirring with a glass rod. After 1 h of leaching, the solids were recovered on the filter paper, washed with small amounts of DIW, and dried overnight in the oven at 55 °C (Samples #3 and #4). The leached solutions were transferred into 100-ml volumetric flasks that were filled up to the mark with DIW and then mixed in the shaker for 2 min (Samples #5 and #6).
3
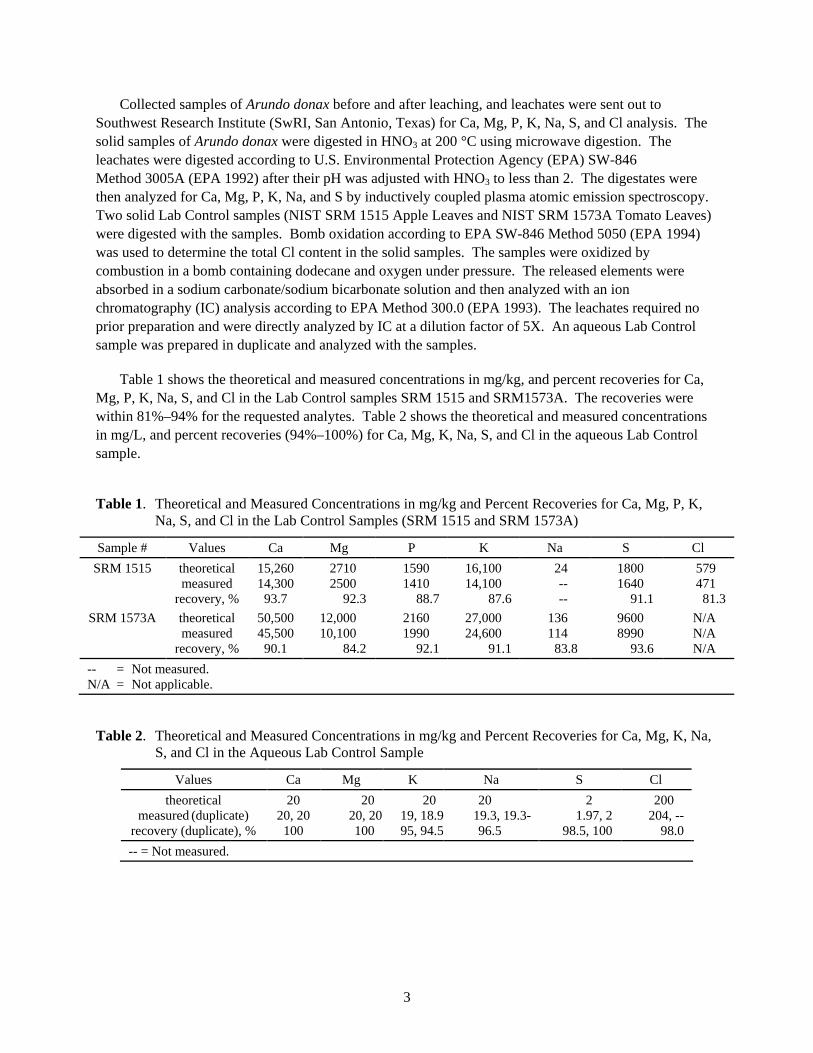
Collected samples of Arundo donax before and after leaching, and leachates were sent out to Southwest Research Institute (SwRI, San Antonio, Texas) for Ca, Mg, P, K, Na, S, and Cl analysis. The solid samples of Arundo donax were digested in HNO3 at 200 °C using microwave digestion. The leachates were digested according to U.S. Environmental Protection Agency (EPA) SW-846 Method 3005A (EPA 1992) after their pH was adjusted with HNO3 to less than 2. The digestates were then analyzed for Ca, Mg, P, K, Na, and S by inductively coupled plasma atomic emission spectroscopy. Two solid Lab Control samples (NIST SRM 1515 Apple Leaves and NIST SRM 1573A Tomato Leaves) were digested with the samples. Bomb oxidation according to EPA SW-846 Method 5050 (EPA 1994) was used to determine the total Cl content in the solid samples. The samples were oxidized by combustion in a bomb containing dodecane and oxygen under pressure. The released elements were absorbed in a sodium carbonate/sodium bicarbonate solution and then analyzed with an ion chromatography (IC) analysis according to EPA Method 300.0 (EPA 1993). The leachates required no prior preparation and were directly analyzed by IC at a dilution factor of 5X. An aqueous Lab Control sample was prepared in duplicate and analyzed with the samples.
Table 1 shows the theoretical and measured concentrations in mg/kg, and percent recoveries for Ca, Mg, P, K, Na, S, and Cl in the Lab Control samples SRM 1515 and SRM1573A. The recoveries were within 81%–94% for the requested analytes. Table 2 shows the theoretical and measured concentrations in mg/L, and percent recoveries (94%–100%) for Ca, Mg, K, Na, S, and Cl in the aqueous Lab Control sample.
Table 1. Theoretical and Measured Concentrations in mg/kg and Percent Recoveries for Ca, Mg, P, K, Na, S, and Cl in the Lab Control Samples (SRM 1515 and SRM 1573A)
Sample # Values Ca Mg P K Na S Cl SRM 1515 theoretical
measured recovery, %
15,260 14,300 93.7
2710 2500
92.3
1590 1410
88.7
16,100 14,100
87.6
24 -- --
1800 1640
91.1
579 471 81.3
SRM 1573A theoretical measured
recovery, %
50,50045,500 90.1
12,000 10,100
84.2
2160 1990
92.1
27,000 24,600
91.1
136 114 83.8
9600 8990
93.6
N/A N/A N/A
-- = Not measured. N/A = Not applicable.
Table 2. Theoretical and Measured Concentrations in mg/kg and Percent Recoveries for Ca, Mg, K, Na, S, and Cl in the Aqueous Lab Control Sample
Values Ca Mg K Na S Cl theoretical
measured (duplicate) recovery (duplicate), %
20 20, 20
100
20 20, 20 100
20 19, 18.9 95, 94.5
20 19.3, 19.3- 96.5
2 1.97, 2
98.5, 100
200 204, --
98.0 -- = Not measured.

4
4.0 Results
4.1 Chemical Analysis of Arundo Donax
Table 3 shows the concentrations of Ca, Mg, P, K, Na, S, and Cl in mg/kg for the ground dried and torrefied Arundo donax before and after leaching in DIW. Torrefied Arundo donax contained slightly higher concentration of K (2.5 wt%) and Cl (0.6 wt%) than dried Arundo donax but the concentration of other elements were similar. Comparing before and after leaching concentrations revealed that a short leaching in water can remove a large fraction of unwanted elements from Arundo donax with higher removal efficiencies observed for dried Arundo donax. About 52 wt% of total Ca, 78 wt% of total Mg, 80 wt% of total P, 98 wt% of total K, 70 wt% of total Na, 75 wt% of total S, and 98 wt% of total Cl was removed from dried Arundo donax, whereas for torrefied Arundo 15 wt% of total Ca, 40 wt% of total Mg, 55 wt% of total P, 91 wt% of total K, 71 wt% of total S, and 97 wt% of total Cl was leached out into water. Highly efficient leaching of elements from dried Arundo donax was validated by Table 4 that shows the concentrations of Ca, Mg, P, K, Na, S, and Cl in mg/kg in the leachates. It is expected that the leaching time can be shortened and leaching rates further increased with water turbulent flow and/or heated water.
A total mass balance (summed-up concentrations of elements in the leached solids and leachates) indicated a good agreement with total concentrations of Ca, Mg, P, K, Na, Cl and S in the non-leached dried or torrefied Arundo donax. The small-scale variations in total concentrations of elements illustrated the accuracy of the analytical methods as shown in the Table 1 and Table 2.
Table 3. Concentrations of Ca, Mg, P, K, S, and Cl in mg/kg in the Dried and Torrefied Arundo Before (1,2) and After Leaching (3,4) in DIW
Sample # Ca Mg P K Na S Cl 1(a) 2750 2110 1590 22500 256 3230 4950 2(b) 2540 2060 1695 25050 238 3095 6045 3(c) 1330 458 321 368 76 801 113 4(d) 2150 1230 756 2340 282 886 200
(a) Dried Arundo before leaching. (b) Torrefied Arundo before leaching. (c) Dried Arundo after leaching. (d) Torrefied Arundo after leaching.
Table 4. Concentrations of Ca, Mg, P, K, S, and Cl in mg/kg in the Leachates from Dried (5) and Torrefied (6) Arundo
Sample # Ca Mg P K Na S Cl 5(a) 1310 1546 1219 20625 130 2323 5807 6(b) 695 917 953 22434 78 2363 6611
(a) Leachate from dried Arundo. (b) Leachate from torrefied Arundo.

5
4.2 SEM-EDS Analysis
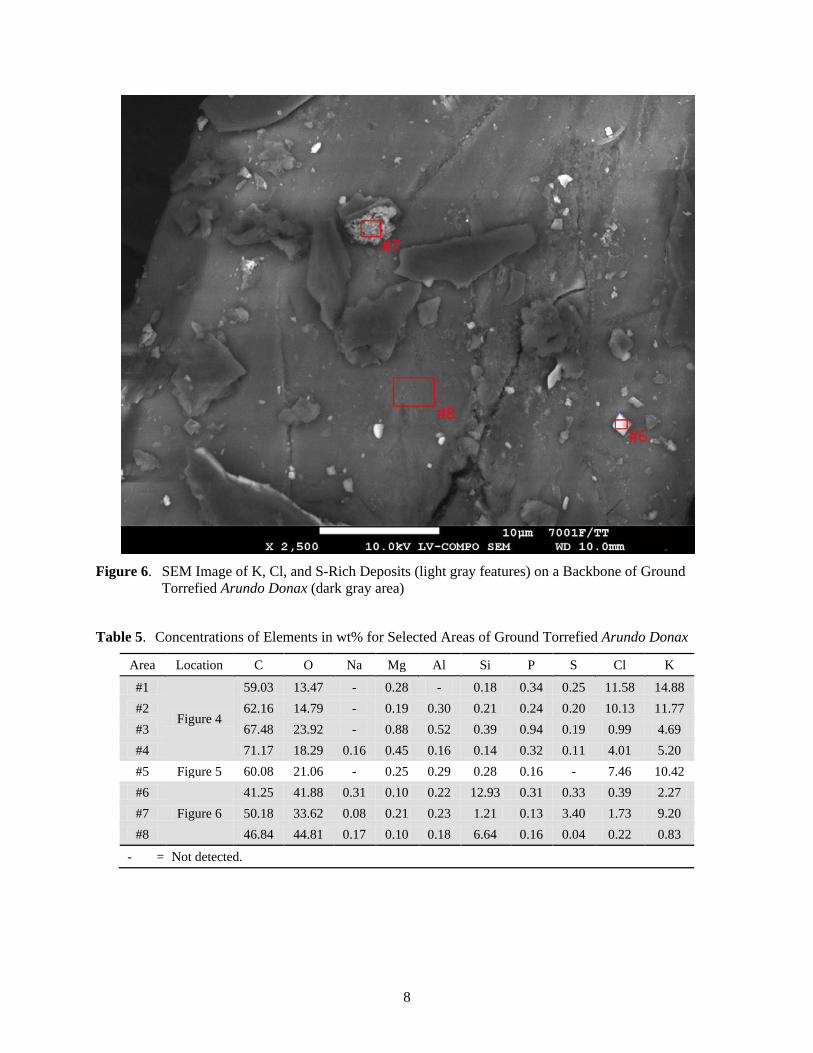
The surfaces of ground torrefied Arundo donax samples were covered by numerous K, Cl, and S-rich amorphous deposits. In contrast, none of these deposits were observed on the surfaces of ground dried Arundo donax samples. This suggests that salt deposits KCl and K2SO4 were formed through condensation of volatile species (K, Cl, and S) during torrefaction. Figure 3–Figure 6 show SEM images with examples of K, Cl, and S-rich deposits on the surfaces of ground torrefied Arundo samples. Table 5 summarizes concentrations of elements in wt% for selected areas in the Figure 3–Figure 6. Figure 7 visualizes a distribution of elements (C, O, Mg, Si, S, Cl, and K) for the deposits in the Figure 3C. Figure 8 and Figure 9 show SEM image of ground dried Arundo samples. Table 6 summarizes the elemental concentrations in wt % for selected areas in the Figure 8 and Figure 9.
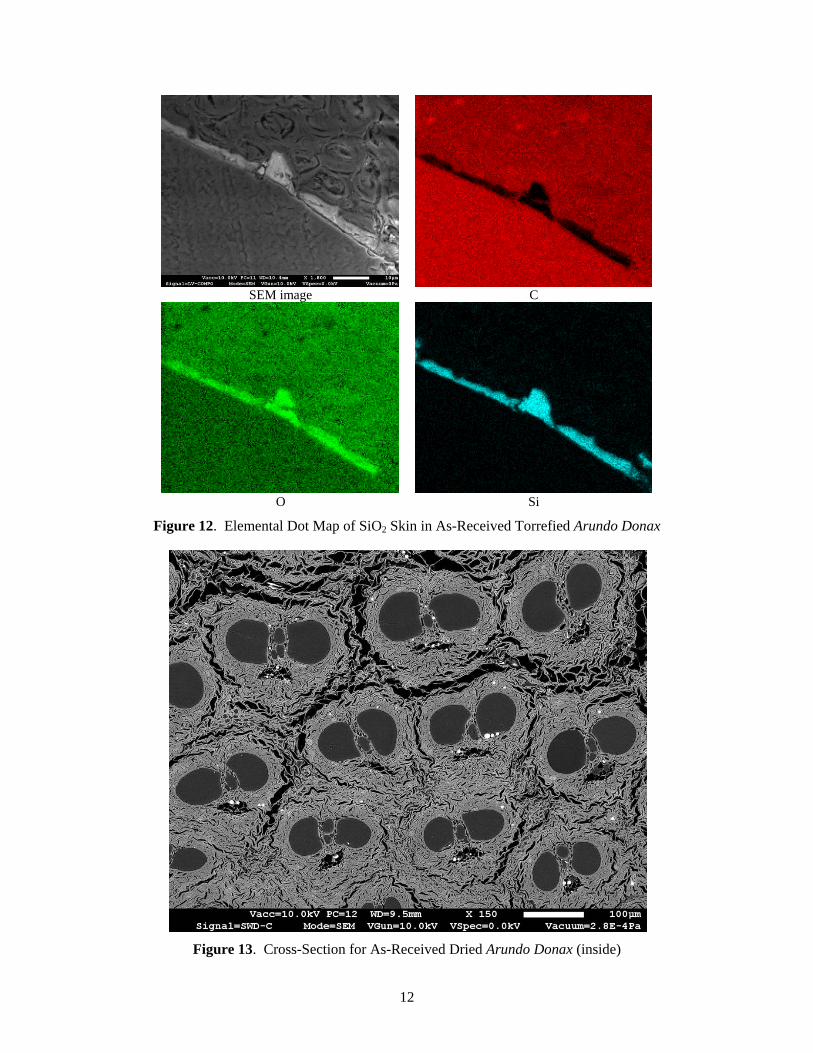
Figure 10 and Figure 11 show an internal structure and layer of silica, respectively, for polished cross-section of torrefied Arundo donax. Figure 12 shows an elemental dot-map visualizing this silica layer. Figure 13 shows the internal structure for polished cross-section of dried Arundo donax. Figure 14 and Figure 15 show a low magnification and close up, respectively, of the top skin for dried Arundo donax. Structural changes were minimal when going from dried to torrefied Arundo donax.

6
A
B
C
Figure 3. SEM Images of K, Cl, and S-Rich Deposits (light gray features) on a Backbone of Ground
Torrefied Arundo Donax (dark gray area); B – magnified red rectangle area in picture A, C - magnified red rectangle area in picture B

7
Figure 4. SEM Image of K, Cl, and S-Rich Deposits (light gray features) on a Backbone of Ground
Torrefied Arundo Donax (dark gray area)
Figure 5. SEM Image of KCl Condensate (white and light gray features) on a Backbone of Ground
Torrefied Arundo Donax (dark gray area)
8
Figure 6. SEM Image of K, Cl, and S-Rich Deposits (light gray features) on a Backbone of Ground
Torrefied Arundo Donax (dark gray area)
Table 5. Concentrations of Elements in wt% for Selected Areas of Ground Torrefied Arundo Donax
Area Location C O Na Mg Al Si P S Cl K
#1
Figure 4
59.03 13.47 - 0.28 - 0.18 0.34 0.25 11.58 14.88 #2 62.16 14.79 - 0.19 0.30 0.21 0.24 0.20 10.13 11.77 #3 67.48 23.92 - 0.88 0.52 0.39 0.94 0.19 0.99 4.69 #4 71.17 18.29 0.16 0.45 0.16 0.14 0.32 0.11 4.01 5.20 #5 Figure 5 60.08 21.06 - 0.25 0.29 0.28 0.16 - 7.46 10.42 #6
Figure 6 41.25 41.88 0.31 0.10 0.22 12.93 0.31 0.33 0.39 2.27
#7 50.18 33.62 0.08 0.21 0.23 1.21 0.13 3.40 1.73 9.20 #8 46.84 44.81 0.17 0.10 0.18 6.64 0.16 0.04 0.22 0.83
- = Not detected.

9
SEM Image C O Mg
Si S Cl K
Figure 7. Elemental Dot Map of K, Cl, S-Rich Deposits for Ground Torrefied Arundo Donax (area inside of red rectangle in Figure 3B)
Figure 8. SEM Image of a Backbone for Ground Dried Arundo Donax
10
Figure 9. SEM Image of a Backbone for Ground Dried Arundo Donax
Table 6. Concentrations of Elements in wt% for Selected Areas of Ground Dried Arundo Donax
Area Location C O Na Mg Al Si P S Cl K
#9 Figure 8
21.53 59.39 0.15 0.06 0.03 18.13 0.03 0.11 0.20 0.37 #10 31.60 52.90 0.07 0.04 0.05 14.58 0.07 0.08 0.17 0.44 #11
Figure 9 33.20 51.55 0.07 0.06 0.06 14.28 0.06 0.06 0.16 0.49
#12 38.89 48.82 0.07 0.04 0.03 11.43 0.07 0.06 0.16 0.43

11
Figure 10. Cross-Section for As-Received Torrefied Arundo Donax (inside)
Figure 11. Cross-Section for As-Received Torrefied Arundo Donax (side)
12
SEM image C
O Si
Figure 12. Elemental Dot Map of SiO2 Skin in As-Received Torrefied Arundo Donax
Figure 13. Cross-Section for As-Received Dried Arundo Donax (inside)

13
Figure 14. Cross-Section for As-Received Dried Arundo Donax (top skin)
Figure 15. Cross-Section for As-Received Dried Arundo Donax (detail of top skin)

14
5.0 Conclusion
Torrefaction, which is a promising method to convert biomass into a high energy density solid biofuel, cannot be efficiently used to significantly reduce concentrations of volatile species such as K, Cl, and S in the Arundo, and therefore mitigate their adverse impact on the heat transfer and corrosion rates in the boiler. However, SEM-EDS analysis of torrefied Arundo donax revealed that during torrefaction, small percentages of K, Cl, and S can volatize out of Arundo donax and can get concentrated due to condensation on the outside surfaces in the form of amorphous or crystallized clusters of salts KCl and K2SO4 with a size of 1–100 µm. Hence, the question arises whether there will be the salt deposits in the reactor after torrefaction.
Our water-leaching test indicated that a short exposure of dried Arundo donax to water prior to torrefaction can drastically decrease concentrations of volatile species K, Cl, and S. In addition, leaching of dried Arundo donax was more efficient that for torrefied Arundo donax. We were able to remove ~98 wt% of total K and Cl, and ~75 wt% of total S from dried Arundo donax compared to 90 wt% of total K and Cl, and 70 wt% of S from torrefied Arundo donax. The leaching time is expected to be shortened and leaching rates further increased with water turbulent flow and/or heated water.
6.0 References
BG&E – Biomass Gas & Electric, LLC. 2007. Why Arundo Donax is Possibly the Finest Bioenergy Crop Available for a Variety of Uses. Accessed August 22, 2012 at http://www.biggreenenergy.com/default.aspx?tabid=4269.
Dahl J and I Obernberger. 2004. “Evaluation of the Combustion Characteristics of Four Perennial Energy Crops (Arundo Donax, Cynara Cardunculus, Miscanthus X Gaganteus, and Panicum Virgatum).” Presented at the 2nd World Conference on Biomass for Energy, Industry and Climate Protection, May 10–14, 2004, Rome, Italy, pp. 1265–1270.
EPA – U.S. Environmental Protection Agency. 1992. Acid Digestion of Waters for Total Recoverable or Dissolved Metals for Analysis by FLAA or ICP Spectroscopy. SW-846 Method 3005A, Rev. 1, Washington, D.C.
EPA – U.S. Environmental Protection Agency. 1993. Determination of Inorganic Anions by Ion Chromatography. SW-846 Method 300.0, Rev. 2.1, Washington, D.C.
EPA – U.S. Environmental Protection Agency. 1994. Bomb Preparation Method for Solid Waste. SW-846 Method 5050, Rev. 0, Washington, D.C.
Lei W. 2012. “Exploring Biomass at Boardman.” Presented at Future Energy Conference, April 25–28, 2012, Portland, Oregon.
Quinn L and J Holt. 2003. “Invasibility of Experimental Riparian Communities by Arundo Donax.” Presented at California Invasive Plant Council Symposium Planning Weed Management for Ecosystem Recovery , October 1-3 2003, University of California, Riverside. Accessed August 22, 2012 at http://www.cal-ipc.org/symposia/archive/pdf/12035.pdf.