physiological and morphological...
TRANSCRIPT

1
PHYSIOLOGICAL AND MORPHOLOGICAL EFFECTS OF HIGH WATER TABLES ON EARLY GROWTH OF GIANT REED (Arundo donax), ELEPHANT GRASS (Pennisetum
purpureum), ENERGYCANE AND SUGARCANE (Saccharum spp.).
By
STEPHEN PETER JENNEWEIN
A THESIS PRESENTED TO THE GRADUATE SCHOOL OF THE UNIVERSITY OF FLORIDA IN PARTIAL FULFILLMENT
OF THE REQUIREMENTS FOR THE DEGREE OF MASTER OF SCIENCE
UNIVERSITY OF FLORIDA
2013

2
© 2013 Stephen Peter Jennewein

3
To my Father, Peter Jennewein

4
ACKNOWLEDGMENTS
I thank my Father. I am forever grateful for the 25 years you were in my life and for
all the wisdom and knowledge you have shared with me. Without your support and
encouragement I would not be who I am.
I am deeply indebted to Barry Glaz, whose guidance and patience throughout the
years have endowed me with the skills I would need to make it to and through graduate
school.
I thank Dr. Gilbert for giving me the opportunity to invest my efforts into bioenergy
research at the Everglades Research Education Center. It’s been a privilege being
involved with the station’s research.
I thank my graduate committee, Drs. Robert A. Gilbert, Diane L. Rowland, Alan
Wright, and Jerry M. Bennett who have been a constant source of direction and
inspiration.
I acknowledge the Department of Energy for funding this research. Also, I thank
Drs. Ed Hanlon and John Capece for managing the DOE grant responsible for this
research.

5
TABLE OF CONTENTS page
ACKNOWLEDGMENTS .................................................................................................. 4
LIST OF TABLES ............................................................................................................ 7
LIST OF FIGURES .......................................................................................................... 8
LIST OF ABBREVIATIONS ............................................................................................. 9
ABSTRACT ................................................................................................................... 10
CHAPTER
1 BIOENERGY SPECIES FEASIBLE FOR BIOMASS PRODUCTION IN THE EVERGLADES AGRICULTURAL AREA OF FLORIDA AND THEIR TOLERANCE TO FLOODING STRESS ................................................................. 12
Introduction ............................................................................................................. 12 Flood Response Mechanisms ................................................................................. 14
Candidate Genotypes ............................................................................................. 16 Typical Flooding Conditions in the EAA .................................................................. 21
Physiological Measurements .................................................................................. 22 Objectives ............................................................................................................... 22
2 PHYSIOLOGICAL AND MORPHOLOGICAL EFFECTS OF HIGH WATER TABLES ON EARLY GROWTH OF GIANT REED, ELEPHANT GRASS, ENERGYCANE AND SUGARCANE....................................................................... 24
Abstract ................................................................................................................... 24 Introduction ............................................................................................................. 25
Materials and Methods............................................................................................ 28 Genotype Evaluation Under Variable Flooding Levels ..................................... 28
Plant Measurements ........................................................................................ 29 Data Analysis ................................................................................................... 32
Results .................................................................................................................... 33 Dry Matter Accumulation and Partitioning ........................................................ 33 Leaf Area Index ................................................................................................ 34
Stalk Population ............................................................................................... 35 Aerenchyma Development ............................................................................... 36 SPAD................................................................................................................ 38 Stomatal Conductance ..................................................................................... 38
Discussion .............................................................................................................. 39
Conclusions ............................................................................................................ 45

6
3 CUSTOM LYSIMETER NETWORK DESIGN FOR FLOOD RESPONSE STUDIES ................................................................................................................ 63
Abstract ................................................................................................................... 63
Introduction ............................................................................................................. 64 Design and Construction ......................................................................................... 65
Choice of Components ..................................................................................... 66 System Layout .................................................................................................. 67 Assembly and Installation ................................................................................. 68
Adjusting Water Tables and Maintenance ........................................................ 71 Expenses ................................................................................................................ 72
Summary ................................................................................................................ 73
LIST OF REFERENCES ............................................................................................... 76
BIOGRAPHICAL SKETCH ............................................................................................ 84

7
LIST OF TABLES
Table page 2-1 Harvest measurement analysis of variance F ratios and level of significance .... 47
2-2 Average total dry weight of four bioenergy genotypes exposed to three water-table treatments in plant cane, first ratoon, and successive plant cane crops .... 48
2-3 Average leaf dry weight of four bioenergy genotypes exposed to three water-table treatments in plant cane, first ratoon, and successive plant cane crops .... 49
2-4 Average LAI of four bioenergy genotypes exposed to three water-table treatments in plant cane, first ratoon, and successive plant cane crops ............. 50
2-5 Average stalk population of four bioenergy genotypes exposed to three water-table treatments in three crops ................................................................. 51
2-6 Average pipe cross sectional area of four bioenergy genotypes exposed to three water-table treatments in three crops ........................................................ 52
2-7 Average pipe cross sectional to stalk cross sectional area proportion of four bioenergy genotypes exposed to three water-table treatments in three crops ... 53
2-8 Average pipe length to stalk length proportion of four bioenergy genotypes exposed to three water-table treatments in three crops ...................................... 54
2-9 Physiological measurements analysis of variance F ratios and level of significance ......................................................................................................... 55
3-1 Index of materials used, quantity, and pricing as of January 2011 ..................... 74

8
LIST OF FIGURES
Figure page 2-1 Model of lysimeter design showing custom network fitting and semi-
permeable soil-water barrier ............................................................................... 56
2-2 Model of reservoirs showing the 40F reservoir on left, 16C center, and 40C on right with drain pipes pictured in front; solid state sensors in the center ........ 56
2-3 Effect of the interaction of genotype, water table, and day of measurement on SPAD in plant cane crop .................................................................................... 57
2-4 Effect of the interaction of genotype, water table, and day of measurement on SPAD in first ratoon crop .................................................................................... 58
2-5 Effect of the interaction of genotype, water table, and day of measurement on SPAD in successive plant cane crop .................................................................. 59
2-6 Effect of the interaction of genotype, water table, and day of measurement on stomatal conductance in plant cane crop ........................................................... 60
2-7 Effect of the interaction of genotype, water table, and day of measurement on stomatal conductance in first ratoon crop ........................................................... 61
2-8 Effect of the interaction of genotype, water table, and day of measurement on stomatal conductance in successive plant cane crop ......................................... 62
3-1 Model of lysimeter design showing custom network fitting and semi-permeable soil-water barrier ............................................................................... 75
3-2 Model of reservoirs showing the 40F reservoir on left, 16C center, and 40C on right. Drain pipes pictured in front; solid state sensors n the center .............. 75
9
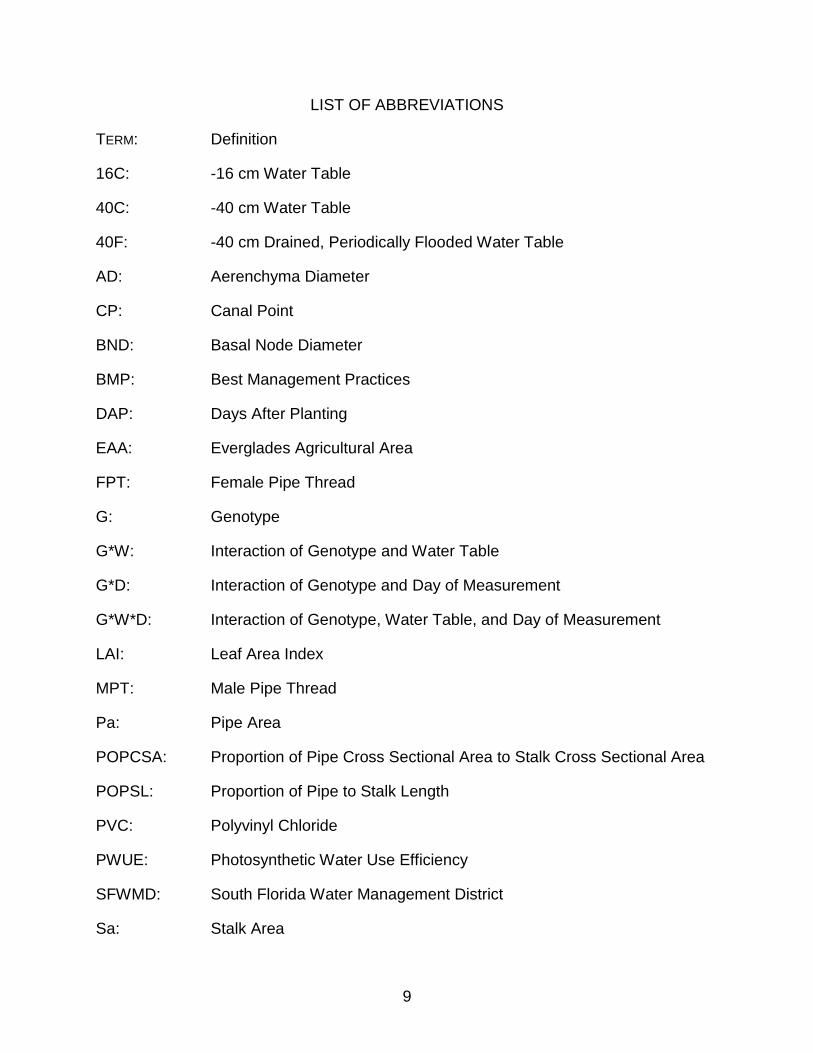
LIST OF ABBREVIATIONS
TERM: Definition
16C: -16 cm Water Table
40C: -40 cm Water Table
40F: -40 cm Drained, Periodically Flooded Water Table
AD: Aerenchyma Diameter
CP: Canal Point
BND: Basal Node Diameter
BMP: Best Management Practices
DAP: Days After Planting
EAA: Everglades Agricultural Area
FPT: Female Pipe Thread
G: Genotype
G*W: Interaction of Genotype and Water Table
G*D: Interaction of Genotype and Day of Measurement
G*W*D: Interaction of Genotype, Water Table, and Day of Measurement
LAI: Leaf Area Index
MPT: Male Pipe Thread
Pa: Pipe Area
POPCSA: Proportion of Pipe Cross Sectional Area to Stalk Cross Sectional Area
POPSL: Proportion of Pipe to Stalk Length
PVC: Polyvinyl Chloride
PWUE: Photosynthetic Water Use Efficiency
SFWMD: South Florida Water Management District
Sa: Stalk Area

10
Abstract of Thesis Presented to the Graduate School of the University of Florida in Partial Fulfillment of the Requirements for the Degree of Master of Science
THE PHYSIOLOGICAL AND MORPHOLOGICAL EFFECTS OF PERIODIC
FLOODING ON GIANT REED (Arundo donax), ELEPHANT GRASS (Pennisetum purpureum), ENERGYCANE AND SUGARCANE (Saccharum spp.).
By
Stephen Peter Jennewein
May 2013
Chair: Robert Gilbert Cochair: Diane Rowland Major: Agronomy
Increasing demand for renewable energy sources has spurred interest in high-
biomass crops used for energy production. Species potentially well-suited for biofuel
production in the seasonally-wet subtropical Everglades Agricultural Area (EAA) of
Florida include giant reed (Arundo donax), elephant grass (Pennisetum purpureum),
energycane (Saccharum spp.), and sugarcane (Saccharum spp.). The objectives in this
study were to evaluate the role of fluctuating water tables on the morphology,
physiology, and early season growth of these four genotypes. The candidate genotypes
were grown in a greenhouse under three water table depths, defined by distance of the
water table from the soil surface: two constant water tables (-16 cm and -40 cm) along
with a flood cycle (2 weeks of flood to the soil level followed by 2 weeks at -40 cm from
the soil level). The genotypes included CP 89-2143 (sugarcane), L 79-1002
(energycane), Merkeron (elephant grass), and wild type (giant reed). The experiment
was repeated for plant cane, first ratoon, and successive plant cane crop cycles.
Reductions in dry matter yield were observed among genotypes subjected to the
-40 cm drained, periodically flooded (40F) water table relative to the -40 cm constant

11
(40C) or -16 cm constant (16C). Plant cane dry weights were reduced by 37% in giant
reed, 52% in elephant grass, 42% in energycane, and 34% in sugarcane in the 40F
compared to 40C water table treatments. Similarly, in the first ratoon crop dry weights
were reduced by 29% in giant reed, 42% in elephant grass, 27% in energycane, and
62% in sugarcane. In plant cane and successive plant cane, average total dry weight
was greatest for elephant grass whereas ratoon total dry weight was greatest for
energycane. Genotype had more pronounced effects on physiological attributes than
water table. The highest stomatal conductance and SPAD values were observed in
giant reed while the highest stalk populations were in elephant grass and energycane.
Aerenchyma presence and volume increased under higher water tables with elephant
grass having the greatest aerenchyma production. Because of the high yields and stalk
populations in energycane and elephant grass for all crop stages seen in this study,
these two genotypes show potential for bioenergy production in the EAA, but field trials
are recommended to confirm this.

12
CHAPTER 1 BIOENERGY SPECIES FEASIBLE FOR BIOMASS PRODUCTION IN THE
EVERGLADES AGRICULTURAL AREA OF FLORIDA AND THEIR TOLERANCE TO FLOODING STRESS
Introduction
Depletion of fossil fuel reserves and increasing energy demand in developing
nations has led to interest in renewable biofuel crops. However, the potential benefits
and difficulties of growing biofuel feedstock crops are numerous. Benefits include:
developing a virtually zero emission renewable fuel source, creating a new American
industry, lowering energy costs, and providing increased energy independence to the
American economy (Burner et al., 2009, Deren et al., 1991, Huang et al., 2009,
Lewandowski et al., 2003, Ragauskas et al., 2006). Difficulties include: availability of
land, inefficient methods of digesting cellulose, very large inputs required for growth,
and potential invasiveness of biofuels species (Bastianoni and Marchettini 1996,
Ditomaso et al., 2010, Gordon et al., 2011, Leakey 2009, Somma et al., 2010). If a
substantial portion of U.S. energy could be produced from crops grown domestically,
the benefits far outweigh the costs. There are many species being evaluated for
biomass production globally. Species that have been proposed as well-suited for
production in the Southeastern U.S. include giant reed (Arundo donax), elephant grass
(Pennisetum purpureum), energycane (Saccharum spp.) and sugarcane (Saccharum
spp.) (Erickson et al., 2012, Knoll et al., 2012). These C4 grasses, as well as the C3 reed
Arundo donax, are known to do well in warm, wet conditions and have high biomass
yields.
One primary region being considered for production of these species is the
Everglades Agricultural Area (EAA) of southern Florida. South Florida is a subtropical

13
region with high humidity, rainfall, and radiation (Abtew, 2001). Belle Glade had an
average annual rainfall of 1400 mm from 1924 through 2001
(http://erec.ifas.ufl.edu/wd/ewdmain.htm). South and Central Florida has an average
annual rainfall of 52” (1321 mm) (Ali et al., 2000). The high humidity associated with the
EAA imparts additional water use efficiency to crops as well (Sinclair et al., 1984). The
EAA is comprised of 190,000 hectares, established by the Central and Southern Florida
Flood Control Project, south of Lake Okeechobee. The area was historically swamp
land that was drained to make way for development and agriculture. As such, the
elevation is very low, making the EAA prone to periodic flooding. These conditions limit
the choice of crop species. Farmers typically pump rainwater into canals as soon as
possible to mitigate yield losses from flood stress. This pumping costs money in fuel
and effectively reduces water available for future use if later needed during drier
conditions.
One prerequisite for a crop to perform well in the EAA environment is some sort
of flooding tolerance. Due to high annual rainfall (Ali et al., 2000), shallow soils resulting
from subsidence (Shih et al., 1998), and pumping restrictions in the EAA, crops are
often exposed to high water tables (Hebert, 1971). A crop showing favorable
morphological and physiological responses to high water tables would have high
biomass potential in this region. Managed periodic flooding is also utilized in this region
to mitigate loss of phosphorus (Daroub et al., 2010). It is estimated that 123,210 metric
tons of phosphorus are present in the EAA, a substantial portion of the total 418,050
metric tons present in the greater Everglades ecosystem (Reddy et al., 2011). This
phosphorus comes from soil subsidence and commercial application of fertilizer. The

14
amount of phosphorus leaching into the water systems of Florida along with redirected
flows has disrupted endemic species and led to the implementation of best
management practices (BMPs) in 1995. As part of these BMP’s, water must settle
before being pumped off of crop land to allow for phosphorus to deposit in the sediment
and remain in the soil. This practice of allowing water to settle for a period of time before
pumping provides an incentive for cultivation of flood-tolerant biofuel crops. Flooding of
the EAA soils also helps mitigate soil loss within the region. The soils in the EAA are
predominantly organic histosols and oxidation causes soil subsidence reducing soil
depth (Daroub et al., 2011). Aerobic microbes consume the soil and can lower the depth
to < 15 cm from the hardpan of limestone bedrock, making water management difficult.
Higher water tables expose less of the soil profile to aerobic conditions and slow the
subsidence rate. Lastly, maintaining high water tables can serve as a method of water-
storage which can reduce the demand on water from Lake Okeechobee as well as
increase dry season water flow into the Everglades (Aillery et al., 2001). Therefore,
growing flood tolerant biomass crops in the EAA may help maintain these benefits of
periodically raising and maintaining high water tables within this region.
Flood Response Mechanisms
High water tables present specific challenges to plants and flood stress, even
short in duration, is enough to cease growth or even kill some plants (McWhorter, 1972,
Hunt, 1951). Plants respond morphologically and physiologically to flooding stress
including: altered photosynthetic rates (Caudle and Maricle, 2012), decreased cellular
respiration (Armstrong, 1979), adventitious root development (Iwanaga and Yamamoto,
2007), root senescence (Kozlowski, 1984, Sarkar and Gladish, 2012; Tsukahara and
Kozlowski, 1985), ethylene accumulation (Chen, 2002), and aerenchyma production

15
(Jackson and Armstrong, 1999). Waterlogged soil conditions accelerate denitrification
(Song et al., 2010), limiting plant access to nitrogen. Anaerobic conditions increase
microbial formation of sulfides and butyric acid which are toxic to plants (Wesseling,
1974).
A typical stress response in plants is lowered photosynthesis, but plants exhibit
varied photosynthetic responses to flooding (Caudle and Maricle, 2012). The ability of a
plant to maintain, or even increase, photosynthetic rates while flooded may be a means
of determining flood tolerance. A decrease in photosynthesis may be a direct result of
lowered vascular conductance (Kramer, 1940) in roots and stomatal closure in leaves of
inundated plants (Kozlowski, 1982). This has a coupled effect in the plant by reducing
nutrient availability at the same time as reducing water availability (Else et al., 1995).
Adventitious root development and aerenchyma production are two responses
plants have to increase oxygen penetration into the plant as well as increase vascular
conductance (Tsukahara and Kozlowski, 1985). Therefore, flooding stress often induces
adventitious root and aerenchyma formation (Gilbert et al., 2007, Pigliucci and
Kolodynska, 2002). The production of aerenchyma is perhaps the most beneficial
adaptation to flooding. While there is evidence for programmed cell death (Sarkar and
Gladish, 2012) as a mechanism for aerenchyma production it has also been
hypothesized that the hollow air spaces form as a result of stress-induced necrosis in
poorly oxygenated tissue (Evans, 2004). Aerenchyma may form in roots, stalks, and
leaves. The presence of aerenchyma gives secondary access to atmospheric oxygen
and enables cellular respiration to occur in submerged tissue. Diffusion of oxygen from
aerenchymatous tissue into anoxic soil can also inhibit toxin accumulation (Blom, 1999).

16
In this way the plant creates a beneficial microclimate around roots by means of
aerenchyma.
Candidate Genotypes
Some bioenergy crops that may withstand flooding stress are sugarcane,
energycane, elephant grass and giant reed. Sugarcane has been grown in the EAA
through most of the 20th century and has been bred to thrive in the conditions within that
region. Energycane was bred from sugarcane varieties, with selection criteria
emphasizing fiber content and dry matter yields over sucrose production, and grows
well under the environmental conditions of the EAA as well. Data on growth and
management of elephant grass and giant reed in the EAA is lacking. Given the high
yields observed in elephant grass (Woodard and Prine, 1993) and giant reed (Angelini
et al., 2005) grown in similar climatic regions to the EAA, they may be successful
bioenergy crops for the region.
Sugarcane has proven to be successful in the EAA with almost a century of
cultivation in the region. Sugarcane sucrose yields have exceeded 15 Mg ha-1 (1.5 kg
m-2) for Saccharum spp. (Giamalva et al., 1984) with fresh-weight biomass yields of 240
Mg ha-1 observed in Louisiana (Alexander 1985). Commercial varieties of sugarcane
are interspecific hybrids primarily of Saccharum officinarum L. and Saccharum
spontaneum L. Species belonging to the Saccharum genus are considered the most
complex genomes among crop plants (Zhang et al., 2012). This has made it problematic
to identify markers for important agronomic characteristics, including flood tolerance.
However, sugarcane does have existing flood tolerance mechanisms, including the
tendency of certain cultivars to develop aerenchyma constitutively (Gilbert et al., 2007).
However, there are detrimental impacts of flooding in sugarcane including reductions in

17
leaf, stalk, and root biomass (Glaz and Lingle, 2012). Glaz and Morris (2010) found that
shallow water tables were more detrimental than periodic flooding drained to -45 cm in
Canal Point (CP) varieties CP 88-1762, CP 89-2143, CP 89-2376, and CP 96-1252.
Sugarcane was shown to suffer yield loss and decreased leaf nutrient content with a 3-
month summer flood (Gilbert et al., 2008) but was shown to exhibit a yield boost with a
2-day flood compared with constant water levels (Glaz and Gilbert, 2006). These
reductions in biomass under prolonged flooding may partially be related to decreases in
stomatal conductance under long term flood stress (Glaz and Morris, 2010) while
periodic floods may actually moderately increase transpiration and photosynthesis (Glaz
et al., 2004). Many of these responses are cultivar dependent; a field trial that
maintained in-situ high water tables through canal depth management found varietal
differences and led the author to propose using flood tolerant varieties to draw away
and store excess water from susceptible varieties (Glaz et al., 2002).
Sugarcane (Saccharum spp.) has a history of both sucrose and energy
production in the EAA. Direct combustion of bagasse, the solid material left over in
processing, powers the mills responsible for refining sugar (Glaz et al., 2011). The
conversion of bagasse to energy through combustion has a maximum efficiency of 26%,
which may be less than pyrolysis, depending on the usage of pyrolysis byproducts
(Perez et al., 2002). Bagasse can be used to produce ethanol as opposed to
incineration for energy production. Conversion from bagasse to ethanol is very
inefficient, with theoretical yields eight times greater than actual yields (Dawson and
Boopathy, 2008). Part of this inefficiency is due to the strength and complexity of the
cell wall material. Through genetic manipulation, the lignin content of sugarcane may be
18
lowered, thus increasing the fermentable glucose content and ethanol production
efficiency for this feedstock (Jung et al., 2012). In order for bagasse to produce energy,
a minimum amount of fiber must be present. Cultivars grown commercially in the EAA
have fiber content, measured as g fiber per kg of biomass, ranging from 88.6 g kg-1 to
114.5 g kg-1 (Glaz et al., 2011). Higher fiber content corresponds to higher energy
output and lower sucrose content. Successful farm management requires crop planning
that will provide enough fiber to power milling operations while maximizing sucrose
production. The fiber content of sugarcane cultivars bred in Canal Point Florida is
determined at stage IV of the breeding program, and is a factor as to whether or not the
variety is released. Typically a grower desires fiber content between 9-11% (Barry Glaz,
personal communication, July 28th, 2011).
Energycane is a term used to describe Saccharum spp. genotypes having
increased biomass, fiber, tillers, and cellulose than sugarcane (Chynoweth et al., 1993).
Energycane varieties are not used for commercial sugar production since sucrose
concentration is lower than in commercial sugarcane varieties. In the early 20th century
the majority of sugarcane cultivars were Saccharum officinarum clones, but this
changed with the introduction of intergeneric hybrids to add traits such as vigor and
disease resistance (Wang et al., 2008). These inter genera clones paved the way for
energycane, giving breeders the genetic stock to select for vigorous biomass
accumulation. Energycane cultivars are well adapted for production of biomass
(Alexander 1985), and could be used for cellulosic ethanol production (Chong and
O’Shea, 2012). Fresh biomass yields in energycane are comparable to sugarcane and
have ranged from 48 Mg ha-1 to 253 Mg ha-1 year-1 depending on variety, soils and

19
climate (Giamalva et al., 1984; Mislevy et al., 1995). As with elephant grass, there has
been little research on water table response in energycane. Given the high genetic
similarity to sugarcane, some high water table and flood tolerance mechanisms may be
present. Viator et al., (2012) compared the response of two energycane varieties, L 79-
1002 and Ho 01-12, to two sugarcane varieties, HoCP 96-540 and L 99-226, grown at
high water tables and found that the energycane clones tolerated high water table
conditions better than the sugarcane clones. However, it has also been observed that
Louisiana energycane varieties do not exhibit as much flood tolerance as Canal Point
varieties (Viator et al., 2012).
Elephant grass is a C4 carbon fixing grass with excellent biomass production
potential. Elephant grass is capable of accumulating over 80 Mg ha-1 year-1 of dry
biomass in tropical regions (Vincente-Chandler et al., 1959). A study in Florida found
dry biomass yields of four bunchgrasses, including two varieties of elephant grass,
between 37-53 Mg ha-1 (Woodard and Prine, 1993). Ensilage of elephant grass is
facilitated by high levels of water soluble carbohydrates, making elephant grass an
excellent candidate for methane production (Woodard et al., 1991). Its nutritive content
makes it an excellent cattle feedstock as well (Meinerz et al., 2008). Apparently, there
have been no studies on high water table response of elephant grass. The leaf sheaths
of elephant grass may develop constitutive aerenchyma in mature plants (Brito et al.,
1997, Brito et al., 1999). With a center of origin in Zimbabwe
(http://www.fao.org/ag/AGP/AGPC/doc/Gbase/data/pf000301.htm), elephant grass
grows well in environments with high annual rainfall (greater than 1,500 mm y-1), and
warm sub-tropical temperatures (25-40° C; Russell and Webb, 1976).

20
Giant Reed (Arundo Donax) is endemic to Asia, Africa, and the Middle East.
Often, giant reed is found bordering water ways and low lying areas. Comprised of a
hollow stalk, all tissue in giant reed has access to air. Larger soil carbon storage was
found in soils under giant reed than those under C. dactylon (Sarkhot, 2012), indicating
that giant reed may not be as detrimental to soil quality as other species. Giant reed
photosynthesizes using the C3 pathway but its photosynthetic rate is similar to C4
grasses (Christou et al., 2001; Rossa, 1998). Spencer (2012) postulated that giant
reed’s rhizome nutrient stores led to strong ratooning ability. To our knowledge, only
one study has been performed on morphological responses of giant reed to various
water table levels (Rezk and Edany, 1979). Water tables of zero, five, ten, and fifteen
cm from the soil surface had no impact on giant reed shoot height, dry weight, and
diameter (Rezk and Edany 1979). The lack of significant differences in morphology
attributes presents evidence of the tolerance of giant reed to high water tables. High
biomass yields have been recorded for giant reed; in central Italy it was found to
accumulate 3 kg m-2 year-1 of dry matter (Angelini et al., 2005), capable of producing
more biomass than Miscanthus given similar inputs (Angelini et al., 2009). Giant reed
yields compared to Phragmites australis, another reed plant of the Poaceae family,
were greater given similar nutrient supply and sequestration (Idris et al., 2012). Giant
reed also has good ratooning ability; one trial showed the average aboveground dry
biomass of 39 clones doubled from 10.6 t ha-1 in the first year to 22.1 t ha-1 in the
second year (Cosentino et al., 2006). Given these results, giant reed’s biomass
production potential is high in environments similar to the EAA.

21
Sugarcane crops in the EAA are typically grown and harvested for three
consecutive years: the first crop after planting is termed the plant cane crop; the
subsequent plant cane crop regrowth is referred to as a first ratoon crop; and the first
ratoon regrowth in the third year is termed second ratoon. Once second ratoon is
harvested commercial fields may be rotated with another crop or left fallow, if the crop is
replanted with sugarcane it is termed a successive crop.
Given that all of the candidate genotypes are vegetatively propagated similar
management may be possible. Determining how many years of regrowth each genotype
is capable of will require further study. Rapid biomass accumulation, characteristic of all
genotypes (Angelini et al., 2005, Woodard and Prine, 1993, Alexander, 1985), may
make it possible for multiple harvests per season as well.
Typical Flooding Conditions in the EAA
There are three primary water table conditions normally experienced by crops in
the EAA. The highest commercially desired water table in the EAA is achieved by
maintaining a constant forty cm water depth (termed 40C in the current study) from the
soil surface. This depth has been found not to significantly reduce sucrose production in
plant cane crops (Andreis, 1976). Often after rainfall events, water tables will rise to
within 16 cm of the soil surface and will be maintained for a time period (Glaz et al.,
2002;) termed 16C in the current study. Further, in areas where soil depth has
decreased to roughly -16 cm from the soil surface, farmers are incapable of having a
lower water table in these regions. A third condition has arisen from best management
practices set forth by South Florida Water Management District which require allowing
storm water to settle before draining; in this condition, there is periodic flooding between
40 and 16 cm water table depths (termed 40F in the current study). This condition can

22
also be typical of seasonal conditions within some regions of the EAA or may be utilized
as an alternative water table management practice by growers. Thus, in the current
study the 40C represents low water table management with the 16C and 40F
representing increasingly higher water table management respectively.
Physiological Measurements
SPAD and stomatal conductance measurements are useful in determining
physiological differences among species under flooding stress. A study conducted by
Glaz et al., (2008) found that SPAD may be useful in determining tolerance of
sugarcane genotypes to high water tables due to changes in chlorophyll content.
Significant decreases in stomatal conductance have been documented in flood-stressed
citrus plants (Rodriguez-Gamir et al., 2011) and periodically flooded Melaleuca
alternifolia (Jing et al., 2009). High water tables and seven-day periodic floods showed
positive and neutral responses in sugarcane stomatal conductance (Glaz et al., 2004).
Biomass partitioning and yield responded to flooding in sugarcane, Gilbert et al., (2008)
showed significant reductions in sugarcane yield subjected to a three month flood. The
measurements used in this study should provide a quantitative assessment of stress,
and morphological adaptation in the candidate genotypes.
Objectives
The objectives of this study were to evaluate the physiological and morphological
responses exhibited by candidate bioenergy species subjected to high water table
management. Four species were chosen for the study (giant reed, elephant grass,
energycane, and sugarcane) because of their high potential for bioenergy production in
the EAA and for their probable tolerance to flooding conditions that are likely within this

23
region. Water table levels for the study were chosen to reflect the agricultural
management practices and typical field conditions within the EAA.
To assess the various genotypes’ abilities to tolerate high water table conditions,
stomatal conductance, SPAD, and stalk population will be followed throughout the plant
cane and first ratoon crop development stages. Aerenchyma production, biomass
accumulation and partitioning will be assessed at early maturity through destructive
harvesting.
These measurements have successfully assessed magnitude and duration of
stress in other studies (Gilbert et al., 2007, Glaz et al., 2008, Rodriguez-Gamir et al.,
2011, Luo et al., 2009). Measurements such as stalk population and yield are important
in determining if these genotypes can be successful bioenergy crops when grown in the
agro-ecosystems of the EAA.
Results from this study have the potential to add bioenergy crop production into
rotation within the EAA region. Further, results from this study will determine how to
best manage these crops within the EAA. Given the genotypes’ adaptation to high water
tables, cropping systems which incorporate them could improve sustainability,
profitability, and ecology of the region.

24
CHAPTER 2 PHYSIOLOGICAL AND MORPHOLOGICAL EFFECTS OF HIGH WATER TABLES ON
EARLY GROWTH OF GIANT REED, ELEPHANT GRASS, ENERGYCANE AND SUGARCANE
Abstract
Rising energy costs and depletion of non-renewable resources have led to global
interest in renewable bioenergy production. The Everglades Agricultural Area (EAA) has
existing infrastructure to utilize bioenergy and presents a favorable climate for
production. The objectives of this study were to observe the physiological and
morphological effects of high water table management on four bioenergy candidate
species: two Saccharum spp., Arundo donax, and Pennisetum purpureum. These
genotypes were chosen based on their suitability to the region and purported flooding
tolerance, a necessary crop attribute for sustainable production within the EAA. The four
genotypes were evaluated under three water table levels that were representative of the
flooding conditions prevalent in the region: two constant water tables of -16 (16C) and -
40 (40C) cm depth below the soil surface and one periodically flooded treatment (40F).
Three cycles of crop production, plant cane, first ratoon, and successive plant cane
were evaluated. Reductions in dry matter yield were observed among genotypes
subjected to the 40F water table relative to the 40C or 16C treatments: plant cane dry
weights were reduced by 37% in giant reed, 52% in elephant grass, 42% in energycane,
and 34% in sugarcane in the 40F compared to 40C water table treatments. Similarly, in
the first ratoon, crop dry weights were reduced by 29% in giant reed, 42% in elephant
grass, 27% in energycane, and 62% in sugarcane. Genotypes did differ in their potential
biomass production with average total dry weight greatest for elephant grass in plant
cane and successive plant cane; whereas ratoon total dry weight was greatest for

25
energycane. Genotype had more pronounced effects on physiological attributes than
water table, with giant reed having higher stomatal conductance and SPAD values than
the other genotypes. Aerenchyma presence and volume increased with higher water
tables with elephant grass having the greatest aerenchyma production. Due to the high
biomass produced in all crop cycles for energycane and elephant grass these two
species may be well suited for bioenergy production in the EAA region of Florida.
Introduction
Depletion of fossil fuel reserves and increasing energy demand in developing
nations has led to interest in renewable biofuel crops. There are many species being
evaluated for biomass production globally. Species that have been proposed as well-
suited for production in the Southeastern U.S. include giant reed (Arundo donax),
elephant grass (Pennisetum purpureum), energycane (Saccharum spp.) and sugarcane
(Saccharum spp.) (Erickson et al., 2012, Knoll et al., 2012). These C4 grasses, as well
as the C3 reed Arundo donax, are known to do well in warm, wet conditions and have
high biomass yields.
In previous research, sugarcane’s ability to tolerate floods has varied with variety
and flood duration, with varieties developing aerenchyma under high water tables (Glaz
and Morris, 2010). Gilbert et al. (2007) found significant interactions of water table and
genotype on aerenchyma development and morphology in sugarcane. Some sugarcane
cultivars maintain constitutive aerenchyma, regardless of environmental conditions
(Gilbert et al., 2007). Periodic short duration floods may be beneficial for sugarcane
(Glaz et al., 2004) but long-term flooding appears detrimental (Gilbert et al., 2008).
Shallower water tables altered sugarcane root morphology, stimulating roots to narrow,
lengthen, and increase mass (Morris and Tai, 2004). The response of energycane to

26
high water tables has not been as extensively examined, but due to a shared S.
spontaneum background with sugarcane (Alexander, 1985), energycane may exhibit
similar adaptations to high water tables. In a study that compared the two species’
flooding tolerance directly, Louisiana sugarcane cultivars were found to be less flood
tolerant than energycane (Viator et al., 2012). Research on the response of giant reed
and elephant grass to water table management is limited. A linear increase in dry matter
accumulation, plant height, and stalk population to increasing soil moisture has been
observed in elephant grass (Goncalves Mota et al., 2010). The response of giant reed
grown at various water tables was analyzed and compared to another species of reed,
showing giant reed can successfully tolerate high water tables (Rezk and Edany, 1979).
One primary region being considered for production of these species is the
Everglades Agricultural Area (EAA) of southern Florida. The EAA is comprised of
190,000 hectares, established by the Central and Southern Florida Flood Control
Project, south of Lake Okeechobee. The area was historically swamp land that was
drained to make way for development and agriculture. As such, the elevation is very
low, making the EAA prone to periodic flooding. These conditions limit the choice of
crop species. Farmers typically pump rainwater into canals as soon as possible to
mitigate yield losses from flood stress. This pumping costs money in fuel and effectively
reduces water available for future use if later needed during drier conditions.
One prerequisite for a crop to perform well in the EAA environment is some sort of
flooding tolerance. Due to high annual rainfall (Ali et al., 2000), shallow soils resulting
from subsidence (Shih et al., 1998), and pumping restrictions in the EAA, crops are
often exposed to high water tables (Hebert, 1971). A crop showing favorable

27
morphological and physiological responses to high water tables would have high
biomass potential in this region. Managed periodic flooding is also utilized in this region
to mitigate loss of phosphorus (Daroub et al., 2010) as part of best management
practices (BMPs). This practice provides an incentive for cultivation of flood-tolerant
biofuel crops while mitigating soil loss within the region. The soils in the EAA are
predominantly organic histosols and oxidation causes soil subsidence reducing soil
depth (Daroub et al., 2011). Aerobic microbes consume the soil and can lower the depth
to < 15 cm from the hardpan of limestone bedrock, making water management difficult.
Higher water tables expose less of the soil profile to aerobic conditions and slow the
subsidence rate. Lastly, maintaining high water tables can serve as a method of water-
storage which can reduce the, demand on water from Lake Okeechobee as well as
increase dry season water flow into the Everglades (Aillery et al., 2001). Therefore,
growing flood tolerant biomass crops in the EAA may help maintain these benefits of
periodically raising and maintaining high water tables within this region.
The objectives of this study were to evaluate the physiological and morphological
responses exhibited by candidate bioenergy species subjected to high water table
management. Four species were chosen for the study (giant reed, elephant grass,
energycane, and sugarcane) because of their high potential for bioenergy production in
the EAA and for their probable tolerance to flooding conditions that are likely within this
region. Water table levels for the study were chosen to reflect the agricultural
management practices and typical field conditions within the EAA.

28
Materials and Methods
Genotype Evaluation Under Variable Flooding Levels
The experiment was conducted in a greenhouse located at the Everglades
Research Education Center in Belle Glade, Florida. The greenhouse was located at
26°40'2.58"N and 80°38'3.66"W, with dimensions: 9.5 m wide x 12.5 m long x 5.5 m tall.
Soil for the trial was harvested from the top meter of a field adjacent to the greenhouse.
The soil series used was Lauderhill Muck (euic, hyperthermic Lithic Haplosaprist).
Four biomass crop genotypes were tested under three water table levels.
Varieties used were CP 89-2143 for sugarcane (Glaz et al., 2000), L 79-1002 for
energycane (Bischoff et al., 2008), Merkuron for elephant grass (Burton, 1989), and wild
type giant reed. Treatments consisted of the four genotypes grown under each of three
water tables. Water tables, defined by distance from the soil surface, consisted of two
constant water tables and one periodically flooded water table: 1) a -40 cm constant
(40C); 2) a -16 cm constant (16C); and 3) a periodically flooded (40F) water table in
which the soil was flooded to the soil line for two weeks and then drained to -40 cm for
two weeks.
Genotypes and flooding treatments were established in forty-eight Rubbermaid
265-liter (70 gallon) stock tanks (Rubbermaid, Huntersville NC) with dimensions of 103
cm long X 81 cm wide X 24 cm high (Figure 2-1). Fifty-one tanks were utilized: 48 as
experimental units and three as water reservoirs (Figure 2-2). Three valves were
installed on the outside of each experimental unit, corresponding to each water table
reservoir, and then soil was filled to the top of the tank. Tanks were put into
predetermined locations that minimized variation in elevation due to the drainage
gradient in the greenhouse. Water levels for respective treatments were maintained

29
using automated pool level controllers (Jandy, Model LX-2, Vista CA). Genotypes were
vegetatively propagated by planting eye pieces into flats. After eye pieces emerged two
stalks of each genotype were transplanted into each tank. Tanks were fertilized at rates
similar to commercial production (Rice et al., 2010) on Lauderhill muck soils:
approximately 57 kg P/ha, 171 kg K/ha, 228 kg S/ha, and 57 kg N/ha, with
micronutrients. Once established, the more vigorous of the two plants was chosen and
the other was thinned from the tank. After thinning, water table treatments were applied.
Plant Measurements
Sugarcane crops in the EAA are typically grown and harvested for three
consecutive years: the first crop after planting is termed the plant cane crop; the
subsequent plant cane crop regrowth is referred to as a first ratoon crop; and the first
ratoon regrowth in the third year is termed second ratoon. Once second ratoon is
harvested commercial fields may be rotated with another crop or left fallow, if the crop is
replanted with sugarcane it is termed a successive crop. After harvesting first ratoon the
tanks were dug up and rotated with a new randomization referred to as successive plant
cane. Observations of growth and physiological performance were measured during all
three crop growth cycles. Plant growth and physiological measurements, consisting of
SPAD, stomatal conductance, and stalk height were begun one week after water table
treatment initiation and were repeated on a two week basis. Measurements for the plant
cane crop were begun on 09 March 2011 and concluded on 26 May with harvest. First
ratoon measurements began (after a period of establishment following plant cane
harvest) on 29 June 2011 and concluded on 15 August with harvest. Successive plant
cane measurements began on 15 February 2012 and concluded on 26 April with
harvest. One week following the week of measurements, the water table in the 40F was

30
drained back to -40 cm from the soil surface. As two of the three water tables (40C and
16C) were constant they were not modified until harvest. The treatment cycle consisted
of two weeks of flood in the 40F followed by two weeks at 40C, with measurements
occurring one week after a water table change. This lasted for a total of six cycles in
plant cane and successive plant cane, and three in the first ratoon crop.
In-season physiological measurements included stomatal conductance using a
porometer (Decagon, model SC 1, Pullman WA), SPAD readings (Konica Minolta,
model 502 Plus, Tokyo Japan), plant height for the tallest tiller, and number of tillers in
each lysimeter. Three SPAD readings were taken on the tallest tiller at the distal portion
of each leaf surrounding the top visible dewlap. For stomatal conductance
measurements were taken from the leaf at the top visible dewlap (additionally from the
leaf below the top visible dewlap in successive plant cane). Stomatal conductance
measurements were taken around noon with constant sunlight (when possible) to allow
for maximal conductance. Due to high variability in data for the plant cane and first
ratoon, one additional measurement per plant was taken on the successive plant cane
crop. When plants grew > 2 meters high the top visible dewlap became inaccessible.
Where this occurred measurements were taken from an adjacent tiller at the top visible
dewlap or from a leaf lower on the tallest tiller. In-season morphology was observed by
measuring plant height and counting stalk population. Every stalk in each tank was
counted to give stalk population. The tallest stalk was then measured from the soil level
to its top.
Plants were harvested soon after they reached the ceiling of the greenhouse on:
25 May 2011 for the plant cane crop; 12 August 2011 for the ratoon crop; and 25 April

31
2012 for the successive plant cane crop. Harvesting was accomplished by cutting the
plants as close to the soil as possible in order to remove all aboveground biomass from
each tank. From each tank, the two tallest stalks were selected and used to examine
morphological traits; the average of the two stalks for each measurement was taken as
the mean value for the tank. Morphological traits measured included: the height of the
stalks, stalk basal diameter, internode length, total nodes, aerenchyma dimensions (if
present, two perpendicular diameters were measured from a stalk cross section with a
digital caliper), and the length of the stem affected by aerenchyma. Aerenchyma-
affected stalk length, defined as pipe length, is the height of the hollow air space in the
stalk measured by node. Nodes are the sections of stalk containing eye pieces.
Dimensions were measured using a digital caliper to the nearest 0.1 mm. Stalk area
was calculated from measurements of the Basal Node Diameters (BND) at the midpoint
of the internode closest to the soil surface with BND1 being at the widest point and
BND2 being at the narrowest point of the node. Stalk area (Sa) was then calculated,
treating the stalk as an ellipse, using the formula:
Sa = π(½BND1)(½BND2)
For aerenchyma measurements, the stalks were cut horizontally at the basal node and
an aerenchyma diameter (AD) was measured with a digital caliper. Measurements were
taken similarly to stalk area, treating the aerenchyma area as an ellipse, with AD1 being
the narrowest aerenchyma diameter and AD2 being the widest point. Similar methods
were utilized by Gilbert et al. (2007). These measurements were used to calculate pipe
area (Pa) with the following formula:
Pa = π(½AD1)(½AD2)

32
A pipe area proportion (PAP) was then calculated to put the aerenchyma in perspective
of the stalk area. This was accomplished using the following formula:
PAP = Sa /Pa
The pipe length was calculated by counting the amount of nodes that the aerenchyma
traversed. This was accomplished by cutting the internode acropetally from the basal
internode until the pipe ceased. Leaf area per tank was measured using an Licor LI-
3000C (Li-Cor, LI-300C, Lincoln, Nebraska). All remaining biomass was mulched to aid
in desiccation and placed into drying bags. Leaves and stalks were separated and fresh
weights were recorded for both. The bags were placed into a drying oven at 65° C until
stable weight was achieved. The weights were then recorded as dry weight.
This measurement process was repeated for the following ratoon crop and
successive plant cane crop. Upon completion of the plant cane harvest the plants were
given 25 days at the -40 cm water table to reestablish. Once emergence was achieved
in each tank the treatments were again initiated for the ratoon crop. After harvesting the
ratoon crop the stools were removed and the soil was again adjusted. Treatments were
re-randomized and the successive plant cane measurements were conducted as
previously discussed for the plant cane crop.
Data Analysis
Data from the repeated measures taken throughout the trial were analyzed in
SAS (SAS version 9.2, Cary, North Carolina) using Proc Mixed with repeated measures.
Genotype, water table, and flood cycle (a full cycle of flooding and drainage consisted of
two weeks of flooding and two weeks of drainage to -40 cm) were treated as fixed
effects. Days after planting was used as a random effect. Genotype, water table, day of
measurement, and their interactions were tested at a significance level of 0.05. Days

33
from first measurement were used as the repeated measure. The effects of genotype,
water table, day, and their interactions were all analyzed for significance. Analyses were
run separately for each crop. The SAS macro pdmix was used to generate lettered
comparisons and least significant difference values for each analysis (Saxton, 1998).
Results
Dry Matter Accumulation and Partitioning
Genotype had a highly significant effect on all harvest parameters measured in
all crops (Table 2-1). Water table effects were also strong but impacted more harvest
features in the ratoon and successive plant cane crops. There were also several
significant interactions between genotype and water table for harvest measurements
throughout all crops.
For the plant cane crop elephant grass had significantly higher dry weight yields
than the other genotypes in all water tables. However, unlike the other three genotypes,
giant reed yields were similar across all water tables, leading to a significant interaction
(Table 2-1). In contrast, in the first ratoon crop, energycane produced significantly more
dry weight than any other genotype (Table 2-2). During successive plant cane, elephant
grass had the highest dry matter yields above all other genotypes in all water tables with
1.4 kg m-2 produced in both the 40C and 16C treatments and 0.7 kg m-2 in the 40F water
tables.
Plant cane dry weights averaged among genotypes were significantly lower at
the 40F (0.95 kg m-2) water table than 40C (1.74 kg m-2) or 16C (1.71 kg m-2) water
tables. In the first ratoon crop the 40F (1.2 kg m-2) water table had significantly less dry
weight, averaged among genotypes, than ether the 40C (1.9 kg m-2) or 16C (2.0 kg m-2)
water tables. In successive plant cane the same relationship was observed with the 40F

34
water table (0.43 kg m-2) being significantly less than the 40C (0.89 kg m-2) or 16C (0.90
kg m-2). Excluding giant reed, the 40F water table always had significantly less dry
biomass yields than the 40C.
In contrast to the other genotypes, sugarcane produced more leaf biomass than
stalk biomass. The specific leaf area, averaged for all crops and water tables, was 0.10
kg m-2 in giant reed and elephant grass, 0.13 kg m-2 in energycane and 0.18 kg m-2 in
sugarcane. Water table had a negligible effect on this ratio, averaged among crops, for
all genotypes except in sugarcane where it increased from 0.15 kg m-2 in the 40F and
40C to 0.23 kg m-2 in the 16C water tables.
Leaf dry weights were significantly reduced when exposed to periodic flooding
relative to the 40C water table (Table 2-3). Reductions in leaf dry weights, averaged for
all genotypes, at the 40F water table relative to the 40C were significant in plant cane
(0.75 kg m-2 to 0.42 kg m-2), first ratoon (0.91 kg m-2 to 0.51 kg m-2), and successive
pant cane (0.44 kg m-2 to 0.19 kg m-2). However, in plant cane and first ratoon
reductions in leaf dry weight at the 40F water table relative to the 40C for giant reed
were not significant. Among all crops giant reed produced significantly less leaf dry
weight than the other genotypes. The 16C water table was not significantly different
than the 40C water table in any crop for any genotype.
Leaf Area Index
In plant cane, elephant grass and energycane had large reductions in LAI when
managed at the 40F relative to the 40C water tables; whereas sugarcane had a slight
reduction and giant reed LAI fluctuated. Elephant grass, energycane and sugarcane LAI
decreased by 51%, 47% and 39%, respectively in the 40F compared to the 40C water
table (Table 2-4). Giant reed LAI increased from the 16C (2.1) to the 40F (2.7), which

35
was similar to the 40C water table (2.8). In the first ratoon crop, energycane LAI (9.9)
was significantly higher than elephant grass (7.6), which was greater than sugarcane
(5.4) or Arundo (4.5) (Table 2-4). Trends in genotype LAI in first ratoon were not similar
to plant cane where elephant grass produced greater LAI than all other genotypes.
Successive plant cane showed similar relationships in LAI reductions at the 40F relative
to the 40C water table. More defined reductions in giant reed LAI managed with periodic
flooding were observed in successive plant cane.
Stalk Population
Giant reed and sugarcane produced similar stalk populations across crops. Stalk
population averages across crops and water tables were 10 stalks m-2 in giant reed,
compared to 9 stalks m-2 in sugarcane. Giant reed and sugarcane were not significantly
different from each other in stalk population averaged among water tables for any crop.
While elephant grass (37 stalks m-2) had the highest stalk population averaged over all
water tables in plant cane, energycane had the highest populations in first ratoon (52
stalks m-2) and successive plant cane (36 stalks m-2; Table 2-5). In elephant grass a
stalk population of 18 stalks m-2 averaged across all crops and water tables was
recorded, compared to 22 stalks m-2 in energycane. Water table had a negligible effect
on stalk population in plant cane with stalk populations averaged among all genotypes
showing no significant difference between each water table. In first ratoon and
successive plant cane stalk populations averaged among all genotypes were
significantly higher in the 40C water table than the 16C water table, which was
significantly higher than the 40F water table.

36
Aerenchyma Development
In the 40C water table the average pipe area among all crops for elephant grass
was 38.9 mm2. This is in contrast to 71.5 mm2 in the 16C and 62.9 mm2 in the 40F.
Given the yield reductions in elephant grass associated with the 40F water table it is
probable that the smaller aerenchyma area is relative to decreasing stalk volume. The
pipe area proportion averaged among crops was 0.26 in elephant grass for both the
16C and 40F water tables compared to 0.13 in the 40C, supporting this idea.
Energycane and sugarcane showed a similar response in aerenchyma
development to water table. Aerenchyma was present in all water tables but the
magnitude was variable. An increase in average plant cane pipe diameter in the 40F
relative to the 40C water table was observed to be 43% in elephant grass, 308% in
energycane, and 812% in sugarcane (Table 2-6). Giant reed decreased average pipe
diameter in the 40F relative to the 40C water table by 6.5% in plant cane. In the first
ratoon crop average pipe diameter in the 40F water table relative to the 40C water table
increased by 33% in elephant grass, 188% in energycane, and 231% in sugarcane. In
giant reed a 30% decrease was observed in the 40F water table relative to the 40C
water table for the first ratoon crop. The successive plant cane crop produced much
less aerenchyma among genotypes making comparisons difficult. Among all genotypes
and crops this equated to an increase in average pipe diameter of 24% in the 40F
relative to the 40C water table.
Genotype had a highly significant effect on Proportion of Pipe Cross Sectional
Area (POPCSA) in all crops (Tables 2-1). In plant cane pipe area proportions averaged
among water tables were significantly higher in giant reed (0.30) and elephant grass
(0.25) than energycane (0.02) or sugarcane (0.02) (Table 2-7). Elephant grass,

37
energycane and sugarcane had increased POPCSA with increasing water table depth
in the ratoon crop. In the first ratoon crop elephant grass had much more of its stalk
volume in aerenchyma with a POPCSA range of 0.21-0.35, whereas energycane (0.02-
0.11) and sugarcane (0.00-0.03) had less. The POPCSA, averaged among genotypes,
was significantly larger in the 40F water table compared to the 40C water table in first
ratoon and successive plant cane crops. In the plant cane crop there was no significant
difference in POPCSA, averaged among genotypes, between water tables.
Genotype had a highly significant effect on POPSL (Proportion of Pipe to Stalk
Length) in the plant cane crop (Table 2-1). In the plant cane crop POPSL averaged
among all water tables was 0.80 in giant reed and 0.68 in elephant grass which was
significantly larger than 0.11 in energycane or 0.18 in sugarcane (Table 2-8). In the first
ratoon crop POPSL averaged among water tables was 0.99 for giant reed, 0.69 for
elephant grass, 0.20 for energycane, and 0.24 for sugarcane. In the successive plant
cane crop the POPSL averaged among water tables was 0.92 for giant reed, 0.12 in
elephant grass, 0.17 in energycane, and 0.09 in sugarcane. Giant reed had piping up
almost the entire stalk (0.98-1.00) in all water tables and crops, significantly more piping
than the other three genotypes except for elephant grass in the plant cane crop.
Elephant grass had the second largest ratios among crops and water tables, from 0.58-
0.73, while energycane and sugarcane shared a range of 0.00- 0.34. The POPSL
averaged among genotypes showed no significant difference between water tables in
plant cane and first ratoon crops. In the successive plant cane crop POPSL averaged
among genotypes was significantly larger in the 40F (0.38) water table than the 40C
(0.26) water table.

38
SPAD
In plant cane and successive plant cane genotype, water table, and the
interaction of G*W all had significant effects on SPAD values while in first ratoon only
genotype and water table had a significant effect (Table 2-9). A gradual overall
decrease in SPAD value was observed in elephant grass, energycane, and sugarcane
as time progressed in the plant cane crop (Figure 2-3). This is in contrast to giant reed
where a gradual increase in SPAD value occurred. Energycane and sugarcane initially
showed increases in SPAD value but then declined gradually. Elephant grass SPAD
values declined from the first day of measurements to the last at a faster rate than
energycane or sugarcane.
First ratoon SPAD values decreased for all genotypes and water tables as time
progressed, with the exception of the 16C in giant reed where SPAD values showed
slight increases (Figure 2-4). Sugarcane grown at the 16C water table had a decrease
in SPAD over time but the decrease was less pronounced than in elephant grass or
energycane.
In the successive plant cane crop a similar relationship in SPAD values over time
was observed to the plant cane crop. There was a decline in SPAD over time for
energycane and elephant grass, and an increase for giant reed (Figure 2-5).
Stomatal Conductance
In the plant cane crop all genotypes showed similar trends in stomatal
conductance (Figure 2-6). An anomalous spike occurred at 82 DAP with all genotypes
showing highly elevated conductance relative to 69 and 96 DAP. Conductance ranged
from 356 mmol m-2s-1 to 1040 mmol m-2s-1 in giant reed, 149 mmol m-2s-1 to 485 mmol

39
m-2s-1 in elephant grass, 255 mmol m-2s-1 to 724 mmol m-2s-1 in energycane, and 248
mmol m-2s-1 to 689 mmol m-2s-1 in sugarcane.
Stomatal conductance data in the first ratoon showed a similar reaction in all
genotypes (Figure 2-7). All four genotypes increased conductance from 33 to 46 DAP
and then decreased to 61 DAP. Similar conductance values were observed in elephant
grass, energycane, and sugarcane. Giant reed showed significantly higher conductance
on all measurement days in all water tables.
In the successive plant cane crop, stomatal conductance measurements were
increased from one to two per pot, which may have led to the lower variability in
stomatal conductance data (Figure 2-8). Giant reed had higher stomatal conductance
rates than all other genotypes (Figure 2-8A). Giant reed stomatal conductance
plateaued after day 91 between 713 mmol m-2s-1 and 901 mmol m-2s-1 for all water
tables. Conductance levels for elephant grass were much lower, below 300 mmol m-2s-1
for all water tables on all day of measurements (Figure 2-8B). Stomatal conductance in
sugarcane increased in all water tables until 91 DAP (Figure 2-8D). The range of
stomatal conductance levels in energycane throughout the successive plant cane crop
was 589 mmol m-2s-1 to 244 mmol m-2s-1,
Discussion
Results of this study indicate a variable response to water table management
among the candidate genotypes. This variable response was found in repeated
physiological measurements along with harvest and yield measurements. Aerenchyma
development and magnitude was stimulated at higher water table management, in the
C4 genotypes as opposed to giant reed, while yield was reduced in all genotypes. The

40
decrease in hollow air space in giant reed is most likely tied to yield losses, as giant
reed produced smaller hollow stalks under flooded conditions.
Yield data showed a distinct response to periodic flooding. In plant cane and first
ratoon elephant grass, sugarcane, and energycane yield significantly declined in the
40F water table relative to the 40C. Losses were less pronounced in sugarcane and
giant reed. This may be evidence of flood tolerance in sugarcane and giant reed.
Tolerance of high water tables has been shown in giant reed (Rezk and Edany, 1979),
and CP varieties of sugarcane (Viator et al., 2012). Yield data in the 16C water table
was variable when compared to 40C. At the early growth stages of these plants there
may be no benefit in draining to -40 cm from approximately -16 cm. This may present
an opportunity for farmers to pump up canals and store water to use later without losing
yield. For sugarcane a yield loss in certain varieties grown under periodic flooding is
consistent with the literature (Glaz et al., 2008, Glaz et al., 2004, Glaz et al., 2002,
Gilbert et al., 2007). Varietal differences exist in sugarcane flood tolerance and flood
duration influences whether periodic flooding is beneficial or detrimental. Elephant grass
and energycane consistently had higher yields among water tables and crops. To our
knowledge this study represents the first report examining flood tolerance in elephant
grass.
In sugarcane flood tolerance may have inadvertently been selected for early in
the breeding program due to local flooding (Sartoris and Belcher, 1949). In the 1940s a
lack of infrastructure at Canal Point resulted in storms frequently inundating the entire
area, as deep as six feet in one instance (Hebert, 1971). Construction of pump stations
and levies has alleviated this problem. Giant reed has colonized areas of low-lying

41
commonly inundated land. While, to our knowledge, no breeding work has been done
on giant reed, it has evolved to be a flood-tolerant species. If the high yields associated
with elephant grass and energycane could be bolstered by breeding for flood tolerance
the magnitude of yield loss observed in this study with management at 40F may be
mitigated. Thus improving what may already be an effective water storage or bioenergy
crop.
High stalk populations have been associated with strong ratooning abilities,
which is a favorable trait for crop production in the EAA (Milligan et al., 1996). Strong
ratooning abilities lower management costs for growers, who may not need to replant as
often and can implement mechanized harvesting. Giant reed has been documented with
vigorous ratooning abilities, having higher yields following the first harvest (Angelini et
al., 2005). This was observed in the first ratoon crop in this study, where giant reed
biomass increased by 118% over plant cane. The energycane variety L 79-1002 was
initially selected for desirable attributes such as high fiber and cellulose content along
with large stalk populations (Bischoff et al., 2008). Bischoff et al. (2008) reported that L
79-1002 produced up to 114 stalks from one stool of cane. This study concurs with
previous reports of strong energycane ratooning ability, as the first ratoon crop had an
86% biomass increase over plant cane. In contrast, elephant grass biomass decreased
in ratoon relative to plant cane and sugarcane increased by a modest amount. The
potential lack of ratooning strength observed in elephant grass may make it problematic
for production in the EAA.
The 40F water table resulted in decreases in stalk population relative to the 40C
in all crops and genotypes. Reduced stalk populations have been reported by Viator et

42
al. (2012) in L 79-1002 subjected to periodic flooding. Among all crops sugarcane
average stalk population decreased by 40% in the 40F water table relative to the 40C.
This is comparable to the 28% reduction observed by Gilbert et al. (2008) in flooded
sugarcane in the first ratoon crop. Like yield, leaf area tended to decrease at higher
water tables, similar to results in sugarcane reported under flooded conditions by Gilbert
et al. (2007). The trends for leaf area matched yield closely. While all four crops are
capable of growing under these high water tables, elephant grass and energycane were
more affected by periodic flooding than sugarcane or giant reed.
There were similar trends in SPAD data for each crop. SPAD values gradually
decreased as canopy closure occurred for elephant grass, energycane and sugarcane.
Decreases in SPAD at higher water table management were also observed among
genotypes. This was similar to results reported by Glaz et al. (2008) in which periodic
flooding lowered sugarcane SPAD values relative to those found in a constant drained
water table. Since SPAD is correlated to leaf N, this trend may have been due to dilution
of leaf N content as leaf biomass increased and N was remobilized. A more likely
explanation to the loss of leaf nitrogen over time is decreased availability as
denitrification was accelerated under hypoxic conditions (Song et al., 2010). Giant reed
was the exception to this trend as SPAD increased over time. This was most likely due
to its small leaf area and C3 photochemistry. SPAD is correlated to extractable leaf
nitrogen content (Madeira et al., 2003) and C4 species tend to have lower leaf nitrogen
concentrations relative to C3 species (Brown, 1978).
Giant reed had the highest stomatal conductance in each crop while elephant
grass had the lowest. The higher conductance in giant reed was likely due to its C3

43
carbon fixation pathways, which impart lower photosynthetic water use efficiency
(PWUE) than C4 plants (Vogan and Sage 2011). A lower PWUE would result in more
transpiration than C4 plants for comparable yields. High stomatal conductance may be
advantageous under high water tables (Glaz and Morris, 2010) and could be a sign of
tolerance as decreased conductance is typical during flood stress (Iwanaga and
Yamamoto, 2007). Low conductance in elephant grass, relative to energycane and giant
reed, also observed by Erickson et al. (2012), may be the result of high water use
efficiency (Nagasuga et al., 1998). Elephant grass had the most stable conductance
among water tables over the course of measurements. Energycane and sugarcane
showed little variation in stomatal conductance throughout the trial. The shared S.
spontaneum background (Alexander, 1985) in these varieties may explain similarities in
stomatal conductance.
Elephant grass also had the most prevalent aerenchyma (excluding giant reed).
In plant cane and first ratoon crops elephant grass produced aerenchyma for all water
tables in all lysimeters. Aerenchyma production in elephant grass has been observed
previously (Brito et al., 1997, Brito et al., 1999). To our knowledge, the effect of water
table management on elephant grass production of aerenchyma is novel to this study.
Given the lack of water table management data on giant reed it is difficult to define
aerenchyma on this plant. Giant reed’s common name is giant reed due to its naturally
hollow stalks. This hollow stalk is not produced as a developmental modification like
aerenchyma. Between nodes of giant reed a delicate tissue resembling a spider web
exists. In giant reed subjected to 40F and 16C water tables this web-like tissue
exhibited small holes. Whether these holes were aerenchyma, or if they played a role in
44
oxygen permeation, require further studies to determine. Determining if these holes
appeared as a result of water table management would also require further study.
Sugarcane aerenchyma, described by pipe diameter, has been observed
increasing in response to flooding by 116% in plant cane to 115% in a second ratoon
crop by Gilbert et al. (2007). Glaz et al. (2004) observed increases ranging from 88% in
plant cane to 56% in a second ratoon crop. This study showed average pipe diameter
increases of 89% and 70% for sugarcane in plant cane and first ratoon respectively. For
elephant grass pipe diameters increased when exposed to periodic flooding by 30% and
25% in plant cane and first ratoon respectively. Energycane showed a 75% and 65%
increase in pipe diameter in plant cane and first ratoon respectively. Giant reed
decreased total hollow air space by 92% and 44% in plant cane and first ratoon
respectively. The 40F water table produced the largest aerenchyma. Given smaller stalk
diameters with the yield reductions associated with the higher water tables, the pipe
area proportion was comparable at each water table. It is known that varietal differences
in flood tolerance exist in Canal Point sugarcane (Gilbert et al., 2007), while sugarcane
varieties from Louisiana require further study and screening to determine flood
tolerance (Viator et al., 2012). The reason some plants developed no aerenchyma while
others at the same water table did is not known.
Bioenergy production in the EAA would require crops capable of high biomass
yields, flood tolerance, and vigorous ratooning. All of the species in this study exhibit
flood tolerance, without which the periodic flooding may have resulted in death within a
few days (McWhorter, 1972, Hunt, 1951). Biomass yields in sugarcane and giant reed
were small when compared to energycane and elephant grass. However, giant reed

45
and sugarcane were less affected by periodic flooding than the other two varieties.
Given the performance of the various species it seems that elephant grass and
energycane may have the potential for cultivation as bioenergy crops in the region. Of
the two, the apparent ratooning abilities of energycane make it the most likely candidate
for bioenergy production. Future studies should focus on field management of these
species in both productive land and storm treatment areas.
Conclusions
High water table management had a distinct effect on the physiology and
morphology of Arundo donax, Pennisetum purpureum, and Saccharum spp. Periodic
flooding stressed these plants, as evidenced by yield, LAI, stalk population, and SPAD
reductions relative to a constant -40 cm water table. However, the ability of the plants to
simply survive the 40F water table denotes some flood tolerance. While a constant high
water table was found to be more detrimental than periodic flooding in a full season
study by Glaz and Morris (2010), in the early growth observed by this study the opposite
was observed. Further studies examining roots would most likely explain this
relationship further. Soon after planting sugarcane, or bioenergy crops, it may be
beneficial for a farmer to pump up canals and store water on new growth.
Aerenchyma production increased at higher water tables among the C4 plants.
The air space within the hollow stalks of giant reed decreased in conjunction with
smaller stalk size associated with periodic flooding. Yield, LAI, and SPAD responded
variably to the 40C relative to the 16C water table. Clear reductions were observed in
plants managed with periodic flooding, however. Stomatal conductance was similar
among water tables for each genotype, denoting physiological tolerance to the high
water tables.

46
Given the productive capacity of these species further full season studies are
recommended. This study demonstrated the effects of high water tables on early growth
but was limited by the physical constraints of the greenhouse. Duplication of this study
in a field setting throughout the season would validate the results and continue building
a knowledge base for management practices on these bioenergy species in the EAA.
Energycane and elephant grass had the largest yields over the course of the
experiment and warrant further study regarding suitability for bioenergy cropping
systems. These genotypes may be particularly suitable for water quality improvement
within South Florida Water Management District’s storm treatment areas and water
catchment areas. If planted in areas receiving storm effluent, the plants may act as a
sink for nutrient runoff. Harvesting biomass, for use as litter, from these areas could
result in a form of fertilizer recycling, while improving water quality in ecologically
sensitive areas.

47
Table 2-1. Harvest measurement analysis of variance F ratios and level of significance
Source of
Stalk Leaf Dry Total Dry
Pipe Pipe Area Pipe Length
Variation df Population Weight Weight LAI CS Area† Proportion ‡ Proportion ø
Plant Cane
Genotype (G) 3 19.45*** 44.44*** 105.76*** 63.86*** 15.98*** 24.66*** 31.41***
Water (W) 2 0.20 15.98*** 27.08*** 13.85*** 1.58 1.01 0.40
G*W 6 1.09 2.58* 7.06*** 3.92** 1.61 1.81 1.48
First Ratoon
Genotype (G) 3 50.15*** 50.72*** 38.74*** 28.64*** 212.10*** 503.99*** 131.78***
Water (W) 2 15.00*** 30.28*** 15.68*** 28.15*** 1.64 19.79*** 0.02
G*W 6 3.51** 2.85* 0.96 1.44 13.85*** 9.34*** 2.70*
S. Plant Cane
Genotype (G) 3 51.95*** 50.02*** 97.82*** 59.54*** 21.25*** 32.06*** 123.28***
Water (W) 2 17.26*** 49.15*** 55.46*** 83.48*** 2.77 2.99 3.70*
G*W 6 1.97 6.67*** 8.94*** 5.18*** 2.04 1.21 1.96
*, **, ***indicate P < 0.05, 0.01, and 0.001, respectively.
†Cross Sectional (CS) area was calculated using the formula for area of an ellipse and two width measurements taken from the widest (L1) and narrowest points (L2) of stalk or aerenchyma, (π/4)(L1+L2) ‡ Defined as proportion of pipe cross-sectional area at base of stalk to stalk cross-sectional area (pipe area/stalk area).
ø Defined as proportion of pipe extension to stalk extension (# pipe nodes/# nodes stalk).
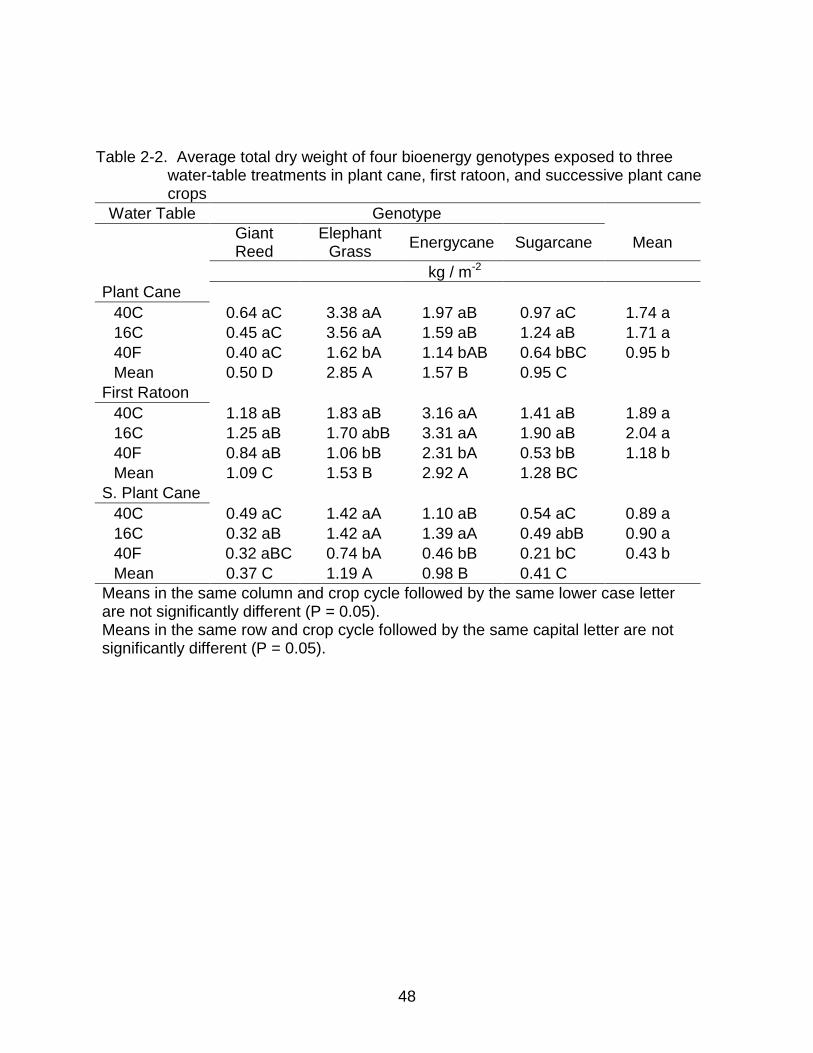
48
Table 2-2. Average total dry weight of four bioenergy genotypes exposed to three
water-table treatments in plant cane, first ratoon, and successive plant cane crops
Water Table Genotype
Giant Reed
Elephant Grass
Energycane Sugarcane Mean
kg / m-2
Plant Cane
40C 0.64 aC 3.38 aA 1.97 aB 0.97 aC 1.74 a
16C 0.45 aC 3.56 aA 1.59 aB 1.24 aB 1.71 a
40F 0.40 aC 1.62 bA 1.14 bAB 0.64 bBC 0.95 b
Mean 0.50 D 2.85 A 1.57 B 0.95 C
First Ratoon
40C 1.18 aB 1.83 aB 3.16 aA 1.41 aB 1.89 a
16C 1.25 aB 1.70 abB 3.31 aA 1.90 aB 2.04 a
40F 0.84 aB 1.06 bB 2.31 bA 0.53 bB 1.18 b
Mean 1.09 C 1.53 B 2.92 A 1.28 BC
S. Plant Cane
40C 0.49 aC 1.42 aA 1.10 aB 0.54 aC 0.89 a
16C 0.32 aB 1.42 aA 1.39 aA 0.49 abB 0.90 a
40F 0.32 aBC 0.74 bA 0.46 bB 0.21 bC 0.43 b
Mean 0.37 C 1.19 A 0.98 B 0.41 C
Means in the same column and crop cycle followed by the same lower case letter are not significantly different (P = 0.05). Means in the same row and crop cycle followed by the same capital letter are not significantly different (P = 0.05).

49
Table 2-3. Average leaf dry weight of four bioenergy genotypes exposed to three
water-table treatments in plant cane, first ratoon, and successive plant cane crops
Water Table Genotype
Giant Reed
Elephant Grass
Energycane Sugarcane Mean
kg / m-2
Plant Cane
40C 0.27 aD 1.24 aA 0.93 aB 0.58 aC 0.75 a
16C 0.20 aD 1.25 aA 0.71 abBC 0.66 aC 0.70 a
40F 0.19 aD 0.65 bA 0.51 bBC 0.33 bC 0.42 b
Mean 0.22 D 1.04 A 0.72 B 0.52 C
First Ratoon
40C 0.49 a D 0.90 aB 1.49 aA 0.76 aBC 0.91 a
16C 0.51 aD 0.77 abBC 1.33 aA 0.95 aB 0.89 a
40F 0.34 aB 0.53 bB 0.88 bA 0.30 bB 0.51 b
Mean 0.44 C 0.73 B 1.23 A 0.67 B
S. Plant Cane
40C 0.24 aC 0.46 aB 0.63 aA 0.44 aB 0.44 a
16C 0.15 abC 0.37 aB 0.76 aA 0.39 abB 0.42 a
40F 0.11 bB 0.25 bA 0.26 bA 0.16 bAB 0.19 b
Mean 0.17 C 0.36 B 0.55 A 0.33 B
Means in the same column and crop cycle followed by the same lower case letter are not significantly different (P = 0.05). Means in the same row and crop cycle followed by the same capital letter are not significantly different (P = 0.05).

50
Table 2-4. Average LAI of four bioenergy genotypes exposed to three water-table
treatments in plant cane, first ratoon, and successive plant cane crops
Water Table Genotype
Giant Reed
Elephant Grass
Energycane Sugarcane Mean
Plant Cane
40C 2.75 aC 13.78 aA 7.38 aB 3.80 aC 6.93 a
16C 2.10 aC 12.33 aA 5.93 abB 3.58 aBC 5.98 a
40F 2.68 aB 6.75 bA 3.90 bB 2.33 aB 3.91 b
Mean 2.51 C 10.95 A 5.73 B 3.23 C
First Ratoon
40C 5.13 aB 9.58 aA 11.65 aA 6.40 aB 8.19 a
16C 5.13 aC 8.00 aB 10.85 aA 7.50 aB 7.87 a
40F 3.38 aBC 5.10 bAB 7.18 bA 2.25 bC 4.48 b
Mean 4.54 C 7.56 B 9.90 A 5.38 C
S. Plant Cane
40C 2.50 aB 4.83 aA 4.68 aA 2.53 aB 3.63 a
16C 1.48 bD 3.93 bB 4.65 aA 2.28 aC 3.08 b
40F 1.05 bBC 2.23 cA 1.73 bAB 0.93 bC 1.48 c
Mean 1.68 B 3.67 A 3.68 A 1.19 B
Means in the same column and crop cycle followed by the same lower case letter are not significantly different (P = 0.05). Means in the same row and crop cycle followed by the same capital letter are not significantly different (P = 0.05).

51
Table 2-5. Average stalk population of four bioenergy genotypes exposed to three
water-table treatments in plant cane, first ratoon, and successive plant cane crops
Water Table Genotype
Giant Reed
Elephant Grass
Energycane Sugarcane Mean
Stalks m-2
Plant Cane
40C 15.00 aB 37.67 aA 30.33 aA 13.00 aB 24.00 a
16C 14.00 aB 42.67 aA 26.67 aB 14.67 aB 24.50 a
40F 22.00 aAB 30.67 aA 26.33 aA 11.67 aB 22.67 a
Mean 17.00 C 37.00 A 27.78 B 13.11 C
First Ratoon
40C 24.75 aC 38.75 aB 70.00 aA 23.75 aC 39.31 a
16C 23.00 aC 35.00 aAB 45.00 bA 25.50 aBC 32.13 b
40F 19.50 aCD 28.50 aBC 41.75 bA 12.25 bD 25.50 c
Mean 22.42 C 34.08 B 52.25 A 20.50 C
S. Plant Cane
40C 21.00 aC 32.75 aB 41.00 aA 17.75 aC 28.13 a
16C 13.25 bC 29.00 aB 40.25 aA 12.50 abC 23.75 b
40F 15.25 abCD 21.25 bBC 25.75 bAB 9.00 bD 17.81 c
Mean 16.50 C 27.67 B 35.67 A 13.08 C
Means in the same column and crop cycle followed by the same lower case letter are not significantly different (P = 0.05). Means in the same row and crop cycle followed by the same capital letter are not significantly different (P = 0.05).

52
Table 2-6. Average pipe cross sectional area of four bioenergy genotypes exposed to
three water-table treatments in plant cane, first ratoon, and successive plant cane crops
Water Table Genotype
Giant Reed
Elephant Grass
Energycane Sugarcane Mean
mm2
Plant Cane
40C 57.65 bA 46.05 aA 1.13 aB 0.48 aB 26.33 a
16C 74.28 aA 84.25 aA 0.00 aB 1.88 aB 40.10 a
40F 20.10 bB 60.30 aA 9.83 aB 7.35 aB 24.39 a
Mean 50.68 A 63.53 A 3.65 B 3.23 B
First Ratoon
40C 118.37 aA 64.80 bB 3.03 aC 1.53 aC 46.93 a
16C 93.73 bB 110.62 aAB 10.58 aC 3.45 aC 54.59 a
40F 64.28 cB 115.97 aA 15.58 aC 9.60 aC 51.36 a
Mean 92.13 A 97.13 A 9.73 B 4.86 B
S. Plant Cane
40C 30.65 aA 2.98 bB 0.00 bB 0.00 aB 8.41 b
16C 21.90 aA 16.28 abA 0.73 bB 0.00 aB 9.73 ab
40F 27.38 aA 9.33 bB 12.53 aB 9.95 aB 14.79 a
Mean 26.64 A 9.53 B 4.42 B 3.32 B
Means in the same column and crop cycle followed by the same lower case letter are not significantly different (P = 0.05). Means in the same row and crop cycle followed by the same capital letter are not significantly different (P = 0.05).
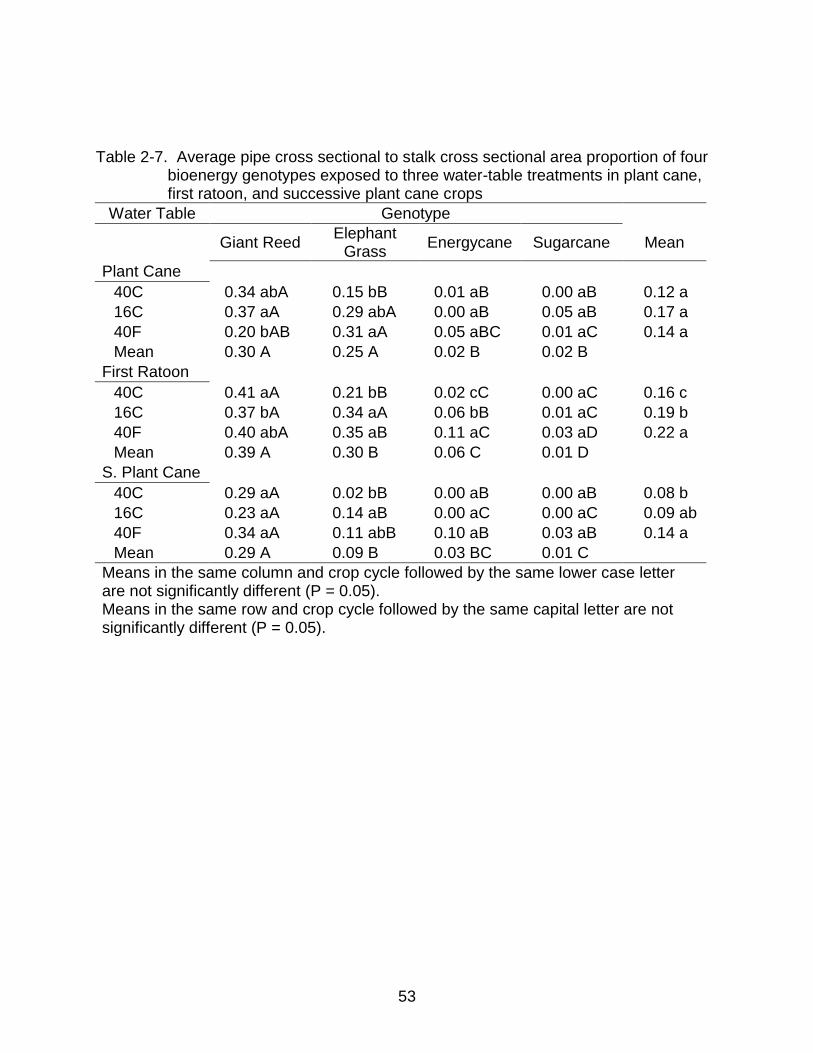
53
Table 2-7. Average pipe cross sectional to stalk cross sectional area proportion of four bioenergy genotypes exposed to three water-table treatments in plant cane, first ratoon, and successive plant cane crops
Water Table Genotype
Giant Reed
Elephant Grass
Energycane Sugarcane Mean
Plant Cane
40C 0.34 abA 0.15 bB 0.01 aB 0.00 aB 0.12 a
16C 0.37 aA 0.29 abA 0.00 aB 0.05 aB 0.17 a
40F 0.20 bAB 0.31 aA 0.05 aBC 0.01 aC 0.14 a
Mean 0.30 A 0.25 A 0.02 B 0.02 B
First Ratoon
40C 0.41 aA 0.21 bB 0.02 cC 0.00 aC 0.16 c
16C 0.37 bA 0.34 aA 0.06 bB 0.01 aC 0.19 b
40F 0.40 abA 0.35 aB 0.11 aC 0.03 aD 0.22 a
Mean 0.39 A 0.30 B 0.06 C 0.01 D
S. Plant Cane
40C 0.29 aA 0.02 bB 0.00 aB 0.00 aB 0.08 b
16C 0.23 aA 0.14 aB 0.00 aC 0.00 aC 0.09 ab
40F 0.34 aA 0.11 abB 0.10 aB 0.03 aB 0.14 a
Mean 0.29 A 0.09 B 0.03 BC 0.01 C
Means in the same column and crop cycle followed by the same lower case letter are not significantly different (P = 0.05). Means in the same row and crop cycle followed by the same capital letter are not significantly different (P = 0.05).

54
Table 2-8. Average pipe length to stalk length proportion of four bioenergy genotypes exposed to three water-table treatments in plant cane, first ratoon, and successive plant cane crops
Water Table Genotype
Giant Reed
Elephant Grass
Energycane Sugarcane Mean
Plant Cane
40C 0.90 aA 0.58 aB 0.14 aC 0.05 aC 0.42 a
16C 0.84 aA 0.73 aA 0.00 aB 0.17 aB 0.43 a
40F 0.66 aA 0.72 aA 0.20 aB 0.34 aB 0.48 a
Mean 0.80 A 0.68 A 0.11 B 0.18 B
First Ratoon
40C 0.98 aA 0.73 abB 0.10 bD 0.28 aC 0.52 a
16C 1.00 aA 0.75 aB 0.15 bC 0.24 aC 0.53 a
40F 1.00 aA 0.58 bB 0.34 aC 0.21 aC 0.53 a
Mean 0.99 A 0.69 B 0.20 C 0.24 C
S. Plant Cane
40C 0.94 aA 0.10 aB 0.00 bB 0.00 aB 0.26 b
16C 0.91 aA 0.14 aB 0.16 bB 0.12 aB 0.33 ab
40F 0.90 aA 0.11 aC 0.34 aB 0.16 aC 0.38 a
Mean 0.92 A 0.12 B 0.17 B 0.09 B
Means in the same column and crop cycle followed by the same lower case letter are not significantly different (P = 0.05). Means in the same row and crop cycle followed by the same capital letter are not significantly different (P = 0.05).

55
Table 2-9. Physiological measurements analysis of variance F ratios and level of significance
Source of Variation
Genotype (G) Water (W) G*W Day (D) G*D W*D G*W*D
Plant Cane
Stomatal Conductance 57.25*** 1.05 0.48 28.99*** 2.83** 0.50 0.86
SPAD 26.66*** 4.00* 2.45* 33.78*** 14.53*** 1.39 1.18
df 3 2 6 5 15 10 30
First Ratoon
Stomatal Conductance 45.66*** 0.48 0.28 17.66* 1.03 1.00 1.35
SPAD 34.04*** 3.68* 2.12 8.16* 3.82** 1.42 1.38
df 3 2 6 2 6 4 12
S. Plant Cane
Stomatal Conductance 147.61*** 6.01** 1.00 7.13** 5.87*** 1.06 1.71*
SPAD 76.02*** 19.57*** 2.45* 24.31*** 17.89*** 1.94 1.33
df 3 2 6 5 15 10 30
*, **, ***indicates P < 0.05, 0.01, and 0.001, respectively.
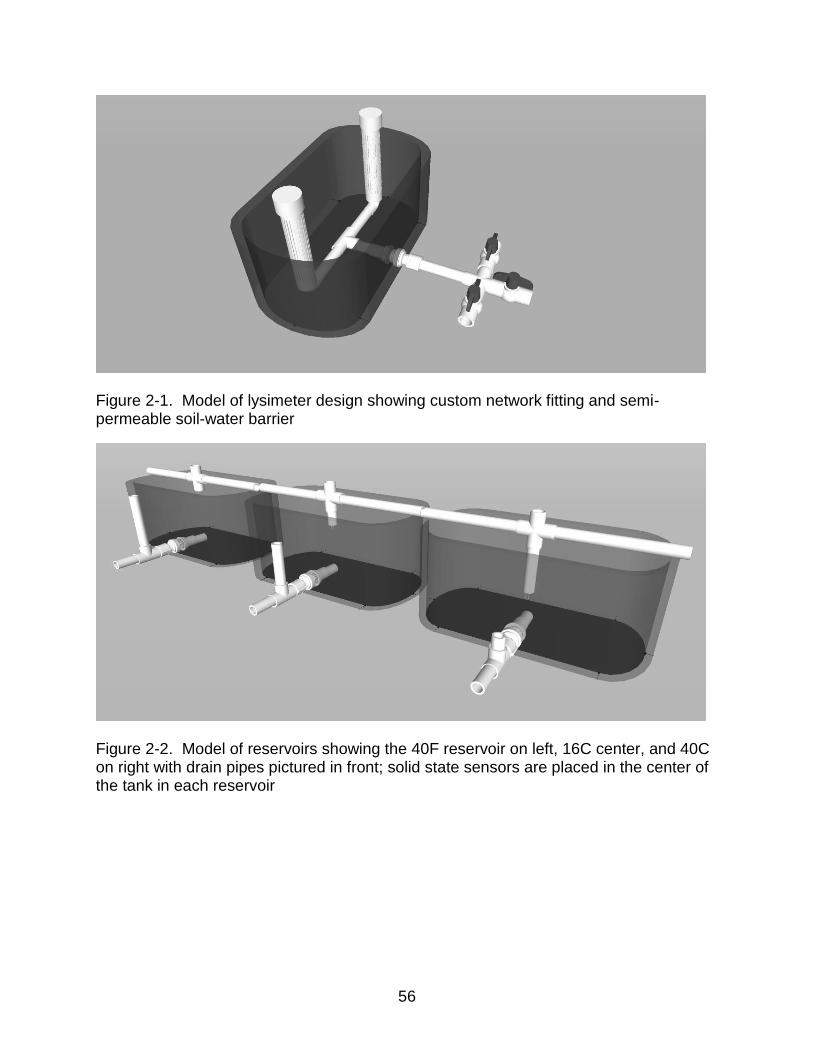
56
Figure 2-1. Model of lysimeter design showing custom network fitting and semi-permeable soil-water barrier
Figure 2-2. Model of reservoirs showing the 40F reservoir on left, 16C center, and 40C on right with drain pipes pictured in front; solid state sensors are placed in the center of the tank in each reservoir

57
Giant Reed
Days After Planting
0 20 40 60 80 100
SP
AD
0
30
40
50
60
40C
16C
40F
Elephant Grass
Days After Planting
0 20 40 60 80 100
SP
AD
0
30
40
50
60
Energycane
Days After Planting
0 20 40 60 80 100
SP
AD
0
30
40
50
60
Sugarcane
Days After Planting
0 20 40 60 80 100
SP
AD
0
30
40
50
60
A B
C D
Figure 2-3. Effect of the interaction of genotype, water table, and day of measurement on SPAD in plant cane crop for (A) giant reed, (B) elephant grass, (C) energycane, and (D) sugarcane

58
Giant Reed
Days After Planting
30 35 40 45 50 55 60 65
SP
AD
0
30
40
50
40C
16C
40F
Elephant Grass
Days After Planting
30 35 40 45 50 55 60 65
SP
AD
0
30
40
50
Energycane
Days After Planting
30 35 40 45 50 55 60 65
SP
AD
0
30
40
50
Sugarcane
Days After Planting
30 35 40 45 50 55 60 65
SP
AD
0
30
40
50
A B
C D
Figure 2-4. Effect of the interaction of genotype, water table, and day of measurement on SPAD in first ratoon crop for (A) giant reed, (B) elephant grass, (C) energycane, and (D) sugarcane

59
Giant Reed
Days After Planting
40 60 80 100 120 140
SP
AD
0
30
40
50
60
40C
16C
40F
Elephant Grass
Days After Planting
40 60 80 100 120 140
SP
AD
0
30
40
50
60
Energycane
Days After Planting
40 60 80 100 120 140
SP
AD
0
30
40
50
60
Sugarcane
Days After Planting
40 60 80 100 120 140
SP
AD
0
30
40
50
60
A B
C D
Figure 2-5. Effect of the interaction of genotype, water table, and day of measurement on SPAD in successive plant cane crop for (A) giant reed, (B) elephant grass, (C) energycane, and (D) sugarcane

60
Days After Planting
0 20 40 60 80 100
mm
ol m
-2s
-1
0
200
400
600
800
1000
1200
40C
16C
40F
Days After Planting
0 20 40 60 80 100
mm
ol m
-2s
-1
0
200
400
600
800
1000
1200
Days After Planting
0 20 40 60 80 100
mm
ol m
-2s
-1
0
200
400
600
800
1000
1200
Days After Planting
0 20 40 60 80 100
mm
ol m
-2s
-1
0
200
400
600
800
1000
1200
A B
C D
Energycane Sugarcane
Giant Reed Elephant Grass
Figure 2-6. Effect of the interaction of genotype, water table, and day of measurement on stomatal conductance in plant cane crop for (A) giant reed, (B) elephant grass, (C) energycane, and (D) sugarcane

61
Days After Planting
30 35 40 45 50 55 60 65
mm
ol m
-2s
-1
0
200
400
600
800
1000
1200
40C
16C
40F
Days After Planting
30 35 40 45 50 55 60 65
mm
ol m
-2s
-1
0
200
400
600
800
1000
1200
Days After Planting
30 35 40 45 50 55 60 65
mm
ol m
-2s
-1
0
200
400
600
800
1000
1200
Days After Planting
30 35 40 45 50 55 60 65
mm
ol m
-2s
-1
0
200
400
600
800
1000
1200
Giant Reed
Sugarcane
Elephant Grass
Energycane
A B
C D
Figure 2-7. Effect of the interaction of genotype, water table, and day of measurement on stomatal conductance in first ratoon crop for (A) giant reed, (B) elephant grass, (C) energycane, and (D) sugarcane

62
Giant Reed
Days After Planting
60 80 100 120 140
mm
ol m
-2s
-1
0
200
400
600
800
1000
Sugarcane
Days After Planting
60 80 100 120 140
mm
ol m
-2s
-1
0
200
400
600
800
1000
Elephant Grass
Days After Planting
60 80 100 120 140
mm
ol m
-2s
-1
0
200
400
600
800
1000
40C
16C
40FEnergycane
Days After Planting
60 80 100 120 140
mm
ol m
-2s
-1
0
200
400
600
800
1000
A B
C D
Figure 2-8. Effect of the interaction of genotype, water table, and day of measurement on stomatal conductance in successive plant cane crop for (A) giant reed, (B) elephant grass, (C) energycane, and (D) sugarcane

63
CHAPTER 3 CUSTOM LYSIMETER NETWORK DESIGN FOR FLOOD RESPONSE STUDIES
Abstract
Flood response studies are important for determining management practices and
flood tolerance of crops grown the Everglades Agricultural Area. Current lysimeter
designs focus on examining water quality and evapotranspiration but typically do not
emphasize water table control. A series of 48 networked lysimeters were designed,
constructed, and installed at the University of Florida Everglades Research and
Education Center in Belle Glade, Florida. The purpose of these lysimeters was to
observe the morphological and physiological response of plants subjected to variable
water table management. Each lysimeter had a volume of 0.27m3 and a surface area of
0.55 m2. The network was installed in a greenhouse with dimensions 9.5 m wide x 12.5
m long x 5.5 m tall. Lysimeters were filled with Lauderhill Muck (euic, hyperthermic
Lithic Haplosaprist). A water permeable, soil impermeable, barrier was set up on the
interior of each lysimeter using PVC screen. Each lysimeter was directly connected to
one of three water reservoir tanks. The water reservoirs consisted of a stock tank with a
drain pipe (length of vertical pipe) reaching the maximum desired depth of water and a
solid state water sensor (a tee structure containing static line with sensor probe)
reaching the minimum desired depth of water. Sensors provided input to a control board
which regulated the reservoir’s solenoid. Changing water tables in each lysimeter is
accomplished by closing one valve and opening another. Solid state sensor water level
controllers used in this design are a technology, novel to this study, that may improve
lysimeter design and function.

64
Introduction
Agricultural production in the Everglades Agricultural Area (EAA) must cope with
seasonal flooding. Soil subsidence (Shih et al., 1998), high annual rainfall (Ali et al.,
2000), and water management district pumping regulations all lead to increasing
inundation of crops in the EAA. The Everglades Research Education Center (EREC)
works on improving sustainability and profitability of the region. The soils in the EAA are
predominantly organic histosols and oxidation causes soil subsidence reducing soil
depth (Daroub et al., 2011). Allowing water to settle prior to pumping slows subsidence
and improves water quality by reducing export of phosphorus-rich sediment.
Identification and development of flood-tolerant cultivars followed by incorporation into
crop management may help increase sustainability in the EAA.
High water tables can prompt various stress responses from plants. Aerenchyma
production (Sarkar and Gladish, 2012), adventitious rooting (Pigliucci and Kolodynska,
2002), stunting and even death (McWhorter, 1972) all occur in varying magnitudes
during flood stress. To effectively examine these responses it is necessary to apply
precise water tables on experimental treatments. If new cultivars or cropping systems
are developed for use in the EAA the impact of high water tables must be examined on
their effectiveness. It has also been proposed to develop high water table tolerant crops
to use for storing water (Aillery et al., 2001).
Lysimeters are ideal mechanisms to study the influence of water table depth on
crop growth (Glaz and Lingle, 2012, Glaz and Morris, 2010). A lysimeter is defined as “A
device for measuring percolation and leaching losses from a column of soil under
controlled conditions” by the Soil Scientists Society of America. There are many
methods and ideologies concerning lysimeter form and function (Titus and

65
Mahendrappa, 1996, Kohnke et al., 1940). Lysimeters have been used to examine
leachate (Trankler et al., 2005), evapotranspiration (Scott et al., 2002), soil gas
emissions (Berglund et al., 2010), and flood response (Glaz and Lingle, 2012, Glaz and
Morris, 2010). Previous lysimeter designs have not utilized solid state sensors or water
table networking to control water level. Thus the goal of this study was to design a
lysimeter for controlling water table with the incorporation of newer technology and a
new approach of integration. This experiment draws on previous lysimeter construction
techniques and incorporates novel technology to accomplish water level control and
automation. What is unique to this design is the automation of water level through the
use of solid state switches, and networking of lysimeters. For the purposes of this study,
given the design of the lysimeters, examining water percolation and leaching is possible
but not emphasized. Precise water level control is the primary intention of this design.
Design and Construction
The experiment was conducted in a greenhouse located at the Everglades
Research Education Center in Belle Glade, Florida. The greenhouse was located at
26°40' 2.58"N and 80°38 '3.66"W, with dimensions: 9.5 m wide x 12.5 m long x 5.5 m
tall. Given resource limitations as many pre-fabricated parts as possible were used. This
approach allowed for both ease in construction and design duplication. Another benefit
in utilizing prefabricated parts is ease of replacing damaged components. This design
could be installed either inside or outside a greenhouse; however the purpose of
networking the lysimeters to the reservoir tanks is to allow for equilibration of water
level. In order to accomplish this, a stable and level foundation must be utilized. If
installed outside greater leaching would likely occur. Water inputs from precipitation
would enter from each lysimeter and exit from the drain pipe in the attached reservoir.

66
Choice of Components
In our design, it was important to have a lysimeter volume that would allow for
vigorous sugarcane biomass accumulation while fitting within the confines of the
greenhouse. Any crop may be grown in these lysimeters until belowground biomass fills
265 liters without becoming root bound. The time required for roots to fill the tank will
vary by crop and if so desired larger stock tanks could be utilized. The concept of
networking lysimeter tanks requires each tank to have an internal and external pipe
fitting, thus requiring the installation of a bulkhead adapter. Another major concern was
root growth; within a short period of time, sugarcane roots can completely fill a 20 liter
pot often causing variability in plant morphology. In order to study longer term growth
the tanks had to have a relatively large volume. For this reason Rubbermaid 265 liter
(70 gallon) stock tanks were chosen (Rubbermaid, Huntersville NC). These tanks come
pre-installed with 3.2 cm (1 ¼”) female pipe thread (FPT) bulkhead adapters. Fifty-one
tanks were purchased, 48 as experimental units and three as water reservoirs. These
reservoirs were the basis for the management and automation of water levels within the
treatments.
Given the bulkhead adapter dimensions and availability of parts, nominal pipe
size polyvinylchloride (PVC) piping was used for the internal and external fittings within
each tank and reservoir. A manufactured electronic fill device (Jandy LX-2, Vista,
California) was chosen for controlling water inputs. These are used for mitigating
evaporation losses in residential pools. PVC pipe provided good structural material for
the solid state water level sensor installation. The solid state sensor on the Jandy LX-2
fits into a 2.5 cm PVC coupling.

67
Measurements needed to be taken throughout plant growth. In order to
maneuver through the greenhouse and take plant measurements the material used to
connect each tank needed to be flexible and resist damage if stepped on. This
connecting material must also have a sufficient volume to convey water with enough
speed as to minimize water level equilibration times and decrease the ability of
sediment to clog the system. Due to these considerations it was decided to use kink-
resistant 1.6 cm (5/8”) garden hose to network tanks.
Float-based switches are problematic in systems used to examine plant growth.
Organic deposits can foul mechanisms and result in failure. In situations where plants
are growing adjacent to the switch debris can fall into the float and also cause failure.
For this reason it was decided to devise a novel use for technology typically reserved for
bilge pumps and pool level controllers. Solid state water level sensors utilize an electric
relay to close a circuit when sensor heads are submerged in water. A magnetic field is
generated between two sensor heads that becomes altered upon submersion which
opens or closes a relay. On the LX-2 sensor the relay is only engaged when the water
level falls below the sensor head. This occurs often as evapotranspiration is constantly
lowering water level.
System Layout
The lysimeters were constructed to examine the response of four genotypes to
three water tables. Before construction began, a treatment map was drafted which
placed each of the twelve treatments within the greenhouse into four replications
centered on the three reservoir tanks. Chosen water tables represented possible
management practices for increasing water table depth. Water tables were defined by
distance from the soil surface. These consisted of the two constant depths of -16 cm

68
and -40 cm (16C and 40C) and a periodically flooded (40F) water table. The 40C was
the lowest water table used in this study, with the 16C and 40F representing increasing
water table depth management respectively. The periodically flooded water table was
flooded for two weeks and then drained to -40 cm for two weeks. The dimensions of the
greenhouse would accommodate rows of no more than six lysimeters; thus each
replicate was split into two rows of six lysimeters. Each row of six tanks within a
replicate was parallel to the three reservoirs and at an equal distance such that a row of
six was present on either side of the reservoirs.
Assembly and Installation
Stock tanks were installed with custom pipe fittings. These fittings ended on the
inside of the tank in two vertical columns, resembling a large U structure (Figure 3-1) of
3.2 PVC screens, and on the outside with three 1.9 cm ball valves. From end to end the
tub fitting consisted of a 3.2 cm PVC end cap, 60 cm of 3.2 cm PVC screen, 3.2 cm to
1.9 cm reducing bushing, 1.9 cm elbow, 20 cm of 1.9 cm PVC pipe, 1.9 cm PVC tee
fitting (one end of the tee mirrored previous track, the other exited the tank), 20 cm of
1.9 cm PVC pipe, 3.2 cm male pipe thread (MPT) by slip adapter, 1.9 cm PVC cross,
and finally three 1.9 cm PVC ball valves. This resulted in two columns of water-
permeable PVC screen on the inside with three ball valves on the outside (Figure 3-1).
In order to install these fittings through the bulkhead and maintain a watertight seal it
was necessary to fabricate a custom fitting. A 3.2 cm by 1.9 cm slip by slip reducing
bushing was filed down on the inside to allow a length of 1.9 cm pipe to slide all the way
through. This was then glued to the 20 cm section of 1.9 cm pipe at roughly half the
length. The reducing bushing with pipe was then glued into the 3.2 cm MPT by slip

69
adapter and installed into the 265 liter stock tank. This created a watertight fitting
through the bulkhead adapter allowing connections on the inside and outside of the tub.
Once the semipermeable pipe fittings and valves were installed in the tanks they
were filled with soil. This soil used was Lauderhill Muck (euic, hyperthermic Lithic
Haplosaprist) collected from the first meter of topsoil in a field adjacent to the
greenhouse. A total of 17 m3 was collected and placed in front of the greenhouse.
These 265-liter tanks filled with soil were too heavy to lift by hand. In order to install the
tanks within the greenhouse wooden pallets were built for each tank to rest on. The
dimensions of the pallet enabled a pallet jack to lift the filled tanks and maneuver them
into position. Empty tanks were placed outside the greenhouse on their pallets where a
front loader dumped all the necessary soil into them (slowly as to not break the installed
pipe fittings). They were then lifted with the pallet jack and placed into rows defined by
the treatment map. Upon completion eight rows of six soil-filled tanks were lined up in
the greenhouse.
Three reservoir tanks were installed in the center of the eight rows of tanks. A 3.2
cm MPT by slip adapter, 1.9 cm by 3.2 cm reducing bushing and a 1.9 cm tee were
installed on the front of the bulkhead adapter. The tee faced up, perpendicular from the
ground. One end of the tee was installed with a length of 1.9 cm PVC pipe and the other
with a barbed garden hose adapter. The length of pipe was used as the drain and each
reservoir had a unique drain pipe height corresponding to the desired highest depth of
water in each reservoir. Thus the 40C reservoir had a drain pipe approximately 39.5 cm
below the top of the reservoir, the 16C drain pipe extended to approximately 15.5 cm
from the top of the reservoir, and the 40F had a drain pipe approximately 0.5 cm below

70
the top of the reservoir. The drainage pipe was on the outside of the tank running
perpendicular to the ground. On top of the reservoirs, solid state sensors from the water
level controllers (Jandy, Model LX-2, Vista CA) were installed into a static pipe. This
was done using a length of 2.5 cm PVC pipe with a cross fitting in the middle (Figure 3-
2). The cross was installed with a length of 2.5 cm pipe that dangled into the reservoir,
and a length of 2.5 cm pipe that ran perpendicular and rested on the edges of the top of
the reservoir. This was permanently attached to the reservoir using screws to keep the
sensor from moving. The sensor housing was installed into a 2.5 cm couple housing at
the end dipping into the reservoir. The length of the pipe housing the sensor determined
the lowest depth of water in the reservoir. The tips of the sensors were as close to the
top of the tank as possible for the flood, -16 cm from the top for the 16C water table,
and -40 cm from the top for the 40C. For the 40F reservoir the sensor probes were
angled by tilting the cross by approximately 45° in order to elevate them. The drain pipe
on each reservoir sat just above the tips of the sensor. Thus any fluctuation in water
level would be controlled. The sensor wire was rooted through the structural pipe and
ran to a control panel which contained the three water level controllers along with their
solenoids. The control units were connected with the solid state sensors from each
reservoir.
The next step in assembly was installing the hoses in order to network the entire
system. The soil filled tanks had three 1.9 cm slip ball valves in a tee configuration
exiting the bulkhead adapter (Figure 3-1). To every ball valve three 1.9 cm FPT slip
adapters and three 1.9 cm MPT barbed fittings were installed. This resulted in each tank
having three barbed fittings and each reservoir having one on the outside of the

71
bulkhead adapter. Using 1.6 cm garden hose and male by male barbed tees and
elbows each reservoir was connected to each tank. Garden hose was run from each
reservoir down each row of tanks, where attachments were made. This was done so
that every right valve had a direct line to the 40C reservoir, every front valve had a
direct line to the 16C reservoir, and every left valve had a direct line to the 40F
reservoir.
A plywood board was mounted to the greenhouse wall. On this plywood sheet
the three control boards and three solenoids for each of the reservoirs were installed.
The lines from the sensor probes were run from the reservoirs to the control boards.
The control boards connected to the solenoids through copper wires. Water supply to
the solenoids was supplied by a spigot and 1.6 cm garden hose which was spliced
close to the solenoids and attached to each. The spigot was pressurized by a well and
pump just outside the greenhouse. Power to the control boards was supplied by a
spliced extension cord and 115VAC outlet.
This lysimeter system used gravity and water level sensors to equilibrate water
level in reservoirs. By closing two of the three ball valves any tank can be isolated from
all but one of the reservoirs, which will control the water table depth. These reservoirs
are networked among treatments. Thus the variability of water level within treatments is
minimized to variance in soil depth and elevation from the greenhouse floor.
Adjusting Water Tables and Maintenance
In this lysimeter design, water table levels are controlled in the reservoirs and
applied to the desired tanks through networked hoses. For the purposes of this study it
was necessary to cycle between flooded conditions and drained. In order to accomplish
this, the valve connecting to the 40C reservoir was closed and the valve connecting to

72
the 40F reservoir was opened. As this was done in all tanks subjected to this treatment
water table would equilibrate over the course of a few hours. This would occur as water
from the reservoir, at a higher level, would seep through the garden hose into the tanks,
at a lower level, through the PVC screen into the soil. As the reservoir water level
lowered the solenoid would engage and water would fill the system. This occurred until
water level in the reservoir was identical to those in the tanks. When the flooded water
table was drained the valve connecting to this reservoir was closed and the valve
connecting to the 40C water table was opened. Due to the drain pipe installed on this
40C reservoir water levels would not exceed approximately 40.5 cm. Opening the 40C
valve to flooded tanks would cause a surge in water level to adjacent tanks already
connected to the 40C reservoir. In order to mitigate this issue, before opening the 40C
valve in flooded tanks, all valves in 40C tanks could be closed until equilibration.
Soil was filled as close to the top of the pot as possible; soil depth variance was
addressed by flooding and draining the tubs, allowing them to settle and then topping off
the soil in the lysimeter. After completing one sugarcane growth trial plant stools in the
lysimeters were dug up and replanted. The soil level settled throughout the trials;
therefore, after harvesting soil for the first ratoon crop was added to maintain the soil
level with the top of the lysimeter. A new randomization was used meaning that each
tank may have changed water table treatments. Given that each water table was
applied simply by opening and closing valves the process of changing water tables
between experiments was drastically simplified.
Expenses
The majority of material expenses came from purchase of the lysimeter stock
tanks and water level controllers (Table 3-1). The PVC screen may require special order

73
as it is typically sold in small lengths and can vary in price depending on vendor. The
stock tanks are typically available from restaurant or large animal supply vendors. All
other parts are stocked by most hardware stores and can be picked up without specialty
ordering. Not included in expenses for this trial is the cost of the foundation. As
mentioned earlier these were installed in a greenhouse. A solid stable foundation is
necessary to utilize the equilibration technique described in this paper. This would
comprise the largest expense in construction and would vary on location and choice of
materials.
Summary
A custom network of lysimeters was designed and installed at the Everglades
Research Education Center in Belle Glade, Florida. The lysimeters successfully
managed water table levels, while continually adjusting for evapotranspiration.
Changing water table in these lysimeters was accomplished simply by opening and
closing valves. Solid state sensors controlled solenoids which maintained water level to
desired depth in reservoirs while gravity and a system of networked hoses equilibrated
this water level into treatment lysimeters.
Three water tables were used for this study however this system is capable of
incorporating more. Adding more valves to the fitting exiting the bulkhead adapter with
corresponding reservoirs would effectively increase the amount of water tables.
Transitioning from one water table to another is a simple process of opening and closing
valves and reduces user error. The system consists of a functional unit in the plant-soil-
air continuum and could be used for studies of water table effects on various systems.

74
Table 3-10. Index of materials used, quantity, and pricing as of January 2011
Category Quantity Price in
USD Total
Rubbermaid 265 Gallon Stock Tanks 51 75.00 3825.00
Jandy LX-2 Water Controllers 3 350.00 1050.00
3.2 cm PVC Well Screen 61 m 6.67 / m 406.87
1.9 cm ball valve 144 2.00 288.00
3.2 cm to 1.9 cm MPT x Slip adapter 51 0.90 45.90
3.2 cm to 1.9 cm slip x Slip reducing bushing 147 0.90 132.30
1.9 cm slip X slip elbow fitting 96 0.30 28.80
3.2 cm PVC cap 96 1.00 96.00
1.9 cm slip X FPT adapter 147 0.47 69.09
1.9 cm MPT X 1.6 cm barbed adapter 147 1.00 147.00
1.6 cm barbed tee fitting 60 2.16 129.60
1.6 cm barbed elbow fitting 60 1.00 60.00
1.9 cm PVC Pipe 61 m 0.72 / m 43.92
3.2 cm PVC Pipe 12.2 m 2.10 / m 25.62
2.5 cm PVC pipe 6.1 m 1.48 / m 9.03
2.5 cm cross fitting 3 1.00 3.00
2.5 cm tee fitting 6 1.00 6.00
51.6 cm garden hose 300ft 0.24/ft 72.00
Total Material Expenses
6438.13

75
Figure 3-9. Model of lysimeter design showing custom network fitting and semi-permeable soil-water barrier
Figure 10. Model of reservoirs showing the 40F reservoir on left, 16C center, and 40C on right. Drain pipes pictured in front; solid state sensors are placed in the center of the tank at the desired water table level in each reservoir

76
LIST OF REFERENCES
Abtew, W. 2001. Evaporation estimation for Lake Okeechobee in South Florida. Journal of Irrigation and Drainage Engineering 127:140-147.
Aillery, M., R. Shoemaker and M. Caswell. 2001. Agriculture and ecosystem restoration in South Florida: Assessing trade-offs from water-retention development in the everglades agricultural area. Am. J. Agric. Econ. 83:183-195.
Alexander, A.G. 1985. The energy cane alternative. Elsevier Science Ltd, New York.
Ali, A., W. Abtew, S. Van Horn and N. Khanal. 2000. Temporal and spatial characterization of rainfall over central and south florida. J. Am. Water Resour. Assoc. 36:833-848.
Andreis, H. 1976. Water table study on an everglades peat soil - effects on sugar-cane and on soil subsidence. Sugar J. 39:8-12.
Angelini, L., L. Ceccarini and E. Bonari. 2005. Biomass yield and energy balance of giant reed (arundo donax L.) cropped in central italy as related to different management practices. Eur. J. Agron. 22:375-389.
Angelini, L.G., L. Ceccarini, N.N.o. Di Nassa and E. Bonari. 2009. Comparison of arundo donax L. and miscanthus x giganteus in a long-term field experiment in Central Italy: Analysis of productive characteristics and energy balance. Biomass Bioenerg. 33:635-643.
Armstrong, W. 1979. Aeration in higher plants. Adv. Bot. Res. 7:225-332.
Bastianoni, S. and N. Marchettini. 1996. Ethanol production from biomass: Analysis of process efficiency and sustainability. Biomass Bioenerg. 11:411-418.
Berglund, O., K. Berglund and L. Klemedtsson. 2010. A lysimeter study on the effect of temperature on CO2 emission from cultivated peat soils. Geoderma 154:211-218.
Bischoff, K.P., K.A. Gravois, T.E. Reagan, J.W. Hoy, C.A. Kimbeng, C.M. LaBorde and G.L. Hawkins. 2008. Registration of 'L 79-1002' sugarcane. J. Plant Regist. 2:211-217.
Blom, C. 1999. Adaptations to flooding stress: From plant community to molecule. Plant Biol. 1:261-273.
Brito, C.J.F., R.A. Rodella, F.C. Deschamps and Y. Alquini. 1997. Structure of the leaf blade and sheath of elephant grass ( pennisetum purpureum schum., poaceae) cultivars.; organizacao estrutural da lamina e da bainha foliar de cultivares de capim-elefante ( pennisetum purpureum schum.-poaceae). Arq. Biol. Tecnol. 40:661-671.

77
Brito, C., R. Rodella, F. Deschamps and Y. Alquini. 1999. Quantitative anatomy and in vitro tissue degradation in elephant grass (pennisetum purpureum schumach.) cultivars. Rev. Bras. Zootecn. 28:223-229.
Brown, R.H. 1978. A difference in N use efficiency in C3 and C4 plants and its implications in adaptation and evolution. Crop Sci. 18:93-98.
Burner, D.M., T.L. Tew, J.J. Harvey and D.P. Belesky. 2009. Dry matter partitioning and quality of miscanthus, panicum, and saccharum genotypes in Arkansas, USA. Biomass Bioenerg. 33:610-619.
Burton, G.W. 1989. Registration of merkeron napiergrass. Crop Sci. 29:1327-1327.
Caudle, K.L. and B.R. Maricle. 2012. Effects of flooding on photosynthesis, chlorophyll fluorescence, and oxygen stress in plants of varying flooding tolerance. Trans. Kans. Acad. Sci. 115:5-18.
Chen, H., R. Qualls and G. Miller. 2002. Adaptive responses of lepidium latifolium to soil flooding: Biomass allocation, adventitious rooting, aerenchyma formation and ethylene production. Environ. Exp. Bot. 48:119-128.
Chong, B.F. and M.G. O'Shea. 2012. Developing sugarcane lignocellulosic biorefineries: Opportunities and challenges. Biofuels 3:307-319.
Christou, M., M. Mardikis and E. Alexopoulou. 2001. Research on the effect of irrigation and nitrogen upon growth and yields of arundo donax L. in Greece. Aspects of Applied Biology47-55.
Chynoweth, D., C. Turick, J. Owens, D. Jerger and M. Peck. 1993. Biochemical methane potential of biomass and waste feedstocks. Biomass Bioenerg. 5:95-111.
Cosentino, S., V. Copani, G. D'Agosta, E. Sanzone and M. Mantineo. 2006. First results on evaluation of arundo donax L. clones collected in Southern Italy. Ind. Crop. Prod. 23:212-222.
Daroub, S.H., T.A. Lang and S.v. Horn. 2010. Best management practices in south florida: A success story. Proceedings of the 19th World Congress of Soil Science: Soil Solutions for a Changing World, Brisbane, Australia, 1-6 August 2010.Division Symposium 3.2 Nutrient Best Management Practices302-305.
Daroub, S.H., S.v. Horn, T.A. Lang and O.A. Diaz. 2011. Best management practices and long-term water quality trends in the everglades agricultural area. Crit. Rev. Environ. Sci. Technol. 41:608-632.
Dawson, L. and R. Boopathy. 2008. Cellulosic ethanol production from sugarcane bagasse without enzymatic saccharification. BioResources 3:452-460.

78
Deren, C.W., G.H. Snyder, P.Y.P. Tai, C.E. Turick and D.P. Chynoweth. 1991. Biomass production and biochemical methane potential of seasonally flooded inter-generic and inter-specific saccharum hybrids. Bioresour. Technol. 36:179-184.
Ditomaso, J.M., J.K. Reaser, C.P. Dionigi, O.C. Doering, E. Chilton, J.D. Schardt and J.N. Barney. 2010. Biofuel vs bioinvasion: Seeding policy priorities. Environ. Sci. Technol. 44:6906-6910.
Else, M., W. Davies, M. Malone and M. Jackson. 1995. A negative hydraulic message from oxygen-deficient roots of tomato plants - influence of soil flooding on leaf water potential, led expansion, and synchrony between stomatal conductance and root hydraulic conductivity. Plant Physiol. 109:1017-1024.
EREC Weather Data. Available at http://erec.ifas.ufl.edu/wd/ewdmain.htm.
Erickson, J.E., A. Soikaew, L.E. Sollenberger and J.M. Bennett. 2012. Water use and water-use efficiency of three perennial bioenergy grass crops in florida. Agriculture 2:325-338.
Evans, D. 2004. Aerenchyma formation. New Phytol. 161:35-49.
Giamalva, M.J., S.J. Clarke and J.M. Stein. 1984. Sugarcane hybrids of biomass. Biomass 6:61-68.
Gilbert, R.A., C.R. Rainbolt, D.R. Morris and J.M. McCray. 2008. Sugarcane growth and yield responses to a 3-month summer flood. Agric. Water Manage. 95:283-291.
Gilbert, R.A., C.R. Rainbolt, D.R. Morris and A.C. Bennett. 2007. Morphological responses of sugarcane to long-term flooding. Agron. J. 99:1622-1628.
Glaz, B. and R. Gilbert. 2006. Sugarcane response to water table, periodic flood, and foliar nitrogen on organic soil. Agron. J. 98:616-621.
Glaz, B., S.T. Reed and J.P. Albano. 2008. Sugarcane response to nitrogen fertilization on a histosol with shallow water table and periodic flooding. J. Agron. Crop Sci. 194:369-379.
Glaz, B., D. Morris and S. Daroub. 2004. Sugarcane photosynthesis, transpiration, and stomatal conductance due to flooding and water table. Crop Sci. 44:1633-1641.
Glaz, B., S. Edme, J. Miller, S. Milligan and D. Holder. 2002. Sugarcane cultivar response to high summer water tables in the everglades. Agron. J. 94:624-629.
Glaz, B., J. Miller, C. Deren, P. Tai, J. Shine and J. Comstock. 2000. Registration of 'CP 89-2143' sugarcane. Crop Sci. 40:577-577.
Glaz, B. and S.E. Lingle. 2012. Flood duration and time of flood onset effects on recently planted sugarcane. Agron. J. 104:575-583.

79
Glaz, B. and D.R. Morris. 2010. Sugarcane responses to water-table depth and periodic flood. Agron. J. 102:372-380.
Glaz, B., J.M. Shine Jr., M.S. Irey, R. Perdomo, G. Powell and J.C. Comstock. 2011. Seasonal fiber content of three sugarcane cultivars in three crop cycles on sand and muck soils. Agron. J. 103:211-220.
Goncalves Mota, V.J., S.T. dos Reis, E.C. Junqueira de Sales, V.R. Rocha Junior, F.G. de Oliveira, S.F. Walker, C.E. Martins and A.C. Coser. 2010. Irrigation depth and nitrogen doses on elephant-grass pastures during the dry season in the north of minas gerais state. Rev. Bras. Zootecn. 39:1191-1199.
Gordon, D.R., K.J. Tancig, D.A. Onderdonk and C.A. Gantz. 2011. Assessing the invasive potential of biofuel species proposed for Florida and the United States using the Australian Weed Risk Assessment. Biomass Bioenerg. 35:74-79.
Hebert, L.P. 1971. US sugar cane field station, Canal Point, Florida—first fifty years 1920–1970. Sugar y Azucar 66:73-76.
Huang, H., S. Ramaswamy, W. Al-Dajani, U. Tschirner and R.A. Cairncross. 2009. Effect of biomass species and plant size on cellulosic ethanol: A comparative process and economic analysis. Biomass Bioenerg. 33:234-246.
Hunt, F. 1951. Effects of flooded soil on growth of pine seedlings. Plant Physiol. 26:363-368.
Idris, S.M., P.L. Jones, S.A. Salzman and G. Allinson. 2012. Performance of the giant reed (arundo donax) in experimental wetlands receiving variable loads of industrial stormwater. Water Air Soil Pollut. 223:549-557.
Iwanaga, F. and F. Yamamoto. 2007. Growth, morphology and photosynthetic activity in flooded alnus japonica seedlings. J. for. Res. 12:243-246.
Jackson, M. and W. Armstrong. 1999. Formation of aerenchyma and the processes of plant ventilation in relation to soil flooding and submergence. Plant Biol. 1:274-287.
Jing, Y.X., G.L. Li, B.H. Gu, D.J. Yang, L. Xiao, R.X. Liu and C.L. Peng. 2009. Leaf gas exchange, chlorophyll fluorescence and growth responses of melaleuca alternifolia seedlings to flooding and subsequent recovery. Photosynthetica 47:595-601.
Jung, J.H., W.M. Fouad, W. Vermerris, M. Gallo and F. Altpeter. 2012. RNAi suppression of lignin biosynthesis in sugarcane reduces recalcitrance for biofuel production from lignocellulosic biomass. Plant Biotechnol. J. 10:1067-1076.

80
Knoll, J.E., W.F. Anderson, T.C. Strickland, R.K. Hubbard and R. Malik. 2012. Low-input production of biomass from perennial grasses in the coastal plain of Georgia, USA. BioEnergy Res. 5:206-214.
Kohnke, H., F.R. Dreibelbis and J.M. Davidson. 1940. A survey and discussion of lysimeters and a bibliography on their construction and performance. Miscellaneous Publication.United States Department of Agriculture 372:67.
Kozlowski, T.T. 1982. Water supply and tree growth. part II flooding. Forestry Abstracts 43:145-161.
Kozlowski, T.T. 1984. Plant-responses to flooding of soil. Bioscience 34:162-167.
Kramer, P. 1940. Causes of decreased absorption of water by plants in poorly aerated media. Am. J. Bot. 27:216-220.
Leakey, A.D.B. 2009. Rising atmospheric carbon dioxide concentration and the future of C4 crops for food and fuel. Proc. R. Soc. B-Biol. Sci. 276:2333-2343.
Lewandowski, I., J. Scurlock, E. Lindvall and M. Christou. 2003. The development and current status of perennial rhizomatous grasses as energy crops in the US and Europe. Biomass Bioenerg. 25:335-361.
Luo, F., K.A. Nagel, B. Zeng, U. Schurr and S. Matsubara. 2009. Photosynthetic acclimation is important for post-submergence recovery of photosynthesis and growth in two riparian species. Ann. Bot. 104:1435-1444.
Madeira, A., A. Ferreira, A. de Varennes and M. Vieira. 2003. SPAD meter versus tristimulus colorimeter to estimate chlorophyll content and leaf color in sweet pepper RID D-1122-2009. Commun. Soil Sci. Plant Anal. 34:2461-2470.
McWhorter, C.G. 1972. Flooding for johnson-grass control. Weed Sci. 20:238-241.
Meinerz, G.R., C.J. Olivo, M.F. Ziech, C.A. Agnolin, A.P. Dullius and R.d.S. Moraes. 2008. Nutritional composition of elephant grass pastures submitted to two management strategies under grazing. Acta Scientiarum Animal Sciences 30:379-385.
Milligan, S., K. Gravois and F. Martin. 1996. Inheritance of sugarcane ratooning ability and the relationship of younger crop traits to older crop traits. Crop Sci. 36:45-50.
Mislevy, P., F. Martin, M. Adjei and J. Miller. 1995. Agronomic characteristics of US 72-1153 energycane for biomass. Biomass Bioenerg. 9:449-457.
Morris, D.R. and P.Y.P. Tai. 2004. Water table effects on sugarcane root and shoot development. Journal - American Society of Sugar Cane Technologists 24:41-59.

81
Nagasuga, K., F. Kubota, K. Hirao and K. Nada. 1998. A consideration of the water transport status in napier grass (pennisetum purpureum schumach.) based on the temporary rises in leaf photosynthesis and transpiration by plants excision. Jap. J. Crop Sci. 67:555-560.
Pennisetum purpureum Schumach. Available at http://www.fao.org/ag/AGP/AGPC/doc/Gbase/data/pf000301.htm.
Perez, M., M. Granda, R. Garcia, R. Santamaria, E. Romero and R. Menendez. 2002. Pyrolysis behaviour of petroleum pitches prepared at different conditions. J. Anal. Appl. Pyrolysis 63:223-239.
Pigliucci, M. and A. Kolodynska. 2002. Phenotypic plasticity and integration in response to flooded conditions in natural accessions of arabidopsis thaliana (L.) heynh (brassicaceae). Ann. Bot. 90:199-207.
Ragauskas, A., C. Williams, B. Davison, G. Britovsek, J. Cairney, C. Eckert, W. Frederick, J. Hallett, D. Leak, C. Liotta, J. Mielenz, R. Murphy, R. Templer and T. Tschaplinski. 2006. The path forward for biofuels and biomaterials. Science 311:484-489.
Reddy, K.R., S. Newman, T.Z. Osborne, J.R. White and H.C. Fitz. 2011. Phosphorous cycling in the greater everglades ecosystem: Legacy phosphorous implications for management and restoration. Crit. Rev. Environ. Sci. Technol. 41:149-186.
Rezk, M.R. and T.Y. Edany. 1979. Comparative responses of 2 reed species to water table levels. Egypt. J. Bot. 22:157-172.
Rice, R.W., R.A. Gilbert and J.M. McCray. 2010. Nutritional requirements for Florida sugarcane. 2012.
Rodriguez-Gamir, J., G. Ancillo, M. Carmen Gonzalez-Mas, E. Primo-Millo, D.J. Iglesias and M. Angeles Forner-Giner. 2011. Root signalling and modulation of stomatal closure in flooded citrus seedlings. Plant Physiol. Biochem. 49:636-645.
Rossa, B., A. Tuffers, G. Naidoo and D. von Willert. 1998. Arundo donax L. (poaceae) - a C3 species with unusually high photosynthetic capacity. Bot. Acta 111:216-221.
Russell, J. and H. Webb. 1976. Climatic range of grasses and legumes used in pastures - results of a survey conducted at 11th international-grassland-congress. Journal of the Australian Institute of Agricultural Science 42:156-166.
Sarkar, P. and D.K. Gladish. 2012. Hypoxic stress triggers a programmed cell death pathway to induce vascular cavity formation in pisum sativum roots. Physiol. Plantarum 146:413-426.

82
Sarkhot, D.V., S. Grunwald, Y. Ge and C.L.S. Morgan. 2012. Total and available soil carbon fractions under the perennial grass cynodon dactylon (L.) pers and the bioenergy crop arundo donax L. Biomass Bioenerg. 41:122-130.
Sartoris, G. B. and B.A. Belcher. 1949. The effect of flooding on flowering and survival of sugar cane. Sugar 44:36-39.
Saxton, A.M. 1998. A macro for converting mean separation output to letter groupings in PROC MIXED. p. 1243-1246. In A macro for converting mean separation output to letter groupings in PROC MIXED. In proc. 23rd SAS users group intl. SAS Institute, Cary, NC. 1998.
Scott, D., N. Bayfield, A. Cernusca and D. Elston. 2002. Use of a weighing lysimeter system to assess the effects of trampling on evapotranspiration of montane plant communities. Can. J. Bot. -Rev. can. Bot. 80:675-683.
Shih, S., B. Glaz and R. Barnes. 1998. Subsidence of organic soils in the everglades agricultural area during the past 19 years. Soil Crop Sci. Soc. Fla. Proc. 57:20-29.
Sinclair, T., C. Tanner and J. Bennett. 1984. Water-use efficiency in crop production. Bioscience 34:36-40.
Somma, D., H. Lobkowicz and J.P. Deason. 2010. Growing america's fuel: An analysis of corn and cellulosic ethanol feasibility in the united states. Clean Technol. Environ. Policy 12:373-380.
Song, K., S. Lee, W.J. Mitsch and H. Kang. 2010. Different responses of denitrification rates and denitrifying bacterial communities to hydrologic pulsing in created wetlands. Soil Biol. Biochem. 42:1721-1727.
Spencer, D.F. 2012. Response of arundo donax L. (giant reed) to leaf damage and partial defoliation. J. Freshwat. Ecol. 27:77-87.
Titus, B.D. and M.K. Mahendrappa. 1996. Lysimeter system designs used in soils research: A review.
Trankler, J., C. Visvanathan, P. Kuruparan and O. Tubtimthai. 2005. Influence of tropical seasonal variations on landfill leachate characteristics - results from lysimeter studies. Waste Manage. 25:1013-1020.
Tsukahara, H. and T. Kozlowski. 1985. Importance of adventitious roots to growth of flooded platanus-occidentalis seedlings. Plant Soil 88:123-132.
Viator, R.P., P.M. White Jr., A.J. Hale and H.L. Waguespack. 2012. Screening for tolerance to periodic flooding for cane grown for sucrose and bioenergy. Biomass Bioenerg. 44:56-63.

83
Vincente-Chandler, J., S. Silva and J. Figarella. 1959. The effect of nitrogen fertilization and frequency of cutting on yield and composition on the yield and composition of three tropical grasses. Agron. J. 51:202-206.
Vogan, P.J. and R.F. Sage. 2011. Water-use efficiency and nitrogen-use efficiency of C3-C4 intermediate species of flaveria juss. (asteraceae). Plant Cell Environ. 34:1415-1430.
Wang, L., P.A. Jackson, X. Lu, Y. Fan, J.W. Foreman, X. Chen, H. Deng, C. Fu, L. Ma and K.S. Aitken. 2008. Evaluation of sugarcane x saccharum spontaneum progeny for biomass composition and yield components. Crop Sci. 48:951-961.
Wesseling, J. 1974. Crop growth and wet soils. Drainage for Agriculture (Agronomy no.17; Schilfgaarde, J.Van - Editor).7-37.
Woodard, K.R. and G.M. Prine. 1993. Dry-matter accumulation of elephantgrass, energycane, and elephantmillet in a subtropical climate. Crop Sci. 33:818-824.
Woodard, K.R., G.M. Prine, D.B. Bates and D.P. Chynoweth. 1991. Preserving elephantgrass and energycane biomass as silage for energy. Bioresour. Technol. 36:253-259.
Zhang, J., C. Nagai, Q. Yu, Y. Pan, T. Ayala-Silva, R.J. Schnell, J.C. Comstock, A.K. Arumuganathan and R. Ming. 2012. Genome size variation in three saccharum species. Euphytica 185:511-519.

84
BIOGRAPHICAL SKETCH
Stephen Peter Jennewein was born in Boynton Beach Florida in 1986. Having a
fascination and reverence for science he attended Palm Beach Gardens High School as
a pre medical student before attending the University of Central Florida. While attending
the University of Central Florida, Stephen pursued degrees in biology and aerospace
engineering. Completing an undergraduate program in biology in 2008 he proceeded to
work as a biological science technician for the Agricultural Research Service of the
United States Department of Agriculture. After working as a technician for two years
Stephen applied to the University of Florida’s Agronomy Department and was accepted
as a graduate student under the supervision of Dr. Gilbert.