characterization of elastomeric isolators for shock limitation of parametric modeling is that the...
TRANSCRIPT

ME 4054 – Design Projects
Characterization of Elastomeric Isolators for Shock
- Vol. 1 - May 1, 2009
Team
Matt Hildebrand Jim Holmberg Brian Kornis
Nick Haupt
Sam Newbauer
Advisors Jim Wieczorek Ed Alexander
Client

2
Executive Summary
BAE Systems required the design of a versatile test method to characterize their shock isolators with the ultimate goal of developing a finite element model of the isolator for shock analysis. The test was required to evaluate the dynamic response of the isolator and was limited to the standard testing equipment available at BAE Systems. The key parameters of interest included the velocity and displacement dependence of the isolator response under shock loading conditions. A simplified FEA model of the isolator was to be developed with the empirical test data using ANSYS software. A simulated test of the isolator must correlate with the empirical results in order to verify the design. Two conjunctive test methods were designed to fully characterize the isolators. The first test method utilized an MTS tensile testing machine to apply step and ramp displacement inputs to the isolator. Force and displacement measurements were used to determine the isolator stiffness and low velocity damping. The second test method utilized a large drop test apparatus capable of attaining high impact velocities. Acceleration and position were measured to further evaluate isolator damping. A test fixture was designed and manufactured for each of the test methods. The MTS test fixture allowed for loading in tension, compression, and shear. The drop test fixture limited the isolator deflection and effectively reduced the g-force of the impact. The isolator was modeled in ANSYS using two uncoupled, 1-dimensional mass-spring-damper systems. An iterative process was used to correlate the damping results between the FEA and empirical models.
The test methods successfully evaluated the stiffness and damping of a shock isolator. The isolator stiffness exhibited unique behavior under each loading condition. The isolator damping results were consistent between the two test methods indicating an agreement between tests. Unexpectedly, the damping force was shown to be independent of velocity. The FEA model of the isolator correlated within the 95% confidence interval of the empirical results. Large uncertainties in the drop test result were attributed to resolution precision error associated with the measuring devices. Further design work is needed before high velocity testing of the isolator can be completed in tension and shear.

3
Table of Contents Title ........................................................................................................ 1
Executive Summary ................................................................................ 2
1. Problem Definition ......................................................................... 5
1.1 Problem Scope .............................................................................................. 5 1.2 Technical Review .......................................................................................... 5
1.2.1 Modeling Shock Isolators ............................................................................................ 5
1.2.2 Damping Modes in Rubber ......................................................................................... 7
1.2.3 BAE Approach .............................................................................................................. 7
1.2.4 BAE Test Equipment .................................................................................................... 9
1.3 Design Requirements .................................................................................. 11 1.3.1 Isolator Test .............................................................................................................. 11
1.3.2 Isolator Test Fixtures ................................................................................................. 12
1.3.3 FEA Model of the Isolator ......................................................................................... 12
2. Design Description ....................................................................... 13
2.1 Summary .................................................................................................... 13 2.2 Detailed Description ................................................................................... 13
2.2.1 Functional Block Diagram ......................................................................................... 14
2.2.2 Functional Description .............................................................................................. 14
Shock Isolator .................................................................................................................... 14 MTS Fixture and Test Method ......................................................................................... 15 Drop Test Fixture and Test Method .................................................................................. 18 Data Analysis (MATLAB and SIMULINK) ............................................................................ 20 ANSYS FEA Model ............................................................................................................. 22
2.3 Additional Uses ........................................................................................... 23
4
Table of Contents 3. Evaluation .................................................................................. 24
3.1 Evaluation Plan ........................................................................................... 24 3.2 Evaluation Results ....................................................................................... 25 Design Requirement 1: Evaluation of Isolator Stiffness .................................................. 25 Design Requirement 2: Evaluation of Isolator Damping ................................................... 26 Design Requirement 3: MTS Test Fixture Deflection ........................................................ 27 Design Requirement 4: Drop Test Fixture Stiffness .......................................................... 28 Design Requirement 5: ANSYS Isolator Model Correlation .............................................. 29
3.3 Discussion ................................................................................................... 30 3.3.1 Strengths and Weaknesses ....................................................................................... 30
3.3.2 Next Steps ................................................................................................................. 32
References ........................................................................................... 33

5
1
Finite element analysis plays an important role in designing for naval shock applications. Simulated testing ensures that onboard weapons systems will retain their structural integrity and continue to function following shock events. Recent advances in the capabilities of computer-aided simulation are motivated by the high cost and severe environmental impact of real event testing [1]. New technology has allowed the use of more detailed and sophisticated models for predicting system level response. Presently it is desired to develop a more accurate and simplified representation of shock isolation systems for use in comprehensive dynamic analysis.
Problem Definition
1.1 Problem Scope
The problem is to provide British Aerospace (BAE) a versatile testing method for their shock isolators with the goal of developing a Finite Element Analysis (FEA) model for shock analysis. Fixtures for mounting the isolators must be designed and manufactured so the tests can be performed on BAE equipment. The required test results include the load-deflection-time properties and failure envelopes of a shock isolator at the appropriate velocity levels. Key parameters of interest are the velocity and displacement dependence of the isolator response. A simplified FEA model is to be developed and correlated with the empirical test data using ANSYS software. The limits of ANSYS transient analysis are to be documented along with experimental methods, data analysis, and results.
1.2 Technical Review
1.2.1 Modeling Shock Isolators
There are two approaches to modeling isolators: analytical modeling based on physical and geometrical data, and parametric modeling based on experimental data [2]. The analytical model is used to calculate the shock absorber force as a function of displacement, velocity, and acceleration from a system of differential equations. Conversely, the parametric model uses experimental data to develop an input/output relation of the shock absorber and is ideal for computer aided engineering (CAE) models. While the parametric parameters of the model may or may not have any physical meaning, they are strongly correlated with measurements.

6
The limitation of parametric modeling is that the model is only valid within the boundary of the test conditions. That is, the parametric model of a shock isolator is only accurate to the specific conditions under which the real isolator was tested. Since the objective is to characterize the dynamic performance of an isolator for simulations and benchmarking, a parametric modeling approach is considered appropriate.
Due to the complex dynamic behavior of shock isolators, a simplified analytical model is also desirable. The most important problem in the implementation of a simplified analytical model is given by the non-linear stiffness and damping behavior of the isolators. It has been shown that a simplified finite element model based on the coupling of a spring and a damping element can be used to effectively characterize an isolation device. In a recent report on analytical modeling of seismic isolated structures, simplified multi-linear elastic-plastic (MEP) models of rubber bearings were investigated. The MEP models were shown to correctly reproduce any hysteresis loop and the behavior of an isolated structure within the range of deformations in which the model had been calibrated [3].
The analytical model best suited to represent the BAE isolator system is the Kelvin-Voigt viscoelastic model. This simple model consists of a spring and a damper connected in parallel, as shown in Figure 1. The total force on the system is equal to the sum of the forces on the spring and the damper. In this report, the spring force is referred to as the isolator stiffness, and the damping force is referred to as the isolator damping.
Equation 1: Kelvin-Voigt Viscoelastic Model One characteristic specific to the Kelvin-Voigt analytical model is that it ignores stress-relaxation. Since the parametric isolator model is only concerned with short-duration isolator response (less than one second), this analytical model is appropriate.
Figure 1: Kelvin-Voigt Viscoelastic Model

7
1.2.2 Damping Modes in Rubber
Damping is the energy dissipation mechanism that causes vibratory motion to slow and stop over time. The amount of damping is mostly a function of material, velocity, and frequency. Three modes of damping which are relevant to the shock isolator include viscous damping, frictional damping, and structural damping.
Viscous Damping is modeled as a mechanical system vibrating in a fluid. Energy is dissipated by fluid moving around the object. This form of damping is a function of the size and shape of the object, the viscosity of the fluid, and the velocity of the object.
Frictional (Coulomb) Damping is caused by two surfaces sliding past each other. The damping force is the product of the normal force and the coefficient of friction. The frictional damping force is independent of velocity. Structural (Hysteretic) Damping is caused by thermoelasticity and grain boundary viscosity within a material [4]. When a material is deformed, energy is absorbed and dissipated by the material itself. The effect is due to friction between the internal planes which slip or slide as the deformations take place. When a structure having material damping is subjected to vibration, the stress-strain diagram shows a hysteresis loop. The area of this loop denotes the energy lost per cycle due to the internal damping [5]. See section 1.5 of Volume 2 for a technical review on modeling each of these damping modes in ANSYS.
1.2.3 British Aerospace Approach
BAE supplies a shipboard defense system which utilizes a specific shock isolator to protect its electronic components. These electronics are stored in a box which is supported in 3-dimesions with numerous isolators. BAE engineers are currently working on a FEA model to predict the vulnerabilities of the defense system with respect to close proximity underwater explosion (UNDEX) and near-miss shock events.
Engineers must rely upon very basic data from isolator manufacturers when selecting an appropriate isolation system. This basic data includes allowable load ranges, maximum rated deflections, and the natural frequencies of the isolators. BAE conducts a series of experiments in attempt to supplement this data and to evaluate the dynamic properties of the isolators.

8
Recent test methods at BAE have included cyclic loading on material tensile test machines. The isolators were loaded in compression then tension in order to determine load-deflection behavior. Five cycles of tension/compression were completed at shifted equal-energy amplitudes to produce the asymmetric hysteresis loop shown in Figure 2.
Figure 2: Cyclic Loading on MTS Machine
The dynamic properties of the isolators vary with each direction of loading, so isolators were tested in tension, compression, and shear loading. For example, the isolator tested in Figure 2 was stiffer in compression than in tension.
The limits of current test methods at BAE are twofold. First, the MTS machine does not produce sufficient velocities needed to simulate a real shock event. The rate of displacement typically associated with a shock event is around 12ft/s. Second, the current test method measures the energy lost due to damping in a loading cycle. However, this method does not consider the displacement and velocity dependence of the isolator damping. The isolator damping is expected to exhibit some velocity and displacement dependence.

9
1.2.4 BAE Test Equipment
MTS 810 Tensile Test Machine The MTS tensile test machine is designed for tensile testing of various specimens in order to determine their mechanical properties. The MTS machine has a load rating from 1 to 110 kips. The machine consists of a heavy-duty 2x4x10 foot load frame with a fixed beam at the bottom, a moving beam (referred to as a cross head), a servohydraulic actuator in its base [7]. The actuator controls the vertical motion of the crosshead.
The shock isolation system cannot be mounted directly to the MTS machine. With an appropriate fixture, the isolator can be mounted between the two grips which are attached to the fixed beam and the moving crosshead respectively. The movement of the crosshead relative to the fixed beam generates strain within the isolator and a corresponding load. The applied force on the isolator is measured by a strain gauge load cell located on the crosshead beam. Finally, the rate of displacement can be controlled during the tensile test by specifying the relative rate of the grips. For very stiff materials, the measured displacement may also include the elongation of the grips and the fixture.
The MTS machine is able to accelerate up to a maximum velocity of 4ft/s over 0.1 inches of deflection. A typical velocity profile is shown below for the MTS machine. The shaded blue region indicates the useable deflection range for testing the isolator at a constant velocity. Typical BAE isolators are rated close to 2.0 inches of deflection, which allows for 1.8 inches of testing at 4ft/s.
Figure 3: Maximum Velocity Profile of MTS Machine Over 0.5” of Rated Deflection1
1. Rated deflection refers to the maximum allowable deflection of the isolator as specified by the manufacturer.

10
MTS Drop Test Apparatus The MTS drop test apparatus is typically used for impact testing of various objects in order to determine failure criteria. By designing an appropriate fixture and data acquisition, the dynamic response of the isolator system can be safely tested using the drop test apparatus. The drop test consists of two steel beams which guide the freefall of a 170lb mass. A profile of the drop test apparatus available at BAE systems is sketched below. The mass can be raised to variable heights up to 16 ft by a remote controlled lift mechanism. A lock/release mechanism releases the mass, which then falls freely until it collides with the fixed base.
Figure 4: MTS Drop Test Apparatus at BAE Systems
Due to the relative size of the mass compared to the isolator, the collision is assumed to be perfectly inelastic (the two masses stick together). The ratio of kinetic energy retained in the perfectly inelastic case is shown in Equation 2.
Equation 2: Ratio of Perfectly Inelastic Collision

11
1.3 Design Requirements
This project consists of three separate parts: the isolator test, the isolator test fixture, and the FEA model of the isolator. The design requirements of the test and model derive directly from specific customer needs which uniquely define the problem at hand. The design requirements of the test fixtures arose from the partial design solution; the selected test methods. The five design requirements driving the project are listed below.
1. The isolator test must evaluate the isolator stiffness over its rated deflection range (as specified by manufacturer).
2. The isolator test must evaluate the isolator damping over its rated deflection range at velocities up to 12 ft/s.
3. The MTS test fixture must not deflect more than 0.005 inches under peak loading conditions.
4. The drop test fixture must have stiffness in compression of kips/in. 5. A drop test simulation using the FEA model of the isolator must correlate within the
95% confidence interval of the empirical drop test data.
The rated deflection range and peak loading conditions are not uniquely specified here. This is due to the fact that the test method and fixture must accommodate a variety of isolators. (See section 1.2 for additional user needs and product design specifications).
1.3.1 Isolator Test – Design Requirements
Understanding the performance of the isolator during a shock event is the goal of the isolator testing. If the isolator fails in use, the defense system on the ship will fail, ultimately putting lives at risk. By fully understanding the dynamic behavior of the isolator BAE systems engineers can eliminate this risk.
The dynamic behavior of the shock isolator is characterized by its static stiffness and dynamic damping, as shown by Equation 1. Since the ultimate goal is an isolator model which represents the physical isolator, the isolator stiffness and damping must be evaluated under expected shock conditions. Peak shock velocities on the order of 12ft/second are typical. In use, the isolator is expected to withstand dynamic loading within this velocity range up to its rated deflection.
In order to evaluate the stiffness of the isolator, the test is only required to measure the force required to displace the isolator over time. However, evaluation of the isolator damping is complicated by a dependence on velocity and displacement. As a result, two tests are required to uniquely identify the stiffness and damping of the isolator.

12
1.3.2 Isolator Test Fixtures – Design Requirements
The MTS test fixture allows for the isolator to be mounted to the MTS machine and loaded in tension, compression, and shear. To ensure accurate data acquisition, the fixture must remain rigid throughout the MTS test. Shear loading of the isolator creates a moment force on the test fixture. A deflection of 0.005 inches under the maximum shear loading condition is considered tolerable to the extent that it will not affect the test results.
The main function of the drop test fixture is to prevent the isolator from being loaded beyond its rated deflection. The fixture must also be rigid in order to not interfere with the test results. Since the drop test fixture supports the isolator during the drop test, sizeable compression of the fixture will skew the measured isolator deflection.
At the same time, the drop test fixture must protect the data acquisition system from excessive shock. The acceleration of the drop test mass will be measured with piezoelectric accelerometers. The accelerometers are rated to specific shock limits. Exceeding the shock limit can damage the devices which are expensive to replace. Regular operation of the drop test mass produces a shock on the order of 105g upon impact. The magnitude of this shock event must be reduced by the test fixture in order to protect the data acquisition equipment.
1.3.3 FEA Model of the Isolator – Design Requirements
As computer power continues to increase it is important to understand both the ability of a FEA modeling to approximate real events while also accounting for the inherent limitations imposed by the model. The purpose of the FEA model of the isolator is to accurately represent the dynamic behavior of the isolator in a real shock event. The drop test can be simulated on the isolator model by applying the appropriate loading conditions. If the model accurately represents the physical isolator, the dynamic response of the system model will correlate with the empirical result. An acceptable correlation should agree within 95% confidence to the empirical result.

13
2
Design Description
2.1 Summary of the Design
Two separate test methods were designed to characterize the shock isolators. Completion of both tests was required to fully specify the dynamic properties of the isolator under the appropriate loading conditions. The first test method involved the use of a Materials Testing System (MTS) tensile machine to evaluate the isolator stiffness. The MTS machine evaluated force, displacement, and time with a load cell and position sensor. The MTS test also specified the isolator damping at low velocities (up to 4ft/s). The second test method required the use of a MTS drop test apparatus to further evaluate damping by displacing the isolator at higher velocities. The MTS drop test measured acceleration, position, and time with accelerometers and a linear position transducer.
A fixture was designed for each of the test methods. The fixture for the MTS test was a solid aluminum L-bracket which interfaced the isolator and the MTS machine. The MTS fixture allowed the isolator to be tested in tension, compression, and shear loading. The fixture for the drop test was designed for compression testing and consisted of an aluminum block, two aluminum plates, and a rubber mat. The drop test fixture limited the isolator deflection under the drop mass while effectively reducing the g-force of the impact.
A finite element model of the isolator was developed using ANSYS. The overall FEA model of the isolator consisted of two uncoupled mass-spring-damper systems. The first system accounted for loading in tension and compression while the second system accounted for loading in shear. An iterative process was used to correlate the response of the FEA model to the empirical results.
2.2 Detailed Description
The design was broken down into five essential functions which are outlined in the following block diagram. The functional block diagram illustrates how each part of the design work together to produce the isolator model which represents the real physical system.

14
2.2.1 Functional Block Diagram
Figure 5: Functional Block Diagram
2.2.2 Functional Description
Shock Isolator BAE systems use a variety of shock isolators in various applications. Since the isolator relevant to this project could not be made available for testing, a commercial isolator with comparable deflection and loading criteria was chosen for analysis. Several identical isolators were purchased for repeat testing. The rubber isolator system includes a metal base plate which must be bolted to a rigid surface in order to secure the isolator during proper use. The isolator which was tested is illustrated below. The table includes the specifications that were provided for the actual BAE isolator, as well as the tested isolator. (See section 1.3.2 and 1.4.2 of Volume 2 for isolator alternatives and selection).
Isolator Thread Max Load
Deflection @ Max Load
(A) (B) (C) (D) (E) Mount Hole Dia.
Cost (each)
Tested 3/8”-16 135 lb 0.5” 1.75” 3.88” 1.75” 2.38” 3.00” 0.34” $23.54 BAE n/a 175 lb 2.0” 4.00” 4.00” n/a n/a n/a n/a $1000
Figure 6: Isolator Specifications

15
MTS Test Fixture
The MTS test fixture was designed for mounting the isolator system to the MTS tensile machine. The fixture consists of a solid aluminum L-bracket with two rigid support arms. The bottom of the L-bracket bolts to the fixed beam of the MTS machine. The base plate of the isolator bolts to the L-bracket, which accommodates two adjustable isolator positions.
The first isolator position allows for the isolator to be loaded in either tension or compression. In this position, the isolator sits horizontal on the L-bracket and the cross head of the MTS machine threads directly into the top of the isolator. To prevent uneven loading, a washer covers the top face of the isolator.
The second isolator position allows for the isolator to be loaded in shear. In this position, the isolator attaches to the vertical side of the L-bracket. The bottom of the L-bracket is secured to the MTS machine with two bolts which are encased in an aluminum block to prevent the bracket from twisting. The top of the isolator is bolted to an aluminum “paddle” which in turn connects to the moving cross head of the MTS machine. The paddle evenly distributes the shear stress across the top of the isolator. Finally, an additional aluminum support beam adds stability to the L-bracket during shear loading. (See section 1.3.3 and 1.4.3 of Volume 2 for MTS fixture alternatives and design selection. Refer to section 2.1.2 of Volume 2 to for fully dimensioned line drawings).
Figure 7: MTS Test Fixture

16
MTS Test The first of two test methods designed to evaluate the dynamic response of the isolators was the MTS test. This test implemented an MTS tensile test machine to apply specific loading conditions to the isolator. The MTS test consisted of two separate parts: a static loading test to evaluate the isolator stiffness and a dynamic loading test to evaluate the isolator damping.
In the static loading test, ten step inputs of displacement were applied to the isolator over time intervals of one second. The magnitudes of the ten displacements were evenly incremented to cover the rated deflection range of the isolator. For each step input, the force required to maintain the isolator displacement was measured. Since no velocity is applied to the isolator during step displacements, the stiffness of the isolator is easily determined from Equation 1. The measured force is equal to the spring force.
A plot of the force versus time for a ½ inch step displacement in the test isolator is shown below. To account for the stress relaxation occurring rubber, the force at each displacement was analyzed immediately after the measured force stabilized. (See sections 4.1 and 4.2.1 of Volume 2 for discussion of the determination of this stabilization point).
Figure 8: Force versus Time MTS Test Data for 0.5inch Deflection
In the dynamic loading test, constant velocity displacements were applied to the isolator over the rated range of deflection. The constant velocity displacements were achieved by following a ramp displacement profile, as shown in Figure 3. In total, ten ramp displacements were equally incremented up to 4ft/s.
For each ramp displacement, the force required to displace the isolator at a constant rate was measured. This measured force was equal to the sum of the spring force and the damping force, as shown in Equation 1. In order to determine the damping force, the spring force (as determined from the static loading test) was subtracted from the total measured force. The isolator damping was evaluated at low velocities in tension, compression, and shear.
0
50
100
150
200
250
300
0 0.2 0.4 0.6 0.8 1 1.2
Forc
e (lb
s)
Time (Seconds)

17
During the dynamic test, the user specifies a constant velocity input. The output from the MTS test is displacement and force measurements. A sample of each of these measurements is shown below. In this test, the isolator was displaced at a constant velocity of 0.45ft/s, up to its rated deflection of 0.5inches.
Figure 9: Measured Force and Displacement for 0.45ft/s Ramp Displacement
(See section 1.3.1 and 1.4.1 of Volume 2 for MTS test alternatives and test selection).

18
Drop Test Fixture The drop test fixture was designed for mounting the isolator system to the drop test apparatus. The fixture allows for compression testing only. The drop test fixture sits freely on the base plate of the drop test apparatus. The isolator bolts to the top surface of the fixture between two rigid supports. The two supports effectively stopped the drop mass from loading the isolator past its rated deflection. (For the test isolator, this rated deflection was 0.5 inches).
The drop test fixture also includes a rubber mat which minimizes the g-force experienced by the accelerometers upon impact. The drop test fixture is modeled below.
Figure 10: Drop Test Fixture
(See section 1.3.3 and 1.4.3 of Volume 2 for drop test fixture alternatives and design selection. Refer to section 2.1.1 of Volume 2 to for fully dimensioned line drawings).

19
Drop Test The second test method designed to evaluate the dynamic response of the isolator was the drop test. This test implemented an MTS drop test apparatus to apply high velocity displacements to the isolator system.
In the drop test, a 170lb mass was allowed to freefall to a desired velocity before impacting the isolator. The velocity was determined by selecting the corresponding height. The acceleration of the drop mass was measured with an accelerometer over the duration of the test. Upon impact with the isolator, the accelerometer measures the deceleration of the mass over the rated range of deflection of the isolator. Meanwhile, the position of the mass was measured using a string potentiometer. Upon impact with the isolator, the position of the mass was taken as a measure of the isolator displacement.
The test was completed for 20 different impact velocities ranging from 2 to 13ft/s. By measuring the acceleration of the mass/isolator system, the force applied to the isolator was easily determined using Newton’s second law. By once again subtracting the known spring force, the isolator damping was evaluated over high velocities.
Upon impact with the isolator, the acceleration and position of the mass were measured. A sample of the data is shown in Figure 11 over 0.5 inches of displacement.
Figure 11 – Acceleration Data for Drop Test Impact Velocity of 2ft/s
(See section 1.3.1 and 1.4.1 of Volume 2 for drop test alternatives and test selection).

20
MATLAB MATLAB scripts were used to filter and analyze the test data. Due to high frequency noise in the measured data, a variety of low-pass digital filters were used to attenuate frequency regions outside of the desired solution domain. See Figure 12 for a comparison of the original data and the filtered data for a ramp displacement test.
Figure 12 - Velocity and Acceleration1 Data from 0.45 ft/s Ramp Displacement Test
(See section 4.1 and 4.2 of Volume 2 for complete data analysis and commented MATLAB scripts).
1. The acceleration data was used to determine the regions of constant velocity (see section 4.2.2 of Vol. 2 for further explanation).

21
Once the data was properly filtered, each empirical data set was analyzed to evaluate the corresponding isolator properties. The output from the MTS test data analysis was the stiffness and low velocity damping of the isolator in tension, compression, and shear. The output from the drop test data analysis was the damping of the isolator over a larger range of input velocities. The MATLAB outputs for each test are presented in the subsequent evaluation section.
Regression analyses were performed on the test results to provide 95% confidence intervals for all results. The test results were presented in two ways: all results were written to text files for easy implementation into finite element analyses and plots were created to allow for graphical interpretation of the results.
Simulink To help visualize and predict the results of the drop test, “Matlab Simulink” was used to simulate the dynamics of the weight during the drop test. A conceptual example of the block diagram used for the simulation is shown in Figure 13 below. The mathematical model of the isolator (Equation 1) was used to represent the dynamic response of the isolator to deflections imposed by the weight. The results of the simulation proved invaluable to designing and implementing the real-life drop test. Perturbations in the stiffness and damping were simulated to determine the corresponding change in position and acceleration. From these results, range and accuracy specifications were derived for both the measurement of position and acceleration. (See section 4.4 for complete Simulink block diagram and commented Simulink run script).
Figure 13 – Conceptual Block Diagram of Simulink Simulation

22
ANSYS FEA Model The FEA model was designed using ANSYS software. In order to represent the physical isolator, the model incorporated the empirical results for isolator stiffness and damping. The 3-dimensional problem was simplified to two uncoupled, 1-dimensional systems. The first system accounted for loading in tension and compression, while the second solution accounted for shear loading. The isolator was modeled using 1-D combination elements for which the end nodes were specified. Combination elements are defined by two nodes and a combination of physical properties such as stiffness and damping. User specified “key-options” allow the dynamic behavior of the element to be specified [6]. An analogy can be drawn between the ANSYS model and the Kelvin-Voigt Model, as shown below. Here, several ANSYS elements are overlapped to fully specify the system.
Figure 14: 1-D ANSYS Isolator Model
The empirical force deflection data collected from the MTS test was used to define the non-linear stiffness of the isolator model using the element combin39. The combin39 element is controlled via prescribed forces at defined displacements.

23
The velocity and displacement dependencies of the isolator damping are also incorporated into the FEA model. The available range of empirical data for each loading condition defines the range in which the model is valid. From the experimental results, the isolator damping was approximated as a frictional damping that changed with displacement.
To model the damping force, several combin37 elements were used in parallel. Each element was designated a specific displacement region over which it was active (turned on). Outside this region, the element was inactive (turned off). This method was used to ensure that the isolator damping was correctly modeled over the full range of displacements
The empirical drop test data was first approximated using a Matlab Simulink simulation. This simulation allowed for the early development and correlation of an FEA isolator model. The FEA model was then correlated to the empirical stiffness and damping results. An iterative process was used to make fine adjustments to the FEA model. This method helped the FEA analysis results to converge within the 95% confidence interval of the empirical data.
(See section 4.3 in Volume 2 for selected samples of the ANSYS code).
2.2 Additional Uses
The isolator test was specifically designed to work for a variety of isolator systems. The test fixtures may be easily modified to accommodate isolators with larger diameters or of different shapes all together. The test method and analysis may be extended to the modeling of other isolation systems including rubber bearings, washers, or joints which are typically used to absorb vibration.
The failure parameters of the isolators can also be determined using the MTS tensile machine and test fixture. This is accomplished by measuring the force and displacement at which the isolators fails. Failure in tension and shear loading is defined as the point at which the isolator is effectively pulled apart by the MTS machine (i.e. applied force is zero).

24
3
3.1 Evaluation Plan
Evaluation
This project consists of three separate parts: the isolator test, the isolator test fixture, and the FEA model of the isolator. The essential design requirements for the project are listed below.
Design Requirements
1. The isolator test must evaluate the isolator stiffness over its rated deflection range (as specified by manufacturer).
2. The isolator test must evaluate the isolator damping over its rated deflection range at velocities up to 12 ft/s.
3. The MTS test fixture must not deflect more than 0.005 inches under peak loading conditions (300lbf in shear).
4. The drop test fixture must have stiffness in compression of kips/in. 5. A drop test simulation using an FEA model of the isolator must correlate within the
95% confidence interval of the empirical drop test data.
The isolator test method was required to evaluate the isolator stiffness and damping under loading conditions expected in a real shock event. The isolator test method was performed on a real shock isolator to evaluate its dynamic response. The force required to displace the isolator was measured in a static loading test in order to evaluate the isolator stiffness. The force required to displace the isolator at constant velocities was measured in a series of dynamic tests in order to evaluate the isolator damping.
The MTS fixture was required to meet a minimum deflection under specific loading conditions. The fixture was first modeled using Pro-Engineer modeling software. The fixture model was then tested using ANSYS finite element analysis to ensure it met the design requirement.
The drop test fixture was required to have stiffness in compression of kips/in. This requirement was first evaluated analytically. The deflection of the fixture was then measured under test conditions to ensure the design requirement was met.
The FEA model was required to correlate with the empirical test data. This correlation was evaluated by observing the deflection, velocity, and acceleration of the isolator with respect to time.

25
3.2 Evaluation Results
Each design requirement was carefully evaluated. The evaluation methods and results are documented in five separate reports in section 3.1 of Volume 2. Abstracts for each evaluation report are provided below.
Design Requirement 1: Evaluation of Isolator Stiffness The stiffness of the isolator must be known to correctly analyze the isolator in a shock event. This report details the test method used to evaluate the isolator stiffness. The set up and test procedures for the static MTS test are provided for each loading condition (compression, tension, and shear). This report also includes test results, data analysis, and discussion sections.
The isolator stiffness for tension and compression loading is presented as a function of position in Figure 15. The isolator stiffness is shown for the shear loading condition in Figure 16. A regression analysis was completed in order to determine the 95% confidence intervals for each data set. The curves depict the measured stiffness result for each loading condition and therefore meet the design criteria.
Figure 15: Regression Analysis of Stiffness for Tension and Compression

26
Figure 16: Regression Analysis of Stiffness for Shear
Design Requirement 2: Evaluation of Isolator Damping In addition to stiffness, the damping of the isolator must be known to correctly analyze the isolator in a shock event. This report evaluates the two test methods used to determine isolator damping. The implementation and analyses of the dynamic MTS test and drop test are also presented in detail. For both tests, an input velocity was set by the user while the isolator deflection and force were measured. These measured quantities, along with the previously determined isolator stiffness, allowed for the calculation of damping force.
The dynamic MTS test evaluated the isolator damping for constant velocity displacements up to 2ft/s1. Meanwhile, the drop test evaluated the damping force across a wide range of impact velocities (2ft/s - 13ft/s). The damping evaluated at low drop velocities was compared to the damping results from the MTS test. The two test methods were shown to produce nearly the same damping force with respect to displacement. Contrary to prediction however, the damping force was determined to be independent of impact velocity. Instead, the damping force was shown to vary with position only. The drop test results for two impact velocities are shown together in Figure 17, demonstrating that damping is independent of velocity. High velocity impacts produced considerable noise in the data over the initial 50% of the displacement. For each test, the damping force peaked around 20 pounds for 0.5 inches of deflection. The isolators were tested at impact velocities up to 13 feet per second, which yielded similar results to those shown in Figure 17. As a result, the evaluation of the isolator damping effectively met the design requirement.
1. The specified velocity input of 4ft/s was not achieved for the test isolator, due to the rated deflection.

27
Figure 17: Comparison of Damping vs. Deflection at Different Impact Velocities
Design Requirement 3: MTS Test Fixture Deflection In this report, a finite element analysis was completed to determine the maximum deflection of the MTS isolator fixture under a 500lbf shear loading condition. The maximum allowable deflection was specified to be 0.005 inches. The test fixture was modeled in Pro/Engineer Wildfire 4.0 and imported into ANSYS (classic) for analysis. Forces were applied to the two positions where the isolator bolts to the test fixture to simulate the load applied during testing. The bottom of the fixture was constrained where the fixture connects to the MTS machine.
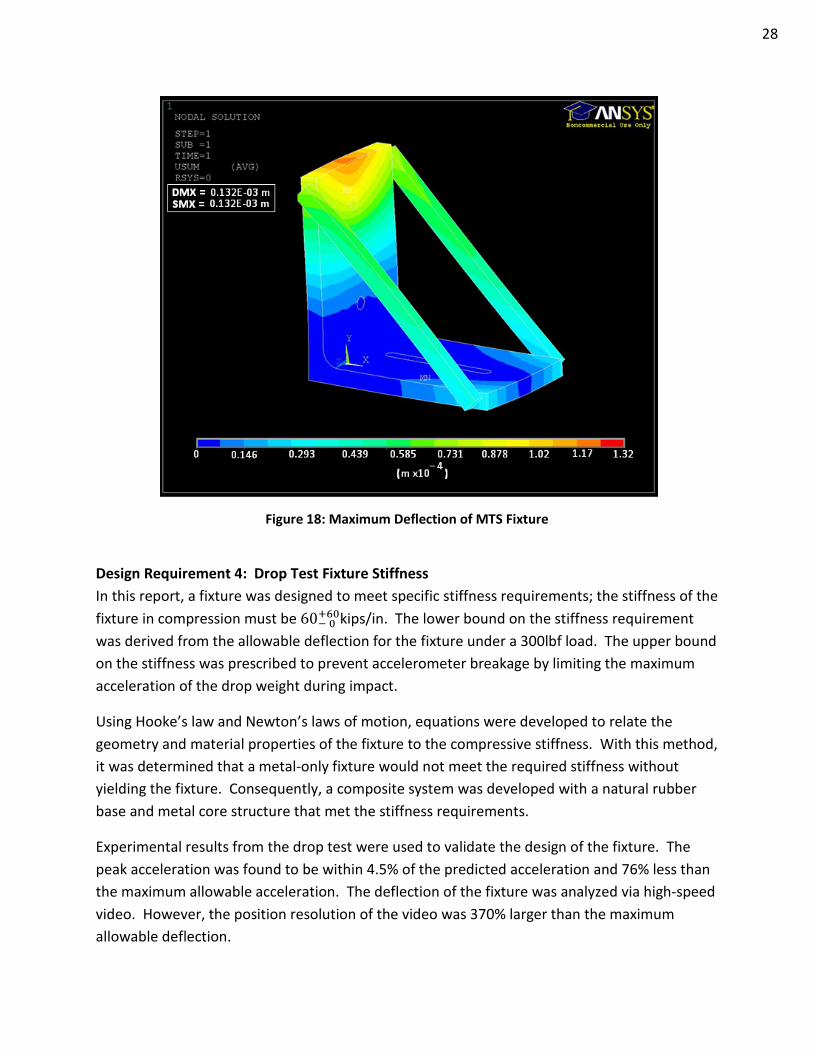
The simulation was first completed for the fixture without the two support links. The maximum deflection was determined to be 0.04 inches at the top of the fixture. This is approximately an order of magnitude larger than the maximum allowable deflection specified in the design requirement. The second simulation was completed for the fixture with the additional support links in place. The maximum deflection was determined to be 0.005 inches at the top of the fixture, as shown in Figure 18. This result signifies the worst case scenario for loading in shear and validates the inclusion of the support links in the final design. Consequently, the MTS test fixture passes the design requirement for maximum deflection.
28
Figure 18: Maximum Deflection of MTS Fixture
Design Requirement 4: Drop Test Fixture Stiffness In this report, a fixture was designed to meet specific stiffness requirements; the stiffness of the fixture in compression must be kips/in. The lower bound on the stiffness requirement was derived from the allowable deflection for the fixture under a 300lbf load. The upper bound on the stiffness was prescribed to prevent accelerometer breakage by limiting the maximum acceleration of the drop weight during impact.
Using Hooke’s law and Newton’s laws of motion, equations were developed to relate the geometry and material properties of the fixture to the compressive stiffness. With this method, it was determined that a metal-only fixture would not meet the required stiffness without yielding the fixture. Consequently, a composite system was developed with a natural rubber base and metal core structure that met the stiffness requirements.
Experimental results from the drop test were used to validate the design of the fixture. The peak acceleration was found to be within 4.5% of the predicted acceleration and 76% less than the maximum allowable acceleration. The deflection of the fixture was analyzed via high-speed video. However, the position resolution of the video was 370% larger than the maximum allowable deflection.
29
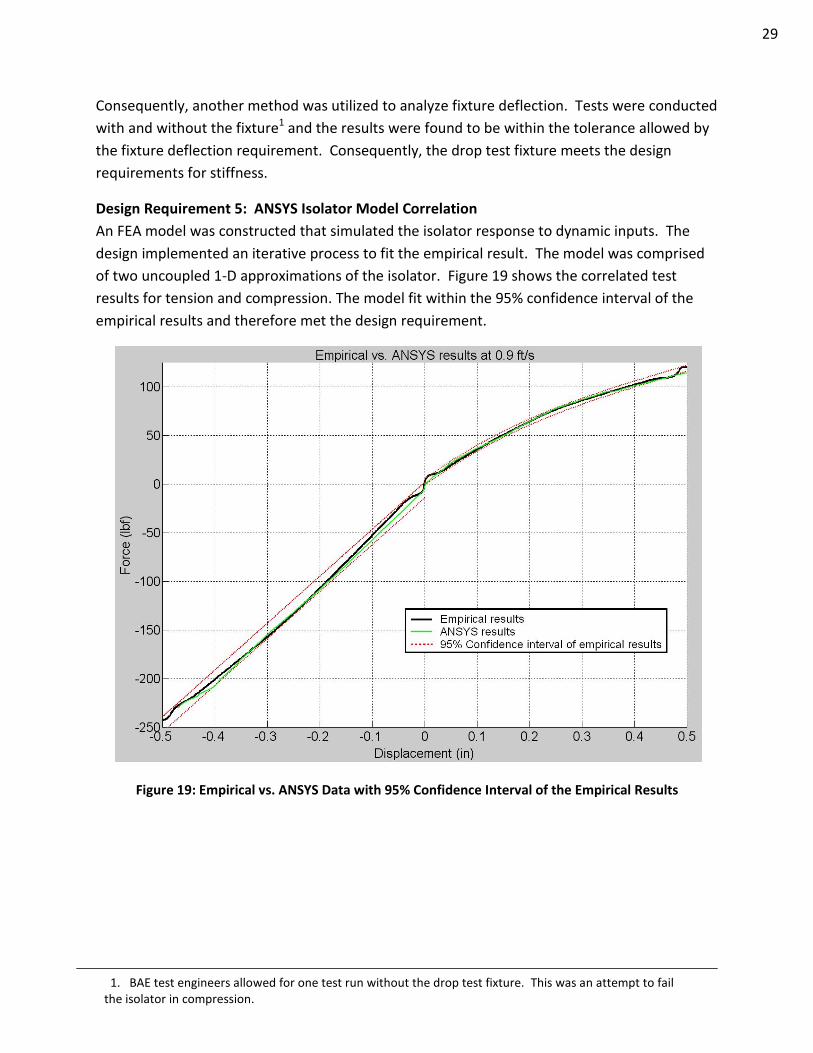
Consequently, another method was utilized to analyze fixture deflection. Tests were conducted with and without the fixture1 and the results were found to be within the tolerance allowed by the fixture deflection requirement. Consequently, the drop test fixture meets the design requirements for stiffness.
Design Requirement 5: ANSYS Isolator Model Correlation An FEA model was constructed that simulated the isolator response to dynamic inputs. The design implemented an iterative process to fit the empirical result. The model was comprised of two uncoupled 1-D approximations of the isolator. Figure 19 shows the correlated test results for tension and compression. The model fit within the 95% confidence interval of the empirical results and therefore met the design requirement.
Figure 19: Empirical vs. ANSYS Data with 95% Confidence Interval of the Empirical Results
1. BAE test engineers allowed for one test run without the drop test fixture. This was an attempt to fail the isolator in compression.

30
3.3 Discussion
3.3.1 Strengths and Weaknesses
MTS Test & Fixture
The MTS test effectively evaluated the isolator stiffness and damping in tension, compression, and shear. The MTS machine easily produced the full range of isolator deflection and had no difficulty in loading the test isolator to failure. As a result, the test can be used to characterize the stiffness and static failure parameters of the shock isolators at BAE systems.
The MTS test fixture is equally versatile and can accommodate isolators of various shapes and sizes. In addition, the fixture is relatively inexpensive to manufacture (approximately 1/10th the cost of the BAE isolator). Finally, the fixture makes the test easy for BAE technicians to set up and perform.
Due to time constraints, only two runs of the MTS test were completed. Without additional data, it is difficult to ascertain the true repeatability and accuracy of the test method.
Drop Test
The drop test effectively evaluated the damping of an isolator system in compression over high velocity displacements. The team was unable to find any documentation suggesting that this measurement had been successfully taken or even attempted prior to this project. Therefore, the evaluation of damping with the drop test was perhaps the most significant accomplishment of the project. The acquired test data allowed for a full characterization of the isolator under compression loading in a shock event. Qualitatively and quantitatively, an excellent correlation was found for the damping between the two test methods.
The weakness of the drop test method was that it produced large uncertainty in the damping. Depending on position, the mean calculation of damping force was between 8 and 20lbs. The total uncertainty in this calculation was approximately 70% of the nominal damping, which implies large confidence intervals for the results. The uncertainty analysis included precision error in the measuring devices and error from the regression analysis on the stiffness.
Drop Test Fixture
The drop test fixture was designed to be versatile in order to accommodate various isolators. It was also relatively cheap to manufacture (approximately 1/5th the cost of the BAE isolator) and simple to install. The major strength of the drop test fixture was that it successfully protected the shock isolator and the accelerometers from being damaged during testing.

31
The drop test fixture had several weaknesses. The main weakness was that the fixture only allowed the isolator to be tested in compression. To fully characterize the isolator, the isolator fixture must allow the isolator to be tested in tension and shear.
A second weakness of the drop test fixture was that over repeated testing it will likely cause damage to the drop mass. While no significant damage occurred during the testing for this project, it is suspected that multiple tests will begin to indent the bottom of the drop mass.
Finally, the resolution of the high speed camera used to measure position was not precise enough to capture the small deflection that occurred in the fixture. As a result, this measurement method was not a viable solution to confirm whether or not the drop fixture compressed past the allowable deflection during testing.
Isolator Model
The isolator model was successfully completed using ANSYS software, which is commonly used in industry. The model replicated the dynamic response of the test isolator using a combination of elements to specify the isolator stiffness and damping based on the empirical results. The model was correlated to within the 95% confidence interval of the empirical drop test result which confirms the curve fit for the isolator model.
Another strong aspect of the ANSYS isolator model is its simplicity. Incorporating only two nodes and two element types, the model is relatively quick and easy to construct, manipulate, and debug. This simplicity is essential when looking at the application for this model, for which it serves as a small component of a much larger system model.
The main weakness of the FEA model was that it was modeled as two uncoupled systems. As a result, the model can only simulate a dynamic response in 1-dimension. The 1-D models require strict constraints on displacement and loading conditions for each simulation.

32
3.3.2 Next Steps
With the completion of this project, the actual BAE isolators are ready to be tested. The next steps include improving upon the weaknesses of the design project. Multiple runs of each test will provide BAE with the means of conducting a detailed statistical analysis that will verify the repeatability of the test methods and the consistency between identical isolators.
Future design work should include reducing the uncertainty in the damping results associated with the drop test. This requires improving the precision of measuring devices and reducing systematic error in the test procedure.
The drop test apparatus must be modified in order to allow for tension and shear loading. This is a difficult task which will benefit from a thorough design process. The installation of a protective surface on the bottom of the drop test mass will prevent damage to the apparatus from multiple testing. Finally, the resolution of the high speed camera should be increased to verify that the drop test fixture continues to meet the design criteria.
BAE Systems uses NASTRAN software rather than ANSYS for finite element analysis. A 3-dimensional model must be developed which incorporates the empirical stiffness and damping properties of the isolator. A successful model of the isolator can then be incorporated into a macro model. This large system model will then be used to predict the performance of naval defense systems in near-miss shock events.

33
1. United States Department of Defense. MIL – STD – 810G, “Test Method Standard – Environmental Engineering Considerations and Laboratory Tests”. Method 516.6. October 2008.
References
2. Rao, M.D., Gruenberg, S. “Measurement of Equivalent Stiffness and Damping of Shock
Absorbers”. Experimental Techniques. March 1, 2002. Society for Experimental Mechanics Inc. 1-2.
3. Forni, M. et al. “Verification and Improvement of Analytical Modeling of Seismic Isolation Bearings and Isolated Structure”. 2007. Italy. 112-116.
4. C. Cai, H. Zheng, M. S. Khan, K. C. Hung. “Modeling of Material Damping Properties in ANSYS”. Defense Systems Division, Institute of High Performance Computing. October 2002. Germany. 2-4.
5. Liu, M., Corman, D. G. “Formulation of Rayleigh Damping and its Extensions”. School of Mechanical and Offshore Engineering, The Robert Gordon University. March 1994. Scotland, U.K. 1-3.
6. ANSYS® Classic, Release 11.0, “Help system”, Elements Reference, ANSYS Inc.
7. MTS Systems Corporation. “MTS Landmark™ Testing solutions”. March 2009. MN. 2-12. http://www.mts.com.