characterization of new populations in sunn hemp ( l.) and
TRANSCRIPT

Characterization of New Populations in Sunn Hemp (Crotalaria juncea L.) and
Relationship of Their Traits to Yield
by
Alexandros Doukopoulos
A dissertation submitted to the Graduate Faculty of
Auburn University
in partial fulfillment of the
requirements for the Degree of
Doctor of Philosophy
Auburn, Alabama
May 7, 2012
Copyright 2012 by Alexandros Doukopoulos
Approved by
Jorge A. Mosjidis, Chair, Professor of Agronomy and Soils
David B. Weaver, Professor of Agronomy and Soils
Donald M. Ball, Extension Specialist & Professor of Agronomy and Soils
Kipling S. Balkcom, Affiliate Associate Professor of Agronomy and Soils

ii
Abstract
Sunn hemp (Crotalaria juncea L.) is a short-day, erect shrubby annual, generally 1 to 4 m
in height. It is a candidate species for crop rotation schemes as a means of weed suppression and
as a green manure crop to improve soils and reduce root-knot nematode (Meloidogyne spp.)
infestations. An ongoing breeding program has resulted in a locally adapted population,
‘Selection PBU,’ that varies significantly from the non-adapted ones. In 2007 a field study was
undertaken, using two cycles of selection, in order to determine the correlation between juvenile
and mature-plant traits and to evaluate the effect of young plant selection on forage yield and
other mature-plant traits. Furthermore, several cycles of breeding populations, their parental
material and the tropical cultivar ‘Tropic Sun’, for a total of eight populations, were tested in
Alabama in 2008 and 2009. Their morphological characteristics were evaluated to identify how
the changes in photoperiodicity requirements affected the more recent selection cycles compared
to their parental populations. Additionally, germination and growth chamber studies were
conducted to determine the effect of temperature and genotype on seedling emergence and early
plant growth.
Our results indicated that selecting for traits, such as height and number of leaves at four
weeks can significantly improve biomass, both at flowering and harvesting time, as well as seed
yield. There is potential for future selections to reach higher uniformity, as shown by the higher
heritability values for the latest selection cycle compared to the more recent one. Applying equal
selection intensity as an even split of 31.6% among, and 31.6% within, family selection,
produces the largest genetic gain.

iii
Selection PBU was the best or among the best populations for morphological
characteristics important for the release of a cultivar in a temperate environment. The most
important characteristics were number of days until flowering, days until harvesting, biomass
and seed weight, as well as seed quality. The variety ‘‘Tropic Sun’’ was the poorest performer
since it produced excessive vegetative matter, very few flowers and no seed. The breeding
program has been successful in producing plants that are not photoperiodic and they have
become adapted to the sub-tropical conditions of the Southeast. In the process, the plants have
become more compact, and they flower and are ready for harvest much earlier than their parental
populations. This has allowed producing sufficient amounts of good quality seed to allow for
seed-increase and for the continuation of the breeding cycles.

iv
Acknowledgments
This dissertation is dedicated to my father Andreas, my mother Evangelia and my sister
Anastasia. Their love, support and sacrifice have been my inspiration during this study.
My deepest gratitude goes to Dr. Jorge A. Mosjidis who taught me to think critically and
to expect more from myself. His patience, financial support and constant guidance made this
project possible. I would also like to thank my committee members Dr. David B. Weaver, Dr.
Kipling S. Balkcom and Dr. Donald M. Ball for their help and their willingness to rush to meet
deadlines.
Special thanks to Gaganjot Sidhu, Theodore, Valerie, Greg and all the other student
workers for their assistance with all the field and lab experiments.

v
Table of Contents
Abstract ......................................................................................................................................... ii
Acknowledgments ....................................................................................................................... iv
List of Tables .............................................................................................................................. vii
Literature Review
Species description and origin ........................................................................................ 1
Economic benefits and utilization ................................................................................... 2
Requirements and adaptation .......................................................................................... 3
References ....................................................................................................................... 7
Relationship between juvenile-plant traits and mature-plant traits in Sunn hemp
Abstract ......................................................................................................................... 11
Introduction ................................................................................................................... 12
Materials and Methods .................................................................................................. 14
Results and Discussion ................................................................................................. 16
References ..................................................................................................................... 20
Characterization of new populations in Sunn hemp and relationship of their traits to yield
Abstract ......................................................................................................................... 28
vi
Introduction ................................................................................................................... 29
Materials and Methods .................................................................................................. 32
Results and Discussion ................................................................................................. 34
References ..................................................................................................................... 49
Daylength and Temperature Effects on Emergence and Early Growth of Crotalaria juncea
Abstract ......................................................................................................................... 63
Introduction ................................................................................................................... 64
Materials and Methods .................................................................................................. 65
Results and Discussion ................................................................................................. 67
References ..................................................................................................................... 73

vii
List of Tables
Table 1: Analysis of variance of HS families in randomized complete block design on an
individual plant basis ........................................................................................................22
Table 2: Pearson correlation coefficients among seedling traits and mature plant traits in Sunn
hemp for Cycles 1 (C1) and 3 (C3) ...................................................................................23
Table 3: Means of the top 10% seedlings for each juvenile trait compared with the means of the
whole population ...............................................................................................................24
Table 4: Percentage increases of mature-plant traits when selecting the top 10% seedling
compared with the mean of the whole population for selected mature-plant traits for
Cycle 1 (C1) and Cycle 3 (C3)..........................................................................................25
Table 5: Heritabilities and expected responses for selected traits to five selection methods for
Cycle 1 and Cycle 3...........................................................................................................27
Table 6: Mean values and analyses of variance of 12 traits of eight genotypes of Sunn hemp in
2008 at FCU and PBU.......................................................................................................49
Table 7: Mean values of two plant growth traits of 8 populations of C. juncea in 2008 at PBU.
Averages represent the means of approximately 200 plants per population.....................51
Table 8: Mean values of two plant growth traits of 8 populations of C. juncea in 2008 at FCU.
Averages represent the means of approximately 200 plants per population.....................52
Table 9: Pearson correlation coefficients among seedling traits and mature plant traits in C.
juncea for 2008 in PBU and FCU.....................................................................................53
Table 10: Mean values and analyses of variance of 16 traits of eight genotypes of Sunn hemp in
2009 at FCU and PBU.......................................................................................................55

viii
Table 11: Mean values of six plant growth traits of 8 populations of C. juncea in 2009 at PBU.
Averages represent the means of approximately 200 plants per population.....................57
Table 12: Mean values of six plant growth traits of 8 populations of C. juncea in 2009 at FCU.
Averages represent the means of approximately 200 plants per population.....................58
Table 13: Pearson correlation coefficients among seedling traits and mature plant traits in C.
juncea for 2009 in PBU and FCU......................................................................................59
Table 14: Average percentage of seedling emergence of six genotypes of Sunn hemp grown at
five day/night temperatures ...............................................................................................61
Table 15: Regression equations representing the population-temperature interaction for
emergence percentage .......................................................................................................75
Table 16: Mean values and analyses of variance of 12 traits of three genotypes of Sunn hemp
under four different day/night length temperature combinations .....................................77
Table 17: Mean values of two plant growth traits of three populations of Sunn hemp. Averages
represent the means of four plants per population ............................................................79

ix
List of Figures
Figure 1: Effect of temperature on the germination percentage for six populations of
Sunn hemp.........................................................................................................................76

1
I. Literature Review
Species description and origin
Sunn hemp (Crotalaria juncea L.) is a multifaceted legume. It is regularly used to combat
problems created by long-term monocropping of subsistence cereal crops that have depleted and
degraded the natural resource base in many poorer regions of the world (Lal, 1997). Cover crops
can be a good antidote to degraded soils and a viable solution to problems such as soil erosion,
and decline in inherent soil organic matter and fertility, especially on hillsides in the tropics and
subtropics (Balasubramanian and Blaise, 1993).
Cover crops are usually legumes or grasses or a mixture of the two grown to improve
and/or sustain the productivity of a given agricultural system. Although the terms `cover crop'
and `green manure' have sometimes been used interchangeably (Smith et al., 1987), they are
recognized to be distinct (Lal et al., 1991). The sole function of a green manure species is to
enhance soil fertility and improve nutrient cycling. Cover crops fulfill additional functions such
as weed suppression, pest and disease control, soil and water conservation, and the provision of
food and animal feed.
Sunn hemp is a short-day, herbaceous annual, generally 1 to 4 m in height that is
probably native to the Indo-Pakistan subcontinent. It belongs to the genus Crotalaria, the family
Fabaceae, the subfamily Papilionoideae, and the tribe Crotalarieae (van Wyk and Schutte 1995).

2
It contains approximately 550 species dispersed throughout the temperate, subtropical, and
tropical regions of the world. Sunn hemp has a basic chromosome number (n) of 8.
Economic benefits and utilization
It is a fast growing species that is widely grown as a cover and/or green manure crop in
the tropics where it is also grown for fiber and animal fodder (Purseglove 1981). The neutral
detergent fiber (NDF) and acid detergent fiber (ADF) values of sunn hemp leaves indicate that
their forage quality is acceptable for lactating cows. NDF values of leaves 6 to 12 weeks after
planting (WAP) range between 244 to 373 g kg-1
and ADF values range between 189 and 289 g
kg-1
. Stems were not found to be suitable for feeding lactating cows. NDF values of stems 6 to 12
WAP range from 660 to 783 g kg-1
and ADF values range from 543 to 653 g kg-1
(Mansoer et
al.1997).
It has been reported that sunn hemp seeds contain five pyrrolizidine alkaloids (Smith and
Culvenor 1981). Pyrrolidizidine alkaloids ingested in sufficient amount can be toxic to animals
and birds. Although pyrrolizidine alkaloids are not directly toxic, metabolic derivatives formed
in the liver can be toxic by interacting with cell DNA (Mattocks 1978). Most commonly, they
cause liver damage (hepatoxic effect) and can affect other organs such as the lungs (Hooper
1978).
Research at Auburn University in cooperation with other institutions has shown that
trichodesmine and junceine were the only pyrrolizidine alkaloids present in the seeds of nine
populations that originated in different parts of the world (Ji et al. 2005). Furthermore, they were
present in very low amounts. Two experiments conducted to determine any possible toxicity of
sunn hemp seed to chickens, one of the most susceptible animals to pyrrolizidine alkaloids,

3
found that whole seeds or ground seeds fed at a 0.5% inclusion level did not affect bird mortality
(Hess and Mosjidis, 2008).
Additionally, Cunningham et al. (1978) concluded from their studies that Sunn hemp is
an excellent candidate for papermaking because it produced good yields of bleachable sulfate
pulps, had pulp strength properties that were equal to, or greater than, those of mixed southern
hardwood pulp, and possessed greater bast fiber length to width ratios than typical wood fibers.
In the southeastern U.S., sunn hemp is a candidate species for crop rotation schemes as a
means of weed suppression and as a green manure crop to improve soils and reduce root-knot
nematode infestations (Cook and White, 1996). Mosjidis and Wehtje (2011) determined that
increasing sunn hemp densities consistently resulted in a progressive reduction in weed biomass
due to its ability to grow faster and taller than other plants. Moreover, Sunn hemp is considered
to be allelopathic to other plants which could enhance its ability to suppress weeds (Collins et al.
2007). Marla et al. (2008) found that C. juncea populations supported very low numbers of
Meloidogyne incognita. There was a significant difference in M. incognita numbers between all
the C. juncea populations and the tomato (Solanum lycopersicum) control. Furthermore,
reproduction of Rotylenchulus reniformis was significantly lower on the C. juncea populations
(P ≤ 0.05) compared to cotton (Gossypium spp.). Also, C. juncea freeze-dried root exudates were
able to kill both M. incognita and R. reniformis juveniles.
Requirements and adaptation
The plant is adapted to a wide range of environmental conditions and soil types.
Furthermore, it tolerates droughts and can grow in low fertility soils. Sunn hemp produces high
biomass yields and fixes N (McSorley 1999). It has been proven to be a good candidate for use
in a crop rotation scheme. A tropical cultivar of sunn hemp accumulated 120 to 136 kg ha-1
of

4
total N at 12 WAP in Alabama (Mansoer et al. 1997). Average corn grain yield following the
tropical sunn hemp cultivar ‘Tropic Sun’ was 6,900 kg ha-1
and after fallow 5,700 kg ha-1
. The
N equivalent of fertilizer was 58 kg ha-1
(Balkcom and Reeves 2005). Mansoer et al. (1997)
found that 45 kg ha-1
of N remained in the residues at corn planting time. Yadvinder et al. (1992)
showed that tropical legumes could produce their biomass in a shorter time period compared
with winter legumes. Reddy et al. (1986) showed mean biomass yields of 10 Mg ha-1
for several
tropical legumes across a 3 yr full summer production period with mean N yields of 200 kg ha-1
.
Research conducted using ‘Tropic Sun’ has shown that it is able to produce higher biomass
contents in temperate climates (Mansoer et al., 1997). Balkom and Reeves (2005) found during
a two year experiment that ‘‘Tropic Sun’’ biomass averaged 7.6 Mg ha-1
and aboveground N
content averaged 144 kg ha-1
at first frost.
Determining the correlation between juvenile and mature plant traits would offer certain
advantages to breeders and farmers. Early indirect selection at the seedling stage has the
potential to cut down the costs of expensive field progeny tests. Another benefit would be
introducing more plants with high yield potential once poor candidates have been eliminated
(Xie and Mosjidis, 1995). Also, Twampley (1972) found that selecting the most vigorous trefoil
seedlings from the most vigorous lines (geno-phenotypic selection) is the most effective method
of increasing seedling vigor. Previous research has shown that traits identified at the seedling
stage of plants can provide indications for the potential of a mature plant. In red clover
(Trifolium pratense), selecting for traits such as petiole length and leaves per seedling produced a
superior mature-plant population (Xie and Mosjidis, 1995). In common vetch (Vicia sativa L.)
seedling traits were correlated with mature-plant biomass and reproductive performance (Qiu
and Mosjidis, 1993).

5
A breeding program geared towards the development of C. juncea cultivars that can
produce seeds under the humid subtropical climate of the Southeast USA has been underway at
Auburn University, Alabama, since 2003 (Mosjidis 2006, 2007). Several cycles of selection have
resulted in a locally adapted population named ‘Selection PBU’ (SelPBU) that is shorter (height
is 150-180 cm) than non adapted ones (height is about 450 cm), produces lower biomass yield
and has the added value of producing seed. In order to determine exactly how the selection
process has affected a variety of morphological traits, the overall plant growth of the selection
cycles that have been created over the years of the breeding program were compared to their
parental populations, as well as to each other.
Naturally, the sustainability of this experiment and of this breeding program lies in the
improvement of seed production (Ries and Everson, 1973) as well as the rate of leaf appearance
(Clements and Latter, 1974). In forages these traits have been found to be associated with poor
emergence and low seed germination (Pfeiffer et al., 1972). Current areas of major seed
production, such as Hawaii, Brazil, and India, are characterized by high relative humidity, average
rainfall between 150 to 200 mm, and daily temperatures between 23° C and 29.4° C during Sunn
hemp growth period (Dempsey, 1975). C. juncea plants in their original tropical environment have
a good growth rate. However, in temperate, or in the case of Alabama humid subtropical,
environments non adapted populations do not mature fast enough to produce seed. Unlike tropical
cultivars, SelPBU successfully produces viable Sunn hemp seed in temperate regions north of 28°
N (Mosjidis, 2006, 2007). Increases in seed production area could lead to wider seed availability
and lower seed cost. By determining the tolerance of C. juncea for low and high temperatures,
we can shift its planting date earlier in the season at an optimal temperature period. This can help
ensure good germination rates and reaching of maturity in a timely manner without hindering
seed production.

6
In conclusion, the first goal of this study was to determine the correlation between
juvenile and mature plant traits as a mean of predicting mature plant performance. The second
goal of this research was to identify morphological and growth characteristics that could be used
to identify populations and determine any significant changes that happened over several cycles
of recurrent selection among different populations. The third goal was to determine the influence
of temperature and daylength on early growth of three C. juncea genotypes.

7
References
Balasubramanian, V., and N.K.A. Blaise. 1993. Short season fallow management for sustainable
production in Africa. In Ragland, J.; Lal, R., ed., Technologies for sustainable agriculture
in the tropics. Am. Soc. Agron, Madison, WI, USA. ASA-SP 56:279–293.
Balkcom, K.S., and D.W. Reeves. 2005. Sunn-hemp utilized as a legume cover crop for corn
production. Agron. J. 97:26-31.
Clements, R.J., and B.D.H. Latter. 1974. Responses to selection for seed weight and seedling
vigour in Phalaris. Aust. J. Agric. Res. 25:33-44
Collins, A.S., C.A. Chase, W.M. Stall, and C.M. Hutchinson. 2007. Competitiveness of three
leguminous cover crops with yellow nutsedge (Cyperus esculentus) and smooth pigweed
(Amaranthus hybridus). Weed Sci. 55:613-618.
Cook, C.G., and G.A. White. 1996 Crotalaria juncea: A potential multi-purpose fiber crop. p.
389-394. In: J. Janick (ed.), Progress in new crops. ASHS Press, Arlington, VA.
Cunningham, R.L., T.F. Clark, and M.O. Bagby. 1978. Crotalaria juncea—annual source of
papermaking fiber. Tech. Assoc. Pulp Pap. Ind. 61:37–39
Dempsey, J.M. 1975. Fiber crops. The University Presses of Florida, Gainesville, FL.
Hess, J.B., and J.A. Mosjidis. 2008. Effect of Sunn hemp seed inclusion in broiler starter diets on
live performance attributes. J. Appl. Anim. Res. 33:105-108.
Hooper P.T. 1978. Pyrrolizidine alkaloid poisoning - pathology with reference to differences in
animal and plant species. In: Keeler R F, Van Kampen KR, James LF (ed.) Effects of
poisonous plants on livestock. Academic Press Inc, New York, USA: 161-176.
Ji, X., I. Khan, J.A. Mosjidis, H. Wang, and P. Livant. 2005. Variability for the presence of
pyrrolizidine alkaloids in Crotalaria juncea L., Pharmazie. 60:620-622.
8
Lal, R. 1997. Long-term tillage and maize monoculture effects on a tropical Alfisol in western
Nigeria. I. Crop yield and soil physical properties. Soil Tillage Res. 42:145–160.
Lal, R., E. Regnier, D.J. Eckert, W.M. Edwards, and R. Hammond. 1991. Expectation of cover
crops for sustainable agriculture. In Cover Crops for Clean Water, 1-11 (Ed. W. L.
Hargrove). Ankly, Iowa, USA: Soil Water Conserv. Soc.
Mansoer, Z., D.W. Reeves, and C.W. Wood. 1997. Suitability of Sunn hemp as an alternative
late-summer legume cover crop. Soil Sci. Soc. Am. J. 61:246–253.
Marla, S.R., R.N. Huettel, and J.A. Mosjdis. 2008. Evaluation of Crotalaria juncea populations as
hosts and antagonistic crops to manage Meloidogyne incognita and Rotylenchulus
reniformis. Nematropica. 38:155-161.
Mattocks, A.R. 1978. Recent studies on mechanisms of cytotoxic action of pyrrolizidine
alkaloids. In: Keeler R F, Van Kampen KR, James LF (ed.) Effects of poisonous plants
on livestock. Academic Press Inc, New York, USA: 177-187
McSorley, R. 1999. Host susceptibility of potential cover crops for root-knot nematodes. J.
Nematology. 31:619-623.
Mosjidis J.A. 2006. Legume breeding and their utilization as forage and cover crops.
Proceedingsof the 60th. Southern Pasture and Forage Crop Improvement Conference,
Auburn, Alabama, April 12, 2006. CD-ROM
Mosjidis J.A. 2007. Breeding of Annual and Perennial Legumes and their Utilization as Forage
and Cover Crops. A Periodical of Scientific Research on Field and Vegetable Crops
(Zbornik Radova) 44:7-11.
9
Mosjidis J.A., and G. Wehtje. 2011. Weed control in Sunn hemp and its ability to suppress weed
growth. Crop Protection. 30:70-73
Purseglove, J.W. 1981. Leguminosae. In Tropical crops: dicotyledons. Edited by J.W.
Purseglove. Longman Group Ltd., Essex, UK: 250–254.
Reddy, K.C., A.R. Soffes, and G.M. Prine. 1986. Tropical legumes for green manure: I. Nitrogen
production and the effects on succeeding crop yields. Agron. J. 78:1–4.
Ries, S.K., and E.H. Everson. 1973. Protein content and seed size relationship with seedling
vigor of wheat cultivars. Agron. J. 65:884-886.
Pfeiffer, R.A., G.W. McKee, and M.L. Risius. 1972. Germination and emergence of crownvetch
as affected by seed maturity and depth of planting.. Agron. J. 64:772-774.
Qiu, J., and J.A. Mosjidis. 1993. Influence of seed weight and planting depth on common vetch
establishment and growth. Field Crops Res. 33:353-366
Smith J.W., and C.C.J. Culvenor. 1981. Plant sources of hepatoxic pyrrolizidine alkaloids, J. Nat.
Prod. 44: 129-152
Smith, M.S., W.W. Frye, and J.J. Varco. 1987. Legume winter cover crops. Adv. Soil Sci. 7:95-
139.
Twampley, B.E. 1972. Genotypic, phenotypic, and geno-phenotypic methods of selection for
seedling vigor in birdsfoot trefoil. Can. J. Plant Sci. 52:227-232
van Wyk, B.E., and A.L. Schutte. 1995. Phylogenetic relationships in the tribes Podalyrieae,
Liparieae and Crotalarieae. In Advances in legume systematics. Edited by M. Crisp and
J.J. Doyle. Royal Botanic Gardens, Kew, UK: 283–308.
Xie, C., and J.A. Mosjidis. 1995. Seedling-selection effects on morphological traits of mature
plants in red clover. Theor. Appl. Genet. 91:1032-1036.

10
Yadvinder, S., S. Bijay, and C.S. Khind. 1992. Nutrient transformations in soil amended with
green manures. Adv. Soil Sci. 20:237–309.

11
II. Relationships between juvenile-plant traits and mature-plant yield in Sunn hemp
Abstract
Early stage selection at the seedling stage is a process that has the potential to cut down the costs
of expensive field tests and allow breeders to introduce more plants with high yield potential
once undesirable candidates have been eliminated. The purpose of this research was to identify
juvenile-plant traits in Sunn hemp that demonstrate high correlation with mature-plant traits.
Two selection cycles, Cycle 1 and Cycle 3, of a Sunn hemp population were chosen for the
study. For Cycle 1, results indicate that number of leaves (Lf4wk) at 4 weeks after planting, had
the highest positive correlation with biomass at harvest and seed yield (r = 0.220 and 0.304
respectively). For Cycle 3, results show that number of leaves (Lf4wk) at 4 weeks after planting,
had the highest positive correlation with biomass at harvest and seed yield (r = 0.308 and 0.304
respectively). When selecting the top 10% of the plants based on Ht4wk, there was a 67.51%
increase in biomass at flowering (BioFl), 22.83% increase in biomass at harvest (BioHst) and
18.38% increase in seed weight (SeedWt), each of which was significant at the 0.05 level.
Therefore, it is possible to eliminate plants and families in Sunn hemp based on their
performance at an early stage. Among the five selection schemes tested for direct selection,
selecting 31.6% among and 31.6% within families produced the largest genetic gain. Selecting
among families is a better option for Cycle 3 than it is for Cycle 1.

12
Introduction
Sunn hemp (Crotalaria juncea L.) is a short-day, erect, shrubby, annual plant that
generally reaches 1 to 4 m in height. It is used in rotation schemes as a green manure crop to
improve soils (Cook and White, 1996), reduce root-knot nematode infestations (Marla et. al.,
2008) and suppress weeds (Mosjidis and Wehtje, 2011). Determining the correlation between
juvenile and mature plant traits would offer certain advantages to breeders. Early indirect
selection at the seedling or young plant stage would lower selection costs by eliminating poor
performers early in the growing season. An alternative would be to include more plants with high
yield potential or spend the resources in additional evaluation of superior plants (Xie and
Mosjidis, 1995).
Previous research has shown that traits identified at the seedling stage of plants can
provide indications for the potential of a mature plant. Twampley (1972) found that selecting the
most vigorous trefoil (Lotus corniculatus) seedlings from the most vigorous lines (geno-
phenotypic selection) is the most effective method of increasing seedling vigor. This applies to
situations where the character under selection is sufficiently high in heritability to make
phenotypic selection rewarding, and where the populations being used for evaluation of
progenies can also be used to supply breeding material for the next selection cycle. In red clover
(Trifolium pretense L.), selecting for traits such as petiole length and leaves per seedling
produced a superior mature-plant population with higher individual dry plant weight and forage
yield. Additionally, if selection was made on single plants as early as five weeks after planting,
substantial gains in higher individual dry plant weight and forage yield could be achieved. (Xie
and Mosjidis, 1995). In common vetch (Vicia sativa L.), seedling traits were correlated with
mature-plant biomass and reproductive performance (Qiu and Mosjidis, 1993). Root growth

13
potential in sycamore (Ficus sycomorus L.) seedlings was strongly correlated with building of
larger crowns and increased production of photosynthetic area (Schultz and Land, 1989). Also, in
21-day-old sugar beet (Beta vulgaris L.) taproot-leaf weight ratio was correlated with
photosynthate partitioning, which has an effect on economic yield (Snyder and Carlson, 1978).
It has been a matter of debate whether allocation of resources can happen in such a
manner that high biomass yield and increased seed numbers can coexist on the same plant.
Allard (1988) showed that in barley (Hordeum vulgare L.) high seed numbers per plant were
associated with the predominant allele of every locus, which is responsible for high reproductive
capacity. In contrast, high and low biomass are about equally associated with marker-locus
alleles with both high and low reproductive capacities. Therefore, in barley, there can be a
combination where these two traits are superior. Moreover, in beans it was found that seed yield
had the highest phenotypic, genetic and environmental correlations with biomass among other
traits, suggesting that genes that control these two traits are closely linked (Scully et al, 1991).
These findings suggest that it is possible to breed for a plant that delivers good performances on
both fronts.
Previous reports showed that correlations between seedling traits and mature-plant traits
were generally small, and there was only a small number of seedling traits associated with
mature-plant performance (Xie and Mosjidis, 1995). In most cases, the genetic effects on mature
plant traits of selecting seedling traits have not been identified. Therefore, the objectives of this
study were 1) to determine the relationship of young plant traits and mature-plant traits and 2) to
evaluate the effect of young plant selection on forage yield and other mature-plant traits.

14
Materials and Methods
Two selection cycles, Cycle 1 (C1) and Cycle 3 (C3), of a Sunn hemp population were
chosen for the study. Twenty half-sib (HS) families for each cycle were planted on April 19,
2007 in Tallassee, AL (PBU). A split-plot design with four replications was employed. Selection
cycles were the main plots and families were the sub-plots. Each plot consisted of twenty,
randomly chosen plants that were tagged to ensure that all measurements were consistently taken
from the same plant.
Traits measured at the juvenile stage were height (Ht2wk) and number of leaves (Lf2wk)
at two weeks as well as height (Ht4wk) and number of leaves (Lf4wk) at four weeks. Internode
length at two (Int2wk) and four (Int4wk) weeks was calculated.
When the first flower appeared, five plants from each family were harvested in order to
measure dry biomass weight (BioFl). The remaining plants were harvested when they reached
seed maturity. Mature plant traits measured were the number of days from planting till harvest
(DHst), biomass weight (BioHst), seed weight (SeedWt) and seed quality (SeedQ). The latter
was measured using a 1 to 9 scale, where 1 = almost all seeds were discolored or moldy, 2 =
90% of seeds were discolored or moldy, 3 = 75% of seeds were discolored or moldy, 4 = 60% of
seeds were discolored or moldy, 5 = 50% of seeds were discolored or moldy, 6 = 40% of seeds
were discolored or moldy,7 = 25% of seeds were discolored or moldy, 8 = 10% of seeds were
discolored or moldy and 9 = no discolored or moldy seeds.
Pearson correlation coefficients were calculated among all variables. About 2200 plants
were used to calculate correlation coefficients among juvenile, and mature, plant traits. A total of
600 plants, roughly 5 plants from each family and replication, were used to measure BioFl and
the rest were used for measuring BioHst, SeedWt and SeedQ.

15
The effect on mature traits of selecting the top 10% of plants for each juvenile trait was
estimated. The mean of the whole population for each mature plant trait was determined and
compared to the mean of the selected plants using a t-test (SAS Institute, 2002-2003).
Data were subjected to analysis of variances (Table 1) using the model:
Xijk = μ + Bi + HSj +B.HSij + Eijk
Where i = 1,…., r, j = 1…..,f, k = 1,…., n; μ is the grand mean, Bi is the ith block effect, and Eijk
is the variation among n individual plants within plots.
Based on the model above two types of heritability were measured. These were
heritability on an individual plant basis (H1), , and
heritability on a family mean basis (H2), (Nguyen
and Sleper, 1983). The expected response to selection was calculated using the formula R = kh2δ
= h2S, where k is the selection intensity, h
2 the heritability value, δ the square root of the
phenotypic variance and S the mean phenotypic value of selected plants, expressed as a deviation
from the population mean (Falconer, 1981). Three types of selection can be made based on the
model above: mass selection using the heritability H1; family selection using the heritability H2
and combined selection, which is family selection together
with as within-family selection (Nguyen and Sleper, 1983).
Five combinations of selection intensity among and within families giving rise to the
same final selection intensity (10%) were compared. They were: (1) 10% among (k = 1.755) and
100% within-family selection; (2) 80% among (k = 0.351) and 12.5% within family selection (k
= 1.647); (3) 31.6% among and 31.6% within family selection (k = 1.125); (4) 12.5% among and
80% within family selection; and (5) 100% among and 10% mass selection.

16
Results and Discussion
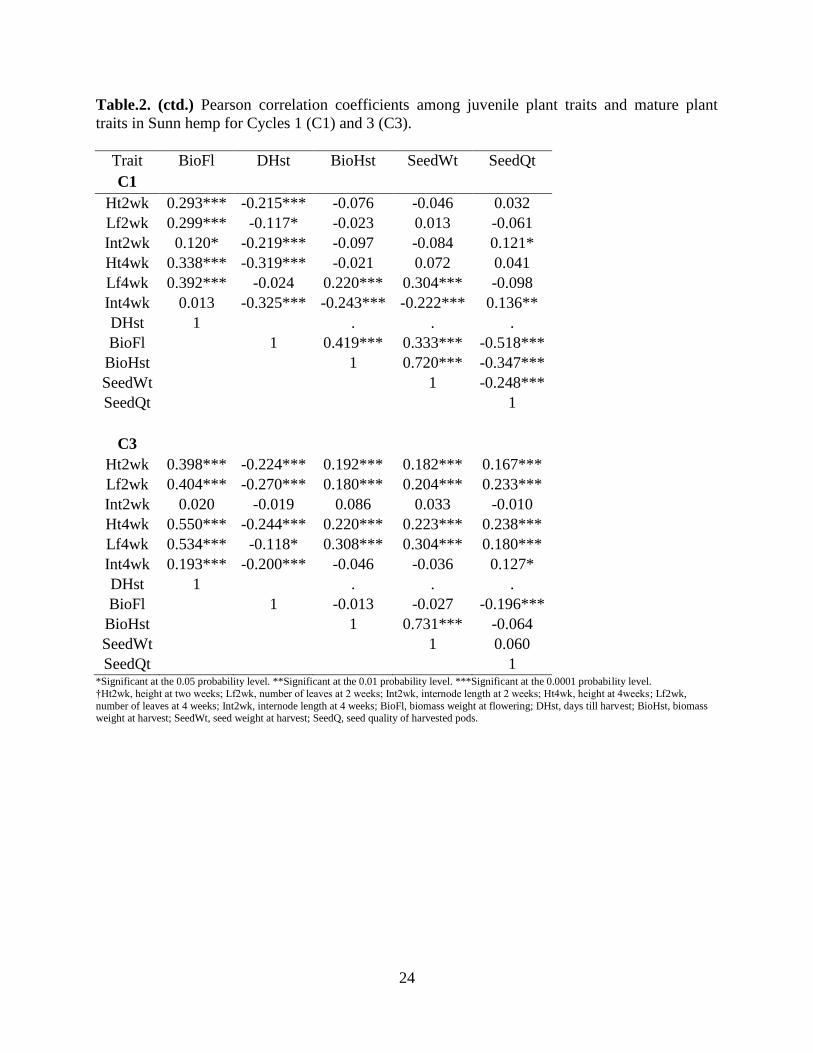
Most of the correlation coefficients between juvenile and mature plant traits were small
although more than half of them were significant (Table 2). Almost all of the juvenile traits had
high positive correlations with each other. In general, the correlation coefficients among juvenile
plant traits were larger than those between juvenile traits and mature plant traits. Cycle 3 had the
strongest correlation between juvenile and mature plant traits. These higher values indicate that
the population has become more uniform, which improves the value of identifying traits for
further selection.
For traits measured before or at first flower, correlated responses for Cycle 1 showed that
BioFl had the highest positive correlation with Lf4wk, (r = 0.392) (Table 4) followed by Ht4wk
(r = 0.338). DHst correlated negatively with all juvenile traits. The highest negative correlations
were with Int4wk (r = - 0.325) followed by Ht4wk (r = - 0.319) meaning that an increase in any
of these traits will decrease days to harvest. For BioHst the only positive correlation was with
Lf4wk (r = 0.220). All other correlations were negative and the only significant correlation was
with Int4wk (r = - 0.243). For SeedWt, the highest positive correlation was with Lf4wk (r =
0.304). Again, the only other significant correlation was negative and it was with Int4wk (r = -
0.222). SeedQt had the highest positive correlation with Int4wk (r = 0.136) followed by Int2wk
(r = 0.121).
For Cycle 3, BioFl had the highest positive correlation with Ht4wk (r = 0.550) (Table 4)
followed by Lf4wk (r = 0.534). DHst correlated negatively with all traits. The highest negative
correlations were with Lf2wk (r = - 0.270) followed by Ht4wk (r = - 0.244). For BioHst the
highest positive correlation was with Lf4wk (r = 0 0.308) followed by Ht4wk (r = 0.220). For
SeedWt the highest positive correlations was with Lf4wk (r = 0.304) followed by Ht4wk (r =
17
0.223). SeedQt had the highest positive correlation with Ht4wk (r = 0.238) followed by Lf2wk
(r = 0.233).
Cycle 1 and Cycle 3 had relatively similar coefficients of variability (CV) for all juvenile-
plant traits. For Cycle 1, the CV for Ht2wk, Lf2wk, Int2wk, Ht4wk, Lf4wk and Int4wk were
0.29, 0.21, 0.18, 0.26, 0.22 and 0.22, respectively, whereas for Cycle 3 the corresponding values
were 0.30, 0.22, 0.35, 0.27, 0.22 and 0.21, respectively. On the other hand, Cycle 1 had larger
variability than Cycle 3 for all traits measured at flowering and at harvest, except for DHst that
had some increase. The CV for the traits BioFl, DHst, BioHst, SeedWt and SeedQt were 0.96,
0.13, 1.12, 0.65 and 0.10 whereas for Cycle 3 the corresponding values were 0.55, 0.26, 0.64,
0.61 and 0.07. These results indicate that plants became more uniform for mature traits in the
more advanced cycle of selection. Variability was generally higher for mature-plant traits
measured at flowering and harvest. Therefore, selection progress for these traits will be expected
to be larger than for juvenile-plant traits.
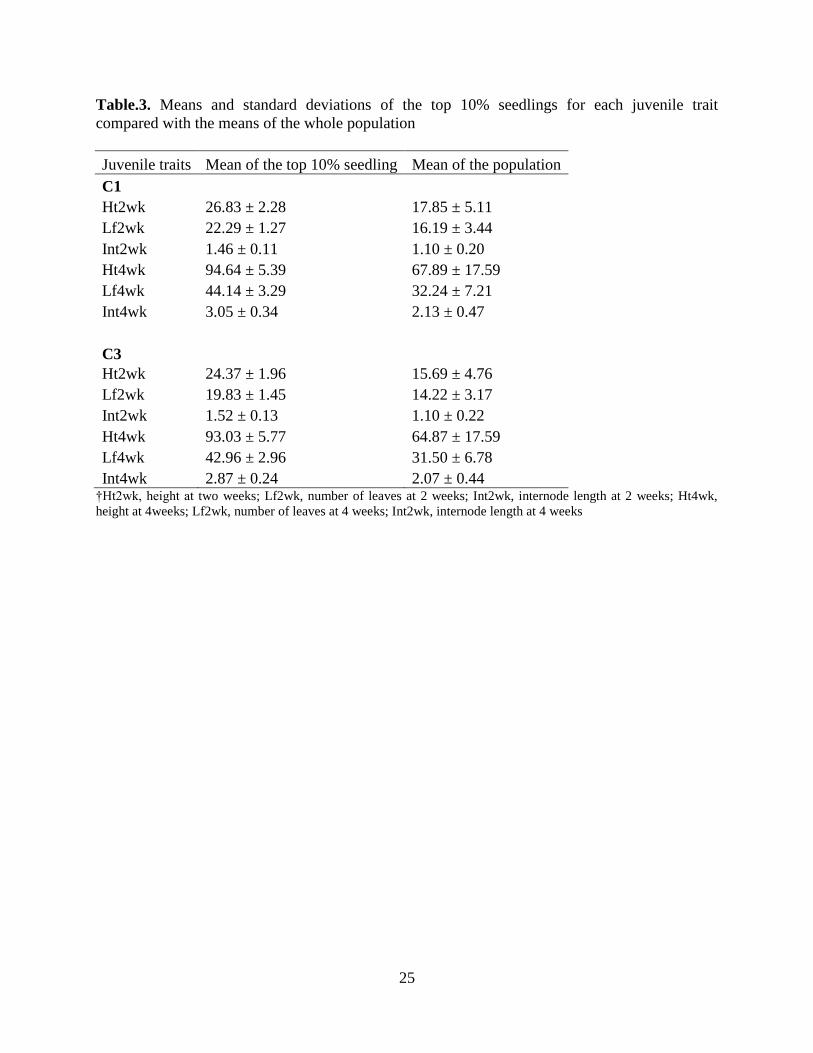
Means of the top 10% juvenile-plant traits were different from the corresponding means
of the whole population (Table 3). Selection of the best 10% seedlings for height at two and four
weeks after planting as well as number of leaves for the same time period significantly increased
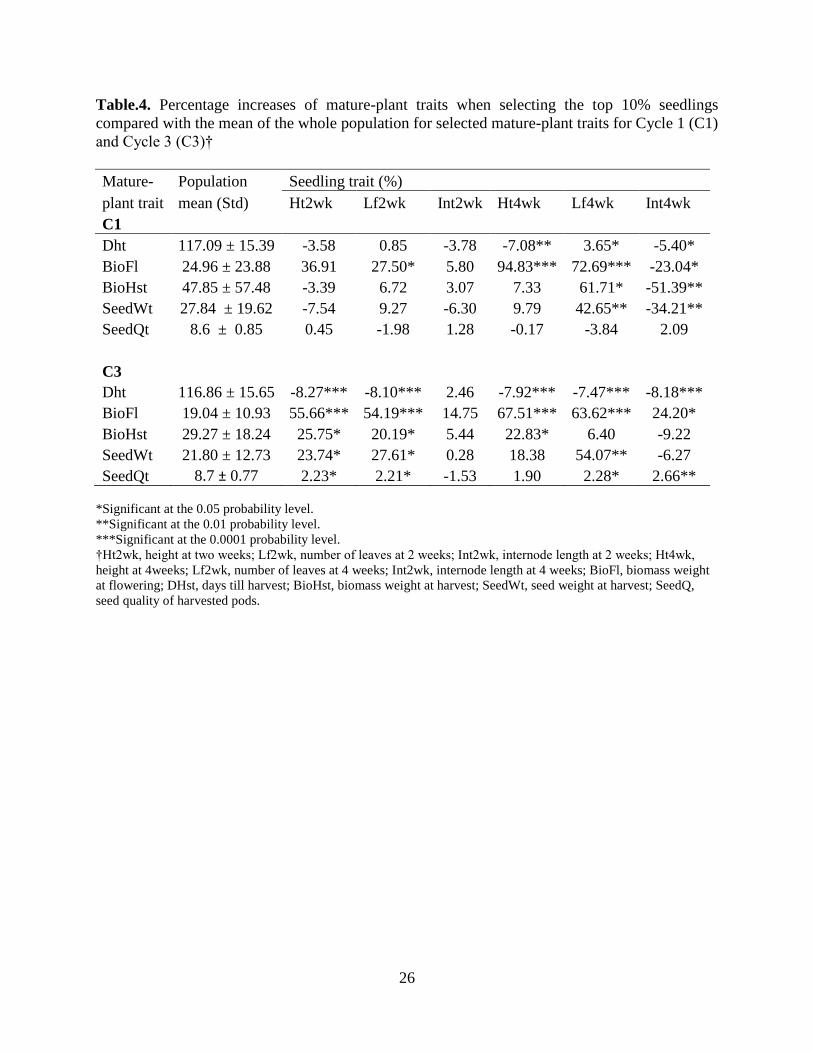
biomass at flowering as well as biomass and seed yield at harvesting. In Cycle 1, the juvenile-
plant trait that resulted in the most improvement on mature-plant performance was Lf4wk (Table
4). It had the greatest increase on BioFl (72.69%), followed by BioHst, which was improved by
61.71%. There were also positive gains for SeedWt (42.65%) and DHst (3.65%). The greatest
single gain was obtained when selecting for Ht4wk, which improved BioFl by 94.83%.
Plants in Cycle 3 showed more overall improvement compared to Cycle 1. The greatest
effect on mature-plant performance was obtained when selecting for Ht4wk, which increased

18
BioFl by 67.51%. The same juvenile trait also increased BioHst by 22.83% and SeedWt by
18.38%. Also, it resulted in a small decrease in DHst (-7.92%). The trait Lf4wk improved BioFl
and SeedWt as well, by 63.32% and 54.07% respectively. Again, there was a small decrease on
DHst (7.47%). Selecting for Ht2wk resulted in an increase for BioFl (55.63%) and SeedWt
(23.74%) . Selecting for Lf2wk resulted in an increased BioFl (54.19%) and by 23.74% and
27.61% for SeedWt. The same traits resulted in an decreased DHst of around8.%. Overall,
selecting for taller plants and larger number of leaves, four weeks after planting, resulted in the
highest biomass increase, especially during flowering.
Narrow-sense heritability values on an individual basis (H1) were low except for Lf4wk
in both cycles of selection and SeedQt in Cycle 1. Heritability on a family mean basis (H2)
values were relatively large in both cycles with exception of Lf2wk, BioFL and BioHst in Cycle
1. The H1 values were smaller than H2 except for in Cycle 1. Cycle 1 had consistently lower
values than Cycle 3 (Table 4).
Among the juvenile-plant traits Lf4wk had the greatest expected genetic gain and the
highest heritability values for both cycles; Ht4wk had the second highest values. Heritability on a
family mean basis is a clear choice for mature-plant traits. The mature trait with the greatest
expected genetic gain was seed weight. Also, Cycle 1 had much smaller heritability values for
DHst than Cycle 3. There were different results for the two cycles from the five selection
methods. The option of selecting for 12.5% among and 80% within families showed better
results for Cycle 1. On the other hand, an even split of 31.6% among and 31.6% within showed
more promising results for Cycle 3. This indicates that families had improved and had become
more uniform. Selecting both among and within families is a better option for Cycle 3 than it is
for Cycle 1. The reason for this is that variability in Cycle 1 is higher among individual plants
19
than among families. Increased uniformity among families for the desirable traits is a good
indication that selection is having its expected effects; however variability within the new
population is reduced.
In summary, our results indicate that selecting for traits, such as height and number of
leaves at four weeks can significantly improve biomass, both at flowering and seed harvesting
time, as well as seed yield, while reducing the number of days till harvest. The plants of Cycle 3
have become more uniform than the plants of Cycle 1, as indicated by lower CVs and higher
correlations among juvenile and mature traits. There is potential for future selections to reach
higher uniformity, as shown by the higher heritability values for Cycle 3 than in Cycle 1.
Applying equal selection intensity as an even split of 31.6% among and 31.6% within family
selection, produces the largest genetic gain. Increased trait heritability from oldest to newest
selection cycles can solidify early selection in C. juncea as an effective tool in the hands of
breeders for eliminating plants and families with lackluster performance, in order to increase the
number of plants to be field tested or perform more intense selection on the remaining plants.
20
References
Allard, R.W. 1988. Genetic changes associated with the evolution of adaptedness in cultivated
plants and their wild progenitors. J. Her. 79:225-238
Cook, C.G., and G.A. White. 1996 Crotalaria juncea: A potential multi-purpose fiber crop. p.
389-394. In: J. Janick (ed.), Progress in new crops. ASHS Press, Arlington, VA.
Falconer, D.S. 1981. Introduction to quantitative genetics. Longman, London New York
Marla, S.R., R.N. Huettel, and J.A. Mosjidis. 2008. Evaluation of Crotalaria juncea populations
as a summer cover crop to manage Meloidogyne incognita and Rotylenchulus
reniformis. Nematropica. 83:155-162
Mosjidis, J.A., and G. Wehtje. 2010. Weed control in Sunn Hemp (Crotalaria juncea L.) and its
ability to suppress weed growth. Crop Protection (In Press)
Nguyen, H.T., and D.A. Sleper .1983. Theory and application of half-sib matings in forage grass
breeding. Theor. Appl. Genet. 64:187-196
Scully, B.T., D.H. Wallace, and D.R. Viands. 1991. Heritability and correlation of biomass,
growth rates, harvest index, and phenology to the yield of common beans. J. Amer. Soc.
Hort. Sci. 116(1):127-130
Snyder, F.W., and G.E. Carlson. 1978. Photosynthate partitioning in sugar beet. Crop Sci.
82:737-741
Schultz, E.B., and S.D. Land. 1989. Sycamore seed and seedling traits-early selection criteria.
20th Southern Forest Tree Improvement Conference. Charleston, SC
Twampley, B.E. 1972. Genotypic, phenotypic, and geno-phenotypic methods of selection for
seedling vigor in birdsfoot trefoil. Can. J. Plant Sci. 52:227-232
21
Qiu, J., and J.A. Mosjidis. 1993. Influence of seed weight and planting depth on common vetch
establishment and growth. Field Crops Res. 33:353-366
Xie, C., and J.A. Mosjidis. 1995. Seedling-selection effects on morphological traits of mature
plants in red clover. Theor. Appl. Genet. 91:1032-1036

22
Table.1. Analysis of variance of HS families in randomized complete block design on an
individual plant basis.
Source Degrees of freedom Expected mean squares
Replications (r – 1)
Families (f – 1) FW rnn 222 Error (r – 1) (f – 1) 22 nW Within plots rf (n – 1) W
2

23
Table.2. Pearson correlation coefficients among juvenile plant traits and mature plant traits in
Sunn hemp for Cycles 1 (C1) and 3 (C3).
Trait Ht2wk Lf2wk Int2wk Ht4wk Lf4wk Int4wk
C1
Ht2wk 1 0.813*** 0.675*** 0.797*** 0.544*** 0.430***
Lf2wk 1 0.145*** 0.713*** 0.602*** 0.272***
Int2wk 1 0.474*** 0.206*** 0.380***
Ht4wk 1 0.646*** 0.563***
Lf4wk 1 -0.234***
Int4wk 1
C3
Ht2wk 1 0.770*** 0.362*** 0.805*** 0.571*** 0.484***
Lf2wk 1 -0.050 0.697*** 0.653*** 0.257***
Int2wk 1 0.256*** 0.066* 0.290***
Ht4wk 1 0.685*** 0.625***
Lf4wk 1 -0.117***
Int4wk 1
*Significant at the 0.05 probability level. **Significant at the 0.01 probability level. ***Significant at the 0.0001 probability level.
†Ht2wk, height at two weeks; Lf2wk, number of leaves at 2 weeks; Int2wk, internode length at 2 weeks; Ht4wk, height at 4weeks; Lf2wk,
number of leaves at 4 weeks; Int2wk, internode length at 4 weeks
24
Table.2. (ctd.) Pearson correlation coefficients among juvenile plant traits and mature plant
traits in Sunn hemp for Cycles 1 (C1) and 3 (C3).
Trait BioFl DHst BioHst SeedWt SeedQt
C1
Ht2wk 0.293*** -0.215*** -0.076 -0.046 0.032
Lf2wk 0.299*** -0.117* -0.023 0.013 -0.061
Int2wk 0.120* -0.219*** -0.097 -0.084 0.121*
Ht4wk 0.338*** -0.319*** -0.021 0.072 0.041
Lf4wk 0.392*** -0.024 0.220*** 0.304*** -0.098
Int4wk 0.013 -0.325*** -0.243*** -0.222*** 0.136**
DHst 1 . . .
BioFl 1 0.419*** 0.333*** -0.518***
BioHst 1 0.720*** -0.347***
SeedWt 1 -0.248***
SeedQt 1
C3
Ht2wk 0.398*** -0.224*** 0.192*** 0.182*** 0.167***
Lf2wk 0.404*** -0.270*** 0.180*** 0.204*** 0.233***
Int2wk 0.020 -0.019 0.086 0.033 -0.010
Ht4wk 0.550*** -0.244*** 0.220*** 0.223*** 0.238***
Lf4wk 0.534*** -0.118* 0.308*** 0.304*** 0.180***
Int4wk 0.193*** -0.200*** -0.046 -0.036 0.127*
DHst 1 . . .
BioFl 1 -0.013 -0.027 -0.196***
BioHst 1 0.731*** -0.064
SeedWt 1 0.060
SeedQt 1 *Significant at the 0.05 probability level. **Significant at the 0.01 probability level. ***Significant at the 0.0001 probability level.
†Ht2wk, height at two weeks; Lf2wk, number of leaves at 2 weeks; Int2wk, internode length at 2 weeks; Ht4wk, height at 4weeks; Lf2wk,
number of leaves at 4 weeks; Int2wk, internode length at 4 weeks; BioFl, biomass weight at flowering; DHst, days till harvest; BioHst, biomass weight at harvest; SeedWt, seed weight at harvest; SeedQ, seed quality of harvested pods.
25
Table.3. Means and standard deviations of the top 10% seedlings for each juvenile trait
compared with the means of the whole population
Juvenile traits Mean of the top 10% seedling Mean of the population
C1
Ht2wk 26.83 ± 2.28 17.85 ± 5.11
Lf2wk 22.29 ± 1.27 16.19 ± 3.44
Int2wk 1.46 ± 0.11 1.10 ± 0.20
Ht4wk 94.64 ± 5.39 67.89 ± 17.59
Lf4wk 44.14 ± 3.29 32.24 ± 7.21
Int4wk 3.05 ± 0.34 2.13 ± 0.47
C3
Ht2wk 24.37 ± 1.96 15.69 ± 4.76
Lf2wk 19.83 ± 1.45 14.22 ± 3.17
Int2wk 1.52 ± 0.13 1.10 ± 0.22
Ht4wk 93.03 ± 5.77 64.87 ± 17.59
Lf4wk 42.96 ± 2.96 31.50 ± 6.78
Int4wk 2.87 ± 0.24 2.07 ± 0.44 †Ht2wk, height at two weeks; Lf2wk, number of leaves at 2 weeks; Int2wk, internode length at 2 weeks; Ht4wk,
height at 4weeks; Lf2wk, number of leaves at 4 weeks; Int2wk, internode length at 4 weeks
26
Table.4. Percentage increases of mature-plant traits when selecting the top 10% seedlings
compared with the mean of the whole population for selected mature-plant traits for Cycle 1 (C1)
and Cycle 3 (C3)†
Mature- Population Seedling trait (%)
plant trait mean (Std) Ht2wk Lf2wk Int2wk Ht4wk Lf4wk Int4wk
C1
Dht 117.09 ± 15.39 -3.58 0.85 -3.78 -7.08** 3.65* -5.40*
BioFl 24.96 ± 23.88 36.91 27.50* 5.80 94.83*** 72.69*** -23.04*
BioHst 47.85 ± 57.48 -3.39 6.72 3.07 7.33 61.71* -51.39**
SeedWt 27.84 ± 19.62 -7.54 9.27 -6.30 9.79 42.65** -34.21**
SeedQt 8.6 ± 0.85 0.45 -1.98 1.28 -0.17 -3.84 2.09
C3
Dht 116.86 ± 15.65 -8.27*** -8.10*** 2.46 -7.92*** -7.47*** -8.18***
BioFl 19.04 ± 10.93 55.66*** 54.19*** 14.75 67.51*** 63.62*** 24.20*
BioHst 29.27 ± 18.24 25.75* 20.19* 5.44 22.83* 6.40 -9.22
SeedWt 21.80 ± 12.73 23.74* 27.61* 0.28 18.38 54.07** -6.27
SeedQt 8.7 ± 0.77 2.23* 2.21* -1.53 1.90 2.28* 2.66**
*Significant at the 0.05 probability level.
**Significant at the 0.01 probability level.
***Significant at the 0.0001 probability level.
†Ht2wk, height at two weeks; Lf2wk, number of leaves at 2 weeks; Int2wk, internode length at 2 weeks; Ht4wk,
height at 4weeks; Lf2wk, number of leaves at 4 weeks; Int2wk, internode length at 4 weeks; BioFl, biomass weight
at flowering; DHst, days till harvest; BioHst, biomass weight at harvest; SeedWt, seed weight at harvest; SeedQ,
seed quality of harvested pods.

27
Table.5. Heritabilities and expected responses for selected traits to five selection methods for
Cycle 1 and Cycle 3†
Heritability Selection method
10%
among
80%
among
31.6%
among
12.5%
among
Trait H1 H2
12.5%
within
31.6%
within
80%
within
10%
mass
Cycle 1
Ht2wk 0.07 0.54 1.03 0.78 1.05 1.09 0.61
Lf2wk 0.02 0.17 0.13 0.10 0.13 0.14 0.08
Ht4wk 0.09 0.63 4.89 3.65 4.96 5.16 2.85
Lf4wk 0.32 0.79 3.79 3.95 4.61 4.24 3.40
DHst 0.09 0.31 1.36 1.61 1.78 1.56 1.42
BioFl 0.00 0.08 0.43 0.28 0.41 0.44 0.21
BioHst 0.00 0.03 0.38 0.25 0.36 0.39 0.19
seedWt 0.05 0.50 3.89 2.74 3.83 4.07 2.09
seedQ 0.60 0.51 0.17 0.35 0.32 0.23 0.33
Cycle 3
Ht2wk 0.11 0.70 1.67 1.28 1.72 1.77 1.01
Lf2wk 0.15 0.81 1.76 1.31 1.78 1.85 1.02
Ht4wk 0.12 0.60 4.35 3.84 4.81 4.71 3.16
Lf4wk 0.47 0.85 4.59 5.26 5.91 5.24 4.63
DHst 0.19 0.63 4.02 4.08 4.82 4.47 3.49
BioFl 0.08 0.35 1.19 1.22 1.43 1.32 1.04
BioHst 0.12 0.59 4.82 4.26 5.34 5.22 3.51
seedWt 0.17 0.66 4.02 3.80 4.63 4.42 3.19
seedQ 0.13 0.39 0.08 0.09 0.10 0.09 0.08 †Ht2wk, height at two weeks; Lf2wk, number of leaves at 2 weeks; Int2wk, internode length at 2 weeks; Ht4wk,
height at 4weeks; Lf2wk, number of leaves at 4 weeks; Int2wk, internode length at 4 weeks; BioFl, biomass weight
at flowering; DHst, days till harvest; BioHst, biomass weight at harvest; SeedWt, seed weight at harvest; SeedQ,
seed quality of harvested pods.
H1, heritability on an individual plant basis; H2, heritability on a family mean basis

28
III. Characterization of New Populations in Sunn Hemp and Relationship of Their Traits
to Yield.
Abstract
In 2002, a breeding program was initiated at Auburn University for the adaptation of sunn
hemp to the climatic conditions of the continental U.S. The program has altered its physiology to
produce smaller plants with early, uniform flowering and maturity that produce viable seeds.
Populations selected in tropical environments grow very tall in a temperate or subtropical
environment such as in the southern part of the continental US. Biomass production is excessive
and difficult to manage when the plants are grown as cover crops.
Field experiments were conducted to evaluate Crotalaria juncea populations generated
by the breeding program to measure changes caused by the selection process to morphological,
developmental and agronomic traits. In 2008, eight populations were planted in Tallassee and
Shorter, AL, and twelve characteristics were measured throughout their life-cycle. In 2009, eight
populations were planted in the same two locations and 16 characteristics were measured.
In 2008, eight traits were significant (P < 0.01) for population differences. These traits
were height at two and four weeks after planting, height up to the first flower and number of
branches below it, as well as length and width of the leaf located below the flower, total height at
29
harvesting, and seed weight. There were significant population-location interactions for two
traits. These traits were days to flowering and stem diameter of the plant base at first flower.
In 2009, seven traits were significant (P < 0.01) for population interaction differences.
The traits were the diameter at the plant’s base, height up to the first flower, number of branches
below it, number of days till harvesting, total height, dry biomass weight and seed weight. Six
traits showed significant population-location interactions. These traits were number of leaves
four weeks after planting, days to flowering, diameter right below the first flower, leaf length,
and seed quality.
SelPBU was the best or among the best populations for morphological characteristics
important from the release of a cultivar in a temperate environment. The most important
characteristics were number of days till flowering, days till harvesting, biomass and seed weight
as well as seed quality. ‘Tropic Sun’ was the poorest performer since it produced excessive
vegetative matter, very few flowers and no seed.
Introduction
Sunn hemp (Crotalaria juncea L ) is a legume crop that has received attention due to its
green manure properties and its potential to reduce soil erosion and improve nutrient levels in
soils with low organic matter content (Mansoer et al.,1997). Its primary use is as a green manure
crop. The main function of a green manure crop is to enhance soil fertility and to improve
nutrient cycling. Sunn hemp is of interest as a cover crop because it is also suppresses plant
parasitic nematodes (Marla et. al., 2008). Additionally, it can assist in weed suppression
(Mosjidis and Wehtje, 2010), pest and disease control (Cook and White, 1996), soil and water
conservation (Mansoer et al., 1997), and the provision of food and animal feed. Crotalaria
juncea can increase nitrogen in the soil especially in organic production systems (Wang et al.,

30
2004b). This combination of nematode and nitrogen management could be especially useful in
sustainable and organic production systems where neither nematicides nor synthetic nitrogen
fertilizers can be used (McSorley, 1999). It is also drought resistant and has a wide range of
adaptation to soil types.
Cunningham et al. (1978) concluded from their studies that Sunn hemp was an excellent
candidate for papermaking because it produced good yields of bleachable sulfate pulps, had pulp
strength properties that were equal to or greater than those of mixed southern hardwood pulp,
and possessed greater bast fiber length to width ratios than do typical wood fibers. The major
constraint affecting the extensive use of C. juncea in the continental United States is limited
reproduction and non-availability of seeds for large scale cultivation.
Sunn hemp is a tropical crop that cannot reproduce except under tropical conditions. In
the United States, ‘Tropic Sun’ is the only cultivar of which seed is available; however, it was
bred under the tropical conditions of Hawaii (Rotar and Joy, 1983).
A breeding program aimed at developing cultivars of C. juncea that can produce seeds
under the humid subtropical climate of the Southeast USA has been conducted at Auburn
University, Alabama, since 2002 (Mosjidis 2006, 2007). Phenotypic recurrent selection (mass
selection with male and female plant selection) was used for traits that can be selected up to
flowering. This method was found to successfully improve yield in a number of plant species. In
common beans it increased grain yield, with a mean annual gain of 5.7% (Ramalho et al, 2005).
Also, recurrent selection for grain yield in Spanish maize populations lead to an increase by an
average of 6 Mg ha-1
(Vales et al, 2001). After eight cycles of selection in spring wheat there
was a linear increase in kernel weight at a rate of 1.7 g cycle-1
(Wiersma et al, 2001). Recurrent
31
selection can improve seedling vigor as well, as shown in kura clover that exhibited increased
shoot and seed weight after three cycles of selection (DeHaan et al, 2001).
Traits such as seed quality and seed yield are being selected using mass selection (only
female plants were selected after pollination). Analysis of the physiological basis of increased
yield potential is important as a guide for further gains (Evans & Fischer 1999). The comparison
of cultivars from different areas and with differences in yield potential may serve to identify
traits that are associated with yield (Evans 1993).
Several cycles of selection have resulted in a locally adapted population that is shorter
(height is 150-180 cm) than non adapted ones (height is about 450 cm). Biomass yield is lower
and it has the added value of producing seed. Populations selected in tropical environments like
‘Tropic Sun’ grow very tall in a temperate or subtropical environment such as in the southern
part of the continental US. Biomass production is excessive and difficult to manage when the
plants are grown as cover crops.
Several cycles of breeding populations, their parental material and the tropical cultivar
‘Tropic Sun’, for a total of eight populations, were tested in Alabama in 2008 and 2009. Their
morphological characteristics were evaluated to identify any changes in plant growth emerging
from the ongoing breeding program as well as to identify how the changes in photoperiodicity
requirements affected the more recent selection cycles compared to their parental populations.
The specific objectives of the study were: 1) to identify morphological and growth characteristics
that could be used to identify the populations; 2) to determine any significant changes that
happened over several cycles of recurrent selection among different populations; and 3) to
determine which plant traits are correlated with mature plant performance.
32
Materials and Methods
Experiments were conducted in 2008 and 2009 at the Plant Breeding Unit (PBU),
Tallassee, AL on a Norfolk sandy loam (fine-loamy, mixed, thermic Typic Hapludult) and at the
Field Crops Unit (FCU) near Shorter, AL on a Compass sandy loam (coarse-loamy, siliceous,
subactive, thermic Plinthic Paleudults). In 2008, seeding dates were April 23rd
and May 2nd
at
PBU and FCU, respectively. In 2009 the planting dates were April 28th
at PBU and April 24th
at
FCU. The plants in PBU relied solely on rainfall while the plants in FCU received irrigation by
an overhead system when drought conditions were severe. In both locations and years, the
experiments were conducted in a randomized complete block design with five replications.
Populations were assigned to plots that were two rows (90 cm) apart and 4.5 m long per
population. In each replication, 40 random plants of each population were tagged and identified
soon after emergence.
Plant material
The populations tested in 2008 were ‘Tropic Sun’ (TS), Population12 (P12), a seed increase
under the conditions of Alabama of accession PI 322377 from Brazil, Selection P12 Cycle 1
(SelP12C1), Selection P12 Cycle2 (SelP12C2), Selection P12 Cycle 3 (SelP12C3), Selection
PBU (SelPBU), Selection Uniform Plants (SelUP) and Selection Population2 Cycle 1 (SelP2C1).
In 2009 the eight populations that were tested were Population2 (P2), an increase of accession PI
207657 from Sri Lanka, Selection Population2 Cycle1 (SelP2C1), Selection Population2 Cycle 2
(SelP2C2), P12, SelP12C1, SelP12C2, SelP12C3, and SelPBU. Populations P2 and P12 are the
populations used in the selection program (C0) from which the other population were selected.
The SelP2C1 and SelP2C2 were derived from P2, and SelP12C1, SelP12C2, SelP12C3 and

33
SelPBU were selected from P12. TS was used as a control population and is a cultivar that has
not been selected for the environmental conditions of the continental U.S
Measurements
In 2008, measurements taken on 40 individual plants per population were height at 2- and
4-weeks after planting (cm), number of days to first flower after planting, stem diameter at the
base of the plant and just below the first flower (mm), plant height up to the first flower (cm) and
number of branches below it, length and width of the leaf located below the flower (cm), total
height at maturity (cm), dry biomass weight (g) and seed production weight (g).
In 2009, the first measurements taken were number of leaves and height 2- and 4-weeks
after planting (cm), number of days to the first flower after planting, diameter of the stem at the
plant’s base and right below the first flower (mm), plant height up to the first flower (cm),
number of branches below it, length and width of the leaf located below the flower (cm). At
harvesting, the number of days from planting to 80% mature pods, total plant height (cm), dry
biomass weight (g), and seed weight (g) and seed quality (measured on a scale of 1 to 9 with 9
being the best quality seed) were counted. Plant biomass and seed yield measurements were
taken after drying for 48 hours at 60 C.
Statistical analysis
Data were collected on each plant and subjected to an ANOVA. Treatment means were
separated by the appropriate LSD comparison at the 0.05 level. All data were analyzed using the
SAS (v 9.2) statistical package (SAS Institute, 2003). The data were also analyzed by the PROC
GLM option. Interactions among locations and populations were estimated, and the two locations
were treated separately when interactions were significant. Pearson correlation analysis among
all traits was carried out.
34
Results and Discussion
2008 Experiments
The analysis of variance showed that the population effect was not significant for the trait
diameter of the stem below the first flower (Table 1). Thus, this trait will not be used to identify
morphological and growth characteristics of the populations in 2008. When statistically
significant, the changes that occurred in the populations derived from P12, namely SelP12C1,
SelP12C2 and SelP12C3, will be highlighted.
Height at two weeks after planting
The analysis of variance showed that the main effects of location (P < 0.0001) and
population (P = 0.0108) were significant. The location-population interaction was not
significant; i.e. different populations had similar growth at both locations. The average plant
height for all populations ranged from 7.87 cm to 9.58 cm. ‘Tropic Sun’ had the shortest plants
(7.87 cm), which were not significantly different from SelP12C2 (8.60 cm), SelP12C3 (8.51 cm)
and SelPBU (8.16 cm). SelP2C1 had the tallest plants (9.58 cm) and was followed by P12 with
9.24 cm, SelP12C1 with 8.99 cm and SelUP (8.87 cm), which were significantly different from
TS but similar to the other populations.
Height at four weeks after planting
Population differences were significant (P = 0.0086). The shortest population was TS
(34.20 cm) and was not significantly different from SelP12C2 (37.83 cm). SelP2C1 was the
tallest (43.81 cm) followed by SelP12C1 (43.06 cm), P12 (42.52 cm), SelUP (42.08 cm),
SelP12C3 (41.10 cm) and SelPBU (39.78 cm). These populations were not significantly different
from each other. Among the populations derived from P12 SelP12C1 was significantly different
from SelP12C2 while the rest of the populations were not significantly different from each other.

35
Number of days to first flower
The location-population interaction was significant (P = 0.0362); i.e. different
populations responded differently to the two locations. Therefore, locations must be described
separately. At PBU (Table 2), the control TS was significantly different from all the other
populations with an average of 86 days until the appearance of the first flower. The remaining
seven populations were not significantly different from each other with a span of 48 to 52 days
till flowering. P12 was not significantly different from SelP12C1 while the latter was not
significantly different from SelP12C2. SelP12C2 was not significantly different from SelP12C3.
At FCU (Table 3) TS was again significantly different from the rest of the populations with 76
days till flowering. P12 was also significantly different from the rest of the populations with 52
days till flowering. From the remaining populations SelUP took the fewest number of days (46)
till flowering and was not significantly different from SelP12C3 (47 days), SelP12C2 (48 days),
SelP12C1 (49 days) and SelP2C1 (49 days). SelPBU was significantly different from TS, P12
and SelUP but similar to the other populations.
Diameter of the stem at the base of the plant
The location-population interaction was again significant (P = 0.0004). At PBU the TS
control had by far the thickest stem with 17.11 mm of diameter which was significantly different
from all other populations. Compared to the others SelP12C2 (9.88 mm) had the second thickest
stems and was not significantly different from P12 (9.58 mm), SelP12C1 (9.46 mm) and
SelP2C1 (8.77 mm) but it was significantly different from SelP12C3 (8.19 mm). SelPBU had the
thinnest stem with 8.12 mm and was also not significantly different from SelP12C3 as well as
SelUP (8.32 mm) and SelP2C1. At FCU, again, TS had the thickest stem with 27.97 mm of
diameter and was significantly different from all the other populations. From the remaining

36
seven populations, SelUP had the thinnest stem with 11.62 mm and was not significantly
different from SelP2C1 (12.46 mm), SelPBU (12.54 mm), SelP12C3 (13.19 mm) and SelP12C1
(13.71 mm). P12 (14.64 mm) and SelP12C2 (14.46 mm) were significantly different from TS
and SelUP but similar to the other populations.
Height up to the first flower
The analysis of variance showed that the location (P = 0.0227) and population (P <
0.0001) differences were significant. The location-population interaction was not significant.
Reflecting its late flowering, our control TS population (189.67 cm) was significantly different
from all the other populations, almost double the height of the immediately shorter population,
which was P12 (91.84 cm). The latter was not significantly different from SelP2C1 (85.36 cm)
and SelP12C1 (84.16 cm). The population with the shortest plants at flowering was SelP12C2
(73.72 cm) and it was not significantly different from SelUP (74.78 cm) and SelP12C3 (78.06
cm). SelPBU (82.79 cm) was not significantly different from SelP2C1, SelP12C1 and SelP12C3.
P12 and SelP12C1 were significantly different from each other and from the other two
populations. SelP12C3 and SelP12C2 were not significantly different from each other.
Number of branches below the first flower
The location (P < 0.0001) and population (P < 0.0001) differences were significant. The
control TS (13 branches) was significantly different from all the other populations. SelP12C2
(10.49 branches) was also significantly different from all the other populations. The populations
SelP12C3 (8.97 branches), P12 (8.68 branches), SelP12C1 (8.29 branches) and SelPBU (7.70
branches) were not significantly different from each other. The remaining two populations
SelP2C1 (7.08 branches) and SelUP (7.19 branches) were not significantly different from
SelP12C1 and SelPBU.

37
Length of the leaf located below the first flower
Location (P < 0.0001) and population (P < 0.0001) differences had a significant effect on
leaf length. Again, TS (12.18 mm) was significantly different from all the other populations. The
leaf length of the rest of the populations ranged from 9.43 mm for SelUP to 10.95 mm for
SelP2C1. The latter was not significantly different from P12 (10.49 mm) but it was significantly
different from the other populations. Populations SelUP (9.43 mm), SelPBU (9.68 mm),
SelP12C3 (9.87 mm) and SelP12C1 (10.00 mm) had the shortest leaves and were not
significantly different from each other.
Width of the leaf located below the first flower
Location (P < 0.0001) and population (P < 0.0001) differences were significant for leaf
width. TS had the widest leaves (2.90 mm) was significantly different from all the other
populations. P12 had leaves 2.48 mm wide and was not significantly different from SelP2C1
(2.43 mm), SelP12C1 (2.40 mm) and SelP12C2 (2.36 mm) but it was significantly different from
SelP12C3 (2.22 mm). SelPBU (2.12 mm) had the narrowest leaves.
Height at harvest
Location (P = 0.014) and population (P < 0.0001) differences were significant for height
at harvesting. SelP2C1 (200.21 cm) and P12 (195.22 cm) were not significantly different from
each other. SelP12C1 (178.49 cm) was significantly different from all the other populations. The
rest of the populations were not significantly different from each other, with SelUP (157 cm)
being the shortest. P12 and SelP12C1 were significantly different from each other and from the
other two populations. SelP12C3 and SelP12C2 were not significantly different from each other.
38
Dry biomass weight
Population (P < 0.0001) had a significant effect on dry biomass weight. P12 (117.06 g) produced
by far the most biomass and was significantly different from all the other populations. It was
followed by SelP12C1 (87.73 g), SelP12C2 (87.39 g) and SelP2C1 (80.04 g), which were not
significantly different from each other. The most recent selections SelP12C3, SelUP and SelPBU
produced the lowest biomass (58.46 g, 55.20 g and 44.27 g respectively) and were also not
significantly different from each other. P12 and SelP12C3 were significantly different from each
other and from the other two populations. SelP12C1 and SelP12C2 were not significantly
different from each other.
Seed weight
Location (P = 0.0450) and population (P = 0.0017) had a significant effect on seed
weight per plant. P12 produced the most seeds with 30.84 g, but it was not significantly different
from SelP12C2 (29.00 g) and SelP12C1 (26.02 g). SelP2C1 (24.10 g) and SelP12C3 (24.03 g)
had significantly lower seed weight than the former populations but they were not significantly
different from each other and from SelUP (19.89 g) and SelPBU (17.47 g).
Besides characterizing and measuring the differences among populations, another
important aspect of the breeding process is having selections that are uniform and have very few
outliers. In order to determine uniformity we chose our most recent selection in 2008, SelPBU,
and we calculated the percentage of plants that fell beyond two standard deviations from average
in a normal distribution. This was done for four traits, number of days to first flower, height up
to first flower, height at seed harvest and biomass weight. In PBU these percentages were 3%,
4%, 1% and 3%, for the four traits respectively. In FCU the percentages of plants falling beyond

39
two side deviations from average were 2%, 3%, 4% and 1%. The results show that the plants in
recent selections are becoming uniform populations.
Finally, concentrating on traits before or during first flower, correlated responses for 2008
in PBU showed that dry biomass had the highest positive correlation with leaf length (r = 0.657)
(Table 4) followed by number of days to first flower (r = 0.592). For seed weight the highest
positive correlations were with number of branches below the first flower (r = 0.567) followed
closely by leaf length (r = 0.558). In FCU, dry biomass had the highest positive correlation with
diameter of the stem at base (r = 0.606) followed by leaf width (r = 0.489). For seed weight the
highest positive correlations were with number of days to first flower (r = 0.602) followed
closely by diameter of the stem at the base of the plant (r = 0.593).
2009 experiments
The analysis of variance showed that population effect of was not significant for the traits
height at two weeks after planting, number of leaves at two weeks after planting and height at
four weeks after planting (Table 6). Thus, these traits will not be used to identify morphological
and growth characteristics of the populations. Besides discussing the statistically significant
changes that occurred in the populations derived from P12, significant differences that happened
in the two populations derived from P2, SelP2C1 and SelP2C2 will also be presented.
Number of leaves at four weeks
The location-population interaction was significant (P < 0.0134). In PBU there were no
significant differences among any of the populations. In FCU SelP12C2 (28.06 leaves),
SelP12C1 (27.58 leaves), P12 (26.41 leaves), SelPBU (25.43 leaves), SelP2C1 (24.55 leaves)
and SelP12C3 (24.26 leaves) were not significantly different from each other (Table 7). From
this group, the last three populations were not significantly different from SelP2C2 (22.09

40
leaves). SelP2C1, SelP12C3, SelP2C2 and P2 (20.85 leaves) were not significantly different
from each other.
Days to flowering
The location-population interaction was significant (P = 0.0007). In PBU, the original
parental populations P12 and P2 took the most days until flowering, 61 and 58 respectively, and
were significantly different from each other from the other populations. SelP12C1 (56 days) was
not significantly different from SelP2C2 (56 days), SelP12C2 (54 days) and SelP2C1 (54 days).
SelP2C2 was significantly different from SelP12C3, while the latter population was not
significantly different from SelPBU (53 days), SelP2C1 and SelP12C2. P12 took significantly
more days to reach flowering than its derived populations. SelP12C1 was significantly different
from SelP12C3 but not from SelP12C2 and SelPBU. In FCU P2 (70 days) and SelP2C1 (65
days) were not significantly different from each other. SelP2C1 was not significantly different
from SelP2C2 (64 days) and P12 (62 days). P12 was significantly different from SelP12C2 (55
days) but it was not different from SelP12C1 (57 days), SelPBU (57 days) and SelP12C3 (57
days). P12 was significantly different from all its derived populations.
Diameter of the stem at the base of the plant
The analysis of variance showed that population (P < 0.0001) differences were
significant. The original populations, namely P2 (8.72 mm) and P12 (8.75 mm) had the thickest
stems and were not significantly different from each other. The rest of the populations ranged
from 6.30 mm for SelP12C3 to 7.13 mm for SelP12C1. The latter population was not
significantly different from SelP2C1 (7.03 mm), SelP2C2 (6.94 mm) and SelP12C2 (6.81).
SelP12C2 was not significantly different from SelPBU (6.41 mm) and SelP12C3 (6.30 mm). P12
was significantly different from all its derived populations. SelP12C1 was not significantly

41
different from SelP12C2, the latter was not significantly different from SelPBU and SelPBU was
not significantly different from SelP12C3. P2 was significantly different from SelP2C1 and
SelP2C2.
Diameter of the stem below the first flower
The population differences were significant (P = 0.0025). P12 (2.61 mm) was not
significantly different from SelP12C1 (2.44 mm). SelP12C1 was only significantly different
from SelP2C2 (2.31 mm). SelP2C2 and the remaining five populations were not significantly
different from each other.
Height up to the first flower
The analysis of variance showed that population (P < 0.0001) differences were
significant. P2 was the tallest (102.48 cm) and was significantly different from all the other
populations. P12 (92.08 cm) was below it and was not significantly different from SelP2C1
(89.00 cm) and SelP2C2 (87.42 cm). SelP12C1 (79.71 cm) was significantly different from all
the other populations. Below it were SelP12C2 (67.80 cm), SelPBU (69.20 cm) and SelP12C3
(69.24 cm), which were not significantly different from each other. P12 and SelP12C1 were
significantly different from each other and from the other three derived populations, which were
not significantly different from each other. P2 was significantly different from SelP2C1 and
SelP2C2.
Number of branches below the first flower
Location (P < 0.0001) and population (P < 0.0010) differences were significant on
number of branches. The average number of branches for PBU was 5.43 and for FCU 4.11
branches. Populations SelP12C2 (5.78 branches), P12 (5.74 branches), SelP12C1 (5.51 branches)
and P2 (5.13 branches) were not significantly different from each other. The remaining

42
populations were not significantly different from each other and from P2. SelP12C2, P12 and
SelP12C1 were not significantly different from each other. SelP12C1 was not significantly
different from SelPBU and the latter significantly different from SelP12C3.
Length of the leaf located below the first flower
Location (P < 0.0001) and population (P < 0.0001) differences were significant. P2 had
the widest leaves of all the other populations (9.91 mm) and was not significantly different from
SelP2C1 (9.82 mm). The latter population was not significantly different from P12 (9.45 mm)
and SelP2C2 (9.43 mm). SelP12C1 (8.89 mm) was significantly different from SelP12C3 (8.49
mm) but not significantly different from SelP12C2 (8.72 mm) and SelPBU (8.51 mm). P12 was
significantly different from its derived populations. P12 was significantly different from
SelP12C3 and SelPBU but not from SelP12C1 and SelP12C2.
Width of the leaf located below the first flower
The location-population interaction was significant (P = 0.0306). In PBU all populations
had leaves that were on average two cm wide, as was the case for FCU. Differences were often
measured at the second decimal, which although allowing for identification of significant
differences on a statistical level, makes it difficult to differentiate populations in the field. In
FCU P12 was significantly different from SelPBU but not from the other three derived
populations.
Number of days till harvesting
Location (P = 0.0029) and population (P < 0.0001) differences were significant. Plants at PBU
took almost five more days to reach maturity for harvesting, 140 days on average, than plants at
FCU, 136 days. In both locations, P2 took the most number of days to reach harvest stage (158
days) and was significantly different from all the other populations. SelP2C2 (145 days), P12

43
(145 days) and SelP2C1 (144 days) were not significantly different from each other. The
populations that required the fewest days were SelP12C2 (125.4 days), SelPBU (126.1 days),
SelP12C3 (127 days) and SelP12C1 (132 days). SelP12C2 was significantly different from
SelP12C1 but not significantly different from SelPBU and SelP12C3. P12 was significantly
different from its derived populations. SelP12C1 was significantly different from SelP12C2 but
not from SelP12C3 and SelPBU. P2 was significantly different from SelP2C1 and SelP2C2.
Height at harvest
Location (P = 0.0010) and population (P < 0.0001) differences were significant on height at
harvesting. P2 was the population with the tallest plants at 222.3 cm and was significantly
different from all the other populations. The population P12 (177.9 cm) was not significantly
different from SelP2C2 (186.7 cm) but it was significantly different from SelP2C1 (190.4 cm).
SelP2C2 and SelP2C1 were not significantly different from each other. The shorter plants
belonged to SelP12C2 (145.3 cm), SelP12C3 (147 cm) followed by SelPBU (148.6 cm) and
SelP12C1 (157 cm). The latter was not significantly different from SelPBU but it was
significantly different from SelP12C2 and SelP12C3. P12 was significantly different from its
derived populations. SelP12C1 was significantly different from SelP12C2 and SelP12C3 but not
from SelPBU. P2 was significantly different from SelP2C1 and SelP2C2.
Dry biomass weight
Population (P < 0.0001) had a significant effect on biomass weight. The average biomass
weight for all populations ranged from 32.73 g for SelP12C3 to 121.72 g for P2. P2 was
significantly different from all the other populations. P12 with 88.37 g was not significantly
different from SelP2C2 at 75.23 g. SelP2C1 (69.92 g) was not significantly different from
SelP2C2 and was also not significantly different SelP12C1 (57.75 g). The least biomass was

44
produced by SelP12C3 (32.73 g), SelPBU (33.81 g) and SelP12C2 (42.57 g), which were not
significantly different from each other. P12 and SelP12C1 were significantly different from each
other and from the other three populations, which were not significantly different from each
other. P2 was significantly different from SelP2C1 and SelP2C2.
Seed weight
Location (P < 0.0001) and population (P < 0.0001) had a significant effect on seed
weight. Plants at PBU (19.97 g) produced almost 5 g more seed than plants at FCU (14.98 g).
The average seed weight for all populations ranged from 14.9 g for SelP12C3 to 22.8 g for P12.
P12 was significantly different from all the other populations. Below P12 were SelP12C2 (19.32
g), SelP12C1 (17.5 g), P2 (17.42 g), and SelP2C1 (16.82 g), which were not significantly
different from each other. Lastly, SelP12C3 (14.9 g), SelPBU (15.41 g) and SelP2C2 (15.53 g)
did not produce significantly more seed from SelP2C1, SelP12C1 and P2. P12 and SelP12C2
were not significantly different from each other. The latter was significantly different from
SelP12C3 and SelPBU but not from SelP12C1.
Seed quality
The location (P = 0.0045) and population (P < 0.0001) interaction were significant for
seed quality. SelPBU (8) had significantly better quality seed from SelP12C1 (6) but not from
SelP12C2 (6.8) and SelP12C3 (6.3). Finally, P12 (4), SelP2C1 (3.8), SelP2C2 (3.5) and P2 (3.3)
were not significantly different from each other. This supports the hypothesis that early
flowering and early harvesting leads to better quality seed. P12 was significantly different from
its derived populations, which were not significantly different from each other.
In 2009 we chose two populations to check for percentage of plants falling beyond two
standard deviations from average. The populations were the most recent selection of SelPBU and

45
SelP2C2. These are the best candidates for releasing as a variety and they need to exhibit
uniformity. The traits tested were number of days to first flower, height up to first flower,
number of days till seed harvest, height at seed harvest and biomass weight. In PBU the
percentages of plants beyond 95% were 3%, 2%, 2%, 2% and 5% for SelPBU and 3%, 3%, 2%,
4% and 4% for SelP2C2 respectively. In FCU the percentages were 5%, 3%, 3, 1% and 4% for
SelPBU and 5%, 5%, 3%, 2%, and 6% for SelP2C2.
The correlated responses for 2009 in PBU, for traits before or during flowering, (Table 9)
showed that dry biomass had the highest positive correlation with height at flowering (r = 0.847)
followed by diameter of the stem at base (r = 0.812). For seed weight the highest positive
correlations were with diameter of the stem at the base (r = 0.726) followed by number of days
to first flower (r = 0.574). Seed quality correlated negatively with all traits except for number of
leaves at two weeks after planting. This means that an increase in the rest of traits will decrease
seed quality. The highest negative correlations were with leaf length (r = - 0.662) followed by
height at flowering (r = - 0.574). For the same year in FCU dry biomass had the highest positive
correlation with height at flowering (r = 0.801) followed by diameter of the stem at the base (r =
0.728). For seed weight the highest positive correlations were with leaf width (r = 0.641)
followed by number of branches below the first flower (r = 0.617). For seed quality the highest
negative correlations were with number of days to flowering (r = - 0.608) followed by height up
to first flower (r = -0.579).
Summary
Results from 2008 indicated that the different cycles of selection were not different for
height at two and four weeks after planting. The control, TS, had the shortest plants in both
cases. For the trait number of days to first flower, TS took significantly longer to reach this stage

46
than the rest of the populations, which were not significant different among them. TS was also
significantly different than the other populations for the traits stem base, height up to the first
flower, number of branches and length of the leaf below the first flower, while the rest of the
populations did not have significant differences based on year of selection.
Results from 2009 indicated that all populations gained an average of two leaves and two
cm in height in the span of two weeks. However, there was no significant difference among them
for any of the early traits in either one of the locations.
When plants started to flower, there was a clear differentiation among the two parent
populations P2 and P12 and the rest of the selections. ‘Tropic Sun’ had very limited flowering
and no seed production, so no additional measurements were taken from this cultivar. For the
parental populations used in the Alabama breeding program, on average, P2 and P12 begun to
flower four to nine days later than the earliest flowering population. Furthermore, P2 and P12
had significantly thicker stems both at their base and right below their first flower. The
difference was 1.5 mm and 0.5 mm respectively when compared to more recent selections. Also,
earlier selection cycles were almost 20cm taller up to their first flower. Clearly, the extra days
that P2 and P12 required to flower were spent in producing more vegetative matter. Length and
width of the leaf below the first flower was almost identical among populations except for P12 in
PBU, which was almost one cm longer than its three cycles of selection and SelPBU. Number of
branches below the first flower was almost identical among populations with P2 and P12 having
an average of six branches as opposed to five for later selections, but the difference was not
statistically significant.
As with flowering, the original material, P2 and P12 took 20 to 30 extra days to reach a
level of at least 80% mature pods and they were 40 cm taller. There was a significant drop in
47
days to harvesting between parent material and the first cycle of selection. Specifically, P2 was
harvested two weeks later than SelP2C1 and P12 was harvested 12 days later than SelP12C1.
Differences at harvesting time were smaller among subsequent selections with only a day
difference between SelP2C1 and SelP2C2, eight days difference between SelP12C1 and SelPBU
and two days difference between SelP12C2 and SelP12C3.
Yield measurements reflected these observations with P2 and P12 netting significantly
higher biomass and seed. More specifically, P2 produced on average 50 g more than SelP2C1, as
did P12 when compared to SelP12C3. In PBU, P12 was able to produce roughly eight more g of
seed than SelPBU. In contrast, at FCU SelPBU produced seed of significantly higher quality than
P12. The reason for this is that late-maturing pods are more susceptible to southern green stink
bug (Nezara viridula L ) attacks. Stink bugs puncture the pod in order to feed on the juices and
the resulting opening leaves the pod susceptible to fungal infestation, which results into moldy
seeds that weigh far less than healthy seeds and are, of course, of much poorer quality. The
problem is further accentuated for late-maturing plants that get caught in early-fall rains,
especially in soils that do not allow for adequate drainage.
After two years of testing, results indicate that traits measured at two and four weeks after
planting did not produce any significant differences among populations. Although the separation
among later selection cycles was not very consistent for the remaining traits, the parental
populations P2 and P12 were taller than the populations derived from them and had wider stems.
On the other hand, SelPBU, the latest selection measured, ranked either at the bottom or second
to last for all traits except seed quality. This means that there is a trade-off, with progressive
selection cycles the plants are getting uniformly smaller in size, but their earlier flowering and
earlier harvesting dates allow them to produce higher-quality seed.

48
This is because parental populations retain, to a much greater extent, their
photoperiodicity and thus favor shorter daylength. Therefore, late in the summer they switch
their resources into producing taller, thicker stems and more leaves but their flowering and
harvesting date gets significantly delayed. Their pods only mature during the fall when daylength
begins to shorten.
In conclusion, the breeding program has been successful in producing plants that have
adapted to the subtropical conditions of the Southeast. In the process, the plants have become
more compact, they flower early and they are also ready for harvest much earlier than their
parental populations. This has allowed the production of sufficient amounts of good quality seed
which in turn allows for seed-increase and for the continuation of the breeding cycles.
49
References
Cook, C.G., and G.A. White. 1996 Crotalaria juncea: A potential multi-purpose fiber crop. p.
389-394. In: J. Janick (ed.), Progress in new crops. ASHS Press, Arlington, VA.
Cunningham, R.L., T.F. Clark, and M.O. Bagby. 1978. Crotalaria juncea—annual source of
papermaking fiber. Tech. Assoc. Pulp Pap. Ind. 61:37–39
Evans, L.T. 1993. Crop Evolution, Adaptation and Yield. Cambridge: Cambridge University
Press.
Evans, L.T. and R.A. Fischer. 1999. Yield potential: its definition, measurement and
significance. Crop Science 39:1544–1551.
Mansoer, Z., D.W. Reeves, and C.W. Wood. 1997. Suitability of Sunn hemp as an alternative late
summer legume cover crop. Soil Science Society of America Journal 61: 246-253.
Montgomery, B. 1954. Sunn fiber. In: H.R. Mauersberger (ed.), Mathew's textile fibers. 6th ed.
Wiley, New York p. 323-327
Marla, S.R., R.N. Huettel, and J.A. Mosjidis. 2008. Evaluation of Crotalaria juncea populations
as a summer cover crop to manage Meloidogyne incognita and Rotylenchulus
reniformis. Nematropica 83:155-162
McSorley, R. 1999. Host susceptibility of potential cover crops for root-knot nematodes. Journal
of Nematology. 31:619-623.
Mosjidis J.A. 2006. Legume breeding and their utilization as forage and cover crops.
Proceedingsof the 60th. Southern Pasture and Forage Crop Improvement Conference,
Auburn, Alabama, April 12, 2006. CD-ROM
Mosjidis J.A. 2007. Breeding of Annual and Perennial Legumes and their Utilization as Forage
and Cover Crops. A Periodical of Scientific Research on Field and Vegetable Crops
(Zbornik Radova) 44:7-11.
50
Mosjidis, J.A. and G. Wehtje. 2010. Weed control in Sunn Hemp (Crotalaria juncea L.) and its
ability to suppress weed growth. Crop Protection 30:70-73
Ramalho, M.A.P., A. Abreu de FB, and J.B. Santos. 2005. Genetic progress after four cycles of
recurrent selection for yield and grain traits in common bean. Euphytica. 144: 23-29
Rotar, P.P. and R.J. Joy. 1983. `’Tropic Sun’' Sunn hemp, Crotalaria juncea L. Univ. of Hawaii,
College of Tropical Agr. and Human Resources, Institute of Tropical Agr. and Human
Resources Research Extension Series 36
Vales, M.I., R.A. Malvar, P. Revilla, and A. Ordás. 2001. Recurrent selection for grain yield in
two Spanish maize synthetic populations. Crop Sci. 41: 15-19
Wang, K. H., R. McSorley, and R. N. Gallaher. 2004b. Effect of Crotalaria juncea on squash
infected with Meloidogyne incognita. Journal of Nematology. 36:290-296.
White, G.A. and J.R. Haun. 1965. Growing Crotalaria juncea, a multi-purpose fiber legume, for
paper pulp. Econ. Bot. 19:175-183
Wiersma, J.J., R.H. Busch, G.G. Fulcher, and G.A. Hareland. 2001. Recurrent selection for
kernel weight in spring wheat. Crop Sci. 41: 999-1005

51
Table.6. Mean values and analyses of variance of 12 traits of eight genotypes of Sunn hemp in
2008 at FCU and PBU.
Ht2 Ht4 DFlr DmStB DmStFl HtFlr
Location
FCU 7.10 40.49 50.65 14.40 3.46 92.44
PBU 10.35 40.61 53.13 9.74 3.01 90.22
LSD (0.05) 0.47 2.61 1.28 0.69 0.18 3.82
Population
P12 9.24 42.52 51.90 12.11 3.26 91.84
SelP12C1 8.99 43.06 49.30 11.59 3.27 84.16
SelP12C2 8.60 37.83 48.30 12.17 3.15 73.72
SelP12C3 8.51 41.10 47.70 10.69 3.08 78.06
SelPBU 8.16 39.78 49.50 10.33 3.20 82.79
SelUP 8.87 42.08 46.96 9.97 3.20 74.78
SelP2C1 9.58 43.81 49.10 10.61 3.17 85.36
TS 7.87 34.20 81.29 21.76 3.62 189.67
LSD (0.05) 0.93 5.22 2.58 1.39 0.37 7.70
Analysis of variance (P > F)
Location <.0001 0.9281 0.0025 <.0001 <.0001 0.0227
Population 0.0108 0.0086 <.0001 <.0001 0.2451 <.0001
Loc*Pop 0.452 0.9129 0.0362 0.0004 0.9862 0.7883
†Ht2 = height at 2 weeks after planting (cm), Ht4 = height at 4 weeks after planting (cm), DFlr = number of days till the first
flower after planting, DmStB = diameter at the base of the plant (mm), DmStFlr = diameter at the first flower (mm), HtFlr =
height up to the first flower (cm), BrhN = number of branches below the first flower, Llth = leaf length at the first flower (cm),
Lwth = leaf width at the first flower (cm), Height = height at harvest (cm), Biomass = dry biomass weight at seed maturity (g),
SeedWt = seed weight (g).
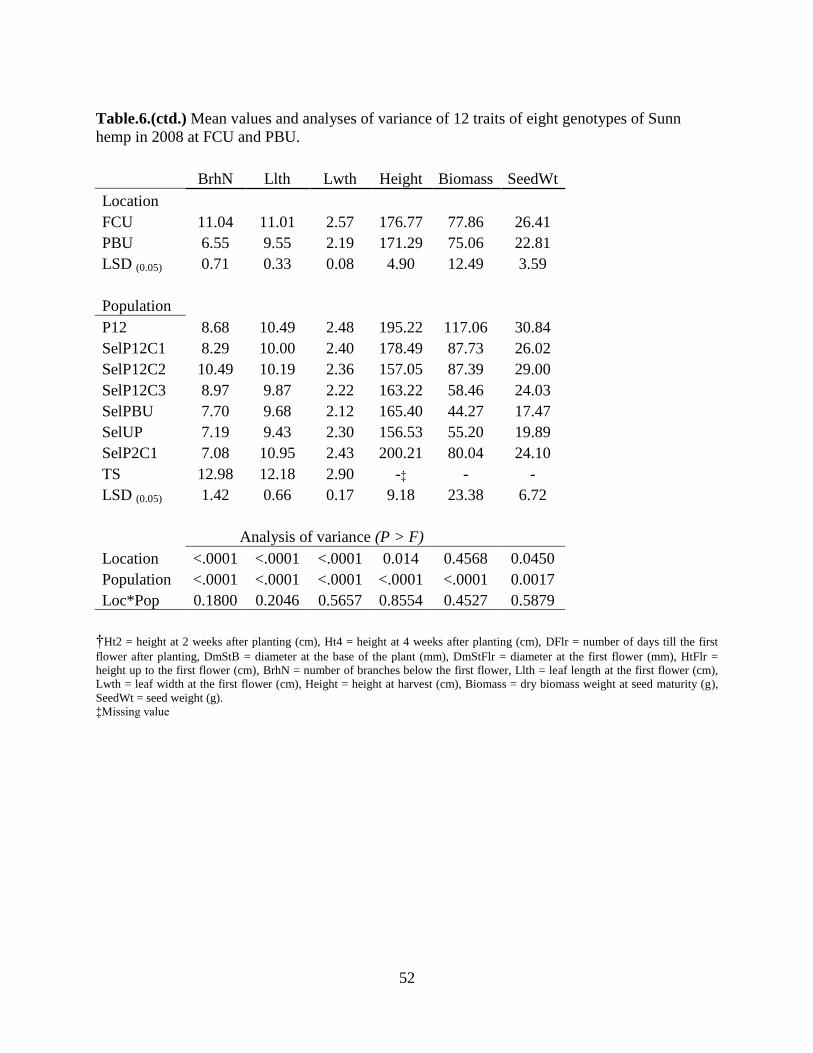
52
Table.6.(ctd.) Mean values and analyses of variance of 12 traits of eight genotypes of Sunn
hemp in 2008 at FCU and PBU.
BrhN Llth Lwth Height Biomass SeedWt
Location
FCU 11.04 11.01 2.57 176.77 77.86 26.41
PBU 6.55 9.55 2.19 171.29 75.06 22.81
LSD (0.05) 0.71 0.33 0.08 4.90 12.49 3.59
Population
P12 8.68 10.49 2.48 195.22 117.06 30.84
SelP12C1 8.29 10.00 2.40 178.49 87.73 26.02
SelP12C2 10.49 10.19 2.36 157.05 87.39 29.00
SelP12C3 8.97 9.87 2.22 163.22 58.46 24.03
SelPBU 7.70 9.68 2.12 165.40 44.27 17.47
SelUP 7.19 9.43 2.30 156.53 55.20 19.89
SelP2C1 7.08 10.95 2.43 200.21 80.04 24.10
TS 12.98 12.18 2.90 -‡ - -
LSD (0.05) 1.42 0.66 0.17 9.18 23.38 6.72
Analysis of variance (P > F)
Location <.0001 <.0001 <.0001 0.014 0.4568 0.0450
Population <.0001 <.0001 <.0001 <.0001 <.0001 0.0017
Loc*Pop 0.1800 0.2046 0.5657 0.8554 0.4527 0.5879
†Ht2 = height at 2 weeks after planting (cm), Ht4 = height at 4 weeks after planting (cm), DFlr = number of days till the first
flower after planting, DmStB = diameter at the base of the plant (mm), DmStFlr = diameter at the first flower (mm), HtFlr =
height up to the first flower (cm), BrhN = number of branches below the first flower, Llth = leaf length at the first flower (cm),
Lwth = leaf width at the first flower (cm), Height = height at harvest (cm), Biomass = dry biomass weight at seed maturity (g),
SeedWt = seed weight (g).
‡Missing value

53
Table.7. Mean values of two plant growth traits of 8 populations of C. juncea in 2008 at PBU.
Averages represent the means of approximately 200 plants per population.
Population DFlr† DmStB
P12 51.80 9.58
SelP12C1 50.00 9.46
SelP12C2 49.00 9.88
SelP12C3 48.00 8.19
SelPBU 50.00 8.12
SelUP 47.60 8.32
SelP2C1 49.60 8.77
TS 85.50 17.11
LSD (0.05) 4.58 1.32
† DFlr = number of days till the first flower after planting, DmStB = diameter at the base of the plant (mm), Biomass = dry
biomass weight at seed maturity (g)
‡Missing value

54
Table.8. Mean values of two plant growth traits of 8 populations of C. juncea in 2008 at FCU.
Averages represent the means of approximately 200 plants per population.
Population DFlr† DmStB
P12 52.00 14.64
SelP12C1 48.60 13.71
SelP12C2 47.60 14.46
SelP12C3 47.40 13.19
SelPBU 49.00 12.54
SelUP 46.32 11.62
SelP2C1 48.60 12.46
TS 75.67 27.97
LSD (0.05) 2.52 2.55
† DFlr = number of days till the first flower after planting, DmStB = diameter at the base of the plant (mm), Biomass = dry
biomass weight at seed maturity (g)
‡Missing value

55
Table.9. Pearson correlation coefficients among seedling traits and mature plant traits in C.
juncea for 2008 in PBU and FCU.
Trait
PBU 08 Ht4 DFlr DmStB DmStFlr HtFlr BrhN
Ht2 0.907*** -0.475** -0.299 -0.119 -0.294 -0.402*
Ht4 -0.522*** -0.333 -0.104 -0.302 -0.501***
DFlr 0.865*** 0.354* 0.918*** 0.664***
DmStB 0.385* 0.906*** 0.741***
DmStFlr 0.208 0.367*
HtFlr 0.522***
BrhN
Llth
Lwth
Hhst
Biomass
FCU 08 Ht4 DFlr DmStB DmStFl HtFlr BrhN
Ht2 0.796*** -0.175 -0.120 0.003 -0.004 -0.345*
Ht4 -0.455** -0.376* -0.111 -0.245 -0.519***
DFlr 0.911*** 0.565*** 0.962*** 0.681***
DmStB 0.673*** 0.885*** 0.843***
DmStFl 0.607*** 0.581***
HtFlr 0.587***
BrhN
Llth
Lwth
Hhst
Biomass *Significant at the 0.05 probability level. **Significant at the 0.01 probability level. ***Significant at the 0.0001 probability
level.
Ht2 = height at 2 weeks after planting, Ht4 = height at 4 weeks after planting, DFlr = number of days till the first flower after
planting, DmStB = diameter at the base of the plant, DmStFlr = diameter at the first flower, HtFlr = height up to the first flower,
BrhN = number of branches below the first flower, Llth = leaf length at the first flower, Lwth = leaf width at the first flower,
Hhst = height at harvest, Biomass =dry biomass weight, SeedWt = seed weight.

56
Table.9.(ctd.) Pearson correlation coefficients among seedling traits and mature plant traits in C.
juncea for 2008 in PBU and FCU.
Trait
PBU 08 Llth Lwth Hhst Biomass SeedWt
Ht2 -0.304 -0.119 0.174 -0.117 -0.133
Ht4 -0.351* -0.149 0.240 -0.150 -0.176
DFlr 0.754*** 0.607*** 0.463** 0.592*** 0.200
DmStB 0.848*** 0.735*** 0.076 0.479** 0.478**
DmStFlr 0.122 0.472** 0.176 0.171 0.208
HtFlr 0.848*** 0.620*** 0.794*** 0.512** 0.077
BrhN 0.531*** 0.605*** -0.363* 0.346* 0.567***
Llth 0.711*** 0.550** 0.657*** 0.558**
Lwth 0.303 0.473** 0.410*
Hhst 0.562*** 0.164
Biomass 0.655***
FCU 08 Llth Lwth Hhst Biomass SeedWt
Ht2 0.010 0.245 0.476** 0.083 0.024
Ht4 -0.241 -0.040 0.295 -0.195 -0.346
DFlr 0.424** 0.677*** 0.393* 0.432** 0.602***
DmStB 0.298 0.781*** 0.281 0.606*** 0.593***
DmStFl 0.028 0.528*** 0.276 0.290 0.034
HtFlr 0.461** 0.740*** 0.779*** 0.224* 0.161
BrhN 0.093 0.524*** -0.180 0.400* 0.387*
Llth 0.578*** 0.716*** 0.477** 0.443*
Lwth 0.720*** 0.489** 0.393*
Hhst 0.253 0.278
Biomass 0.850*** *Significant at the 0.05 probability level. **Significant at the 0.01 probability level. ***Significant at the 0.0001 probability
level.
Ht2 = height at 2 weeks after planting, Ht4 = height at 4 weeks after planting, DFlr = number of days till the first flower after
planting, DmStB = diameter at the base of the plant, DmStFlr = diameter at the first flower, HtFlr = height up to the first flower,
BrhN = number of branches below the first flower, Llth = leaf length at the first flower, Lwth = leaf width at the first flower,
Hhst = height at harvest, Biomass =dry biomass weight, SeedWt = seed weight.

57
Table.10. Mean values and analyses of variance of 16 traits of eight genotypes of Sunn hemp in
2009 at FCU and PBU.
Means for traits measured per plant
Ht2† Leaf2 Ht4 Leaf4 DFlr DmStB DmStFl HtFL
Location
FCU 6.60 9.27 30.21 24.67 56.15 6.97 2.31 81.74
PBU 5.85 7.69 16.77 17.03 55.60 7.50 2.37 82.49
LSD (0.05) 0.40 0.43 2.13 1.11 1.34 0.31 0.09 3.26
Population
P12 6.49 8.67 23.14 21.76 61.30 8.75 2.61 92.08
SelP12C1 6.05 8.82 25.36 22.34 56.10 7.13 2.44 79.71
SelP12C2 5.72 8.62 22.83 22.15 54.80 6.81 2.31 67.80
SelP12C3 6.01 8.90 22.38 20.48 38.30 6.30 2.27 69.24
SelPBU 5.88 8.76 21.75 20.68 55.20 6.41 2.27 69.20
P2 6.51 8.07 23.34 18.84 63.50 8.72 2.31 102.48
SelP2C1 6.78 8.38 25.18 20.91 58.60 7.03 2.28 89.00
SelP2C2 6.36 7.63 23.96 19.66 59.20 6.94 2.21 87.42
LSD (0.05) 0.80 0.85 4.26 2.22 2.69 0.63 0.19 6.53
Analysis of variance (P > F)
Location 0.0004 <.0001 <.0001 <.0001 <.0001 0.0015 0.2396 0.6470
Population 0.1337 0.0567 0.6592 0.0311 <.0001 <.0001 0.0025 <.0001
Loc*Pop 0.6883 0.2933 0.4112 0.0134 0.0007 0.5877 0.0428 0.2480
†Ht2 = height at 2 weeks after planting (cm), Leaf2 = number of leaves at 2 weeks after planting, Ht4 = 4 weeks after planting
(cm), Leaf4 = number of leaves at 4 weeks after planting, DFlr = number of days till the first flower after planting, DmStB =
diameter at the base of the plant (mm), DmStFlr = diameter at the first flower (mm), HtFlr = height up to the first flower (cm)
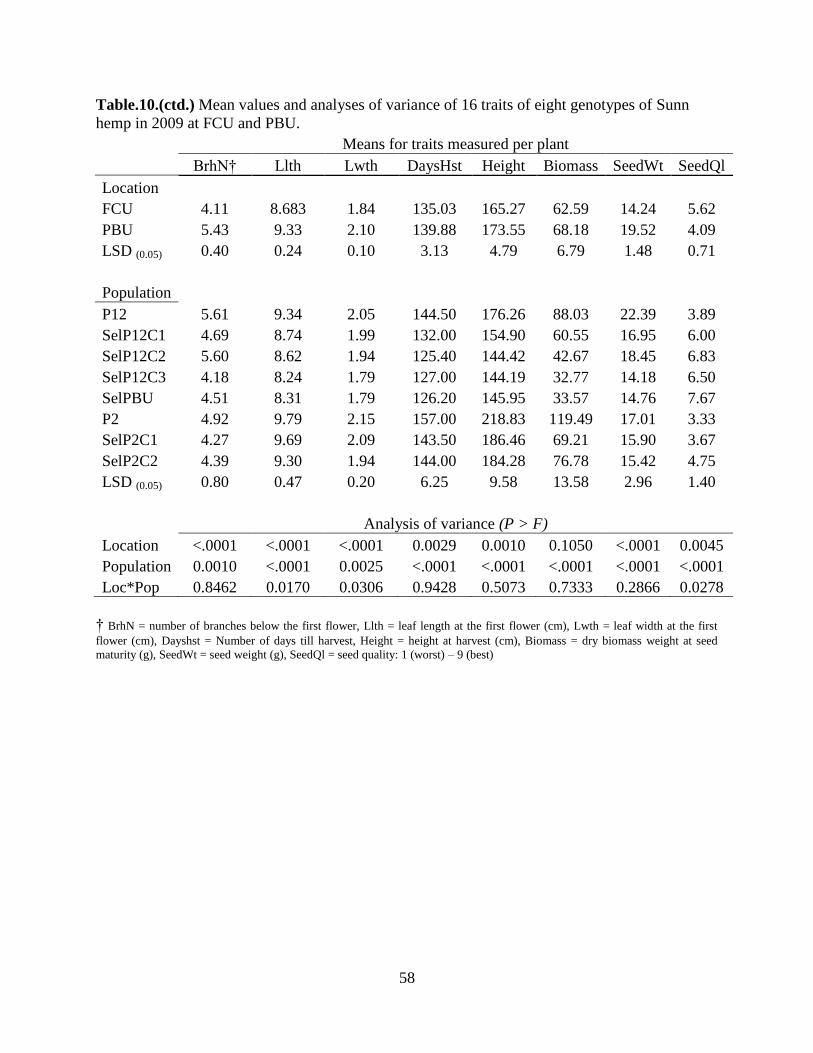
58
Table.10.(ctd.) Mean values and analyses of variance of 16 traits of eight genotypes of Sunn
hemp in 2009 at FCU and PBU.
Means for traits measured per plant
BrhN† Llth Lwth DaysHst Height Biomass SeedWt SeedQl
Location
FCU 4.11 8.683 1.84 135.03 165.27 62.59 14.24 5.62
PBU 5.43 9.33 2.10 139.88 173.55 68.18 19.52 4.09
LSD (0.05) 0.40 0.24 0.10 3.13 4.79 6.79 1.48 0.71
Population
P12 5.61 9.34 2.05 144.50 176.26 88.03 22.39 3.89
SelP12C1 4.69 8.74 1.99 132.00 154.90 60.55 16.95 6.00
SelP12C2 5.60 8.62 1.94 125.40 144.42 42.67 18.45 6.83
SelP12C3 4.18 8.24 1.79 127.00 144.19 32.77 14.18 6.50
SelPBU 4.51 8.31 1.79 126.20 145.95 33.57 14.76 7.67
P2 4.92 9.79 2.15 157.00 218.83 119.49 17.01 3.33
SelP2C1 4.27 9.69 2.09 143.50 186.46 69.21 15.90 3.67
SelP2C2 4.39 9.30 1.94 144.00 184.28 76.78 15.42 4.75
LSD (0.05) 0.80 0.47 0.20 6.25 9.58 13.58 2.96 1.40
Analysis of variance (P > F)
Location <.0001 <.0001 <.0001 0.0029 0.0010 0.1050 <.0001 0.0045
Population 0.0010 <.0001 0.0025 <.0001 <.0001 <.0001 <.0001 <.0001
Loc*Pop 0.8462 0.0170 0.0306 0.9428 0.5073 0.7333 0.2866 0.0278
† BrhN = number of branches below the first flower, Llth = leaf length at the first flower (cm), Lwth = leaf width at the first
flower (cm), Dayshst = Number of days till harvest, Height = height at harvest (cm), Biomass = dry biomass weight at seed
maturity (g), SeedWt = seed weight (g), SeedQl = seed quality: 1 (worst) – 9 (best)

59
Table.11. Mean values of six plant growth traits of 8 populations of C. juncea in 2009 at PBU.
Averages represent the means of approximately 200 plants per population.
Traits Measured per Plant
Population Leaf4† DFlr DmStFl Llth Lwth SeedQl
P12 17.24 61.00 2.71 9.41 2.10 2.95
SelP12C1 17.27 55.40 2.29 8.84 2.01 6.00
SelP12C2 16.47 54.20 2.24 8.53 1.92 6.00
SelP12C3 17.24 52.80 2.33 8.70 1.94 5.17
SelPBU 16.31 53.60 2.25 8.62 1.93 7.00
P2 16.97 58.40 2.44 10.33 2.45 3.05
SelP2C1 17.49 53.80 2.40 10.36 2.31 4.00
SelP2C2 17.25 55.60 2.26 9.87 2.14 -‡
LSD (0.05) NS 2.31 0.27 0.57 0.21 2.73
†Leaf4 = number of leaves at 4 weeks after planting, DFlr = number of days till the first flower after planting, DmStFlr =
diameter at the first flower (mm), Llth = leaf length at the first flower (cm), Lwth = leaf width at the first flower (cm), SeedQl =
seed quality: 1 (worst) – 9 (best)
‡Missing value

60
Table.12. Mean values of six plant growth traits of 8 populations of C. juncea in 2009 at FCU.
Averages represent the means of approximately 200 plants per population.
Traits Measured per Plant
Population Leaf4† DFlr DmStFl Llth Lwth SeedQl
P12 26.28 61.60 2.50 9.26 1.99 4.90
SelP12C1 27.41 56.80 2.58 8.64 1.97 6.16
SelP12C2 27.83 55.40 2.39 8.71 1.96 6.96
SelP12C3 23.72 56.20 2.21 7.79 1.64 7.56
SelPBU 25.05 56.80 2.29 8.00 1.65 7.99
P2 20.71 68.60 2.19 9.26 1.86 3.22
SelP2C1 24.32 63.40 2.16 9.02 1.88 3.46
SelP2C2 22.07 62.80 2.16 8.72 1.75 6.10
LSD (0.05) 4.34 4.87 0.27 0.78 NS 1.80
† Leaf4 = number of leaves at 4 weeks after planting, DFlr = number of days till the first flower after planting, DmStFlr =
diameter at the first flower (mm), Llth = leaf length at the first flower (cm), Lwth = leaf width at the first flower (cm), SeedQl =
seed quality: 1 (worst) – 9 (best)

61
Table.13. Pearson correlation coefficients among seedling traits and mature plant traits in C.
juncea for 2009 in PBU and FCU.
PBU 09
Trait Leaf2 Ht4 Leaf4 DFlr DmStB DmStFl HtFL BrhN
Ht2 0.632*** 0.624*** 0.353* 0.229 0.180 0.128 0.438** -0.202
Leaf2 0.156 0.203 0.016 -0.067 -0.032 -0.0001 -0.222
Ht4 0.481** -0.002 0.328 0.026 0.618*** -0.037
Leaf4 -0.158 0.246 0.310 0.222 0.103
DFlr 0.641*** 0.365* 0.689*** 0.137
DmStB 0.548*** 0.765*** 0.514**
DmStFl 0.342* 0.219
HtFL 0.113
*Significant at the 0.05 probability level. **Significant at the 0.01 probability level. ***Significant at the 0.0001 probability level.
Ht2 = height at 2 weeks after planting, Leaf2 = number of leaves at 2 weeks after planting, Ht4 = 4 weeks after planting, Leaf4 =
number of leaves at 4 weeks after planting, DFlr = number of days till the first flower after planting, DmStB = diameter at the
base of the plant DmStFlr = diameter at the first flower, HtFlr = height up to the first flower, BrhN = number of branches below
the first flower, Llth = leaf length at the first flower, Lwth = leaf width at the first flower, Dayshst = Number of days till harvest,
Hhst = height at harvest, Biomass =dry biomass weight, SeedWt = seed weight, SeedQt = seed quality

62
Table.13.(ctd.) Pearson correlation coefficients among seedling traits and mature plant traits in
C. juncea for 2009 in PBU and FCU.
PBU 09
Trait Llth Lwth DaysHst Hhst Biomass SeedWt SeedQt
Ht2 0.155 0.042 0.434** 0.352* 0.199 -0.013 -0.005
Leaf2 -0.323* -0.359* -0.063 -0.147 -0.201 -0.043 0.437*
Ht4 0.658*** 0.543*** 0.539*** 0.651*** 0.470** -0.006 -0.364
Leaf4 0.269 0.246 0.118 0.169 0.166 0.134 -0.075
DFlr 0.200 0.152 0.680*** 0.522*** 0.651*** 0.574*** -0.464*
DmStB 0.538** 0.562** 0.596*** 0.640*** 0.770*** 0.726*** -0.496*
DmStFl 0.303 0.390* 0.305 0.309 0.367* 0.497*** -0.185
HtFL 0.684*** 0.584*** 0.863*** 0.914*** 0.847*** 0.445** -0.574**
BrhN 0.194 0.287 -0.139 -0.178 0.266 0.454* -0.460*
Llth 0.909*** 0.657*** 0.802*** 0.665*** 0.310 -0.662**
Lwth 0.572*** 0.729*** 0.684*** 0.311 -0.471*
DaysHst 0.892*** 0.789*** 0.371* -0.553**
Hhst 0.843*** 0.329* -0.528*
Biomass 0.590*** -0.586**
SeedWt -0.364
*Significant at the 0.05 probability level. **Significant at the 0.01 probability level. ***Significant at the 0.0001 probability level.
Ht2 = height at 2 weeks after planting, Leaf2 = number of leaves at 2 weeks after planting, Ht4 = 4 weeks after planting, Leaf4 =
number of leaves at 4 weeks after planting, DFlr = number of days till the first flower after planting, DmStB = diameter at the
base of the plant DmStFlr = diameter at the first flower, HtFlr = height up to the first flower, BrhN = number of branches below
the first flower, Llth = leaf length at the first flower, Lwth = leaf width at the first flower, Dayshst = Number of days till harvest,
Hhst = height at harvest, Biomass =dry biomass weight, SeedWt = seed weight, SeedQt = seed quality
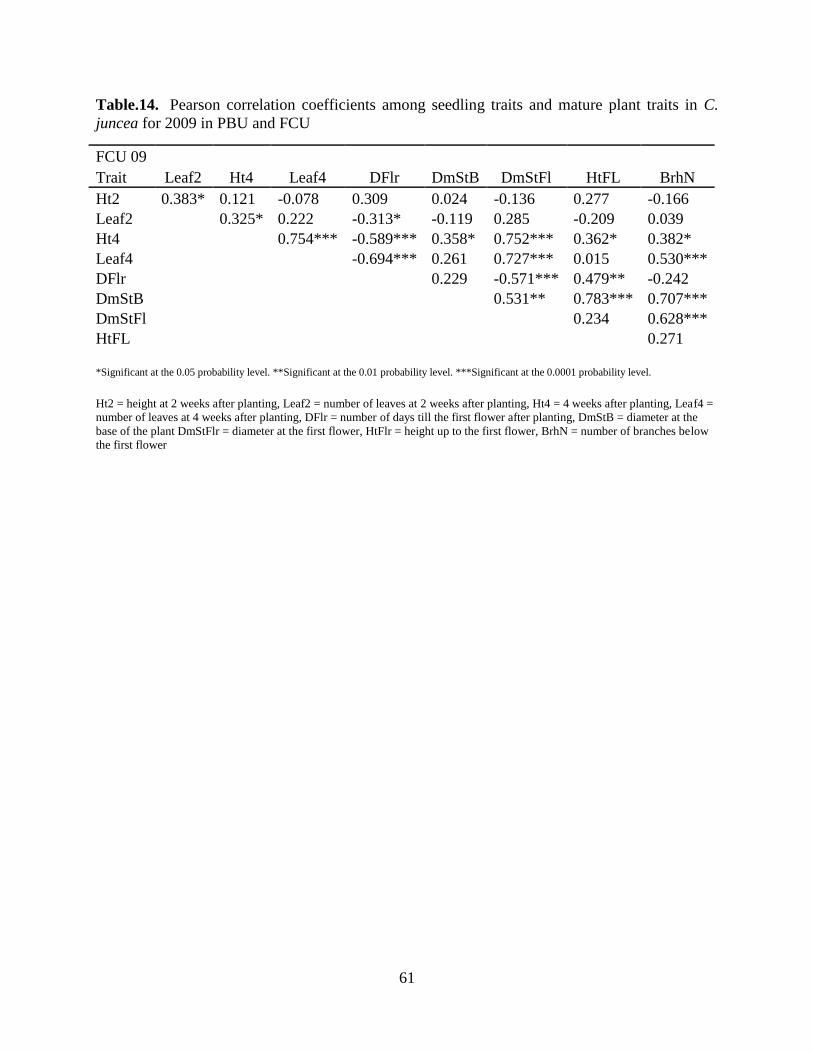
61
Table.14. Pearson correlation coefficients among seedling traits and mature plant traits in C.
juncea for 2009 in PBU and FCU
FCU 09
Trait Leaf2 Ht4 Leaf4 DFlr DmStB DmStFl HtFL BrhN
Ht2 0.383* 0.121 -0.078 0.309 0.024 -0.136 0.277 -0.166
Leaf2 0.325* 0.222 -0.313* -0.119 0.285 -0.209 0.039
Ht4 0.754*** -0.589*** 0.358* 0.752*** 0.362* 0.382*
Leaf4 -0.694*** 0.261 0.727*** 0.015 0.530***
DFlr 0.229 -0.571*** 0.479** -0.242
DmStB 0.531** 0.783*** 0.707***
DmStFl 0.234 0.628***
HtFL 0.271
*Significant at the 0.05 probability level. **Significant at the 0.01 probability level. ***Significant at the 0.0001 probability level.
Ht2 = height at 2 weeks after planting, Leaf2 = number of leaves at 2 weeks after planting, Ht4 = 4 weeks after planting, Leaf4 =
number of leaves at 4 weeks after planting, DFlr = number of days till the first flower after planting, DmStB = diameter at the
base of the plant DmStFlr = diameter at the first flower, HtFlr = height up to the first flower, BrhN = number of branches below
the first flower

62
Table.14.(ctd.) Pearson correlation coefficients among seedling traits and mature plant traits in
C. juncea for 2009 in PBU and FCU
FCU 09
Trait Llth Lwth DaysHst Hhst Biomass SeedWt SeedQt
Ht2 -0.037 -0.095 0.347 0.26 0.214 -0.151 -0.258
Leaf2 -0.364* 0.004 -0.376* -0.394* -0.376* -0.013 0.169
Ht4 0.303 0.698*** -0.426** 0.13 0.026 0.354* 0.143
Leaf4 0.213 0.575*** -0.595*** -0.202 -0.248 0.474** 0.328*
DFlr 0.177 -0.339* 0.935*** 0.597*** 0.591*** -0.262 -0.608***
DmStB 0.855*** 0.729*** 0.370** 0.683*** 0.728*** 0.595*** -0.430**
DmStFl 0.453** 0.786*** -0.437** -0.002 -0.0141 0.554*** 0.217
HtFL 0.726*** 0.523*** 0.585*** 0.893*** 0.801*** 0.208 -0.579***
BrhN 0.620*** 0.727*** -0.122 0.148 0.257 0.617*** 0.071
Llth 0.775*** 0.329* 0.723*** 0.682*** 0.565*** -0.397*
Lwth -0.187 0.358* 0.333* 0.641*** -0.098
DaysHst 0.733*** 0.725*** -0.116 -0.718***
Hhst 0.893*** 0.168 -0.666***
Biomass 0.344* -0.663***
SeedWt -0.162
*Significant at the 0.05 probability level. **Significant at the 0.01 probability level. ***Significant at the 0.0001 probability level.
Llth = leaf length at the first flower, Lwth = leaf width at the first flower, Dayshst = Number of days till harvest, Hhst = height at
harvest, Biomass =dry biomass weight, SeedWt = seed weight, SeedQt = seed quality

63
IV. Daylength and Temperature Effects on Emergence and Early Growth of Crotalaria
juncea
Abstract
Sunn hemp is a tropical legume that is not adapted to the environmental conditions of the
southeastern United States. Research has determined that seasonal variations in daylength and
temperature play an important role on early growth in this plant, but their effect on germination as
well as on early plant growth has not been documented. A germination experiment was conducted in
order to determine the effect of temperature on seed emergence. Temperatures tested were 10°C,
15°C, 20°C, 25°C, and 30°C. Genotypes chosen were Population 2, Population 7, Population 11,
Population 16, selection PBU and ‘Tropic Sun’ (TS). Additionally, an environmental chamber
study was undertaken to determine the effect of daylength and temperature in three populations of
Sunn hemp. Genotypes chosen were Population 2, SelPBU, and TS. Plants were tested under 4
daylength-temperature combinations, which were 32/17ºC for 14 and 12 hours of daylength, and
25/10 ºC for 14 and 12 hours of daylength.
Temperature did not have a significant effect on germination percentage. Only the lower
temperature (10ºC) resulted in significantly lower seed germination. Temperature had a significant
quadratic effect on percent germination on almost all of the genotypes. The highest daylength-
temperature combinations (32/17ºC for 14 and 12 hours of daylength) brought significant
increases in the number of leaves, plant height, internode length, fresh leaf and stem weight, dry
leaf and stem weight as well as percent dry matter. These are the ideal combinations for

64
screening Sunn hemp genotypes for early plant growth. In the environment of the southeastern
United States, plants planted later in May will grow faster than plants sown earlier in the spring.
Introduction
Poor emergence and seedling growth of forage crops has been associated with low seed
germination (Haskins and Gorz, 1975) and reduced seedling elongation (Ries and Everson,
1973), low rate of leaf appearance (Clements and Latter, 1974), or seedling weight. Daylength is
one of the most important factors affecting plant growth and morphogenesis. Pandey and Sinha
(1977) studied the effect of various daylengths on Crotalaria juncea and found a marked
increase in dry matter and leaf area with increasing daylength.
Milford and Lenton (1976) studied the effect of daylength on the sugar beet (Beta
vulgaris) and found that dry weight was 25% greater and leaf area was increased by 18% when
plants were exposed to a 16 h photoperiod compared to a 12 h photoperiod. However,
Ketellapper (1965) reported that at a daylength of 16 h there was a significant decline in dry
matter in C. juncea, suggesting a deleterious effect of a long light-period. This might indicate an
adaptation of that species to optimal growth during the months of June and July in the
southeastern United States, with nearly 14 h of daylight at a latitude of approximately 30º, which
marks the southernmost tip of Alabama.
Other studies have shown that optimum planting dates for Sunn hemp differ across
environments. For example, planting dates that coincide with adequate soil moisture and frost-
free, warm weather conditions provided the most rapid seedling emergence and the highest
yields (Kundu, 1964). White and Haun (1965) conducted a study to determine the influence of
planting date on stalk yield in Kansas, where the growing season is relatively short compared to
the southern states. Their results showed a 40% decrease in stalk yield in 1962 when planting
65
was delayed 2 weeks; however, no yield differences occurred with a 2-week planting delay in
1963. Cook et al (1998) indicated that delays in planting from late March to mid-April could
result in lower stalk yields, especially if planting is delayed by 4 weeks or longer.
Sunn hemp is typically a photoperiodic plant and flowering occurs in response to short
days (White and Haun 1965). The major Sunn hemp growing areas, which are India and Brazil,
are characterized by high humidity, have an average temperature of 23.0°C to 29.4°C, and have a
rainfall of 170-200 mm during the growing season (Dempsey 1975). Because of the lateness in
flowering of tropical plants very little seed production has occurred in the continental United
States, with the exception of most southern parts of Texas. The primary sources of seed for the
Sunn hemp grown in the continental United States have been from Hawaii and South America,
especially Brazil and Colombia, but they recently have been imported from South Africa as well.
The short-day, frost-free environments of these locations allow for reliable and excellent yields
of good quality seed. Small-scale seed production has occurred in South Texas, but the
possibility of early frost always poses a threat of reducing yields of seed crops grown in the
continental United States.
The objective of this experiment was to investigate 1) the effect of temperature on seed
germination and emergence of six C. juncea populations, and 2) to determine the effect of
temperature and daylength regimes representative of conditions in the southeastern U.S. on
seedling emergence and on the early growth of three C. juncea genotypes.
Materials and Methods
Germination Experiment
Five replications (runs) of 50 visually viable seeds of six C. juncea genotypes were
placed in petri dishes that were lined with filter paper on both sides to absorb water. The petri
66
dishes were placed in incubators at six different temperatures (10°C, 15°C, 20°C, 25°C, and
30°C). The genotypes included in this study were some of the populations that were used as
parental material in the selection program, Population 2 (P2), Population 7 (P7), Population 11
(P11) and Population 16 (P16), a later selection from this parental material coded Selection PBU
(SelPBU) and ‘Tropic Sun’ (TS), a cultivar that has not been selected for the conditions of the
continental U.S.
Seeds initiated germination on the second day and a daily count of germinated seeds was
kept. Seeds were considered germinated when the radical started protruding from the seedcoat.
On the fourteenth day, a count was taken of any seeds that had not germinated and of any that
had not swollen at all, an indicator of a hard seed that did not allow any water to imbibe.
ANOVA was performed on the data set using SAS PROC GLM, and the interaction
among genotypes and temperatures was tested.
Environmental Chamber Experiment
The daylength and temperature requirements of three genotypes of C. juncea were tested
using environmental chambers. The genotypes chosen were P2, SelPBU, and TS. All plants were
tested under 4 daylength-temperature combinations, which were 32/17ºC for 14 and 12 hours of
daylength, and 25/10 ºC or 14 and 12 hours of daylength. The temperatures were chosen in order
to represent a typical late spring and early summer in Alabama. Two replications (runs) of 16
pots per genotype were sown in pots 10 cm diameter by 19.4 cm long (total volume = 3.8 L) and
filled with Sunnshine Mix # 8 (Sunn Gro Horticulture Canada Ltd.) for each experiment. After
emergence, each pot was thinned to 1 plant. Photosynthetic flux density during daylength was 394
μmol m-2 s-1 provided by a mixture of fluorescent and incandescent lamps. Water was added only
when the soil surface dried. The 16 pots were divided from the beginning into 4 categories to be
harvested in 2 week intervals after planting for a total of 56 days.

67
Measurements included stem height (cm), number of leaves, fresh and dry stem weight
(g), fresh and dry leaf weight (g), total fresh and dry weight, internode length (cm), ratio of total
dry matter weight to total fresh weight, ratio of dry leaf weight to dry stem weight and percent
dry leaf weight to total dry weight.
Data were analyzed as a factorial design where daylength-temperature combinations
were the main plots and genotypes were the subplots. Data were subjected to ANOVA using
SAS PROC GLM.
Results and Discussion
Germination Experiment
The four highest temperatures tested were not significantly different among them for
percent germination and growth rate index. Only 10ºC was significantly different from the other
temperatures.
Among populations, P11 was significantly different from the other populations and had
the highest percent germination (96.88%) and rate index (3.46) (Table 14). Two populations, P16
and SelPBU, were not significantly different from each other in percent germination, 91.44% and
89.6% respectively, and GRI, 3.27 and 3.20 respectively. Moreover, SelPBU was not
significantly different from TS in percent germination and GRI. Finally, TS, P7 and P2 were not
significantly different from each other in percent germination, 86.32%, 84% and 83.2%
respectively, and GRI, 3.08, 3.00 and 2.97 respectively.
For all populations, temperature had a significant quadratic effect on percent germination
(Figure 1). The exception was P16 because the percentage of germinated seeds did not increase
with every temperature increase. A fourth degree polynomial equation was more suitable for
describing its relationship with temperature (Table 15).
68
Percentage of hard seeds was small for all populations. P16 and SelPBU had the highest
percentage of hard seeds, 3.92% and 2.96% respectively, and were not significantly different
from each other. SelPBU was not significantly different from P7 (2.32%) and P2 (2.16%). P11
and TS had the fewest hard seeds with 0.8% and 0.32% respectively.
P2 had the highest percentage of non-viable seeds and was significantly different from
the other populations. The populations P7 (4.56%) and P16 (4.16%) were not significantly
different from each other, and P16 was not significantly different from SelPBU (2.64%). Also
SelPBU was not significantly different from TS (1.52%) and P11 (1.2%).
Environmental Chamber Experiment
Temperature and daylength had a significant effect on all traits except percent dry matter.
On the other hand, the population-temperature interaction was not significant on any trait; i.e. the
populations responded similarly to changes in temperature or daylength (Table 16).
Number of Leaves
Main effects of temperature, daylength, and population were significant. Daylength
accounted for most of the variability. Daylength-temperature interactions were significant. At
daylength of 14 h more leaves were produced than at 12 h. Specifically, the higher temperature at
the longest daylength (32/17ºC at 14 hr) produced the most leaves (49.75). The lowest
temperature for the same daylength (25/10ºC at 14 hr) produced the second largest number of
leaves (35 leaves). Daylength of 12 hr produced fewer leaves with the 32/17ºC combination
producing 29 leaves and the 25/10ºC combination producing 21 leaves. SelPBU (36 leaves) was
significantly different than the other two populations (Table 17). TS (34 leaves) and P2 (32
leaves) did not significantly differ.

69
Plant Height
Main effects of temperature and daylength were significant with temperature accounting
for most of the variability. The highest temperature combination 32/17ºC produced the tallest
plants with stem height topping of at an average of 107.92 cm for 14 hr of daylength At the
same temperature but for 12 hr of daylength the stem height was reduced significantly (83.67
cm). The lowest temperature combination (25/10ºC) resulted in plants with significantly
decreased height. At 14 hr of daylength the average height was 65.86 cm, and at 12 hr the plants
were significantly shorter (34.55 cm).
Internode Length
This is the ratio of height divided by number of leaves. The main effect of population was
significant. The population P2 (2.36 cm) was significantly different than the other two
populations, which at 2.03 cm and 2.02 cm for TS and SelPBU respectively, were not
significantly different between them. Temperature-daylength interactions were significant. The
temperature combination 32/17ºC resulted in significantly longer internodes at 14 hr (2.86 cm)
than at 12 hr (2.19 cm). The temperature combination 25/10ºC produced significantly shorter
internodes but different daylengths did not significantly differ from each other.
Fresh Leaf Weight
Main effect of temperature was significant and accounted for most of the variability. The
combination 32/17ºC at 14 hr (12.39 g) was significantly different than 25/10ºC at 14 hr (6.79 g).
The remaining two combinations were not significantly different from each other. Main effect of
daylength and temperature-daylength interaction was also significant.

70
Fresh Stem Weight
Main effects of daylength and temperature were significant, as was temperature-
daylength interactions. The combination 32/17ºC at 14 hr (13.80 g) produced the heaviest stems
and was significantly different than the other combinations. The temperature-daylength
combination 32/17ºC at 12 hr (6.02 g) was not significantly different from the combination
25/10ºC at 14 hr (5.55 g), but it was significantly different from the other two combinations.
Finally, 25/10ºC at 12 hr (1.95 g) brought a significantly large decrease to stem weight.
Total Fresh Weight
The fresh weight of stems and leaves together followed the pattern of fresh stem weight.
Main effects of daylength and temperature were significant. Also significant was temperature-
daylength interactions. The highest temperature at the longest daylength 32/17ºC at 14 hr (26.19
g) brought about significantly large increase in total fresh weight. Decreases in temperature and
daylength brought a decrease in weight. More specific, 32/17ºC at 12 hr produced 12.33 g and
25/10ºC at 14 hr produced 10.16 g. These two combinations were not significantly different
between them. At the bottom, significantly different from the other combinations, was 25/10ºC at
12 hr (5.10 g).
Dry Leaf Weight
Daylength had the largest effect on this trait. All daylength-temperature combinations
were significantly different among them. The combinations 32/17ºC at 14 hr (2.15 g) and
25/10ºC at 14 hr (1.58 g) were the top-ranking and the combinations 32/17ºC at 12 hr (1.02 g)
and 25/10ºC at 12 hr (0.41 g) were the bottom two.
Dry Stem Weight

71
Temperature had the largest effect on this trait. Again, all daylength-temperature
combinations were significantly different among them. However, this time the combinations
32/17ºC at 14 hr (2.92 g) and 32/17ºC at 12 hr (1.53 g) were at the top and the combinations
25/10ºC at 14 hr (0.98 g) and 25/10ºC at 12 hr (0.26 g) were at the bottom.
Total Dry Weight
The combination 32/17ºC at 14 hr (5.06 g) was significantly different from the other
combinations. The combination 32/17ºC at 12 hr (2.56 g) was not significantly different from
25/10ºC at 14 hr (2.55 g) but it was significantly different from the rest of the treatments. Last,
the combination 25/10ºC at 12 hr (0.67 g) was significantly different from the other
combinations.
Percent Dry Matter
This was the ratio of the total dry matter weight to total fresh weight. The combination
25/10ºC at 14 hr (0.30%) was significantly different from 25/10ºC at 12 hr (0.13%) but not
significantly different from the other two combinations. The combinations 32/17ºC at 14 hr
(0.25%) and 32/17ºC at 12 hr (0.19%) were also significantly different from 25/10ºC at 12 hr but
not significantly different from each other.
Dry Leaf Weight to Dry Stem Weight
Temperature was the defining factor for this trait. The combinations 25/10ºC at 14 hr
(1.67) and 25/10ºC at 12 hr (1.60) were at the top and not significantly different from each other,
although they were significantly different from the remaining two. The higher temperature
combinations 32/17ºC at 14 hr (0.75) and 32/17ºC at 12 hr (0.75) were at the bottom and not
significantly different from each other.
Percent Dry Leaf Weight to Total Dry Weight
72
Again, temperature was the defining factor. As with the previous trait the combinations
25/10ºC at 14 hr (61.28%) and 25/10ºC at 12 hr (60.91%) were at the top and not significantly
different from each other. Finally, the higher temperature combinations 32/17ºC at 14 hr
(42.66%) and 32/17ºC at 12 hr (41.67%) were at the bottom and not significantly different from
each other.
In summary, germination seems largely unaffected by lower temperatures and only
decreases significantly when it reaches 10ºC. All the genotypes had more than an 80%
emergence rate with SelPBU being somewhere in the middle of the pack.
On the other hand, growth of Sunn hemp is significantly affected by both temperature
and daylength. In general, all genotypes tested produce larger plants when grown at higher
temperatures. Daylength also plays a role since plants grown during lengthier days outperformed
plants grown during shorter days. From this we can draw the conclusion that planting early in the
spring in Alabama is not appropriate as daylength and temperature requirements for seedling
development are not met. The earliest time that Sunn hemp may be planted is late April to early
May when the average temperature begins to exceed 20 ºC. The growth rate will be slow but
once average temperature and daylength increase development will improve. Screening
genotypes

73
References
Clements, R.J., and B.D.H. Latter. 1974. Responses to selection for seed weight and seedling
vigour in Phalaris. Aust. J. Agric. Res. 25:33-44
Cook, C.G., A.W. Scott Jr., and P. Chow. 1998. Planting date and cultivar effects on growth and
stalk yield of Sunn hemp. Ind. Crops Prod. 8:89–95
Dempsey, J.M. 1975. Fiber Crops. In: University Presses of Florida, Gainesville, Fla. p. 457
Haskins, F.A., and H.J. Gorz. 1975. Influence of seed size, planting depth and companion crop
on emergence and vigor of seedlings in sweetclover. Agron. J. 67:652-654
Ketellapper, H.J. 1965. Interaction of photoperiod and cycle length in plant growth. Physiologia
Plantarum 18:337-345
Kundu, B.C. 1964. Sunn-hemp in India. Proc. Soil Crop Soc. Florida 24:396–404
Milford, G.F.J., and J.R. Lenton. 1976. Effect of photoperiod on growth of sugarbeet. Annals of
Botany 40:1309-1315
Pandey, B.N., and R.P. Sinha. 1977. Light as a factor of growth and morphogenesis. I. Effect of
artificial shading on Crotalaria juncea L. and C. sericea Retz. New Phytol 79:431-439
Ries, S.K. and E.H. Everson. 1973. Protein content and seed size relationships with seedling
vigor of wheat cultivars. Agron. J. 64:772-774.
White, G.A., and J.R. Haun. 1965. Growing Crotalaria juncea, a multi-purpose fiber legume, for
paper pulp. Econ. Bot 19:175–183.

74
Table.14. Average percentage of seedling emergence of six genotypes of Sunn hemp grown at
five day/night temperatures.
Genotypes Emergence(%)† GRI*
P11 96.88a 3.46
P16 91.44b 3.27
SelPBU 89.6b,c 3.2
TS 86.32c,d 3.08
P7 84d 3
P2 83.2d 2.97
† Treatment means followed by the same letter are not significantly different at a probability level of 0.05 according to the Least
Significant Difference (LSD) t test.
GRI = growth rate index
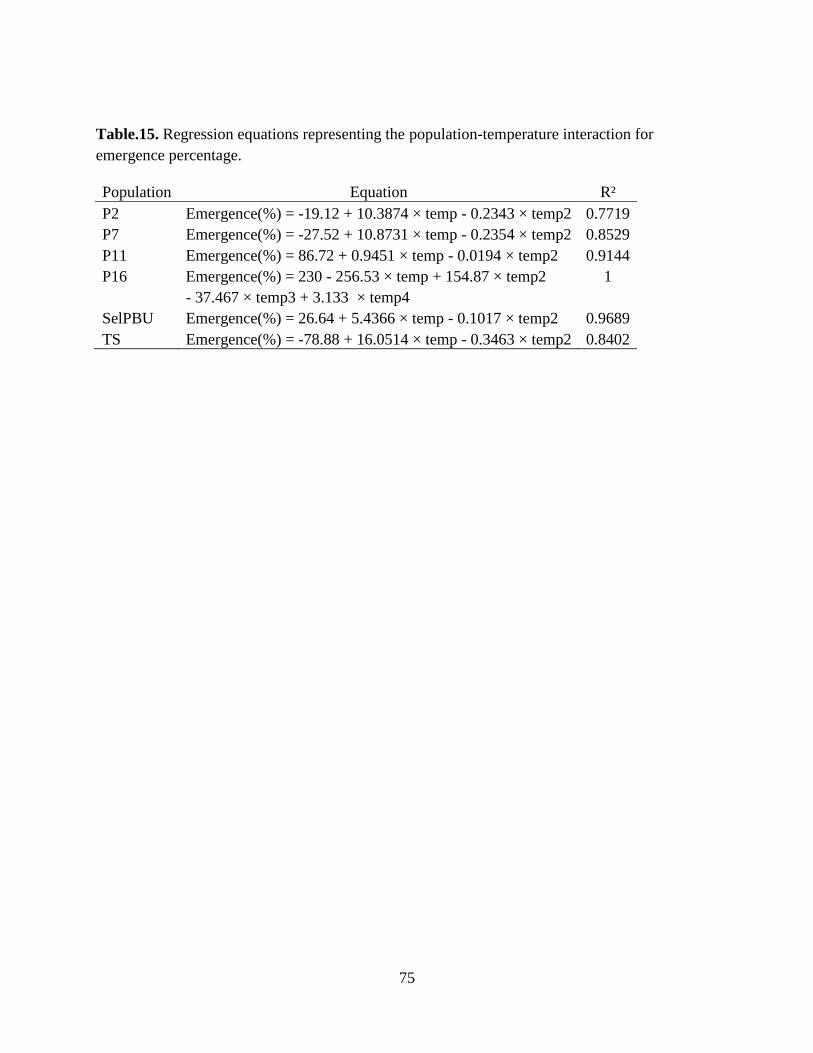
75
Table.15. Regression equations representing the population-temperature interaction for
emergence percentage.
Population Equation R²
P2 Emergence(%) = -19.12 + 10.3874 × temp - 0.2343 × temp2 0.7719
P7 Emergence(%) = -27.52 + 10.8731 × temp - 0.2354 × temp2 0.8529
P11 Emergence(%) = 86.72 + 0.9451 × temp - 0.0194 × temp2 0.9144
P16 Emergence(%) = 230 - 256.53 × temp + 154.87 × temp2 1
- 37.467 × temp3 + 3.133 × temp4
SelPBU Emergence(%) = 26.64 + 5.4366 × temp - 0.1017 × temp2 0.9689
TS Emergence(%) = -78.88 + 16.0514 × temp - 0.3463 × temp2 0.8402

76
Temperature (ºC)
10 15 20 25 30
Perc
ent
Germ
ination
30
40
50
60
70
80
90
100
110
Pop2
Pop7
Pop11
Pop16
SelPBU
TS
Figure.1. Effect of temperature on the germination percentage for six populations of Sunn hemp.

77
Table.16. Mean values and analyses of variance of 12 traits of three genotypes of Sunn hemp under four different day/night length
temperature combinations.
Means for traits measured per plant
Temperature day/night Daylength DryLfWt DryStemWt PcDryMatt LftoStWt PcLfTDryWt TlDryWt
ºC
25/10 12 21.33 34.55 1.69 3.15 1.95 5.1
14 35.33 62.86 1.8 6.79 5.55 12.33
Temperature
mean
32/17 12 29.42 83.67 2.86 4.13 6.02 10.16
14 49.75 107.92 2.19 12.39 13.8 26.19
Source Mean square of
Pop 83.521* 268.291 0.602** 2.628 0.237 4.4
Days 3536.333*** 8287.135*** 0.95** 424.29*** 388.286*** 1624.362***
Temp 1518.75*** 26606.792*** 7.332*** 130.251*** 455.840*** 1073.426***
Pop*Temp 24.938 94.502 0.582* 2.136 0.655 4.848
Pop*Days 45.646 381.801* 0.167 2.28 10.853 19.08
Days*Temp 120.333* 49.41 1.841*** 64.103*** 52.375** 232.364***
Pop*Days*Temp 7.146 65.845 0.053 1.838 3.248 5.091
*Significant at the 0.05 probability level. **Significant at the 0.01 probability level. ***Significant at the 0.0001 probability level.
†NumLeaves = number of leaves, PlantHt = plant height (cm), HtDivNumL = stem height divided by number of leaves (internode length – cm), FreshLfWt = fresh leaf weight (g),
FreshStemWt = fresh stem weight (g), TlFreshWt = total fresh weight (g)

78
Table.16. (ctd.) Mean values and analyses of variance of 13 traits of three genotypes of Sunn hemp under four different day/night
length temperature combinations.
Means for traits measured per plant
Temperature day/night Daylength DryLfWt DryStemWt PcDryMatt LftoStWt PcLfTDryWt TlDryWt
ºC
25/10 12 0.41 0.26 0.13 1.6 60.91 0.67
14 1.58 0.98 0.3 1.67 61.28 2.55
Temperature
mean
32/17 12 1.02 1.53 0.25 0.75 41.67 2.56
14 2.15 2.92 0.19 0.75 42.66 5.06
Source Mean square of
Pop 0.051 0.01 0.009 0.206 39.936 0.077
Days 15.778*** 13.209*** 0.037 0.014 5.495 57.794***
Temp 4.201*** 31.009*** 0 9.452*** 4298.625*** 58.014***
Pop*Temp 0.076 0.059 0.016 0.338 78.968 0.147
Pop*Days 0.105 0.838* 0.029 0.138 79.448 1.533
Days*Temp 0.006 1.347* 0.143* 0.015 1.135 1.175
Pop*Days*Temp 0.088 0.389 0.018 0.009 24.459 0.612
*Significant at the 0.05 probability level. **Significant at the 0.01 probability level. ***Significant at the 0.0001 probability level.
† DryLfWt = dry leaf weight (g), DryStemWt = dry stem weight (g), PcDryMatt = percent dry matter, LftoStWt = leaf to stem weight ratio, PcLfTDryWt = percent leaf weight to
total dry weight, TlDryWt = total dry weight (g)

79
Table.17. Mean values of two plant growth traits of three populations of Sunn hemp. Averages
represent the means of four plants per population.
Population Numlvs† HtDivNumL
SelPBU 36.44 2.015
TS 33.50 2.0288
P2 31.94 2.3575
LSD 2.905 0.2498
†NumLvs = number of leaves, HtDivNuL = stem height divided by number of leaves (internode
length – cm)