characterization of the effect of the scrubber system ... of the... · nakim project report...
TRANSCRIPT
Nakim Ficaria Seaways Oct. 2012 Page 1
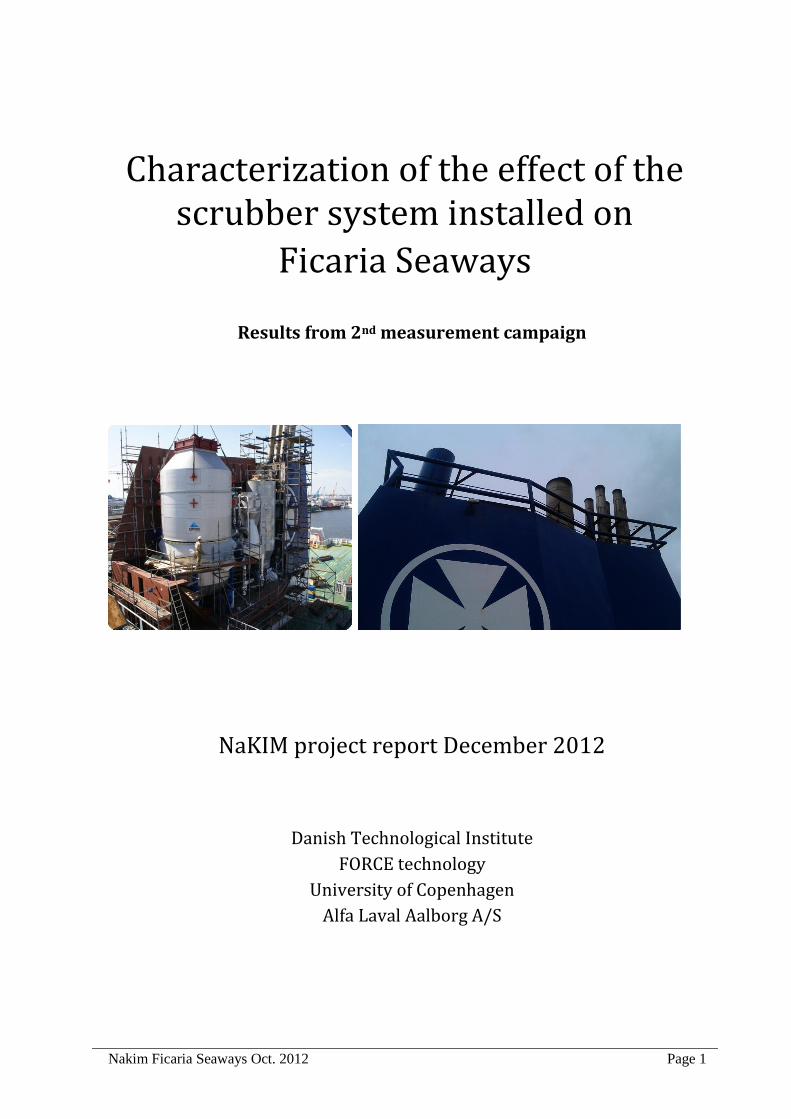
Characterization of the effect of the scrubber system installed on
Ficaria Seaways
Results from 2nd measurement campaign
NaKIM project report December 2012
Danish Technological Institute
FORCE technology
University of Copenhagen
Alfa Laval Aalborg A/S
Nakim Ficaria Seaways Oct. 2012 Page 2
Characterization of the effect of the scrubber system installed on Ficaria
Seaways
1 Introduction ...................................................................................................................................... 3
2 Measurement specifications ............................................................................................................. 3
2.1 Vessel ....................................................................................................................................... 3
2.2 Engines ..................................................................................................................................... 4
2.3 Fuel ........................................................................................................................................... 4
2.4 Modified scrubber system ........................................................................................................ 4
2.5 Meteorological conditions ........................................................................................................ 5
3 Measurement setup on Ficaria Seaways ........................................................................................... 5
3.1 Sampling location ..................................................................................................................... 5
3.2 Instrumentation for particle measurements .............................................................................. 6
3.2.1 DustTrak DRX ...................................................................................................................... 6
3.2.2 FID ........................................................................................................................................ 6
4 Measurement focus periods .............................................................................................................. 6
5 Results .............................................................................................................................................. 7
5.1 Particle number and size distributions ...................................................................................... 7
5.1.1 SMPS results ........................................................................................................................ 7
5.1.2 ELPI results ........................................................................................................................ 11
5.2 Particle mass conversions ....................................................................................................... 14
5.2.1 SMPS and ELPI results ...................................................................................................... 14
5.2.2 DustTrak results .................................................................................................................. 14
5.3 Effect of operating the jet-sprayers and venturies .................................................................. 17
5.4 FID measurements .................................................................................................................. 18
5.5 Elemental analysis of particulate matter ................................................................................. 18
5.6 Raman analysis of chemical composition .............................................................................. 19
6 Discussion....................................................................................................................................... 19
6.1 Effect of the scrubber on the particle number concentration .................................................. 19
6.2 Effect of the scrubber on the particle mass concentration ...................................................... 20
6.3 Comparison with results from the first campaign ................................................................... 21
7 Conclusion ...................................................................................................................................... 22

Nakim Ficaria Seaways Oct. 2012 Page 3
1 Introduction The results and conclusions presented in this report are part of the work undertaken by the innovation
consortium NaKIM. Under NaKIM project activity no. 2 (Airborne particles), a group with members
from FORCE Technology, Danish Technological Institute, and University of Copenhagen has performed
exhaust gas measurements onboard the ship Ficaria Seaways which has had an exhaust gas cleaning
system (scrubber) retrofitted after their main engine in 2009. The objective of the work performed within
the NaKIM framework in this context, is to develop and evaluate methods for characterization of the
particle emissions before and after the scrubber.
The results presented here are from a second measurement campaign onboard Ficaria Seaways, carried
out in October 2012. The ship operates between Göteborg, Sweden, and Gent, Belgium.1 The results from
the first campaign, carried out in February 2011, are described in detail in the report “Characterization of
the effect of the scrubber system installed on Ficaria Seaways” dated September 2012. The results
presented in the present report are closely related to the results from the first campaign and as such
detailed engine and scrubber description, measurements techniques, locations etc. are only described in
this report when differing from the first campaign. The reader is as such referred to the old report for
details and further information.
In short the scrubber system has been developed by Alfa Laval Aalborg and is optimized for removal
of sulfur compounds in the exhaust gas. The scrubber can operate in two modes using either seawater or
freshwater with added sodium hydroxide (NaOH).
The measurements presented in this report were performed on the 16th-18
th of October 2012. During
this time period, the scrubber was mainly operated in seawater (SW) mode. For a short period on Oct. 17th
the scrubber was also operated in freshwater (FW) mode however with no functioning water cleaning
unit.
The effect of the scrubber system on the emission of particles was tested on exhaust from fuel
containing 2.3 % (w/w) sulfur. An important part of the reason for carrying out a second campaign was to
achieve data from longer measurement periods and for studying the reproducibility between
measurements carried out during different meteorological conditions and scrubber conditions. The main
focus of the tests was on particle number concentration and size distribution.
2 Measurement specifications
2.1 Vessel Ficaria Seaways is the last in a series of six Ro-Ro (roll on - roll off) vessels built by Flensburger
Schiffbau Geselschaft in Germany in 2006. She was commissioned by DFDS Seaways who also currently
owns and operates the vessel. She was rebuilt to increase the cargo capacity at MWB Motorenwerke in
Bremerhaven in 2009 and had at the same time the main parts of the scrubber system installed. The
scrubber system installation was finalized and operational in February 2010. Table 1 summarizes the
Technical data for the vessel Ficaria Seaways.
Table 1: Technical data for the vessel Ficaria Seaways
Year built 2006 (rebuilt 2009) Length 230.43 m (199.8 before rebuilt)
Width 26.5 m
Gross tonnage 37 939 (32 389 before rebuilt)
Speed 22.5 knots
Cargo capacity 4 650 lane meters (3 831 before rebuilt)
Accommodation 12 drivers
Main engine MAN B&W type 9L60 MC-C
1 Previously operating between Göteborg, Sweden, and Immingham, England, as described in the first report.

Nakim Ficaria Seaways Oct. 2012 Page 4
2.2 Engines The main engine on Ficaria Seaways is a MAN B&W 9L60 MC-C 2 stroke Diesel engine. It is a
compact 9 cylinder, long stroke, camshaft controlled, turbocharged engine with a piston diameter of 60
cm. It has a dry mass of 510 tons and a stroke length of 2.022 meters. The engine is capable of providing
a maximum of 21 070 kW of energy for propulsion.
Apart from the main engine the vessel is equipped with 4 auxiliary MAN 4-stroke engines (1 720 kW
each), and 1 diesel emergency generator (500 kW). It is also equipped with two Rolls Royce bow
thrusters (1 100 kW each) and two Rolls Royce stern thrusters (880 kW each).
All measurements presented in this report were made on emissions from the main engine.
2.3 Fuel High sulfur content fuel containing 2.3 % (w/w) sulfur was used. To enable direct comparison of the
concentrations and size distributions of emitted particles the goal was to take and compare measurements
during operating conditions where the fuel consumption by the main engine was constant before and after
the scrubber.
On October 16th on the way towards Gent the main engine load and hence fuel consumption was almost
constant all day at ~82 % which corresponds to ~3700 L/hr. On the following two days the fuel
consumption by the main engine was in general lower and somewhat more variable as seen in Figure 1.
This made it more challenging to compare measurements before/after scrubber.
Figure 1: Main engine load during the three days of measuring
2.4 Modified scrubber system As compared to the first campaign the scrubber has been slightly modified. Metal based filling
elements have replaced old polymer elements and more elements are in addition filled into the scrubber.
The original idea behind performing the second measurement campaign on a vessel with a hybrid
scrubber was to get more experience with both SW and FW scrubbers and to facilitate a direct
comparison between the two modes of scrubber operation. The campaign was planned in a way that
would allow for tests of both scrubber operation modes, but due to a non-operational sludge centrifuge in
FW mode, tests were mainly performed for the SW mode of the scrubber. Very limited tests were carried
out in FW mode but with contaminated water recirculated in the loop.
The flow rate of SW through the scrubber system during the campaign is shown in Figure 2.
0
10
20
30
40
50
60
70
80
90
100
16-10-12 00:00 17-10-12 00:00 18-10-12 00:00 19-10-12 00:00
Engi
ne
load
%
Time

Nakim Ficaria Seaways Oct. 2012 Page 5
Figure 2: Sea water use for scrubber operation on the three measurement days.
2.5 Meteorological conditions The measurements were performed on October 16
th, 17
th and 18
th, 2012. On October 16
th there was a
strong head wind of about 15 m/s, but it declined to about 5 m/s the following two days. The weather was
partly cloudy and rainy and with day temperatures of 10-15 °C, slightly cooler on day 1. Night
temperatures were around 5-10 °C.
3 Measurement setup on Ficaria Seaways
3.1 Sampling location Two 4” and one 1” socket connectors for measuring particles are previously welded on the exhaust
pipe before the scrubber, as shown in Figure 3. After the scrubber four 4” and one 1” socket connectors
were welded for this present campaign.
Figure 3: Probe socket connectors. The pictures show the sample outlets before (left) and after (right) the scrubber.
It was essential that the ELPI and SMPS instruments should not be moved between particle
measurements. Hence the SMPS and ELPI instruments were positioned between the two outlets before
500
600
700
800
900
1000
1100
1200
16-10-12 00:00 17-10-12 00:00 18-10-12 00:00 19-10-12 00:00
Wat
er
con
sum
pti
on
[m
3 /h
]
Time

Nakim Ficaria Seaways Oct. 2012 Page 6
and after the scrubber, and sequential measurements were performed by switching the heated sample hose
between the two outlets welded in the chimney, one before and one after the scrubber, see Figure 3. This
setup was necessary to obtain data during the relatively short measurement period and due to the very
limited space available in the chimney.
3.2 Instrumentation for particle measurements The instruments for particle measurements were located between the samplings outlets before and after
the scrubber. The measurement setup consisted of two 5 m long heated sampling hoses which connected
the sampling outlets with an exhaust dilution system. The dilution system consisted of two ejector diluters
(Dekati model DI-1000). Gas was drawn from either before or after the scrubber, through the dilution
system, and analyzed using a scanning mobility particles sizer (SMPS) and an Electrical Low pressure
Impactor (ELPI). These systems as well as dilution systems are described in detail in the previous report.
In addition to ELPI and SMPS measurements, a small handheld device (DustTrak DRX from TSI, Inc.)
was connected to the manifold of the ejection diluter. The aim of using this instrument was to test whether
such a simple handheld instrument could give some valid information when compared to state-of-the-art
ELPI and SMPS particle measurements. Exhaust gas is not the typical environment for a DustTrak.
Also two flame ionization detectors (FID) were connected directly to the chimney for measuring total
organic carbon (TOC).
3.2.1 DustTrak DRX
DustTrak DRX from TSI Inc., provides an online PM measurement and the instrument displays
particles in 5 size fractions (PM1, PM2.5, PM4, PM10 and total PM). The instrument covers a
concentrations area of 0.002–150 mg/m3 and can log data each second. In the specific application data
were logged each 10 seconds.
The detection is done optically. In short, scattered light from the particles is focused into a
photodetector where it is linearly converted to a voltage. The average voltage signal can for PM2.5 be
converted to mass by calibrating against a known aerosol. The signal voltage for individual particles is
measured as individual voltage pulses. These pulses are through modeling translated into a size fraction
with the five intervals (PM1, PM2.5, PM4, PM10 and total PM).
3.2.2 FID
Total organic carbon (TOC) concentration is measured in a heated (120°C) partial flow of flue gas free
of particles. The TOC-concentration is determined using a Flame Ionization Detector (FID) calibrated
with propane.
4 Measurement focus periods During the three days of measuring the instruments in general performed well with no major
breakdowns.
Table 2 summarizes stable measuring periods that are picked for further analysis. The criteria being
relatively stable engine conditions and water consumption in the scrubber. The results presented in this
report are mainly based on those focus periods.

Nakim Ficaria Seaways Oct. 2012 Page 7
Focus
period
Scrubber
mode
Position
BS/AS
Day Time MCR
(average)
[%]
Water
flow (avg)
[m3/h]
1 SW BS 16. Oct. 12:03 - 12:41 81.8±1.1 1008±4
AS 16. Oct. 12:58 - 13:32 81.9±1.2 999±5
2 SW AS 16. Oct. 15:42 - 16:16 82.2±1.0 1078±5
3 SW AS 16. Oct. 20:45 - 21:19 81.7±1.4 1056±6
4 SW BS 17. Oct. 22:20 - 22:54 73.1±2.5 1091±4
AS 17. Oct. 21:14 - 21:59 65.8±3.6 1088±4
5 SW BS 18. Oct 04:41 - 05:15 69.1±1.0 1077±3
AS 18. Oct 07:59 - 8:33 68.5±1.0 1074±4
Table 2: Summary of the focus periods during the campaign where stable data was obtained for both SMPS and ELPI
equipment. SW: Seawater, BS: Before scrubber, AS: After scrubber, MCR: Maximum continuous revolution (engine).
In addition to the periods described in Table 2 the effect of operating the scrubber jet-sprayers and
venturis were also shortly investigated on Oct. 18th and will also be discussed to some extent in the
following.
5 Results
5.1 Particle number and size distributions Two instruments were applied to measure size distributions and number concentrations, namely a
scanning mobility particle sizer (SMPS) and an electrical low pressure impactor ELPI, described in detail
in the previous report. The main advantage of SMPS is the detailed particle size information whereas the
ELPIs main advantage is the temporal resolution as well as the option for collecting material on filters.
The ELPI and SMPS instruments measure the particle number using different physical principles which
results in different equivalence diameters. The ELPI is based on the cascade impactor principle and
measures the particle’s aerodynamic diameter. The SMPS is based on the particle movement in an
airstream under the influence of an electric field, which provides the electrical mobility diameter of the
particles. This must be taken into account when comparing the results obtained with the instruments. The
diameters have not been placed on the same scale and in the figures in this report the diameter from
SMPS measurements is the mobility diameter and the diameters from ELPI is aerodynamic diameter.
All results given in the following are adjusted to dry air conditions and 273 K. Water content of 2.9 %
before scrubber and 1.0 % after scrubber are used as well as measurement conditions of assumed 35 °C in
the chimney.
5.1.1 SMPS results
Time series plots of the SMPS data are shown in Figure 4 for the 3 days of measuring together with
MCR and focus periods are marked. In Figure 5 is in addition to number concentration shown the average
particle diameter for the 3 days together with total number concentration as measured with SMPS.
It should be noted that on Oct. 18th at 0:15 a sudden increase in particle number concentration is
observed (with both ELPI and SMPS) despite appearing constant engine and scrubber conditions. The
pressure was not changed on the diluter at that time so this sudden increase is still somehow a mystery.

Nakim Ficaria Seaways Oct. 2012 Page 8
Figure 4: Particle number concentration as a function of time together with engine load and sample point (before/after scrubber). Focus periods are also marked on top.
Figure 5: Particle number concentration as a function of time together with average particle diameter measured with SMPS and sample point.
0
10
20
30
40
50
60
70
80
90
100
0.0E+00
5.0E+08
1.0E+09
1.5E+09
2.0E+09
2.5E+09
10/16/2012 0:00 10/16/2012 12:00 10/17/2012 0:00 10/17/2012 12:00 10/18/2012 0:00 10/18/2012 12:00
Engi
ne
load
[%
MC
R]
Tota
l co
nc.
[#/
cm3
] Sample Point (1E+9 = BS; 2E+9 = AS) SMPS Total PN (4.3-165 nm) MCR
1 2 3 4 5 5
-10
0
10
20
30
40
50
60
0.0E+00
5.0E+08
1.0E+09
1.5E+09
2.0E+09
2.5E+09
10/16/2012 0:00 10/16/2012 12:00 10/17/2012 0:00 10/17/2012 12:00 10/18/2012 0:00 10/18/2012 12:00
Par
ticl
e d
iam
ete
r [n
m]
Tota
l co
nc.
[#/
cm3
]
Sample Point (1E+9 = BS; 2E+9 = AS) SMPS Total PN (4.3-165 nm) SMPS mean diameter

Nakim Ficaria Seaways Oct. 2012 Page 9
In Figure 6 is shown average size distributions before/after scrubber for the selected focus periods (1, 4
and 5) as defined in Table 2.
Figure 6: Average particle size distributions measured by SMPS before and after the scrubber for selected periods
with relative constant engine and scrubber conditions.
0.0E+00
1.0E+09
2.0E+09
3.0E+09
4.0E+09
5.0E+09
1 10 100
dN
/dlo
gDp
[#/
cm3
]
Particle size (nm)
1 - 82 % MCR BS-number AS-number
0.0E+00
5.0E+08
1.0E+09
1.5E+09
2.0E+09
2.5E+09
1 10 100
dN
/dlo
gDp
[#/
cm3
]
Particle size (nm)
4 - ca. 70 % MCR BS-number AS-number
0.0E+00
5.0E+08
1.0E+09
1.5E+09
2.0E+09
2.5E+09
1 10 100
dN
/dlo
gDp
[#/
cm3
]
Particle size (nm)
5 - 69 % MCR BS-number AS-number

Nakim Ficaria Seaways Oct. 2012 Page 10
Additional 2 periods were chosen (focus period 2 and 3) on the 16th with relative constant engine
conditions for evaluating the reproducibility after scrubber. Average SMPS size distributions are shown
in Figure 7.
Figure 7: Average particle size distributions measured by SMPS after the scrubber for selected periods on the 16th with
constant engine and scrubber conditions.
Mean particle number, mean particle diameter and peak diameter (mode), for the selected periods given
in Table 2, and visualized above, are summarized in Table 3. Particle number reduction is also shown for
the periods of interest.
Focus
period
Position
BS/AS
MCR
(average)
[%]
Mean number
conc. SMPS
[x108 #/cm3]
PN
reduction
[%]
Mean
diameter
[nm]
Peak diame-
ter (mode1)
[nm]
1 BS 81.8±1.1 16.9 ± 1.8
46 24.4 ± 0.7 22.8 ± 1.7
AS 81.9±1.2 9.2 ± 0.4 21.5 ± 0.1 16.4 ± 0.5
2 AS 82.2±1.0 9.3 ± 0.2 N.A. 21.2 ± 0.1 16.9 ± 0.4
3 AS 81.7±1.4 9.2 ± 0.2 N.A. 20.0 ± 0.1 16.0 ± 0.6
4 BS 73.1±2.5 7.7 ± 0.1
41 14.1 ± 0.1 12.2 ± 0.4
AS 65.8±3.6 4.5 ± 0.2 15.5 ± 0.6 10.6 ± 0.4
5 BS 69.1±1.0 7.8 ± 0.1
58 13.9 ± 0.1 11.6 ± 0.4
AS 68.5±1.0 3.2 ± 0.1 14.7 ± 0.2 9.7 ± 0.3
Table 3: Mean particle number concentration and diameters measured with SMPS.
0.0E+00
5.0E+08
1.0E+09
1.5E+09
2.0E+09
2.5E+09
3.0E+09
1 10 100
dN
/dlo
gDp
[#/
cm3]
Particle size (nm)
82% MCR Oct. 16th after scrubber
Test 1: 12:58-13:32 Test2: 15:42-16:16 Test3: 20:45-21:19

Nakim Ficaria Seaways Oct. 2012 Page 11
The size distributions for different engine loads (69-82 %) before the scrubber show a primary peak
between 10-25 nm and a smaller secondary peak around 50-70 nm. After the scrubber a trimodal size
distribution is observed, with primary peak at 10-20 nm and minor peaks at 30-40 nm and 60-80 nm.
In all cases, the vast majority of the particles emitted are smaller than 30 nm. Both particle number and
peak particle diameter decreases after the scrubber for all focus periods.
The average particle number concentration is found by SMPS to decrease by 40-60 % in the interval
from 4-165 nm, and the reduction is mainly caused by the smallest particles as can be observed in Figure
6.
5.1.2 ELPI results
Below is shown ELPI results for the three focus periods defined in Table 2 with measurements before
and after scrubber.
-0.5
0
0.5
1
1.0E+04
1.0E+06
1.0E+08
1.0E+10
0.02 0.04 0.07 0.12 0.20 0.31 0.48 0.76 1.23 1.95 3.08 6.27R
em
ova
l eff
icie
ncy
Par
ticl
e n
um
be
r co
nce
ntr
atio
n #
/cm
3
Particle size (mm)
1 - 82% MCR Before scrubber After scrubber removal efficiency
-0.5
0
0.5
1
1.0E+04
1.0E+06
1.0E+08
1.0E+10
0.02 0.04 0.07 0.12 0.20 0.31 0.48 0.76 1.23 1.95 3.08 6.27
Re
mo
val e
ffic
ien
cy
Par
ticl
e n
um
be
r co
nce
ntr
atio
n #
/cm
3
Particle size (mm)
4 - ca. 70 % MCR Before scrubber After scrubber removal efficiency

Nakim Ficaria Seaways Oct. 2012 Page 12
Figure 8: ELPI results from the 3 selected focus periods. Note: Double logarithmic scale.
Numbers concentrations measured with ELPI are given in Table 4. They were similar whether using
cut of 10 or 2 µm. Referring to Figure 8 it is also evident that almost all particles are below 100 nm, in
agreement with SMPS measurements.
Focus
period
Position
BS/AS
MCR
(average)
[%]
Mean number conc.
ELPI 7nm-2µm
[x108 #/cm3]
PN
reduction
[%]
1 BS 81.8±1.1 20.5 ± 0.4
48 AS 81.9±1.2 10.6 ± 0.5
2 AS 82.2±1.0 9.2 ± 0.3 N.A.
3 AS 81.7±1.4 7.8 ± 0.3 N.A.
4 BS 73.1±2.5 3.5 ± 0.1
38 AS 65.8±3.6 2.2 ± 0.2
5 BS 69.1±1.0 3.3 ± 0.1
57 AS 68.5±1.0 1.4 ± 0.1
Table 4: Mean particle number concentration measured with ELPI.
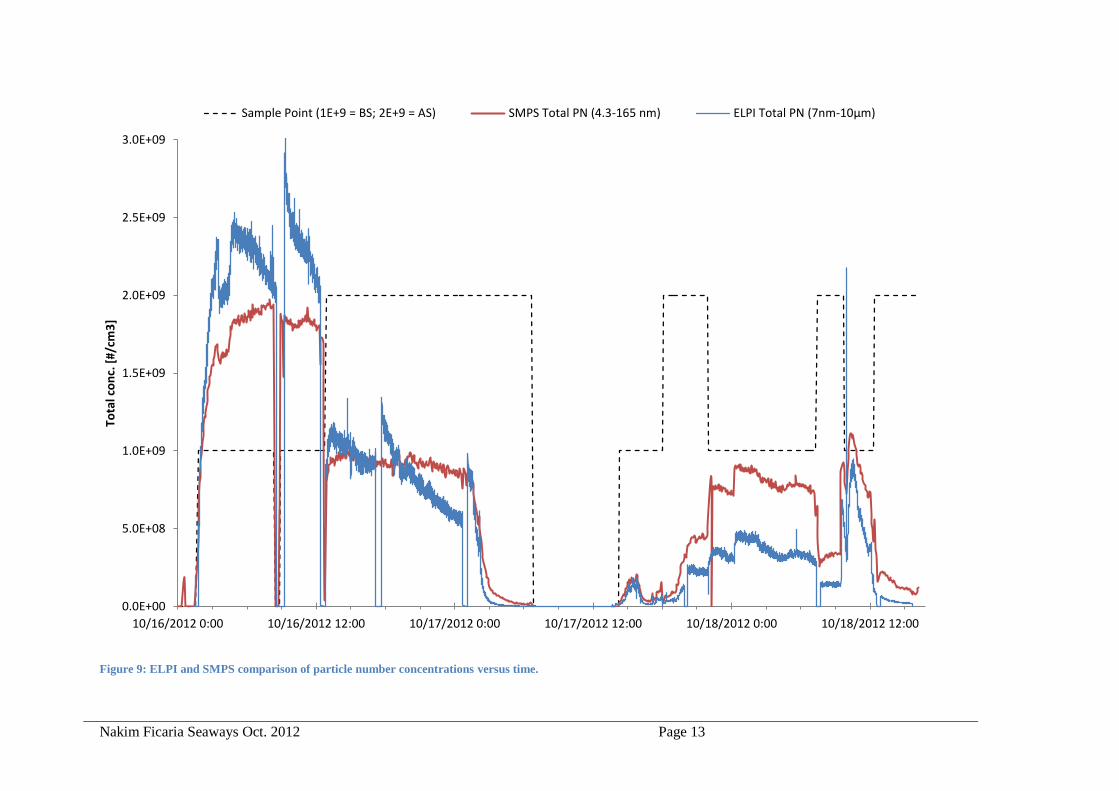
In Figure 9 is shown the overall ELPI and SMPS comparison of particle number concentrations in time.
In general there is a fair agreement for number concentrations measured with the two instruments.
Number concentrations measured on the way towards Gent on the 16th are in very good agreement but
on the way back (17th and 18
th) the SMPS measured about twice the number of particles. Part of this may
be explained by the fact that the peak diameter is smaller at the lower engine loads (about 10 nm) and as
such is very close to the ELPI cut off (7 nm), compare with Figure 6 and Table 3.
-0.5
0
0.5
1
1.0E+04
1.0E+06
1.0E+08
1.0E+10
0.02 0.04 0.07 0.12 0.20 0.31 0.48 0.76 1.23 1.95 3.08 6.27
Re
mo
val e
ffic
ien
cy
Par
ticl
e n
um
be
r co
nce
ntr
atio
n #
/cm
3
Particle size (mm)
5 - 69 % MCR Before scrubber After scrubber removal efficiency
Nakim Ficaria Seaways Oct. 2012 Page 13
Figure 9: ELPI and SMPS comparison of particle number concentrations versus time.
0.0E+00
5.0E+08
1.0E+09
1.5E+09
2.0E+09
2.5E+09
3.0E+09
10/16/2012 0:00 10/16/2012 12:00 10/17/2012 0:00 10/17/2012 12:00 10/18/2012 0:00 10/18/2012 12:00
Tota
l co
nc.
[#/
cm3
] Sample Point (1E+9 = BS; 2E+9 = AS) SMPS Total PN (4.3-165 nm) ELPI Total PN (7nm-10µm)
Nakim Ficaria Seaways Oct. 2012 Page 14
5.2 Particle mass conversions
5.2.1 SMPS and ELPI results
In Figure 10 and in Figure 11 the number concentrations given in section 5.1 for SMPS and ELPI have
been converted to mass concentrations under the assumption of spherical particle and a material density
of 1.0 g/cm3 for all particle sizes.
In Figure 10 is given SMPS total PM (4-165 nm) and ELPI PM 2 (< 2 µm). In Figure 11 is SMPS total
PM shown together with ELPI PM 0.2 (< 0.2 µm), since 0.2 µm is rather close to the SMPS cut off
diameter (165 nm).
Mass concentrations are very dependent upon choice of ELPI cut diameter due to the r3 dependency on
mass, as also visualized in Figure 10 and Figure 11. Note the different scales on the y-axis.
5.2.2 DustTrak results
The DustTrak in general measured more mass after the scrubber than before, see Figure 12. This
tendency is questionable when comparing with ELPI measurements. The mass measured with ELPI in
general is much higher than with DustTrak, compare Figure 10 and Figure 12. One should however keep
in mind that DustTrak uses light scattering and as such the data should be used with some caution since
the method in practice does not measure particles below 100 nm in diameter. Yet those particles do not
contribute significantly to the total mass.
On average more than 98 % of the total mass was measured as PM1 with DustTrak; however one
should also keep in mind that no isokinetic sampling was done.
During navigation in the Gent harbor area on the 17th in the afternoon it is evident from Figure 12 that
more mass is emitted per m3 which makes sense since larger particles are also observed with SMPS,
adding significantly to the total mass. A comparison between DustTrak PM1 and SMPS total mass is
given in Figure 13.

Nakim Ficaria Seaways Oct. 2012 Page 15
Figure 10: Particle mass as a function of time for ELPI (PM 2) and SMPS. A density of 1.0 g/cm3 and the assumption of spherical particles was used for converting from
number concentration to mass.
Figure 11: Particle mass as a function of time for ELPI (PM 0.2) and SMPS. A density of 1.0 g/cm3 and the assumption of spherical particles was used for converting from
number concentration to mass.
0
1
2
0
200
400
600
800
1,000
1,200
10/16/12 0:00 10/16/12 12:00 10/17/12 0:00 10/17/12 12:00 10/18/12 0:00 10/18/12 12:00
Mas
s [m
g/m
3]
ELPI PM 2 SMPS Total PM (4.3-165 nm) Sample Point (1=BS; 2=AS)
0
1
2
0
20
40
60
80
100
120
10/16/2012 0:00 10/16/2012 12:00 10/17/2012 0:00 10/17/2012 12:00 10/18/2012 0:00 10/18/2012 12:00
Mas
s [m
g/m
3]
SMPS Total PM (4.3-165 nm) ELPI PM 0.2 Sample Point (1=BS; 2=AS)

Nakim Ficaria Seaways Oct. 2012 Page 16
Figure 12: DustTrak PM1 mass over time. On the 17th in the afternoon in the Gent harbor area PM was high and not shown fully in this graph.
Figure 13: SMPS total mass compared to DustTrak mass PM1 over time.
0
1
2
0
2
4
6
8
10
12
14
16
18
20
16-10-12 00:00 17-10-12 00:00 18-10-12 00:00 19-10-12 00:00
Mas
s [m
g/m
3]
PM1 Sample Point (1=BS; 2=AS)
0
1
2
0
5
10
15
20
25
30
35
40
16-10-12 00:00 17-10-12 00:00 18-10-12 00:00 19-10-12 00:00
Mas
s [m
g/m
3]
PM1 SMPS Total PM (4.3-165 nm) Sample Point (1=BS; 2=AS)

Nakim Ficaria Seaways Oct. 2012 Page 17
5.3 Effect of operating the jet-sprayers and venturies On Oct. 18
th the effect of turning the scrubber jet-sprayers on/off and activating the venturies were
shortly investigated. The effect on particle size and mass will be covered here.
Time Event
12:26 Jet sprayers OFF
12:58 Jet sprayers ON
13:53 Venturies Activated
14:25 Venturies Deactivated
In theory the combination of having jet sprayers OFF and venturies deactivated (12:26-12:58) should
comprise the worst case scenario whereas the opposite of having jet sprayers ON and venturies activated
(13:53-14:25) should comprise the best case scenario, in terms of particle removal.
Within the described time frame the engine load was constant at 66.9±1.5 % MCR and water
consumption of 1064±4 m3/h. Measurement position was after the scrubber. Stable SMPS measurements
were from 12:40 to 15:00 and shown below. Stable ELPI measurements were from 12:55 and onwards.
Figure 14: Effect of turning the scrubber jet-sprayers on/off and activating the venturis on Oct. 18th.
0
5
10
15
20
12:30 13:00 13:30 14:00 14:30 15:00
Par
ticl
e d
iam
ete
r [n
m]
SMPS mean diameter Mode diameter
-10
0
10
20
30
40
50
60
70
80
90
0.0
0.5
1.0
1.5
2.0
2.5
3.0
3.5
12:30 13:00 13:30 14:00 14:30 15:00
ELP
I m
ass
[mg/
m3
]
SMP
S m
ass
[mg/
m3
]
SMPS Total PM (4.3-165 nm) ELPI PM 2

Nakim Ficaria Seaways Oct. 2012 Page 18
The effect of jet sprayers and venturis on particle mass and diameter is not pronounced as observed in
Figure 14. The reason why mean diameter seem to slightly increase with time while mode diameter
decreases can likely be explained due to the fact that the overall particle number concentration for the
primary peak also decreases in time (mode diameter). Total PN measured with SMPS followed the ELPI
PM2 trace given in Figure 14; i.e. a ~50 % decrease during the two hours period, data not shown.
5.4 FID measurements Below is given the results for the FID measurements for total organic carbon (TOC) for the three focus
periods on the 16th Oct.
5.5 Elemental analysis of particulate matter On Oct. 16
th ELPI plates collected before and after scrubber were analyzed with SEM-EDX, see Table
5. Collection was done in the periods 9:17-12:20 before scrubber and 12:53-17:08 after scrubber.
2.3 % S Fuel
Before scrubber
After scrubber
Mass % mass % Removed Mass % mass
C 711.2 67.9 47.6 372.6 48.1 N 30.8 2.9 100.0 0.0 0.0 O 169.2 16.2 -19.6 202.3 26.1 Na 3.0 0.3 -875.1 28.8 3.7 Mg 0.1 0.0 -6358.4 5.1 0.7 Al 0.0 0.0
0.0 0.0 Si 4.5 0.4 10.4 4.0 0.5 P 0.0 0.0
0.0 0.0 S 63.2 6.0 -42.1 89.9 11.6 Cl 0.0 0.0
0.0 0.0 Sn 4.7 0.4 100.0 0.0 0.0 Ca 22.2 2.1 2.3 21.7 2.8 V 23.0 2.2 -33.6 30.7 4.0 Mn 0.0 0.0
0.0 0.0 Fe 6.6 0.6 7.7 6.1 0.8 Ni 8.8 0.8 -44.7 12.8 1.7 Cu 0.0 0.0 0.0 0.0 Zn 0.0 0.0 0.0 0.0 Total 1047.3 100.0 26.1 773.9 100.0
Table 5: Summary of EDX analysis of the particulate material collected on the impactor stages < 3.08 µm. Each
dataset is a pooling of EDX mass fractions scaled by the physical mass on the individual impactor stages. Negative
number in ‘% Removed’ means that the amount of the element has increased after the scrubber. The columns ‘mass’ and
‘% mass’ are given in mg/m3 and as fraction of the total mass, respectively.
Focus period Scrubber mode Day Time TOC before scrubber (ppm) TOC after scrubber (ppm) Reduction (%)
1 SW 16. Oct. 12:03 - 13:32 44 39 12
2 SW 16. Oct. 15:42 - 16:16 33 32 3
3 SW 16. Oct. 20:45 - 21:19 29 23 20

Nakim Ficaria Seaways Oct. 2012 Page 19
A total carbon reduction of 48 % (w/w) is very similar to the carbon reduction observed in the first
campaign (52 %) for 2.3 % sulphur and with similar mass concentrations. Carbon again dominates the
particle mass. In the previous campaign an increase in the percentage of iron, nickel, oxygen, and sodium,
in the particle mass was observed for 2.3 % S which is similar to what is observed in the present
campaign. The exception is iron which this time is found in significantly lower concentrations. Also no
chlorine is detected, in agreement with the previous measurements.
5.6 Raman analysis of chemical composition Raman spectroscopy was very shortly tried as a possible technique for characterizing the chemical
composition of material collected on ELPI stages and possible identification of salt containing particles.
In this study stage 1-3 (28-155 nm) before and after scrubber were shortly analyzed. Raman spectroscopy
is a non-destructive technique and can in this context be seen as a supplement to SEM-EDX element
analysis for gaining information on chemical composition, rather than elemental analysis with SEM-
EDX. The resolution is about ~1µm.
Inorganic material was evident on top of a fluorescence background on stage 1 before scrubber.
Sulfates are likely candidates. The closest sulphate database match is anhydrous sodium sulphate, in
overall agreement with findings of sodium, sulphur and oxygen (EDX). Naming the cation is however
very uncertain since just one major Raman peak at ~990 cm-1 was clearly identified on top of a
fluorescence background. Also, there are likely at least two inorganic substances dominating, since a
double peak nature is observed.
On stage 2, fluorescence was shadowing for the signal before scrubber and the same goes for stage 3 as
well as measurements after scrubber. Fluorescence is indicating organic material. A more thoroughly
study is necessary for concluding further on this matter, i.e. changing excitation laser wavelength etc.
6 Discussion
6.1 Effect of the scrubber on the particle number concentration Based on the measurements shown in Figure 6 it is evident that the overall particle number
concentrations decreased after the scrubber in the size interval 4-165 nm, independent of engine load as
specified in Table 2.
The average number concentration for the focus periods measured with SMPS and ELPI are shown in
Table 6 and visualized in Figure 15.
Focus
period
Position
BS/AS
MCR
(average)
[%]
Mean number
conc. SMPS
[x108 #/cm3]
Mean number
conc. ELPI
[x108 #/cm3]
PN reduction
SMPS
[%]
PN reduction
ELPI
[%]
1 BS 81.8±1.1 16.9 ± 1.8 20.5 ± 0.4
46
48 AS 81.9±1.2 9.2 ± 0.4 10.6 ± 0.5
2 AS 82.2±1.0 9.3 ± 0.2 9.2 ± 0.3 N.A. N.A.
3 AS 81.7±1.4 9.2 ± 0.2 7.8 ± 0.3 N.A. N.A.
4 BS 73.1±2.5 7.7 ± 0.1 3.5 ± 0.1
41
38 AS 65.8±3.6 4.5 ± 0.2 2.2 ± 0.2
5 BS 69.1±1.0 7.8 ± 0.1 3.3 ± 0.1
58
57 AS 68.5±1.0 3.2 ± 0.1 1.4 ± 0.1
Table 6: Particle number concentration measured by SMPS (4-165 nm) and ELPI (0.007-2 µm).

Nakim Ficaria Seaways Oct. 2012 Page 20
Figure 15: Comparison of the particle number concentration measured by SMPS and ELPI. Numbers are given with
plus/minus one standard deviation based on the number of measurements within the focus periods.
In general, particle number concentrations and calculated reductions as measured by SMPS and ELPI
are in good agreement for 2.3 % S fuel and operating conditions listed in Table 2.
6.2 Effect of the scrubber on the particle mass concentration In Table 7 are given mass concentrations calculated for ELPI, SMPS and DustTrak for the selected
periods in data. PM reduction is not given for DustTrak since these seem questionable.
Focus
period
Position
BS/AS
ELPI (1)
7nm-2µm
[mg / m3]
SMPS (2)
4-165 nm
[mg / m3]
DustTrak
< 1 µm
[mg / m3]
PM reduc-
tion ELPI
[%]
PM reduc-
tion SMPS
[%]
1 BS 651 ± 43 28 ± 3 4.1 ± 0.4
27
20 AS 475 ± 34 22 ± 1 7.8 ± 0.1
2 AS 460 ± 31 21 ± 1 7.5 ± 0.2 N.A. N.A.
3 AS 432 ± 25 20 ± 1 7.6 ± 0.3 N.A. N.A.
4 BS 310 ± 22 7.2 ± 0.1 2.6 ± 0.2
28
-25 AS 224 ± 23 9.0 ± 0.8 4.0 ± 0.5
5 BS 283 ± 19 7 ± 1 2.8 ± 0.2
46
-4 AS 152 ± 14 7 ± 1 3.2 ± 0.1
Table 7: Calculated mass concentrations for ELPI, SMPS and DustTrak together with PM reduction.
0.0E+00
5.0E+08
1.0E+09
1.5E+09
2.0E+09
2.5E+09
BS AS AS AS BS AS BS AS
1 2 3 4 5
Par
ticl
e n
um
be
r co
nce
ntr
atio
n [
#/cm
3]
Focus period
ELPI SMPS

Nakim Ficaria Seaways Oct. 2012 Page 21
1 10 100
Particle size (nm)
AS number 2. campaign
AS number 1. campaign
Note 1: ELPI mass concentration calculated for PM2 (particles with an aerodynamic diameter less than 2 µm) using an assumed
particle density of 1 g/cm³. Due to the high PN concentration, particle mass is only reported for PM2, This is due to the increased
uncertainty involved in mass calculation from PN measurements due to diffusional deposition in the ELPI impactor stages above 1-2000
nm.
Note 2: SMPS mass concentration calculated from the particle size distribution using the electric mobility diameter and the
assumption that the particles are spherical and with a density of 1.0 g/cm3
For the selected focus periods the DustTrak measured more mass after the scrubber than before. This
tendency is questionable when comparing to SMPS and ELPI results. The ELPI measures a PM 2
reduction of 27-46 % for the focus periods.
Since no isokinetic sampling was done the mass reduction cannot be compared to mass reduction
obtained by filter collection methods like ISO8178, as large particles which can carry the major part of
the total mass are excluded. As such the reductions given in Table 7 should be used with caution.
6.3 Comparison with results from the first campaign The measurement using 2.3 % S from the first campaign were taken at similar scrubber water
consumption as the present campaign, hence about 1000 m3/h. Fuel consumption was at 3825 L/h
previously. The present MCR at 82 % from focus period 1 corresponds to 3685 L/h which is the closest
there is to compare with results from the 1st campaign.
In Figure 16 is shown a direct comparison between measurements from the two campaigns and
conditions stated above.
Figure 16: Comparison between 1st and 2nd measurement campaign for 2.3 % S using SMPS data.
Number concentrations from the two campaigns are given in the following Table 8 as well as mean
particle size.
0.0E+00
1.0E+09
2.0E+09
3.0E+09
4.0E+09
5.0E+09
6.0E+09
1 10 100
dN
/dlo
gDp
[#/
cm3]
Particle size (nm)
BS number 2. campaign
BS number 1. campaign

Nakim Ficaria Seaways Oct. 2012 Page 22
Camp-
aign
Fuel
consum-
ption
[L/h]
Position
BS/AS
Mean number
conc. SMPS
[x108 #/cm3]
Mean number
conc. ELPI
[x108 #/cm3]
PN reduc-
tion
SMPS
[%]
PN reduc-
tion
ELPI
[%]
SMPS
mean
diameter
[nm]
2 (new)
3685 BS 16.9 ± 1.8 20.5 ± 0.4
46
48 24.4 ± 0.7
AS 9.2 ± 0.4 10.6 ± 0.5 21.5 ± 0.1
1 (old)
3825 BS 17.2 ± 0.4 29.6 ± 3.3
38
31 19.3 ± 0.3
AS 10.7 ± 0.5 20.4 ± 1.1 16.4 ± 0.2
Table 8: Comparison between 1st and 2nd measurement campaign.
Taken into consideration the slightly different engine loads, different weather conditions between
measurement campaigns, instrumental setup, etc., measurements show a good reproducibility.
A bimodal distribution is observed before scrubber whereas a trimodal distribution is evident after
scrubber, however the secondary peaks both before and after scrubber seem somewhat more pronounced
in results from the 2nd
campaign at the given MCR.
7 Conclusion Particle measurements performed in this study using mainly SMPS and ELPI show that combustion
particles from the vessel Ficaria Seaways in general has a bimodal size distribution before the scrubber
and a trimodal size distribution after the scrubber – in good agreement with previous findings from the
first measurement campaign.
The SMPS size distributions for different engine loads (69-82 %) before the scrubber show a primary
peak between 10-25 nm and a smaller secondary peak around 50-70 nm. After the scrubber a primary
peak at 10-20 nm is observed with minor peaks at 30-40 nm and 60-80 nm.
In all cases, the vast majority of the particles emitted are smaller than 30 nm. Both particle number and
peak particle diameter (mode1) decreases after the scrubber for all focus periods.
In the range of the measurement uncertainties it was found that the scrubber system decreases the
emitted particle number concentration (#/cm3) by 30-60 % under the conditions of the selected focus
periods and the fuel and scrubber water consumption stated in section 2.3 and 2.4. There is good
agreement between PN reductions calculated from SMPS and ELPI data for the focus periods.
For the selected focus periods the DustTrak measured more mass after the scrubber than before. This
tendency is questionable when comparing with ELPI measurements. The ELPI measures a PM 2
reduction of 27-46 % for the focus periods.
The effect on particle diameter and particle mass by operating the scrubber jet sprayers and venturis is
not pronounced in this study.
With SEM-EDX is estimated a total carbon reduction of 48 % which is very similar to the carbon
reduction from the first campaign (52 %) for 2.3 % sulphur and with similar mass concentrations. Carbon
again dominates the particle mass. In the previous campaign an increase in the percentage of iron, nickel,
oxygen, and sodium, in the particle mass was observed for 2.3 % S which is similar to what is observed in
the present campaign. The exception is iron which this time is found in significantly lower concentrations.
Chlorine is not observed, in agreement with previous campaign.
Using Raman spectroscopy inorganic material was evident on top of a fluorescence background on
ELPI stage 1 before scrubber. Sulfates are likely candidates. However it was not possible to accurately
identify the cation. A more thorough study is necessary for concluding further on this matter.
For selected focus periods with similar engine and scrubber operating conditions there is a good
agreement with measurements carried out in the first campaign.