characterizing signal transition behaviors - · pdf file• phase locked loop test...
TRANSCRIPT
1© Agilent Technologies, Inc. 2008
Characterizing signal transition behaviors of oscillator/phase-locked-loop
Page 1
Characterizing phase-locked-loop signal transition behaviors such as
Microphonic/Phase-hits
Author: Akihiko Oginuma, Agilent Technologies
Hello My name is Akihiko Oginuma, with Agilent Technologies, Component Test Division Kobe. I am the product manager for Agilent Signal Source Analyzer which is dedicated solution for testing oscillators and phase-locked-loops with various parameters through phase noise and RF transient measurement functions and so on.
Today’s discussion is about characterizing PLL response as well as signal transition behaviors, but let me start with the background of this application.
Digital communication systems often have unique carrier synchronization and synthesizer requirements such as rapid carrier acquisition/lock, and stable operation in demanding environments. The performance of these requirements is affected by not only oscillator characteristics themselves but also the design of phase-locked loop circuits interacting with unwanted stimulus such as microphonics.
We will discuss how Agilent’s Signal Source Analyzer helps you to identify unwanted phase-locked loop transition, “phase-hits”, even in sub-microsecond period, and achieve easy, comprehensive and accurate phase-locked loop characterization in both linear and nonlinear regions.

2© Agilent Technologies, Inc. 2008
Characterizing signal transition behaviors of oscillator/phase-locked-loop
Page 2
Agenda
• Phase locked loop test parameters and challenges
• PLL linear behavior analysis– Characterizing phase locked loop response on phase noise performance
• PLL Non-linear behavior analysis– Measuring RF transient (PLL lockup time)– Capturing and analyzing Microphonic and phase-hits
• Summary
Agenda
Review of phase locked loop test parameters and challengesPLL linear behavior analysis: PLL response on phase noise performance.PLL Non-linear behavior analysis- Measuring RF transient- Capturing and analyzing Microphonic and phase-hitsQ&A, Agilent product information

3© Agilent Technologies, Inc. 2008
Characterizing signal transition behaviors of oscillator/phase-locked-loop
Page 3
Test Parameters - Characterizing PLL Linear & Nonlinear Behaviors
ComponentEvaluation
Oscillator/PLL Circuit Design
Verification/Test at Operating Conditions
Reference SourcePhase Noise
VCO Phase NoiseAM NoiseTuning Sensitivity
Loop Filter (PLL Response)Phase Noise RF Transient
SpursHarmonics
Microphonic
Phase-hits
Let’s start with test parameters in characterizing phase locked loop linear & non-linear behaviors. We will discuss three different stages of test usage, component evaluation, oscillator/phase-locked-loop circuit design, and verification/test at operating conditions.
As shown in the slide, common phase-locked-loop building blocks are the phase detector, the loop filter, the voltage controlled oscillator (VCO), and the frequency divider. Each of these building blocks has both linear and non-linear attributes to its operation.
Assuming that the test usages above, what we will focus on today is that PLL design phase as well as verification test at operation conditions.
In a couple of next slides, we will review the test parameters and challenges on each stage.
4© Agilent Technologies, Inc. 2008
Characterizing signal transition behaviors of oscillator/phase-locked-loop
Page 4
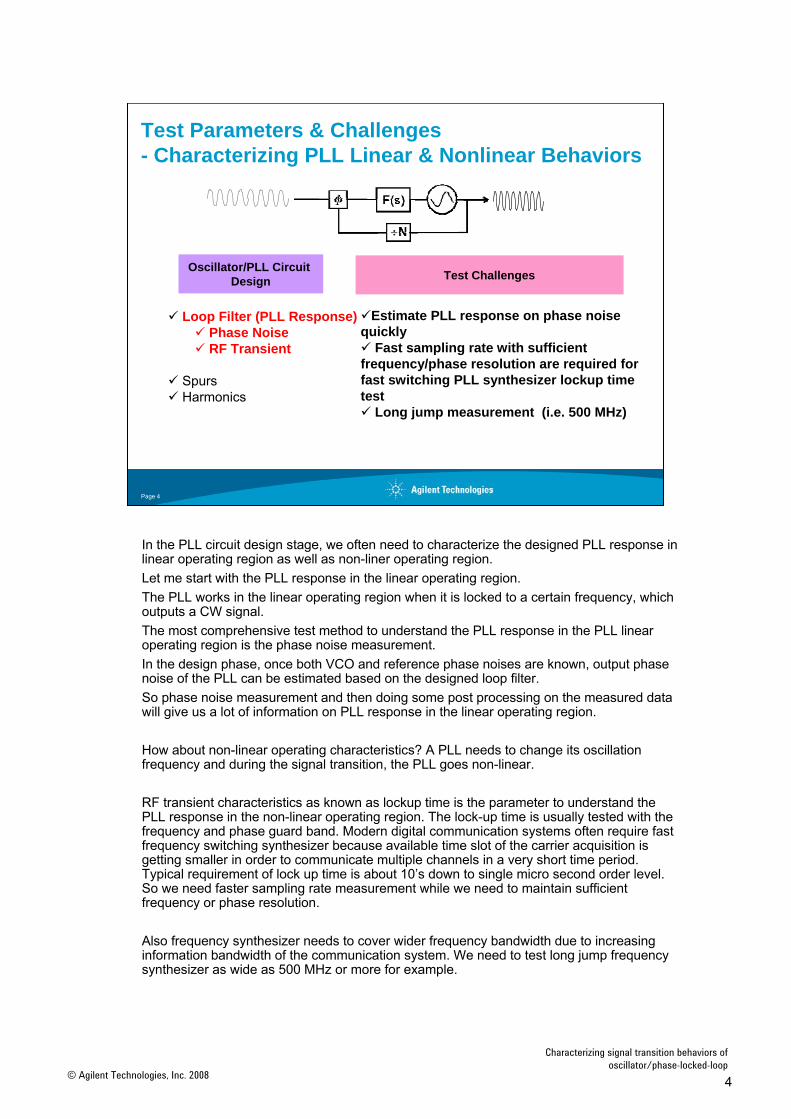
Test Parameters & Challenges- Characterizing PLL Linear & Nonlinear Behaviors
Oscillator/PLL Circuit Design
Loop Filter (PLL Response)Phase Noise RF Transient
SpursHarmonics
Estimate PLL response on phase noise quickly
Fast sampling rate with sufficient frequency/phase resolution are required for fast switching PLL synthesizer lockup time test
Long jump measurement (i.e. 500 MHz)
Test Challenges
In the PLL circuit design stage, we often need to characterize the designed PLL response in linear operating region as well as non-liner operating region.Let me start with the PLL response in the linear operating region. The PLL works in the linear operating region when it is locked to a certain frequency, which outputs a CW signal. The most comprehensive test method to understand the PLL response in the PLL linear operating region is the phase noise measurement. In the design phase, once both VCO and reference phase noises are known, output phase noise of the PLL can be estimated based on the designed loop filter. So phase noise measurement and then doing some post processing on the measured data will give us a lot of information on PLL response in the linear operating region.
How about non-linear operating characteristics? A PLL needs to change its oscillation frequency and during the signal transition, the PLL goes non-linear.
RF transient characteristics as known as lockup time is the parameter to understand the PLL response in the non-linear operating region. The lock-up time is usually tested with the frequency and phase guard band. Modern digital communication systems often require fast frequency switching synthesizer because available time slot of the carrier acquisition is getting smaller in order to communicate multiple channels in a very short time period. Typical requirement of lock up time is about 10’s down to single micro second order level. So we need faster sampling rate measurement while we need to maintain sufficient frequency or phase resolution.
Also frequency synthesizer needs to cover wider frequency bandwidth due to increasing information bandwidth of the communication system. We need to test long jump frequency synthesizer as wide as 500 MHz or more for example.

5© Agilent Technologies, Inc. 2008
Characterizing signal transition behaviors of oscillator/phase-locked-loop
Page 5
Test Parameters & Challenges - Characterizing PLL Linear & Nonlinear Behaviors
Verification/Test at Operating Conditions
MicrophonicPhase-hits
Difficult to capture an event that occurs randomly and unpredictably.
Not sure to define test threshold (frequency resolution, time period)
Test Challenges
Your PLL may be exposed to an extremely high gravity or huge temperature ranges. So what happens when your PLL works at such operating conditions.
When the designed PLL is sensitive to unwanted external physical stimulus, the system may become unstable because the PLL oscillation may be modulated internally. This non-linear behaviors are likely to occur especially at various operating conditions such as temperature changes, vibration, and shock.
Microphonic and phase-hits are known as two major problems, and stability of the PLL needs to be tested at operating conditions as well as to address sources of unwanted such behaviors.
We will review major sources of microphonic and phase-hit problems in the later section, however, the test challenges are how you capture such events with an instrument, and how you analyze the signal behavior to address sources of this types of modulation, because it is hard to predict when phase-hit event occurs. Also you need to define test limit to judge the event is OK or not.

6© Agilent Technologies, Inc. 2008
Characterizing signal transition behaviors of oscillator/phase-locked-loop
Page 6
Agenda
• Phase locked loop test parameters and challenges
• PLL linear behavior analysis– Characterizing phase locked loop response on phase noise
performance
• PLL Non-linear behavior analysis– Measuring RF transient (PLL lockup time)– Capturing and analyzing Microphonic and Phase-hits
• Summary
Agenda
Review of phase locked loop test parameters and challengesPLL linear behavior analysis: PLL response on phase noise performance.PLL Non-linear behavior analysis- Measuring RF transient- Capturing and analyzing Microphonic and phase-hitsQ&A, Agilent product information

7© Agilent Technologies, Inc. 2008
Characterizing signal transition behaviors of oscillator/phase-locked-loop
Page 7
Phase Locked Loop Linear Analysis
f
÷N
F(s)
LoopFilter
VCO
FrequencyDivider
fR
Kf
fOUT
fV
S S
fD
1/N
N
PLL Response on Phase Noise
fOUT/fV
KvKfKf
fOUT/fRReference PN
VCO
Kf KV
The operation of a PLL is easily described using feedback control systems that yield a transfer function in S, the complex frequency parameter used in Laplace transforms. The transfer function to the various possible stimulus points can be found as shown in the slide. The responses to phase fluctuations in the reference, in the VCO and to signals injected at the phase detector output are shown here.
Where let F(s) = KFA response to signals summed at the phase detector output is expressed as,
And a response to VCO phase fluctuations is also expressed as,
The PLL transfer function that describes its response to reference phase fluctuations has a low-pass shape. The response to signals added at the phase detector has a similar low-pass shape and the output phase becomes independent of the reference for phase components above the PLL bandwidth. The transfer function describing the PLL response to phase fluctuations in the VCO has a high pass shape. The PLL has no effect on the VCO phase for fluctuation components above the loop bandwidth but attenuates lower frequency components that lie inside the loop bandwidth. Thus, the phase noise of the reference and the phase detector noise multiplied by N dominate low frequencies while the phase noise of the VCO dominates high frequencies.
NF(s)KKS
F(s)KK(s)φ(s)φ
φv
φv
R
out
+=
NKKKS
KKK(s)φ(s)φ
Fφv
Fφv
R
out
+=
NKKKS
KK(s)φ(s)φ
Fφv
Fv
D
out
+=
NKKKS
S(s)φ(s)φ
FφvV
out
+=
8© Agilent Technologies, Inc. 2008
Characterizing signal transition behaviors of oscillator/phase-locked-loop
Page 8
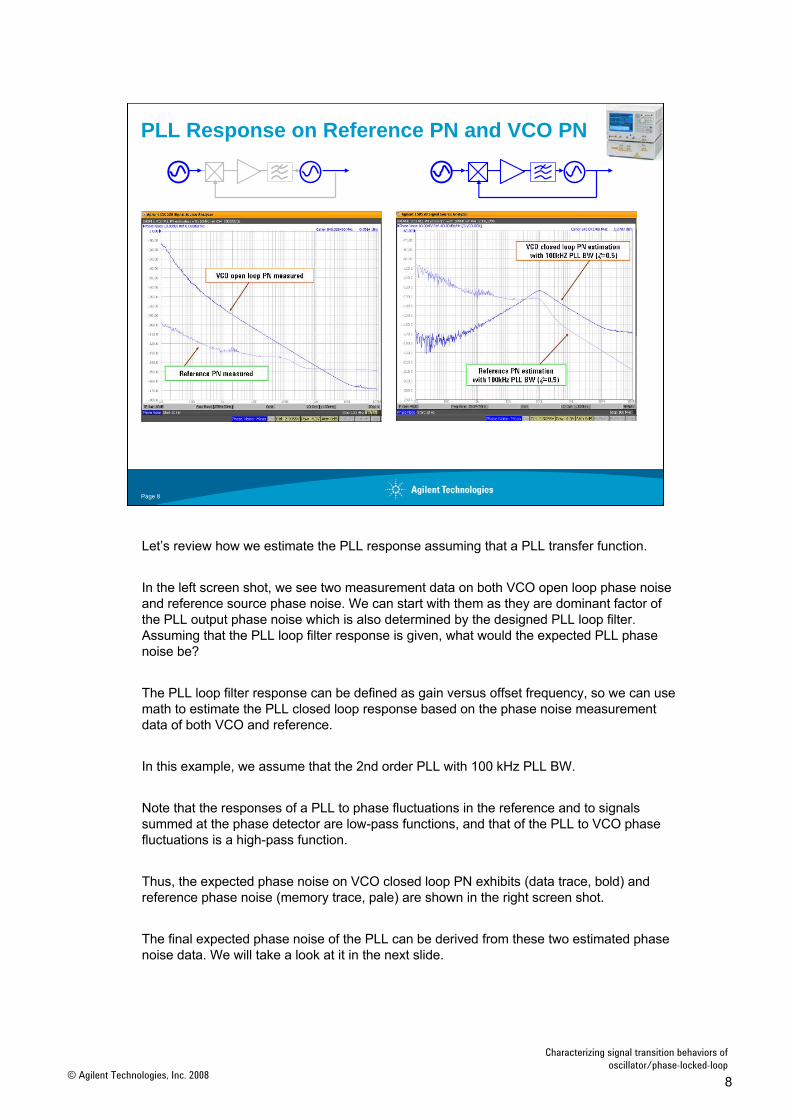
PLL Response on Reference PN and VCO PN
Let’s review how we estimate the PLL response assuming that a PLL transfer function.
In the left screen shot, we see two measurement data on both VCO open loop phase noise and reference source phase noise. We can start with them as they are dominant factor of the PLL output phase noise which is also determined by the designed PLL loop filter. Assuming that the PLL loop filter response is given, what would the expected PLL phase noise be?
The PLL loop filter response can be defined as gain versus offset frequency, so we can use math to estimate the PLL closed loop response based on the phase noise measurement data of both VCO and reference.
In this example, we assume that the 2nd order PLL with 100 kHz PLL BW.
Note that the responses of a PLL to phase fluctuations in the reference and to signals summed at the phase detector are low-pass functions, and that of the PLL to VCO phase fluctuations is a high-pass function.
Thus, the expected phase noise on VCO closed loop PN exhibits (data trace, bold) and reference phase noise (memory trace, pale) are shown in the right screen shot.
The final expected phase noise of the PLL can be derived from these two estimated phase noise data. We will take a look at it in the next slide.

9© Agilent Technologies, Inc. 2008
Characterizing signal transition behaviors of oscillator/phase-locked-loop
Page 9
Estimated Phase Locked Loop Phase Noise
Emulated PLL Phase Noise
VCO Open Loop PN
Reference PN
PLL RF OUT
Based on the measured open loop VCO phase noise and reference oscillator phase noise from the previous slide, estimated total phase noise of the PLL which has 2nd order PLL with 100 kHz BW and 0.5 damping factor.
Inside the loop bandwidth, away from 100 kHz, we can see that the PLL phase noise performance is determined by that of the reference source. Around PLL BW, 100 kHz, the total phase noise performance is determined by VCO closed-loop phase noise or reference source phase noise affected by the PLL loop, whichever worse. Outside the loop bandwidth, VCO phase noise determines PLL output phase noise as reference source phase noise already goes lower than that of VCO due to the effect of low pass PLL loop filter.

10© Agilent Technologies, Inc. 2008
Characterizing signal transition behaviors of oscillator/phase-locked-loop
Page 10
PLL Linear Behavior Analysis with Agilent SSA- Emulate PLL Response on Phase Noise
• “Equation Editor” function enables to emulate PLL response with arbitrary PLL transfer function on measured reference and VCO phase noiseEmulated PLL Phase Noise
VCO Open Loop PN
Reference PN
Equation Editor Screen on the SSA
Agilent E505B Signal Source Analyzer provides such a tool to emulate PLL phase noise performance. Equation editor function of the analyzer allows you to define any types of loop filter response in gain versus offset frequency manner, and it can be applied to both VCO and reference source phase noises are measured on the analyzer to obtain the estimated PLL response on phase noise.
11© Agilent Technologies, Inc. 2008
Characterizing signal transition behaviors of oscillator/phase-locked-loop
Page 11
11
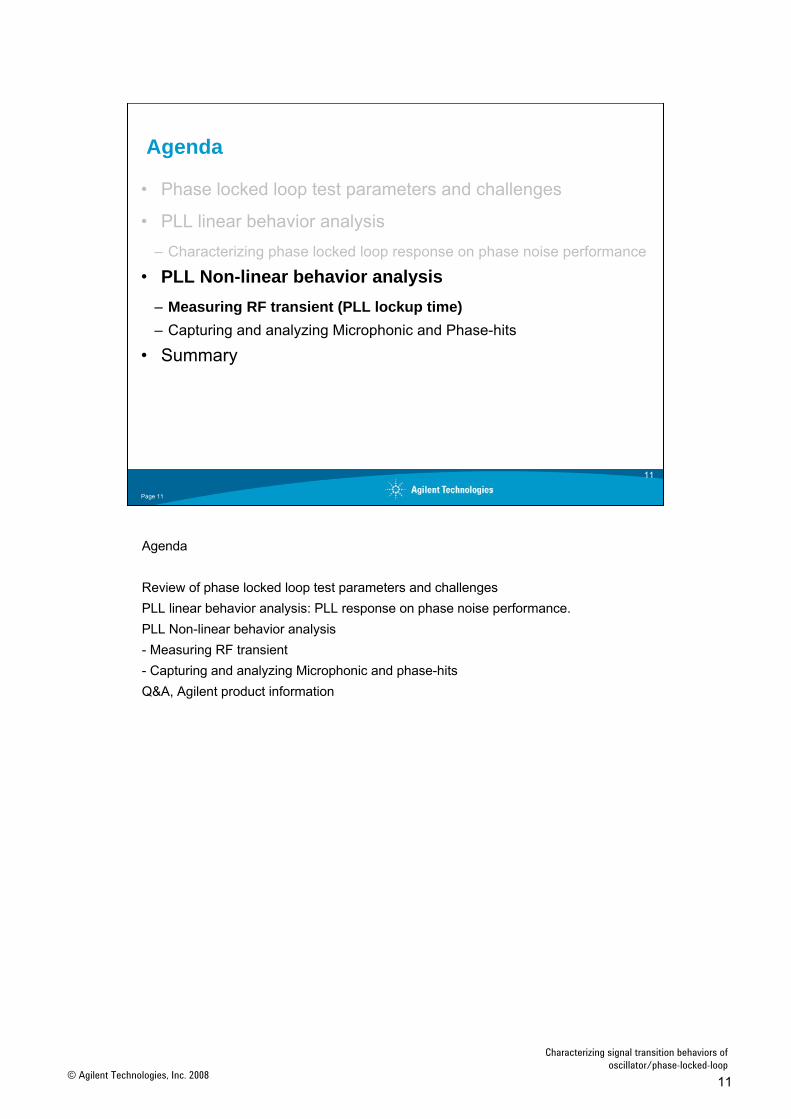
Agenda
• Phase locked loop test parameters and challenges
• PLL linear behavior analysis– Characterizing phase locked loop response on phase noise performance
• PLL Non-linear behavior analysis– Measuring RF transient (PLL lockup time)– Capturing and analyzing Microphonic and Phase-hits
• Summary
Agenda
Review of phase locked loop test parameters and challengesPLL linear behavior analysis: PLL response on phase noise performance.PLL Non-linear behavior analysis- Measuring RF transient- Capturing and analyzing Microphonic and phase-hitsQ&A, Agilent product information
12© Agilent Technologies, Inc. 2008
Characterizing signal transition behaviors of oscillator/phase-locked-loop
Page 12
Synchronization Issues
Signal AvailabilitySignal Lock?
SignalSignal
Signal Acquisition Time
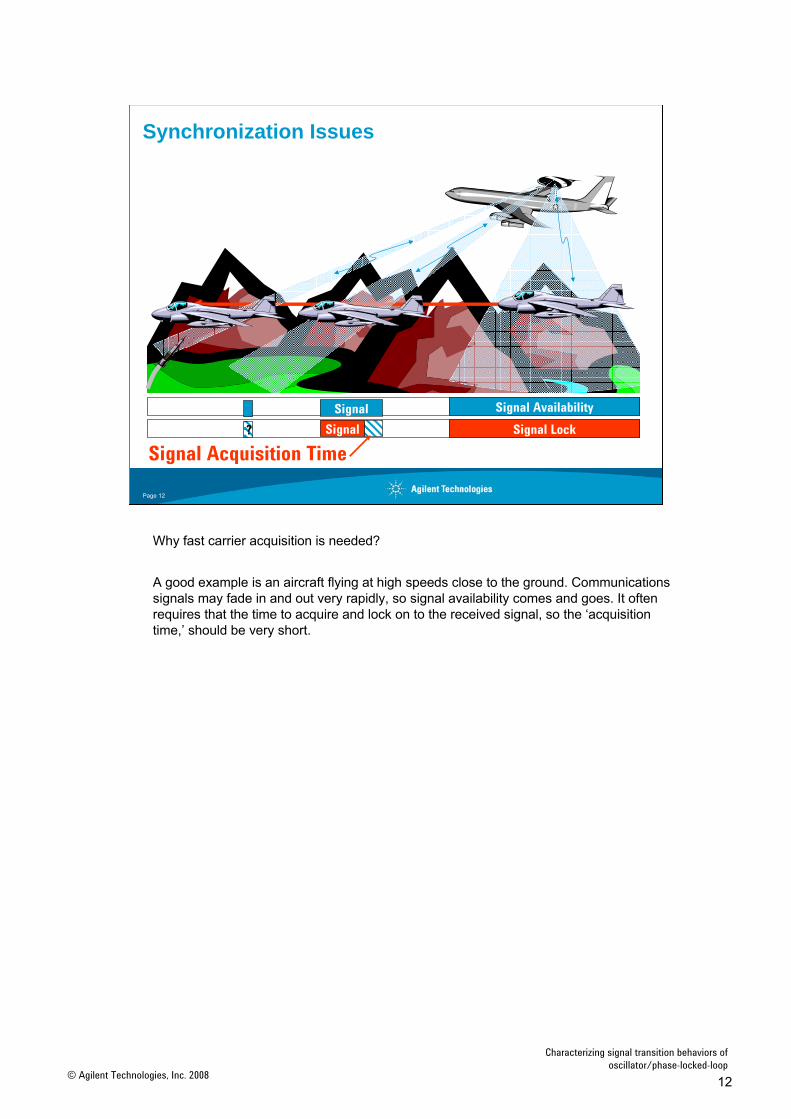
Why fast carrier acquisition is needed?
A good example is an aircraft flying at high speeds close to the ground. Communications signals may fade in and out very rapidly, so signal availability comes and goes. It often requires that the time to acquire and lock on to the received signal, so the ‘acquisition time,’ should be very short.
13© Agilent Technologies, Inc. 2008
Characterizing signal transition behaviors of oscillator/phase-locked-loop
Page 13
LO Lock-Up Time
t
DynamicStatic Static÷ N
Lock-Up Time
f
÷N
F(s)ReferenceInput
RFOutput
RFFrequency
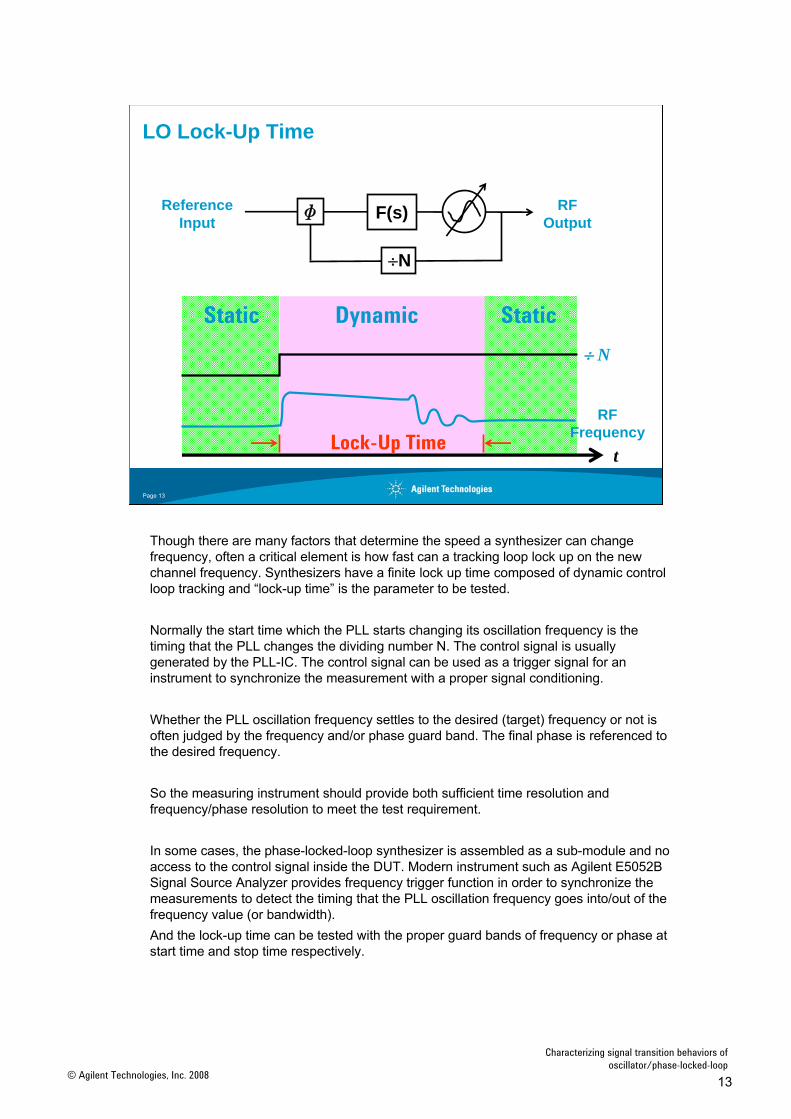
Though there are many factors that determine the speed a synthesizer can change frequency, often a critical element is how fast can a tracking loop lock up on the new channel frequency. Synthesizers have a finite lock up time composed of dynamic control loop tracking and “lock-up time” is the parameter to be tested.
Normally the start time which the PLL starts changing its oscillation frequency is the timing that the PLL changes the dividing number N. The control signal is usually generated by the PLL-IC. The control signal can be used as a trigger signal for an instrument to synchronize the measurement with a proper signal conditioning.
Whether the PLL oscillation frequency settles to the desired (target) frequency or not is often judged by the frequency and/or phase guard band. The final phase is referenced to the desired frequency.
So the measuring instrument should provide both sufficient time resolution and frequency/phase resolution to meet the test requirement.
In some cases, the phase-locked-loop synthesizer is assembled as a sub-module and no access to the control signal inside the DUT. Modern instrument such as Agilent E5052B Signal Source Analyzer provides frequency trigger function in order to synchronize the measurements to detect the timing that the PLL oscillation frequency goes into/out of the frequency value (or bandwidth).And the lock-up time can be tested with the proper guard bands of frequency or phase at start time and stop time respectively.

14© Agilent Technologies, Inc. 2008
Characterizing signal transition behaviors of oscillator/phase-locked-loop
Page 14
Measuring LO Lock-Up Time
Freq vs. Time
Phase vs. TimePower vs. Time
Freq vs. Time (Wide Freq Capture)
Zooming
Here’s an example of PLL lock-up time measurement with Agilent E5052B Signal Source Analyzer.
From this measurement screen we see our phase locked loop synthesizer hops between two frequencies as shown in the left upper trace, frequency versus time in the wide frequency capture mode of the analyzer.
What we want to evaluate is the detail response of phase locked loop during the frequency transition from one to another. Frequency and phase versus time characteristics (shown in the right upper trace and right bottom trace respectively) give more precise information on frequency transition to settle to the final (target) frequency.
We will review how the instrument works a bit more detail with the block diagram in the next slide.

15© Agilent Technologies, Inc. 2008
Characterizing signal transition behaviors of oscillator/phase-locked-loop
Page 15
Dual-Channel Measurements for Frequency/Phase/Power Transient Phenomenon
The signal source analyzer offers a major breakthrough in transient measurements for synthesized signal sources. It has two independent measurement channels and each channel takes a different method for measuring a signal’s frequency simultaneously.
The E5052B’s wideband mode, we call it ‘direct division mode’ path contains a frequency divider at the very front end of the instrument and offers wider frequency hopping analysis range (maximum 4.8 GHz span) up to 7 GHz of carrier signal.
Another narrowband mode (heterodyne mode) shown in this slide, provides significantly fine resolution in frequency or phase transient measurement with reasonably wide frequency hopping range such as 80 MHz, 25.6 MHz, 1.6 MHz or smaller.
Both wideband and narrowband modes operate completely in parallel, the E5052B enables observation of the entire picture of frequency changes and detailed transient response in frequency/phase/power at the same time.
The E5052B takes 125 MHz sampling ADC (analog to digital converter) and the minimum time resolution is 8 ns in the narrowband mode while maintaining finer frequency resolution than any other instruments. It also covers long term observation up to 1,000 seconds (or 10,000 measurement points of the time resolution set)

16© Agilent Technologies, Inc. 2008
Characterizing signal transition behaviors of oscillator/phase-locked-loop
Page 16
Measuring RF Transient with Agilent SSA
Simultaneous 2-channel (wideband and narrowband) measurements
Wideband mode for long jump of frequency transition up to 4.8 GHzNarrowband mode for precise analysis on frequency/phase/power transition up to 80 MHz High sampling rate up to 125 MSa/s (8 nsec/point)
PLL analysis VBA apps allowing:Easy setup for PLL lockup time measurementFrequency, phase, power mask testwith limit lines
PLL Lockup Time Apps
A brief introduction of PLL lockup time measurement application running on Agilent E5052B Signal Source Analyzer.

17© Agilent Technologies, Inc. 2008
Characterizing signal transition behaviors of oscillator/phase-locked-loop
Page 17
17
Agenda
• Phase locked loop test parameters and challenges
• PLL linear behavior analysis– Characterizing phase locked loop response on phase noise performance
• PLL Non-linear behavior analysis– Measuring RF transient (PLL lockup time)– Capturing and analyzing Microphonic and Phase-hits
• Summary
Agenda
Review of phase locked loop test parameters and challengesPLL linear behavior analysis: PLL response on phase noise performance.PLL Non-linear behavior analysis- Measuring RF transient- Capturing and analyzing Microphonic and phase-hitsQ&A, Agilent product information
18© Agilent Technologies, Inc. 2008
Characterizing signal transition behaviors of oscillator/phase-locked-loop
Page 18
Synthesizer Issues
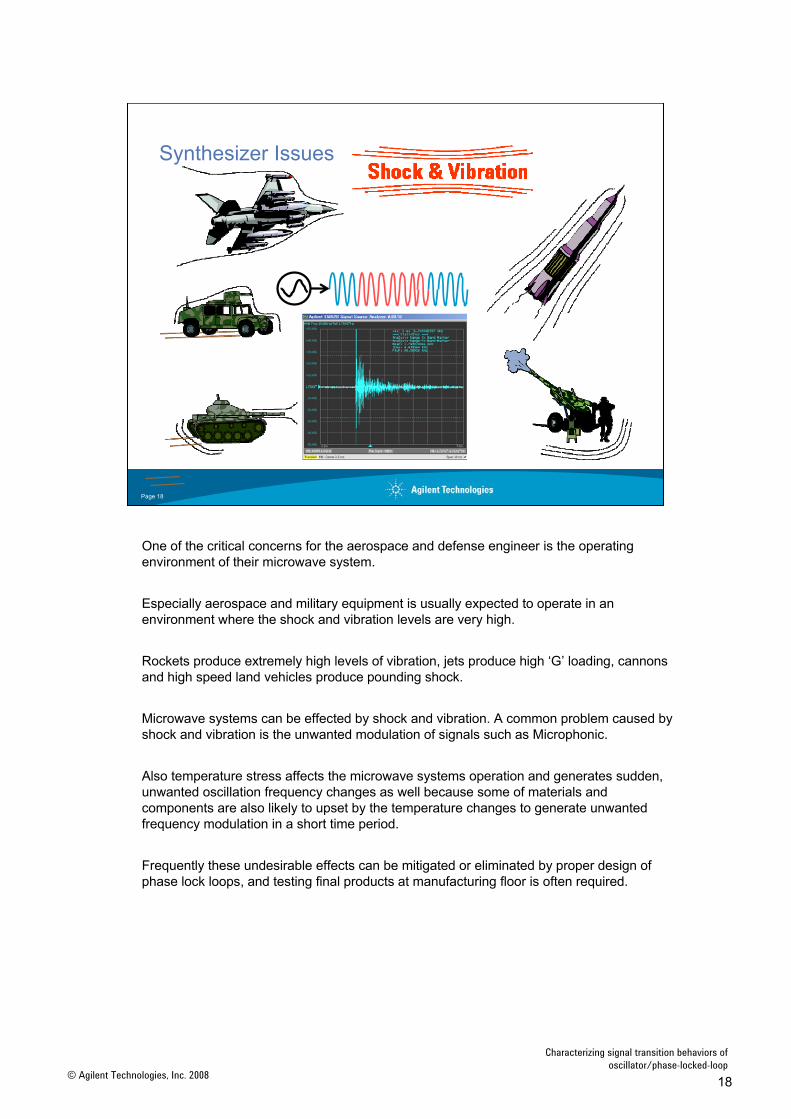
One of the critical concerns for the aerospace and defense engineer is the operating environment of their microwave system.
Especially aerospace and military equipment is usually expected to operate in an environment where the shock and vibration levels are very high.
Rockets produce extremely high levels of vibration, jets produce high ‘G’ loading, cannons and high speed land vehicles produce pounding shock.
Microwave systems can be effected by shock and vibration. A common problem caused by shock and vibration is the unwanted modulation of signals such as Microphonic.
Also temperature stress affects the microwave systems operation and generates sudden, unwanted oscillation frequency changes as well because some of materials and components are also likely to upset by the temperature changes to generate unwanted frequency modulation in a short time period.
Frequently these undesirable effects can be mitigated or eliminated by proper design of phase lock loops, and testing final products at manufacturing floor is often required.

19© Agilent Technologies, Inc. 2008
Characterizing signal transition behaviors of oscillator/phase-locked-loop
Page 19
Common Sources of Unwanted Stimulus
Microphonics
Pyro-Electric Effect
Tce Mismatch
Phase Change
Supply Noise
Doppler Shift
StimulusTime Domain Response of
Unwanted Stimulus
Here are the common sources of unwanted stimulus on phase locked loop components.
These are causes of a sudden frequency and phase change of the controlled signal of the synthesizer. This phenomenon is often called ‘phase hit’.
Phase hits are infrequent but damaging causes of signal degradation in high-performance telecommunications systems, and their effect increases with data rate. As a result, the continuing increase in data rates dictated by dramatic increases in network traffic are making phase hits a prime target for elimination.
Phase hits can be defined as sudden, uncontrolled changes in the phase of a transmitted signal that occurs randomly, and generally lasts for fractions of a second. It can be caused by temperature changes from dissimilar metals expanding and contracting at different rates, as well as from vibration or impact.
In addition, detecting and measuring phase hits generally requires test equipment either designed for the purpose or modified to meet the stringent demands of not only measuring but also characterizing transition events that last a few tens of microseconds at most.

20© Agilent Technologies, Inc. 2008
Characterizing signal transition behaviors of oscillator/phase-locked-loop
Page 20
Microphonics
• Mechanical Frequency Modulation
• Deformation of Resonate Structure
• ωn is a Function of Mass & Young’s Modulus
⇔
M
M K K
Δh ⇒ Δ fm
ΔhMK
n =ω
Microphonics is the phenomenon where certain components in electronic devices transform mechanical vibrations into an undesired electrical signal (noise).
Microwave components are often susceptible to mechanical modulation of the electrical wavelength. This can create a Microphonic sensitivity if the amount of mechanical movement becomes significant relative to the electrical wavelength. As frequency goes higher, the electrical length shortens, and then mechanical stability becomes more critical.
Direct mechanical modulation of electrical length is usually found to be a problem only in extreme vibration environments, but microphonic phenomena are generally repeatable and can be simulated by a certain of physical methods.

21© Agilent Technologies, Inc. 2008
Characterizing signal transition behaviors of oscillator/phase-locked-loop
Page 21
TCE Mismatch In Ceramic Capacitors
• Loop Capacitor Is a Ceramic
• Metal/Ceramic Layers have different TCE
• Handling/Installation Problems Create Micro Cracks
• Cracks Can Cause Abrupt Changes in Capacitance & Phase
• Temperature & Vibration Dependent
Multi-Layer Ceramic
Capacitor
Micro Cracks
MetalCeramic
ΔC
÷M
÷N
The coefficient of thermal expansion (CTE) referring to the thermal or temperature coefficient of expansion (Tce) is an important material property when it comes to avoiding phase-hit problems.
When most materials are heated, they expand. If we use materials with different Tces, the mismatch can build up large mechanical stresses inside the radio. If that energy is released suddenly, it can result in a phase-hit.
Multi-layer ceramic capacitor (MLCC) is commonly used in the radio circuits. If a capacitor with a micro-crack is used as part of the loop filter in a PLL integrator circuit, the capacitance value can change suddenly. To the phase lock loop, a sudden change in capacitance will cause a sudden shift in phase of the output oscillator. Phase steps greater than 90 degree or 180 degree can cause a momentary loss of lock as the phase detector goes non-linear.

22© Agilent Technologies, Inc. 2008
Characterizing signal transition behaviors of oscillator/phase-locked-loop
Page 22
How We Test Phase Hits? (Capturing Unexpected Signal Transition)• A Phase Hit Is A Sudden Uncontrolled Change In Frequency and/or Phase Of The
Transmitted Signal.
• A Phase Hit Limit Could be Specified As Such Event Greater Than 45 Degrees And Lasting Longer Than 4 Milliseconds That May Occur In A Period Of 60 Seconds.
• A Phase Change can be also interpreted as a Frequency Change
time time
Phase Frequency
Frequency Transition
Phase hit is an unintentional signal transition behavior that may cause unlock of carrier synchronization and/or affect bit-error in the communication system. It is natural that the test limits are defined by a guard band of phase along with its lasting period.
Phase transition can be interpreted to frequency transition so that we can capture this phenomenon if we have a dedicated trigger function based on the frequency over time measurement data.
We will review a bit more detail on how the instrument works for triggering and capturing such an unpredictable event.

23© Agilent Technologies, Inc. 2008
Characterizing signal transition behaviors of oscillator/phase-locked-loop
Page 23
How We Capture Phase-hit Event? - Frequency Boundary Trigger (Video Out Mode)
Boundary Out Mode…
Selection of frequency boundary(depending on freq range selected)
Agilent E5052B Signal Source Analyzer provides frequency boundary trigger function to be able to capture such signal transition event.
You can set frequency boundary in the frequency over time measurement screen. The boundary trigger works as trigger off mode. When a measured frequency goes out of the frequency boundary you set, the SSA automatically triggers, and then stop the recording until it reached to the end of memory. The recording length is the time span you set in the SSA.
The SSA frequency boundary trigger provides 10 frequency boundary selections depending on the frequency range, that is the IF bandwidth of the analyzer up to 80 MHz.First you need to have some information about what kind of frequency transition you want to capture, but you can select appropriate one out of the selections.
In the next slide, we will review how it works a bit more detail and learn what the SSA actually does in the hardware level.

24© Agilent Technologies, Inc. 2008
Characterizing signal transition behaviors of oscillator/phase-locked-loop
Page 24
E5052B frequency boundary trigger (video out) circuit diagram
Receiver
LO
ADC FFT MEM
Digital Filter
Digital Filter
Digital Filter
DISP
CMPTR
THR-LVL
Trigger
Digital BPF filter output
Voltage
Time
Frequency Range
Trigger Detection Circuit
This is a simplified block diagram of the SSA transient measurement mode as well as the frequency boundary trigger detection circuit.
The RF signal is coming out of the receiver section, which is downconverted to IF, and goes into the A-D converter. We digitize the incoming data with available sampling rate of the AD converter, maximum rate is 125 MSa/s. The data is feed into the FFT section to obtain frequency data and then recorded in the internal memory. The data is recorded continuously something like an endless tape-recorder if there is no trigger signal is present. The digitized data is also feed into the trigger detection circuit. The circuit consists of several stages of digital filter and a digital comparator.
The digitized data in the trigger detection circuit is compared to the threshold level to judge for triggering. In the frequency boundary out mode, the output signal coming out of the digital filter stages looks like shown in the slide. When frequency goes out of the frequency boundary, the voltage of the digitized data drops accordingly.
The threshold level is also accessed by the user. In the previous soft key menu, there is “minimum power level” entry, which determines the threshold level in dB.
For example, if you set – 3dB as minimum power level, the threshold level is located at the half height of the peal voltage with reference to the ADC converter full scale.
25© Agilent Technologies, Inc. 2008
Characterizing signal transition behaviors of oscillator/phase-locked-loop
Page 25
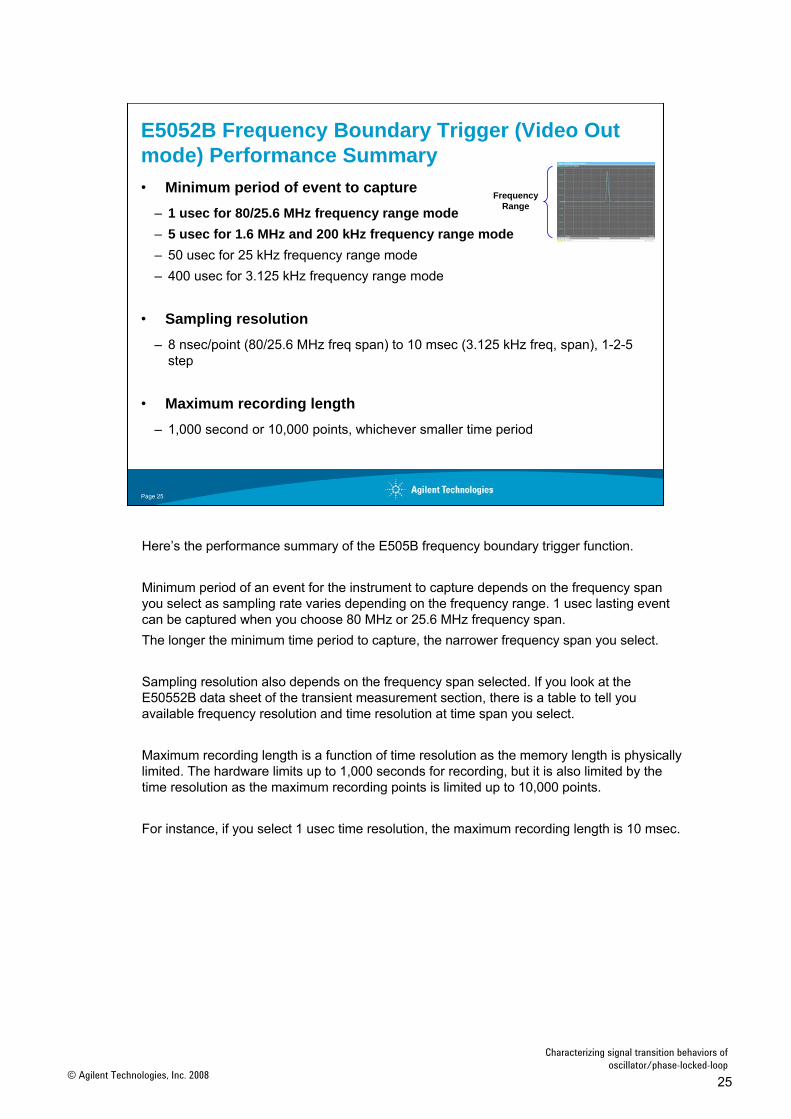
E5052B Frequency Boundary Trigger (Video Out mode) Performance Summary• Minimum period of event to capture
– 1 usec for 80/25.6 MHz frequency range mode– 5 usec for 1.6 MHz and 200 kHz frequency range mode– 50 usec for 25 kHz frequency range mode– 400 usec for 3.125 kHz frequency range mode
• Sampling resolution– 8 nsec/point (80/25.6 MHz freq span) to 10 msec (3.125 kHz freq, span), 1-2-5
step
• Maximum recording length– 1,000 second or 10,000 points, whichever smaller time period
FrequencyRange
Here’s the performance summary of the E505B frequency boundary trigger function.
Minimum period of an event for the instrument to capture depends on the frequency span you select as sampling rate varies depending on the frequency range. 1 usec lasting event can be captured when you choose 80 MHz or 25.6 MHz frequency span.The longer the minimum time period to capture, the narrower frequency span you select.
Sampling resolution also depends on the frequency span selected. If you look at the E50552B data sheet of the transient measurement section, there is a table to tell you available frequency resolution and time resolution at time span you select.
Maximum recording length is a function of time resolution as the memory length is physically limited. The hardware limits up to 1,000 seconds for recording, but it is also limited by the time resolution as the maximum recording points is limited up to 10,000 points.
For instance, if you select 1 usec time resolution, the maximum recording length is 10 msec.
26© Agilent Technologies, Inc. 2008
Characterizing signal transition behaviors of oscillator/phase-locked-loop
Page 26
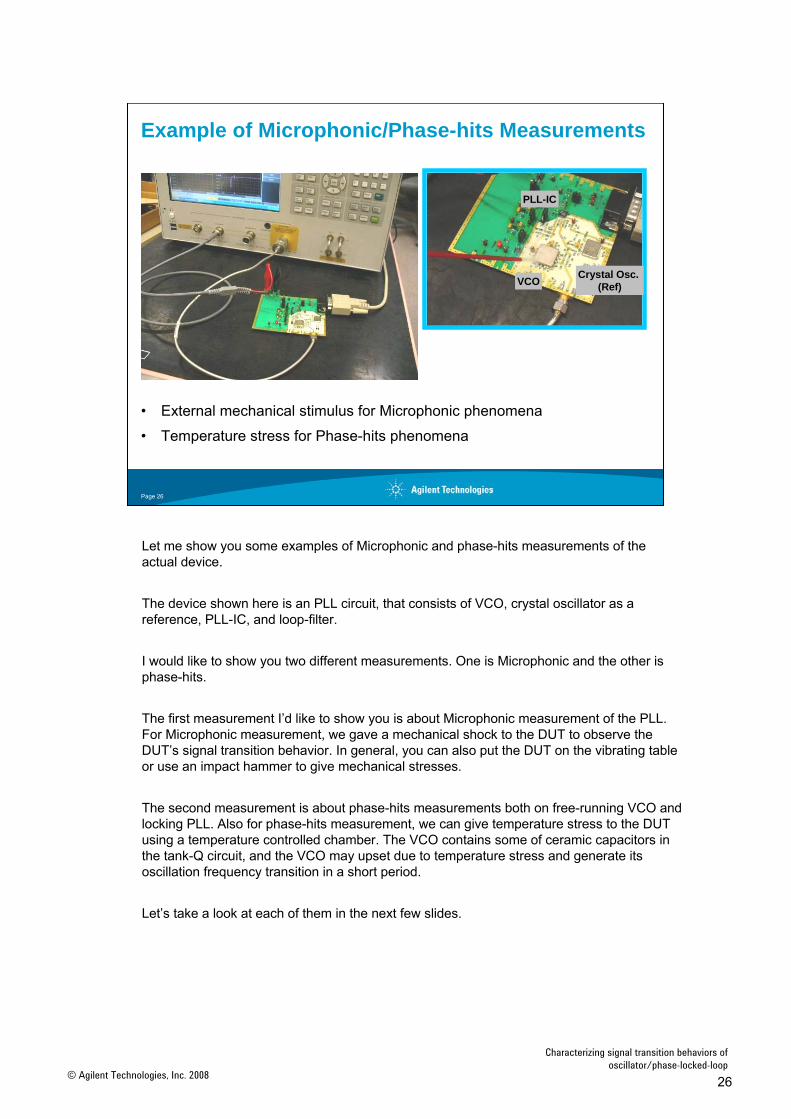
Example of Microphonic/Phase-hits Measurements
• External mechanical stimulus for Microphonic phenomena
• Temperature stress for Phase-hits phenomena
VCO Crystal Osc. (Ref)
PLL-IC
Let me show you some examples of Microphonic and phase-hits measurements of the actual device.
The device shown here is an PLL circuit, that consists of VCO, crystal oscillator as a reference, PLL-IC, and loop-filter.
I would like to show you two different measurements. One is Microphonic and the other is phase-hits.
The first measurement I’d like to show you is about Microphonic measurement of the PLL. For Microphonic measurement, we gave a mechanical shock to the DUT to observe the DUT’s signal transition behavior. In general, you can also put the DUT on the vibrating table or use an impact hammer to give mechanical stresses.
The second measurement is about phase-hits measurements both on free-running VCO and locking PLL. Also for phase-hits measurement, we can give temperature stress to the DUT using a temperature controlled chamber. The VCO contains some of ceramic capacitors in the tank-Q circuit, and the VCO may upset due to temperature stress and generate its oscillation frequency transition in a short period.
Let’s take a look at each of them in the next few slides.

27© Agilent Technologies, Inc. 2008
Characterizing signal transition behaviors of oscillator/phase-locked-loop
Page 27
Example of Microphonic Measurement
Microphonic phenomenon (-2 msec to 8 msec)
Freq vs. Time
Power vs. Time
Freq vs. Time (Wideband)
Frequency BoundaryTo Capture Microphonic Phenomenon
Phase vs. Time
Triggering Point (t=0)
Here’s an measurement example of Microphonic phenomenon of the PLL.
The measured data was 10 millisecond recording, which includes 2 millisecond for pre-trigger event and 8 millisecond after the event.

28© Agilent Technologies, Inc. 2008
Characterizing signal transition behaviors of oscillator/phase-locked-loop
Page 28
Microphonic Measurement – Closer Look
Freq vs. Time
Phase vs. Time
- 100 usec to 400 usec
The recording data contains 1001 points already, so the detailed transition behavior can be observed with zooming function on this analyzer. It also provides statistical analysis function to get standard deviation as well as peak-to-peak of frequency and phase deviation in the time period of your interest.
29© Agilent Technologies, Inc. 2008
Characterizing signal transition behaviors of oscillator/phase-locked-loop
Page 29
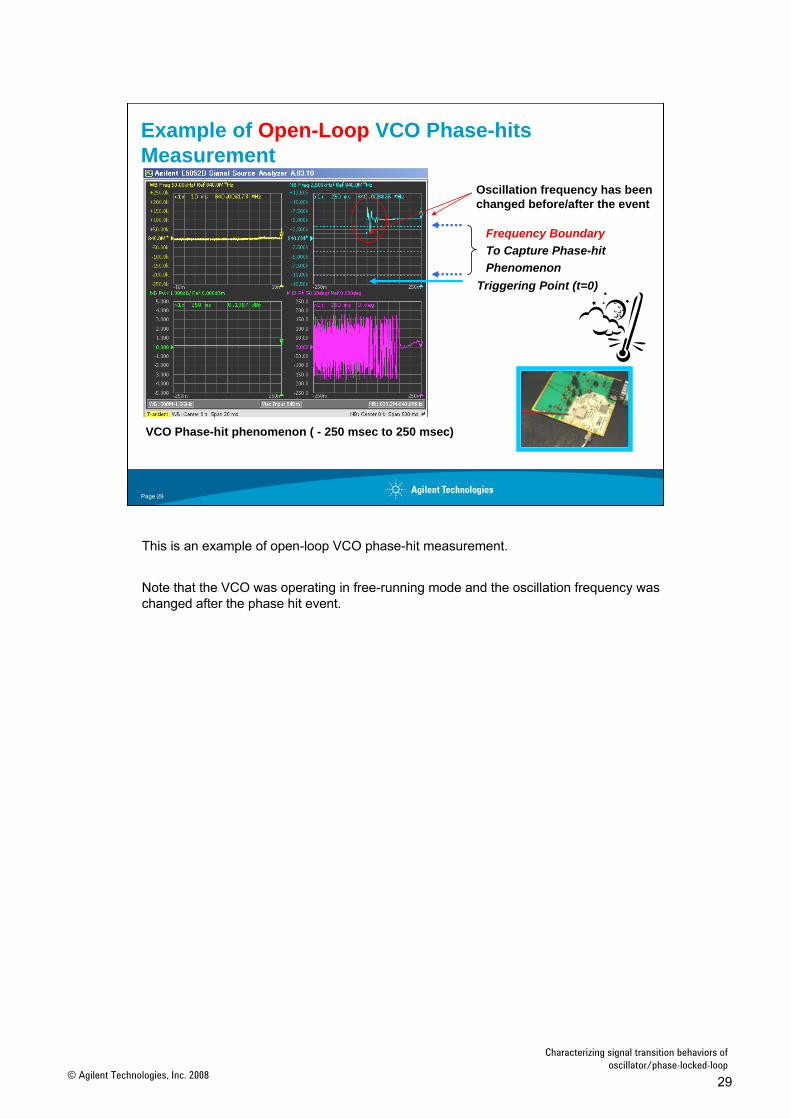
Example of Open-Loop VCO Phase-hits Measurement
Oscillation frequency has beenchanged before/after the event
Frequency BoundaryTo Capture Phase-hit Phenomenon
VCO Phase-hit phenomenon ( - 250 msec to 250 msec)
Triggering Point (t=0)
This is an example of open-loop VCO phase-hit measurement.
Note that the VCO was operating in free-running mode and the oscillation frequency was changed after the phase hit event.
30© Agilent Technologies, Inc. 2008
Characterizing signal transition behaviors of oscillator/phase-locked-loop
Page 30
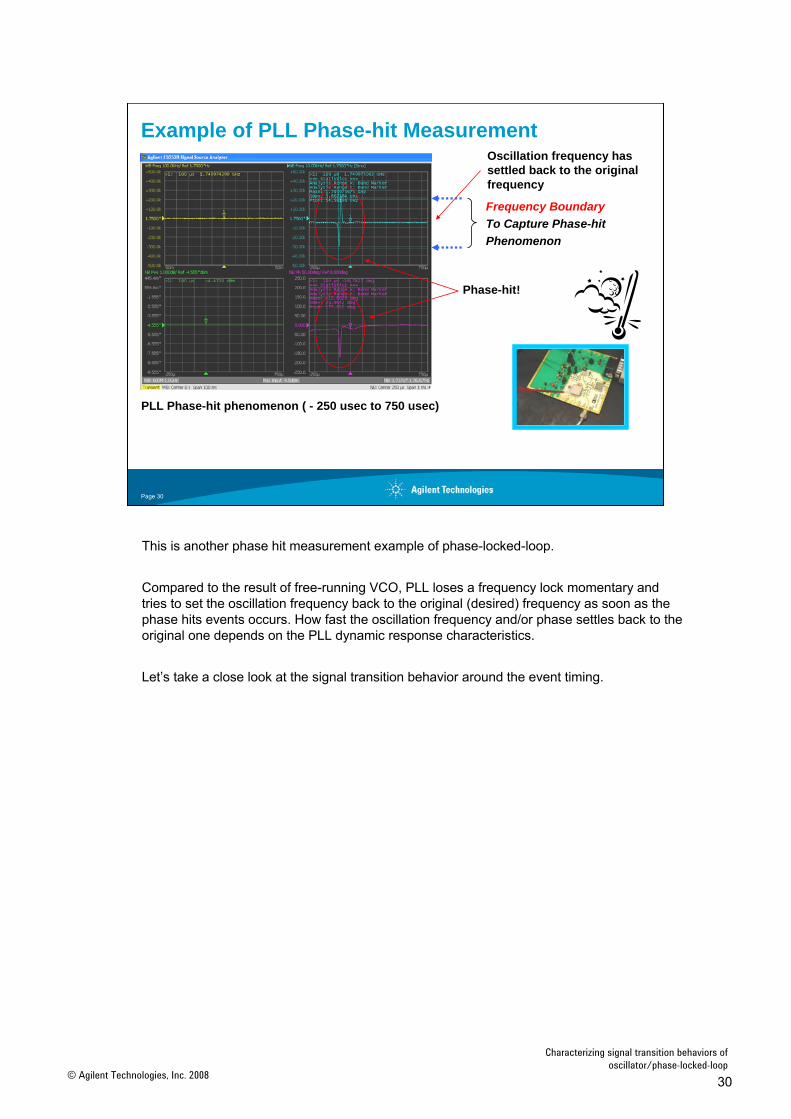
Example of PLL Phase-hit MeasurementOscillation frequency has settled back to the original frequency
Phase-hit!
PLL Phase-hit phenomenon ( - 250 usec to 750 usec)
Frequency BoundaryTo Capture Phase-hit Phenomenon
This is another phase hit measurement example of phase-locked-loop.
Compared to the result of free-running VCO, PLL loses a frequency lock momentary and tries to set the oscillation frequency back to the original (desired) frequency as soon as the phase hits events occurs. How fast the oscillation frequency and/or phase settles back to the original one depends on the PLL dynamic response characteristics.
Let’s take a close look at the signal transition behavior around the event timing.

31© Agilent Technologies, Inc. 2008
Characterizing signal transition behaviors of oscillator/phase-locked-loop
Page 31
Phase-hits Measurement – Closer LookFreq vs. Time
- 20 usec to 80 usec
Phase vs. Time
dt = 8 usec
In this example, the first frequency transition due to the phase-hit phenomenon occurred in the period of 10 micro second or so, and settled back to the original frequency in the period of next 50 micro-second.
Agilent E5052B signal source analyzer with the frequency boundary trigger clearly captured the event even the period of 8 micro second or less that the frequency went out of the boundary.
32© Agilent Technologies, Inc. 2008
Characterizing signal transition behaviors of oscillator/phase-locked-loop
Page 32
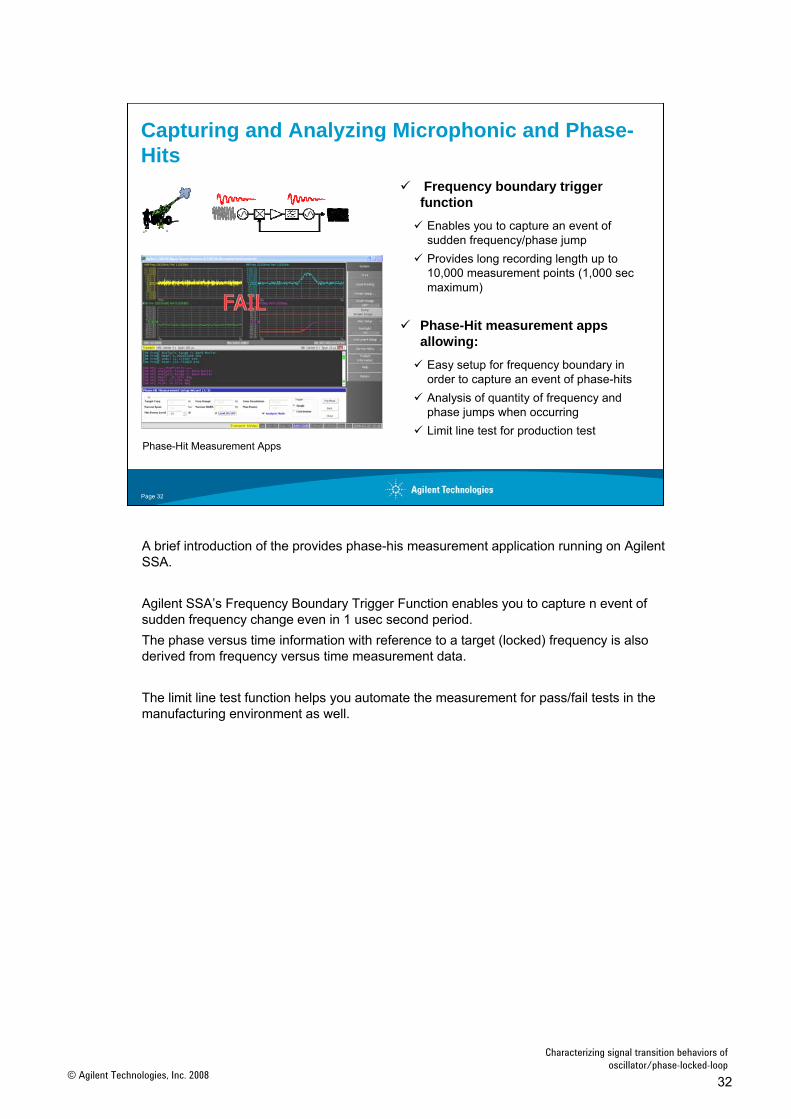
Capturing and Analyzing Microphonic and Phase-Hits
Frequency boundary trigger function
Enables you to capture an event of sudden frequency/phase jumpProvides long recording length up to 10,000 measurement points (1,000 sec maximum)
Phase-Hit measurement apps allowing:
Easy setup for frequency boundary in order to capture an event of phase-hitsAnalysis of quantity of frequency and phase jumps when occurringLimit line test for production test
Phase-Hit Measurement Apps
A brief introduction of the provides phase-his measurement application running on Agilent SSA.
Agilent SSA’s Frequency Boundary Trigger Function enables you to capture n event of sudden frequency change even in 1 usec second period. The phase versus time information with reference to a target (locked) frequency is also derived from frequency versus time measurement data.
The limit line test function helps you automate the measurement for pass/fail tests in the manufacturing environment as well.
33© Agilent Technologies, Inc. 2008
Characterizing signal transition behaviors of oscillator/phase-locked-loop
Page 33
33
Summary
• Characterizing both linear and non-linear behaviors of phase locked loop is a key to identify the root cause of unwanted response of your designed products.
• Agilent E5052B Signal Source Analyzer (SSA) provides world class RF transient measurement performance for capturing and analyzing PLL non-linear behaviors such as lock-up time and Microphonic/phase-hit phenomena.
Summary and conclusion

34© Agilent Technologies, Inc. 2008
Characterizing signal transition behaviors of oscillator/phase-locked-loop
Page 34
34
Q&A
Learn more at: www.agilent.com/find/ssa
Thank you
Data sheets, application notes, videos and presentations available at www.agilent.com.