characterizing user behavior in online social...
TRANSCRIPT
Characterizing User Behavior in Online Social Networks
Fabrício Benevenuto† Tiago Rodrigues† Meeyoung Cha∗ Virgílio Almeida†
†Computer Science Department, Federal University of Minas Gerais, Brazil∗Max Planck Institute for Software Systems (MPI-SWS), Kaiserslautern/Saarbrücken, Germany
ABSTRACTUnderstanding how users behave when they connect to socialnetworking sites creates opportunities for better interfacedesign, richer studies of social interactions, and improveddesign of content distribution systems. In this paper, wepresent a first of a kind analysis of user workloads in on-line social networks. Our study is based on detailed click-stream data, collected over a 12-day period, summarizingHTTP sessions of 37,024 users who accessed four popularsocial networks: Orkut, MySpace, Hi5, and LinkedIn. Thedata were collected from a social network aggregator web-site in Brazil, which enables users to connect to multiplesocial networks with a single authentication. Our analysisof the clickstream data reveals key features of the social net-work workloads, such as how frequently people connect tosocial networks and for how long, as well as the types andsequences of activities that users conduct on these sites. Ad-ditionally, we crawled the social network topology of Orkut,so that we could analyze user interaction data in light of thesocial graph. Our data analysis suggests insights into howusers interact with friends in Orkut, such as how frequentlyusers visit their friends’ or non-immediate friends’ pages.In summary, our analysis demonstrates the power of usingclickstream data in identifying patterns in social networkworkloads and social interactions. Our analysis shows thatbrowsing, which cannot be inferred from crawling publiclyavailable data, accounts for 92% of all user activities. Con-sequently, compared to using only crawled data, consideringsilent interactions like browsing friends’ pages increases themeasured level of interaction among users.
Categories and Subject DescriptorsC.4 [Computer Systems Organization]: Performanceof Systems—Measurement techniques; H.3.5 [InformationStorage and Retrieval]: Online Information Services—Web-based services
Permission to make digital or hard copies of all or part of this work forpersonal or classroom use is granted without fee provided that copies arenot made or distributed for profit or commercial advantage and that copiesbear this notice and the full citation on the first page. To copy otherwise, torepublish, to post on servers or to redistribute to lists, requires prior specificpermission and/or a fee.IMC’09, November 4–6, 2009, Chicago, Illinois, USA.Copyright 2009 ACM 978-1-60558-770-7/09/11 ...$10.00.
General TermsHuman Factors, Measurement
KeywordsOnline social networks, user behavior, session, clickstream,social network aggregator, browsing, silent activity
1. INTRODUCTIONOnline social networks (OSNs) have become extremely
popular. According to Nielsen Online’s latest research [23],social media have pulled ahead of email as the most popu-lar online activity. More than two-thirds of the global on-line population visit and participate in social networks andblogs. In fact, social networking and blogging account fornearly 10% of all time spent on the Internet. These statis-tics suggest that OSNs have become a fundamental part ofthe global online experience.
Through OSNs, users connect with each other, share andfind content, and disseminate information. Numerous sitesprovide social links, for example, networks of professionalsand contacts (e.g., LinkedIn, Facebook, MySpace) and net-works for sharing content (e.g., Flickr, YouTube).
Understanding how users behave when they connect tothese sites is important for a number of reasons. First,studies of user behaviors allow the performance of exist-ing systems to be evaluated and lead to better site de-sign [3, 33] and advertisement placement policies [2]. Sec-ond, accurate models of user behavior in OSNs are crucialin social studies as well as in viral marketing. For instance,viral marketers might want to exploit models of user inter-action to spread their content or promotions quickly andwidely [18, 31]. Third, understanding how the workload ofsocial networks is re-shaping the Internet traffic is valuablein designing the next-generation Internet infrastructure andcontent distribution systems [16,26].
Despite the potential benefits, little is known about so-cial network workloads. A few recent studies examined thepatterns using data that can be gathered from OSN sites,for instance, writing messages to other users [8,14,30,33] oraccessing third party applications [10,22]. As a result, thesestudies reconstruct user actions from “visible” artifacts likemessages and comments. While these initial studies yieldinsights into social network workload, they do not provide aglobal picture of the range and frequency of activities thatusers conduct when they connect to these sites.
A complementary approach to study OSN workloads is touse traces such as clickstream data that capture all activities
49

of users [7]. Since clickstream data include not only visibleinteractions, but also “silent” user actions like browsing aprofile page or viewing a photo, they can provide a moreaccurate and comprehensive view of the OSN workload.
In this paper we present a first of a kind analysis of OSNworkloads based on a clickstream dataset collected from asocial network aggregator. Social network aggregators areone-stop shopping sites for OSNs and provide users with acommon interface for accessing multiple social networks [25].Because social network aggregators are an excellent mea-surement point for studying workloads across various OSNs,we collaborated with a popular social network aggregator inBrazil for this study. We obtained a clickstream dataset,which described session-level summaries of over 4 millionHTTP requests during a 12-day period in 2009. The datasetincluded activity data for a total of 37,024 users who ac-cessed various OSNs through the social network aggregator.
Using the clickstream data, we conducted three sets ofanalyses. First, we characterized the traffic and session pat-terns of OSN workloads (Section 3). We examined howfrequently people connect to OSN sites and for how long.Based on the data, we provide best fit models of sessioninter-arrival times and session length distributions. Sec-ond, we developed a new analysis strategy, which we callthe clickstream model, to characterize user activity in OSNs(Section 4). The clickstream model captures dominant useractivities and the transition rates between activities. Weprofiled user activities for four OSN services: Orkut, MyS-pace, Hi5, and LinkedIn. Third, to gain insight into howusers interact within a given social network, we additionallycrawled the Orkut website and analyzed user activity alongthe social graph (Section 5). Our analysis reveals how oftenusers visit other people’s online profiles, photos, and videos.
Our study provides many interesting findings:
1) Session duration is heavy-tailed, indicating large vari-ations in the OSN usage among users. We provide abest-fit distribution function for the Orkut sessions.
2) Using clickstream data, we present the frequencies andsequences of user activities in Orkut (Table 2 and Fig-ure 6). We find that browsing, which cannot be in-ferred from publicly available data, is the most domi-nant behavior (92%).
3) When we consider silent interactions like browsingfriends’ pages, the number of friends a user interactswith increases by an order magnitude, compared toonly considering visible interactions.
4) Analysis of user interaction along the social graphshows that Orkut users not only interact with 1-hopfriends, but also have significant exposure to friendsthat are 2 or more hops away (22%).
In summary, our study provides a first look into the usageof OSN services from the viewpoint of a social network aggre-gator. The clickstream data analyzed in the paper providesan accurate view of how users behave when they connect toOSN sites. Furthermore, our data analysis suggests severalinteresting insights into how users interact with friends inOrkut. We believe that our findings have implications forefficient system design.
2. DATASETWe use two datasets in this paper. The first is a click-
stream dataset that is collected and provided by a socialnetwork aggregator site. The second is the Orkut social net-work topology that we crawled. These two datasets providecomplementary types of information that we correlate inSection 5. Below we describe both datasets and our method-ology for crawling Orkut. We also discuss some limitationsof these datasets.
2.1 Clickstream dataWe describe how social network aggregators operate and
introduce the clickstream dataset we obtained and analyzed.
2.1.1 Social network aggregatorSocial network aggregators pull content from multiple so-
cial networking sites to a single location, thereby helpingusers who belong to multiple networks manage diverse pro-files more easily [25,27]. Upon logging into a social networkaggregator, users can access their social network accountsthrough a common interface, without having to login to eachOSN site separately. This is done by a two-level real-timeHTTP connection: the first level is between a user and a so-cial network aggregator site and the second is between thesocial network aggregator site and the OSN sites. Socialnetwork aggregators typically communicate with OSN sitesusing Open APIs that OSN sites provide [12]. All contentfrom OSN sites are shown to users through a social networkaggregator’s interface. Figure 1 depicts the scheme interac-tion among users, a social network aggregator site, and OSNsites. Through the interface of the social network aggrega-tor, a user can enjoy all features that are provided by OSNsites, for instance, checking updates from friends, sendingmessages, and sharing photos.
Figure 1: Illustration of a user connecting to multi-ple OSNs through the social network aggregator
2.1.2 Data descriptionThe clickstream data that we analyzed were collected over
a 12-day period (March 26 through April 6, 2009). The dataconsist of summaries of HTTP header information for traf-fic exchanged between the social network aggregator serverand users. The dataset summarizes 4,894,924 HTTP re-quests, including information about time stamp, HTTP sta-tus, IP address of the user, login ID in the social networkaggregator site, URL of the social network site, login IDwithin the social network site, session cookies, and the traf-fic bytes sent and received. After discarding events withmissing fields or HTTP status associated with error codes(e.g., 301, 302), there were 4,649,595 valid HTTP requests.HTTP requests in the trace are grouped into sessions, wherea session represents the sequence of a user’s requests duringa single visit to the social network aggregator. The trace in-cluded 77,407 sessions, covering 16,175 distinct user IP ad-
50

dresses and 37,137 distinct login IDs in the social networkaggregator site.
Not all log entry in the trace were related to accessingOSNs. Some log entries reflect users accessing non-OSNfeatures of the aggregator site, such as listening to an Inter-net radio or watching videos. Other log entries result fromthe automatic display of advertisements and the aggregatorsite’s website logo. After discarding non-OSN related logentries, 802,574 or 17% of the HTTP requests were relatedto accessing the following four OSNs: Orkut, Hi5, MySpace,and LinkedIn. The remainder of this paper focuses on theseHTTP requests related to accessing OSNs.
Table 1 displays the number of users, sessions, and HTTPrequests for these OSNs. Among them, Orkut had thelargest number of users and accounted for nearly 98% ofall HTTP requests. Although the remaining OSN sites takeup only 2% of the trace, the data contain sufficient numberof users for each of these sites. Therefore, we can identifymeaningful user behaviors for these OSNs.
OSNs # users # sessions # requestsOrkut 36,309 57,927 787,276Hi5 515 723 14,532
MySpace 115 119 542LinkedIn 85 91 224
Total 37,024 58,860 802,574
Table 1: Summary of the clickstream data
2.1.3 Data anonymizationThe social network aggregator anonymized any sensitive
information that might reveal a user’s identity prior to ouranalysis. There were three types of information that wereanonymized. First is the user login IDs in the social net-work aggregator site. Second is the user IDs in the socialnetwork site. Third is the IDs of web content that usersaccessed. We could determine the content ID only if thecontent ID appeared in the URL of the fetched webpage.For example, when a user browses a particular photo, con-tent information like the photo ID, the uploader ID, and thealbum ID appears on the URL of the fetched webpage, andwas therefore logged and anonymized. On the other hand,when a user browses his or her own homepage and sees up-date feeds from friends, information about these web objectsdoes not appear in the URL of the fetched webpage, and wastherefore not logged.
2.2 Social network topology of OrkutTo gain insight into user behaviors over the social graph,
we crawled the largest OSN site in the trace, Orkut. Be-cause of the sheer size of the Orkut network, we decided tocrawl friendship information for only those users that ap-pear in the clickstream dataset. We used the Orkut userIDs that appear in the trace, prior to anonymization. Weimplemented a crawler which downloaded the profile page ofeach of these Orkut users. A profile page contained a vari-ety of information about users. Certain profile informationis made publicly available to all Orkut users, for instance,the list of friends, the list of community memberships, name,gender, and country. On the other hand, other informationlike email, phone number, and age is set private and is shown
only to friends by default. When crawling Orkut, we storedall profile information that is made publicly available.
We gathered the profile information of the 36,309 Orkutusers the week after the clickstream data were gathered,during April 10–17, 2009. The average number of friendswas 211.4 and the median number of friends was 152. Someusers had no listed friends at all, while the user with thehighest number had 998 friends. Orkut allows a user tohave at most 1,000 friends. Later we examine what fractionof friends a user visibly or silently interacts with. The IDsof users in the crawled social graph were anonymized in thesame way as the clickstream data.
2.3 Data limitationsAlthough the clickstream data give us a unique oppor-
tunity to study user activities across multiple OSNs, thedataset has limitations.
First, the dataset is biased towards the set of users in thesocial network aggregator portal. One evident bias is thedemographics of users in Orkut. To examine the geographi-cal distribution of users, we used the GeoIP database [20] toidentify the location of 16,175 IP addresses that appearedin the trace. These users were located across all continentsin the world, spanning 90 countries. However, certain geo-graphical locations contained more users than others. Brazilhad the highest presence both based on the number of IP ad-dresses (71%) and the number of the HTTP requests (70%).The second largest user base came from India and accountedfor 12% of the IP addresses and 14% of the requests. Thethird most common location was the United States. Thebias in user samples may raise a concern about how rep-resentative our results are for other social networks in thedata, i.e., Hi5, MySpace, and LinkedIn.
Second, user behavior in a given social networking siteis influenced by the specific mechanisms the site provides.Therefore, our findings about user activity may change asnew features are added to social networking sites. To ex-amine the set of user behaviors that are relatively obliviousto the specific design of websites, we studied user behaviorsacross multiple social networks and tried to look for patternsthat remain consistent across multiple services.
Third, we are not able to infer behaviors of users over along term period (e.g., several months) since the data werecollected only over a 12-day period.
3. CONNECTION PATTERN ANALYSISIn this section, we characterize OSN workloads at the ses-
sion level. We first describe how sessions are identified in thesocial network aggregator, then examine the duration andfrequency of connections to OSN services. We also modeltwo key session characteristics from a system’s perspective:inter-arrival times and session length distribution.
3.1 Defining a sessionThe social network aggregator considers the following
events to determine end of a session (a) when a user closesthe web browser or logs out or (b) when a user does not en-gage in any action for more than an arbitrarily set period oftime. The system uses a 20 minute threshold. To check thesensitivity of this session threshold, we examined whetherany two consecutive sessions of the same user had a shorterinterval than 20 minutes. For 22% of all sessions (gener-ated by 13% of all users), an earlier session by the same
51

0.5
0.6
0.7
0.8
0.9
1
1 10 100
CD
F
# of sessions per user ID
(a) Frequency of accesses to OSN sites
0 0.1 0.2 0.3 0.4 0.5 0.6 0.7 0.8 0.9
1
100 101 102 103 104 105 106
CD
F
Total session duration per user ID (s)
(b) Total time spent on OSNs per user
0
0.1 0.2
0.3 0.4
0.5
0.6 0.7
0.8 0.9
1
100 101 102 103 104 105 106
CD
F
Session duration (s)
LinkedInMySpace
OrkutHi5
(c) Session duration per OSN site
Figure 3: Session level characteristics of OSN workload
0
100
200
300
400
500
600
700
800
Mar
/26
Mar
/27
Mar
/28
Mar
/29
Mar
/30
Mar
/31
Apr
/01
Apr
/02
Apr
/03
Apr
/04
Apr
/05
Apr
/06
# U
niqu
e on
line
user
s
Time in intervals of 1 hour
Users onlineOnline for more than 1 hour
Figure 2: Number of online users over time
user ended less than 20 minutes prior (i.e., 22% of sessionswere solely identified by events of closing of web browsers orlogging out). For analysis, we used the session informationthat is identified by the social network aggregator.
Utilizing the session information, we first examined thenumber of concurrent users (i.e., concurrent sessions) thataccessed any of the four OSN sites (Figure 2). The beginningof each day is marked in the horizontal axis. We see a diurnalpattern with strong peaks around 3 PM (in Brazil). At alltimes, there are at least 50 people who are using the socialnetwork aggregator service. At peak times, the number ofconcurrent users surpasses 700, more than a 10-fold increaseover the minimum. Drops in usage on certain days indicateclear weekly patterns, where weekends showed a much lowerusage than weekdays. The strong diurnal pattern in OSNworkloads has also been observed in accessing messages andapplications on Facebook [11] and in the content generationof blog posts, bookmarks, and answers in user generatedcontent (UGC) websites [9, 13].
To see the usage pattern of heavy OSN users, we alsoshow in Figure 2 the number of users who stayed online formore than 1 hour at any given point in time. The dailypeaks for heavy users coincide with the peaks from all users.The total number of online users and the number of heavyusers showed a strong correlation; the Pearson’s correlationcoefficient was 0.84. This indicates that the ratio betweenthe heavy users and all users is oblivious to the time ofday. The gap between the two data points in the figure also
indicates that there are users who login and connect for lessthan an hour throughout the day.
3.2 OSN session characteristicsSo, how ofen and for how long do people connect to OSN
sites? To estimate these quantities, we measure the fre-quency and duration of sessions for each user. We calculatesession duration as the time interval between the first andthe last HTTP requests within a session. This approach al-lows us to infer the duration of any session with two or moreHTTP requests. 87% of all sessions in the dataset containedat least two HTTP requests.
Individuals varied widely in the frequency with which theyaccessed social networks. Figure 3(a) shows the cumulativedistribution function (CDF) of the total number of sessionsper user. The majority of users (63%) accessed the socialnetwork aggregator’s site only once during the 12-day pe-riod. The most frequently logging in user accessed the socialnetwork aggregator’s site on average 4.1 times a day. Thetotal time spent accessing social networks also varied largelyper individual, as shown in Figure 3(b). On one hand, 51%of the users spent no more than 10 minutes at the socialnetwork aggregator’s site over the 12 days. On the otherhand, 14% of the active users spent in total more than anhour and the most active 2% of the users spent more than12 hours (i.e., an average of an hour a day).
Across all users, we did not see a high correlation betweenthe frequency and duration of OSN accesses (correlation co-efficient 0.27). This means that the amount of time a userspends on social networks is not strongly correlated to thespecific number of times that the user logins to social net-works. We also did not see a strong correlation between asession duration and the number of HTTP requests madeduring the session (correlation coefficient 0.16). The corre-lation became relatively stronger when we considered rela-tively short sessions that lasted less than 20 minutes (corre-lation coefficient 0.49). This may suggest that long sessionstend to have idle users. For short sessions, the longer thesession duration, the more activities the session contains.
In addition to widely varying OSN usage per individual,session durations also varied widely across the four OSNsites. Figure 3(c) shows the CDF of the session durationsfor each OSN site. All four OSN sites exhibit a consistentheavy-tailed pattern in their session durations. However,the median session durations vary across OSNs. The me-dian session durations of Orkut, Hi5, and MySpace are 13.4minutes, 2.7 minutes and 24 seconds, respectively, indicat-
52

10−6
10−5
10−4
10−3
10−2
10−1
100
100 101 102 103
CC
DF
Inter−session time (sec.)
Orkut sessionsLogNormal fit
(a) Inter-session time
100
101
102
103
104
105
100 101 102 103
# of
Occ
urre
nces
Session Length (# of Requests)
α = 1.765, R2 = 0.96
(b) Session length
10−6
10−5
10−4
10−3
10−2
10−1
100
100 101 102 103 104 105 106
CC
DF
Inter−request time (sec.)
Orkut requestsLogNormal fit
(c) Inter-request time
Figure 4: Characteristics of Orkut sessions and the best fit functions
ing that users likely engage in a series of activities whenthey connect to these sites. In contrast, the median sessionduration of LinkedIn is very short (3 seconds). In the fol-lowing section, we take a deeper look into which activitiesare popular across these sites.
3.3 Modeling Orkut sessionsTo understand the dynamics of user arrival and depar-
ture processes from a system’s perspective, we measurethe session inter-arrival times. Here, we present a casestudy for Orkut. More formally, we utilize a time seriest(i), i = 1, 2, 3, ... to denote the arrival time of the ith sessionin the trace. The time series a(i) is defined as t(i+ 1)− t(i)and it denotes the inter-arrival time of the ith and i + 1thsessions, where sessions may belong to different users. Fig-ure 4(a) shows the complementary cumulative distributionfunction (CCDF) of a(i), which we fitted to a Lognormaldistribution. The probability distribution function for thelognormal distribution is given by:
f(x) =1
σx√
2πe−(log(x)−µ)2/2σ2 (1)
with parameters µ = 2.245 and σ = 1.133.To characterize the period of time during which a session
is active, we use a time series l(i) which denotes the lengthof the ith session in the trace, defined as the number ofrequests in that session. Figure 4(b) shows the frequencymarginal distribution of l(i) for all sessions identified in theOrkut trace. We observe a heavy-tail distribution; most ofthe sessions involve very few HTTP requests, while a smallnumber of sessions involve a large number of HTTP requests.This implies significant deviations in the number of actions(or clicks) users make in a single session.
The distribution was fitted to a Zipf distribution of theform βx−α with parameters α = 1.765 and β = 4.888. AZipf-like distribution suggests that session lengths are highlyvariable when users connect to online social networks. Suchhigh variability is in line with the patterns seen in web surf-ing. Huberman et al. [15] also found strong variability inthe number of clicks a user exhibits in a session, as well aswhen navigating a given website.
The last variable we characterize at the session layer is theinter-arrival time between requests within a single session.Figure 4(c) displays the CCDF distribution that was fittedto a Lognormal distribution, with parameters µ = 1.789and σ = 2.366. Large inter-arrivals would correspond tousers leaving Orkut pages to spend time on other social
networks or other features of the social network aggrega-tor then returning back to Orkut. On the other hand, smallinter-arrivals would correspond to users constantly interact-ing with the social networking site. We found that the av-erage session lengths and the session starting times are notcorrelated (the Pearson’s correlation coefficient is -0.027).This suggests that the high variability in session length isnot due to diurnal pattern in user behaviors (as was thecase with the number of active clients), but rather it is afundamental property of the interaction of OSN users.
The combination of request inter-arrival time and sessionlength provides an important model for understanding thebehavior of OSN users, for the two quantities reflect theinherent nature of OSN users and are not related to load(e.g., the number of active sessions) or time of the day. Thebest fit distribution functions presented in this section canbe used to generate synthetic (parameterizable) traces, thatmimic actual OSN workloads.
4. THE CLICKSTREAM MODELIn this section we present a comprehensive view of user
behavior in OSNs by characterizing the type, frequency, andsequence of activities users engage in. We developed a newanalysis strategy, which we call the clickstream model, toidentify and describe representative user behaviors in OSNsbased on clickstream data.
The modeling of the system implies two steps. The firststep is to identify dominant user activities in clickstreams.This step involves enumerating all features users engaged inon OSNs at the level of basic unit, which we call user activ-ity. We manually annotated each log entry of the clickstreamdata with the appropriate activity class (e.g., friend invita-tion, browsing photos), based on the information availablein the HTTP header. Because a user can conduct a widerange of activities in a typical OSN site, we further tried togroup semantically similar activities into a category by uti-lizing the webpage structure of OSN sites (i.e., which set ofactivities can be conducted in a single page) and manuallygrouping related activities into categories.
The second step of modeling is to compute the transitionrates between activities. To represent the sequence in whichactivities are conducted, we built a first-order Markov chainof user activities and compute the probability transition be-tween every pair of activity states. To gain a holistic view,we built a Markov chain that describes how users transitionfrom actions in one category to another.
53

Different OSNs provide different features, potentiallyleading to a substantial variation in the set of popular useractivities. Our analysis in this section highlights the simi-larities and differences in user behaviors across four differentsocial networks in the trace. Below we present the full click-stream model only for Orkut, which is the most accessedOSN in the trace.
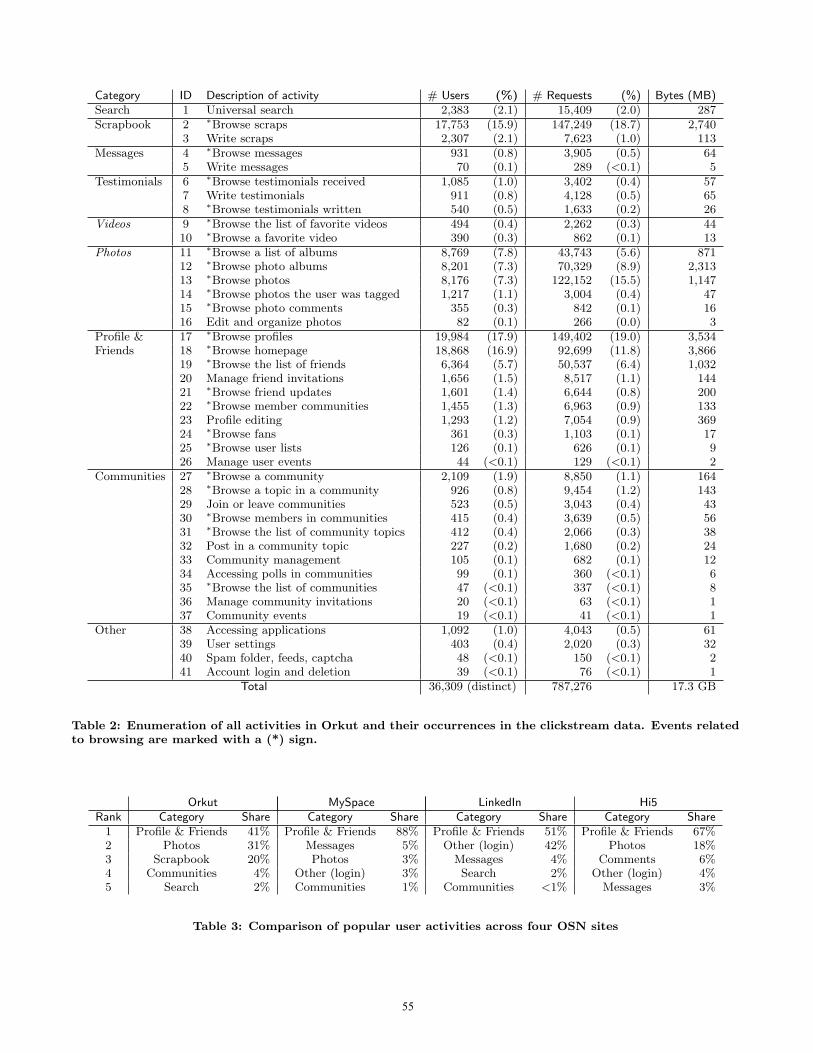
4.1 User activities in OrkutIn the first step of modeling, we identified 41 activities
with at least one HTTP request in the clickstream data.We grouped these activities into the following categories:Search, Scrapbook, Messages, Testimonials, Videos, Photos,Profile & Friends, Communities, and Other. Table 2 displaysthe list of 41 activities with the number and share of userswho engaged in the corresponding activity at least once, thenumber and share of HTTP requests, and the total trafficvolume both received and sent by users.
The activity categories listed in Table 2 represent the fol-lowing features in Orkut, which are described in more detailin [24,32]:
• Universal search (activity 1) allows users to searchfor other people’s profiles, communities, and commu-nity topics (or forums) in the entire Orkut website. Asearch box appears at the upper right corner of ev-ery Orkut page, allowing users to engage in the searchfeature from any page.
• Scrapbook (activities 2 and 3) displays all text mes-sages sent to a given user. Unlike personal messagingor email, Scrapbook entries are public, meaning thatanyone with an Orkut account can read others’ scraps.By default, anyone can leave a scrap in a user’s scrap-book. However, users can set their scrapbook to beprivate, so that only friends or friends of friends in thenetwork can leave a scrap. Table 2 shows that brows-ing and writing scraps is one of the most popular formsof user interaction in Orkut.
• Messages (activities 4 and 5) are a private way tocommunicate. Messages can be sent by anyone. Ta-ble 2 shows that the messages feature is not widelyused in Orkut.
• Testimonials (activities 6 to 8) are a commentarythat users leave about his or her friends. Testimonialscan only be written by friends, but can be viewed byanyone by default. A user can set options so that tes-timonials are kept private, and only the user’s friendscan view the testimonial page. Compared to the inter-action through scrapbook, we see much less interactionthrough testimonials.
• The Videos (activities 9 and 10) and Photos (activ-ity 11–16) categories incorporate all activities in whichusers share multimedia content. The photos categoryis another popular activity in Orkut. A photo can betagged and commented on only by friends. However, aphoto can be viewed by anyone by default. To share avideo, Orkut asks users to first upload their videos toYouTube then to add the video URLs at the Orkut’svideo page.
• Profile & Friends (activities 17–26) represent all ac-tivities in which users manage their own profiles or
visit other people’s profiles. Orkut allows anyone tovisit anyone’s profile, unless a potential visitor is onthe “Ignore List” (a list where a user specifies otherusers who he or she wants to block from any form ofinteraction). Users can customize their profile prefer-ences and can restrict the information that appears ontheir profile page from other users.A user’s homepage displays a short list of updatesabout the user’s friends. The homepage also displaysa short list of friends ordered by login time, where thefirst person is the one who logged in most recently.
• Communities (activities 27–37) can be created byanyone with an Orkut account. Community memberscan post topics, inform other members about an event,ask questions, or play games. Users can freely join anypublic community, while a moderated community re-quires explicit approval. Invitations to join a commu-nity are sent through messages.
The statistics of user activity in Table 2 suggest interest-ing trends in the usage of Orkut. Browsing (marked with a* sign) is the most common user behavior, both in terms ofthe number of users and the request volume. In fact, brows-ing accounted for 92% of all requests! Compared to othernon-browsing activities in the same category, browsing typ-ically engaged 2 to 100 times more users. For instance, thenumber of users who ever browsed messages was 13 timeslarger than those who sent messages. In fact, other behav-iors that require more user engagement were less prominentin the trace; time-intensive behaviors like browse a favoritevideo (activity 10) and participation-oriented behaviors likeposting in a community topic (activity 32) are not popular.
Our findings demonstrate that many Orkut users primar-ily use the service for passive interactions such as browsingupdates from their friends through homepage, profile pages,and scrapbook, while occasionally engaging in more activeinteraction such as writing scraps, searching, editing photos,and accessing applications.
4.2 Comparison of user activity across OSNsTo get perspective on how user behaviors vary across dif-
ferent social networks, we repeated the analysis in Table 2for other social networks that appear in the trace (i.e., MyS-pace, LinkedIn, and Hi5). All four OSNs exhibited a com-mon pattern in that the most popular activity was brows-ing profiles. Some activities, however, could only be ob-served in a subset of these four networks, because the foursocial networks provided different features to users. For ex-ample, MySpace uniquely provided Blogs and News pagesand LinkedIn uniquely provided Jobs and Companies pages.Also video and photo features are not supported in LinkedIn.
Table 3 displays for all four social networks the top fivecategories based on the number of HTTP requests and theshare of corresponding HTTP requests. The statistics arenormalized for each social network, so that the sum of shareof all activity categories is 100% for each social network.
We make several observations. First, the Profile & Friendscategory is the most popular across all social networks.Users commonly browsed profiles, homepage, and the listof friends across all four networks.
Second, LinkedIn shows a much lower degree of interactionamong users using messages than Orkut. Only 4% of therequests in LinkedIn are related to messaging between users.
54
Category ID Description of activity # Users (%) # Requests (%) Bytes (MB)Search 1 Universal search 2,383 (2.1) 15,409 (2.0) 287Scrapbook 2 ∗Browse scraps 17,753 (15.9) 147,249 (18.7) 2,740
3 Write scraps 2,307 (2.1) 7,623 (1.0) 113Messages 4 ∗Browse messages 931 (0.8) 3,905 (0.5) 64
5 Write messages 70 (0.1) 289 (<0.1) 5Testimonials 6 ∗Browse testimonials received 1,085 (1.0) 3,402 (0.4) 57
7 Write testimonials 911 (0.8) 4,128 (0.5) 658 ∗Browse testimonials written 540 (0.5) 1,633 (0.2) 26
Videos 9 ∗Browse the list of favorite videos 494 (0.4) 2,262 (0.3) 4410 ∗Browse a favorite video 390 (0.3) 862 (0.1) 13
Photos 11 ∗Browse a list of albums 8,769 (7.8) 43,743 (5.6) 87112 ∗Browse photo albums 8,201 (7.3) 70,329 (8.9) 2,31313 ∗Browse photos 8,176 (7.3) 122,152 (15.5) 1,14714 ∗Browse photos the user was tagged 1,217 (1.1) 3,004 (0.4) 4715 ∗Browse photo comments 355 (0.3) 842 (0.1) 1616 Edit and organize photos 82 (0.1) 266 (0.0) 3
Profile & 17 ∗Browse profiles 19,984 (17.9) 149,402 (19.0) 3,534Friends 18 ∗Browse homepage 18,868 (16.9) 92,699 (11.8) 3,866
19 ∗Browse the list of friends 6,364 (5.7) 50,537 (6.4) 1,03220 Manage friend invitations 1,656 (1.5) 8,517 (1.1) 14421 ∗Browse friend updates 1,601 (1.4) 6,644 (0.8) 20022 ∗Browse member communities 1,455 (1.3) 6,963 (0.9) 13323 Profile editing 1,293 (1.2) 7,054 (0.9) 36924 ∗Browse fans 361 (0.3) 1,103 (0.1) 1725 ∗Browse user lists 126 (0.1) 626 (0.1) 926 Manage user events 44 (<0.1) 129 (<0.1) 2
Communities 27 ∗Browse a community 2,109 (1.9) 8,850 (1.1) 16428 ∗Browse a topic in a community 926 (0.8) 9,454 (1.2) 14329 Join or leave communities 523 (0.5) 3,043 (0.4) 4330 ∗Browse members in communities 415 (0.4) 3,639 (0.5) 5631 ∗Browse the list of community topics 412 (0.4) 2,066 (0.3) 3832 Post in a community topic 227 (0.2) 1,680 (0.2) 2433 Community management 105 (0.1) 682 (0.1) 1234 Accessing polls in communities 99 (0.1) 360 (<0.1) 635 ∗Browse the list of communities 47 (<0.1) 337 (<0.1) 836 Manage community invitations 20 (<0.1) 63 (<0.1) 137 Community events 19 (<0.1) 41 (<0.1) 1
Other 38 Accessing applications 1,092 (1.0) 4,043 (0.5) 6139 User settings 403 (0.4) 2,020 (0.3) 3240 Spam folder, feeds, captcha 48 (<0.1) 150 (<0.1) 241 Account login and deletion 39 (<0.1) 76 (<0.1) 1
Total 36,309 (distinct) 787,276 17.3 GB
Table 2: Enumeration of all activities in Orkut and their occurrences in the clickstream data. Events relatedto browsing are marked with a (*) sign.
Orkut MySpace LinkedIn Hi5Rank Category Share Category Share Category Share Category Share
1 Profile & Friends 41% Profile & Friends 88% Profile & Friends 51% Profile & Friends 67%2 Photos 31% Messages 5% Other (login) 42% Photos 18%3 Scrapbook 20% Photos 3% Messages 4% Comments 6%4 Communities 4% Other (login) 3% Search 2% Other (login) 4%5 Search 2% Communities 1% Communities <1% Messages 3%
Table 3: Comparison of popular user activities across four OSN sites
55

0
0.1
0.2
0.3
0.4
0.5
0.6
0.7
0.8
0.9
1
0−1min 1−10min 10−20 min 20−105min
Fra
ctio
n of
tim
eProfile & Friends
ScrapsPhotos
Communities
(a) Probability of dominant activities
0
0.005
0.01
0.015
0.02
0.025
0−1min 1−10min 10−20 min 20−105min
Fra
ctio
n of
tim
e
SearchTestimonial
VideosMessages
(b) Probability of subdominant activities
Figure 5: Probability of the user activity as a function of session duration (error bars indicate 95% confidenceinterval)
Because Linkedin is a network used mainly for professionalnetworking (e.g., finding jobs or employees), it is natural toexpect that users primarily browse profiles and create linkswith each other, rather than exchanging messages.
Third, MySpace showed a different profile from Orkut, de-spite the similarity of its service to that provided by Orkut.MySpace showed a much lower interaction through Photos.A detailed look into the data reveals that 90% of the MyS-pace users also accessed one of the other three social net-works (75% accessed Orkut). Thus, it seems that users whoaccessed MySpace using the social network aggregator useOrkut as their primary social network and access MySpaceto keep in touch with friends that use only MySpace.
Fourth, the popular user activities in Hi5 were similar tothose of Orkut: the most frequent user activity involvedbrowsing friends’ updates through Profile & Friends andPhotos. The next most popular user activity in both OSNswas a form of message interaction among users: Scrapbookin Orkut and Comments and Messages in Hi5. We expectto see similar usage trends for other social networks thatpossess similar service characteristics to Orkut.
4.3 Probability of activity over timeWe next investigated whether there is any correlation be-
tween the occurrence of a particular activity and session du-ration. To check for such a correlation, we categorized usersessions into four non-overlapping classes based on their ses-sion durations: (a) less than 1 minute, (b) 1 to 10 minutes,(c) 10 to 20 minutes, and (d) 20 minutes or longer. For ses-sions belonging to each of these intervals, we examined theaverage proportion of the total session duration that a userspent on each activity.
Figure 5 shows the fraction of time spent on each activityas a function of session duration. The results are shown intwo separate plots to more easily exhibit the trends for bothdominant and subdominant activities. We found two keypatterns. First, irrespective of session duration, users spentthe most time on Profile & Friends and Scrapbook activi-ties. In very short sessions (i.e., less than 1 minute), usersspent 90% of their time on these activities. However, even
for a long session (i.e., 20 minutes or longer), the two activ-ities accounted for 75% of the total. Second, the remainingcategories of activities became more prevalent for longer ses-sions. The fraction of time spent consuming media content(i.e., Photos and Videos activities) increased by a factor of2 when comparing sessions shorter than 1 minute to thoselonger than 20 minutes. The probability of seeing Commu-nity activity also increased with the session duration.
4.4 Transition from one activity to anotherIn the second step of modeling, we constructed a first-
order Markov chain of user activity based on the sequenceof activities seen from all sessions. We added two abstractstates, initial and final, which we appended to the sequenceof requests at the beginning and the end of the user sessions,respectively.
Figure 6(a) shows the transition probability between allpairs of activities. A color pixel at (x,y) represents the prob-ability of transition from activity x in the horizontal axis toactivity y in the vertical axis. Activity IDs in the figure areidentical to the activity IDs in Table 2. We also visuallyshow the boundaries for categories. Darker pixels indicatehigher transition probability. For visual clarity, probabilitiesbelow 0.01 are shown as zero probability in the figure.
When users log in to the social network aggregator site,they are immediately exposed to a small selection of updatesfrom all social networks. Users can then click on any ofthe displayed web objects or the logo of a social networkto further browse a given social network. These events areshown as dark pixels on the first column in Figure 6(a). Forexample, x=“Start” and y=“browsing homepage” illustratesthe case when a user clicked on the logo of a social networkand the homepage of the social network was displayed. Atypical session started with one of the following activities:browsing scrap, browsing profile, and browsing homepage.
Once a user engaged in a particular activity, the user waslikely to repeat the same activity. This is shown by a stronglinear trend in y = x. For instance, after browsing onephoto, a user was likely to immediately browse other photos.In total, 67% of the user activities were repeated.
56

Activity at time t
Act
ivity
at t
ime
t+1
StartSearch
Scrapbook
Message
Testimonial
Video
Photo
Profile & Friends
Community
Other
5 10 15 20 25 30 35 40
5
10
15
20
25
30
35
40
Tra
nsiti
on p
roba
bilit
y
0.8
0.7
0.6
0.5
0.4
0.3
0.2
0.1
−0
2: browse scraps
18: browse home
17: browse profile
(a) User behaviors at the level of activities
(b) User behaviors at the level of categories
Figure 6: Transition probability in the clickstream model for Orkut
57

Next there were more transitions of activities within thesame category (77%) than across categories (23%). Thismeans that users typically conduct a sequence of activitiesthat are conceptually related. For instance, a user is likely tobrowse photos immediately after browsing the list of photoalbums, rather than after conducting a less related activitylike accessing applications.
We also notice that popular activities like browsing home-page, browsing profiles, and browsing scraps display charac-teristic horizontal stripes in the graph. This is because everyOrkut page embeds hyperlinks to a user’s homepage, profilepage, and scrapbook page. This suggests that providing ameans for users to access a particular feature easily can mo-tivate users to use the given feature frequently.
4.5 Transition from one category to anotherFinally we examined the sequence of user activities at the
level of categories (Figure 6(b)). Again we added two syn-thetic states, Initial and Final, at the beginning and the endof each session. Nodes now represent categories and directededges represent the transition between two categories. Edgeswith probability smaller than 4% were removed to reduce thefigure complexity. The sum of all outgoing probabilities (in-cluding the omitted edges) for each state is 1.0. Comparedto Figure 6(a), user behaviors at the category level providea more holistic view of OSN usage.
We observe that most users initiated their sessions fromthe Profile & Friends, Scrapbook, or Photos category, asmentioned earlier. We also observe that self loops arepresent in almost all states. For example, one Communitiesactivity was followed by another Community activity witha probability of 0.82. Similarly, Photos activities showedhigh repetition with a probability of 0.86. Repetition alsooccurred in Search (probability 0.71). Repetition in Scrap-book was related to users replying to received scraps afterbrowsing them. In Orkut, users can directly reply to an ex-isting (received) scrap from one’s own Scrapbook page. Wefound that 65% of write scrap events (activity 3) immedi-ately followed browsing scrap events (activity 2). Except forself loops, Profile & Friends was the most common precedingstate for most activities.
5. SOCIAL INTERACTIONS IN ORKUTOne crucial aspect of OSNs is the wide range of features
that support communication between users. In this section,we investigate how users interact with each other throughthe various features OSNs provide.
5.1 OverviewUnderstanding social interactions has been of great inter-
est in various research fields like sociology, economy, politicalscience, and marketing. Until recently, obtaining large-scaledata was one of the key challenges in studying social in-teractions. Nowadays, we get around this challenge by thewealth of OSN data available on the Internet. A few stud-ies have used publicly crawled OSN data (e.g., comments,testimonials) to characterize social interactions [8,14,30,33].Although these initial studies have identified several impor-tant properties of social interaction, there are behaviors ofusers that cannot be measured with datasets that containonly visible activity.
One such activity is browsing, which, as demonstrated inthe previous section, is one of the most frequent activities
in OSNs.1 As opposed to “visible” interactions that are in-ferred from crawled data like writing a scrap, browsing afriend’s web content can be considered “silent” social inter-action. Although visible and silent interactions serve differ-ent purposes, both are interesting for the understanding thesocial interaction behaviors of users.
In this section we provide a complete view of user inter-action in social networks, by considering both visible inter-action and silent interaction. Our goal is two-fold: (a) Wewould like to know what fraction of user interaction is silent,compared to visible. If we consider visiting a friend’ profileor photo pages as social interaction among users, how muchincrease would we observe in the number of friends a usertypically interacts with? We highlight the potential bias instudies of user interactions using only visible data. (b) Weare interested in knowing the interaction patterns amongusers along the social graph distance. In particular, howoften do users visit their friends’ profiles or even traversemultiple hops to visit the profile of friend of a friend?
5.2 Interaction over social network distanceWe only considered explicitly visiting another user’s page
to be silent user interaction. It is possible that a user cansilently “interact” with a friend by viewing the short list ofupdates about that friend that are automatically shown onthe user’s own homepage. However, we do not count theseviews as interaction, because we cannot be certain whethera user noticed these updates.2 For example, a user may finda thumbnail of photo update from a friend at her homepage.Only when the user clicks on the photo (thereby visiting thefriend’s photo page), do we then consider the event as a validsocial interaction with a 1-hop friend.
To gain a comprehensive understanding on the social be-havior of a user, we needed an essential piece of information:the list of friends of a given user. The clickstream datasetdoes not include information about the list of friends. There-fore, as described in Section 2.3, we gathered informationabout the list of friends for all users in the workload traceby crawling the Orkut website.
5.2.1 Webpage access patternsTo investigate the patterns of interaction among users,
we first examined how often users visit their friends’ pages,compared to visiting their own. Not all accesses in the tracewere related to interaction among users. Therefore, we fo-cused on the following activities as a form of user interaction:scrapbook, messages, testimonials, videos, photos, and pro-file & friends. This list comprises activities from 2 to 26 inTable 2. We excluded all activities related to search, com-munities, and others in Table 2.
Figure 7 shows, for each category of user activity, thefraction of times a user was accessing one’s own page (de-noted self in the figure), a page of an immediate friend(denoted friend), or a page of a non-immediate friend (de-noted 2+hops). The result for Messages is omitted, becauseusers can only access their own Messages page. Unless auser has explicitly restricted access, Orkut users can browse
1Most social networks do not log browsing events of users.However, one exception is Orkut. In Orkut, the list of “re-cent visitors” to every profile page is shown. Users can alsoturn this option off and hide their browsing patterns.2User studies using eye tracking devices will be able to dis-tinguish whether users noticed the exposed content or not.
58

Scrap Testimonial Video Photo Profile 0
25
50
75
100
Self
Friend
2+hopsUse
r ac
tivity
(%
)
Figure 7: Webpage accesses along the social network distance
Scrap Message Testimonial0
25
50
75
100
Use
r ac
tivity
(%
)
2+hops
Friend Friend(100%)
Friend
Self(<1%)
2+hops
Figure 8: Interaction in writing
any other user’s pages containing scrapbook, testimonials,video, photo, and profile. However, the bar chart showsthat users mostly accessed pages of their own or their im-mediate friends; 80% of all accesses remain within a 1-hopneighborhood in the social network topology.
We examined each of the activity categories in detail.Users most frequently accessed their own pages when itcomes to scrapbook and testimonials. Yet, users did visitscrapbook and testimonial pages of their 1-hop friends andread what messages are written about their friends. With asmall probability, users also visited beyond the 1-hop neigh-borhood. In total, Orkut users accessed their friends’ pagesmore frequently (59%)3 than their own pages. When vis-iting friends’ pages, Orkut users not only interacted withimmediate friends, but also had significant exposure to non-immediate friends (22%=13/59).
Focusing on each category of interaction, Table 2 showsthat users accessed their own video pages as often as theyaccessed their friends’ video pages. On the other hand, inaccessing photos, which is a popular activity in Orkut, userswere more likely to access their friends’ photo pages thantheir own. Accessing profile pages was well-divided amongone’s own, immediate friends, and non-immediate friends;20% of the browsed profiles were 2 or more hops away.
Next we focused on visible interactions and examinedwhich friends users interacted with. We considered the fol-lowing three visible activities: write scraps (activity 3), writemessages (activity 5), and write testimonials (activity 7), be-cause for these activities we could determine the interactionpartner from the URL of the trace.
Figure 8 shows the division of the times when a user wroteto oneself, a 1-hop friend, or a 2 or more hop away friend.When using the scrapbook feature, users mostly interactedwith immediate friends. Self posts were rare (0.5%), butcould serve as a broadcast message to everyone who visitsthe scrapbook. Interestingly, 10% of scraps were sent tousers that are 2 or more hops away. On the other hand,users did not interact much with immediate friends throughMessages. Instead, we observed frequent interaction withnon-immediate friends through Messages (76%). Testimo-nials were only sent to immediate friends, as written in theOrkut policy. We discuss the implications of these findingsin the following section.
3This probability is computed as the count of activities at1-hop divided by the total occurrences of all activities.
5.2.2 What leads users to visit other people’s pages?Having studied the frequency at which users access their
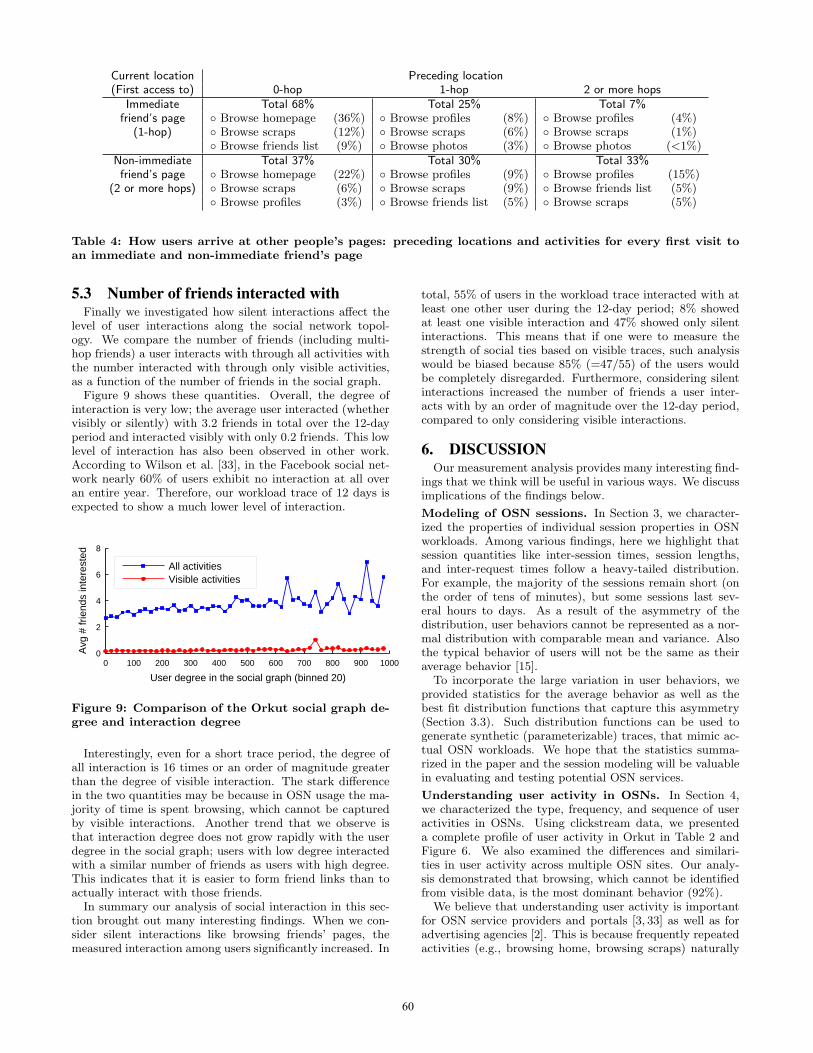
friends’ pages, we now take a closer look at how a user nav-igates from one friend’s page to another. Particularly, weare interested in understanding what activities lead users tovisit a page of a friend or a non-friend. We performed the fol-lowing analysis. Each time a user visited a page of a friend,we examined which preceding page the user was at: one’sown page, an immediate friend’s page, or a non-immediatefriend’s page? Table 4 shows the fraction of preceding loca-tions for every first access to a friend’s page in each session.In addition to the navigation statistics, Table 4 also showsthe list of top activities that preceded the navigation event.
The majority of accesses (68%) to an immediate friend’swebpage originated from browsing one’s own webpage (thefirst row of Table 2). The remaining accesses occurred whenthe user was navigating the social network; accesses to animmediate friend’s webpage were followed by browsing ofanother immediate friend’s webpage (25%) or browsing ofa non-immediate friend’s webpage (7%). When it comesto visiting a non-immediate friend’s webpage (the secondrow of Table 2), the preceding location of the user was welldistributed across 0-hop, 1-hop, and 2 or more hops.
Interestingly, the most popular activity that leads a userto an immediate or non-immediate friend’s webpage isbrowsing one’s own homepage. As described in Section 4.1, auser’s homepage contains a short list of updates from friendsas well as a list of the subset of friends who recently loggedin. Such updates can contain links to non-immediate friendswhen they interacted with mutual friends through photocomments, testimonials, or applications. Therefore, updatesfrom friends can also drive users to visit the webpage of afriend of a friend.
Another interesting observation we make is the high frac-tion of accesses that originated from an immediate friend’swebpage, which accounted for 25% of the accesses to an-other immediate friend’s webpage and 30% of the accessesto a non-immediate friend’s webpage (the third column ofTable 2). This reinforces the previous findings that users insocial networks find new content and contacts through their1-hop friends [4,5,28]. Browsing an immediate friend’s pro-file was the most common gateway that led users from onefriend to another.
Lastly, we note that browsing scraps (activity 2) appearsin the top three activities in all the rows of Table 4. Thismay mean that Orkut users are keen on reading other users’scrapbook content and also are curious about checking outnew contacts that they encounter through such activity.
59
Current location Preceding location(First access to) 0-hop 1-hop 2 or more hops
Immediate Total 68% Total 25% Total 7%friend’s page ◦ Browse homepage (36%) ◦ Browse profiles (8%) ◦ Browse profiles (4%)
(1-hop) ◦ Browse scraps (12%) ◦ Browse scraps (6%) ◦ Browse scraps (1%)◦ Browse friends list (9%) ◦ Browse photos (3%) ◦ Browse photos (<1%)
Non-immediate Total 37% Total 30% Total 33%friend’s page ◦ Browse homepage (22%) ◦ Browse profiles (9%) ◦ Browse profiles (15%)
(2 or more hops) ◦ Browse scraps (6%) ◦ Browse scraps (9%) ◦ Browse friends list (5%)◦ Browse profiles (3%) ◦ Browse friends list (5%) ◦ Browse scraps (5%)
Table 4: How users arrive at other people’s pages: preceding locations and activities for every first visit toan immediate and non-immediate friend’s page
5.3 Number of friends interacted withFinally we investigated how silent interactions affect the
level of user interactions along the social network topol-ogy. We compare the number of friends (including multi-hop friends) a user interacts with through all activities withthe number interacted with through only visible activities,as a function of the number of friends in the social graph.
Figure 9 shows these quantities. Overall, the degree ofinteraction is very low; the average user interacted (whethervisibly or silently) with 3.2 friends in total over the 12-dayperiod and interacted visibly with only 0.2 friends. This lowlevel of interaction has also been observed in other work.According to Wilson et al. [33], in the Facebook social net-work nearly 60% of users exhibit no interaction at all overan entire year. Therefore, our workload trace of 12 days isexpected to show a much lower level of interaction.
0 100 200 300 400 500 600 700 800 900 10000
2
4
6
8
User degree in the social graph (binned 20)
Avg
# fr
iend
s in
tere
sted
All activitiesVisible activities
Figure 9: Comparison of the Orkut social graph de-gree and interaction degree
Interestingly, even for a short trace period, the degree ofall interaction is 16 times or an order of magnitude greaterthan the degree of visible interaction. The stark differencein the two quantities may be because in OSN usage the ma-jority of time is spent browsing, which cannot be capturedby visible interactions. Another trend that we observe isthat interaction degree does not grow rapidly with the userdegree in the social graph; users with low degree interactedwith a similar number of friends as users with high degree.This indicates that it is easier to form friend links than toactually interact with those friends.
In summary our analysis of social interaction in this sec-tion brought out many interesting findings. When we con-sider silent interactions like browsing friends’ pages, themeasured interaction among users significantly increased. In
total, 55% of users in the workload trace interacted with atleast one other user during the 12-day period; 8% showedat least one visible interaction and 47% showed only silentinteractions. This means that if one were to measure thestrength of social ties based on visible traces, such analysiswould be biased because 85% (=47/55) of the users wouldbe completely disregarded. Furthermore, considering silentinteractions increased the number of friends a user inter-acts with by an order of magnitude over the 12-day period,compared to only considering visible interactions.
6. DISCUSSIONOur measurement analysis provides many interesting find-
ings that we think will be useful in various ways. We discussimplications of the findings below.
Modeling of OSN sessions. In Section 3, we character-ized the properties of individual session properties in OSNworkloads. Among various findings, here we highlight thatsession quantities like inter-session times, session lengths,and inter-request times follow a heavy-tailed distribution.For example, the majority of the sessions remain short (onthe order of tens of minutes), but some sessions last sev-eral hours to days. As a result of the asymmetry of thedistribution, user behaviors cannot be represented as a nor-mal distribution with comparable mean and variance. Alsothe typical behavior of users will not be the same as theiraverage behavior [15].
To incorporate the large variation in user behaviors, weprovided statistics for the average behavior as well as thebest fit distribution functions that capture this asymmetry(Section 3.3). Such distribution functions can be used togenerate synthetic (parameterizable) traces, that mimic ac-tual OSN workloads. We hope that the statistics summa-rized in the paper and the session modeling will be valuablein evaluating and testing potential OSN services.
Understanding user activity in OSNs. In Section 4,we characterized the type, frequency, and sequence of useractivities in OSNs. Using clickstream data, we presenteda complete profile of user activity in Orkut in Table 2 andFigure 6. We also examined the differences and similari-ties in user activity across multiple OSN sites. Our analy-sis demonstrated that browsing, which cannot be identifiedfrom visible data, is the most dominant behavior (92%).
We believe that understanding user activity is importantfor OSN service providers and portals [3, 33] as well as foradvertising agencies [2]. This is because frequently repeatedactivities (e.g., browsing home, browsing scraps) naturally
60
serve as good targets for advertisements and the sequenceof activities can be analyzed to improve the website de-sign. One application of our analysis is that an OSN serviceprovider may consider providing a personalized web interfacefor users based on the users’ activity profiles. For example,a user login page can be reorganized so that frequently re-peated activities are more easily accessible. OSN serviceproviders may also use aggregate patterns in clickstreamsto identify users with similar behaviors (e.g., belonging tothe same communities, possessing similar profile description)and recommend popular content within the site.
Interaction over the social graph. In Section 5 we usedboth the clickstream data and the social graph topology tostudy how users interact with friends in OSNs. Among vari-ous findings, we observed that Orkut users not only interactwith 1-hop friends, but also have substantial exposure tofriends that are 2 or more hops away (22%). This exposureto friends’ pages has significant implication for informationpropagation in OSNs: OSNs exhibit “small-world” proper-ties [1, 21, 33], which means that the network structure hasa potential to spread information quickly and widely. Ourobservation highlighted that users actively visiting immedi-ate and non-immediate friends’ pages serves as an empiricalprecondition for word-of-mouth-based information propaga-tion.
Especially when it comes to rich media content like videosand photos, more than 80% of content was found through a1-hop friend (Figure 7). This finding reinforces some of therecent studies that emphasize the impact of word-of-mouth-like information propagation through friends in social net-works (the so called social cascade) [4,5,28]. As OSN trafficis expected to grow rapidly [23], the patterns of social in-teraction and information flow can be valuable in designingthe next-generation Internet infrastructure and content dis-tribution systems [16, 26]. For instance, by tracking downthe patterns of social cascade in OSNs and correlating themwith information about the geographical locations of users,we can make an educated guess about the geographical re-gions to which particular piece of content will likely spread.Such predictions will allow for the design of efficient contentdistribution systems.
7. RELATED WORKThere are a rich set of studies on analyzing the workloads
of Web 2.0 services. Mislove et al. [21] studied graph the-oretic properties of OSNs, based on the friends network ofOrkut, Flickr, LiveJournal, and YouTube. They confirmedthe power-law, small-world, and scale-free properties of theseOSN services. Ahn et al. [1] studied the network propertiesof Cyworld, a popular OSN in South Korea. They com-pared the explicit friend relationship network with the im-plicit network created by messages exchanged on Cyworld’sguestbook. They found similarities in both networks: thein-degree and out-degree were close to each other and socialinteraction through the guestbook was highly reciprocal.
Liben-Nowell et al. [19] analyzed the geographical loca-tion of LiveJournal users and found a strong correlation be-tween friendship and geographic proximity. Krishnamurthyet al. [17] analyzed an OSN formed by users on Twitter.They examined geographical spread of Twitter usage andalso analyzed user behavior in this environment. Hubermanet al. [14] showed that Twitter users have a small number
of friends compared to the number of followers they declare.Golder et al. [11] analyzed temporal access and social pat-terns in Facebook. They analyzed the message header ex-changed by Facebook users, revealing periodic patterns interms of messages exchanged on that network. Gjoka etal. [10] have studied application usage workloads in Face-book and the popularity of applications. Nazir et al. [22]similarly analyzed application characteristics in Facebook,by developing and launching their own applications.
Wilson et al. [33] proposed the use of interaction graphsto impart meaning to online social links by quantifying userinteractions. They analyzed interaction graphs derived fromFacebook user traces and showed that they exhibit signifi-cantly lower levels of the “small-world” properties shown intheir social graph counterparts. Valafar et al. [29] conducteda measurement study of the Flickr OSN and showed thatonly a small fraction of users in the main component of thefriendship graph is responsible for the vast majority of userinteractions.
Burke et al. [3] studied user motivations for contribut-ing in social networking sites, based on server log data fromFacebook. They found that newcomers who see their friendscontributing go on to share more content themselves. Fur-thermore, those who were initially inclined to contribute,receiving feedback and having a wide audience, were alsopredictors of increased sharing. Chapman and Lahav [6]conducted survey interviews and analysis of web browsingpatterns of 36 users of four different nationalities to examineethnographical differences in the usage of OSNs.
Compared to the studies above, we focused on characteriz-ing the workload of all user activities, beyond use of a singleapplication and including all silent activities like browsing.
8. CONCLUSIONIn this paper we presented a thorough characterization
of social network workloads, based on detailed clickstreamdata summarizing HTTP sessions over a 12-day period of37,024 users. The data were collected from a social networkaggregator website, which after a single authentication en-ables users to connect to multiple social networks: Orkut,MySpace, Hi5, and LinkedIn. We analyzed the statisticaland distributional properties of most of the important vari-ables of OSN sessions. We presented the clickstream modelto characterize user behavior in online social networks.
Our study uncovered a number of interesting findings,some of which are related to the specific nature of social net-working environments. Many previous social network stud-ies reconstructed user actions from “visible” artifacts, suchas comments and testimonials. Using the clickstream model,we underscored the presence of “silent” user actions, such asbrowsing a profile page or viewing a photo of a friend. Theseresults led us to classify social interactions into two groups,composed of publicly visible activities and silent activities,respectively.
Our current and future work is focused on leveraging theresults presented in this paper along three main directions.
First, we would like to to investigate the impact of friendson the behavior of user of social networks. The success of asocial networking site is directly associated with the qualityof content users share. Thus, in order to design social net-work services, it is key to understand factors that motivateusers to join communities, become fans of something, andupload or retrieve media content.
61
Second, we are interested in understanding content dis-tribution patterns across multiple OSNs. We would like toknow to what extent content is shared across OSN sites aswell as explore the impact of age, content, and geographicallocality in object popularity. Given that users participate inmultiple social networks, we expect that a user may sharethe same content across multiple sites. Answering thesequestions will let us explore opportunities for efficient con-tent distribution, for example, caching and pre-fetching, aswell as advertisement and recommendation strategies. Forinstance, certain types of content may be popular either ina specific geographical region or in a single social network,in which case advertisement algorithms should be based onthis characteristic. On the other hand, if content is eas-ily replicated across sites, then we can detect rising contentfrom one social networking site and implant it into anothersite.
Lastly, based on our analysis, we plan to build a socialnetwork workload generator that incorporates many of ourfindings, including the statistical distributions of sessionsand requests and the Markov models for user behavior.
AcknowledgmentsWe are grateful to the social network aggregator for provid-ing us with the clickstream data. We sincerely thank Kr-ishna Gummadi, Rodrigo Rodrigues, Hamed Haddadi, RoseHoberman, and the anonymous reviewers, for their valuablecomments and suggestions.
9. REFERENCES[1] Y.-Y. Ahn, S. Han, H. Kwak, S. Moon, and H. Jeong.
Analysis of topological characteristics of huge onlinesocial networking services. In WWW, 2007.
[2] B. A. Williamson. Social network marketing: adspending and usage. EMarketer Report, 2007.http://tinyurl.com/2449xx.
[3] M. Burke, C. Marlow, and T. Lento. Feed me:Motivating newcomer contribution in social networksites. In ACM CHI, 2009.
[4] M. Cha, A. Mislove, B. Adams, and K. Gummadi.Characterizing Social Cascades in Flickr. In ACMSIGCOMM WOSN, 2008.
[5] M. Cha, A. Mislove, and K. P. Gummadi. Ameasurement-driven analysis of informationpropagation in the Flickr social network. In WWW,2009.
[6] C. N. Chapman and M. Lahav. Internationalethnographic observation of social networking sites. InACM CHI Extended Abstracts, 2008.
[7] P. Chatterjee, D. L. Hoffman, and T. P. Novak.Modeling the clickstream: implications for web-basedadvertising efforts. Marketing Science, 2003.
[8] H. Chun, H. Kwak, Y.-H. Eom, Y.-Y. Ahn, S. Moon,and H. Jeong. Online social networks: Sheer volumevs social interaction: a case study of Cyworld. InACM IMC, 2008.
[9] F. Duarte, B. Mattos, A. Bestavros, V. Almeida, andJ. Almeida. Traffic characteristics and communicationpatterns in blogosphere. In AAAI ICWSM, 2007.
[10] M. Gjoka, M. Sirivianos, A. Markopoulou, andX. Yang. Poking Facebook: characterization of OSNapplications. In ACM SIGCOMM WOSN, 2008.
[11] S. Golder, D. Wilkinson, and B. Huberman. Rhythmsof social interaction: messaging within a massiveonline network. In ICCT, 2007.
[12] Google OpenSocial.http://code.google.com/apis/opensocial/.
[13] L. Guo, E. Tan, S. Chen, X. Zhang, and Y. (E.) Zhao.Analyzing patterns of user content generation inonline social networks. In ACM SIGKDD, 2009.
[14] B. Huberman, D. Romero, and F. Wu. Social networksthat matter: Twitter under the microscope. FirstMonday, 2009.
[15] B. A. Huberman, P. L. T. Pirolli, J. E. Pitkow, andR. M. Lukose. Strong regularities in world wide websurfing. Science, 1998.
[16] B. Krishnamurthy. A measure of online socialnetworks. In COMSNETS, 2009.
[17] B. Krishnamurthy, P. Gill, and M. Arlitt. A few chirpsabout Twitter. In ACM SIGCOMM WOSN, 2008.
[18] J. Leskovec, L. A. Adamic, and B. A. Huberman. Thedynamics of viral marketing. ACM TWEB, 2007.
[19] D. Liben-Nowell, J. Novak, R. Kumar, P. Raghavan,and A. Tomkins. Geographic routing in socialnetwork. PNAS, 2005.
[20] MaxMind. GeoIP Database.http://www.maxmind.com/app/ip-location.
[21] A. Mislove, M. Marcon, K. P. Gummadi, P. Druschel,and B. Bhattacharjee. Measurement and analysis ofonline social networks. In ACM IMC, 2007.
[22] A. Nazir, S. Raza, and C.-N. Chuah. UnveilingFacebook: a measurement study of social networkbased applications. In ACM IMC, 2008.
[23] Nielsen Online Report. Social networks & blogs now4th most popular online activity, 2009.http://tinyurl.com/cfzjlt.
[24] Orkut Help.http://www.google.com/support/orkut/.
[25] R. King. When your social sites need networking,BusinessWeek, 2007. http://tinyurl.com/o4myvu.
[26] P. Rodriguez. Web infrastructure for the 21st century.WWW’09 Keynote, 2009.http://tinyurl.com/mmmaa7.
[27] S. Schroeder. 20 ways to aggregate your socialnetworking profiles, Mashable, 2007.http://tinyurl.com/2ceus4.
[28] N. Sastry, E. Yoneki, and J. Crowcroft. Buzztraq:predicting geographical access patterns of socialcascades using social networks. In ACM EuroSys SNSWorkshop, 2009.
[29] M. Valafar, R. Rejaie, and W. Willinger. Beyondfriendship graphs: a study of user interactions inFlickr. In ACM SIGCOMM WOSN, 2009.
[30] B. Viswanath, A. Mislove, M. Cha, and K. P.Gummadi. On the evolution of user interaction inFacebook. In ACM SIGCOMM WOSN, 2009.
[31] D. J. Watts and J. Peretti. Viral marketing for thereal world. Harvard Business Review, 2007.
[32] Wikipedia. Orkut.http://en.wikipedia.org/wiki/Orkut.
[33] C. Wilson, B. Boe, A. Sala, K. P. N. Puttaswamy, andB. Y. Zhao. User interactions in social networks andtheir implications. In ACM EuroSys, 2009.
62