charging futures forumchargingfutures.com/media/1204/may-forum-deck-final_publication.pdf ·...
TRANSCRIPT

Charging Futures Forum23 May 2018

Welcome
Louise Schmitz, NG ESO - Lead Secretariat

Welcome
Frances Warburton, Ofgem - Forum Chair

Objectives for the day
➢ Learn about recent developments of the Targeted Charging Review, including modelling work
➢ Learn about the Settlement Reform Project
➢ Learn about the Task Forces’ final report on Access rights and Forward-looking charges, and Baringa’s work on the case for change
➢ Ask your questions to Ofgem and Task Force members
➢ Contribute your thoughts on all three projects, including on interactions between the three projects
4

Do we have the original image so that we could lose the grey background on this.?
The Charging Futures ecosystem
5
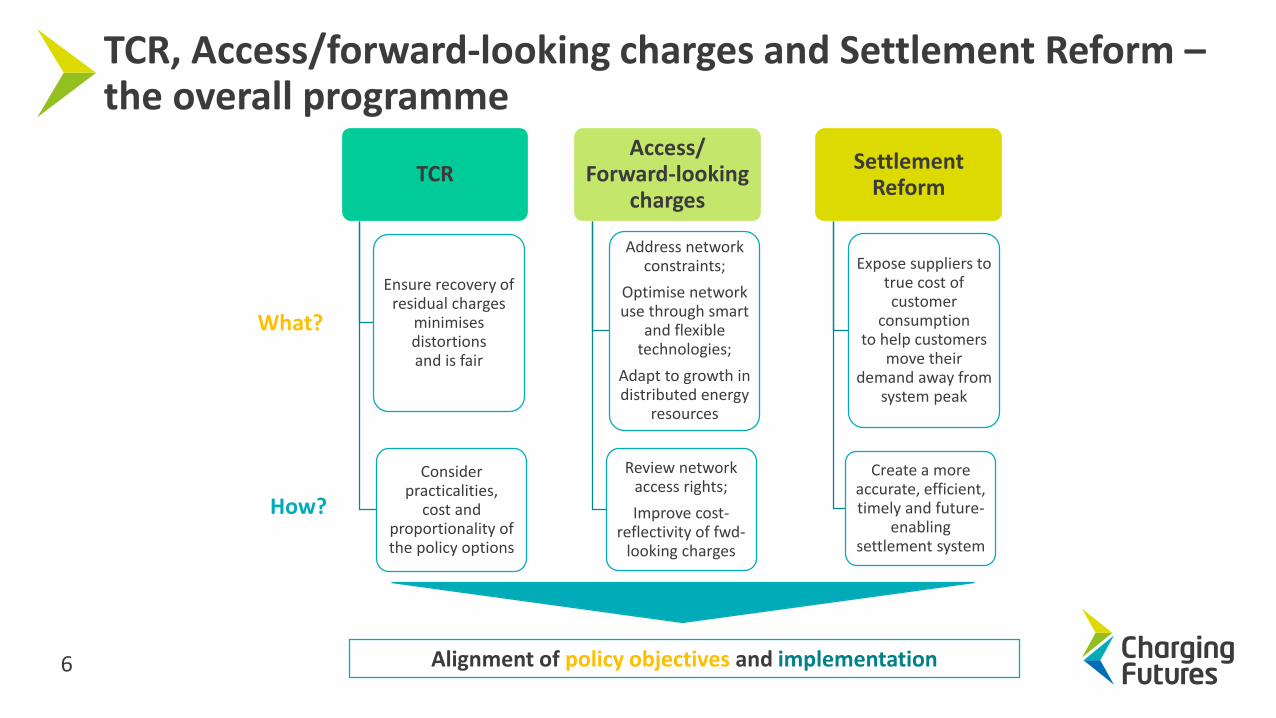
TCR
Ensure recovery of residual charges
minimises distortions and is fair
Consider practicalities,
cost and proportionality of the policy options
Access/Forward-looking
charges
Address network constraints;
Optimise network use through smart
and flexible technologies;
Adapt to growth in distributed energy
resources
Review network access rights;
Improve cost-reflectivity of fwd-
looking charges
Settlement Reform
Expose suppliers to true cost of customer
consumption to help customers
move their demand away from
system peak
Create a more accurate, efficient, timely and future-
enabling settlement system
How?
TCR, Access/forward-looking charges and Settlement Reform –the overall programme
Alignment of policy objectives and implementation
What?
6

TCR
Access/Forward-lookingcharges
SettlementReform
Consolidated timelines
Our decision will outline how we intend for any reforms to be taken forward.
This includes expected implementation timescales.
Q2 2018 Q3 2018 Q4 2018 2019 2020 2021
Outputs raised as code modifications through open
governance process
Implementation from 2020/21
onwards
Consultation(2nd half 2018)
SCR decision
Consultation(summer 2018)
Decision on reform
programme
Further analysis & industry
engagement to narrow options
Access to data
consultation(spring 2018)
Outline business case;
TOM, stage 2, start
(mid-2018)
Consumer impacts CfE(2nd half 2018)
Full business case;Decision on
Settlement Reform(2nd half 2019)
2nd
RFI(early 2019)
Code changes, System changes and
implementation
Further analysis & industry
engagement to narrow options
Access to data
consultation(spring 2018)
Outline business case;
TOM, stage 2, start
(mid-2018)
Consumer impacts CfE(2nd half 2018)
2nd RFI(early 2019)
7

Agenda > 10:00 – 10:15: Welcome – Frances Warburton, Ofgem
> 10:15 – 10:50: Targeted Charging Review – Andrew Self, Ofgem• The case for change• TCR workshop summary• Q&A
> 10:50 – 11:20: Update on Frontier’s analytical work
– Sam Street & Abbas Hussain, Frontier Economics
> 11:20 – 11:35: Coffee break & Charging drop-in desk
> 11:35 – 11:55: TCR breakout discussions – Andrew Self, Ofgem
> 11:55 – 12:35: Settlement Reform – George Huang, Ofgem
– Kevin Spencer, Elexon
> 12:35 – 13:25: Lunch & Charging drop-in desk8

Agenda > 13:25 – 13:40: Electricity network access project – Jon Parker, Ofgem
• Brief overview• Project objectives and timelines
> 13:40 – 13:55: Baringa analysis – Nick Screen, Baringa
> 13:55 – 14:40: Task Force progress & conclusions – Task Force members• Overview of work since last Forum• Overview of conclusions
> 14:40 – 14:55: Electricity network access project Q&A
> 14:55 – 15:15: Coffee break & Charging drop-in desk
> 15:15 – 16:15: Overall programme – Frances Warburton, Ofgem• Brief overview• Breakout discussions
> 16:15 – 16:30: Closing remarks – Frances Warburton, Ofgem9

Your involvement
10
Targeted Charging Review: The case for change
Andrew Self, Ofgem
12 12
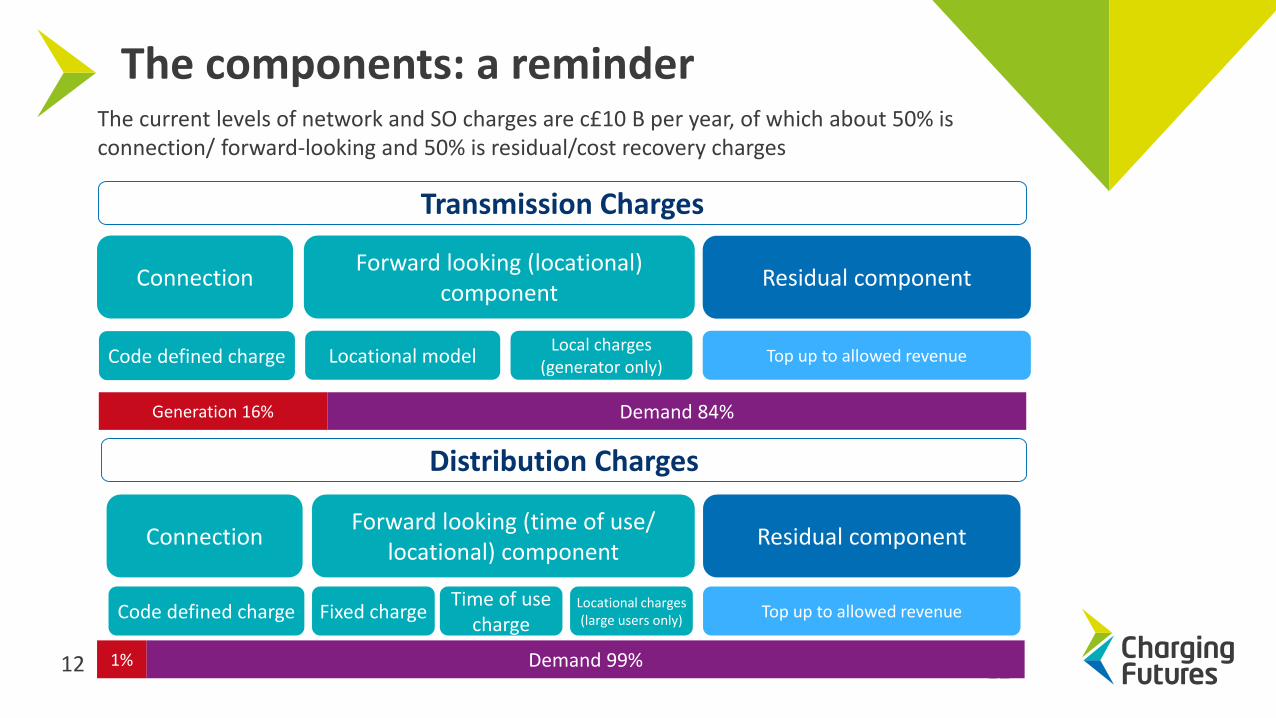
Transmission Charges
Forward looking (locational) component
Residual component
Local charges (generator only)
Locational model Top up to allowed revenue
Generation 16% Demand 84%
Distribution Charges
1% Demand 99%
The components: a reminder
Connection
Code defined charge
Connection
Code defined charge
Forward looking (time of use/ locational) component
Fixed chargeTime of use
chargeLocational charges (large users only)
Residual component
Top up to allowed revenue
The current levels of network and SO charges are c£10 B per year, of which about 50% is connection/ forward-looking and 50% is residual/cost recovery charges
12

Why reform residual network charging framework?
Under the current system, we believe:
• Some users may make decisions based (in part) on residual charges, and pay lower charges as a result, although their actions have not reduced the total level of costs which need to be recovered.
• The increase in availability and affordability of smaller scale generation means that some consumers can more easily reduce their net demand.
• The current way that residual charges are set creates some incentives that could lead to a more expensive system overall.
• Current residual charges fall increasingly on groups of customers who are less able to take action.
We think that residual network charges should be reviewed in order to reduce harmful distortions, and so that everyone pays a fair share.
13

Targeted Charging Review (TCR)
Current framework Significant Code Review Desired outcomes
Increasing system costs
Inefficient operation decisions
Increasing costs for inactive consumers
Inefficient investment decisions
Resolve how residual charges are set and
recovered
Review embedded benefits
Targeted Charging Review overview
14
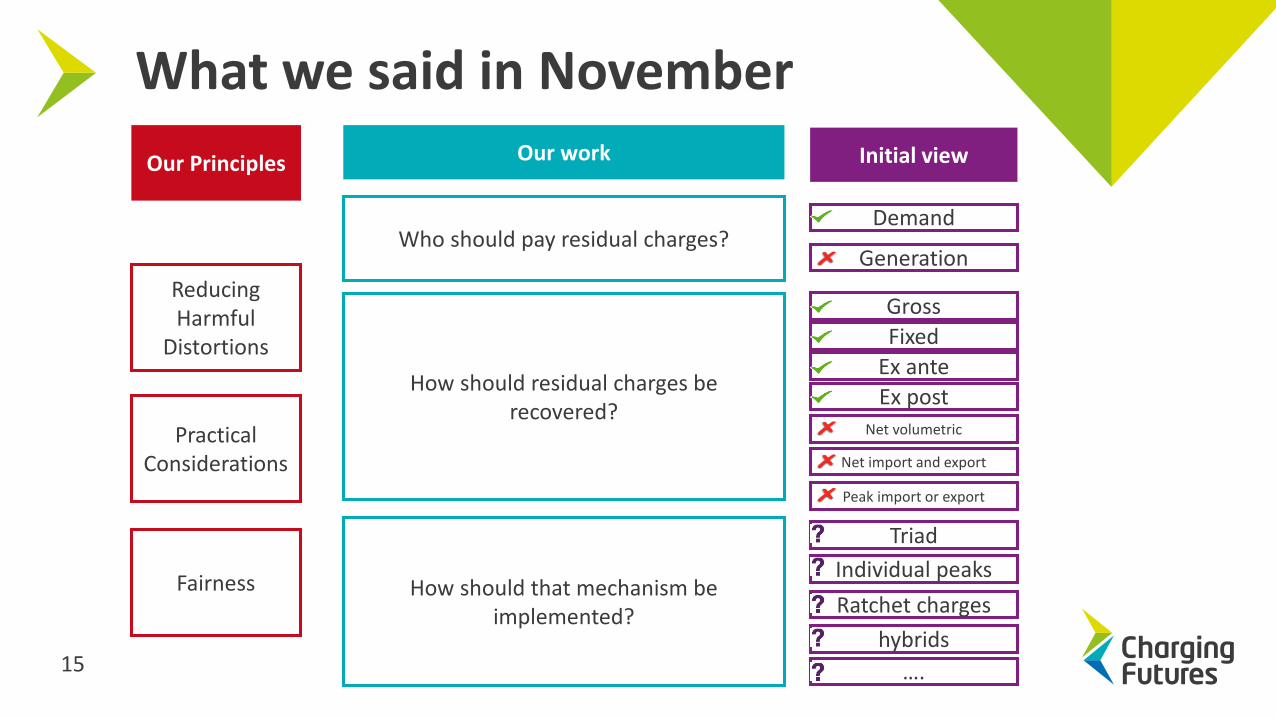
What we said in November
Practical Considerations
Fairness
Reducing Harmful
Distortions
Demand
Our Principles Our work
Who should pay residual charges?
How should residual charges be recovered?
Generation
Ex post
Ex ante
Fixed
Gross
Net volumetric
Net import and export
Peak import or export
How should that mechanism be implemented?
Initial view
hybrids
Ratchet charges
Individual peaks
Triad
….15

1) Distributional impactsI. Static analysis
II. Behavioural response
2) Whole systems impactI. Vanilla options
II. Detailed policy design
III. Transitional arrangements
3) Proportionality and practical considerationsI. Costs of reform
II. Implementation timelines
III. Impact on different industry users
Our Analytical workTo date, we narrowed down our shortlist of options to four high level recovery mechanisms. We intend to conduct further analysis. Our work will focus on:
16

Stakeholder Workshop Feedback
Wider range of user groups
Support for the proposed approach to
the modelling
Clearer links between the TCR, Electricity
Network Access and HHS projects.
Reminder of the reasons for the review
Challenging timelines
• In late April we held stakeholder workshops in Glasgow and London to allow participants to feed in views on our proposed approach to the analytical work.
• The stakeholder feedback will help inform the analytical work that will support GEMA’s decision on the TCR.
• Stakeholders shared many views and provided useful insights into the our proposed approach. Some of those shared views are captured below:
17

Stakeholder Workshop Feedback
Support for the proposed approach to
the modelling
Wider range of user groups
Clearer links between the TCR, Electricity
Network Access and HHS projects.
TCR Objectives
Challenging timelines
Most participants indicated that they were supportive of the proposed way forward
Many stakeholders thought the proposed user groups reflected a fair cross section of industry. However, there were calls for a greater
range of user groups. We have adjusted our user groups as a result
We will be discussing all three projects today. We will publish a way forward on Access ahead of our consultation on the TCR
There was call for further clarity on TCR objectives and a reminder of the case for change
We intend to publish our minded-to decision later in the year. This will include views on any transitional arrangements
18

Next steps
• We intend to press the ‘go button’ on our modelling activities very soon• If you have any further comments please send them to [email protected]
• We will be doing work over summer to progress:
o Quantitative assessmento Practical considerationso Fairness
• This will feed into our final policy design options
• We are due to take these to GEMA in autumn, and plan to publish a minded to decision later in the year.
19

Targeted Charging Review: Update on Frontier’s analytical workSam Street & Abbas Hussain, Frontier Economics

23 May 2018
Targeted Charging Review
Project update to the Charging Futures Forum

22frontier economics
Contents
1. Project overview 3
2. Update on user groups 7
3. Initial assessment of bill impacts 10

23frontier economics
1. Project overview 3
2. Update on user groups 7
3. Initial assessment of bill impacts 10
24frontier economics
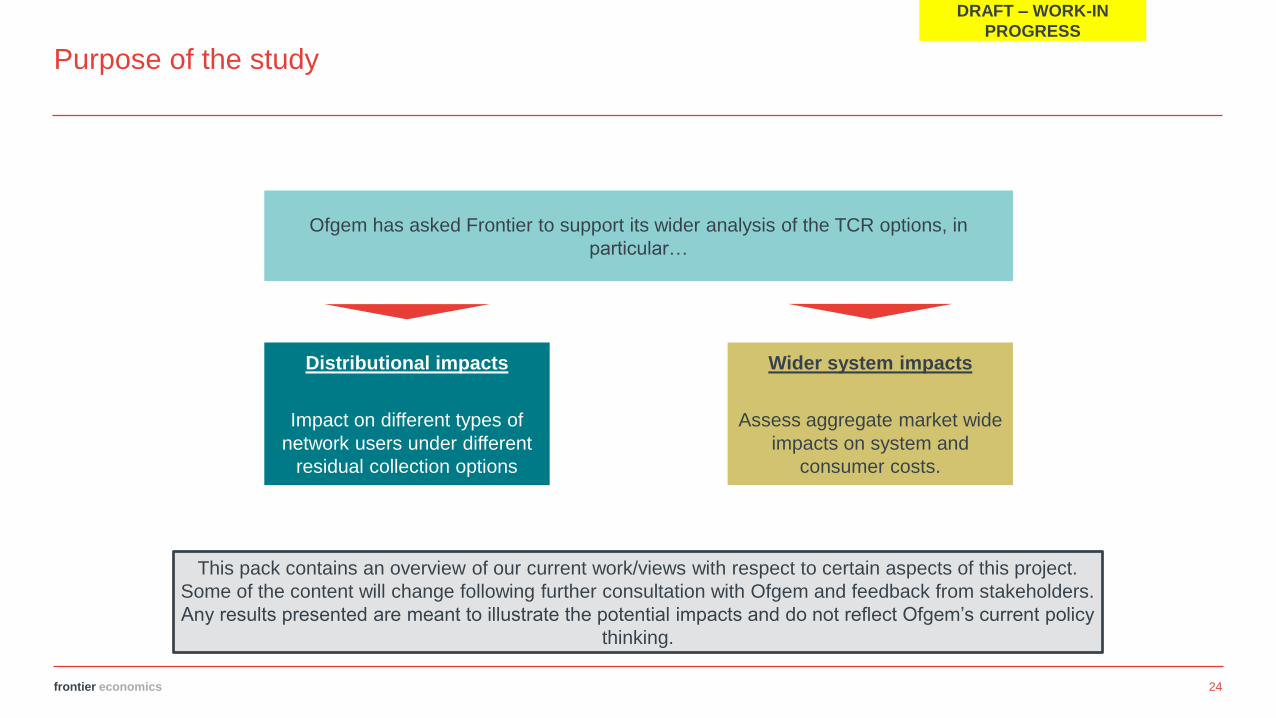
Purpose of the study
Ofgem has asked Frontier to support its wider analysis of the TCR options, in
particular…
Distributional impacts
Impact on different types of
network users under different
residual collection options
Wider system impacts
Assess aggregate market wide
impacts on system and
consumer costs.
DRAFT – WORK-IN
PROGRESS
This pack contains an overview of our current work/views with respect to certain aspects of this project.
Some of the content will change following further consultation with Ofgem and feedback from stakeholders.
Any results presented are meant to illustrate the potential impacts and do not reflect Ofgem’s current policy
thinking.

25frontier economics
At a high-level there are 3 steps to the analysis
Static impacts
▪ Agree a range of potential charging options and assess
relative to the baseline how they affect network bills of
different types of users, holding their physical behaviour
constant
1
Dynamic
‘behavioural’
impacts
▪ Given the potential impact on network bills for different types of
users, we will consider the potential for behaviour to be affected
in relation to how/when customers use the network, choose to
self generate, and adopt new technologies, e.g., EV/Heat pumps
2
System wide
impacts
▪ Assess aggregate market wide impacts on system and
consumer costs as a result of behaviour change, e.g.,
increases in demand, changes in balancing costs and
investment in networks
3
DRAFT – WORK-IN
PROGRESS

26frontier economics
In the first phase of the project we are aiming to understand the direct (static) impact on
bills (holding physical behaviour constant)
Definition of baseline
charging arrangements
Definition of alternative
structure of charges
Direct impact on bills by
user group
Definition of user groups
and user profiles
We provide an update on each
of these steps in today’s
sessions
DRAFT – WORK-IN
PROGRESS
We talk through some initial
analysis of the bill impacts,
which is largely qualitative, but
we include some initial
quantitative analysis
27frontier economics
1. Project overview 3
2. Update on user groups 7
3. Initial assessment of bill impacts 10

28frontier economics
Light industrial HV-Connected
In total we have identified 15 final demand user groups spread across domestic,
commercial and industrial categories
Final
demand
DomesticCommercial /
Light IndustrialIndustrial
EHV-Connected without onsite
generation/demand managementLow consumption
Size and meter type
Appliances/onsite generation
- Solar PV/storage
- Electric Vehicles
- Heat pumps
A B C
High Economy 7
Low consumption
Medium consumption
High consumption
1
2
3
4
56
7
8
DRAFT – WORK-IN
PROGRESS
In reality the boundaries between users may overlap. For example, small Commercial profiles will also be
captured by our analysis of the larger domestic profiles
High consumption without solar
PV/storage
High consumption with solar
PV/storage
9
10
12
11
T-Connected with peak
generation/demand management
T-Connected without onsite
generation/demand management
15
EHV-Connected with onsite
generation/demand management
14
13
The user groups have been updated following feedback from stakeholders and further discussions with Ofgem

29frontier economics
Information provided by industrial stakeholders has helped inform our industrial user
groups
Loads with peaking generation and can avoid triad
Load with demand management capability and can avoid triad
Loads based on batched processes capable of avoiding consumption during triad
Features of industrial load profiles described to us
Load without onsite generation and can’t avoid triad
Load without onsite generation and can’t avoid triad, but significant spare
connection capacity
3We will consider load without
onsite generation/demand
management capability on EHV
and T network
[Profile assumes triad peak and
individual peak the same]
Archetypes
Loads with onsite baseload generation with:
▪ Low/zero net import with high import capacity to cover outages and maintenance
▪ Net exporting connection with high import capacity to cover outages and maintenance
4
5
6
7
8
DRAFT – WORK-IN
PROGRESS
Load with baseload onsite
generation/demand management
on EHV and T network.
[Profile assumes low triad peak
but high individual peak]
Connection capacities do not always relate closely to actual peak demand
Industrial loads across T, EHV and HV network We now have industrial user
groups at each voltage level, and
will test impact of excess
connection capacity on charges.
1
2
30frontier economics
1. Project overview 3
2. Update on user groups 7
3. Initial assessment of bill impacts 10

31frontier economics
Update on bill impact analysis
Qualitative
▪ Our initial work has focused on a
qualitative assessment of the impacts
on different types of users
▪ This supports understanding of the
quantitative impacts and helps to draw
out more general points around the
dynamics of expected impacts
Quantitative
▪ We have developed the bill impact model
across each of the charging
methodologies (i.e., CDCM, EDCM,
TNUoS).
▪ We do not yet have sufficient data to
calculate the charges for each of the
methodologies, however, we have
requested further data from the industry.
▪ Our initial analysis has focused on
CDCM charges, some of which we
present today.
In the following section, we set out our understanding of the baseline charges, and then
consider qualitatively the impact of each of the ‘vanilla’ charging options separately. Where
relevant we provide illustrative CDCM bills analysis for different user groups
DRAFT – WORK-IN
PROGRESS

32frontier economics
Residual cost recovery arrangements vary across the three residual charging
methodologies
TNUoS▪ Half-hourly metered users charged on the basis of “triad” - £/kW based on user’s peak
▪ Non-half-hourly metered users – charged on the basis of consumption during 16:00 -
19.00 every day (p/kWh)
CDCM▪ A “volumetric” p/kWh charge constant across all users based on
net (at meter) annual consumption.
EDCM▪ Customer specific residual charge charged on connection
(p/kVA/day). Variation in part driven by historic net consumption
usage of connection capacity during ‘super-red’ hours
DUoS
Charging arrangements for residual cost recovery under status quo (“baseline”)
Even though the options are to be applied consistently across each charging methodology, given the baseline varies in each, the impacts will also vary by charging methodology
DRAFT – WORK-IN
PROGRESS

33frontier economics
The total residual to recover varies widely across the different DNOs
-£100,000,000
-£50,000,000
£0
£50,000,000
£100,000,000
£150,000,000
£200,000,000
£250,000,000
ElectricityNorthWest
Northeast Yorkshire SouthernScotland
NorthWales &Mersey
Southern ScottishHydro
Eastern London SouthEast
EastMidlands
SouthWales
SouthWest
WestMidlands
DRAFT – WORK-IN
PROGRESS
34frontier economics
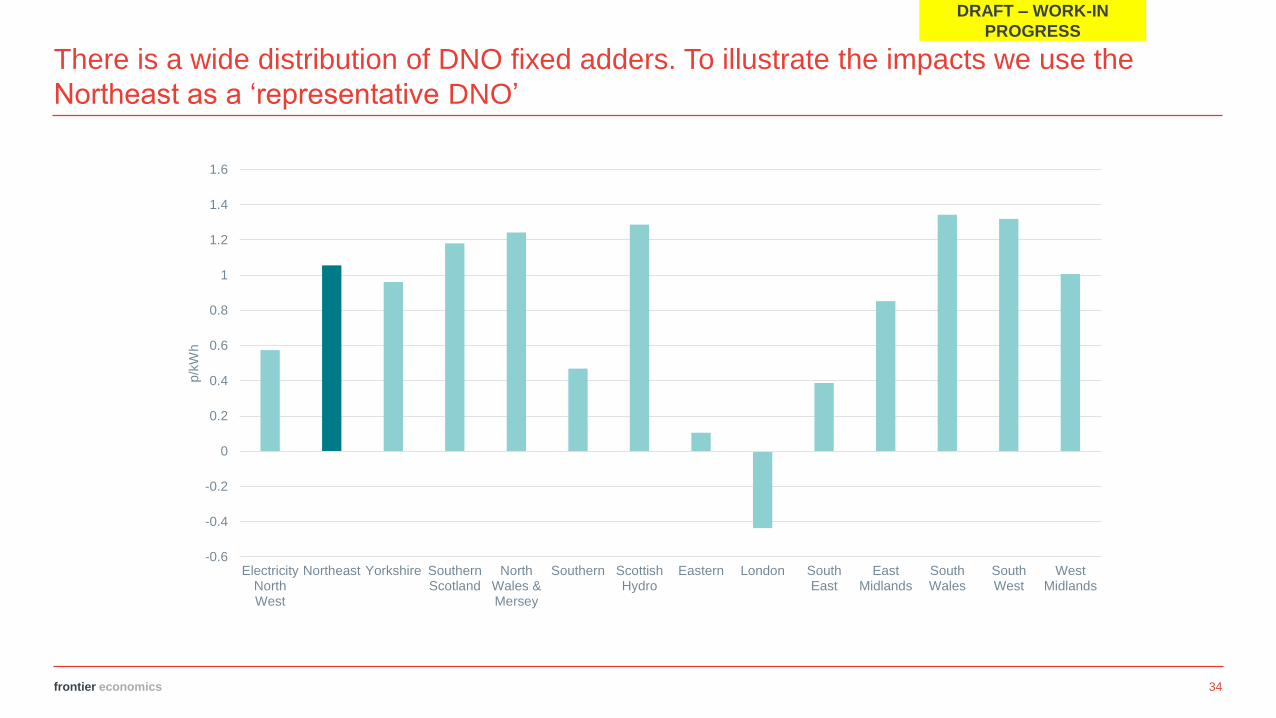
There is a wide distribution of DNO fixed adders. To illustrate the impacts we use the
Northeast as a ‘representative DNO’
-0.6
-0.4
-0.2
0
0.2
0.4
0.6
0.8
1
1.2
1.4
1.6
ElectricityNorthWest
Northeast Yorkshire SouthernScotland
NorthWales &Mersey
Southern ScottishHydro
Eastern London SouthEast
EastMidlands
SouthWales
SouthWest
WestMidlands
p/k
Wh
DRAFT – WORK-IN
PROGRESS

35frontier economics
Fixed
(per user fixed
charges)
Gross volumetric
consumption (based
on all user’s
consumption incl. from
onsite generation)
Ex ante capacity
(charge related to
user’s agreed or
connected capacity)
Ex post capacity
(based on measure of
individual peak system
usage)
Relative to the baseline we assess the impact of moving to each of the
four alternative ‘vanilla’ charging options
DRAFT – WORK-IN
PROGRESS
1 2 3 4
▪ As a starting point we
consider the impact of
options where the
revenue raised from a
particular segment is
similar to historic levels.
▪ Apply to non-domestic
customers (i.e. industrial
final demands and
larger commercial sites)
which includes sites on
the HV network under
the CDCM regime.
▪ Capacity charge based
on individual customer
connection capacity
▪ We assume the same
connection capacity for
all domestic customers
▪ We consider the impact
of a measure of single
individual user peak
demand
▪ The impacts set out in this section are ‘static’ i.e. they do not consider behaviour change.
▪ The options we consider are illustrative examples only and not indicative of final policy options

36frontier economics
Distributional impact matrices: Fixed charges
TNUoS
L
H
L H
Triad/4-7pm peaks
Ne
t a
nn
ua
l
co
nsu
mp
tio
n
CDCM
L
H
L H
Peak demand
Ne
t a
nn
ua
l
co
nsu
mp
tio
n
EDCM
L
H
L H
Level of current
EDCM residual
charge
Ne
t a
nn
ua
l
co
nsu
mp
tio
n
Expected reduction in residual bill Expected increase in residual billExpected reduction in residual due to expansion of
charging base/reduced avoidance behaviour only
Users with above average
peaks gain, and those with
below average peaks are
worse off
Users with above average
net annual consumption
gain, and those with below
average annual
consumption are worse off
Users who previously paid
high site specific EDCM
charges (i.e. in part due to
high historic super-red
consumption as % of
connection capacity) will gain.
DRAFT – WORK-IN
PROGRESS
37frontier economics
£0
£10
£20
£30
£40
£50
£60
£70
£80
Domestic - Lowconsumption
Domestic - Mediumconsumption
Domestic - Highconsumption
Domestic - Economy7 high
Domestic - Solar PVwith storage
Domestic - Electricvehicles
Domestic - Heatpumps
Baseline Fixed charges
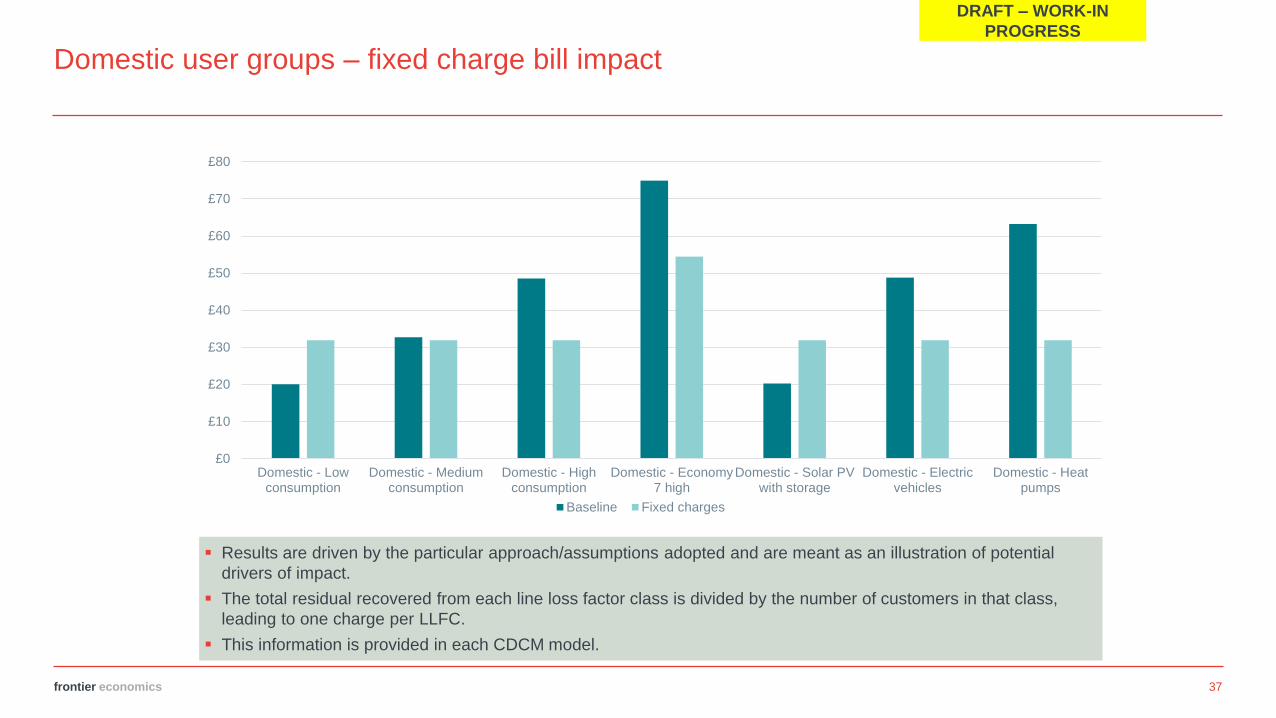
Domestic user groups – fixed charge bill impact
DRAFT – WORK-IN
PROGRESS
▪ Results are driven by the particular approach/assumptions adopted and are meant as an illustration of potential
drivers of impact.
▪ The total residual recovered from each line loss factor class is divided by the number of customers in that class,
leading to one charge per LLFC.
▪ This information is provided in each CDCM model.

38frontier economics
£0
£50
£100
£150
£200
£250
£300
£350
£400
£450
£500
SME - Low consumption SME - High consumption with solar PV/storage SME - High consumption without solarPV/storage
Baseline Fixed - high consumer relative to LLFC Fixed - low consumer relative to LLFC
Commercial user groups – fixed charge bill impact
DRAFT – WORK-IN
PROGRESS
▪ Results are driven by the particular approach/assumptions adopted and are meant as an illustration of potential
drivers of impact.
▪ The total residual recovered from each line loss factor class is divided by the number of customers in that class,
leading to one charge per LLFC. As such, results are sensitive to the choice of LLFC.
▪ This information is provided in each CDCM model.

39frontier economics
Distributional impact matrices: Gross volumetric
TNUoS
L
H
L H
Triad/4-7pm peaks
Gro
ss a
nn
ua
l
co
nsu
mp
tio
n
CDCM
L
H
L H
Net annual
consumption
Gro
ss a
nn
ua
l
co
nsu
mp
tio
n
EDCM
L
H
L H
Level of current
EDCM residual
charge
Gro
ss a
nn
ua
l
consum
ption
Users with “peaky” profiles gain,
and those with high consumption
but with low peak (incl. due to
onsite generation/DSR) are worse
off. Users with high charges
before and after change still
benefit due to expansion of
charging base.
Users with low net annual
consumption but high gross
consumption due to baseload
onsite generation are worse off.
Users with high charges before
and after change benefit due to
expansion of charging base.
Users who previously paid high
site specific EDCM charges (i.e. in
part due to high historic super-red
consumption as % of connection
capacity) will gain. Users with high
charges before and after change
benefit due to expansion of
charging base.
DRAFT – WORK-IN
PROGRESS
Expected reduction in residual bill Expected increase in residual billExpected reduction in residual due to expansion of
charging base/reduced avoidance behaviour only

40frontier economics
Distributional impact matrices: Ex ante capacity
TNUoS
L
H
L H
Triad/4-7pm peaksC
on
ne
ctio
n c
ap
acity
CDCM
L
H
L H
Net annual
consumption
Co
nn
ectio
n c
ap
acity
EDCM
L
H
L H
Level of current
EDCM residual
charge
Co
nn
ectio
n c
ap
acity
Users with high connection
capacity relative to their triad peak
demand are worse off. Users with
high charges before and after
change benefit due to reduced
avoidance behaviour.
Users with high connection
capacity relative to their net
annual consumption are worse off.
Users with high annual
consumption, fully utilising their
connection capacity gain. Users
with high charges before and after
change still benefit due to reduced
avoidance behaviour.
Users who previously paid high
site specific EDCM charges (i.e. in
part due to high historic super-red
consumption as % of connection
capacity) will gain.
DRAFT – WORK-IN
PROGRESS
Expected reduction in residual bill Expected increase in residual billExpected reduction in residual due to expansion of
charging base/reduced avoidance behaviour only

41frontier economics
Domestic user groups – ex-ante capacity charge bill impact
£0
£10
£20
£30
£40
£50
£60
£70
£80
Domestic - Lowconsumption
Domestic - Mediumconsumption
Domestic - Highconsumption
Domestic - Economy7 high
Domestic - Solar PVwith storage
Domestic - Electricvehicles
Domestic - Heatpumps
Baseline Ex-ante capacity
DRAFT – WORK-IN
PROGRESS
▪ Results are driven by the particular approach/assumptions adopted and are meant as an illustration of potential
drivers of impact.
▪ The total residual recovered within each DNO is divided by the assumed total connection capacity of DNO customers.
▪ We have used connection capacities available in the CDCM models for HH customers.
▪ Otherwise, we have made assumptions based on conversations with DNOs.

42frontier economics
Commercial user groups – ex-ante capacity charge bill impact
DRAFT – WORK-IN
PROGRESS
▪ Results are driven by the particular approach/assumptions adopted and are meant as an illustration of potential
drivers of impact.
▪ The total residual recovered within each DNO is divided by the assumed total connection capacity of DNO customers.
▪ We have used connection capacities available in the CDCM models for HH customers.
▪ Otherwise, we have made assumptions based on conversations with DNOs.
£0
£50
£100
£150
£200
£250
£300
SME - Low consumption SME - High consumption with solar PV/storage SME - High consumption without solarPV/storage
Baseline Ex-ante capacity

43frontier economics
Distributional impact matrices: Ex post capacity
TNUoS
L
H
L H
Triad/4-7pm peaksIn
div
idu
al p
ea
k
CDCM
L
H
L H
Net annual
consumption
Ind
ivid
ua
l p
ea
k
EDCM
L
H
L H
Level of current
EDCM residual
charge
Ind
ivid
ua
l p
ea
k
Users with high individual peak not
aligned with system peak are
worse off. Users with high/low
charges before and after change
benefit due to expansion of the
charging base.
Users with “peaky” profile are
worse off relative to flat profiles.
Users with high/low charges
before and after change benefit
due to reduced avoidance
behaviour.
Users who previously paid low site
specific EDCM charges (i.e. in part
due to high historic super-red
consumption as % of connection
capacity) but have high individual
peaks are worse off (e.g. site with
onsite generation but with
maintenance periods resulting in high
individual peak).
DRAFT – WORK-IN
PROGRESS
Expected reduction in residual bill Expected increase in residual billExpected reduction in residual due to expansion of
charging base/reduced avoidance behaviour only

Frontier Economics Ltd is a member of the Frontier Economics network, which consists of two separate companies based in Europe (Frontier Economics Ltd) and Australia (Frontier
Economics Pty Ltd). Both companies are independently owned, and legal commitments entered into by one company do not impose any obligations on the other company in the
network. All views expressed in this document are the views of Frontier Economics Ltd.

Coffee break
11:20 – 11:35

Targeted Charging Review: Breakout discussions
Andrew Self, Ofgem
Questions to consider
> Frontier's analytical work will be published with our Impact Assessment.
Do you feel this type of material will help you understand the implications
of the final set of residual charging options for you or your business?
What could be done to improve the information set?
> Given the initial views on distribution impacts, what should this mean for
the final policy options, and potential hybrid approaches?
47
Settlement Reform Project
George Huang, Ofgem
Kevin Spencer, Elexon
Update on Market-Wide Settlement Reform SCR
George HuangKevin Spencer
23 May 2018

50
What we’ll cover
• Project overview
• Business Case
• Consumers and Policy
• Target Operating Model
• How to get in touch with the Settlement Reform team

Certain to occur
Likely to occur
Outcome
Output
Long term
Medium term
Short term
Realising the benefits
51

• Settlement Reform exposes suppliers to the true cost of supply consumers – incentivises development of new energy products to help customers be
more engaged and move consumption away from peak/expensive periods
– should lead to more efficient investment, and use of, generation and network infrastructure
• We are also exploring the potential distributional impacts of Settlement Reform – commissioned CEPA in 2017 to look into distributional impacts of smart
tariffs. Findings available at: https://www.ofgem.gov.uk/publications-and-updates/distributional-impacts-time-use-tariffs
– will further explore distributional impacts as part of our impact assessment
Realising the benefits
52

Project Update
SCR launch (24 July 17)
1st TOM Design Working Group(11 Oct 17)
Strategic Business Case(8 Feb 18)
July 2017 Winter 2019
Decision on MHHS(2nd half 2019)
Outline Business Case(Mid 18)
Skeleton TOM optionsconsultation(30 Apr 18)
Working paper on agent functions(Spring 18)
Access to data consultation (Spring 18)
Stage 2 TOM work begins(Summer 18)
Call for Evidence -HHS consumer impacts(2nd half 18)
Full Business Case(2nd half 19)
Design Working Group deliver detailedTOMand Ofgem2nd RFI(early 19)
53

Strategic Outline Case
Outline Business Case
Full Business Case
See: https://www.gov.uk/government/uploads/system/uploads/attachment_data/file/469317/green_book_guidance_public_sector_business_cases_2015_update.pdf
• Sets out the strategic case for change
• An initial outline of the scope of economic costs and benefits
• Initial thoughts on the other three cases
• Economic assessment of high level options for Settlement Reform, outlining potential range of costs and benefits
• Developed thinking on commercial, financial and management cases
• Detailed costing of specific options
• Relies on Target Operating Model work and policy decisions
• Set out plans to manage and deliver reform and the transition to market-wide HHS
Feb 2018 2nd half 2019Mid-2018
We are following HM Treasury best practice guidance to develop a Business Case based on the 5 Case Model methodology. This will include an economic impact assessment (the Economic Case).
Business case
54

Policy and Consumer Questions
Ofgem is leading on consideration and decision making on the following policy and consumer questions separately from the Target Operating Model development:
Approach on whether or not to centralise functions currently performed by supplier agents
The potential impacts on consumers of Settlement Reform and whether any additional protections will be needed as result
Approach to access to data for settlement• Access to half hourly data from smart meters is currently on an opt-in basis• Gathering evidence on full range of approaches
55

Access to data for settlement options
No Option
1 Access to half-hourly data subject to existing data access rules (opt-in) (the status quo)
2 Half-hourly data is available for settlement purposes only with an option for
consumers to opt-out
3 HH data is available for settlement purposes only
4 HH data is available for settlement purposes only following pseudonymisation
(MPAN replaced with unique identifier)
5 HH data is available for settlement purposes only following anonymisation (MPAN
removed at an early stage of the settlement process)
56

Target Operating Model
• The Target Operating Model (TOM) will set out the transitional and enduring settlement arrangements which will deliver Settlement Reform
• We want to ensure the TOM is future-enabling and does not impede new technologies and business models. For example:
➢ Electric vehicles
➢ Demand-side response (local and wholesale)
➢ Peer to peer trading
• Design of the TOM is being undertaken by an ELEXON-chaired Design Working Group (DWG) that will provide design options to Ofgem.
• Ofgem retains all decision-making authority on the TOM options
57
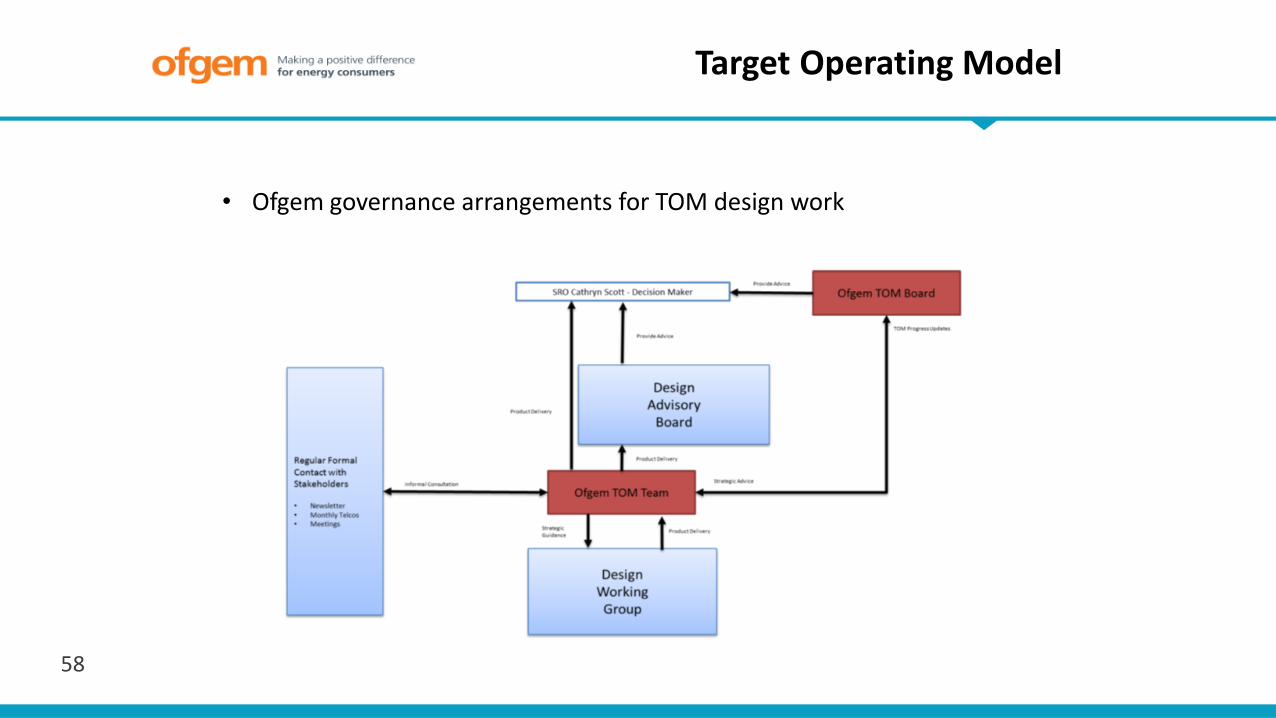
Target Operating Model
• Ofgem governance arrangements for TOM design work
58

Target Operating Model
• The DWG have met regularly since October 2017 and have developed 5 high level ‘skeleton’ TOM options, which are currently out for consultation
• Ofgem has approved the TOM design work to move to the next stage – detailed design work. Detailed design work will cover interaction with network charging
• DNO representation on both the DWG and DAB
59

Market-wide Half-Hourly Settlement
23 May 2018
Kevin Spencer
The ELEXON led Design Working Group
Public

Overview
■ Changing energy usage
■ DWG: Data and interfaces
■ MHHS Context
■ Challenges and Unknowns
■ Design Work so far
■ Summary and next steps
61

Demand profile
■ Example PC1 Domestic Unrestricted: How will it change with new technology and would profiles be
accurate?
62

Design Working Group: Data and interfaces
63

MHHS Context
■ 1998: supply competition implemented profiling because of meter capability
■ Waiting for HH capable meters, make arrangements simpler
■ ELEXON looking at improvements to settlement process since 2010
–PSRG and SRAG work: Profiling, P272 and elective HHS process changes
■ CMA remedy and Ofgem consultation
–We offered expertise to lead on settlement design aspects of HHS
■ Ofgem launch SCR take up ELEXON’s offer of settlement design
■ Lead through expert group (DWG)
■ Delivery of TOM, options, assessment, interaction with policy and business case
■ 2 phases of work:
– Initial set of options (TOM) and assessment Oct 2017– April 2018
–Detailed development with report to Ofgem Q1 2019
64

Design Work so far
Target Operating Model

TOM: Baseline Principles
DWG have 8 baseline principles:
1. be optimised for the longer term ‘target state’ where the majority of Meters will be Smart or Advanced.
Any Meter not either of these should be managed as part of the transitional arrangements;
2. only consider as transitional states (and not the final TOM option) any designs that use the existing
Elective HH and Non Half Hourly (NHH) settlement arrangements;
3. cover HH meter data (Active Import and Active Export) for Settlement purposes only. While non-settlement activities
(such as billing) are out of scope, the design will aim not to be detrimental to these;
4. aim to design out elements of the existing Non-Half Hourly (NHH) profiling process such as the use of
Annualised Advances (AAs) and EACs (EACs);
5. aim to have at least one TOM aligning with the policy developments for data privacy and consideration of agent
functions;
6. not consider technology or architecture factors at this stage;
7. consider any new Unmetered Supplies arrangements only once a framework is in place for the metered segments of the
market so as not to constrain the possibilities for the TOM design; and
8. not consider Settlement timescales until TOM options have been further developed.
66

TOM development: Market Segments
■ Market segments differentiation
–Smart Meter
–Legacy Meter
–Advanced Meter
–Unmetered Supplies
67
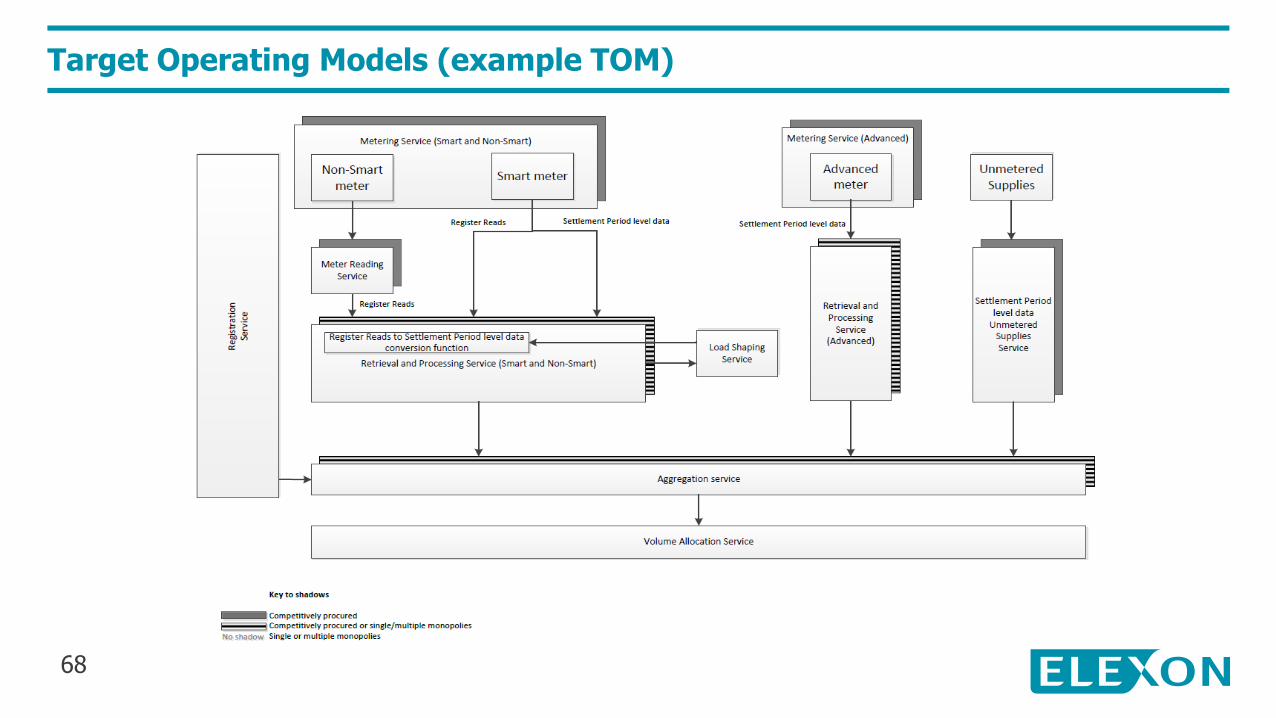
Target Operating Models (example TOM)
68
Market-wide HHS Next Steps
DWG have agreed 5 potential TOMs
ELEXON Industry Consultation being undertaken
Review the responses to consultation
Develop detailed requirements for Services
Look at options for transition
69

[email protected] 0207 380 4115

Practical interactions: Settlement Reform/TCR/Access
Settlement Reform business case to
account for charging options
71

If you would like to find out more or be notified of future updates, please go to the Settlement Reform website: https://www.ofgem.gov.uk/electricity/retail-market/market-review-and-reform/smarter-markets-programme/electricity-settlement
Any questions, please email: [email protected]
How to get in touch
72

Settlement Reform ProjectQ&A
George Huang, Ofgem
Kevin Spencer, Elexon

Lunch12:35 – 13:25

Electricity Network Access Project:Project Overview
Jon Parker - Ofgem

Recap: what are access rights & forward-looking charges?
•The network capacity a user has allocated to them in order to import or export electricity from their target market
•Requires a connection from the user’s equipment to the wider network, and then allocated capacity on that wider network
Network access rights
•The elements of network charges that look to provide signals to users about how their behaviours can increase or reduce future costs on the network
•Includes connection charges and elements of use of system charges
Forward-looking charges
76
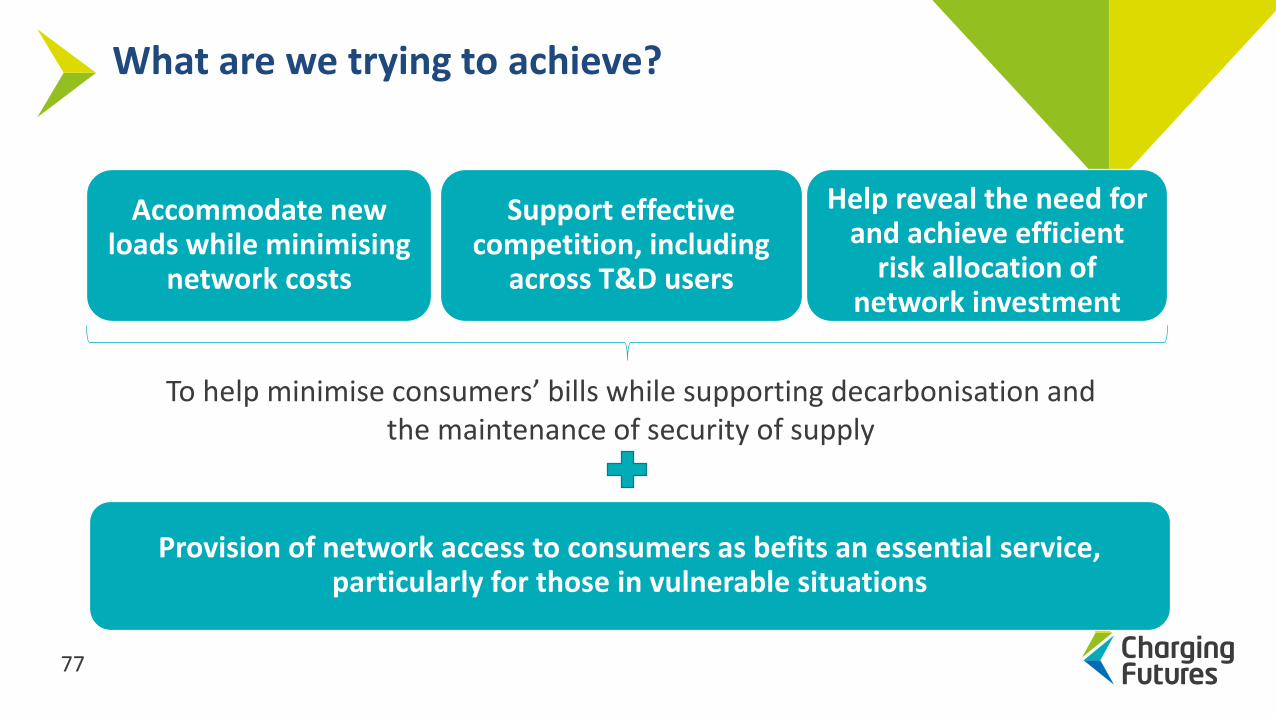
Accommodate new loads while minimising
network costs
Support effective competition, including
across T&D users
Help reveal the need for and achieve efficient
risk allocation of network investment
Provision of network access to consumers as befits an essential service, particularly for those in vulnerable situations
What are we trying to achieve?
To help minimise consumers’ bills while supporting decarbonisation and the maintenance of security of supply
77

Prospect of increased network constraints as use of the network changes
Why are we looking at this now?
New opportunities from smart and flexible technology to maximise capacity
Growth of embedded generation – need for more consistency across transmission and distribution
78

Network access arrangements Forward looking network charges
Nature of access rights
Time aspects
Structure of the charge
Types of costsTypes of charge
Firmness Basis of charge
Geographical natureTiming of payment and degree of user commitment
Associated conditions Level of
granularity
Locational granularity
Allocation and reallocation
Initial allocationTypes of locational signal
Reallocation and trading Temporal granularity
Building blocks of access and forward-looking charges
79

The work to date> In November 2017, we published a working paper on “Reform of electricity network
access and forward looking charges. We also held workshops on some potential options for change in Glasgow and London (at the last CFF).
> We commissioned Baringa to develop and implement an analytical framework and gather evidence to assess the materiality of current inefficiencies.
> We set up two industry Task Forces under the CFF to help assess the options for the change. The TFs have published three outputs. The latest report – a document identifying the initial options for further assessment was published last week.
We want to use today’s session to provide you with an overview of Baringa and the TF’s work
80

Our way forward
> The TF report, Baringa work, the feedback that received via the CFF/workshops and our own analysis will inform how we intend to take this forward. We expect to publish a consultation on the direction of travel in Summer 2018.
> We want to hear views from you on our high-level direction of travel.
> Once it is published, please response to our consultation.
> We intend to present and seek views from the next CFF.
> We also want to use other mechanisms to engage with stakeholders and receive feedback (eg webinars, podcasts). If you have ideas for how we could do this – let us know.
> We envisage making a decision on the high-level direction of travel around the end of the year.81

Electricity Network Access Project:Baringa Analysis
Nick Screen - Baringa

Copyright © Baringa Partners LLP 2018. All rights reserved. This document is subject to contract and contains confidential and proprietary information.
23 May 2018
Analytical framework for network access and forward looking charges Presentation to Charging Futures Forum
Ofgem

Copyright © Baringa Partners LLP 2018. All rights reserved. This document is subject to contract and contains confidential and proprietary information. 84
Reporting Wider system impacts
IntroductionWe were commissioned to develop an assessment of the materiality of current inefficiencies in network access and forward looking charging
January 2018 May 2018
January– project kick off
24th/25th January – presentation of initial thinking and Issues to Task Forces
20th/21st March – presentation of qualitative assessment of wider system impacts to Task Forces
April – assessments complete
Late May – report published
Issue identification and assessment
Phase 2 – supporting Ofgem with
assessment of options
Copyright © Baringa Partners LLP 2018. All rights reserved. This document is subject to contract and contains confidential and proprietary information. 85
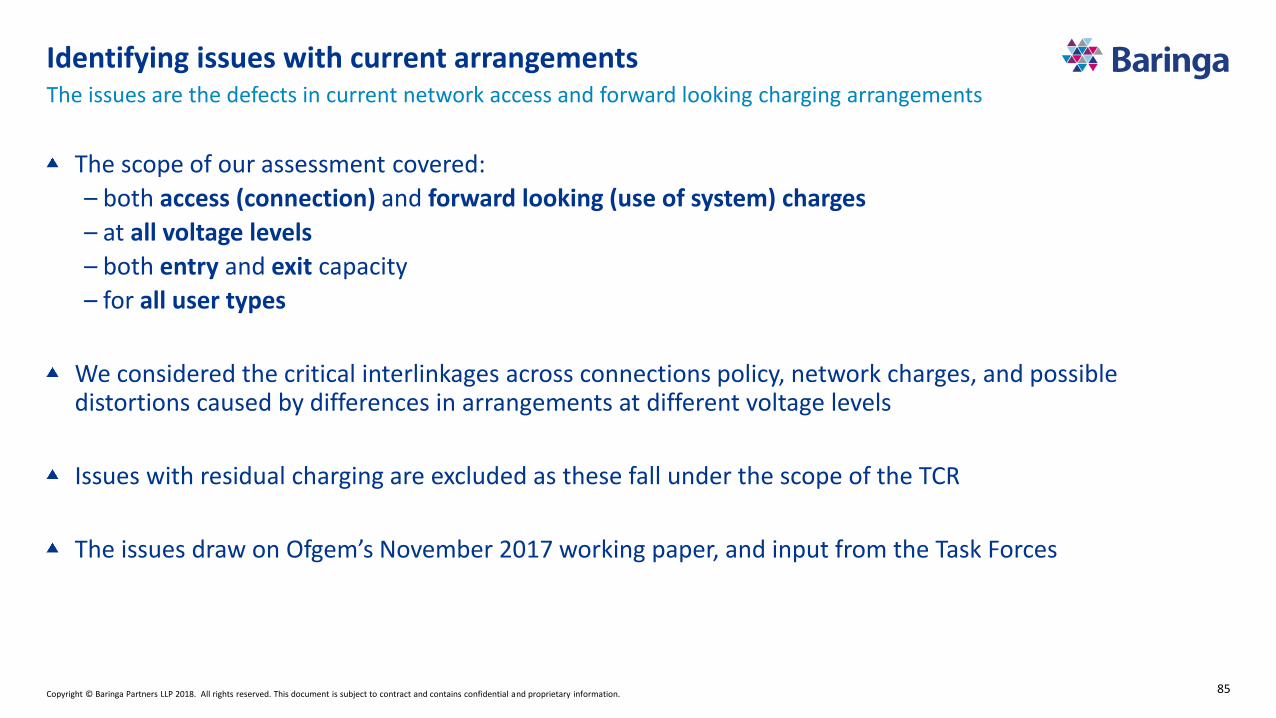
Identifying issues with current arrangements
The scope of our assessment covered:
– both access (connection) and forward looking (use of system) charges
– at all voltage levels
– both entry and exit capacity
– for all user types
We considered the critical interlinkages across connections policy, network charges, and possible distortions caused by differences in arrangements at different voltage levels
Issues with residual charging are excluded as these fall under the scope of the TCR
The issues draw on Ofgem’s November 2017 working paper, and input from the Task Forces
The issues are the defects in current network access and forward looking charging arrangements

Copyright © Baringa Partners LLP 2018. All rights reserved. This document is subject to contract and contains confidential and proprietary information. 86
We identified 22 distinct issues with current arrangementsThe Issues cut across Transmission and Distribution, and a number of categories
9. Lack of LV/HV
locational signals
1. Lack of capacity
options
4. Lack of defined
access rights and
barriers to access
right trading
3. Lack of
transmission import
capacity rights for
distribution network
users
2. No measure of
value to user of
connection
5. Smaller user
network usage may
exceed capacity of
distribution network
6. Access and
charging
arrangements for
IDNOs may not be
cost reflective
13. Lack of efficient
principles of
congestion
management at
distribution
8. Inefficient signals
for capacity planning
and network
investment
17. No clear mechanism
for how the costs of
enabling platforms are
allocated to network
users
18. No clear
mechanism for DSO
operating cost
recovery
Cost and risk allocation
7. Constraint costs
are socialised
22. Voltage level
differences in
network cost
charging
methodologies
21. Voltage level
differences in
operating cost
charging
methodologies
Locationalsignals
20. Different depths
in connection
charging across T
and D
19. Different risk
allocation across T
and D
Signal predictability
12. Inefficient
volumetric based
network charges
10. Lack of locational
line loss signals
Inefficient Dispatch
Capacity allocation
16. EDCM charge
predictability
14. TNUoS charge
predictability
15. BSUoS charge
predictability
Transmission
Distribution
Discrepancy between
T & D
11. Inefficient time of
use signal from Triad
methodology
Common

Copyright © Baringa Partners LLP 2018. All rights reserved. This document is subject to contract and contains confidential and proprietary information. 87
We assessed wider system impacts of the issuesEach of these impacts is explained in our report, along with further assessment and metrics
Impact area Deployment barriers Efficiency of operations Efficiency of investment Allocation of risk
Tx
Entry Medium Low Medium Medium
Exit Low Low Low Low
Interface Medium Low Medium Medium
Dx
Entry High Medium Medium Medium
Exit High Low High Medium
20 GW queue of distribution generation
projects
Up to 9 million EVs by 2030 - potential for spare capacity to be used up as early as
2025
Avoided reinforcement cost due to flex/ToU
tariffs by 2050: £18mn to £970mn
Current capacity waiting to connect:
1.7GW
Discrepancies in charging contribute to
Dx queue and investment costs
The annual constraint costs attributable to capacity
connected under C&M as of September 2015 equated to around £40 to 50 per kW of
C&M capacity (£122mn total)
Copyright © Baringa Partners LLP 2018. All rights reserved. This document is subject to contract and contains confidential and proprietary information. 88
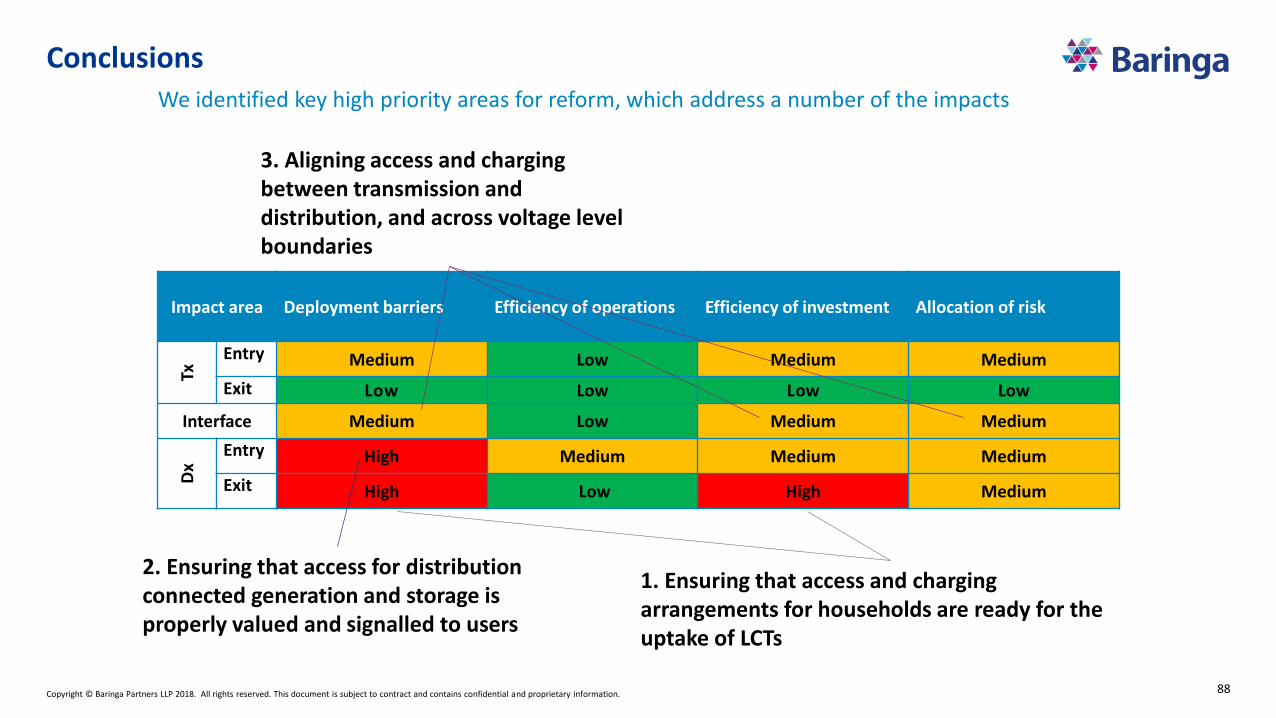
Conclusions We identified key high priority areas for reform, which address a number of the impacts
Impact area Deployment barriers Efficiency of operations Efficiency of investment Allocation of risk
Tx
Entry Medium Low Medium Medium
Exit Low Low Low Low
Interface Medium Low Medium Medium
Dx
Entry High Medium Medium Medium
Exit High Low High Medium
1. Ensuring that access and charging arrangements for households are ready for the uptake of LCTs
2. Ensuring that access for distribution connected generation and storage is properly valued and signalled to users
3. Aligning access and charging between transmission and distribution, and across voltage level boundaries

This document: (a) is proprietary to Baringa Partners LLP (“Baringa”) and should not be re-used for commercial purposes withoutBaringa's consent; (b) shall not form part of any contract nor constitute an offer capable of acceptance or an acceptance; (c) excludes allconditions and warranties whether express or implied by statute, law or otherwise; (d) places no responsibility or liability on Baringa forany inaccuracy, incompleteness or error herein; and (e) the reliance upon its content shall be at user's own risk and responsibility. If anyof these terms is invalid or unenforceable, the continuation in full force and effect of the remainder will not be prejudiced. Copyright ©Baringa Partners LLP 2017. All rights reserved.

Electricity Network Access Project:Access and Forward-Looking Charges Joint Task Forces
Nigel Bessant, Scottish & Southern Electricity Networks
Paul McGimpsey, SP Distribution & SP Manweb
Chris Ong, UK Power Networks

Task Force Approach
> Stage 1: Initial Options
> Building blocks to determine and define various access arrangements, their initial allocation and reallocation.
> Building blocks for the calculation and structure of forward looking charges
> Stage 2: Framework Scenarios, Clusters and Assessment Methodology
> Scenarios explore initial allocation and re-allocation
> Clusters consider influences on user investment or operation
> Charging methodologies and tariff design considered separately
> Assessment Criteria confirmed and linked to CUSC and DCUSA principles
> Stage 3: Final report
91
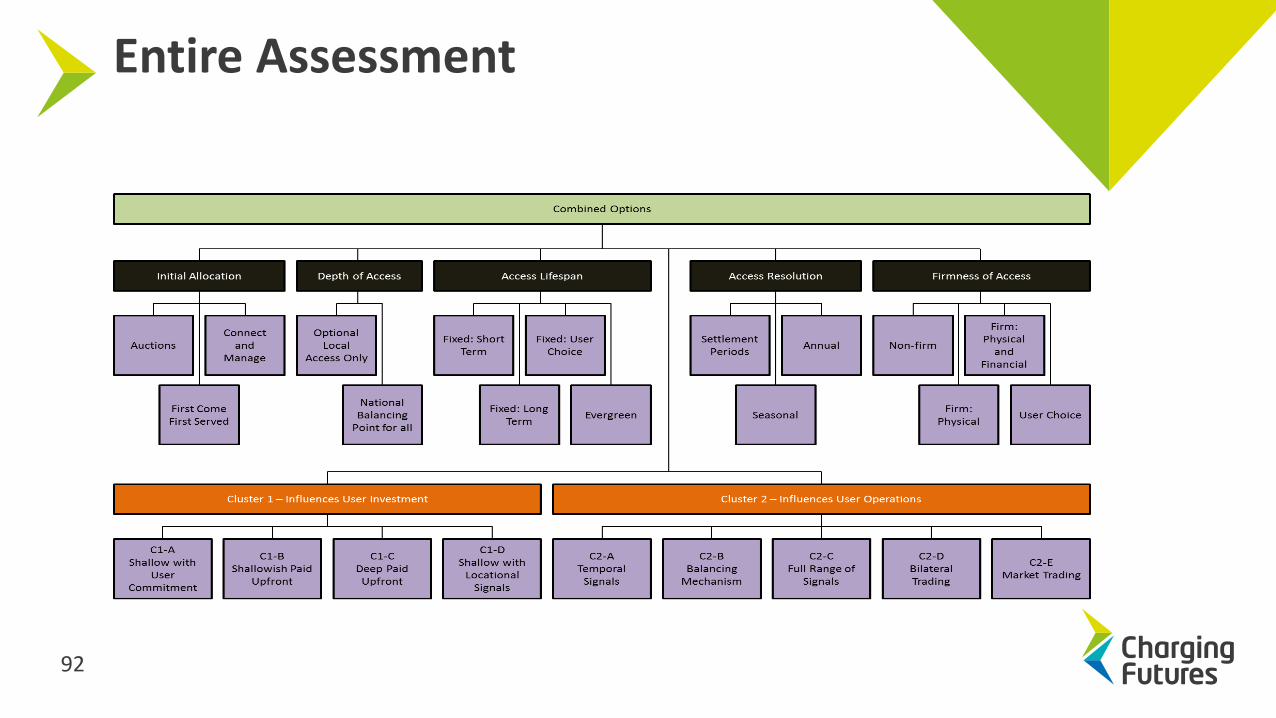
Entire Assessment
92

Cluster 1 – Influences User Investment
Cluster 1:Building Blocks which Influence User Investment Decisions
Connection Boundary
Shallow
Timing of Connection Charge Granularity of locational signalsUser commitment for wider
network investment
Shallowish
DeepUnsecured
annuityPaid up front
Secured annuity
High (e.g. nodal)
Some (e.g. zonal)
NoneSecuritised after conn.
Securitised until conn.
None
93

Cluster 1 – Influences User Investment
Greater alignment of principles between transmission and distribution
Connection charging boundary:
> Shallow boundary paired with cost-reflective ongoing locational charges favoured by many TF members
> Locational charging may not be feasible or desirable at HV or LV – risks a ‘postcode lottery’
> hence, Shallowish boundary may remain appropriate for some users
> Deep boundary is seen as a barrier to investment
User commitment:
> User commitment up to, and potentially for a fixed time beyond, the time of connection reduces the risk of costs associated with stranded assets falling on the wider body of users…
> …but its implementation could be burdensome to deliver for a large number of users
> Need to ensure benefits outweigh costs of delivery
Transitional challenges:
> A move to a shallow connection charging boundary and locational ongoing usage charges could present challenges for existing users (at distribution) who have paid shallowish connection charges
94

Cluster 2 – Influences User Operations
95

Cluster 2 – Influences User Investment
Network Companies could fine tuning real-time user operations
> Extended Balancing Mechanism
> Approaches close to Active Network Management (as on distribution)
Re-allocation of capacity by market-based or bilateral trading requires
> Network planning studies to ensure sufficient network capability
> Exchange rates
> Potentially a capacity threshold for re-allocation
> Ways to ensure a level-playing field between larger and smaller users
Time of Use charges - can have an important role but may not alone be sufficient to guarantee security of supply
Locational charges - can have an important role building on existing models at transmission and EHV. Use at HV / LV would require improvements to existing models
Measures to avoid gaming by market participants
Requires users to have an agreed capacity
Different types of operational signal may be better suited for different users
The many options are not necessarily mutually exclusive but must be coordinate
96

Initial Allocation
First come first served
> First come first served with additional queue management
> First come first served with Connect and manage
Auctions/trading
> Universal auctions
> Targeted auctions
97

Initial Allocation – Auctions
Universal auctions
> access is secured by those who value it most
> Socio-economic consequences of ‘winners and losers’.
Targeted auctions
> e.g. auctions behind specific constraints.
> Requires assessment of would impact current and future network users.
Any form of auction presents significant political, regulatory, economic and operation challenges
98

Initial Allocation - FCFS
First come first served
> There will always be an element of first come first served whether it relates to the connections process or in relation to the readiness of a user’s project to participate in an initial allocation process.
> Auctions with gate closure may be difficult to align with the timescales of multiple users’ construction projects.
Identifying spare capacity for initial allocation
> The reallocation of ‘spare’ capacity may lead to efficient use of existing levels
> Consideration how the term ‘spare’ is defined e.g. voluntarily surrendered or require a mechanistic approach based on contracted terms.
99

User Perspectives on Access Rights
> Depth: General preference for full network access, although some users may only want to be part of a local energy market
> Lifespan: Wide range of views from short term (i.e. within a day) to long term (i.e. 40 years plus) and forever...
> Time of Use: Wide range of time of use choices from fixed access to varying at different times (i.e. within day, month or year)
> Firmness (Financial and Physical): Wide range of views whether financially firm, financially non-firm, or have the choice. However all network users want >99.99% reliability
> Standardisation of Access: Mixed response with a leaning towards standardisation
100

Access Rights
Wide range of views expressed by Task Force members
> little or no preference for bespoke arrangements
> responses indicated they value choice across all the other access characteristics (i.e. depth, lifespan time of use, and level of firmness).
Core and non-core access rights for domestic and small commercial users connected at LV should be considered
> i.e. a basic capacity for essential services with options to buy additional access for things like electric vehicle charging
Transitional arrangements
> To consider feasibility of offering these arrangements (e.g. the definition of and movement towards financial firmness of DG)
> To consider the relative ease of implementation (i.e. Time of Use may be easier that or local/financially firmness for DG)
> To ensure arrangements are charged in a cost reflective manner
101

Tariff Design and Modelling
Tariff design and economic modelling needs to be appropriate to the choice of C1 and C2.
Tariffs must be visible and predictable
Time of Use
> If cost-reflective, can create incentives for users to amend their behaviour
> Seasonal tariffs offer a more targeted price signal which may be more cost-reflective
> Further work required to understand the customer response to Time of Use signals
Active network management
> Could profile capacity at distribution, similar to the Balancing Mechanism at transmission.
> BM signals may be in conflict with Time of Use signals
Number of charging arrangements
> Natural split between LV / HV and EHV (Distribution) and Transmission networks.
> The harmonisation, rationalisation, or increase in commonality is seen as beneficial
> Extending EGV/Transmission models to LV and HV has not been attempted before
The design of future tariffs might need to reflect the use of core and non-core capacity
102

Tariff Design and Modelling
Tariff design and economic modelling needs to be appropriate to the choice of C1 and C2.
Tariffs must be visible and predictable
Time of Use
> If cost-reflective, can create incentives for users to amend their behaviour
> Seasonal tariffs offer a more targeted price signal which may be more cost-reflective
> Further work required to understand the customer response to Time of Use signals
Active network management
> Could profile capacity at distribution, similar to the Balancing Mechanism at transmission.
> BM signals may be in conflict with Time of Use signals
Number of charging arrangements
> Natural split between LV / HV and EHV (Distribution) and Transmission networks.
> The harmonisation, rationalisation, or increase in commonality is seen as beneficial
> Extending EGV/Transmission models to LV and HV has not been attempted before
The design of future tariffs might need to reflect the use of core and non-core capacity
103

Conclusions on further work required
• Assessment of key drivers of costs on transmission and distribution networks• Aim to develop a transparent regime where network users can see areas where their decisions will save costs.
• Case study review - how particular options will work in practice, e.g:• Targeted auctions for initial allocation and other options for short and long-term trading;
• Application of core or basic capacity for domestic and small commercial users;
• New mechanisms for managing unused capacity;
• Safeguarding newly connecting and existing users form the high costs of rural or space networks; and
• User’s behaviours in response to cost and price signals.
• Assessment of feasibility of:• Depth of access;
• Standardisation of access; and
• Financial firmness at distribution.
• Mitigation of disadvantages identified by the Task Forces104

Conclusions on further work required
• Implementation and transitional arrangements
• Different approaches for different user types• Should take into consideration outcomes for flexibility service providers and ensure
vulnerable users are treated appropriately
• Balancing the needs of existing compared with future users
• Impacts and interactions arising from different options• Facilitate greater independent participation or require stronger reliance on intermediaries?
• Relationship between the options considered and design standards (SQSS and P2/6)
• Interaction of network charging signals with the BM, Capacity Market and wholesale price;
• Susceptibility of different options to gaming; and
• Interaction of different options with potential creation of local markets.
• impact of options on owners/operators of private networks, independent licensed distribution networks and offshore transmission networks.
105

Conclusions on further work required
• The impact and linkages to other strategic programmes:
• Baringa - impact assessment of the scale of existing issues
• the Targeted Charging Review
• the Energy Networks Association’s Open Networks programme
• RIIO-2
• ongoing changes to retail competition
• The risk of adverse unintended consequences.
• The recovery of network costs incurred in the provision of flexible (ANM) connections
106

Electricity Network Access Project:Q&A
Q&A membersFacilitator – Louise Schmitz, NG ESO – Lead Secretariat
Jon Parker, Ofgem
Duncan Sinclair, Baringa
Nigel Bessant, Scottish & Southern Electricity Networks
Paul McGimpsey, SP Distribution & SP Manweb
Chris Ong, UK Power Networks108

Coffee break
14:55 – 15:15
TCR, Access/Forward-looking charges and Settlement ReformA look at the overall programme
Frances Warburton, Ofgem

TCR
Ensure recovery of residual charges
minimises distortions and is fair
Consider practicalities,
cost and proportionality of the policy options
Access/Forward-looking
charges
Address network constraints;
Optimise network use through smart
and flexible technologies;
Adapt to growth in distributed energy
resources
Review network access rights;
Improve cost-reflectivity of fwd-
looking charges
Settlement Reform
Expose suppliers to true cost of customer
consumption to help customers
move their demand away from
system peak
Create a more accurate, efficient, timely and future-
enabling settlement system
How?
TCR, Access/forward-looking charges and Settlement Reform –the overall programme
Alignment of policy objectives and implementation
What?
111

Questions to consider
> Identify two or three key risks/opportunities across the overall
programme.
> What policy links and synergies do you see/have concerns about?
> Are there timing issues which give you concern?
> What implementation crossovers need to be considered?
> What IT systems will the reforms impact on? What systems crossovers
should be considered (eg settlement systems and network charging
systems)?
112

Initial reflections on discussions
> Frances Warburton, Director, Energy Systems Transition, Ofgem
> Andrew Self, Head of electricity Network Charging, Ofgem
> Anna Stacey, Head of Settlement Reform, Ofgem
> Jon Parker, Head of Electricity System Framework, Ofgem
113

Next steps and closing remarksFrances Warburton, Ofgem - Forum Chair

Objectives for the day
> Learn about initial options on Access Rights and Forward Looking
Charges from Task Forces
> Learn about how the wider landscape and developments in
technology are relevant to charging and access reform.
> Contribute your thoughts on initial Access Rights and Forward
Looking Charges options
> Ask your questions to Ofgem and Task Force members
115

Your feedback
Go to sli.do
#chargingfutures

Thank you, and have a safe journey home