charging india’s four wheeler transport
TRANSCRIPT
i
CHARGING INDIA’S FOUR-WHEELER
TRANSPORTA Guide for Planning Public Charging
Infrastructure for the Four-Wheeler Fleet in Indian Cities
Shyamasis Das, Chandana Sasidharan, Anirudh Ray
An initiative supported by

ii
The cover-page has been designed in a way to minimise ink-use and reduce carbon footprint in printing.

iii
CHARGING INDIA’S FOUR-WHEELER TRANSPORTA Guide for Planning Public Charging Infrastructure for the Four-Wheeler Fleet in Indian Cities
Shyamasis Das, Chandana Sasidharan, Anirudh Ray

iv
Copyright:
© 2020, Alliance for an Energy Efficient Economy (AEEE)
May 2020
CHARGING INDIA’S FOUR-WHEELER TRANSPORT - A Guide for Planning Public Charging Infrastructure for the Four-Wheeler Fleet in Indian Cities
Suggested citation:
Das, S., Sasidharan, C., Ray, A. (2020). Charging India’s Four-Wheeler Transport. New Delhi: Alliance for an Energy Efficient Economy.
About Alliance for an Energy Efficient Economy:
Alliance for an Energy Efficient Economy (AEEE) is a policy advocacy and energy efficiency market enabler with a not-for-profit motive.
About Shakti Sustainable Energy Foundation:
Shakti Sustainable Energy Foundation seeks to facilitate India’s transition to a sustainable energy future by aiding the design and implementation of policies in the following areas: clean power, energy efficiency, sustainable urban transport, climate policy, and clean energy finance.
Contact:Shyamasis DasPrincipal Research Associate & Lead – Power Utility & Electric MobilityAlliance for an Energy Efficient Economy (AEEE)New DelhiE: [email protected]
Acknowledgement:
The authors express sincere gratitude to N. Mohan (Energy Efficiency Services Limited) and Ravi Gadepalli for their critical feedback on the report.
Disclaimer:
The views/ analysis expressed in this report/ document do not necessarily reflect the views of Shakti Sustainable Energy Foundation. Furthermore, the Foundation does not guarantee the accuracy of any data included in this publication or accept any responsibility for the consequences of its use. This report is based on the best available information in the public domain. Every attempt has been made to ensure correctness of data. However, AEEE does not guarantee the accuracy of any data or accept any responsibility for the consequences of use of such data.
*For private circulation only.
v
Table of Contents
1 IntroductIon 11.1 Context 21.2 Electric car usage in India 31.3 Electric car models in the Indian market 41.4 Comparison of Indian and international electric car models 41.5 Need for investigation 5
2 objectIves, scope, and approach 72.1 Who can benefit from this study? 9
3 dIfferent four-wheeler transport segments In IndIa and theIr possIble chargIng facIlItIes 11
3.1 Electric four-wheeler segments 123.2 Possible public charging facilities for electric four-wheelers 14 3.2.1 Preferences for e-4W fleet charging facilities 16
4 locatIng and plannIng publIc electrIc four-wheeler chargIng facIlItIes 21
4.1 Site selection approach for public e-4W charging facilities 22 4.1.1 Site selection approach for en-route charging facility 23 4.1.2 Site selection approach for charging facility at off-street public parking space 24 4.1.3 Site selection approach for charging facility at on-street public parking space 25 4.1.4 Site selection approach for charging facility within office premises 264.2 Model layout of public e-4W charging facility 27
5 chargIng technologIes for electrIc four-wheelers 295.1 Overview of global EVSE classification practices 305.2 Salient features of charging technologies 325.3 Categorising charging technologies 33 5.3.1 AC Charging 34 5.3.2 DC Charging 39 5.3.3 Inductive Charging 43 5.3.4 Battery Swapping 445.4 Comparative assessment of available charging options 45
6 selectIon of “best-fIt” chargIng technologIes 49
7 stakeholder collaboratIon In chargIng Infrastructure deployment 57
annexures 61Annexure A – MCDMs for e-4W charging at public parking space 62Annexure B – MCDMs for e-4W charging at charging facility within office premises 65Annexure C – Charging time estimation 68Annexure D – List of stakeholders consulted in study 69

vi
List of Figures
Figure 1: Comparison of battery capacity of Indian and international car models 5
Figure 2: Different segments of 4-W commercial fleets 13
Figure 3: Possible charging facilities for different commercial electric four-wheeler segments 15
Figure 4: Scale used in stakeholder survey on types of charging facilities 16
Figure 5: Charging facility preferences of on-demand cab fleets 17
Figure 6: Charging facility preferences of staff transport fleets 17
Figure 7: Charging facility preferences of logistics fleets 18
Figure 8: Charging facility preferences of charging service providers 18
Figure 9: Site selection approach for en-route charging facility 24
Figure 10: Site selection approach for charging facility at off-street public parking space 25
Figure 11: Site selection approach for charging facility at on-street public parking space 26
Figure 12: Site selection approach for charging facility within office premises 26
Figure 13: Model angular parking layout (off-street parking) 27
Figure 14: Overview of charging technology characterisation 33
Figure 15: e-4W charging technology categories 34
Figure 16: Bharat DC 001 and AC Level II-A chargers at captive charging facility 35
Figure 17: EV charger at a parking space 36
Figure 18: Captive charging facility 38
Figure 19: Bharat DC 001 public charger in Khan Market, Delhi 40
Figure 20: 50 kW DC charger in Ahmedabad 41
Figure 21: En-route electric vehicle charging station 42
Figure 22: Electric vehicle charging facility at off-street parking space 42
Figure 23: Scale for assessing the importance of a parameter 50
Figure 24: Mapping of possible key stakeholder roles in facilitating charging infrastructure roll-out in an Indian city 59

vii
List of Tables
Table 1: Overview of e-4Ws in Indian market 4
Table 2: Relevance of the research on public charging infrastructure implementation for different entities 9
Table 3: Reference sheet for model angular parking layout (off-street parking) 28
Table 4: EVSE Levels defined in the U.S. 30
Table 5: DC charging levels defined in the U.S. 31
Table 6: EVSE Modes defined in Europe 31
Table 7: Public charging standards in India 32
Table 8: AC charger technical specifications 35
Table 9: AC charging cost estimates 36
Table 10: DC plug-in charger technical specifications 39
Table 11: DC plug-in charger cost estimates 39
Table 12: Technical specifications and cost of wireless home chargers 43
Table 13: Battery swapping cost estimates 44
Table 14: Comparison of available e-4W charging options in India 46-47
Table 15: Technical parameters for charging technology selection for en-route public charging facilities 52Table 16: Economic parameters for charging technology selection for en-route public charging facilities 53
Table 17: Charging technologies applicable for LV and HV e-4Ws 53
Table 18: Multi-Criteria Decision Matrix for LV e-4W charging at en-route public charging facility 54
Table 19: Multi-Criteria Decision Matrix for HV e-4W charging at en-route public charging facility 54
Table 20: Best-fit technologies for e-4W charging at different types of charging facilities 55
Table 21: Technical and economic parameters for charging technology selection for charging at public parking space 62
Table 22: Multi-Criteria Decision Matrix for LV e-4W charging at public parking space 63
Table 23: Multi-Criteria Decision Matrix for HV e-4W charging at public parking space 64
Table 24: Technical and economic parameters for charging technology selection for charging within office premises 65
Table 25: Multi-Criteria Decision Matrix for LV e-4W charging at captive charging facility within office premises 66
Table 26: Multi-Criteria Decision Matrix for HV e-4W charging at captive charging facility within office premises 67
Table 27: Charging time for LV e-4W 68
Table 28: Charging time for HV e-4W 68
Table 29: List of stakeholders consulted in questionnaire-based survey 69

viii

1
1 Introduction

2
Shifting away from iCE vEhiClES iS no longEr a ChoiCE; thiS tranSformation iS nECESSary to dECarboniSE road tranSport in india.
1.1 Context In India, there is growing interest among policymakers to encourage adoption of Electric Vehicles (EVs) for road transport and phase out fossil fuel-consuming Internal Combustion Engine (ICE) vehicles, in order to achieve the following three major objectives:
Reduce petroleum imports and thus increase national energy security
Import of crude oil accounts for about 85% of India’s petroleum supply. Reduction of oil imports will also help decrease the country’s Current Account Deficit (CAD).
Reduce India’s carbon footprint by leveraging higher efficiency of EVs over ICE vehicles and enabling effective renewable energy off-take
EVs are almost 5 times more efficient than similar ICE vehicles (NITI Aayog & World Energy Council, 2018). The total greenhouse gas (GHG) emission reduction potential from the vehicles supported under the second phase of Faster Adoption and Manufacturing of Hybrid and Electric Vehicles in India (FAME) is estimated to be about 7.4 million tonnes of carbon dioxide emissions over the deployed vehicles’ lifetime (NITI Aayog & RMI, 2019). Furthermore, India’s renewable energy generation capacity (including hydro) has reached more than 129 gigawatts (GW), equivalent to about 35% of the total power generation capacity (CEA, 2019). Thanks to strong policies to increase the share of non-fossil fuel-based electricity, the emission intensity of grid electricity in India can be further reduced. Not to mention the potential application of EVs for energy storage could help ensure grid stability as dependence on variable renewable energy sources increases.
Reduce vehicular emissions of particulate matter (PM), other pollutants and GHGs
Twenty-two of the 30 most polluted cities (in terms of PM2.5 concentration) are reportedly in India (IQAir, 2018). This is not only an issue in Tier-I cities; pollution levels in Tier-II and Tier-III cities are increasing at alarming rates.
It is evident that shifting away from ICE vehicles is no longer a choice; this transformation is necessary to decarbonise road transport in India. However, there are still some perceived barriers to adoption of EVs, including the high upfront EV cost, limited driving range of existing EV models, lack of adequate charging infrastructure, considerably long charging time, and the need for awareness of vehicle owners about EVs.
The Government of India (GoI) has taken a slew of measures to address some of these challenges. The FAME Phase II subsidy scheme, with a budgetary provision of I 100 billion, is a major policy intervention that aims to reduce the cost of EV acquisition and promote the establishment of public EV charging facilities. One key aspect of this scheme is its strong push for commercial fleets in the 2-wheeler, 3-wheeler, and 4-wheeler segments to shift to electric. Apart from FAME-II, the Finance Bill 2019 encourages private ownership of electric 2-wheelers (e-2Ws) and 4-wheelers (e-4Ws) by allowing income tax deduction of up to I 1.5 lakh for the interest paid on EV loans (Press Information Bureau, 2019). Hence, there are significant fiscal incentives available to generate demand for EVs. However, will such monetary support be enough to address the implementation challenges around

3
electric mobility in India? Probably not. The fact is that no subsidy amount is sufficient to overcome all the barriers to large-scale EV deployment. The challenges are multifarious in nature and warrant a holistic strategy to address them, which, in turn, requires the deep involvement of a myriad of stakeholders. Charging infrastructure, the backbone of electric mobility, is an area that requires special attention, planning, and strategy.
The report previously released by the Alliance for an Energy Efficient Economy (AEEE) on this topic, entitled “Charging India’s Bus Transport”, takes a deep dive into the challenges associated with electrifying intra-city public bus fleets and emphasises the importance of comprehensive planning for the establishment of charging infrastructure for the bus fleets. Continuing the pursuit of AEEE’s research endeavour to address the critical challenges related to EV charging infrastructure, this report focuses on the electric four-wheeler segment.
1.2 Electric car usage in indiaOne of the first instances of mass EV adoption in India occurred under the demand aggregation model for bulk EV procurement by Energy Efficiency Services Limited (EESL) for use by various government departments. Against the tender issued by EESL to procure 10,000 electric cars, 1,500 have been delivered as of 2nd October, 2019. Some state governments, e.g. in Andhra Pradesh and Gujarat, also adopted a similar model for the promotion of electric cars (Saluja, 2019).
Commercial adoption of electric cars in the country got a fillip when Lithium Urban Technologies and EEE Taxi started all-electric staff transport fleet in 2015. rydS, a Baghirathi Group company, has also been operating a fleet of 100 electric cars in the business-to-business (B2B) segment since February 2018 (Mahindra Electric, 2018). In addition, EV manufacturer Mahindra Electric has started a connected mobility service using electric cars (Glyd, 2019).
In the business-to-customer (B2C) segment, Ola was the first player to introduce electric cabs, in May 2017, as part of its multi-modal electric mobility pilot project in Nagpur, Maharashtra (Arora & Raman, 2019). The same year witnessed another cab hailing service provider, Uber, tying up with EEE Taxi to bring electric vehicles into its fleet (PTI, 2019). Other new players in electric car passenger service include Blu Smart and Prakriti (Blusmart, 2019) (Prakriti, 2020).
It should be noted that there is no reported deployment of e-4Ws for freight transport in India, which could be attributed to the lack of e-4W models for this purpose in the Indian market. Most of the cars currently available in the Indian market are only suitable for passenger transport.
Charging infraStruCturE, thE baCkbonE of ElECtriC mobility, iS an arEa that rEquirES SpECial attEntion, planning, and StratEgy.

4
1.3 Electric car models in the indian marketIndia has two categories of electric cars, based on their range and battery capacity. The current Indian e-4W market is dominated by cars with a range of 100-200 km and a lower battery pack capacity. The newer models in India have higher battery capacities and ranges of up to 300-400 km. Table 1 provides the key details of e-4Ws in the Indian market.
There are different specifications and charging practices associated with the older and newer models. The older models have a low voltage battery pack (<120 volts (V)) that cannot be charged as quickly as that of the newer models1. In this report, e-4Ws have been categorised into two broad classes, based on the battery voltage:
1. Low Voltage (LV) e-4Ws: These cars have a battery voltage of up to 120V.
2. High Voltage (HV) e-4Ws: These cars have a battery voltage above 120V.
1.4 Comparison of indian and international electric car models
There are almost forty passenger car models that are popular in the key electric car markets in the United States (U.S.), Europe, and China. Only two6 internationally available models have been launched in India. All the other models in India are home-grown in design. In comparison with the international models, the battery capacity of the Indian models is lower, as highlighted in Figure 1. This trend is expected to continue, given the cost sensitivity of Indian consumers and the policy push for indigenisation of auto components (Ministry of Finance, 2020). This makes the planning for EV charging technology in India distinct from the evolution of charging facilities in the rest of the world.
1 for more details, please refer to chapter 5: charging technologies for electric four-wheelers2 the specifications of vehicles are obtained from the respective manufacturer websites (mahindra electric, n.d.)
(tata motors, n.d.) (morris garages) (hyundai, n.d.) (tata motors, n.d.).3 charging time provided by oem for charging at power ≤ 3.3 kw4 charging at 50 kw for hv e-4w and at 15 kw for lv e-4w5 estimated based on battery ampere-hour (ah) values provided by vehicle manufacturer6 hyundai kona electric and mg Zsev are the international car models that have been launched in India.
tablE 1: ovErviEw of E-4wS in indian markEt
Manufacturer Model2 Type of Transport Range (km)
Battery Specifications
Maximum Charging Time3
Minimum Charging Time4
Voltage Category
kWh V5 minutes minutes
Mahindra e2Oplus Passenger 110 11 54 360 LV
Mahindra e2Oplus Passenger 140 15 54 440 95 LV
Mahindra e-Verito Passenger 181 21.2 72 690 90 LV
Mahindra e-Supro Passenger/ Freight 112 14 72 510 LV
Tata Tigor Passenger 213 21.5 72 690 180 LV
Morris Garages ZS EV Passenger 340 44.5 350 1080 50 HV
Hyundai Kona Passenger 452 39.2 350 1140 57 HV
Tata Nexon Passenger 300 30.2 320 480 60 HV

5
1.5 need for investigationThe electric mobility sector in India is at a nascent stage. In spite of the government’s unambiguous policy signal and considerable financial support, EV market development is still on a bumpy road. One significant challenge with regard to scaling up EV adoption is provision of EV charging infrastructure. The e-4W segment in particular is grappling with this barrier to EV adoption. Apart from issues like the limited availability of e-4W models across different four-wheeler segments and vehicle quality issues, the lack of e-4W penetration in the Indian EV market is attributed to lack of public charging infrastructure.
To create a competitive, scalable market for setting up public EV charging facilities in India, the Ministry of Power issued a clarification on 13th April, 2018 to delicense EV charging infrastructure (Ministry of Power, 2018). This opens up the sector to a wide range of players who can invest in the development of charging infrastructure without having a prior licence to do so. In spite of this, the progress in the deployment of public charging stations has been slow. The reason for this could be the lack of familiarity with and perceived complexity of setting up public charging facilities, which the stakeholders viz. the industry, policymakers, & public agencies, transport planners, and financial institutions have never dealt with before.
The government has gotten involved in various sectors to catalyse interventions in the public interest in their early stages and ultimately attract private players. Similarly, in the case of EVs, the central and state governments are encouraging central and state Public Sector Undertakings (PSUs), state Power Distribution Utilities, and other public agencies, including Urban Local Bodies (ULBs) and Urban/ Area Development Authorities, to support the establishment of public charging facilities. Public entities such as EESL, National Thermal Power Corporation, and state power distribution utilities have already taken up some initiatives to this end.
However, despite the involvement of the aforementioned public entities, EV charging is a new domain for them, and, thus, several challenges remain with
Bat
tery
cap
acit
y in
kW
h
120
100
80
60
40
20
0
International Indian
figurE 1: CompariSon of battEry CapaCity of indian and intErnational Car modElS
in SpitE of thE govErnmEnt’S unambiguouS poliCy Signal and ConSidErablE finanCial Support, Ev markEt dEvElopmEnt iS Still on a bumpy road.

6
respect to the planning and establishment of e-4W charging infrastructure. The following critical questions need to be analysed and addressed to achieve effective roll-out of public electric four-wheeler (4-W) charging facilities:
i. What could be the charging requirements and preferences of 4-Ws in India?
ii. Where can the e-4Ws be recharged? How can the existing guidelines for setting up public charging stations be effectively used for deployment of e-4W charging infrastructure?
iii. Is there enough space available in Indian cities to establish this new infrastructure for urban road transport?
iv. What types of charging technologies are suitable for e-4Ws? Are they cost-effective in large-scale deployment?
v. What would be the electricity supply requirement at the public charging facilities? Do the places identified for e-4W charging have the necessary local electricity distribution network?
Addressing these questions requires comprehensive assessment of the key issues. India’s infrastructural challenges are unique, and, hence, the best practices in electric mobility (e-mobility) identified in advanced international markets may not be feasible or effectively address India’s problems; the approach to tackling the challenges and developing solutions needs to be home-grown or tailor-made for Indian cities.
Apart from a few isolated studies that deal with EV charging infrastructure in general, there is a lack of thorough analysis that focuses on the e-4W segment in the Indian context. Considering this critical knowledge gap, the researchers at AEEE have carried out a detailed study on e-4W charging infrastructure planning in India.
india’S infraStruCtural ChallEngES arE uniquE, and, hEnCE, thE bESt praCtiCES in ElECtriC mobility (E-mobility) idEntifiEd in advanCEd intErnational markEtS may not bE fEaSiblE or EffECtivEly addrESS india’S problEmS

7
2 Objectives, scope, and approach

8
This study aims to facilitate the planning and establishment of public e-4W charging infrastructure in Indian cities. To this end, this research has three main objectives:
1. To formulate an effective and easy-to-apply framework for facilitating the identification of locations for public charging infrastructure for different e-4W segments
2. To develop a tool to evaluate the suitability of different charging technologies and objectively select the “best-fit” for deployment at potential public charging locations or facilities
3. To provide useful guidance for the establishment of public charging facilities
Planning public e-4W charging infrastructure in the Indian context is akin to solving a jigsaw puzzle. There are various elements involved in e-4W charging, such as the vehicle models, e-4W segments, types of chargers and their technical and commercial specifications, observed commute/ travel patterns, factors involved in selecting charging facility locations, available electricity distribution network, etc.
Considering the abovementioned aspects, the investigation comprises the following major steps:
i. Identifying the different e-4W segments based on a review of 4-W transport in Indian cities
ii. Identifying the potential locations (or types of charging facilities) for public charging stations to cater to the different e-4W segments
iii. Developing an approach for locating public e-4W charging facilities
iv. Creating model spatial layouts for different types of public EV charging facilities
v. Examining the different categories of EV charging technologies prevalent in mature EV markets and developing a specific classification framework for e-4Ws in the Indian scenario
vi. Carrying out a comparative assessment of the charging options and identifying viable charging technologies for e-4Ws in India
vii. Developing a unique Multi-Criteria Decision Matrix for selection of the best-fit charging technology for each type of charging facility
viii. Identifying the key stakeholders and their possible roles in scaling up deployment of public charging infrastructure in a city
The outcome of this exercise should be considered in the context of the Indian e-4W market and the public parking options or patterns commonly seen in the Indian cities. The recommendations given in this report are not prescriptive; rather, the purpose of this study is to provide general guidance for setting up public e-4W charging infrastructure in an Indian city. The findings should not be construed as specific to a particular city or fleet. For actual implementation, a more elaborate feasibility study should be carried out separately by the implementing agency.
thErE arE variouS ElEmEntS involvEd in E-4w Charging, SuCh aS thE vEhiClE modElS, E-4w SEgmEntS, typES of ChargErS and thEir tEChniCal and CommErCial SpECifiCationS, obSErvEd CommutE/ travEl pattErnS, faCtorS involvEd in SElECting Charging faCility loCationS, availablE ElECtriCity diStribution nEtwork, EtC.

9
2.1 who can benefit from this study?The research results can potentially help a range of actors, from the Central Nodal Agency and State Nodal Agencies, to public implementing agencies and power distribution utilities, to ULBs and Urban/ Area Development Authorities. It is believed that all of these stakeholders can find specific and actionable takeaways in this study and potentially use this report as a go-to reference when implementing public charging infrastructure in Indian cities. Table 2 summarises how different actors can make use of this study.
tablE 2: rElEvanCE of thE rESEarCh on publiC Charging infraStruCturE implEmEntation for diffErEnt EntitiES 78
Actor How the actor can use this study
Implementing agencies7
• To identify potential charging station users in the 4-W segment and understand their charging preferences
• To set up public charging stations in a 3 x 3 km grid in a city, as proposed in the current guidelines issued by the GoI Ministry of Power
• To identify potential locations and associated critical factors for setting up different types of public charging facilities
• To compare and select appropriate charging technologies according to the types of public charging facilities and e-4W specifications
• To plan public charging facilities based on the model layout8 of different types of charging facilities
• To engage with key actors for on-ground implementation of e-4W charging infrastructure
ULBs and Urban/ Area Development Authorities
• To adopt an effective plan for earmarking urban space within their jurisdiction for different types of e-4W public charging facilities
• To engage third parties to set up public charging facilities in a city
Power distribution utilities
• To understand the possible opportunity to invest in the development of e-4W charging infrastructure in their licence areas
• To plan distribution network upgradation to cater to the EV charging load
• To make appropriate arrangements for establishing public charging facilities
• To make informed decisions on provision of electricity connections for different e-4W charging facilities
State Nodal Agencies
• To become familiar with the current e-4W models and applicable charging technologies
• To adopt a practical approach to prioritising locations in a city for public e-4W charging stations
• To develop appropriate plans for engaging implementing agencies to set up, operate, and maintain public charging stations in the state
• To streamline the approval and incentive processes for the establishment of EV charging facilities
Central Nodal Agency
• To get an overview of the e-4W market and a thorough understanding of the available charging technologies, which will help in decision-making
• To advise the state-level stakeholders on planning for the establishment of public charging stations
7 as per the latest guidelines issued by the ministry of power, an implementing agency, to be selected by the respective state nodal agency, would be responsible for the installation, operation, and maintenance of charging facilities.
8 model layout refers to the recommended layout for setting up a charging facility in a given plot area. the layout focuses on optimum usage of parking space.
thE rESEarCh rESultS Can potEntially hElp a rangE of aCtorS, from thE CEntral nodal agEnCy and StatE nodal agEnCiES, to publiC implEmEnting agEnCiES and powEr diStribution utilitiES, to ulbS and urban/ arEa dEvElopmEnt authoritiES.

10

11
3 Different four-wheeler transport segments in India and their possible charging facilities

12
3.1 Electric four-wheeler segmentsThe share of 4-W commercial fleets in both passenger and goods transport in Indian cities is increasing rapidly with the rise in app-based cab and e-commerce services. For example, the two main ride-hailing companies in India - Ola (India) and Uber India, have together registered about 3.65 million rides per day in 2019 till May, compared to 1 million rides per day in 2015 (The Economic Times, 2019). A recent study on an electric mobility pilot found that there is a business case for EV adoption in shared mobility, more so than in private ownership. The e-4Ws provide operational savings of I3.07 per km for fleet owners, allowing the costs to be recovered in 5 years. On the other hand, it takes around 11.5 years to recover the upfront cost for a private user, despite higher operational savings of I 4.57 per km (Arora & Raman, 2019). This shorter payback period for commercial vehicles is primarily due to the fact that these vehicles cover more kilometres per day than privately-owned vehicles.
In addition, e-commerce companies are doubling or tripling their number of delivery agents every year to meet the increased delivery demand, which leads to fleet expansion (The Economic Times, 2018). The FAME-II scheme also recognises the potential of electric mobility in commercial fleets; the scheme gives priority to commercial fleets in terms of subsidy allocation.
Hence, there is going to be significant charging demand from e-4W commercial fleets, and, consequently, the upcoming public charging facilities need to cater to these fleets to an appreciable extent, in addition to private electric cars. It is anticipated that the bulk of private e-4W charging would be in the form of home charging, which is supported by a study on charging trends. The study shows that in key EV markets, the majority of charging happens at the residences of EV owners. However, in urban areas, where possibilities for home charging may be limited, public charging facilities could potentially cater to private vehicles to some extent as well (ICCT, 2019).
On the other hand, shared mobility is gaining popularity. Because a commercial 4-W covers more kilometres per day than a private vehicle, the requirement for charging would be higher in the case of the former. It is therefore predicted that the charging demand from e-4W commercial fleets would exceed the demand from private cars. Therefore, the planning of e-4W charging infrastructure has to take into account the charging preference of commercial fleets.
The operation of commercial 4-W fleets varies significantly based on the purpose of use/ mobility, origin and destination points of the trips, trip attraction/ generation models, service/ business catchment area, etc. Upon careful scrutiny of the different kinds of operations, these fleets can be broadly segmented into two categories based on the type of load they carry, i.e. passengers or goods. Each of these broad categories is further segmented, as shown in Figure 2.
thE SharE of 4-w CommErCial flEEtS in both paSSEngEr and goodS tranSport in indian CitiES iS inCrEaSing rapidly with thE riSE in app-baSEd Cab and E-CommErCE SErviCES.

13
figurE 2: diffErEnt SEgmEntS of 4-w CommErCial flEEtS
A. Commercial passenger car segment – This vehicle segment caters to commercial passengers, transporting them from one point to another. This segment can be further divided into the following two categories:
1. On-demand cab fleets (intra-city): This segment caters to the mobility demand of the public within an urban area. The services of these fleets are increasingly becoming app-based. They primarily operate in two ways:
i) Single node operation: In this case, the starting point (node) for a cab is fixed and is also the point to which the cab will return after making one or multiple trip(s) (Rodrigue, Comtois, & Slack, 2013).
ii) Double node-buffer zone operation: Here, a cab’s movement generally centres around two nodes, i.e. the starting point (cab’s initial location) and ultimate destination (often, it is the resting place as pre-set by the cab driver). An individual who wishes to avail the cab service also follows similar two-node movement (Riejos, 2019). The cab and rider(s) get connected based on the preference of the driver and requirement of the rider(s).
For example, a driver may wish to go from point A to point D, and a rider may want to travel from point B to point C. If the trip from B to C falls within a reasonable buffer zone of the trip from A to D, the driver first moves from point A to point B to pick up the rider and then drops the rider at point C. After completing the trip, the driver continues to point D. Similarly, requests for pick-up and drop-off that are on the way from A to D and do not require significant detours are assigned to the driver, depending upon seat availability (Schiller & Kenworthy, 2017). There could be cases where the driver does not set a preferred destination, and, hence, connection with riders becomes simpler.
2. Staff transport fleets: operation involves ferrying the employees of an organisation between their workplaces (offices) and residences or other prefixed drop-off points (Iles, 2005) (Yaghoubi, 2017). The trips are mostly pre-planned, and the
E-4W COMMERCIAL FLEETS
PASSENGER
CAB ON-DEMAND FLEETS
OFFICE FLEETS
LOGISTICS FLEETS (food, grocery, courier and
e-commerce)
GOODS

14
drivers are generally aware of the travel demand that may arise during the day.
B. Goods segment – The operation of this segment entails transportation of goods from one point to another. In the context of this study, the term logistics fleet refers to the use of a fleet to transport goods from one point to another in a city, where the transactions commonly take place through e-commerce. The goods can be both perishable and non-perishable items. Often, the operation of these fleets is based on the hub-and-spoke model9 (Lun, Lai, & Cheng, 2010).
3.2 possible public charging facilities for electric four-wheelers
Public charging infrastructure is a key enabler for electric vehicle adoption. It is interesting to note that the global growth rates for electric vehicle uptake and public charging infrastructure were similar during the 2013-2018 period. At the beginning of 2019, there were almost 600,000 charging points worldwide. The typical locations for installation of charging infrastructure, besides homes and work places, are public locations such as highway exits, fuelling stations, parking lots, and curbside locations (Hall & Lutsey, 2020).
Successful deployment of public e-4W charging infrastructure depends on a set of intertwined factors, including:
• Capacity utilisation of the charging facilities
• Cost recovery by the charging service providers
• Cost-effective establishment and operation of the charging facilities
• Charging facility accessibility
To achieve the optimum of these factors, careful planning of charging infrastructure is critical and should take into account two key elements:
Where to charge, i.e. at captive charging facilities, public parking spaces, or en-route
How to charge, i.e. the type of charging technology to be adopted
It is envisaged that each of the identified electric fleet segments would depend on a host of charging facilities, which would differ primarily based on the locational aspect. In order to understand the preference of relevant stakeholders in terms of types of charging facilities, a stated preference survey was conducted with e-4W fleet operators and charging service providers10. e-4W fleet operators are the stakeholders representing on-demand cab, logistics, and staff transport fleets. Figure 3 highlights the possible types of charging facilities for different e-4W segments. Most of these charging facilities would also fulfil the charging requirements of private vehicles.
9 logistics companies use hub-and-spoke models for transporting freight, where delivery routes (connections) are arranged like a wheel. freight traffic moves along spokes connected to a central logistics hub.
10 refer to annexure d – list of stakeholders consulted in study.
ElECtriC flEEt SEgmEntS would dEpEnd on a hoSt of Charging faCilitiES, whiCh would diffEr primarily baSEd on thE loCational aSpECt.

15
figurE 3: poSSiblE Charging faCilitiES for diffErEnt CommErCial ElECtriC four-whEElEr SEgmEntS
Key features of the three types of public charging facilities are highlighted below:
1. En-route public charging facilities are located on the side of roads. They are similar to regular fuel refilling stations and are open to the public. These charging facilities can cater to both private cars and commercial fleets. In fact, en-route charging stations happen to be a popular alternative for drivers without reliable home and office charging options in a number of cities, such as London, New York, and Amsterdam (ICCT, 2020). Across Europe, for both inter- and intra-city travel, such facilities are becoming increasingly common (Global Transmission Report, 2020) (Ionity, 2020).
E-4W COMMERCIAL FLEETS
PASSENGER
ON-DEMAND CAB FLEETS
STAFF TRANSPORT FLEETS
LOGISTICS FLEETS (food, grocery, courier and
e-commerce)
Captive charging facility at logistics hub
En-route public charging facility
En-route public charging facility
En-route public charging facility
Charging facility at public parking space
Charging facility at public parking space
Charging facility at public parking space
GOODS
Captive charging facility for cab on-demand fleet
Public charging facilities Private charging facilities
Charging facility within office premise
As the study aims to facilitate the deployment of public charging facilities, it does not examine the captive charging requirements. The following three types of public charging facilities may be required in order to support e-4W mobility in Indian cities:
1. En-route public charging facilities
2. Charging facilities at public parking spaces
3. Charging facilities within office premises
For the purposes of the study, these three types of public e-4W charging facilities are considered.
16
2. Charging facilities at public parking spaces refer to parking spaces in public places like parking lots managed by ULBs, malls, business districts, hospitals, schools, community halls, etc. that are equipped with EV chargers or battery swapping systems. These facilities are open to the public, but sometimes with restricted access. They are either in off-street or on-street public parking spaces. Many such facilities have been established in the Netherlands, France, and Germany (Global Transmission Report, 2020). A few cities, including London, are planning to install charging facilities for commercial fleets in public and commercial hubs and semi-public depots (Hall & Lutsey, 2020).
3. Charging facilities within office premises are intended for charging the electric staff transport fleet. In addition, employees can also use these charging facilities to charge their private EVs (Funke, Sprei, Gnann, & Plötz, 2019). However, it is envisaged that a certain number of chargers would be reserved for use by the staff transport fleet. Currently, in Europe and North America, the numbers of such facilities are on the rise (Wood Mackenzie, 2019). Many cities, like San Francisco and Oslo, have mandated installation of chargers in office parking spaces (Hall & Lutsey, 2020).
3.2.1 preferences for e-4w fleet charging facilities
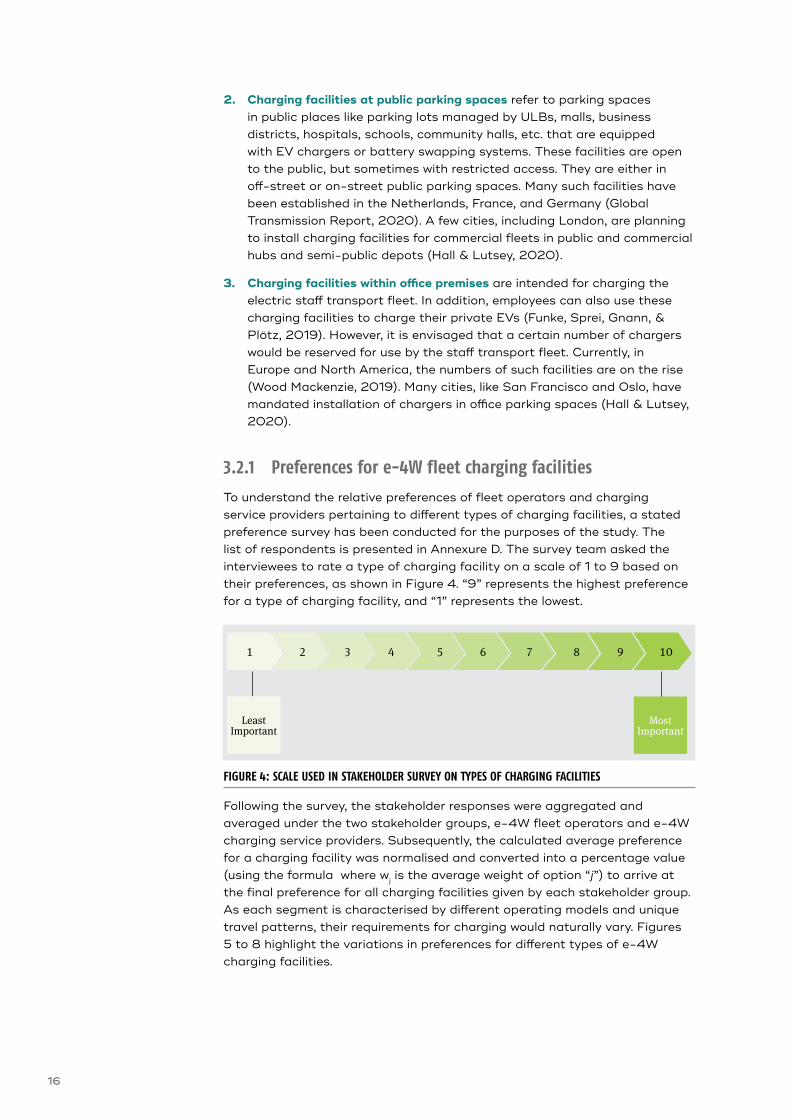
To understand the relative preferences of fleet operators and charging service providers pertaining to different types of charging facilities, a stated preference survey has been conducted for the purposes of the study. The list of respondents is presented in Annexure D. The survey team asked the interviewees to rate a type of charging facility on a scale of 1 to 9 based on their preferences, as shown in Figure 4. “9” represents the highest preference for a type of charging facility, and “1” represents the lowest.
figurE 4: SCalE uSEd in StakEholdEr SurvEy on typES of Charging faCilitiES
Following the survey, the stakeholder responses were aggregated and averaged under the two stakeholder groups, e-4W fleet operators and e-4W charging service providers. Subsequently, the calculated average preference for a charging facility was normalised and converted into a percentage value (using the formula where wj is the average weight of option “j”) to arrive at the final preference for all charging facilities given by each stakeholder group. As each segment is characterised by different operating models and unique travel patterns, their requirements for charging would naturally vary. Figures 5 to 8 highlight the variations in preferences for different types of e-4W charging facilities.
1098765431 2
Least Important
Most Important

17
Preference of on-demand cab fleet operators
figurE 5: Charging faCility prEfErEnCES of on-dEmand Cab flEEtS
Figure 5 indicates that on-demand cab fleets prefer captive charging facilities designated for them over other public charging options. However, a cab cannot entirely depend on captive charging. According to the feedback from cab-fleet operators, a cab drives more than 200 km a day on average, whereas the effective range of the existing electric car models is around 100 km. Hence, to avoid range anxiety, an on-demand cab fleet would require intermediate or opportunity charging, for which it would have to use charging facilities at public parking lots and en-route public charging stations. The survey shows a slightly higher preference for charging at public parking spaces vs. en-route facilities.
Preference of staff transport fleet operators
figurE 6: Charging faCility prEfErEnCES of Staff tranSport flEEtS
Unlike on-demand cab fleets, staff transport fleets do not show a strong preference for a particular charging facility. As per Figure 6, there is a slightly higher preference for charging at the office premises over the other two options. It is evident that the fleet would be willing to use all three types of charging facilities.
ON-DEMAND CAB FLEET
Captive charging for cab on-demand fleets
43%
Charging at en-route public charging stations
26%
Charging at publicparking spaces
31%
STAFF TRANSPORT FLEET
Charging facility withinoffice permise
36%
En-route public charging facility
33%
Charging facilityat public parking
spaces
30%
on-dEmand Cab flEEtS prEfEr CaptivE Charging faCilitiES dESignatEd for thEm ovEr othEr publiC Charging optionS.

18
Preference of logistics fleet operators
figurE 7: Charging faCility prEfErEnCES of logiStiCS flEEtS
In the case of logistics fleets, although there is a strong driver for e-4W adoption for freight transport in India, there are no reported cases of e-4W deployment by logistics fleet operators, due to the current lack of suitable e-4W models. Hence, in the absence of hands-on experience of logistics fleet operators in using e-4Ws in their fleets, the survey could not capture the preferences of this segment. Considering that e-4W adoption will eventually take off in this segment and has significant potential, the investigation through internal deliberation, using the same computational approach, has resulted in a prediction of the segment’s preferences (refer to Figure 7). The study finds that captive charging at logistics hubs is the overwhelming preference. The levels of preference for charging at en-route public charging stations and public parking lots are almost at par.
Preference of charging service providers
figurE 8: Charging faCility prEfErEnCES of Charging SErviCE providErS
LOGISTICS FLEET
Captive charging facility at logistics hub
52%
En-route public charging facility
24%
Charging facilityat public parking
spaces
24%
CHARGING SERVICE PROVIDERS
Charging facility withinoffice premises
22%
En-route public charging facility
15%Charging facility
at public parking spaces
23%
19%
Captive charging facility at logistics hub
21%
Captive charging facility for on-demand cab fleet
CaptivE Charging at logiStiCS hubS iS thE ovErwhElming prEfErEnCE.

19
The charging service providers’ preference to set up charging facilities at the identified charging locations is a critical data point for this study, as one can draw a contrast between this and the preference of fleet operators. As shown in Figure 8, the charging service providers express almost the same level of preference for establishing charging stations at public parking spaces, within office premises, and at logistics hubs. Setting up en-route public charging facilities is found to be the least preferable option, which could be attributed to the difficulty in finding space, along with the high expected cost of land rental in a city. Possible low capacity utilisation of chargers at en-route facilities could also be a reason behind the limited interest of charging service providers in this option.

20
21
4 Locating and planning public electric four-wheeler charging facilities

22
4 Locating and planning public electric four-wheeler charging facilities
4.1 Site selection approach for public e-4w charging facilities
Identification of suitable locations for public charging facilities may pose a challenge to public entities concerned with charging service provision, such as ULBs, area development authorities, State Nodal Agencies, power distribution utilities, the Central Nodal Agency, and other implementing agencies. The effectiveness and economic viability of running a charging facility depend on its utilisation, which, in turn, is contingent on the selection of a good location for the charging facility.
The ideal location of a charging facility is determined by a set of factors related to the establishment and operation of the charging facility. Specifically, one should consider the following when selecting a site:
• Charging demand potential: In order to establish a public e-4W charging facility, it is vital to understand whether the locations under consideration have the potential to attract vehicular traffic and, thereby, charging demand. This is necessary to ensure sufficient usage of the charging facility, which determines cost recovery.
• Infrastructure availability: There are various infrastructural requirements involved in setting up an e-4W charging facility. Therefore, evaluating the potential locations based on the availability of the requisite infrastructure is crucial to determining their viability for a charging facility of a certain capacity.
It should be noted that the above factors are important for site selection for all types of identified public e-4W charging facilities. Each factor, in turn, is accompanied by a set of locating criteria, which vary among different types of charging facilities. Locating criteria are based on indicative and measurable variables related to a prospective location for a particular type of e-4W charging facility and can be used to determine the feasibility of a site for hosting that type of facility. These criteria allow the implementing agency to objectively gauge whether or not the identified location is suitable for a charging facility. Such an approach would be useful to compare and select suitable locations within a 3 km x 3 km grid in a city, as provision of at least one charging station within each grid is strongly recommended by the Ministry of Power (Ministry of Power, 2019). The study identifies the locating criteria that are critical for site selection for each type of public e-4W charging facility. The criteria that are important for each facility type are categorised under the aforementioned factors.
The locating criteria markedly differ between types of charging facilities due to notable differences in their physical and locational characteristics. For example, on-street parking spaces refer to parking bays along the carriageways of roads, normally by the sides of curbs or walls, whereas off-street parking spaces are exclusively delineated land parcels for parking that are off the carriageway11. Therefore, the space required for establishment of EVSE(s) may be on the curb in case of on-street parking and within the parking area in case of off-street parking. On-street parking is lined along the ‘street’, and off-street parking is laid out based on the dimensions of the available parking area.
11 both parking spaces, for the purposes of this study, are assumed to be designated by relevant authorities, as establishment of e-4w charging facilities should conform to the applicable local laws and regulations.

23
The four types of e-4W charging facilities for which locating criteria have been identified are:
1. En-route public charging facilities
2. Charging facilities at off-street public parking spaces
3. Charging facilities at on-street public parking spaces
4. Charging facilities within office premises
The study proposes a stepwise approach to locating the aforementioned charging facilities. In this approach, the charging demand potential of a location is evaluated in the first step. For this evaluation, certain sub-steps representing locating criteria are proposed. The locating criteria are either related to procurable data points or require on-site assessment. For example, in the case of a locating criterion like proximity of a location to a transit node, the existing measurement of the distance between the nearest transit node and the location can be used. On the other hand, a criterion like availability of wall/ curb space for mounting a charger needs to be determined based on site visits. The second step of the proposed approach entails assessment of the availability of requisite supporting infrastructure at the prospective locations. Figure 9 to Figure 12 summarise the suggested approaches for comparative evaluation of possible locations, including factors and locating criteria, that should be followed for each type of charging facility. In addition to the identified locating criteria, there could be a range of other factors, such as the condition of the parking surface or regulatory cap on parking charges in different areas, which may impact an implementing agency’s locating choices. This study does not cover every single aspect of locating criteria, as the purpose is to identify the key determinants in site selection for public e-4W charging facilities.
4.1.1 Site selection approach for en-route charging facility
As shown in Figure 9, the first step in identifying suitable locations for en-route charging facilities has three sub-steps. The first sub-step is concerned with the hierarchy of the roads, the data on which is available in the Master Plan/ Comprehensive Mobility Plan of an urban area. The road hierarchy is composed of classes like arterial roads, sub-arterial roads, collector roads, and local roads, wherein each class of roads has a separate function, design, and usage rules. Higher classes of roads cater to higher volumes of traffic. After checking the road hierarchy and selecting all locations that are abutting the roads of a desired class, traffic volumes on these roads should be compared. This is because there is a direct linkage between traffic volume and potential charging demand. After this comparison, the proximity of the shortlisted locations to nearby traffic intersections should be evaluated, as well as the visibility of the locations from the adjoining roads. The proximity of a location to a traffic intersection and high visibility indicate higher potential usage. The locations that satisfy all these criteria should then be evaluated further in the second step, which looks at infrastructure availability. Infrastructure required to establish an e-4W charging facility can be divided into two broad categories: electrical connections and land. In the case of electrical connections, two important aspects to examine are the difficulty of getting a connection and the reliability of electricity supply. In this regard, the approach considers the proximity of a location to distribution equipment and the loading in the distribution network (or power outages at the location) as the relevant indicators. The closer the location is to distribution infrastructure,
thErE iS a dirECt linkagE bEtwEEn traffiC volumE and potEntial Charging dEmand.

24
the lower the cost and time required to obtain a new electricity connection. The loading in the distribution network or frequency of power outages is an indicator of available network capacity and supply reliability. Lower loading and minimal power cuts in the distribution network are necessary for a location to qualify as a suitable location for a charging facility. With respect to land, availability of adequate space for a charging station to cater to the estimated demand is an important locating criterion. Once availability of sufficient space is ensured at a location, its circle rate should be compared with other prospective locations to evaluate the cost-effectiveness of each option.
figurE 9: SitE SElECtion approaCh for En-routE Charging faCilitya road hierarchy, as set by the Indian road congress for all urban roads, determines the purpose, capacity, and functions of
different types of roads in a city’s/ town’s road network. different types of roads include arterial roads, sub-arterial roads, local roads, etc. and could impact the charging demand.
b the volume of traffic on a particular road could impact the charging demand and, thereby, the usage of a charging facility.c land’s circle rate is a proxy indicator for its market price.
4.1.2 Site selection approach for charging facility at off-street public parking space
For locating charging facilities at off-street public parking spaces, a different set of parameters are proposed, due to the different nature of parking. As shown in Figure 10, in the first step, the approach proposes the estimation of the parking turnover ratio. This determines the capacity utilisation of a parking space. High usage of a parking area is desirable, as it may potentially translate to high charging demand at the location. Moreover, the proximity of a location to a transit node would potentially attract more traffic. Furthermore, the space hierarchy of the location within the city should be assessed, as a space ranking highly in the hierarchy implies a larger catchment area, and the parking lots in such areas may have higher charging
Step 1: Comparing charging demand potential of site(s)
Step 2: Checking the availability of infrastructure at site(s)
Process for selecting site location of an en-route public charging facility
Compare the traffic volumesb on roads adjoining the sites
Check road hierarchya abutting the sites
Check whether the sites are close to traffic signals/ intersections
Evaluate whether the sites have reasonable visibility or not
Electrical connection Land
Determine the proximity of the sites to a distribution transformer, feeder, or electric substation
Examine the loading in the existing distribution network or power outages at the sites
Check whether required land area is available at the sites
Check the circle rate c of land for the sites
thE SpaCE hiErarChy of thE loCation within thE City Should bE aSSESSEd, aS a SpaCE ranking highly in thE hiErarChy impliES a largEr CatChmEnt arEa, and thE parking lotS in SuCh arEaS may havE highEr Charging dEmand potEntial.

25
demand potential. In the second step, the presence of requisite floor/ wall/ curb space is evaluated, as it is necessary to install chargers at a given location. In addition, the recommended indicators pertaining to electrical connections for en-route charging facilities are also valid in the case of charging facilities at off-street public parking spaces.
figurE 10: SitE SElECtion approaCh for Charging faCility at off-StrEEt publiC parking SpaCE
d parking turnover ratio is the ratio of parking demand to the total available parking bays in a parking space. It is used to evaluate the degree of usage of a parking space, which may vary based on the activity (retail/ office space, transport hub, etc.) it sup-ports.
e transit nodes are the locations in the transport network of a city where one mode of transport meets another, such as railway stations, where rail-based transport meets road-based transport, or metro stations, where rail-based transport meets the road-based and walking-based transport. these nodes generally attract large volumes of traffic.
f according the urban and regional development plan formulation and Implementation (urdpfI) guidelines, a city has spaces where people congregate. the size, type, purpose, density, length of stay, etc. of such crowds of people are governed by the hierarchy of space, where the space could range from being a commercial centre or an educational hotspot, to a recreational facility or healthcare hub. a hierarchy of all such spaces is given in the urdpfI guidelines. the higher the ranking of a space in that hierarchy, the higher the volume of citizens and traffic it attracts. this makes it an important parameter to consider from a business perspective when setting up a charging facility. for example, it would be more lucrative to invest in a large-scale charging facility in the central business district of an urban centre than in a convenience shopping centre that houses a milk booth, stationery shop, and grocery shop, because there is higher guaranteed usage of parking space in the former location.
4.1.3 Site selection approach for charging facility at on-street public parking space
In the case of an on-street public parking space, the approach is similar to that for off-street public parking spaces (refer to Figure 11), except that one of the key indicators related to the electrical infrastructure is proximity to the nearest distribution pole or board, instead of proximity to electrical distribution infrastructure. The reason for this difference is that a distribution pole or board is the most probable source of electricity supply in the case of an on-street charging facility.
Step 1: Comparing charging demand potential of site(s)
Step 2: Checking the availability of infrastructure at site(s)
Process for selecting site location of a charging facility at off-street public parking space
Gauge the sites’ proximity to transit node(s) e
Calculate the parking turnover ratio d at the sites to gauge the adequacy of parking space and its utilisation
Check the hierarchy of space f at the sites
Electrical connection Space availability
Determine the proximity of the sites to a distribution transformer, feeder, or electric substation
Examine the loading in the existing distribution network or power outages at the sites
Check whether requisite floor/ wall space is available at the sites for setting up/ mounting EVSE

26
figurE 11: SitE SElECtion approaCh for Charging faCility at on-StrEEt publiC parking SpaCE
4.1.4 Site selection approach for charging facility within office premises
In the case of charging facilities within office premises, the locating approach is quite different (refer to Figure 12). First, for the comparison of charging demand potential between different locations, evaluation of the parking turnover ratio and the number of employees availing cab services is required. A high turnover ratio and high usage of cab services indicate higher potential charging demand at a location. Since it is likely that the premises would have existing electrical connections, instead of determining the site’s proximity to the distribution network, the sanctioned loads at the locations need to be checked, followed by assessment of the existing loading of the connections.
figurE 12: SitE SElECtion approaCh for Charging faCility within offiCE prEmiSES
Step 1: Comparing charging demand potential of site(s)
Step 2: Checking the availability of infrastructure at site(s)
Process for selecting site location of a charging facility at on-street public parking space
Gauge the sites' proximity to transit node(s)
Calculate the parking turnover ratio at the sites to gauge the adequacy of parking space and its utilisation
Check the hierarchy of space at the sites
Electrical connection Space availability
Determine the proximity of the sites to nearest distribution pole/ board
Examine the loading in the existing distribution network or power outages at the sites
Check the availability of multi-utility zone/ extra curb or wall space at the sites for setting up EVSE
Step 1: Comparing charging demand potential of site(s)
Step 2: Checking the availability of infrastructure at site(s)
Process for selecting site location of a charging facility within an office premise
Check the number of employees availing cab services/ using charging facility within office premises
Calculate the parking turnover ratio at the sites to gauge the adequacy of parking space and its utilisation
Electrical connection
Determine the proximity of the sites to nearest distribution pole/ board
Examine the loading in the existing distribution network or power outages at the sites

27
The approaches illustrated in the above figures can serve as a point of departure in site selection and help implementing agencies identify potential locations for the establishment of different types of e-4W charging facilities.
4.2 model layout of public e-4w charging facility
When setting up an e-4W charging facility, certain spatial requirements related to charging infrastructure and vehicle manoeuvrability need to be carefully considered. This study proposes a model angular parking layout for the establishment of an e-4W charging facility, as shown in Figure 13. For a parking area to accommodate the maximum number of vehicles, keeping circulation and bay standards in mind, 45° angular parking is the most suitable configuration. 45° angular parking layouts enable optimum utilisation of space, as a single circulation lane suffices for manoeuvring in the parking area. The same is true for other (sawtooth/ 60°/ 75°/ 30°) angular parking layouts as well, but a significantly lower number of cars can be accommodated in the same total available parking area in such set-ups.
figurE 13: modEl angular parking layout (off-StrEEt parking)12
note: the layout is for illustrative purposes only.
The detailed dimensions of the layout are presented in Table 3. A walkway on the periphery of the parking area has been included in the design, to facilitate pedestrian access.
12 the primary purpose of the model parking layout is to show how the bays should be serviced by e-4w chargers. therefore, a plan for one type of charging facility is sufficient.

28
tablE 3: rEfErEnCE ShEEt for modEl angular parking layout (off-StrEEt parking)
Parameter Data
Parking Bay Type Angular
Parking Bay Area (m2) 12.5
Parking Bay Angle (o) 45
Entry/ Exit specifications Dashed lines at charging station entry/ exit with boom-barriers and a ticket dispenser
Solid lines between bays for non-negotiable movement
Area required for EVSE (m2) 1
Area required for Distribution Transformer (m2) 13
70
Minimum Entry/ Exit Lane Width (m) 2.5
Parking Area Lane Width (m) 5
Sub-Level Parking Ramp Gradient (%) 33
Curb Type Barrier
Curb Height (cm) 14 15
Empty Bay Indicators Optic
14
13 source: master plan delhi – modification 2021, modified till 31/03/2016 (delhi development authority, 2016) 14 source: traffic engineering & transport planning (kadiyali, 2018)
29
5 Charging technologies for electric four-wheelers
30
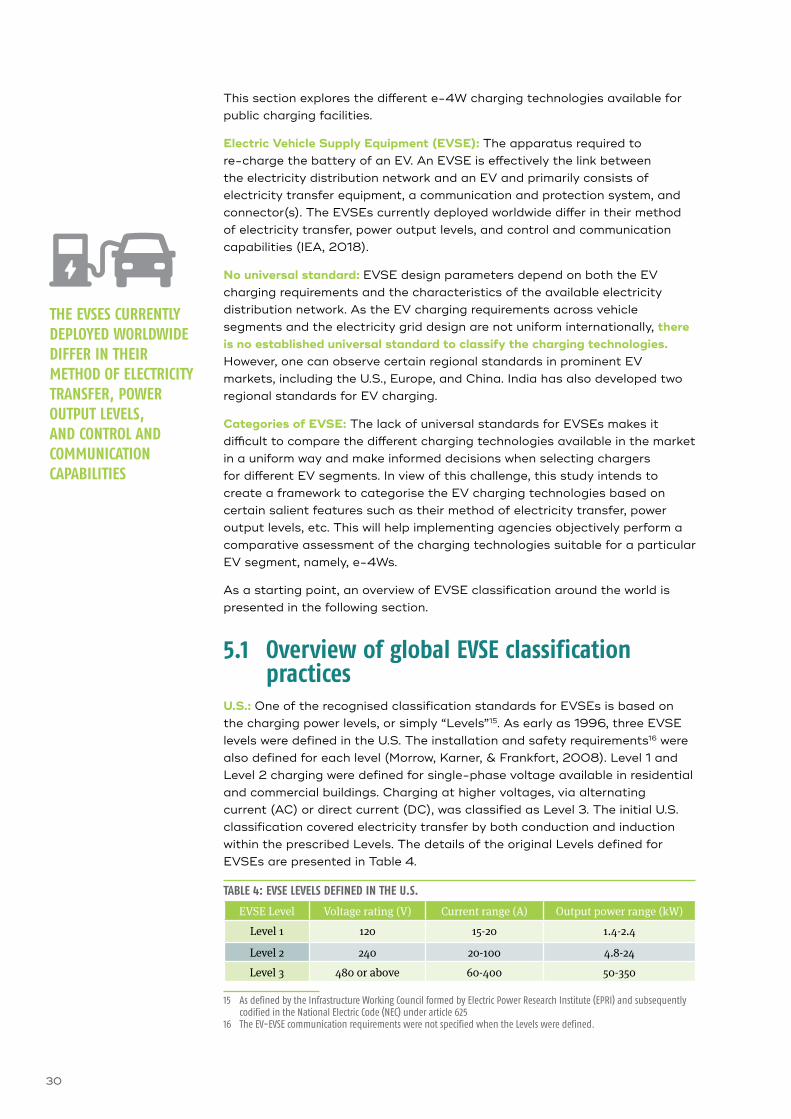
This section explores the different e-4W charging technologies available for public charging facilities.
Electric Vehicle Supply Equipment (EVSE): The apparatus required to re-charge the battery of an EV. An EVSE is effectively the link between the electricity distribution network and an EV and primarily consists of electricity transfer equipment, a communication and protection system, and connector(s). The EVSEs currently deployed worldwide differ in their method of electricity transfer, power output levels, and control and communication capabilities (IEA, 2018).
No universal standard: EVSE design parameters depend on both the EV charging requirements and the characteristics of the available electricity distribution network. As the EV charging requirements across vehicle segments and the electricity grid design are not uniform internationally, there is no established universal standard to classify the charging technologies. However, one can observe certain regional standards in prominent EV markets, including the U.S., Europe, and China. India has also developed two regional standards for EV charging.
Categories of EVSE: The lack of universal standards for EVSEs makes it difficult to compare the different charging technologies available in the market in a uniform way and make informed decisions when selecting chargers for different EV segments. In view of this challenge, this study intends to create a framework to categorise the EV charging technologies based on certain salient features such as their method of electricity transfer, power output levels, etc. This will help implementing agencies objectively perform a comparative assessment of the charging technologies suitable for a particular EV segment, namely, e-4Ws.
As a starting point, an overview of EVSE classification around the world is presented in the following section.
5.1 overview of global EvSE classification practices
U.S.: One of the recognised classification standards for EVSEs is based on the charging power levels, or simply “Levels”15. As early as 1996, three EVSE levels were defined in the U.S. The installation and safety requirements16 were also defined for each level (Morrow, Karner, & Frankfort, 2008). Level 1 and Level 2 charging were defined for single-phase voltage available in residential and commercial buildings. Charging at higher voltages, via alternating current (AC) or direct current (DC), was classified as Level 3. The initial U.S. classification covered electricity transfer by both conduction and induction within the prescribed Levels. The details of the original Levels defined for EVSEs are presented in Table 4.
tablE 4: EvSE lEvElS dEfinEd in thE u.S.
EVSE Level Voltage rating (V) Current range (A) Output power range (kW)
Level 1 120 15-20 1.4-2.4
Level 2 240 20-100 4.8-24
Level 3 480 or above 60-400 50-350
15 as defined by the Infrastructure working council formed by electric power research Institute (eprI) and subsequently codified in the national electric code (nec) under article 625
16 the ev-evse communication requirements were not specified when the levels were defined.
thE EvSES CurrEntly dEployEd worldwidE diffEr in thEir mEthod of ElECtriCity tranSfEr, powEr output lEvElS, and Control and CommuniCation CapabilitiES

31
The Society of Automotive Engineers (SAE)17 revised the Levels classification18 later and separately defined the Levels for AC and DC charging. The Levels for AC charging are the same as in the original Levels classification presented in Table 4. However, three distinct levels were defined for DC charging based on maximum output current and voltage, as shown in Table 5 (Herron, 2016).
tablE 5: dC Charging lEvElS dEfinEd in thE u.S.
DC charging level Voltage rating (V) Maximum current (A) Output power range* (kW)
Level 1200-450
80 36
Level 2 200 90
Level 3 200-600 400 240 *It should be noted that currently, the maximum output voltage of dc chargers available in the market is higher than the sae numbers; the voltage range has increased to 50-1000 v. with the increase in output voltage, the output power has also increased.
Europe: Europe defines four charging Modes19 (refer to Table 6) based on the charging rates and output power levels, as well as communication between the EV and EVSE (Spöttle, et al., 2018). These EVSE Modes are different from U.S. Levels, as installation, communication, and protection are considered when defining Modes20. Furthermore, the 120 V voltage level is not prevalent in Europe, and there is consequently no European counterpart for U.S. Level 1. Both single-phase and three-phase AC connections are allowed under all three Modes.
Mode 1 represents the simplest possible charging mechanism, plugging the EV directly into a household power outlet. In Mode 2, the EV is generally plugged in via a portable cable with an inbuilt protection and control device. Mode 3 entails charging an EV through a fixed outlet or a tethered cable that enables communication between the EV and charger. With the progressive increase in charger power output from Mode 1 to Mode 3, the associated communication and protection protocols get more complex. Advanced EV-EVSE communication in Mode 3 facilitates smart charging aspects such as controlled charging and vehicle-to-grid functionality (Vesa, 2019). A separate subclass for DC charging is also defined under Mode 4.
tablE 6: EvSE modES dEfinEd in EuropE
Mode Description Voltage rating (V)
Maximum current (A)
Output power range (kW)
Mode 1 Slow AC charging in households 250 / 480 16 3.7-11
Mode 2 Slow AC charging with semi-active connection to vehicle to communicate for safety purposes
250 / 480 32 7.4-22
Mode 3 Slow/fast AC charging with an active connection between charger and vehicle for safety and communication for smart charging
250 / 480 32 14.5-43.5
Mode 4 Fast DC charging with an active connection between charger and vehicle
600 400 38-170
17 sae International is a standards organisation for the automotive industry that is active in u.s.18 the sae committee that developed the j1772 or type 1 connector revised the levels classification.19 the modes are defined in the international industry norm dIn/ Iec 61851. 20 In the u.s., the levels were defined first based on output power, and the associated installation and safety require-
ments were specified later. In contrast, in europe, the output power, installation, communication, and protection are used in defining the modes.

32
China: The charging standards established in China are primarily for AC or DC conductive charging. China originally adopted the erstwhile European standards21 and subsequently developed its own charging standards22 for the conductive charging system. Hence, the Chinese standards for conductive charging include the factors covered in the four European Modes described above (Boyd, 2018).
India: India classifies charging based on private vs. public application. Private charging denotes charging an EV at home using a single-phase industrial plug23 with adequate protection. Public charging entails charging outside the home. India has developed two standards24 (refer to Table 7) for public charging, which are unique and suitable for EVs with battery voltages lower than 100V (DHI, 2017). The Bharat AC 001 25 standard is for a 230V AC charger that can charge three EVs at once. The Bharat DC 001 26, on the other hand, is the standard for a DC charger and covers electric two-wheelers, three-wheelers, and four-wheelers.
tablE 7: publiC Charging StandardS in india
Charging standard Output voltage (V) Output power (kW) Maximum current (A)
Bharat DC 001 48/60/72 10/15 200
Bharat AC 001 230 3.3 15
5.2 Salient features of charging technologiesThe salient features of charging technologies identified from the review of different standardisation practices are described in this section. Charging technologies deployed all over the world are generally categorised based on the following four major aspects:
1. Electricity transfer technology: EVSEs can be characterised based on the method of electricity transfer. EVSE charging can be performed through a wired connection, i.e. via conduction, or wirelessly, i.e. via induction. In the case of conduction, the electricity transfer can be achieved using AC or DC power. Battery swapping is the third method of electricity transfer, in which a fully charged battery replaces a depleted battery. Both battery swapping and inductive charging technologies have seen limited commercial deployment, and, hence, standards for these technologies are not commonly applied27.
2. Power output: The power output of the charger can either be AC or DC28. However, the power output range of an EVSE is inextricably linked to the power supply voltage, which can easily be obtained from the distribution network. The maximum output current rating allowed at each voltage and the charging requirement of an EV are the other factors that determine the power output.
21 gbt 18487.3.2001 and gb/t 20234.2.2001 adopting International electrotechnical commission (Iec) standards22 gb/t 18487.1.2015 covering electric vehicle conductive charging system, and gb/t 20234.1, gb/t 20234.2, and gb/t 20234.3
covering connections for conductive charging23 charging at 230v/15a to a maximum 2.5 kw output using an Iec 60309 industrial connector with residual current
devices24 department of heavy Industries (dhI) constituted a committee of experts for the standardisation of charging practices
in 2017.25 for more details, refer to bharat ac 001.26 for more details, refer to bharat dc 001.27 Iec 61980-1:2015 for wireless charging and Iec 62840-1:2016 for battery swapping systems are the major international
standards available. these standards are not commonly used, and not many products conforming to these standards are available in the market.
28 It is important to note that an evse that facilitates ac charging requires an on-board charger on the ev. dc charging is performed in the cases where the vehicle charger is not on-board.
india ClaSSifiES Charging baSEd on privatE vS. publiC appliCation.

33
3. Installation, Communication, and Protection: An EVSE may be portable or fixed in installation. Portable chargers are used for Mode 2 charging, whereas fixed chargers are used in Mode 3 and Mode 4 charging. The fixed installations are either wall mounted or floor mounted. According to the Modes, the communication technology and protection protocol associated with EVSEs also change.
4. Connection between EV and EVSE: In the case of conductive charging, an EVSE has two types of designs: plug-in or pantograph. Plug-in connectors29 are common and used in both AC and DC charging. Pantograph connectors are mostly used in charging at high power using DC. There is no physical connection between EV and EVSE in the case of inductive charging and battery swapping.
A snapshot of charging technology characterisation is presented in Figure 14.
figurE 14: ovErviEw of Charging tEChnology CharaCtEriSation
5.3 Categorising charging technologiesCharging technologies30 currently deployed around the world greatly vary in terms of functional attributes and applications. The absence of global standards for these technologies makes it challenging to categorise them. Nevertheless, to objectively assess these different technologies, a classification framework for charging technologies is required. This study therefore proposes a framework for technology categorisation based on the abovementioned key features of charging technologies. The proposed framework, shown in Figure 15, also takes into account the standard practices followed in India’s distribution network31.
29 type 1, type 2, combined charging system (ccs), charge de move (chademo), and gb-t are the common types of plug-in connectors used in different protocols for ac/dc charging (navigant, 2018).
30 details of chargers covered in the study are available in table 15.31 standard voltages of 230v for single-phase circuits and 415/11000/33000v for three-phase circuits.
Electricity Transfer techonlogy
Conductive Inductive Battery Swapping
DC AC
Power Output Levels
Level 1
Level 2
Level 3
Installation, Communication and Protection
Mode 4 Mode 1
Mode 2
Mode 3
Pantograph Plug in No physical connection
Connection between EV and EVSE

34
figurE 15: E-4w Charging tEChnology CatEgoriES
5.3.1 aC Charging
An e-4W can be charged using conductive AC charging technology, provided the vehicle has an on-board charger. AC charging is the most prevalent type of charging, since grid electricity supply is AC. Batteries, in contrast use DC power, so the AC power from the grid needs to be converted into DC power to charge the battery. The equipment that performs this AC-DC conversion may be either on-board on the EV (in the case of AC charging) or part of the EVSE (in the case of DC charging).
AC charging can be categorised into three levels: Levels 1, 2, and 3 (refer to Table 8), considering the common service voltages available worldwide. The classification combines the U.S. Level-based standard with the European Modes covering associated installation, communication, and protection. The upper limits for output power in relevant cases are set using standard practices32 applicable to the Indian power grid. The Bharat AC 001 is considered as a separate class of AC charging due to its distinctive features.
AC charging technology is generally cheaper than DC technology, because in the case of DC charging, the cost of the converter and other auxiliary equipment is an add-on to the EVSE cost. The ancillary equipment needed for AC charging for e-4Ws primarily consists of appropriately rated electrical cables and circuit breakers33.
32 the maximum current output from a 230 v single-phase ac plug point is considered 16 a, and maximum output from a single-phase circuit is estimated at 32 a.
33 the required rating of a cable/circuit breaker is determined by the output power.
aC Charging tEChnology iS gEnErally ChEapEr than dC tEChnology, bECauSE in thE CaSE of dC Charging, thE CoSt of thE ConvErtEr and othEr auxiliary EquipmEnt iS an add-on to thE EvSE CoSt.
AC Level 1 AC Level 2 AC Level 3 Bharat AC 001
AC Level 2 A
AC Level 2 B
AC Charging
Conductive
Charging technology categories
Inductive
DC Level 1
DC Level 2
DC Level 3
Bharat DC 001
DC Charging
Battery Swapping

35
5.3.1.1 AC Level 1 ( AC-I)
AC Level 1 charging takes place at the lowest service voltage prevalent in some parts of the world. This type of charging is popular in the U.S. for charging e-4Ws at home. The capital cost of charging equipment is negligible, as it is a simple plug and play charging using the domestic socket. The wall-mounted domestic socket provides a small amount of power (refer to Table 8), resulting in prolonged charging time. For example, a battery of 20 kWh takes about 14-15 hours to recharge at AC Level 1. This category is not relevant in India, as the applicable service voltage level is not available.
tablE 8: aC ChargEr tEChniCal SpECifiCationS
Specification AC I AC II AC III Bharat AC 001A B
Input Voltage (V) 120 230 230 415 or above 415
Output Voltage (V) 120 230 230 415 230
Maximum Output Current (A) 20 16 32 63 13
Output Power Range (kW) 1.4-2.4 1.4-3.3 3.3-7.4 11-43 3.3
Charging Mode Not applicable Mode 1/ 2 Mode 2/ 3 Mode 3 Mode 3
5.3.1.2 AC Level 2 (AC-II)
AC-II charging entails single-phase charging performed at the most common service voltage in India. The ability to charge an EV at Level 2 is essential, as 230V outlets are universally available. AC Level 2 is divided into two sub-classes based on charging power, as shown in Table 8.
AC-II (A) charging (see Figure 16 for an example) is simple plug and play charging using an on-board EV charger. The LV e-4Ws in India have on-board chargers that are typically between 1 and 3 kW, and, hence, this type of charging is suitable for them. The EV is plugged into a socket for this type of charging. Two AC-II charging modes are possible based on the installation, communication, and protection - Modes 1 and 2. Mode 2 has improved safety features and is therefore a better solution for e-4W charging at home 34. The maximum power output (refer to Table 8) for this type of charging is restricted by the power output of the available socket and the charger’s capacity.
figurE 16: bharat dC 001 and aC lEvEl ii-a ChargErS at CaptivE Charging faCility
picture courtesy: lithium urban technologies
34 It should be noted that mode 1 charging has been actively discouraged for e-4w charging in many countries due to safety issues.

36
AC II (A) charging can be performed directly via a single-phase three-pin plug. The ancillary infrastructure needed for such charging is typically limited to an industrial plug socket35, electrical cable36 , and residual current protection device37. Alternatively, this type of charging can be done using a portable cable with an in-built protection circuit. The cost estimates for the EVSE and ancillary infrastructure are shown in Table 9.
tablE 9: aC Charging CoSt EStimatES
Charger type Charging equipment cost (�)
Ancillary infrastructure cost (�)
Total EVSE cost (�)
AC-II (A) 0 - 24,000 1,400 - 1,900 1,400 - 25,900
AC-II (B) 38,000 - 65,000 1,600 - 2,500 39,600 - 67,500
AC-III 80,000 - 1,20,000 4,000 - 11,000 79,000 - 1,41,000
Bharat AC 001 40,000 - 50,000 1,800 - 2,500 41,800 - 52,500
AC-II (B) charging is possible with newer car models that have on-board chargers rated at higher power levels (refer to Table 8), which a domestic socket38 cannot provide. Hence, this charging method entails the use of dedicated wall-mounted charging points. This method is limited by the maximum power possible for a single-phase AC circuit. This type of charging is generally Mode 2 or 3, and charging is performed with a protection and pilot control function (Spöttle, et al., 2018). The area required for the wall-mounted charger is generally less than 0.2 square metres. The cost estimates for the charger and ancillary infrastructure are shown in Table 9.
35 Iec 60309 industrial connector 36 2.5 sq. mm, copper, 1100 v, pvc insulated cable37 a double pole residual current circuit breaker or earth leakage circuit breaker.38 domestic 3-pin sockets are 6/16a in India, much less than the maximum output current of 32a in ac-II charging.
InDIAn CAse stuDy ChargeGrid: AC-II charging facilities in India
Providing charging solutions at natural stoppages for EVs is easier at the AC-II Level for two reasons. First, the power supply matches the on-board EV AC chargers’ power. Second, this type of charging only requires single-phase connections, which are available almost everywhere. Magenta Power is working to provide 3.3/7/4 kW AC charging facilities under their ChargeGrid brand. The company has already installed charging facilities at malls, hotels, and co-operative societies (see Figure 17 for an example). These charging points have a technology neutral socket that can accommodate three different types of connectors. They are custom designed for Indian grid conditions and have in-built voltage stabilisers to handle voltage fluctuations.
figurE 17: Ev ChargEr at a parking SpaCE
picture courtesy: magenta power

37
5.3.1.3 AC Level 3 (AC-III)
AC Level 339 entails vehicle charging at the three-phase AC distribution voltage level. The minimum voltage level associated with AC-III charging in the Indian context is 415 V. Table 8 lists the key technical specifications of a range of AC-III chargers for e-4Ws currently available in the international market. This type of charging is only possible when the vehicle has a three-phase AC charger; in the Indian context, vehicles only have single-phase chargers, and the highest observed charging capacity is 7.4 kW. In contrast, in the European market, there are cars with three-phase 22 kW on-board chargers (Navigant, 2018).
The AC-III chargers available in the market are generally wall-mounted with minimal area requirement. The ancillary equipment associated with these chargers is switchgear equipment, including circuit breakers and electrical cables. AC-III chargers with smart charging capability have additional equipment to facilitate the necessary communication and control functions. The cost estimates for AC-III EVSE are presented in Table 9.
InternAtIonAL CAse stuDy AC-III public charging facilities in Europe
AC-III public charging facilities are becoming popular all over Europe, since cars there have on-board three-phase chargers (Navigant, 2018). The unique feature of the AC-III chargers is that they are smart, with the ability to vary the output power rate. Etrel is one of smart charging solution providers in Europe. Etrel’s charger typically has a 22 kW rating and charges one EV at a time. Sometimes, two 22 kW chargers interconnected to a low voltage power supply40 are installed together in a charging pile. The chargers automatically select a charging rate for the EV, considering the needs of each connected vehicle and limits of the electricity connection. Consumers have the option to input the departure time and opt for cost-optimised charging at a lower speed. Multiple chargers installed at one location can coordinate to provide optimal charging without overloading the station (Etrel, 2018) (Etrel, 2019).
5.3.1.4 Bharat AC 001
Bharat AC 001 is a special type of AC Level 2 charger with a three-phase input and single-phase output. Bharat AC 001 has a 10 kW input power level and can charge three EVs at once. The technical specifications for this charger are given in Table 8 (DHI, 2017). The Bharat AC 001 charger
39 this type of charging is often called type 2 ac charging, based on the connector developed in the european market for charging.
40 three phase 415 v 32a/63a supply
InternAtIonAL CAse stuDy ChargePoint: AC-II workplace charging facilities in the U.S.
Workplace charging is a service offered by many charging service companies. One example is ChargePoint in the U.S. ChargePoint operates chargers in workplace parking lots, thereby allowing companies to provide on-site EV charging stations. AC-II charging options are generally used in these workplace charging facilities. The chargers are of lower power levels (less than 40 A), so EVs can be charged without costly electrical upgrades in the facility. Despite being low power, these chargers allow two electric vehicles to be charged in parallel through dynamic sharing. These facilities are smart facilities that allow one to control who can use the facilities. Additionally, it is possible to plug in vehicles and schedule charging during off-peak hours when electricity rates are lower (Navigant, 2018) (Chargepoint, 2017) (Chargepoint, 2017).

38
is a wall-mounted charger with three industrial plug output connectors. The ancillary equipment needed to install this charger includes appropriately rated electrical cables and circuit breakers. The costs associated with this charger and the ancillary equipment are presented in Table 9.
InDIAn CAse stuDy Captive charging facilities in Bengaluru
EV fleet operators often invest in captive fleet charging solutions to avoid issues with an underdeveloped public charging network. Bengaluru-based fleet operator Bhagirathi uses rydS’s low carbon, last mile urban mobility solution with captive charging. The company identified the lack of charging infrastructure as the biggest operational challenge during its EV pilot project (Kotecha, 2018) and proceeded to establish 4 captive charging facilities at its hub and an additional six in other strategic client locations. These charging facilities have both 3.3 kW AC and 16 kW DC chargers that get power via a 250 kilo-volt-ampere (kVA) transformer. rydS follows a charging routine wherein after three fast EV charging sessions, it carries out one slow charging session to maintain the health of the battery.
InDIAn CAse stuDy Centralised captive charging facilities for fleet operation
Centralised captive charging facilities are considered the optimal solution for fleet operation. Lithium Urban Technologies, which provides connected, shared e-mobility solutions for corporates, has set up charging stations (see Figure 18 ) in each of its client sites to enable controlled charging and quick turnaround time.
The company has an in-house optimisation algorithm that factors in the state of charge of the EV battery when on-road so that once the vehicle is docked, it can be charged to an optimal level in order to complete its next trip. Lithium Urban Technologies maintains a 5:1 car to charger ratio to enable smooth operations. The chargers they use are compliant with AC Level II(A) and Bharat DC 001 Standards. The current EVs in their fleet are subject to two types of charging- fast and slow, used during peak and lean times, respectively.
Lithium Urban Technologies is soon launching a charging hub in Delhi NCR to further optimise charging for its vast EV operations in the capital. 100% powered by renewable energy, this charging hub will be a centralised location for its EV fleet to dock and charge before embarking on its next trip. This will further help improve operations and reduce travel times for individual trips.
figurE 18: CaptivE Charging faCility
picture courtesy: lithium urban technologies

39
5.3.2 dC Charging
DC charging is performed with chargers that are not on-board on the EV. Their power output level is only restricted by the safe power limit the battery can accept. Thus, the power output levels of DC chargers are usually higher than those of their AC counterparts. However, the voltage level of the charger still depends on the e-4W battery voltage. DC chargers can be classified into two categories based on the system design - plug-in or pantograph. DC pantograph chargers are of high power41 and generally not used for charging e-4Ws.
5.3.2.1 DC Plug-in
DC plug-in charging entails charging via a plug-in connection. Charging is performed by an EVSE unit that houses an AC-DC converter and a DC charger unit. DC plug-in chargers can be further classified into multiple levels based on power output. Bharat DC 001 is a special DC plug-in charger with two output levels and, hence, added as a separate category. The technical specifications for DC plug-in chargers currently available in the market are presented in Table 10.
tablE 10: dC plug-in ChargEr tEChniCal SpECifiCationS42
Specification DC-I DC-II DC-III Bharat DC 001
Input AC Voltage (V) 415 >415 >415 415
Output DC Voltage Range (V) <1000 <1000 <1000 48 - 72
Maximum Output Current (A) 80 200 >200 200
Output Power Range (kW) <50 >50 >150 3.3/10/15
Charging Mode Mode 4 Mode 4 Mode 4 Mode 4
Level 1 (DC-I) and Level 2 (DC-II) DC chargers are generally used for charging e-4Ws. DC Level 343 (DC-III) chargers of 175 kW are new in the market, but not suitable for all existing EV models (Kane, 2019). DC-I is typically a wall-mounted charger, whereas the DC-II charger is floor-mounted. The ancillary equipment needed for DC-I charging is limited to appropriately rated electric cables and circuit breakers. DC-II plug-in chargers, on the other hand, require additional ancillary equipment, including step down transformers, associated high tension (HT) and low tension (LT) switchgears, cables, and a protection system. The cost estimates for DC plug-in chargers are provided in Table 11. The estimated minimum area requirements for DC-I and DC-II chargers are 0.4 m2 and 1.5 m2, respectively.
tablE 11: dC plug-in ChargEr CoSt EStimatES
Charger type Charging equipment cost (`)
Ancillary infrastructure cost (`)
Total EVSE cost (`)
DC-I 6,00,000 - 8,00,000 8,000 - 15,000 6,08,000 - 8,15,000
DC-II 12,00,000 - 13,00,000 6,25,000 - 8,25,000 18,25,000 - 21,25,000
Bharat DC 001 1,80,000 - 2,60,000 2,800 - 3,500 2,02,800 - 2,63,500
41 dc pantograph chargers have a power output rating of 150 kw or above and are used to charge electric buses.42 applicable for e-2ws43 very few details related to dc level 3 chargers are available in the public domain.

40
InternAtIonAL CAse stuDy DC network charging facility
The advancement in communication technologies has enabled the formation of fast EV charger networks (Navigant, 2018). Fastned is a fast charging provider that operates over ninety charging stations in the Netherlands, Germany, and the United Kingdom. Most of these facilities have DC-II chargers, typically rated at 50 kW. Many of the charging stations have solar PV rooftop systems over the parking space and use the generated solar power for charging. In the last year, Fastned has also deployed 175 kW DC-III chargers at select locations. However, not many EV models are equipped to charge at this power level, and, hence, the maximum power drawn from these chargers is significantly lower than 175 kW in most cases (Kane, 2019) (Fastned, 2019).
InDIAn CAse stuDy: Bharat DC public charging facilities
Energy Efficiency Services Limited (EESL) has been at the forefront of e-mobility ecosystem in the country. It is one of the first in the country to deploy EVs and Public Electric Vehicle Charging facilities on a large scale. EESL has already deployed around 1510 EVs, more than 470 captive chargers, and 70 public charging facilities across India. EESL is partnering with local municipalities, distribution companies (DISCOMs), Metro Rail Corporations, oil companies, and City Development Authorities to conduct feasibility assessment studies, select sites, and implement charging infrastructure in urban areas. The majority of the public chargers installed by EESL are 15 kW chargers that conform to the Bharat DC 001 standard (an example is shown in Figure 19). EESL’s success in forging partnerships with EV fleet operators has helped increase charger utilisation. All of EESL’s public chargers are operated through a mobile app developed specifically for this purpose.
figurE 19: bharat dC 001 publiC ChargEr in khan markEt, dElhi
picture courtesy: eesl

41
InDIAn CAse stuDy Public charging network of 50 kW chargers
Public fast-charging networks capable of quick re-charge of vehicle batteries are gaining popularity in India. Under the Charge & Drive brand name, Fortum India has already made 62 DC fast-charging points operational, out of which 20 points are DC Level 2. These charging points (see an example in Figure 20) are India’s first public 50 kW DC fast-charging points and are suitable for the upcoming HV electric vehicles. They have already been installed in 5 cities: Delhi-NCR, Hyderabad, Mumbai, Bengaluru, and Ahmedabad. These chargers are compatible with both the combined charging system (CCS) and CHArge de Move (CHAdeMO) DC charging protocols. The company also offers a cloud solution configured to suit a wide array of custom requirements, including remote monitoring and diagnostics, price plan administration, and back-end administration that allows an operator to see the current status of each charger, enabling him/her to control the charging at each station. In addition, the consumer can also get details on the status of charging points and use flexible payment options, e.g. credit/debit cards or RFID payment (Singh, 2019) (Fortum, 2019) (PTI, 2019).
figurE 20: 50 kw dC ChargEr in ahmEdabad
picture courtesy: fortum India
5.3.2.2 Bharat DC 001
Bharat DC 001 is a special category of EVSEs specifically designed for the Indian context. This charger is designed at an output voltage level suitable for charging the existing LV e-4W models44 in India. It is a floor-mounted charger that has a high current output at a low voltage (refer to Table 10 for the technical specifications). The ancillary equipment needed for these chargers is similar to that for DC Level 1 chargers, but is relatively inexpensive due to the lower power rating. The costs of the charger and ancillary equipment are summarised in Table 11.
44 typical battery voltages of e-4ws are well above 150 v in established ev markets.

42
InDIAn CAse stuDy Establishment of charging facilities in Nagpur e-mobility pilot project
Ola has established a network of charging stations (see an example in Figure 21), including AC II charging points at driver-partner residences, in Nagpur as part of India’s first multimodal e-mobility initiative. The combined capacity of all the public facilities allows them to charge 22 vehicles at the same time. The public charging facility has AC and DC chargers compliant with the respective Bharat AC 001 and Bharat DC 001 standards. One of the key observations from the project is that the EV charging time increases in the summer when using DC chargers. The charging time in the case of AC charging is not impacted as much by ambient weather conditions. The pilot project has also provided insights on challenges in operating EV chargers due to voltage fluctuations in the distribution grid (Arora & Raman, 2019).
figurE 21: En-routE ElECtriC vEhiClE Charging Station
picture courtesy: ola mobility Institute
InDIAn CAse stuDy
DC charging facilities for fleet operation
DC fast charging is considered the best solution for fleet operation. EEE Taxi, a fleet operator in the on-demand cab and staff transport fleet segments, has EVs that comply with the Bharat DC 001 standard. The company has developed captive and public charging facilities with Bharat DC 001 chargers (refer to Figure 22 for an example) for their fleet operations. Sophisticated algorithms are used for the EVs to keep track of the
state of charge of battery and distance to the next charging facility. EEE Taxi has found that it is optimal to maintain a 4:1 or 5:1 ratio of cars to charging facilities. The current chargers are of 15 kW capacity, but the company is planning to add 30 kW chargers in the future, where their charging facilities are connected to HT lines and have 100 kVA transformers providing power supply.
figurE 22: ElECtriC vEhiClE Charging faCility at off-StrEEt parking SpaCE
picture courtesy: eee taxi

43
5.3.3 Inductive Charging
The inductive charging category includes all charging technologies that entail wireless transfer of electricity, either by static or dynamic induction. Specialised equipment such as high-frequency converters and induction coils are required to transfer energy wirelessly. Additionally, the EVs need to be equipped with receiver units for wireless power, along with the on-board charging equipment. The capacity of these receivers and chargers determines the power limits for charging by this method.
Inductive, or wireless, charging had taken a backseat in the past primarily due to its lower efficiency in comparison with conductive technology (Mi, 2014). However, inductive charging is now gaining popularity as a convenient charging option, as the efficiency has improved over time (Hurst, 2018). Norway is planning to install wireless charging stations for electric taxis in the city of Oslo [refer to International case study: Wireless charging of commercial electric taxis in Oslo for details]. In this model, the taxi driver parks the EV over the in-ground charging unit embedded in the road, and charging begins automatically (Navigant, 2018). Installation of underground inductive charging pads and cables is quite expensive. The cost of an in-road inductive charging project in South Korea is estimated at approximately $69 million USD45 (Yeon-soo, 2019).
Inductive ground pads for home-based charging are also available in the market. These ground pads can be plugged into wall-mounted outlets and placed under the EVs for charging. The technical specifications and costs for home charging units are presented in Table 12 (WiTricity, 2016) (Evantran, 2019) (Hurst, 2018) (Shahan, 2015).
Table 12: TeChnICal speCIfICaTIons and CosT of wIreless home Chargers46
Technical Specifications
Input AC Voltage (V) 230
Maximum Output Current (A)46 32
Output Power Range (kW) 3.3 - 11
Cost Estimates
Charging equipment cost (I) 91,000 - 2,10,000
Ancillary infrastructure cost (I) 1,600 - 2,500
Total EVSE cost (I) 92,600 - 2,12,500
InternatIonal case study Wireless charging of commercial electric taxis in Oslo
Norway is one of the biggest markets for electric cars in Europe (Reuters, 2019). Norway is committed to converting its commercial taxis to a zero-emission system by 2023. In order to achieve this, the municipal government in Oslo has partnered with Fortum and Momentum Dynamics to implement a wireless charging pilot project for EVs. 75-kW wireless charging pads will be embedded in taxi lines, which will help minimise waiting time and charging time for electric cars at charging stations. In order to use the facility, an EV has to be equipped with high power wireless receivers and on-board chargers. The project cost is unknown (Statt, 2019).
45 Equivalent to I 483 crores46 The maximum output current is specified taking into account applicability in the Indian context. Inductive chargers
available in the U.S. market are rated for 30/50 A maximum output (Evantran, 2019).

44
5.3.4 battery Swapping
Battery swapping-based charging entails swapping depleted vehicle batteries with fully charged batteries. This system consists of the battery charging system and battery swapping mechanism. Hence, the technical parameters for battery swapping systems depend on both the charging point for the batteries and the swapping infrastructure. Hardly any information is available on the power requirement for battery charging facilities and swapping operations. The minimum voltage required for this type of charging is typically 415 V or above.
Though battery swapping is not a commonly used technology for e-4W charging, it has often received attention as the future of EV charging. In the case of India, there have been a lot of discussions surrounding the application of range extension batteries (refer to Indian case study: Range extension batteries). However, a major barrier to implementing battery swapping is the fact that most EVs are not designed for this method. Only select car models from Renault, NIO, and Tesla are designed with swappable batteries. The learnings from battery swapping pilots can be summarised in four main points:
1. Battery swapping necessitates changes in EV and battery pack design.
2. Battery swapping can reduce upfront EV cost.
3. Significant investment is required to set up a battery swapping facility.
4. EV owners incur recurring charges for using the swapping facility.
The time required for swapping is typically 5 minutes. The system requires special equipment such as battery-swapping arms and battery movement systems, along with the battery charging systems, which would potentially increase the capital and operating costs. The ancillary infrastructure includes a distribution transformer, associated LT and HT switchgears, cables, a protection system, and a supervisory control and data acquisition (SCADA) system. The estimated cost for battery swapping infrastructure is presented in Table 13 (Spöttle, et al., 2018).
tablE 13: battEry Swapping CoSt EStimatES
Charging and swapping equipment cost (I)
Ancillary infrastructure cost (I)
Total EVSE cost (I)
3,20,00,000+ 2,50,000 - 4,00,000 3,22,50,000+
InternAtIonAL CAse stuDy Better Place battery swapping pilot project
In Israel, as part of a pilot project focused on converting ICE vehicles to inexpensive electric cars, a battery swapping pilot for e-4Ws was implemented. The Renault Fluence, the retrofitted EV model used in the project, only had a range of 120 km. Better Place, an Israeli startup, set out to eliminate range anxiety concerns by installing battery swapping facilities. The company built a network of facilities capable of swapping the batteries in 5 minutes. However, the cost of the car and usage of the swapping facility were too high for customers, which eventually caused the project to the fail. Each swapping facility was projected to cost at least $2 million USD (equivalent to I12.6 crores in 2014), four times the initial estimate by Better Place. The consumers who received a $35,000 USD (equivalent to I22 lakhs in 2014) car would have to spend $3000 USD (equivalent to I1.9 lakhs in 2014) annually for swapping services (Feldman, 2017) (Chafkin, 2014).
battEry Swapping iS not a Commonly uSEd tEChnology for E-4w Charging,

45
InDIAn CAse stuDy Range extension batteries
The Centre for Battery Engineering and EVs at Indian Institute of Technology (IIT) Madras is promoting swappable range extension batteries for electric vehicles in India. In their design, the EV has a fixed battery and a swappable battery. All EVs will have a slot for a second battery, called a range extension battery, which can be added or swapped at a swapping station. This is an alternative to the conventional battery swapping system, wherein the entire battery is detachable. The discharged range extension battery is taken to a conditioned environment and charged in about two hours. The fixed vehicle battery is charged using the AC charging technology. This enables EV operation in an ecosystem with both charging and swapping options (CBEEV, 2019).
5.4 Comparative assessment of available charging options
Considering that it might not be plausible to deploy every available charging technology to recharge the entire range of EV segments (e.g. 2- and 3-wheelers, 4-W passenger cars, buses, light commercial vehicles, etc.), this study has undertaken a thorough comparative assessment of the abovementioned charging options using a set of critical parameters, in order to identify the ones that could be practically implemented for e-4W charging in India (refer to Table 14). AC-I charging and DC pantograph technology are not part of the comparative assessment matrix, because the former requires a service voltage that is not prevalent in India, while the latter is not used to charge e-4Ws. Since e-4Ws suitable for DC Level 3 charging are not envisaged in the Indian market in the near future, this type of charging is also not included in the assessment table. The values in the table have been compiled based on the technical and financial specifications observed in the market and applicability in the Indian context.
Based on the assessment (as summarised in Table 14), the study has found that:
• Battery swapping is not an ideal solution for charging e-4Ws currently available in the market. The requirement for significant EV modifications and high installation and operational cost are two major barriers to its implementation.
• Inductive charging has only achieved limited success as a home charging solution, primarily due to its high cost. The inductive charging solutions for public charging are at the nascent stage. These solutions necessitate high investment and require EVs to be retrofitted with additional equipment.
• AC-III charging is also not found to be suitable, as the current and upcoming EV models in India do not have three-phase on-board chargers.
Thus, this study has shortlisted the following viable e-4W charging technologies for public charging facilities: AC-II, Bharat AC 001, Bharat DC 001, DC-I, and DC-II charging. These technologies are further examined in Chapter 6, in terms of how to select the best-fit technology for the charging requirement of an e-4W fleet in India.
Study haS ShortliStEd thE following viablE E-4w Charging tEChnologiES for publiC Charging faCilitiES: aC-ii, bharat aC 001, bharat dC 001, dC-i, and dC-ii Charging.

46
tablE 14a: CompariSon of availablE E-4w Charging optionS in india
Parameter AC – II (A) AC – II (B)
Bharat AC 001
AC – III Bharat DC 001
DC - I DC - II Inductive charging
Battery swapping47
Input AC volt-age48 (V)
230 230 415 415 415 415 ≥415 ≥230 ≥415
Rated output power49 (kW)
1.6 - 3.3 3.3 - 7.3 10 (3.3 x 3) 11 – 43 10 – 15 ≤50 >50 3.3 - 7.2 Data not available
Output volt-age (V)
230 230 230 415 48/ 60/ 72
50 - 500 150 - 950 230 Data not available
Maximum output current (A)
16 32 15 63 200 80 200 30 Data not available
Output power considered for analysis50 (kW)
2 6.6 2 22 10 25 50 7.2 Data not available
Charging/ swapping time for HV e-4W in hours (40 kWh rated battery)51
14 - 20 4 - 6 14 – 20 1.3 - 1.8 Not ap-plicable
1.1 - 1.6 0.6 - 0.8 4 - 6 0.08352 (5 minutes)
Charging/ swapping time for LV e-4W in hours53 (20 kWh rated battery)
7 - 10 Not ap-plicable
7 – 10 Not ap-plicable
1.4 - 2 Not ap-plicable
Not ap-plicable
Not ap-plicable
Not appli-cable
Required electricity connection54 (HT/ LT)
LT LT LT LT LT LT HT LT HT
Required ancillary in-frastructure
Industrial plug top, residual current circuit breaker
Cable (copper (Cu), 6 sq. mm), moulded case circuit breaker (2-pole (P), 32A)
Cable (Cu, 6 sq. mm), moulded case circuit breaker (4P)
Cables (Cu, 16-25 sq. mm), circuit breaker (3P)
Cable (6 sq. mm), moulded case circuit breaker (4P)
Cables (16-25 sq. mm), circuit breaker (3P)
Distribu-tion trans-former, HT/LT switch-gear, HT/LT cables
Simple plug and play
Distribution transformer, HT /LT switchgear, cables, protection relays, & SCADA
Auxiliary electricity consumption
Nil Low Low Low Low Low Medium Low High
47 the parameters for battery swapping depend on both the battery charging point and swapping infrastructure.48 voltage set at the common single-phase and three-phase ac distribution levels in India or based on respective India-specific standards49 for ac II (a) and ac II (b) charging, the power range is set considering the 16a/32a input current range for a domestic socket in the Indian context. others
are based on standards or as per the specifications of e-4w chargers currently available in the market (dhI, 2017) (witricity corporation, 2018) (witricity, 2016) (evantran, 2019).
50 output powers are set according to dhI guidelines and on-board charger capacity (dhI, 2017) or the highest possible power considered at a power factor of 0.9. for ac III, the output power is assumed based on the study of chargers in the european market (spöttle, et al., 2018)
51 for more details, please refer to annexure c – charging time estimation.52 swapping time set based on available details53 for more details, please refer to annexure c – charging time estimation.54 connection requirement assessed as per India’s grid code

47
Parameter AC – II (A) AC – II (B)
Bharat AC 001
AC – III Bharat DC 001
DC - I DC - II Inductive charging
Battery swapping
Cost of electricity for charging (energy and demand charge as per connection)
As per LT connection
As per LT connec-tion
As per LT connec-tion
As per LT connec-tion
As per LT connec-tion
As per LT connec-tion
As per HT connec-tion
As per LT connection
As per HT connection
Capital cost of charger55 (I)
0 - 24,000 38,000 -65,000
40000 -50,000
80,000 -1,20,000
1,80,000 -2,60,000
6,00,000 -8,00,000
12,00,000 -13,00,000
91,000 -2,10,000
3,20,00,000+
Capital cost of ancillary infrastructure (I)
1,400 -1,900
1,600 -2,500
1,800 -2,500
4,000 -11,000
2,800 -3,500
8,000 -15,000
6,25,000 -8,25,000
1,600 - 2,500
2,50,000 – 4,00,000
Area require-ment (m2)
Not ap-plicable
0.2 (wall-mounted)
0.2 (wall-mounted)
0.15 (wall-mounted)
0.8 (wall-mount-ed)
0.4 (wall-mounted)
1-1.5 (floor-mounted)
Not ap-plicable
Data not available
Requirement of 11/ 22/ 33 kV connec-tion
No No No No No No Yes No Yes
Length of cable connec-tor (m)
5 5 5 5 5 5 5 Not ap-plicable
Not appli-cable
Difficulty of
drawing elec-
tricity from
distribution
network
Not
difficult
Not
difficult
Not
difficult
Mod-
erately
difficult
Mod-
erately
difficult
Mod-
erately
difficult
Difficult Not dif-
ficult
Difficult
Established
precedence
for e-4W
charging
Yes Yes Yes Yes Yes Yes Yes Limited56 Limited57
Suitability for
installation in
public charg-
ing facilities
in India
Yes Yes58 Yes No Yes Yes Yes No Limited
tablE 14b: CompariSon of availablE E-4w Charging optionS in india1234
55 costs estimated based on available literature and consultation with stakeholders regarding market values (spöttle, et al., 2018) (navigant, 2018) (evconnectors, 2019) (Indiamart , 2019)
56 few successful commercial use cases have been reported for inductive charging and battery swapping for e-4ws.57 few successful commercial use cases have been reported for inductive charging and battery swapping for e-4ws.58 however, high-power single-phase charging may lead to an imbalance in the distribution network.

48
49
6 Selection of “best-fit” charging technologies

50
6 Selection of “best-fit” charging technologies
Understanding “where to charge” is not enough to ensure successful establishment of EV charging infrastructure; knowledge on “how to charge” is equally important. The multiplicity of technologies available in the Indian market, with each technology having its own set of pros and cons, makes it hard to select the “best-fit” charging technology.
The effectiveness and feasibility of deployment and use of a charging technology depend on a range of factors, both technical and economic. The technology should satisfy the criteria for charging the vehicle (e.g. charging time, grid infrastructure needed, proximity to grid, etc.), and its implementation should be cost-effective. Considering that charging and battery technologies are still evolving, it is possible that none of the charging options currently available in the market would satisfactorily meet all the criteria; hence, the selection of a suitable charging technology may involve trade-offs.
However, objectively deciding on the trade-offs is a difficult task, and a framework would be useful in the decision making process. Recognising the possible complexity in pinpointing the best-fit technology for e-4W charging, the study provides a methodology for this using a composite Multi-Criteria Decision Matrix (MCDM) for any type of public charging facility. An MCDM consists of a set of techno-economic parameters, each assigned a weight based on the assessed degree of importance using the following scale (refer to Figure 23):
figurE 23: SCalE for aSSESSing thE importanCE of a paramEtEr
The “high-impact” technical and economic parameters mentioned in the MCDMs below were filtered from a comprehensive list of parameters. The weights assigned to these parameters vary with the type of public charging facility. This is inevitable, as the criteria for best-fit technologies change for different public charging facilities. For instance, charging time may be the most important factor in the case of a charging facility that caters to time-bound business operations (such as logistics), whereas it may not be as important for operations where customers are at the location for several hours for another purpose (e.g. at a charging facility within office premises).
While considering the technical or economic parameters and assigning their respective weights, one should treat them in isolation from other contesting parameters and in the context of the given public charging facility. Each charging technology is ranked against individual parameters, whereby the technology that satisfies most the ideal value for a parameter is ranked highest (e.g. Out of four charging technologies, the most suited technology against a particular parameter will have the rank of “4”). These ranks are derived from the comparative assessment of the identified charging technologies. By multiplying the parameter weights by the technology rankings for each respective parameter, taking the sum, and dividing it by the sum of the parameter weights, one arrives at a normalised weighted score for each technology (see Table 18 for an example). The charging technology that
10
Least Important
Less Important
Fairly Important
Very Important
Most Important
98765431 2
rECogniSing thE poSSiblE ComplExity in pinpointing thE bESt-fit tEChnology for E-4w Charging, thE Study providES a mEthodology for thiS uSing a CompoSitE multi-CritEria dECiSion matrix (mCdm) for any typE of publiC Charging faCility.

51
has the highest normalised weighted score represents the most appropriate option.
The charging equipment market in India is still incipient, and the vehicle/ battery features and charging technologies are evolving rapidly, which may impact the technical and economic viability of the concerned charging technologies. Therefore, it is critical to bear in mind that the given rankings of the charging options are only reflective of the present scenario and may require revision as the market evolves. Stakeholders should take a fresh look at the Decision Matrices and revise them as required on a regular basis, to make appropriate decisions.
As explained above, e-4W charging may happen at different types of public charging facilities. The study has identified three main types of public charging facilities that can serve e-4W fleets. However, in the face of the charging technologies’ trade-offs against the commonly-used performance standards (such as charging time, capital cost, operational expenditure, input grid power, etc.), a particular charging technology may not be the best-fit option for all types of public charging facilities. Hence, this study focuses on separately evaluating the charging technologies in the context of the three identified types of public charging facilities. These charging facilities are such that they can cater to the requirement of both commercial fleets and privately-owned vehicles. To this end, separate parameter tables and MCDMs have been developed.
An example of MCDM application to identify the best-fit charging technology for an en-route public charging facility is illustrated below. The MCDMs to assess the suitability of technologies for other types of public charging facilities are presented in Annexures A and B.
The technical and economic parameters considered for chargers for en-route public charging facilities and their respective weights are presented in Table 15 and Table 16, respectively. Similar details for chargers in public parking spaces and office premises are available in Annexures A and B, respectively.
E-4w Charging may happEn at diffErEnt typES of publiC Charging faCilitiES

52
tablE 15: tEChniCal paramEtErS for Charging tEChnology SElECtion for En-routE publiC Charging faCilitiES59
Parameter Ideal valueIdeal value justification
Weight Weight justification
Charging time (minutes)
36 for HV e-4Ws
84 for LV e-4Ws
Minimum time required to charge a 40-kWh and a 20-kWh battery is considered the ideal value for HV and LV e-4Ws, respectively.59
10
In the case of en-route charging, this parameter is given the highest weight, as charging by stopping during a trip may lead to a significant increase in travel time. In order to keep the charging time to a minimum, the operator would prefer the most rapid charging technology available, in order to:
• Serve more EVs and increase the capacity utilisation of the charging facility
• Attract more consumers to use its service for opportunity charging
Land requirement for fixed e-4W charging demand
Minimal
Area requirement for the parking bays, manoeuvring lanes, core charging infrastructure, and ancillary equipment for a fixed number of EVs should be as low as possible.
10
Land requirement basically translates to capital investment or recurring cost linked to the market value of the land and, therefore, has significant impact on the economic viability of operating a charging facility. Hence, this parameter is assigned the highest weight. The land requirement is calculated based on the number of chargers required for a fixed EV demand. Technologies that are able to charge in less time are ranked higher, due to the lower space requirement to charge an equal number of EVs.
Difficulty of drawing electricity from the distribution network
Not difficult
The difficulty of drawing electricity depends on:
• Availability of existing connection with adequate sanctioned load
• Ability to cater to charging requirement without an 11/ 33 kV connection
5
Following consultation with stakeholders, the study found that, to install one charger, the sanctioned load requirement comes under the LT connection category in most states. Therefore, this parameter has a relatively low weight.
59 for detailed analyses, refer to annexure c – charging time estimation.

53
tablE 16: EConomiC paramEtErS for Charging tEChnology SElECtion for En-routE publiC Charging faCilitiES
Parameter Ideal valueIdeal value justification
Weight Weight justification
Capital cost per charger
Minimum cost
The minimum price of an EVSE is the most ideal case for a suitable charging technology.
8
EVSE cost is one of the most significant components of the developer’s capital investment in establishing a charging facility. This has a major impact on the project’s economic feasibility.
Electricity cost for e-4W charging
Minimum cost
The charging system that consumes the least amount of energy, and therefore has the lowest associated electricity cost, would get the highest rank. The amount of energy consumption at the facility level for EV charging is considered to be fixed.60
6
Cost of electricity for charging is the main operational expenditure in running a charging facility. Hence, most states in India have announced promotional EV charging tariffs. Furthermore, in the future, if there is a hike in tariffs, it is expected that the corresponding increase in the cost of service provision would be proportionately passed on to the consumers. Hence, it is not weighted as highly as the EVSE cost.
Based on the listed technical and economic parameters and their ideal values, with the help of the MCDM tool, the study has assessed the applicability of charging technologies for en-route e-4W charging. The MCDMs for LV and HV e-4Ws have to be separate, due to the fact that these categories of e-4Ws can only be charged using certain types of technologies. The charging technologies associated with LV and HV e-4Ws are presented in Table 17.
tablE 17: Charging tEChnologiES appliCablE for lv and hv E-4wS
Charging technology Applicability to LV and HV e-4Ws
High Voltage Low Voltage
AC-II (A) Yes Yes
Bharat AC 001 Yes Yes
AC-II (B) Yes No
Bharat DC 001 No Yes
DC-I Yes No
DC-II Yes No
Table 18 and Table 19 present the MCDMs for best-fit charging technology selection for the en-route public charging of LV and HV e-4Ws, respectively.
60 for detailed analyses, refer to annexure c – charging time estimation.

54
tablE 18: multi-CritEria dECiSion matrix for lv E-4w Charging at En-routE publiC Charging faCility61626364
Pa
ram
eter
s
CriteriaWeight61 (W)
Bharat AC 001 AC-II (A) Bharat DC 001
RBAC00162 W*RBAC001 RAC-II(A)
63 W*RAC-II(A) RBDC00164 W*RBDC001
Tech
nica
l pa
ram
eter
s
Charging time 10 1 10 1 10 3 30
Land requirement for fixed e-4W charging demand
10 1 10 1 10 3 30
Difficulty of drawing electricity from the distribution network
5 1 5 3 15 1 5
Econ
omic
pa
ram
eter
s Capital cost per charger 8 2 16 3 24 1 8
Electricity cost for e-4W charging
6 3 18 3 18 3 18
Sum 39 59 77 91
Normalised Weighted Score 1.51 1.97 2.33
The charging technology with the highest normalised wei ghted score would qualify as the most appropriate option. The above MCDM shows that the Bharat DC 001 EVSE has the highest normalised weighted score. This implies that it is the most suitable technology for charging LV e-4Ws at an en-route public charging facility.
tablE 19: multi-CritEria dECiSion matrix for hv E-4w Charging at En-routE publiC Charging faCility656667686970
P
aram
eter
s
Criteria
Wei
ght65
(W)
Bharat AC 001
AC - II (A) AC - II (B) DC - I DC - II
RBA
C001
66
W*R
BAC0
01
RA
C-II
(A)67
W*R
AC-
II(A
)
RA
C-II
(B)68
W*R
AC-
II(B
)
RD
C-I69
W*R
DC-
I
RD
C-II
70
W*R
DC-
II
Tech
nica
l par
amet
ers
Charging time 10 1 10 1 10 3 30 4 40 5 50
Land requirement for fixed e-4W charging demand
10 1 10 1 10 3 30 4 40 5 50
Difficulty of drawing electricity from the distribution network
5 3 15 5 25 4 20 2 10 1 5
Econ
omic
pa
ram
eter
s
Capital cost per charger
8 4 32 5 40 3 24 2 16 1 8
Electricity cost for e-4W charging
6 5 30 5 30 5 30 5 30 5 30
Sum 39 97 115 134 136 143
Normalised Weighted Score 2.49 2.95 3.44 3.49 3.67
61 w = weight of criterion for particular charging requirement of specific vehicle segment62 r
bac001 = rank of bharat ac 001 charging technology against a particular criterion
63 rac-II(a)
= rank of ac level 2-a charging technology against a particular criterion64 r
bdc001 = rank of bharat dc 001 charging technology against a particular criterion
65 w = weight of criterion for particular charging requirement of specific vehicle segment66 r
bac001 = rank of bharat ac 001 charging technology against a particular criterion
67 rac-II(a)
= rank of ac level 2-a charging technology against a particular criterion68 r
ac-II(b) = rank of ac level 2-b charging technology against a particular criterion
69 rdc-I
= rank of dc level 1 charging technology against a particular criterion70 r
dc-II = rank of dc level 2 charging technology against a particular criterion

55
The MCDM shows that the DC Level 2 EVSE gets the highest normalised weighted score, indicating it is the most suitable technology for charging HV e-4Ws at an en-route public charging facility.
As mentioned above, similar multi-criteria analyses have been carried out for two other types of e-4W charging facilities. Table 20 presents the list of best-fit charging technologies identified by the MCDMs for LV and HV e-4Ws.
tablE 20: bESt-fit tEChnologiES for E-4w Charging at diffErEnt typES of Charging faCilitiES
Charging facility typeBest-fit charging technologies
Low Voltage High Voltage
En-route public charging facility Bharat DC 001 DC-II
Charging facility at public parking space71 AC-II (A) AC-II (B)
Charging facility within office premises AC-II (A) AC-II (B)
MCDM results may vary based on the characteristics of a specific location. For certain locations, additional costs (such as the cost for cabling) and more time (e.g. to get permission for road-cutting) may be required to get the necessary electricity connection.
One should consider MCDM results with some level of caution. The global and Indian EV markets are both still at a nascent stage, and the technical design of EVs and chargers is continuously being updated, which may impact the technical and economic viability of the concerned charging technologies in the coming months. Therefore, one has to remember that the parameters considered in the MCDMs and the results reflect the current context and may change in the future as the EV market evolves. For example, future advances in battery technology and increases in battery size may impact required EV charging time. Furthermore, changes in charger cost with improved economies of scale can alter the ranking. Additionally, the evolution of charging technology (for example, the application of AC-III or DC-III chargers for e-4Ws) could necessitate incorporation of new technologies into decision-making tools. Decision-makers therefore have to reevaluate the possible list of technologies and ideal values of parameters to assess in the MCDM(s) when deciding on chargers for a particular public charging facility.
71 In the case of best-fit charging technology selection for charging facilities at public parking spaces, there is no need for developing separate mcdms for off-street and on-street parking, as there is no difference in the parameters considered for selection in these two categories.
thE global and indian Ev markEtS arE both Still at a naSCEnt StagE, and thE tEChniCal dESign of EvS and ChargErS iS ContinuouSly bEing updatEd, whiCh may impaCt thE tEChniCal and EConomiC viability of thE ConCErnEd Charging tEChnologiES in thE Coming monthS.

56

57
7 Stakeholder collaboration in charging infrastructure deployment

58
7 Stakeholder collaboration in charging infrastructure deployment
The availability of charging infrastructure is the most important requirement for e-4W adoption in India. To create a competitive scalable market for setting up public EV charging facilities in India, the Ministry of Power issued a clarification on 13th April, 2018 to delicense EV charging (Ministry of Power, 2018). This opens up the sector to a wide range of players who can invest in the development of charging infrastructure without having a prior licence to do so. However, on its own, this may not be the silver bullet needed to achieve rapid and large-scale deployment of public charging facilities in a city, as the potential investor or charging service provider will have to depend on the power distribution utility to obtain the necessary (LT/ HT) electricity connection and may also have to depend on other entities to get the required land for the charging facility. It is therefore important to bring multiple stakeholders on board to create a conducive ecosystem for rolling out public charging facilities in a city.
The primary requirement for establishing an EV charging facility is the land for EV parking during charging. The challenge with the land is two-fold: its availability and cost. In Tier-I and Tier-II Indian cities, availability of space at the desired locations could be the biggest hurdle to implementation. This lack of availability results in high land rental costs, which, in turn, directly drives up the charging service cost and negatively affects the charging businesses’ viability. One of the premier on-demand cab fleet operators has reported that land lease alone constitutes more than 40% of the charging station’s operational cost (Arora & Raman, 2019).
ULBs, the custodians of public land in cities, can potentially play a critical role in supporting the interested charging service providers in getting the necessary space. Not only do ULBs have land they can lease, but they also manage parking lots across cities, where space can be earmarked for EV charging bays. The charging service provider and ULB may enter into a lease agreement based on a revenue sharing model.
In the implementation of a charging facility, the vital role of the power distribution utility cannot be over emphasised. From providing a timely (LT or HT) electricity connection for the required sanctioned demand, to supplying uninterrupted electricity, to metering and billing and, gradually, implementing Vehicle-Grid Integration (VGI)72, the power distribution utility’s part is very crucial. Clearly, the charging service provider requires the power utility’s cooperation to establish a charging facility, and the coordination between these two players is critical to the facility’s successful operation.
Apart from the ULB and power distribution utility, the State Nodal Agency (SNA) is another important stakeholder in rolling out public charging infrastructure in a city. The revised guidelines and standards issued by the Ministry of Power on 1st October, 2019 stipulate that every state should nominate a Nodal Agency for public charging infrastructure deployment (Ministry of Power, 2019). As per the guidelines, the SNA is responsible for selecting an Implementation Agency to set up, operate, and maintain public charging facilities in the state, in order to achieve the phased plan for prioritised roll-out of public charging infrastructure. SNA could potentially play the important role of go-between among different stakeholders - engaging the concerned players and ensuring effective coordination, especially in order to address implementation hurdles. Apart from facilitating
72 comprising demand response or virtual power plant programmes.
thE primary rEquirEmEnt for EStabliShing an Ev Charging faCility iS thE land for Ev parking during Charging. thE ChallEngE with thE land iS two-fold: itS availability and CoSt

59
charging facility deployment, SNA has the mandate to limit the fees charged by a charging service provider at a public charging facility73. There are other activities that also involve the SNA, such as accessing charging station data, disbursing subsidies to charging service providers, etc. When the SNA is the power distribution utility, it also has the important abovementioned roles of a power utility in the implementation process. A summary of the key stakeholders’ possible roles is presented in Figure 24.
The bottom line is that understanding a charging service provider’s requirements for public EV charging facility implementation and realising the coordination and/ or collaboration between the public agencies and the interested investor in order to satisfy these requirements are vital to quickly achieving large-scale roll out of public EV charging infrastructure.
figurE 24: mapping of poSSiblE kEy StakEholdEr rolES in faCilitating Charging infraStruCturE roll-out in an indian City
73 this is applicable in the case where the public charging facility has been set up with government incentives.
Ensuring availability of
sace at suitable locations
Designation of charing bays in public parking
lots
Subsidy disbursement to charging service
providers
Timely provision of electricity
connection of required
capacity
Supply of uninterupted
electricity
Implementation of Vehicle Grid
Integration
Electricity metering and
billing
go-between Implementation
Agency selection
Coordination among
stakeholders
Role of SNA
Acessing charging station
data
Fixing ceiling for service
charges
Utility's role
Offering competitive land prices
ULB's possible role

60

61
Annexures

62
Annexure A MCDMs for e-4W charging at public parking space
tablE 21: tEChniCal and EConomiC paramEtErS for Charging tEChnology SElECtion for Charging at publiC parking SpaCE
Parameter Weight Justification of weight
Charging time 8
In the case of charging at parking lots, this parameter is given high weightage, as there is a possibility for opportunity charging. A quicker top-up would be preferred by commercial fleet operators.
Land requirement for fixed e-4W charging demand
5
Land requirement basically translates to capital investment or recurring cost linked to the market value of the land. Here, this parameter is assigned the lowest weight, as parking space is already available. Additional space is only required for charger installation.
Difficulty of drawing electricity from the distribution network
7
Following consultation with stakeholders, this study found that, to install one charger, the sanctioned load requirement comes under the LT connection category in most states. Therefore, this parameter has a relatively low weight.
Capital cost per charger 9
EVSE cost is one of the most significant components of the developer’s capital investment in establishing a charging facility. This has a major impact on the project’s economic feasibility.
Electricity cost for e-4W charging
6
Cost of electricity for charging is the main operational expenditure in running a charging facility. Hence, most states in India have announced promotional EV charging tariffs. Furthermore, in the future, if there is a hike in tariffs, it is expected that the corresponding increase in the cost of service provision would be proportionately passed on to the consumers. Hence, it is not weighted as highly as the EVSE cost.

63
tablE 22: multi-CritEria dECiSion matrix for lv E-4w Charging at publiC parking SpaCE747576 77
Para
met
ers
Criteria
Wei
ght74
(W)
Bharat AC 001 AC-II (A) Bharat DC 001
RBA
C001
75
W*R
BAC0
01
RA
C-II
(A)76
W*R
AC-
II(A
)
RB
DC0
0177
W*R
BD
C001
Tech
nica
l par
amet
ers
Charging time 8 1 8 1 8 3 24
Land requirement for fixed e-4W charging demand
5 1 5 1 5 3 15
Difficulty of drawing electricity from the distribution network
7 1 7 3 21 1 7
Econ
omic
par
amet
ers Capital cost
per charger9 2 18 3 27 1 9
Electricity cost for e-4W charging
6 3 18 3 18 3 18
Sum 35 56 79 73
Normalised Weighted Score
1.60 2.26 2.09
The above MCDM shows that the AC-II (A) EVSE gets the highest normalised weighted score, indicating it is the most suitable technology for LV e-4W charging at a public parking space.
74 w = weight of criterion for particular charging requirement of specific vehicle segment75 r
bac001 = rank of bharat ac 001 charging technology against a particular criterion
76 rac-II(a)
= rank of ac level 2-a charging technology against a particular criterion77 r
bdc001 = rank of bharat dc 001 charging technology against a particular criterion

64
tablE 23: multi-CritEria dECiSion matrix for hv E-4w Charging at publiC parking SpaCE
Para
met
ers
Criteria
Wei
ght78
(W)
Bharat AC 001
AC - II (A) AC - II (B) DC - I DC - II
RBA
C001
79
W*R
BAC0
01
RA
C-II
(A)80
W*R
AC-
II(A
)
RA
C-II
(B)81
W*R
AC-
II (B
)
RD
C-I82
W*R
DC-
I
RD
C-II
83
W*R
DC-
II
Tech
nica
l par
amet
ers
Charging time 8 1 8 1 8 3 24 4 32 5 40
Land requirement for fixed e-4W charging demand
5 1 5 1 5 3 15 4 20 5 25
Difficulty of drawing electricity from the distribution network
7 3 21 5 35 4 28 2 14 1 7
Econ
omic
pa
ram
eter
s Capital cost per charger
9 4 36 5 45 3 27 2 18 1 9
Electricity cost for e-4W charging
6 2 12 2 12 2 12 2 12 1 6
Sum 35 82 105 106 96 87
Normalised Weighted Score
2.34 3.00 3.03 2.74 2.49
The above MCDM shows that the AC-II (B) EVSE gets the highest normalised weighted score and, thus, is the most appropriate technology for HV e-4W charging at a public parking space.
78 w = weight of criterion for particular charging requirement of specific vehicle segment79 r
bac001 = rank of bharat ac 001 charging technology against a particular criterion
80 rac-II(a)
= rank of ac level 2-a charging technology against a particular criterion81 r
ac-II(b) = rank of ac level 2-b charging technology against a particular criterion
82 rdc-I
= rank of dc level 1 charging technology against a particular criterion83 r
dc-II = rank of dc level 2 charging technology against a particular criterion
REFERENCES

65
Annexure BMCDMs for e-4W charging at charging facility within office premises
tablE 24: tEChniCal and EConomiC paramEtErS for Charging tEChnology SElECtion for Charg-ing within offiCE prEmiSES
Parameter Weight Justification of weight
Charging time 6
In the case of charging within office premises, this parameter is given low weightage, as there is not a strong case for opportunity charging. The vehicle is not parked specifically for the purpose of charging, and, hence, charging time is simply a function of parking time, which is typically longer.
Land requirement for fixed e-4W charging demand
5
Land requirement basically translates to capital investment or recurring cost linked to the market value of the land. Here, this parameter is assigned the lowest weight, as parking space is already available. Additional space is only required for charger installation.
Difficulty of drawing electricity from the distribution network
5
Following consultation with stakeholders, the study found that, to install one charger, the sanctioned load requirement comes under the LT connection category in most states. Therefore, this parameter has a relatively low weight.
Capital cost per charger 8
EVSE cost is one of the most significant components of the developer’s capital investment in establishing a charging facility. This has a major impact on the project’s economic feasibility and is therefore given the highest weightage.
Electricity cost for e-4W charging
6
Cost of electricity for charging is the main operational expenditure in running a charging facility. Hence, most states in India have announced promotional EV charging tariffs. In the future, if there is a hike in tariffs, it is expected that the corresponding increase in the cost of charging service provision would be proportionately passed on to the consumers. Hence, it is not weighted as highly as the EVSE cost.

66
tablE 25: multi-CritEria dECiSion matrix for lv E-4w Charging at CaptivE Charging faCility within offiCE prEmiSES 84858687
Para
met
ers
Criteria
Wei
ght84
(W)
Bharat AC 001 AC-II (A) Bharat DC 001
RBA
C001
85
W*R
BAC0
01
RA
C-II
(A)86
W*R
AC-
II(A
)
RB
DC0
0187
W*R
BD
C001
Tech
nica
l par
amet
ers Charging time 6 1 6 1 6 3 18
Land requirement for fixed e-4W charging demand
5 1 5 1 5 3 15
Difficulty of drawing electricity from the distribution network
5 1 5 3 15 1 5
Econ
omic
pa
ram
eter
s Capital cost per charger
8 2 16 3 24 1 8
Electricity cost for e-4W charging
6 3 18 3 18 3 18
Sum 30 50 68 64
Normalised Weighted Score 1.67 2.27 2.13
The above MCDM shows that the AC-II (A) EVSE gets the highest normalised weighted score and is, thus, the most appropriate technology for LV e-4W charging within office premises.
84 w = weight of criterion for particular charging requirement of specific vehicle segment85 r
bac001 = rank of bharat ac 001 charging technology against a particular criterion
86 rac-II(a)
= rank of ac level 2-a charging technology against a particular criterion87 r
bdc001 = rank of bharat dc 001 charging technology against a particular criterion

67
tablE 26: multi-CritEria dECiSion matrix for hv E-4w Charging at CaptivE Charging faCility within offiCE prEmiSES
Para
met
ers
Criteria
Wei
ght 88
(W)
Bharat AC 001
AC - II (A) AC - II (B) DC - I DC - II
RBA
C001
89
W*R
BAC0
01
RA
C-II
(A)90
W*R
AC-
II(A
)
RA
C-II
(B)91
W*R
AC-
II (B
)
RD
C-I92
W*R
DC-
I
RD
C-II
93
W*R
DC-
II
Tech
nica
l par
amet
ers
Charging time
6 1 6 1 6 3 18 4 24 5 30
Land requirement for fixed e-4W charging demand
5 1 5 1 5 3 15 4 20 5 25
Difficulty of drawing electricity from the distribution network
5 3 15 5 25 4 20 2 10 1 5
Econ
omic
pa
ram
eter
s
Capital cost per charger
8 4 32 5 40 3 24 2 16 1 8
Electricity cost for e-4W charging
6 5 30 5 30 5 30 5 30 5 30
Sum 30 88 106 107 100 98
Normalised Weighted Score
2.93 3.53 3.57 3.33 3.27
The above MCDM shows that the AC-II (B) EVSE gets the highest normalised weighted score and is, hence, the most suitable technology for HV e-4W charging within office premises.
88 w = weight of criterion for particular charging requirement of specific vehicle segment89 r
bac001 = rank of bharat ac 001 charging technology against a particular criterion
90 rac-II(a)
= rank of ac level 2-a charging technology against a particular criterion91 r
ac-II(b) = rank of ac level 2-b charging technology against a particular criterion
92 rdc-I
= rank of dc level 1 charging technology against a particular criterion93 r
dc-II = rank of dc level 2 charging technology against a particular criterion

68
Annexure C Charging time estimation
The calculation of EV battery charging time is a challenging exercise, as it depends on the charger output power, as well as the battery characteristics. Batteries themselves are complex energy storage devices wherein the available energy, chemistry, configuration, and safe operating limits determine the charging rate and time. A simplified estimation method has been developed correlating the energy required for charging with the charger’s output power. For the purpose of this study, applicable industry-accepted standards for EVs and Lithium Iron Phosphate (LFP) batteries94 are used. Based on the charging curve of LFP batteries and observations on e-4W charging characteristics, the study adopted the following approach95 to determine the upper and lower limits of charging time. The battery is charged fully, i.e. from the existing state of charge (SoC) to 90% SoC. Initially, the battery is charged up to 60% SoC at the charger’s rated power. After that, the charger power drops down to 50% for the remaining charging duration.
The estimated charging time for an EV with a 20-kWh low voltage battery is presented in Table 27.
tablE 27: Charging timE for lv E-4w
Parameters AC – II (A) Bharat AC 001 Bharat DC 001
Charging power (kW) 2.0 3.3 10.0
C-rate for battery capacity96 0.1 0.2 0.5
Charging time (hours) 10.0 6.1 2.0
Effective C-rate for required energy 0.14 0.14 0.71
Effective charging time (hours) 7 4.2 1.4
The estimated charging time for an EV with a 40-kWh high voltage battery is presented in Table 28.
tablE 28: Charging timE for hv E-4w
Parameters AC – II (A) AC – II (B) Bharat AC 001
AC – III DC- I DC- II
Charging power (kW)
2.0 7.4 2.0 22.0 25.0 50.0
C-rate for battery capacity
0.05 0.17 0.05 0.55 0.63 1.25
Charging time (hours)
20.0 5.4 20.0 1.8 1.6 0.8
Effective C-rate for required energy
0.07 0.26 0.07 0.79 0.89 1.79
Effective charging time (hours)
14.0 3.8 14.0 1.3 1.1 0.6
94 lithium Iron phosphate batteries are the common ev batteries.95 the approach is based on the assumption that the charger power output is such that the charging rate is not more
than the battery’s charge-acceptance, i.e. its ability to accept and store energy under given external parameters such as time, temperature, soc, etc.
96 the c-rate is a measure of the rate at which a battery is charged/ discharged.

69
Annexure D List of stakeholders consulted in study
tablE 29: liSt of StakEholdErS ConSultEd in quEStionnairE-baSEd SurvEy
Stakeholder Type
Name Description
e-4W
cha
rgin
g se
rvic
e pr
ovid
ers
Charge ZoneThe company has deployed an unmanned, automated, and open EV charging network that allows EV drivers to find vacant charging spots based on real-time data.
Energy Efficiency Services Limited
EESL is engaged in bulk EV procurement. They support the EV fleet dedicated to government staff mobility by establishing charging station networks.
Fortum India
Fortum India provides solutions for charging network operations. They are establishing DC charging facilities equipped with 50 kW CCS/CHAdeMO chargers.
Magenta PowerMagenta Power provides EV charging solutions and is also involved in coupling EV and renewable energy technologies.
Panasonic
Panasonic is working on smart EV charging in India. They supply components such as charging stations, battery swap stations, on-board chargers, telematics systems, and virtual components like cloud services, intuitive dashboards, and artificial intelligence.
Volttic Electric Vehicle Charging Solutions
Volttic EV Charging is a brand of Tvesas Electric Solution Pvt. Ltd. They provide household, public, and commercial EV charging solutions.
e-4W
flee
t ow
ners
/ op
erat
ors
Baghirathi Group
Baghirathi Transport Solutions is a shared mobility group, providing services to corporates and educational institutions. They offer their services to schools, corporates, & ride-hailing individuals and have now ventured into e-4Ws for service provision.
Blu Smart
Blu Smart is India’s first all-electric shared smart mobility platform for efficient, affordable, intelligent, sustainable ride-sharing, car-sharing, and scooter-sharing.
EEE TaxiEEE Taxi is a strategic partner of Uber and is using a phase-wise approach to add EVs to its all-electric fleet, which caters to company employees and executives.
Lithium Urban Technologies
Lithium Urban Technologies has a fleet of EVs & associated charging infrastructure to support employee transport management.
Ola Electric Mobility
Ola Electric is working with vehicle and battery manufacturers, cities, & driver-partners to ensure electric mobility is convenient, dependable, and affordable.

70
REFERENCESarora, n., & raman, a. (2019). Beyond Nagpur: The promise of electric mobility. new delhi: ola mobility
Institute.
blusmart. (2019). Blu-Smart Mobility. retrieved september 26, 2019, from https://blu-smart.com/
boyd, j. (2018, december 17). IEEE Spectrum. retrieved from Ieee: https://spectrum.ieee.org/energywise/
transportation/efficiency/a-global-charging-standard-for-evs
cbeev. (2019). Electrifying Growth - Adoption of Electric Vehicle in Corporate Fleet. madras: transportech 2019.
retrieved 2019
cea. (2019, november). Installed Capacity India. retrieved december 30, 2019, from http://cea.nic.in/reports/
monthly/installedcapacity/2019/installed_capacity-11.pdf
central electricity agency. (2018). National Electricity Plan. new delhi: ministry of power.
chafkin, m. (2014, 7 4). A Broken Place: The Spectacular Failure Of The Startup That Was Going To Change
The World. retrieved from fast company: https://www.fastcompany.com/3028159/a-broken-place-
better-place
chargepoint. (2017). ChargePoint Smart EV Charging. retrieved from chargepoint: https://www.chargepoint.
com/files/solutionbriefs/sb-workplace.pdf
chargepoint. (2017). CPF25 Family. retrieved from chargepoint: https://www.chargepoint.com/files/brochures/
br-cpf25.pdf
delhi development authority. (2016). Master Plan Delhi – Modification 2021 (modified till 31/03/2016), . new
delhi: delhi development authority.
dhI. (2017, november 21). Department of Heavy Industries. retrieved from standardisation of protocol for ev
charging infrastructure-bharat ev charger specifications regarding: https://dhi.nic.in/writereaddata/
uploadfile/report%20of%20commIttee636469551875975520.pdf
eee taxi. (2019). EEE taxi- sustainable mobiltiy via e vehicles. retrieved september 26, 2019, from https://
www.eeetaxi.com/
etrel. (2018, 04 12). Etrel portfolio. retrieved from etrel: https://www.etrel.com/brochures/g6.pdf
etrel. (2019). Technical datasheet model E6. retrieved from etrel: https://www.etrel.com/technical_
specification_g6_detailed_v1.1.pdf
evantran. (2019). TECH SPECS – PLUGLESS GEN 1 SYSTEM. retrieved from plugless power: https://www.
pluglesspower.com/gen1-tech-specs/
evconnectors. (2019). EV prodicts. retrieved march 8, 2019, from evconnectors: https://evconnectors.com/
fastned. (2019, april 16). Press release: Fastned opens its first 350kW-ready fast charging station in the
United Kingdom. retrieved from fastned: https://fastned.nl/en/blog/post/fastned-opens-its-first-
350k-w-ready-fast-charging-station-in-the-united-kingdom
feldman, y. (2017, 8 31). WHAT HAPPENED TO BETTER PLACE’S ELECTRIC DREAMS? retrieved from the jerusalem
post: https://www.jpost.com/metro/a-story-that-should-be-told-503905
fortum. (2019, 11 18). Fortum Charge and Drive. retrieved from map of charging stations: https://map.
chargedrive.com/en/
funke, s. Á., sprei, f., gnann, t., & plötz, p. (2019). how much charging infrastructure do electric vehicles
need? a review of the evidence and international comparison. Transportation Research Part D, 77,
224-242. doi:10.1016/j.trd.2019.10.024
global transmission report. (2020). Spotlight: EV Charging Infrastructure in Europe: Deployment picks up
pace. retrieved march 9, 2020, from https://www.globaltransmission.info/archive.php?id=35199
glyd. (2019). Mahindra Glyd. retrieved september 26, 2019, from https://www.myglyd.com/
hall, d., & lutsey, a. n. (2020). Electric vehicle charging guide for cities. washington dc: International
council for clean transport.
herron, d. (2016). Charging levels - Level 1, Level 2, DC Fast Charging. retrieved from green transportation:
https://greentransportation.info/ev-charging/range-confidence/chap4-charging/4-charging-levels.
html
hurst, n. (2018, october 22). Is Wireless Charging for Cars Finally Here? retrieved from smithsonian.com:
https://www.smithsonianmag.com/innovation/wireless-charging-cars-finally-here-180970494/
hyundai. (n.d.). Kona Electric. retrieved from https://www.hyundai.com/in/en/find-a-car/kona-electric/
features

71
Icct. (2019). Electric vehicle capitals: Showing the path to a mainstream market. Icct.
Icct. (2020). Electric vehicle charging guide for cities. washington dc: Icct.
Iea. (2018). Global EV Outlook 2018. International energy agency.
Iles, r. (2005, march 30). regulation of public transport services. Public Transport in Developing Countries,
403-443. doi:https://doi.org/10.1108/9780080456812-019
Indiamart . (2019). Schneider SCADA Systems. retrieved january 26, 2019, from Indiamart Intermesh ltd.:
https://www.indiamart.com/proddetail/schneider-scada-systems-13202900712.html
Insideevs. (n.d.). Chargepoint Will Now Manage GE’s Charging Network. retrieved from https://cdn.motor1.
com/images/mgl/8kvwo/s1/chargepoint-will-now-manage-ge-s-charging-network.jpg
Ionity. (2020). Ionity: Home Page. retrieved march 9, 2020, from https://ionity.eu/
IQair. (2018). World’s most polluted cities PM 2.5 2018. retrieved december 30, 2019, from https://www.
airvisual.com/world-most-polluted-cities?continent=&country=&state=&page=1&perpage=50&citi
es=
kadiyali, l. r. (2018). Traffic Engineering & Transport Planning. new delhi: khanna publishers.
kane, m. (2019, 3 31). Quickest Charging Electric Cars Compared At 175 kW Charger. retrieved from Insideevs:
https://insideevs.com/news/343587/quickest-charging-electric-cars-compared-at-175-kw-charger/
kotecha, a. (2018, february 12). Mahindra wins an order to supply 1000 e-Veritos to Bhagirathi. retrieved
from livemint: https://www.livemint.com/companies/f3wsuhkuq7ftyQwspqrcvk/mahindra-wins-an-
order-to-supply-1000-everitos-to-bhagirath.html
lun, y. h., lai, k. h., & cheng, t. c. (2010). Shipping and Logistics Management. springer sciene and
business media.
mahindra electric. (2018, february 17). Mahindra Electric and Baghirathi Group jointly power Karnataka’s
EV EV dream. retrieved september 26, 2019, from mahindra.com: https://www.mahindra.com/news-
room/press-release/mahindra-electric-and-baghirathi-group-jointly-power-karnatakas-ev-dream
mahindra electric. (2020). eVerito. retrieved from mahindra electric vehicles: https://www.mahindraelectric.
com/vehicles/everito/
mahindra electric. (n.d.). Explore India’s largest portfolio of electric vehicles. retrieved from mahindra
electric: https://www.mahindraelectric.com/vehicles/
mi, c. (2014). Development of an Extremely Efficient Wireless EV Charger. retrieved from stanford university:
https://web.stanford.edu/group/peec/cgi-bin/docs/events/2014/10-24-14%20mi.pdf
ministry of finance. (2020). Union Budget. retrieved from https://www.indiabudget.gov.in/
ministry of power. (2018, april 13). clarification on charging Infrastructure of electric vehicles. No.23/08/2018-
R&R. delhi.
ministry of power. (2019). Charging Infrastructure for Electric Vehicles (EV) - Revised Guidelines & Standards-
reg. new delhi: ministry of power.
mohua. (2019). Amendments to Model Building Bye-Laws, 2016. delhi: town and country planning
organisation.
morris garages. (n.d.). MG ZEV Brochure. retrieved from https://s7ap1.scene7.com/is/content/mgmotor/
mgmotor/documents/mg-dc-pdf-0060.pdf
morrow, k., karner, d., & frankfort, j. (2008). Plug-in hybrid electric vehicle charging infrastructure review.
us department of energy-vehicle technologies program.
navigant. (2018). EV Charging Equipment Market Overview. boulder: navigant consulting, Inc.
nItI aayog & rmI. (2019). India’s Electric Mobility Transformation: Progress to date and future oppurtunities .
new delhi: rocky mountain Institute.
nItI aayog & world energy council. (2018). Zero Emission Vehicles (ZEVs): Towards a Policy Framework. new
delhi: nItI aayog.
o’leary, p. r. (1999). Decision-Maker’s Guide to Solid-Waste Management. dIane publishing.
prakriti. (2020). Prakriti Home Page. retrieved march 09, 2020, from https://www.eprakriti.com/evera-cabs/
press Information bureau. (2019). Union Budget envisions India as a global hub for manufacturing electric
vehicles. retrieved december 17, 2019, from https://pib.gov.in/newsite/printrelease.aspx?relid=191292
ptI. (2019, april 27). Mahindra to Deploy 50 Electric Vehicles in India on Uber Platform. retrieved september
26, 2019, from https://www.news18.com/news/auto/mahindra-to-deploy-50-electric-vehicles-in-
india-on-uber-platform-2118209.html
ptI. (2019, 7 2). MG Motor India ties up with Fortum to set up EV charging stations at showrooms. retrieved

72
from moneycontrol: https://www.moneycontrol.com/news/technology/auto/mg-motor-india-ties-
up-with-fortum-to-set-up-ev-charging-stations-at-showrooms-4161281.html
reuters. (2019, march 25). Oslo Becomes The First City In The World To Get Wireless Charging Systems For EVs.
retrieved from auto ndtv: https://auto.ndtv.com/news/oslo-becomes-the-first-city-in-the-world-
to-get-wireless-charging-systems-for-evs-2012267
riejos, f. a. (2019). Urban Transport XXIV. wIt press.
rodrigue, j.-p., comtois, c., & slack, b. (2013). The Geography of Transport Systems. routledge.
saluja, n. (2019, january 1). EESL plan to finish first lot of e-cars delayed. (e. bureau, editor) retrieved
september 26, 2019, from economic times: https://economictimes.indiatimes.com/industry/auto/eesl-
plan-to-finish-first-lot-of-e-cars-delayed/articleshow/67331483.cms?from=mdr
schiller, p. l., & kenworthy, j. (2017). An Introduction to Sustainable Transportation: Policy, Planning and
Implementation. routledge.
shahan, Z. (2015, 8 21). Plugless Power Lowers Price, Gets Big Shoutout From Jon Cryer. retrieved from
cleantechnica: https://cleantechnica.com/2015/08/21/plugless-power-lowers-price-gets-big-
shoutout-from-jon-cryer/
singh, s. (2019, 05 7). Solar tariffs can rise as quickly as they dropped: Sanjay Aggarwal, Fortum India.
(economic times) retrieved 11 18, 2019, from https://energy.economictimes.indiatimes.com/
news/renewable/solar-tariffs-can-rise-as-quickly-as-they-dropped-sanjay-aggarwal-fortum-
india/69216618
skariachan, d. (2016, december 20). Lithium Urban Tech paves the way for EV revolution in India’s cab
marke. retrieved september 2019, 2019, from livemint: https://www.livemint.com/companies/
jezsx7lg5lvZrxnkum1xwn/lithium-urban-tech-paves-the-way-for-ev-revolution-in-India.html
spöttle, m., jörling, k., schimmel, m., staats, m., grizzel, l., jerram, l., . . . gartner, j. (2018). Research
for TRAN Committee – Charging infrastructure for electric road vehicles. european parliament, ,
policy department for structural and cohesion policies. european parliament, policy department for
structural and cohesion policies, brussels: european parliament. retrieved from http://bit.ly/2jbvvhq
statt, n. (2019, march 21). Norway will install the world’s first wireless electric car charging stations for Oslo
taxis. retrieved from the verge: https://www.theverge.com/2019/3/21/18276541/norway-oslo-wireless-
charging-electric-taxis-car-zero-emissions-induction
tata motors. (n.d.). Nexon EV specifications. retrieved from https://nexonev.tatamotors.com/features/
tata motors. (n.d.). Specifications of Tigor EV. retrieved from https://tigor.tatamotors.com/electric/
specification
the economic times. (2018, april 07). Ecommerce companies plan to double or triple fleet of delivery agents
. retrieved from the economic times: https://economictimes.indiatimes.com/industry/services/retail/
ecommerce-companies-plan-to-double-or-triple-fleet-of-delivery-agents/articleshow/63651675.
cms
the economic times. (2019, june 04). Hail no more! Ola, Uber’s ride growth slows to a crawl . retrieved from
the economic times: https://economictimes.indiatimes.com/small-biz/startups/newsbuzz/hail-no-
more-ola-ubers-ride-growth-slows-to-a-crawl/articleshow/69641990.cms?from=mdr
vesa, j. (2019, march 3). SESKO. retrieved from https://www.sesko.fi/files/671/ev-charging_standards_
may2016_compatibility_mode_.pdf
witricity. (2016). DRIVE 11 Evaluation System. retrieved from witricity corporation: http://witricity.com/wp-
content/uploads/2018/02/drIve_11_20170221-1.pdf
witricity corporation. (2018). the next wireless revolution: electric vehicle wireless charging. masachussets:
witricity corporation.
wood mackenzie. (2019). EV charging analysis snapshot. wood mackenzie. wood mackenzie. retrieved
march 9, 2020, from https://www.woodmac.com/our-expertise/focus/power--renewables/
ev-charging-sample-2019/?utm_source=gtmarticle&utm_medium=web&utm_campaign=wmpr_
evchargingnov19
yaghoubi, h. (2017). Urban Transport Systems. bod - books on demand.
yeon-soo, k. (2019, 3 24). ICT minister nominee accused of wasting research money. retrieved from the
korean times: https://www.koreatimes.co.kr/www/tech/2019/04/325_265924.html

73

74