charitable giving to universities in australia and new ...€¦ · the editorial board members...
TRANSCRIPT

Charitable Giving to Universities in Australia and New Zealand Survey Findings from data collected from 25 universities in Australia and New Zealand for 2014, 2015 and 2016 Based on the Ross-CASE Survey methodology of Charitable Giving to universities in the UK

Charitable Giving to Universities in Australia and New Zealand Survey - Editorial Board Asia-Pacific The Editorial Board members helped manage the project by contributing their time and expertise at each stage of the survey and report. They were involved with survey review, script creation, survey promotions, data collection, data verification, analysis, report writing and dissemination. The 2017 committee consisted of:
● Chair: Sue Birch – The University of Queensland (Director, Advancement Services) ● Co-Chair: Stefanie Hardacre – Monash University (Gift Administration Advisor, Operations) ● Agatha Albano – Macquarie University (Advancement Services Manager) ● John Bird – University of Auckland (Data Strategy Manager) ● Gary Nicholls – University of Auckland (Advancement Services Manager) ● Nikki McGregor – University of Sydney (Director, Advancement Services)
CASE staff Tricia King, Vice-President International, CASE Chua Beng Hwee, Executive Director CASE Asia-Pacific Fione Goh, Head, Business Development, CASE Asia-Pacific Tara Beh, Manager, Special Projects, CASE Asia-Pacific Yashraj Jain, Research Manager, CASE Europe [Report Author] © 2017 CASE All rights reserved. No part of the material in this document may be reproduced or used in any form, electronic or mechanical, including photocopying, recording, posting or distributing, or by any information storage and retrieval system, without the written consent of the Council for Advancement and Support of Education.
This report is not for sale, reproduction or commercial use
Limit of Liability/Disclaimer While the publisher has used its best efforts in preparing this document, it makes no representations or warranties with respect to the accuracy or completeness of the contents of this paper. No liability or responsibility of any kind (to extent permitted by law), including responsibility for negligence is accepted by the Council for Advancement and Support of Education, its servants or agents. All information gathered is believed correct at publication date. Neither the publisher nor the author is engaged in rendering legal, accounting or other professional services. If legal advice or other expert assistance is required, the services of a competent professional should be sought. Publication date August 2017

Contents Introduction by CASE Asia-Pacific ........................................ 1
Foreword ............................................................................ 2
1 Executive summary ......................................................... 4 1.1 Findings ................................................................................................................................... 4
2 Key indicators ................................................................. 6 2.1 New funds secured 2016 ........................................................................................................ 6
2.2 Cash income received 2016 .................................................................................................... 9
2.3 Annual funds 2016 ................................................................................................................ 11
2.4 Alumni and donors 2016 ....................................................................................................... 12
2.5 Fundraising investment 2016................................................................................................ 14
2.6 Alumni relations investment 2016 ........................................................................................ 16
2.7 Institutional expenditure and advancement staff 2016 ....................................................... 18
3 Trends in key indicators 2014-2016 ............................... 20 3.1 Philanthropic income ............................................................................................................ 20
3.2 Alumni and donors ................................................................................................................ 26
3.3 Fundraising and alumni relations staffing trends ................................................................. 27
3.4 Fundraising and alumni relations cost trends ....................................................................... 28
4 Comparisons with institutions in the UK ....................... 30
5 Appendix ...................................................................... 32 5.1.1 CASE .............................................................................................................................. 32
5.1.2 About the survey ........................................................................................................... 32
5.1.3 Reporting conventions .................................................................................................. 32
5.1.4 Acknowledgements ....................................................................................................... 33
5.1.5 Participating institutions ............................................................................................... 33
5.1.6 Glossary ......................................................................................................................... 36

1 | Copyright CASE 2017 | Charitable Giving to Universities in Australia and New Zealand 2014 – 2016
Introduction by CASE Asia-Pacific Over the years, there has been growing awareness of the importance of philanthropy within institutions, leading to increased investment by universities in their advancement offices – in fundraising as well as alumni engagement. The results of this year’s Charitable Giving to Universities in Australia and New Zealand Survey reflect an increasing trend in philanthropic giving, validating this growing institutional awareness.
CASE on Campus, a bespoke program customized based on individual institutions’ specific learning outcomes and target audience, has seen increased demand in the Asia-Pacific region over the past year. These programs are particularly designed to engage senior leadership, including vice chancellors, deans, volunteer boards and academic leaders, to help them understand their role in advancement. CASE has been working in collaboration with Universities Australia to foster conversations within the academic leadership space, cultivating understanding of and advancing the embedded need for academic support in philanthropy.
I would like to express my appreciation towards Tim Dolan, Vice Principal (Advancement) of the University of Sydney, and chair of the committee of Chief Advancement Officers of the Group of Eight and friends, for his leadership in this survey. Special thanks also goes to our survey committee for contributing their time and expertise to this project – noteworthy mention goes out to Sue Birch, Director, Advancement Services of The University of Queensland and Stefanie Hardacre, Gift Administration Advisor, Operations of Monash University, Chair and Co-Chair of the 2017 survey committee, who have worked tirelessly to ensure the accuracy of this survey report.
Last but not least, I would like to thank all participating institutions in contributing to the insightful results. Your contribution to the Charitable Giving to Universities in Australia and New Zealand Survey is important and very much appreciated by the volunteer leadership and staff of CASE. Thank you for your commitment towards the profession.
Chua Beng Hwee (Ms)
Executive Director, CASE Asia-Pacific

2 | Copyright CASE 2017 | Charitable Giving to Universities in Australia and New Zealand 2014 – 2016
Foreword Giving to universities in Australia and New Zealand has come a long way in a short time. How do we know that to be the case? What are the factors accounting for the progress? And what can we expect next from the sector?
This survey of charitable giving, now in its fifth year, provides some answers to those questions and indicates a direction of travel. It is a pleasure therefore to introduce this report on behalf of the Group of Eight research-intensive universities, which initiated this survey exercise in 2012. The report draws on information from 2014-2016 and provides the most robust information we have about the state of philanthropy to tertiary education in the region. I commend the study of its evidence to university leadership and advancement professionals alike. The survey provides an annual opportunity for us to reflect collectively on our work and to consider how to do it still better in future.
Twenty-five institutions – the highest number yet – now have professional advancement offices, each growing in maturity and all committed to high levels of accountability. That figure is in itself an encouraging indicator of philanthropic progress. We urge others to join in next year. The discipline of doing so is healthy for the offices concerned and a courtesy to the growing body of our donors.
“Australians aren’t charitable” and “people don’t give to universities here” are two of the myths I have been glad to see comprehensively busted since moving to Sydney from Los Angeles eight years ago. One of the invigorating trends I have witnessed up close is the willingness of donors, both at home and internationally, to make exceptional gifts to Australasian universities. In my experience, they often do so because of the universities’ ability to tackle some of the biggest and most complex problems in a troubled world, in such areas as health, the environment and social justice. Far-sighted philanthropists are working with and through universities to deliver tangible outcomes to improve the society in which we all live. The very largest gifts have helped drive the acceleration of philanthropic revenue this report records. They have raised the confidence of institutional leadership both in what universities can achieve in partnership with their donors and in the ability of their advancement professionals to support and sustain those key relationships. That bodes well for our joint future.
Another factor that has fuelled the acceleration is the launching by several universities – including Auckland, Melbourne, Sydney and Victoria – of high-profile Campaigns. Campaigns concentrate the mind. The announcement of an aspirational target, for which the university will be answerable, the input from sound consultancy advice, and the sense of shared endeavour within the institution can combine to fast-track the practical experience of advancement staff, the satisfaction donors take in the impact of their giving and the (essential) engagement of key academics with the process. We can confidently expect more universities to announce and complete transformational campaigns in the next five years.
It is the case – unsurprisingly – that a minority of institutions account for the majority of funds raised, as captured by the survey. But it is heartening to see a range of institutions with different missions, ages and scale coming to the party. Philanthropy is not the preserve of the Go8 – as important gifts to Newcastle, UTS and Wollongong, for instance, have demonstrated – gifts not only from their alumni but from friends who recognise that the university they choose to support is the right engine to deliver a vision the donor cares deeply about. Look out for a

3 | Copyright CASE 2017 | Charitable Giving to Universities in Australia and New Zealand 2014 – 2016
widening distribution of significant gifts in the future.
Look out also for an increasingly strategic approach to alumni relations: fewer “events” held for their own sake and more genuine (and measurable) engagement in the overall purpose of the university. New Zealand and Australian universities are not obliged to follow North American advancement models. The fact that our profession downunder is relatively young gives us licence to be nimble and to innovate. These are exciting times.
So it is frustrating that one of the constraints on our momentum – the ability to attract talented and experienced advancement staff (not only front-line fundraisers but the essential underpinning of development service professionals as well) – has just got more restrictive. The tightening of regulations for 457 visas is a real threat to our ability to attract and retain experienced international professionals. Introducing the survey results last year, I wrote that if we could double the number of fundraisers the effect would be phenomenal. We can and will step up training for talented local staff, which will serve us well in decades to come. The recruitment in Australia of the first cohort of CASE Asia-Pacific’s Educational Fundraising Graduate Trainees is timely, as is the importance of providing a greater variety of professional development opportunities for those who are new to the sector. But we should be clear-eyed about the fact that, alas, there are no short-cuts to experience. Quality training, like good major gifts work, simply cannot be rushed.
In the meantime, we would like to thank all those universities who participated in the survey this year and we look forward to the deepening and widening data bank of insight that next year’s results will bring. We are grateful, as ever, to our colleagues at CASE for their support and for the use of the Ross-CASE survey instrument, which allows meaningful comparisons with UK institutions.
Tim Dolan, Vice Principal (Advancement), University of Sydney
Chair, Go8 Chief Advancement Officers

4 | Copyright CASE 2017 | Charitable Giving to Universities in Australia and New Zealand 2014 – 2016
1 Executive summary The survey Supporting Document prescribes definitions for recording philanthropic income. As per the document the two main methods of reporting philanthropic income are:
● New funds secured reflects the success of current fundraising activity. It includes new cash gifts, the full value of confirmed pledges committed in the year, realised bequests, and the market value of gifts-in-kind. It does not include cash payments made against pledges.
● Cash income received reflects the success of both current and previous years’ fundraising activity. It shows all cash received in the year, including new cash gifts, pledge payments, and realised bequests.
1.1 Findings ● New funds secured
The total amount of philanthropic income secured in new funds across participating universities decreased by 0.4 percent since 2015 (after a 27 percent increase from 2014 to 2015) and reached $546.38m in 2016. The number of confirmed pledges over $1m was 67 in 2016, six less than the number of confirmed pledges over $1m in 2015.
● Cash income received
Total cash income received increased by 11 percent since 2015 to $447.5m in 2016. The total number of gifts over $1m in 2016 (76) was six percent higher than in 2015 (72), maintaining the number of high value gifts received after a sharp increase of 53 percent from 2014 to 2015. Total cash income from bequests was $48.96m in 2016, 33 percent lower than the amount received from bequests in 2015 ($73.08m), but 73 percent higher than in 2014 ($28.32m). 2015 was an exceptional year in terms of bequest gifts.
● Annual funds
Total new funds secured by annual funds was $13.95m in 2016 and cash income received by annual funds was $15.01m. While new funds secured by annual funds stayed consistent with previous years with a four percent increase from 2015, cash income received by annual funds increased by 34 percent since 2015.
● Donors
The total number of donors and total number of alumni donors reached a peak of 66,007 and 34,507 respectively in 2016. Total number of donors increased by eight percent since 2015, with non-Go8 institutions reporting a 17 percent increase. The total number of contactable alumni was also at its highest in 2016, at nearly 3.7 million (median of 144,516 contactable alumni).

5 | Copyright CASE 2017 | Charitable Giving to Universities in Australia and New Zealand 2014 – 2016
● Investment in fundraising and alumni relations
In 2016, the total investment in fundraising was $76.63m being 1.7 times more than the total investment in alumni relations at $44.15m. Fundraising staff costs and non-staff costs were $57.49m and $19.15m respectively and alumni relations staff costs and non-staff costs were $30.45m and $13.7m respectively. Alumni magazine production and distribution costs (not included in alumni relations non-staff costs) stood at $5.42m in 2016.
Institutions were investing 23 cents on fundraising activities per $1 in new funds secured and 32 cents on fundraising activities per $1 in cash income received.
Total fundraising investment increased by 11 percent and alumni relations investment by 15 percent since 2015. The increase in alumni relations investment was fuelled by a significant 25 percent increase in non-staff alumni relations costs since 2015.
Fundraising staff numbers increased by eight percent since 2015 with 450 fundraising staff (from 418 in 2015). Alumni relations staff numbers were at a similar level to 2015 with 252 alumni relations staff (247 in 2015) in employment in 2016.

6 | Copyright CASE 2017 | Charitable Giving to Universities in Australia and New Zealand 2014 – 2016
2 Key indicators This chapter presents an in-depth analysis of the key indicators for 2016.
The key findings are based on new funds secured, cash income received, contactable alumni, donors, and investment in fundraising and alumni relations activities. The important figures to note in Table 2 are the sum totals of the different key indicators. They give a broad overview of the economic impact of fundraising across institutions in the region.
Twenty-five institutions participated in this year’s survey out of approximately 51 higher education institutions in Australia (24 institutions out of 43) and New Zealand (1 institution out of 8) that are involved in some form of fundraising or alumni relations activities (i.e. a response rate of 49 per cent). Data has not been reweighted to estimate figures for all 51 institutions and total figures in Table 2 are conservative estimates of where the sector currently stands.
The means and medians differ significantly due to the presence of outliers in the sample. The sample consists of development offices that are at different stages of their maturity cycle and operations. Given that there are double the number of non-Go8 institutions in the survey sample than Go8 institutions, the overall median will be more reflective of non-G08 institutions. Institutions must take these factors into consideration when deciding which variables to benchmark their institution’s performance against.
Table 2 Key indicators 2016 Base Sum Mean Median Charitable giving to participating universities in Australia and New Zealand
Philanthropic income (AUD) New funds secured 25 $546,383,423 $21,855,337 $8,326,050 Cash income received 25 $447,501,447 $17,900,058 $5,927,226 Alumni Contactable alumni 25 3,709,071 148,363 144,516 Alumni donors 25 34,520 1,381 773 Donors Total donors 25 66,007 2,640 1,589 Total number of bequests confirmed 25 268 11 6
Investment (AUD) Total institutional expenditure 25 $20,857,088,531 $834,283,541 $834,287,000 Fundraising costs 25 $76,635,121 $3,065,405 $1,838,475 Alumni relations costs 25 $44,146,666 $1,765,867 $1,341,285 Staff Fundraising staff 25 450 18 13 Alumni relations staff 25 252 10 7
2.1 New funds secured 2016 New funds secured enables an institution to see the true impact of philanthropic support and its
7 | Copyright CASE 2017 | Charitable Giving to Universities in Australia and New Zealand 2014 – 2016
future pipeline, not just in the current financial period but over a number of years. It can assist in demonstrating the success of an advancement program. The median value for new funds secured in 2016 was $8.33m. The number of confirmed pledges of more than $1m was 67, 49 of which came from Go8 institutions. It is also interesting to note that bequest gifts contribute to 16 percent of Go8 institutions’ total new funds secured, while only one percent of non-Go8 institutions’ new funds secured is covered by bequests. Both Go8 and non-Go8 institutions were considerably dependent on their institution’s largest non-bequest pledge, generating 16 percent and 26 percent of their total new funds secured respectively. On ranking the values from highest to lowest, the top-five largest non-bequest pledges cover 77 percent of the total value of $123m while the bottom five account for only 0.52 percent. Two out of five institutions received their largest non-bequest pledge from an individual in lifetime and in income terms, trusts and foundations contributed to 52 percent of the total income from the largest non-bequest pledges.

8 | Copyright CASE 2017 | Charitable Giving to Universities in Australia and New Zealand 2014 – 2016
Table 2.1 New funds secured in 2016 Charitable giving to participating universities in Australia and New Zealand
Amount (AUD) All Go8 Non-Go8 New funds secured - Total $546,383,423 $403,020,766 $143,362,656 New funds secured - Mean $21,855,337 $50,377,596 $8,433,097 New funds secured - Median $8,326,050 $38,294,256 $5,001,977 New funds secured from bequests - Total $61,030,199 $48,941,537 $12,088,662 New funds secured from bequests - Mean $2,441,208 $6,117,692 $711,098 New funds secured from bequests - Median $544,634 $3,887,796 $45,969 Largest non-bequest pledge - Total $159,467,553 $124,902,673 $34,564,880 Largest non-bequest pledge - Mean $6,378,702 $15,612,834 $2,033,228 Largest non-bequest pledge - Median $2,000,000 $5,500,000 $1,000,000 Gifts-in-Kind - Total $21,186,911 $11,404,147 $9,782,764 Gifts-in-Kind - Mean $847,476 $1,425,518 $575,457 Gifts-in-Kind - Median $173,450 $128,066 $182,460 Percentage Median new funds secured from bequests as a percentage of new funds secured* 4% 16% 1%
Median largest non-bequest pledge as a percentage of new funds secured* 21% 16% 26%
Median gifts-in-kind as a percentage of new funds secured* 2.61% 0.22% 3%
Number Number of confirmed pledges over $1,000,000 - Total 67 49 18 Number of confirmed pledges over $1,000,000 - Mean 3 6 1 Number of confirmed pledges over $1,000,000 - Median 2 6 1 Number of universities 25 8 17
*Calculated as per Section 5.1.3 iv) Computed variables
9 | Copyright CASE 2017 | Charitable Giving to Universities in Australia and New Zealand 2014 – 2016
2.2 Cash income received 2016 Cash income received in a year includes all cash which is received during the year, which is comprised of new single cash gifts, pledge payments, and cash realised from bequests. The median value for cash income received in 2016 was $5.93m, of which bequest cash income comprised $108,790m. The number of confirmed cash gifts of more than $1m was 76 in 2016, 65 of which came from Go8 institutions. Cash income from bequests constitutes 17 percent of total cash income received for Go8 institutions and two percent for non-Go8 institutions. For non-Go8 institutions, the largest cash gift contributed to 15 percent of their total cash income received, for Go8 institutions the largest cash gift contributed to 18 percent. The median value of a Go8 institution’s largest cash gift is nine times more than that of non-Go8 institutions. On ranking the values from highest to lowest, the top-five largest cash gifts cover 68 percent of the total value of $56.11m while the bottom five account for only one percent. Nine institutions received their largest cash gifts from trusts and foundations and another nine institutions received their largest cash gift from individuals in lifetime. In monetary terms, trusts and foundations contributed to 60 percent of the total income from largest cash gifts while individuals in lifetime contributed to 30 percent of the total income from largest cash gifts.

10 | Copyright CASE 2017 | Charitable Giving to Universities in Australia and New Zealand 2014 – 2016
Table 2.2 Cash income received in 2016 Charitable giving to participating universities in Australia and New Zealand
Amount (AUD) All Go8 Non-Go8 Cash income received - Total $447,501,447 $343,140,284 $104,361,163 Cash income received - Mean $17,900,058 $42,892,536 $6,138,892 Cash income received - Median $5,927,226 $39,448,915 $2,969,000 Cash income received from bequests - Total $48,969,377 $40,066,817 $8,902,560 Cash income received from bequests - Mean $1,958,775 $5,008,352 $523,680 Cash income received from bequests - Median $108,790 $3,887,796 $36,000 Largest cash gift - Total $85,927,475 $63,278,977 $22,648,498 Largest cash gift - Mean $3,437,099 $7,909,872 $1,332,265 Largest cash gift - Median $1,225,000 $6,250,000 $700,000 Percentage Median cash income from bequests as a percentage of cash income received* 4% 17% 2%
Median largest cash gift as a percentage of cash income received* 18% 18% 15%
Number Number of cash gifts over $1,000,000 - Total 76 65 11 Number of cash gifts over $1,000,000 - Mean 3 8 1 Number of cash gifts over $1,000,000 - Median 1 9 0 Number of universities 25 8 17
*Calculated as per Section 5.1.3 iv) Computed variables

11 | Copyright CASE 2017 | Charitable Giving to Universities in Australia and New Zealand 2014 – 2016
2.3 Annual funds 2016 Participating institutions secured $13.95m in new funds for annual funds and received $15.01m in cash income. Median value of annual funds from new funds for Go8 institutions was $883,595, and median value of annual funds from cash income received was $732,910, compared to $198,041 for non-Go8 institutions in new funds and $143,956 in cash income. Participating institutions secured 3.1 percent of total new funds and 3.7 percent of total cash income received from their annual fund. Notably, non-Go8 institutions secured a higher percentage of total new funds secured and total cash income received from their annual fund than Go8 institutions as seen in Table 2.3 below. Table 2.3 Annual fund income in 2016
Charitable giving to participating universities in Australia and New Zealand Amount (AUD) All Go8 Non-Go8 Annual fund income secured - Total $13,954,177 $8,871,101 $5,083,076 Annual fund income secured - Mean $558,167 $1,108,888 $299,004 Annual fund income secured - Median $299,747 $883,595 $198,041 Annual fund income received in cash - Total $15,010,727 $8,789,981 $6,220,746 Annual fund income received in cash - Mean $600,429 $1,098,748 $365,926 Annual fund income received in cash - Median $316,933 $732,910 $143,956
Percentage
Median annual fund income secured as a percentage of new funds secured* 3.1% 2.2% 4.7%
Median annual fund income received in cash as a percentage of cash income received* 3.7% 2.6% 5.7%
Number of universities 25 8 17 *Calculated as per Section 5.1.3 iv) Computed variables

12 | Copyright CASE 2017 | Charitable Giving to Universities in Australia and New Zealand 2014 – 2016
2.4 Alumni and donors 2016 Participating institutions reported 3.71 million contactable alumni and 66,007 donors (34,520 alumni donors and 31,487 non-alumni donors) in 2016. Go8 institutions reported 1.45 million contactable alumni and 39,997 donors (25,891 alumni donors and 14,106 non-alumni donors). Non-Go8 institutions reported 2.26 million contactable alumni and 26,010 donors (8,629 alumni donors and 17,381 non-alumni donors). Median contactable alumni was 144,516 for all institutions and median figures for Go8 and non-Go8 institutions were 203,117 and 134,500 respectively. Median number of donors was 1,589 donors and 773 alumni donors with median number of donors for Go8 institutions being 4.2 times that of non-Go8 institutions. Almost 75 percent of alumni donors were from Go8 institutions, while 55 percent of non-alumni donors came from non-Go8 institutions. Non-Go8 institutions received a higher proportion of their gifts from non-alumni sources (67 percent) than Go8 institutions (35 percent). Go8 institutions report a higher alumni donor conversion rate (median alumni donor as a percentage of contactable alumni) than non-Go8 institutions, 1.52 percent as compared to 0.38 percent. Institutions secured $5,611 in new funds per donor and received $4,666 in cash income per donor. Median number of bequests intentions confirmed for Go8 institutions were 23 and for non-Go8 institutions were four.

13 | Copyright CASE 2017 | Charitable Giving to Universities in Australia and New Zealand 2014 – 2016
Table 2.4 Alumni and donors in 2016 Charitable giving to universities in Australia and New Zealand
Number All Go8 Non-Go8 Contactable alumni - Total 3,709,071 1,453,067 2,256,004 Contactable alumni - Mean 148,363 181,633 132,706 Contactable alumni - Median 144,516 203,117 134,500 All donors - Total 66,007 39,997 26,010 All donors - Mean 2,640 5,000 1,530 All donors - Median 1,589 4,586 1,094 Alumni donors - Total 34,520 25,891 8,629 Alumni donors - Mean 1,381 3,236 508 Alumni donors - Median 773 2,433 292 Non-alumni donors - Total 31,487 14,106 17,381 Non-alumni donors - Mean 1,259 1,763 1,022 Non-alumni donors - Median 640 1,194 533 New bequest intentions confirmed - Total 268 170 98 New bequest intentions confirmed - Mean 11 21 6 New bequest intentions confirmed - Median 6 23 4 Percentage Median alumni donors as a percentage of contactable alumni* 0.48% 1.52% 0.38%
Median alumni donors as a percentage of total donors* 56% 64% 51%
Amount (AUD) Median new funds secured per donor* $5,611 $8,350 $4,784 Median cash income received per donor* $4,666 $8,030 $2,994 Number of universities 25 8 17
*Calculated as per Section 5.1.3 iv) Computed variables
14 | Copyright CASE 2017 | Charitable Giving to Universities in Australia and New Zealand 2014 – 2016
2.5 Fundraising investment 2016 Total investment in fundraising by participating institutions was $76.63m in 2016. This was split between staff and non-staff costs in the ratio of approximately 4:1 across the sample.
The median amount invested in fundraising activities in 2016 by Go8 institutions was $6.03m and $1.20m by non-Go8 institutions.
It is difficult for institutions to differentiate between philanthropic income solely as a result of the development and advancement activities and philanthropic income due to activities that are outside the scope of a development office. Also, the value of institutional leadership and other academic time invested in fundraising can be substantial, particularly at higher performing institutions.
A return on investment for fundraising departments has been calculated by comparing the fundraising costs to the philanthropic income secured or received. When comparing investment to returns (i.e. fundraising costs to new funds secured and cash income received) it was noticed that Go8 institutions invested 15 cents to raise $1 in new funds and 15 cents to receive $1 in cash income, compared to 32 cents invested by non-Go8 institutions to raise $1 in new funds and 50 cents to receive $1 in cash income.
When figures are analysed in terms of the number of constituents who donated, Go8 and non-Go8 institutions did not differ significantly in terms of fundraising cost per donor. Fundraising cost per donor for Go8 institutions was $1,465, compared to $1,561 for non-Go8 institutions.

15 | Copyright CASE 2017 | Charitable Giving to Universities in Australia and New Zealand 2014 – 2016
Table 2.5 Fundraising investment in 2016 Charitable giving to universities in Australia and New Zealand
Amount (AUD) All Go8 Non-Go8 Fundraising costs - Total $76,635,121 $49,281,465 $27,353,656 Fundraising costs - Mean $3,065,405 $6,160,183 $1,609,039 Fundraising costs - Median $1,838,475 $6,026,512 $1,199,818 Staff fundraising costs - Total $57,486,053 $36,900,202 $20,585,851 Staff fundraising costs - Mean $2,299,442 $4,612,525 $1,210,932 Staff fundraising costs - Median $1,589,809 $4,205,550 $928,914 Non-staff fundraising costs - Total $19,149,068 $12,381,263 $6,767,805 Non-staff fundraising costs - Mean $765,963 $1,547,658 $398,106 Non-staff fundraising costs - Median $438,258 $1,622,996 $278,094 Percentage Median staff fundraising costs as a percentage of fundraising costs* 79% 77% 82%
Median non-staff fundraising costs as a percentage of fundraising costs* 21% 23% 18%
Amount (AUD) Median fundraising investment per dollar of new funds secured* $0.23 $0.15 $0.32
Median fundraising investment per dollar of cash income received* $0.32 $0.15 $0.50
Median fundraising cost per donor* $1,522 $1,465 $1,561
Number of universities 25 8 17 *Calculated as per Section 5.1.3 iv) Computed variables

16 | Copyright CASE 2017 | Charitable Giving to Universities in Australia and New Zealand 2014 – 2016
2.6 Alumni relations investment 2016 Participating institutions invested $44.15m in alumni relations activities, with median alumni relations costs being $1.34m. This investment excludes costs to produce and distribute alumni magazines, which was $5.42m with a median alumni magazine cost of $97,260. Magazine costs at Go8 institutions were nine times higher than at non-Go8 institutions. Go8 institutions invested $19.54 in alumni relations cost per contactable alumni and $1,211 in alumni relations costs per alumni donor. Non-Go8 institutions invested $6.85 in alumni relations cost per contactable alumni and $2,504 in alumni relations costs per alumni donor. Go8 institutions invested $2.28 in alumni magazine costs per contactable alumni and $113 in alumni magazine costs per alumni donor. Non-Go8 institutions invested $0.45 in alumni magazine costs per contactable alumni and $229 in alumni magazine costs per alumni donor.
The median ratio of fundraising investment to investment in alumni relations excluding magazines is 1.7:1 for Go8 institutions and 1.6:1 for non-Go8 institutions.

17 | Copyright CASE 2017 | Charitable Giving to Universities in Australia and New Zealand 2014 – 2016
Table 2.6 Alumni relations investment in 2016 Charitable giving to universities in Australia and New Zealand
Amount (AUD) All Go8 Non-Go8 Alumni relations costs - Total $44,146,666 $26,230,972 $17,915,694 Alumni relations costs - Mean $1,765,867 $3,278,872 $1,053,864 Alumni relations costs - Median $1,341,285 $3,383,845 $899,194 Staff alumni relations costs - Total $30,447,879 $18,554,118 $11,893,761 Staff alumni relations costs - Mean $1,217,915 $2,319,265 $699,633 Staff alumni relations costs - Median $836,023 $2,208,705 $643,550 Non-staff alumni relations costs - Total $13,698,786 $7,676,854 $6,021,932 Non-staff alumni relations costs - Mean $547,951 $959,607 $354,231 Non-staff alumni relations costs - Median $413,517 $850,359 $254,000 Production and distribution alumni magazine costs - Total $5,419,585 $3,528,594 $1,890,991 Production and distribution alumni magazine costs - Mean $216,783 $441,074 $111,235
Production and distribution alumni magazine costs - Median $97,260 $511,905 $57,860
Percentage Median staff alumni costs as a percentage of alumni relations costs* 67% 73% 63%
Median non-staff fundraising costs as a percentage of alumni relations costs* 33% 27% 37%
Amount (AUD) Median alumni relations cost per contactable alumni* $11.86 $19.54 $6.85 Median alumni relations cost per alumni donor* $1,735 $1,211 $2,504 Median alumni magazine cost per contactable alumni* $0.72 $2.28 $0.45 Median alumni magazine cost per alumni donor* $208 $113 $229
Number of universities 25 8 17 *Calculated as per Section 5.1.3 iv) Computed variables

18 | Copyright CASE 2017 | Charitable Giving to Universities in Australia and New Zealand 2014 – 2016
2.7 Institutional expenditure and advancement staff 2016 Participating institutions collectively had an annual expenditure of $20.86bn in 2016. Median fundraising costs as a percentage of institutional expenditure was 0.28 percent, and median alumni relations costs as a percentage of institutions expenditure was 0.17 percent. This equates to 0.45 percent of total institutional expenditure being invested in fundraising and alumni relations activities, equivalent to over $120.78m. The participating institutions’ fundraising workforce stood at 450 FTE staff. Go8 institutions employed 288 FTE fundraising staff and non-Go8 institutions employed 162 fundraising FTE staff. In alumni relations, 248 FTE staff members worked across the participating institutions, 153 of which were at Go8 institutions. Institutions invested an average of $121k per fundraising staff member, resulting in a sixfold return on investment in new funds secured and almost fourfold in cash income received.1 Go8 institutions invested an average of $122k per fundraising staff member, resulting in a fourfold return on investment in new funds secured and cash income received.2 Non-Go8 institutions invested an average of $121k per fundraising staff member, resulting in a fivefold return on investment in new funds secured and almost threefold in cash income received.3
1 Calculated as per Section 5.1.3 iv) Computed variables
2 Calculated as per Section 5.1.3 iv) Computed variables
3 Calculated as per Section 5.1.3 iv) Computed variables

19 | Copyright CASE 2017 | Charitable Giving to Universities in Australia and New Zealand 2014 – 2016
Table 2.7 Institutional expenditure and advancement staff 2016 Charitable giving to universities in Australia and New Zealand
Amount (AUD) All Go8 Non-Go8 Total institutional expenditure - Total $20,857,088,531 $10,592,826,000 $10,264,262,531 Total institutional expenditure - Mean $834,283,541 $1,324,103,250 $603,780,149 Total institutional expenditure - Median $834,287,000 $1,440,857,000 $602,708,000 Percentage Median fundraising costs as a percentage of institutional expenditure* 0.28% 0.38% 0.25%
Median alumni relations costs as a percentage of institutional expenditure* 0.17% 0.22% 0.14%
Number
Fundraising staff - Total 450 288 162 Fundraising staff - Mean 18 36 10 Fundraising staff - Median 13 36 9
Alumni relations staff - Total 252 153 99 Alumni relations staff - Mean 10 19 6 Alumni relations staff - Median 7 18 5
Amount (AUD)
Median new funds secured per FTE fundraising staff* $735,688 $968,334 $572,364
Median cash income received per FTE fundraising staff* $450,880 $1,043,383 $334,006
Median fundraising staff cost per FTE fundraising staff* $121,369 $122,257 $121,369
Median alumni relations staff cost per FTE alumni relations staff* $109,775 $117,566 $104,249
Number of universities 25 8 17 *Calculated as per Section 5.1.3 iv) Computed variables
20 | Copyright CASE 2017 | Charitable Giving to Universities in Australia and New Zealand 2014 – 2016
3 Trends in key indicators 2014-2016 Trends are calculated using data from institutions that participated and provided information for a key set of variables for three surveys, 2014, 2015 and 2016. These findings are on a like-for-like basis and are illustrated in the following charts (all participating institutions, Go8 institutions and non-Go8 institutions).
Below are the highlights of the trends in key indicators:
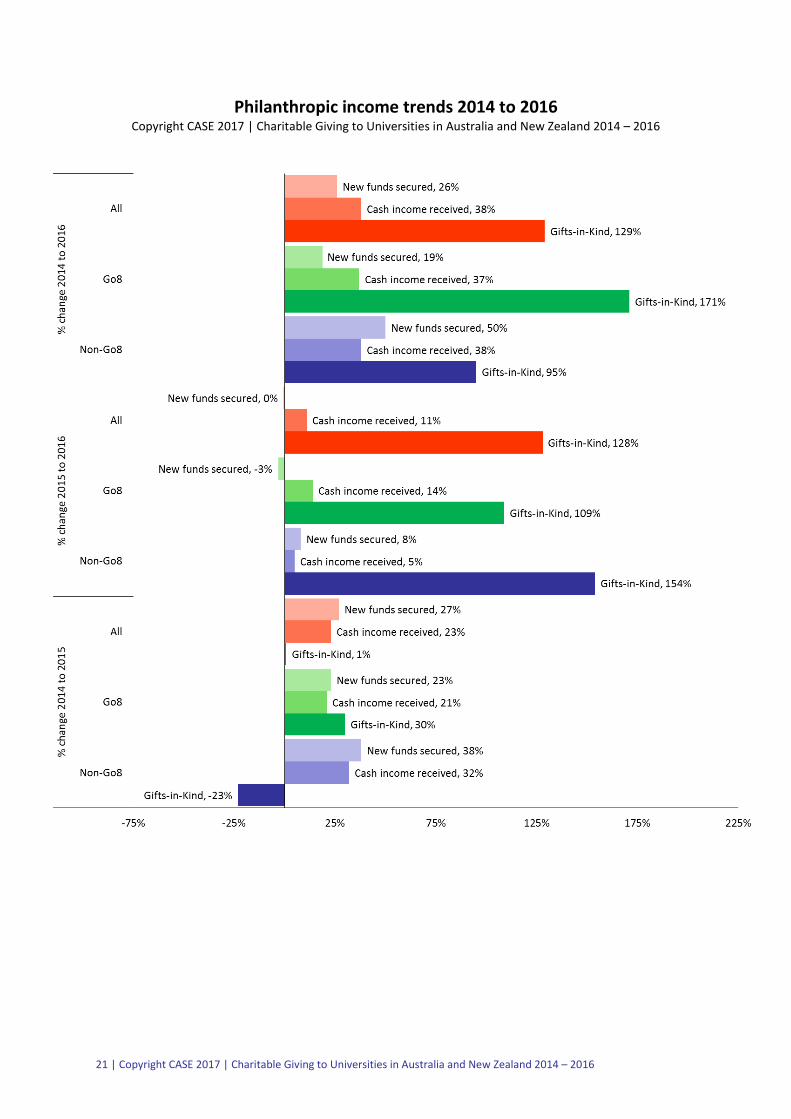
3.1 Philanthropic income ● New fund secured decreased by 0.4 percent since 2015 after a 27 percent increase from
2014 to 2015.
● Cash income received has shown an increase since 2014 but at a reduced rate of change, with an increase of 23 percent from 2014 to 2015 and 11 percent from 2015 to 2016.
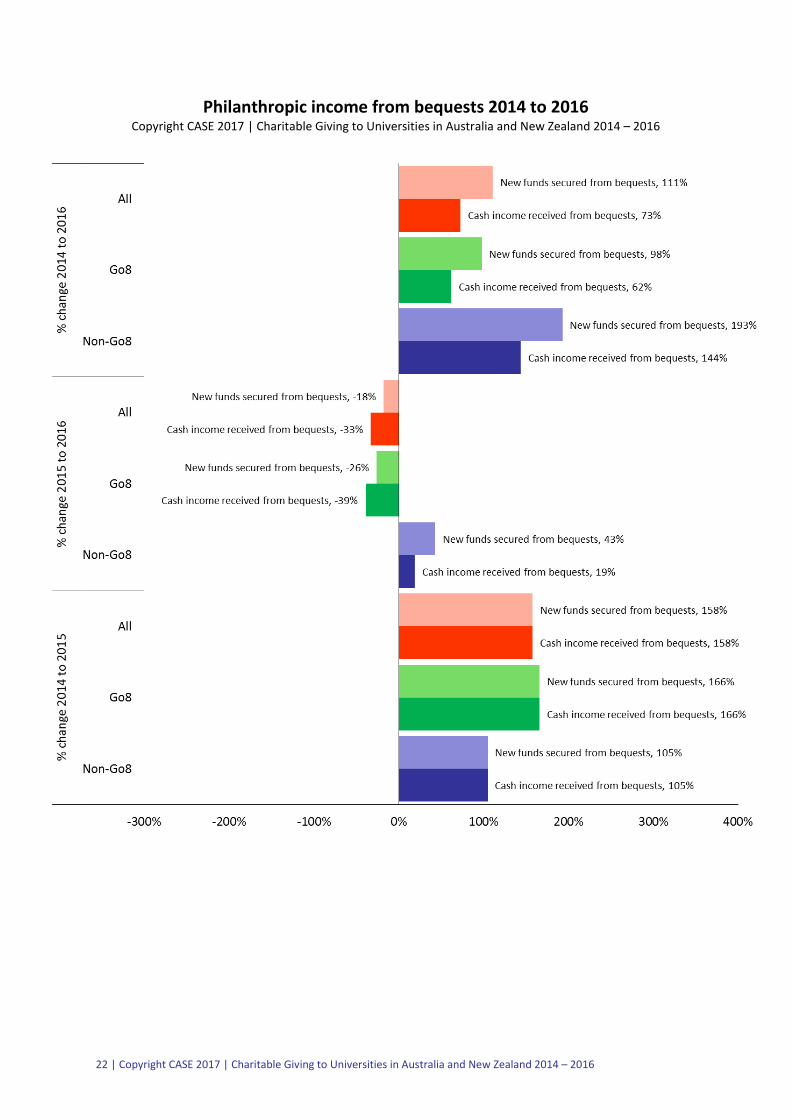
● Income from bequests across the 25 institutions and Go8 institutions decreased from 2015 to 2016, but increased for non-Go8 institutions during the same period.
● Annual fund income secured increased by 55 percent at non-Go8 institutions from 2015 to 2016, while Go8 institutions saw a decrease of 13 percent in annual fund income secured during the same time period.
● Go8 institutions saw a significant rise in the value of large gifts and pledges, with a 47 percent increase in the amount of the largest pledge secured and an 83 percent increase in the amount of the largest cash gift received from 2015 to 2016.
● Go8 institutions reported a fall in the number of new bequest intentions confirmed (-52 percent) from 2015 to 2016 after an increase of 172 percent from 2014 to 2015. Non-Go8 institutions reported a 63 percent increase from 2014 to 2015 in the number of new bequest intentions confirmed and a relatively marginal five percent increase from 2015 to 2016.
● The number of cash gifts over $1m increased by 10 percent for non-Go8 institutions from 2015 to 2016, compared to a five percent increase for Go8 institutions.
21 | Copyright CASE 2017 | Charitable Giving to Universities in Australia and New Zealand 2014 – 2016
Philanthropic income trends 2014 to 2016 Copyright CASE 2017 | Charitable Giving to Universities in Australia and New Zealand 2014 – 2016
22 | Copyright CASE 2017 | Charitable Giving to Universities in Australia and New Zealand 2014 – 2016
Philanthropic income from bequests 2014 to 2016 Copyright CASE 2017 | Charitable Giving to Universities in Australia and New Zealand 2014 – 2016

23 | Copyright CASE 2017 | Charitable Giving to Universities in Australia and New Zealand 2014 – 2016
Annual fund income trends 2014 to 2016 Copyright CASE 2017 | Charitable Giving to Universities in Australia and New Zealand 2014 – 2016

24 | Copyright CASE 2017 | Charitable Giving to Universities in Australia and New Zealand 2014 – 2016
Largest gifts and pledges trends 2014 to 2016 Copyright CASE 2017 | Charitable Giving to Universities in Australia and New Zealand 2014 – 2016

25 | Copyright CASE 2017 | Charitable Giving to Universities in Australia and New Zealand 2014 – 2016
Confirmed gifts, pledges and bequests trends 2014 to 2016 Copyright CASE 2017 | Charitable Giving to Universities in Australia and New Zealand 2014 – 2016

26 | Copyright CASE 2017 | Charitable Giving to Universities in Australia and New Zealand 2014 – 2016
3.2 Alumni and donors ● Contactable alumni numbers grew by five percent and nine percent for Go8 and non-Go8
institutions respectively from 2015 to 2016.
● Total donors increased by 17 percent for non-Go8 institutions from 2015 to 2016 and three percent for Go8 institutions during the same time period. This has been a reduced rate of change compared to the 35 percent and 12 percent increases from 2014 to 2015.
● Alumni donors increased by 10 percent at non-Go8 institutions from 2015 to 2016 and by three percent at Go8 institutions.
● Number of non-alumni donors increased by 21 percent for non-Go8 institutions from 2015 to 2016 and by five percent for Go8 institutions.
Alumni and donor trends 2014 to 2016 Copyright CASE 2017 | Charitable Giving to Universities in Australia and New Zealand 2014 – 2016

27 | Copyright CASE 2017 | Charitable Giving to Universities in Australia and New Zealand 2014 – 2016
3.3 Fundraising and alumni relations staffing trends ● Fundraising staff numbers grew year on year since 2014 but the increase has been at a lower
rate of eight percent between 2015 and 2016, compared to a 13 percent increase from 2014 to 2015
● The rate of change remained stable for non-Go8 fundraising staff numbers with an eight percent increase between 2014 and 2015, and a seven percent increase from 2015 to 2016. Whereas the rate of change decreased for Go8 fundraising staff numbers with a 15 percent increase from 2014 to 2015, followed by an eight percent increase between 2015 and 2016.
● Alumni relations staff numbers grew by 0.6 percent at Go8 institutions and 4.6 percent at non-Go8 institutions from 2015 to 2016. This was significantly different from the 10 percent and 16 percent increase in alumni relations staff from 2014 to 2015.
Staffing trends 2014 to 2016 Copyright CASE 2017 | Charitable Giving to Universities in Australia and New Zealand 2014 – 2016

28 | Copyright CASE 2017 | Charitable Giving to Universities in Australia and New Zealand 2014 – 2016
3.4 Fundraising and alumni relations cost trends ● Staff fundraising costs increased by 17 percent from 2015 to 2016 and non-staff fundraising
costs decreased by three percent. The rate of change in non-staff fundraising costs from 2015 to 2016 was significantly different to the change from 2014 to 2015 which was an increase of 29 percent.
● Staff alumni relations costs increased by 13 percent from 2015 to 2016 and non-staff fundraising costs increased by 25 percent.
● Alumni magazine production and distribution costs increased for non-Go8 institutions from 2015 to 2016 by 11 percent, whereas for Go8 institutions it was stagnant.
Fundraising cost trends 2014 to 2016
Copyright CASE 2017 | Charitable Giving to Universities in Australia and New Zealand 2014 – 2016

29 | Copyright CASE 2017 | Charitable Giving to Universities in Australia and New Zealand 2014 – 2016
Alumni cost trends 2014 to 2016 Copyright CASE 2017 | Charitable Giving to Universities in Australia and New Zealand 2014 – 2016
30 | Copyright CASE 2017 | Charitable Giving to Universities in Australia and New Zealand 2014 – 2016
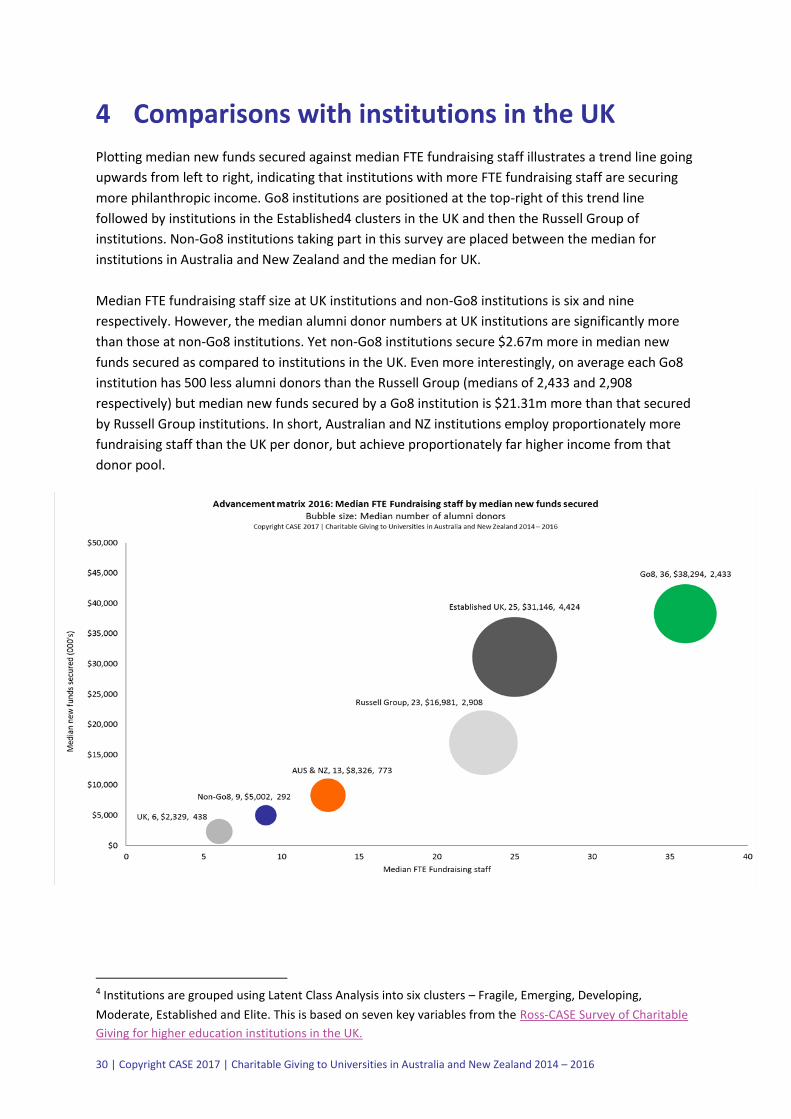
4 Comparisons with institutions in the UK Plotting median new funds secured against median FTE fundraising staff illustrates a trend line going upwards from left to right, indicating that institutions with more FTE fundraising staff are securing more philanthropic income. Go8 institutions are positioned at the top-right of this trend line followed by institutions in the Established4 clusters in the UK and then the Russell Group of institutions. Non-Go8 institutions taking part in this survey are placed between the median for institutions in Australia and New Zealand and the median for UK. Median FTE fundraising staff size at UK institutions and non-Go8 institutions is six and nine respectively. However, the median alumni donor numbers at UK institutions are significantly more than those at non-Go8 institutions. Yet non-Go8 institutions secure $2.67m more in median new funds secured as compared to institutions in the UK. Even more interestingly, on average each Go8 institution has 500 less alumni donors than the Russell Group (medians of 2,433 and 2,908 respectively) but median new funds secured by a Go8 institution is $21.31m more than that secured by Russell Group institutions. In short, Australian and NZ institutions employ proportionately more fundraising staff than the UK per donor, but achieve proportionately far higher income from that donor pool.
4 Institutions are grouped using Latent Class Analysis into six clusters – Fragile, Emerging, Developing, Moderate, Established and Elite. This is based on seven key variables from the Ross-CASE Survey of Charitable Giving for higher education institutions in the UK.
31 | Copyright CASE 2017 | Charitable Giving to Universities in Australia and New Zealand 2014 – 2016
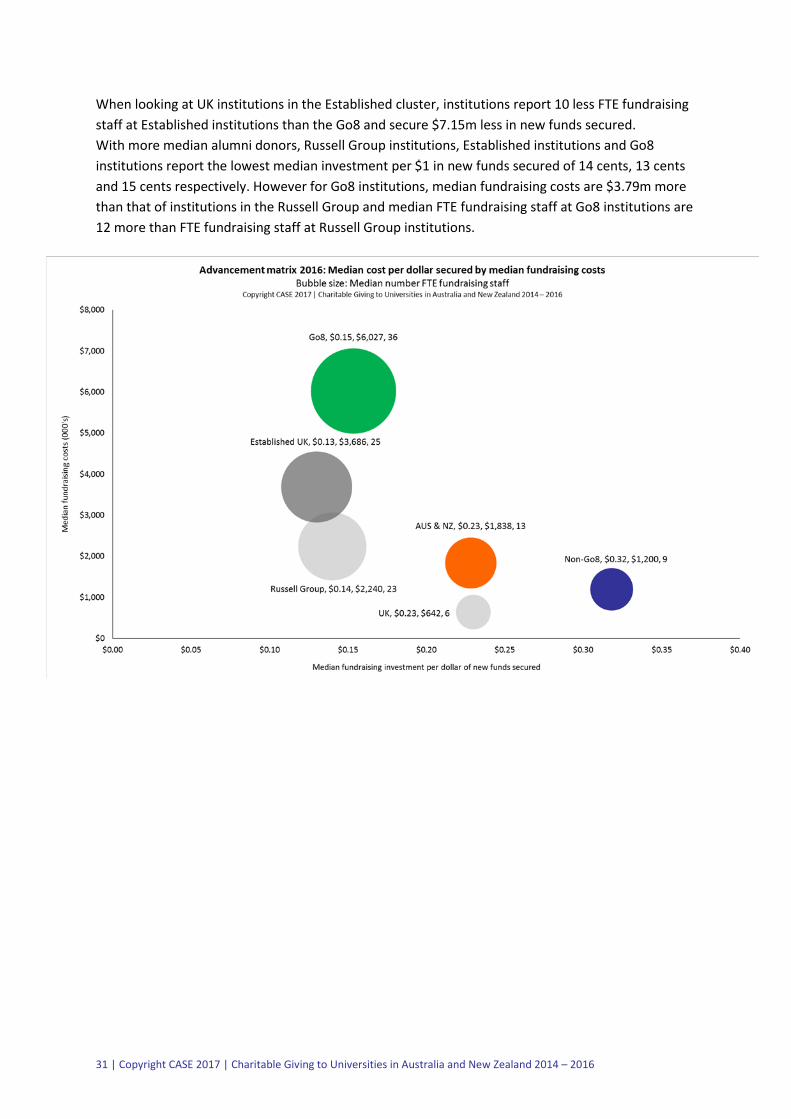
When looking at UK institutions in the Established cluster, institutions report 10 less FTE fundraising staff at Established institutions than the Go8 and secure $7.15m less in new funds secured. With more median alumni donors, Russell Group institutions, Established institutions and Go8 institutions report the lowest median investment per $1 in new funds secured of 14 cents, 13 cents and 15 cents respectively. However for Go8 institutions, median fundraising costs are $3.79m more than that of institutions in the Russell Group and median FTE fundraising staff at Go8 institutions are 12 more than FTE fundraising staff at Russell Group institutions.

32 | Copyright CASE 2017 | Charitable Giving to Universities in Australia and New Zealand 2014 – 2016
5 Appendix
5.1.1 CASE
The Council for Advancement and Support of Education (CASE) is a professional not-for-profit association serving educational institutions and the advancement professionals who work on their behalf in alumni relations, communications, development, marketing and allied areas.
5.1.2 About the survey
This report presents findings from the Charitable Giving to Universities in Australia and New Zealand Survey 2014, 2015 and 2016. CASE Asia-Pacific undertakes the project management, overseeing the communications and marketing, with CASE Europe managing the data collection, analysis and report writing. The survey is based on the UK Ross-CASE Survey and has been carried out since 2012. The survey was offered online for the first time in 2016 and the online platform was also used again in 2017 to collect data for 2016. The survey is overseen by a survey committee. The committee and CASE research staff review the survey script, reporting rules and the question-by-question guide before launching the survey to eligible institutions in Australia and New Zealand. The 2014, 2015 and 2016 survey was launched online via the CASE Benchmarking Toolkit in March 2017 and closed in May 2017. Members of the board and CASE Research staff queried the data submitted by the institutions against an exhaustive set of logic, ratio, arithmetic and substantive tests (a full list can be obtained on request). The queries were emailed to the participating institutions who had the option of rectifying the errors by amending their data or leaving the answers unanswered. Best possible efforts were made to remove any unreliable data that was submitted. Descriptive statistics, mainly using the measures of central tendencies (mean and median), was used to analyse the data and key indicators were reported on this basis. Results were published by the medium of this report accompanied by an infographic. All participating institutions also received access to the CASE Benchmarking toolkit’s reporting tools. All data collected has been reported on a confidential and aggregated basis in this report. All income figures in this report are in Australian Dollars (AUD). As with previous reports this year’s data is intended for benchmarking purposes, and as such does not provide sector or organisational context, nor does it speculate as to reasons why differences may have occurred between years.
5.1.3 Reporting conventions
i) Trend data Trend data are presented on a like-for-like basis for each variable reported in Chart 2.2 in percentages only. Returning participating institutions were requested to submit data for 2016 and update any data from 2014 and 2015. New participating institutions were requested to submit data for three years - 2014, 2015 and 2016.
ii) Base size
The number of institutions given as the base in tables and figures refers to the number of institutions answering a particular question or set of questions, rather than the total number participating in the survey.
iii) Measures of central tendencies
Mean figures provide a snapshot of the overall group’s performance while median figures highlight the distribution in fundraising figures across the participating institutions. Where the mean and median are close together, the group is relatively homogenous and where the mean is significantly different to the median, the group is much more diverse. Differences in mean and median figures could also be due to the presence of outliers in a sample. Given that the sample size covers a diverse range of institutions, there is a variation between institutions with some institutions having substantially higher values than others and

33 | Copyright CASE 2017 | Charitable Giving to Universities in Australia and New Zealand 2014 – 2016
vice-versa. Thus, some mean values are skewed upwards and are generally much higher than the median values. This variation is reduced when mission groups are analysed. This is because mission group institutions are generally very similar to each other in terms of their operations.
iv) Computed variables
Some variables are calculated on the basis of two variables from the survey. For example largest cash gift as a percentage of total cash income received was calculated by first computing the percentage of largest cash gift to total cash income received for each institution and then the median was calculated from these figures rather than computing it by using the total of the largest cash gift and dividing that by total cash income received.
5.1.4 Acknowledgements
First and foremost we would like to thank the university staff who gave their time to provide information about the philanthropic income of their institutions. A special thanks to all the new institutions participating in the study for the first time and we are hopeful of increasing this number in the future and expanding the study across the Asia-Pacific region. In addition we are grateful to the survey committee for their guidance and support.
5.1.5 Participating institutions
Table 2.6.5 Response rates 2013 - 2017 2013 2014 2015 2016 2017 Charitable Giving to Universities in Australia and New Zealand
Higher education institutions in Australia
Invited to participate 43 43 43 43 43
Number participating 8 10 14 23 24
Response rate 19% 23% 32% 53% 56% Higher education institutions in New Zealand
Invited to participate 8 8 8 8 8
Number participating 0 1 5 1 1
Response rate 0% 12% 62% 12% 12% Higher education institutions in Australia and New Zealand
Invited to participate 51 51 51 51 51
Number participating 8 11 19 24 25
Response rate 16% 21% 37% 47% 49%

34 | Copyright CASE 2017 | Charitable Giving to Universities in Australia and New Zealand 2014 – 2016
8 Australia - Go8 Institutions
1. Australian National University 2. Monash University 3. University of Adelaide 4. University of Melbourne 5. University of New South
Wales 6. University of Queensland 7. University of Sydney 8. University of Western
Australia
Non-Go8 Australia Australia - Non-Go8 Institutions
1. Curtin University 2. Deakin University 3. Flinders University 4. Griffith University 5. La Trobe University 6. Macquarie University 7. Murdoch University 8. Queensland University of Technology 9. RMIT University 10. Swinburne University of Technology 11. The University of Newcastle 12. University of New England 13. University of South Australia 14. University of Tasmania 15. University of Technology Sydney 16. University of the Sunshine Coast
New Zealand New Zealand
1. The University of Auckland
Universities that participated in the 2014-15 Ross-CASE Survey and have been included in the analysis of this report are as follows: Other UK institutions
1. Abertay University 2. Aberystwyth University 3. Anglia Ruskin University 4. Arts University Bournemouth 5. Aston University 6. Bath Spa University 7. Birkbeck College 8. Bournemouth University 9. Brunel University London 10. Canterbury Christ Church University 11. Cardiff Metropolitan University 12. City University London 13. Courtauld Institute of Art 14. Coventry University 15. Cranfield University 16. Edge Hill University 17. Edinburgh Napier University 18. Glasgow Caledonian University 19. Goldsmiths, University of London 20. Guildhall School of Music & Drama 21. Heriot-Watt University 22. Institute of Cancer Research 23. Kingston University 24. Lancaster University 25. Leeds College of Art 26. Leeds Trinity University 27. Liverpool Hope University 28. Liverpool John Moores University 29. Liverpool School of Tropical Medicine 30. London Business School 31. London School of Hygiene & Tropical Medicine 32. London South Bank University 33. Loughborough University 34. Manchester Metropolitan University
46. Royal Holloway, University of London 47. Royal Northern College of Music 48. Royal Veterinary College 49. Royal Welsh College of Music & Drama 50. SOAS, University of London 51. Swansea University 52. Teesside University 53. The University of West London 54. Trinity Laban Conservatoire of Music and Dance 55. Ulster University 56. University Campus Suffolk 57. University of Aberdeen 58. University of Bath 59. University of Bedfordshire 60. University of Brighton 61. University of Chester 62. University of Cumbria 63. University of Derby 64. University of Dundee 65. University of East Anglia 66. University of Essex 67. University of Huddersfield 68. University of Hull 69. University of Kent 70. University of Leicester 71. University of Lincoln 72. University of Northumbria at Newcastle 73. University of Portsmouth 74. University of Reading 75. University of Roehampton 76. University of Salford 77. University of South Wales 78. University of St Andrews 79. University of St Mark & St John

35 | Copyright CASE 2017 | Charitable Giving to Universities in Australia and New Zealand 2014 – 2016
35. Middlesex University 36. Newman University 37. Nottingham Trent University 38. Open University 39. Oxford Brookes University 40. Queen Margaret University Edinburgh 41. Robert Gordon University 42. Rose Bruford College 43. Royal Agricultural University 44. Royal College of Art 45. Royal College of Music
80. University of Stirling 81. University of Strathclyde 82. University of Surrey 83. University of Sussex 84. University of the Arts London 85. University of the West of England, Bristol 86. University of the West of Scotland 87. University of Wolverhampton 88. University of Worcester 89. York St John University
UK institutions in the Russell Group 1. Cardiff University 2. Imperial College London 3. King's College London 4. London School of Economics and Political Science 5. Newcastle University 6. Queen Mary University of London 7. Queen's University Belfast 8. University College London 9. University of Birmingham 10. University of Bristol 11. University of Cambridge 12. University of Durham 13. University of Edinburgh 14. University of Exeter 15. University of Glasgow 16. University of Leeds 17. University of Liverpool 18. University of Manchester 19. University of Nottingham 20. University of Oxford 21. University of Sheffield 22. University of Southampton 23. University of Warwick 24. University of York
36 | Copyright CASE 2017 | Charitable Giving to Universities in Australia and New Zealand 2014 – 2016
5.1.6 Glossary
Annual funds: Gifts obtained through mass participation often directed to general operations and/or designated university priorities. Bequests: A commitment (pledge) that a transfer of wealth will occur upon a donor’s death. Within the survey bequest gifts are only counted in either new funds secured or cash income received (depending on the type of gift) when it is received. Committed bequests (whether received in year or not) are included in the committed bequests question within the survey. Cash income received: Income received by the institution including payments received towards pledges made in previous years, excluding new pledges where payment has not been received. Contactable alumni: This refers to addressable alumni (former students of the institution) – those who you have reliable postal or email addresses anywhere in the world. Gifts-in-kind: This includes other goods donated that are not a monetary contribution. Group of Eight: The Group of Eight (Go8) is a coalition of research-intensive Australian higher education institutions (refer to the Go8 website for further information https://go8.edu.au/ ). Investment in alumni relations: The costs associated with engagement activity with alumni and community, including staff and non-staff expenditure. Investment in fundraising: The costs associated with the efforts to gather new funds secured and cash income received. It includes the cost of the staff (staff expenditure) undertaking the fundraising and the other costs (non-staff expenditure) of running and maintaining the fundraising operations. When the cost of both staff expenditure and non-staff expenditure is combined this equals the total fundraising expenditure. Mean: A measure of central tendency which is the average value i.e. the sum of the sampled values divide by the number of items in the sample. In this report mean denotes the arithmetic mean. Median: A measure of central tendency the median separates the higher half of a data sample, a population, or a probability distribution, from the lower half. New funds secured: New funding secured by the institution, including new donations received and new confirmed pledges not yet received but excluding payments of pledges made in previous years. This does not include bequest pledges but includes bequest received. Organisations: Includes trusts, foundations, companies and other organisations. Philanthropic income: This is defined in the Supporting Document and includes gifts/donations or grants that meet two criteria – source of funds should be eligible and the nature of funds should meet the survey’s definition of philanthropic intent. The survey reports philanthropic income in two ways – new funds secured and cash income received. Reporting rules and Question-by-question guide: These documents provide guidance and definitions on funding that is eligible for inclusion in the survey and how that funding is recorded. It also contains general guidance on completing the survey. Russell Group Universities: The Russell Group is an Association of 24 research-intensive institutions in the UK. Sum: Summation is the operation of adding a sequence of numbers; the result is their sum or total.