charles hakes fort lewis college1. charles hakes fort lewis college2 light pollution stellar...
TRANSCRIPT
Charles HakesFort Lewis College 1
Charles HakesFort Lewis College 2
Light Pollution
Stellar Evolution
Charles HakesFort Lewis College 3
Lab Notes
• Be sure you have started your “report” lab.• Constellation presentations next week.• Observatory field trips…
Charles HakesFort Lewis College 4
Night Lights
• http://apod.nasa.gov/apod/ap101104.html
Charles HakesFort Lewis College 5
Limiting Magnitude
and
Light Pollution
Charles HakesFort Lewis College 6
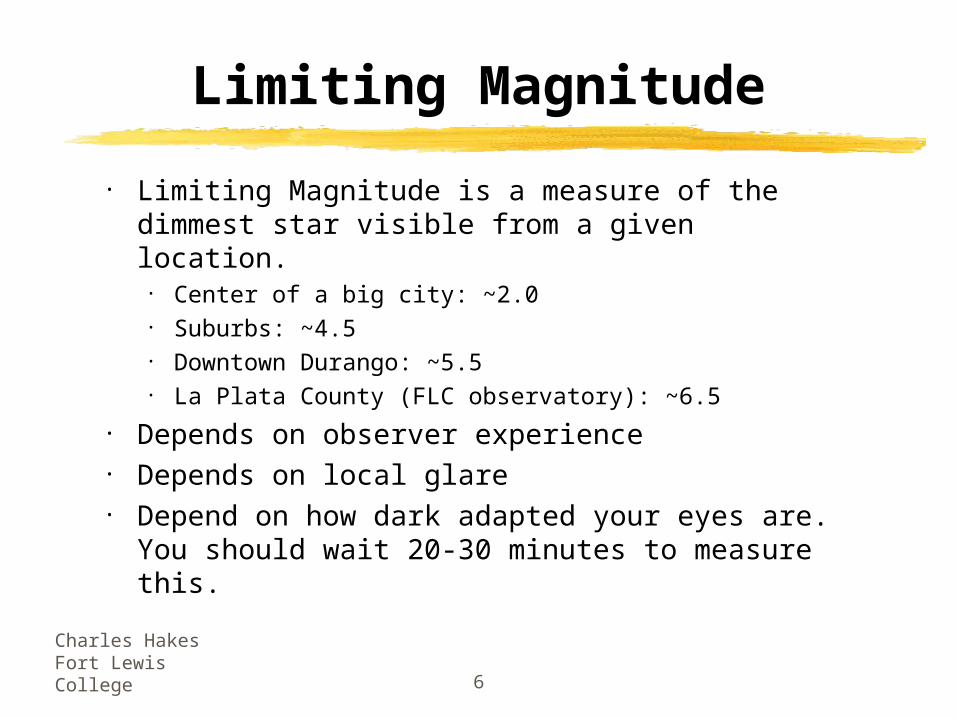
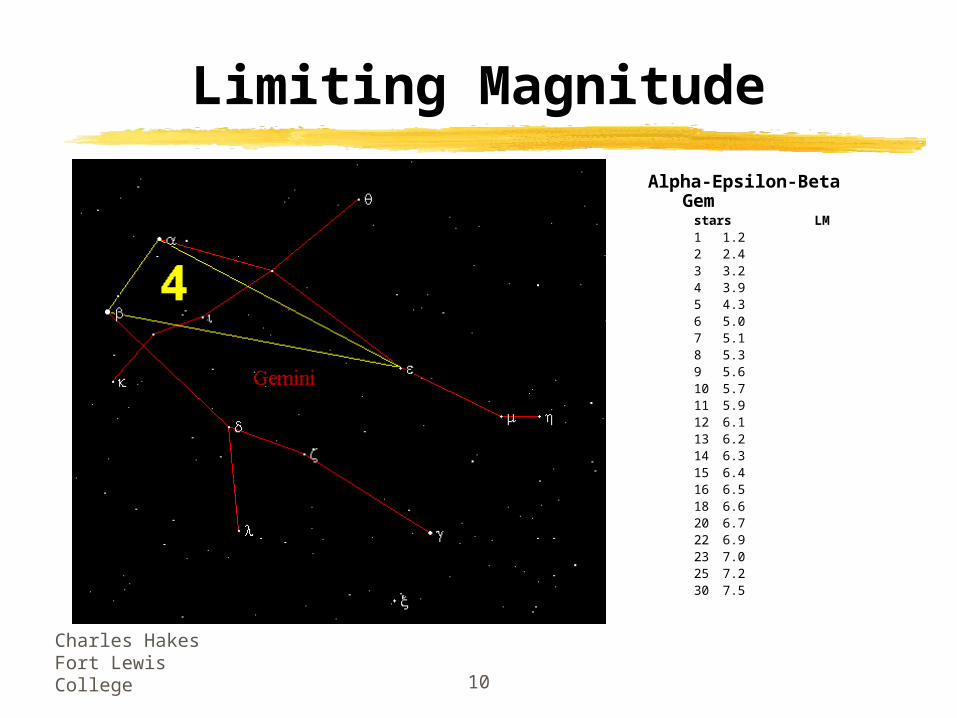
Limiting Magnitude
• Limiting Magnitude is a measure of the dimmest star visible from a given location.
• Center of a big city: ~2.0• Suburbs: ~4.5• Downtown Durango: ~5.5• La Plata County (FLC observatory): ~6.5
• Depends on observer experience• Depends on local glare• Depend on how dark adapted your eyes are. You
should wait 20-30 minutes to measure this.

Charles HakesFort Lewis College 7
Limiting Magnitude
• Use stars of known magnitude (e.g. Little Dipper)
Charles HakesFort Lewis College 8
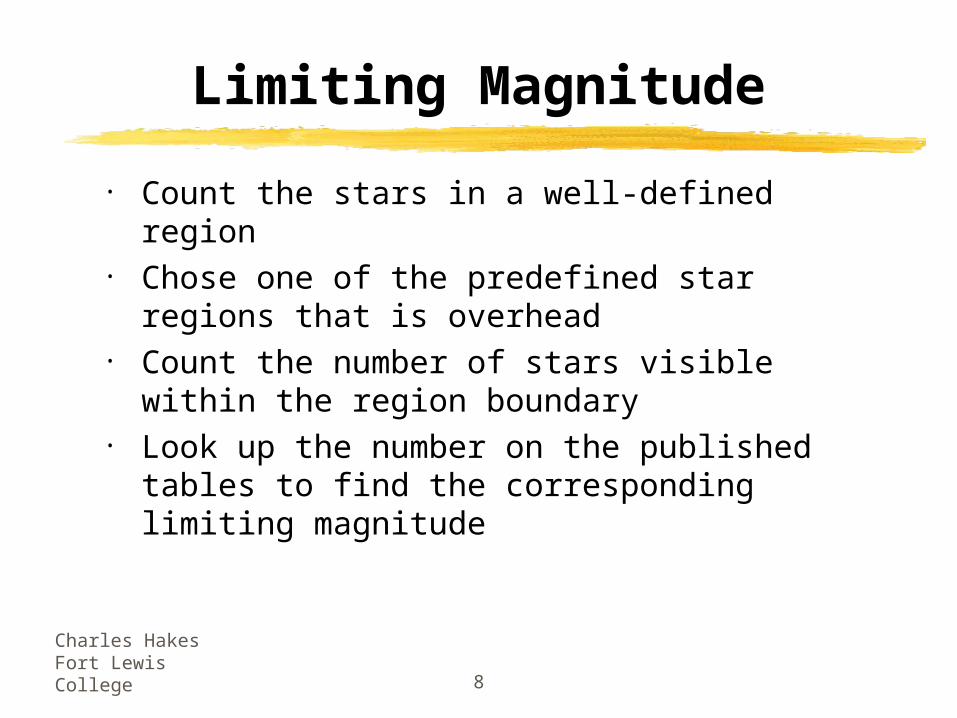
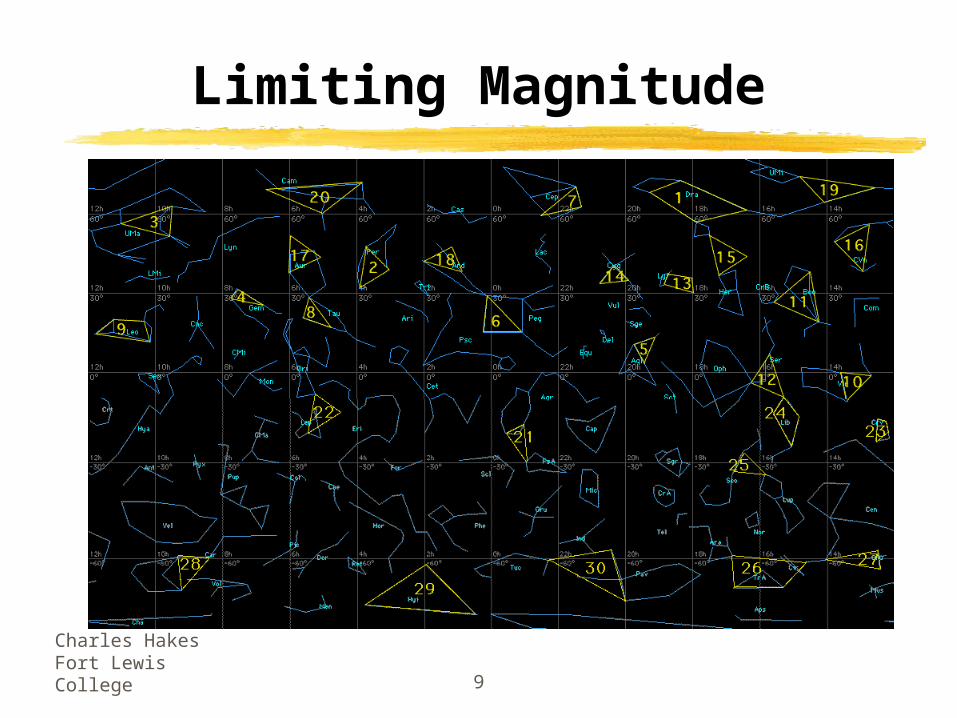
Limiting Magnitude
• Count the stars in a well-defined region• Chose one of the predefined star regions that is
overhead• Count the number of stars visible within the region
boundary• Look up the number on the published tables to find
the corresponding limiting magnitude
Charles HakesFort Lewis College 9
Limiting Magnitude
Charles HakesFort Lewis College 10
Limiting Magnitude
Alpha-Epsilon-Beta Gemstars LM1 1.22 2.43 3.24 3.95 4.36 5.07 5.18 5.39 5.610 5.711 5.912 6.113 6.214 6.315 6.416 6.518 6.620 6.722 6.923 7.025 7.230 7.5
Charles HakesFort Lewis College 11
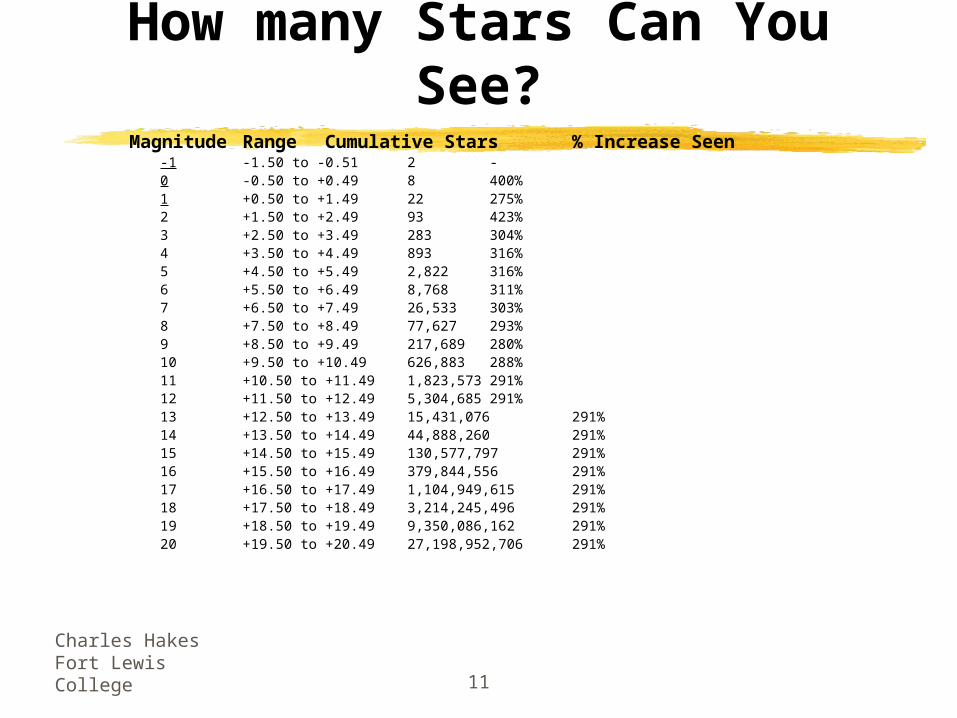
How many Stars Can You See?Magnitude Range Cumulative Stars % Increase Seen
-1 -1.50 to -0.51 2 -0 -0.50 to +0.49 8 400%1 +0.50 to +1.49 22 275%2 +1.50 to +2.49 93 423%3 +2.50 to +3.49 283 304%4 +3.50 to +4.49 893 316%5 +4.50 to +5.49 2,822 316%6 +5.50 to +6.49 8,768 311%7 +6.50 to +7.49 26,533 303%8 +7.50 to +8.49 77,627 293%9 +8.50 to +9.49 217,689 280%10 +9.50 to +10.49 626,883 288%11 +10.50 to +11.49 1,823,573 291%12 +11.50 to +12.49 5,304,685 291%13 +12.50 to +13.49 15,431,076 291%14 +13.50 to +14.49 44,888,260 291%15 +14.50 to +15.49 130,577,797 291%16 +15.50 to +16.49 379,844,556 291%17 +16.50 to +17.49 1,104,949,615 291%18 +17.50 to +18.49 3,214,245,496 291%19 +18.50 to +19.49 9,350,086,162 291%20 +19.50 to +20.49 27,198,952,706 291%

Charles HakesFort Lewis College 12
How many Stars Can You See?
• Dark-adapted naked eye (1x7 binoculars)• Can see to magnitude 6.5 -> ~104 stars
• Light gathering ability scales with area.• Magnitude Increase = log10(Area increase) / 0.4• 10x50 binoculars ~50x area -> +4.25 magnitudes• 16” SCT ~64x area -> +4.5 magnitudes• 10m Keck telescope ~625x area -> +7 magnitudes

Charles HakesFort Lewis College 13
How many Stars Can You See?
• So for naked eye observing• 10x50 binoculars
• 50x area• +4.25 magnitudes (to 10.75) > 106 stars
• 16” SCT• 64x area• +4.5 magnitudes (to 15.25) > 108 stars
• 10m Keck telescope• 625x area• +7 magnitudes (to 22.75) > 1011 stars
Charles HakesFort Lewis College 14
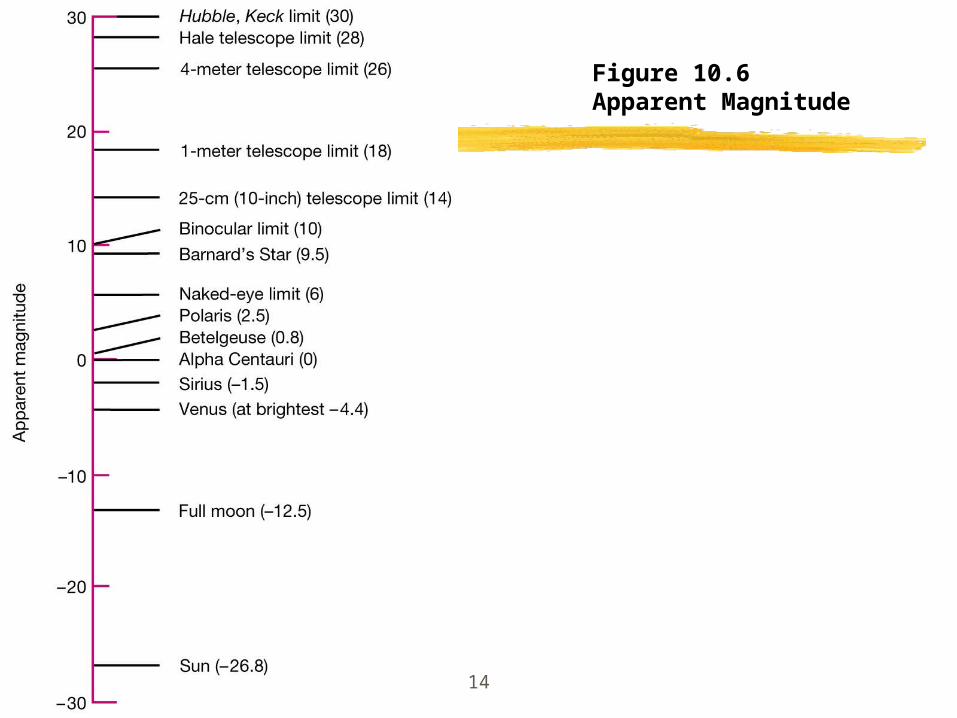
Figure 10.6Apparent Magnitude

Charles HakesFort Lewis College 15
Light Pollution
• Generally not an issue in La Plata county.• Durango has a dark sky ordinance, but
only for new construction.• Fort Lewis is making progress with outside
light fixtures.
Charles HakesFort Lewis College 16
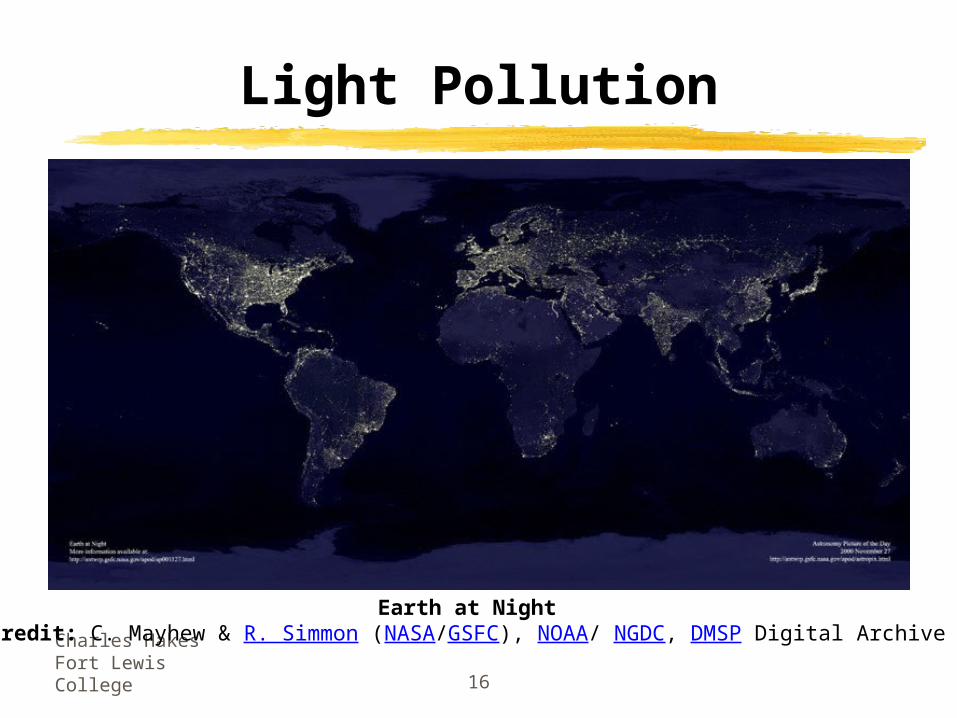
Light Pollution
Earth at Night Credit: C. Mayhew & R. Simmon (NASA/GSFC), NOAA/ NGDC, DMSP Digital Archive
Charles HakesFort Lewis College 17
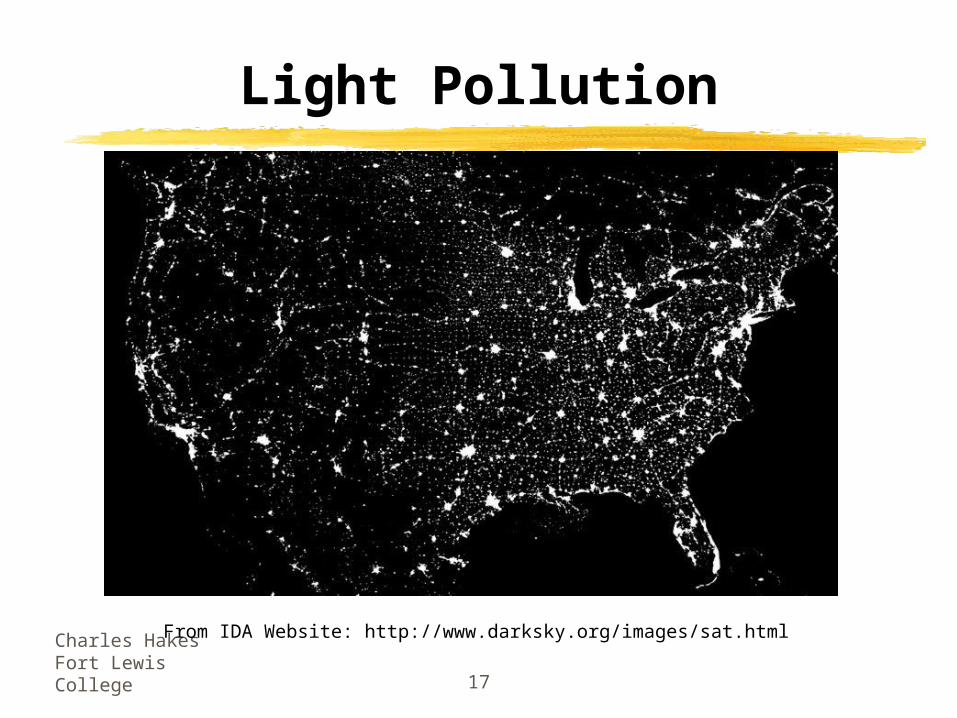
Light Pollution
From IDA Website: http://www.darksky.org/images/sat.html
Charles HakesFort Lewis College 18
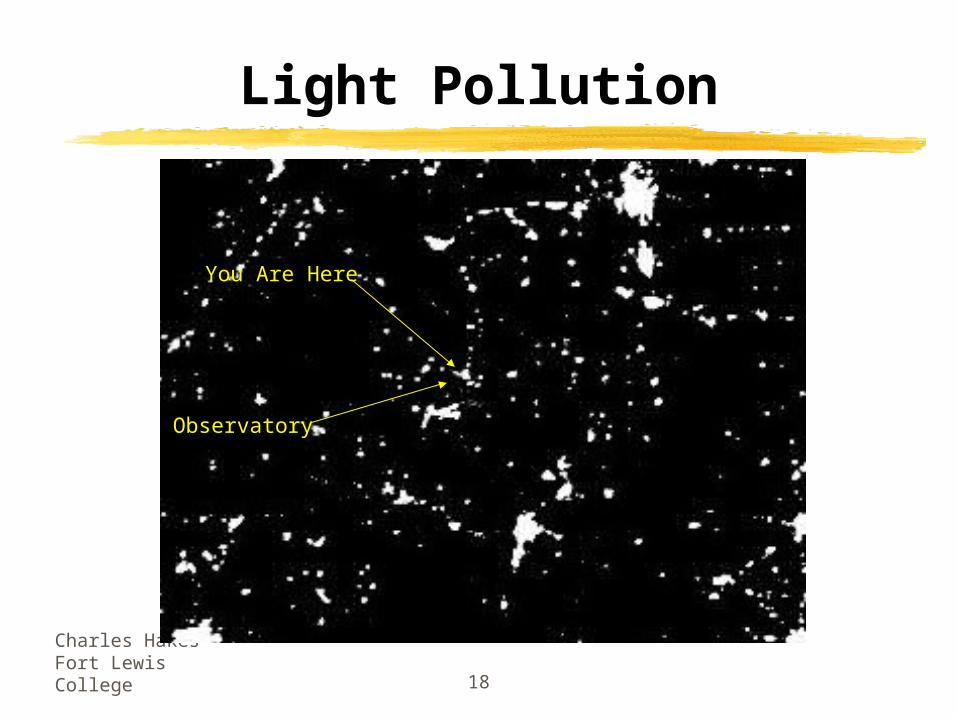
Light Pollution
You Are Here
Observatory
Charles HakesFort Lewis College 19
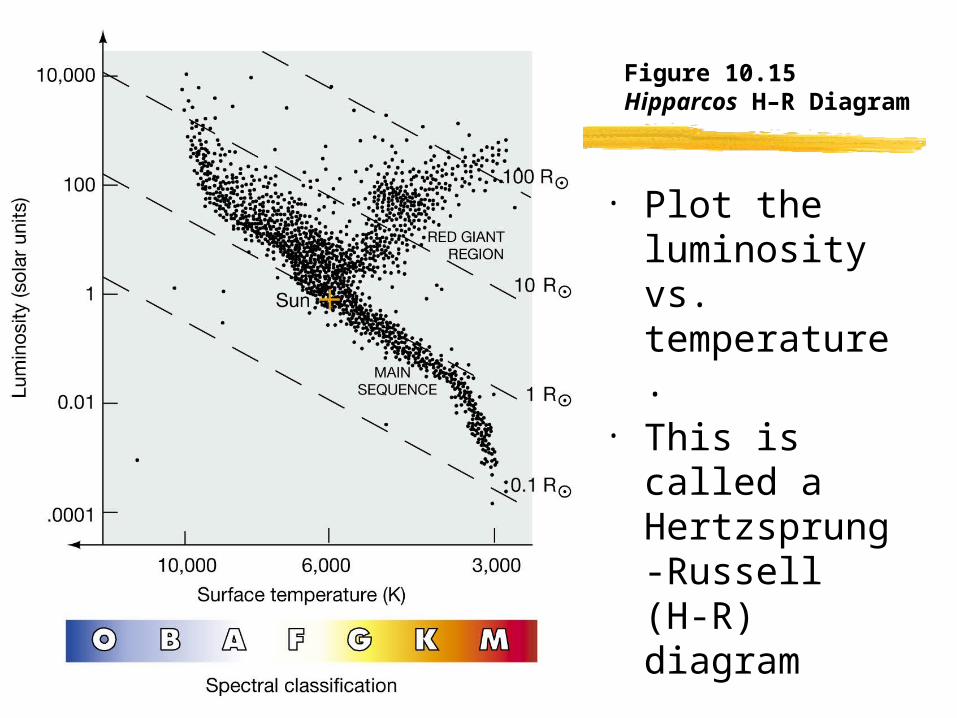
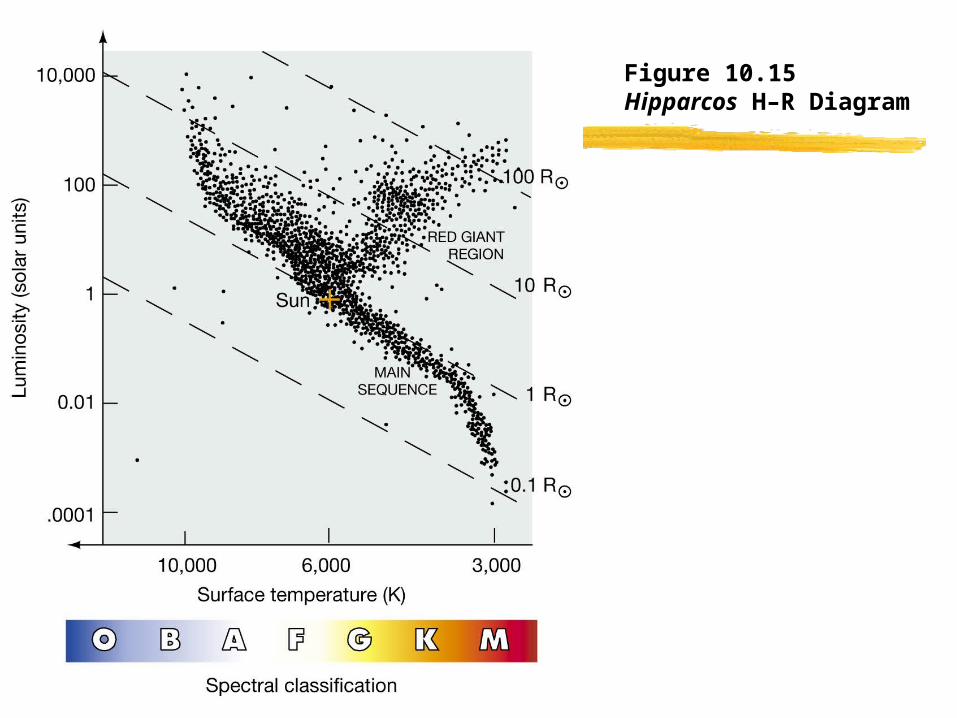
Figure 10.15Hipparcos H–R Diagram
• Plot the luminosity vs. temperature.
• This is called a Hertzsprung-Russell (H-R) diagram
Charles HakesFort Lewis College 20
What fraction of the stars on an H-R diagram are on the main sequence
A. 0-50%
B. 50-70%
C. 70-80%
D. >80%
Charles HakesFort Lewis College 21
What fraction of the stars on an H-R diagram are on the main sequence
A. 0-50%
B. 50-70%
C. 70-80%
D. >80%
Charles HakesFort Lewis College 22
Distance Scale
• If you know brightness and distance, you can determine luminosity.
• Turn the problem around…
Charles HakesFort Lewis College 23
Distance Scale
• If you know brightness and distance, you can determine luminosity.
• Turn the problem around…• If a star is on the main sequence,
then we know its luminosity. So• If you know brightness and luminosity,
you can determine a star’s distance.

Charles HakesFort Lewis College 24
Distance Scale
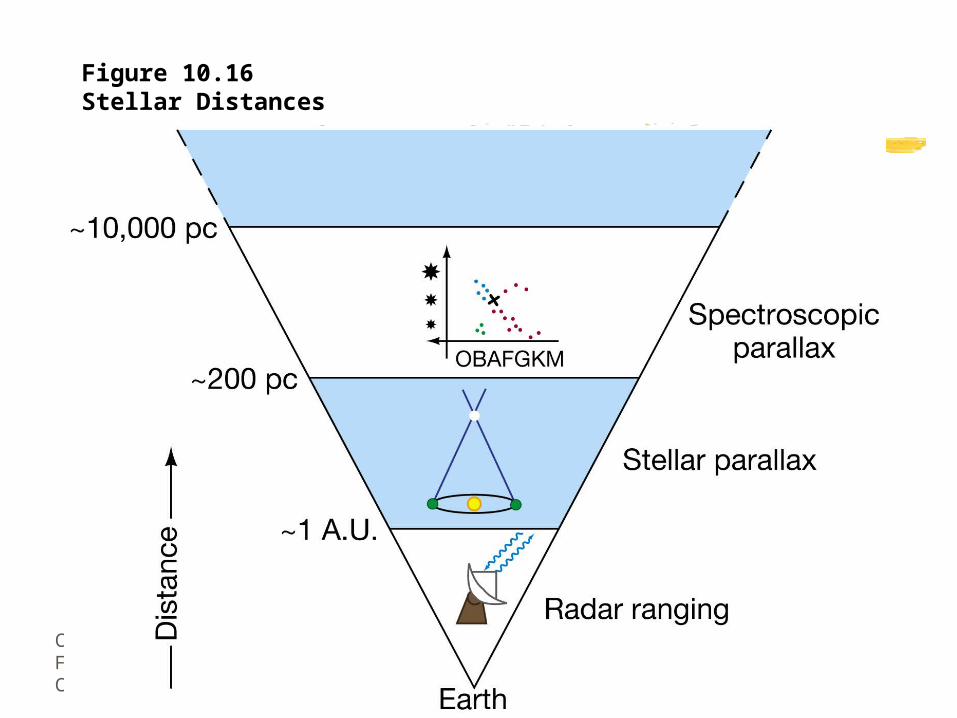
• Spectroscopic Parallax - the process of using stellar spectra to determine distances.
• Can use this distance scale out to several thousand parsecs.
Charles HakesFort Lewis College 25
Figure 10.16Stellar Distances

Charles HakesFort Lewis College 26
Stellar Evolution
Charles HakesFort Lewis College 27
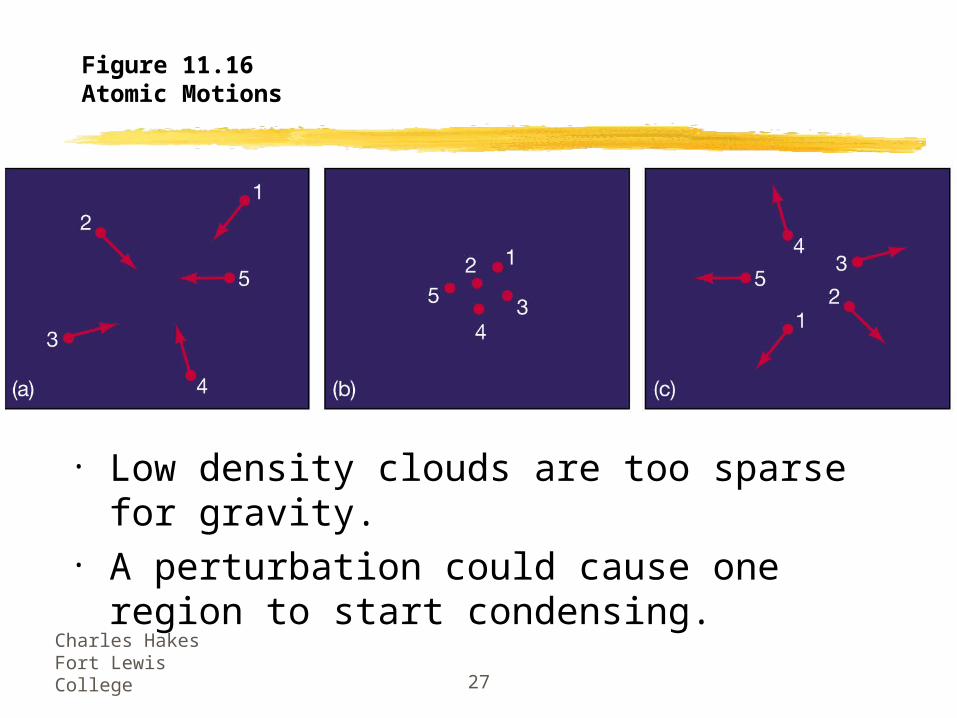
Figure 11.16Atomic Motions
• Low density clouds are too sparse for gravity.• A perturbation could cause one region to start
condensing.
Charles HakesFort Lewis College 28
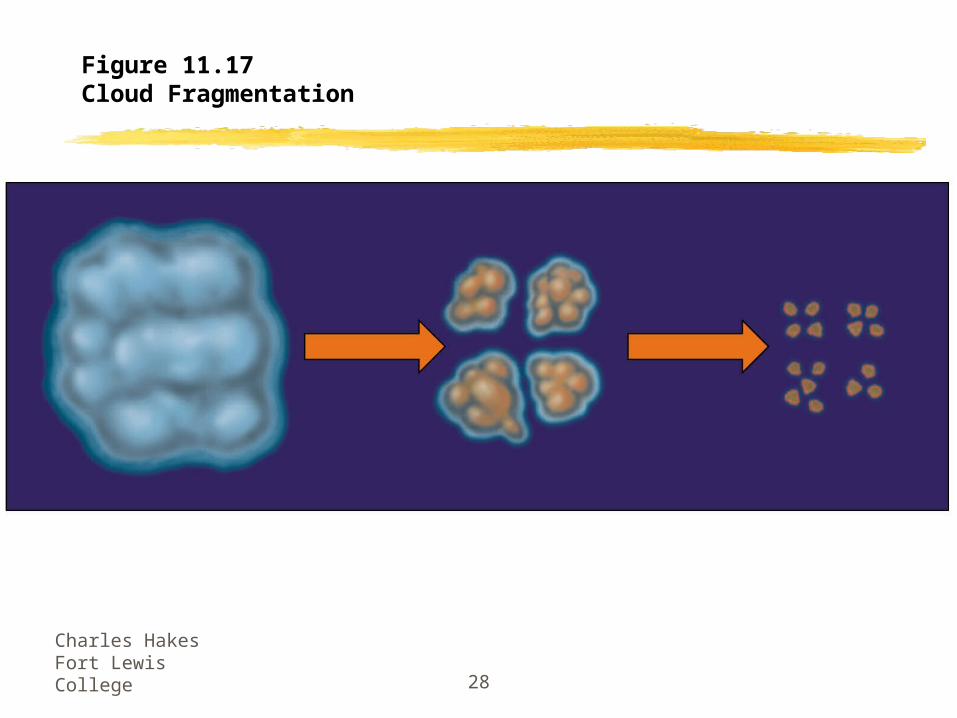
Figure 11.17Cloud Fragmentation
Charles HakesFort Lewis College 29
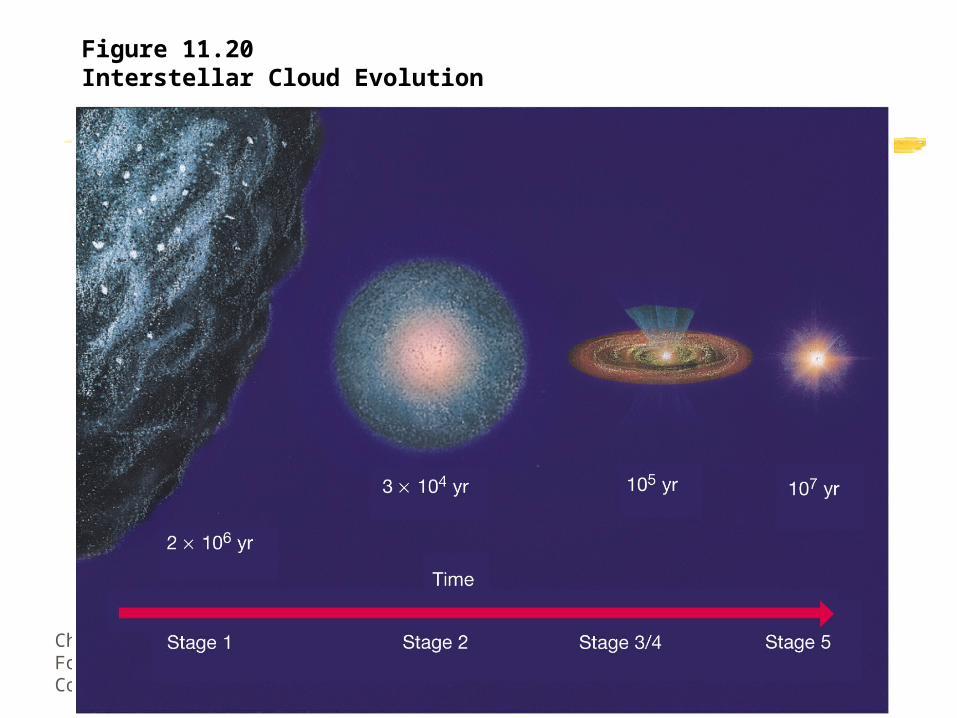
Figure 11.20Interstellar Cloud Evolution
Charles HakesFort Lewis College 30
http://discovermagazine.com/2009/interactive/star-formation-game/
google “star formation game”

Charles HakesFort Lewis College 31
H-R diagram review
• The H-R diagram shows luminosity vs. temperature.
• It is also useful for describing how stars change during their lifetime even though “time” is not on either axis.
• How to do this may not be obvious.• Exercise - Get in groups of ~four and get
out a blank piece of paper.
Charles HakesFort Lewis College 32
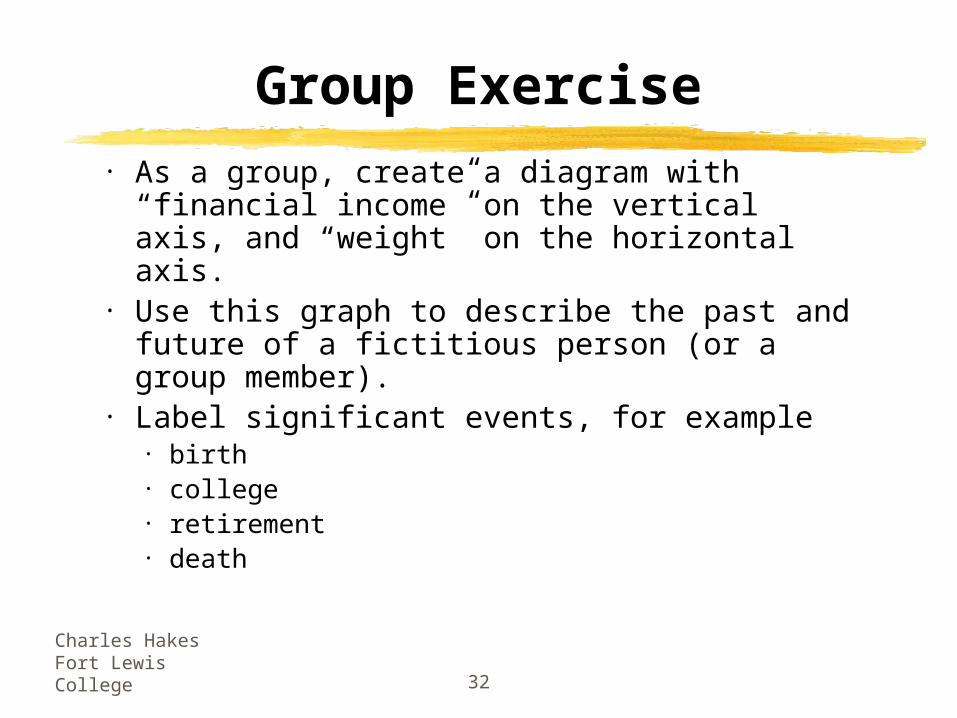
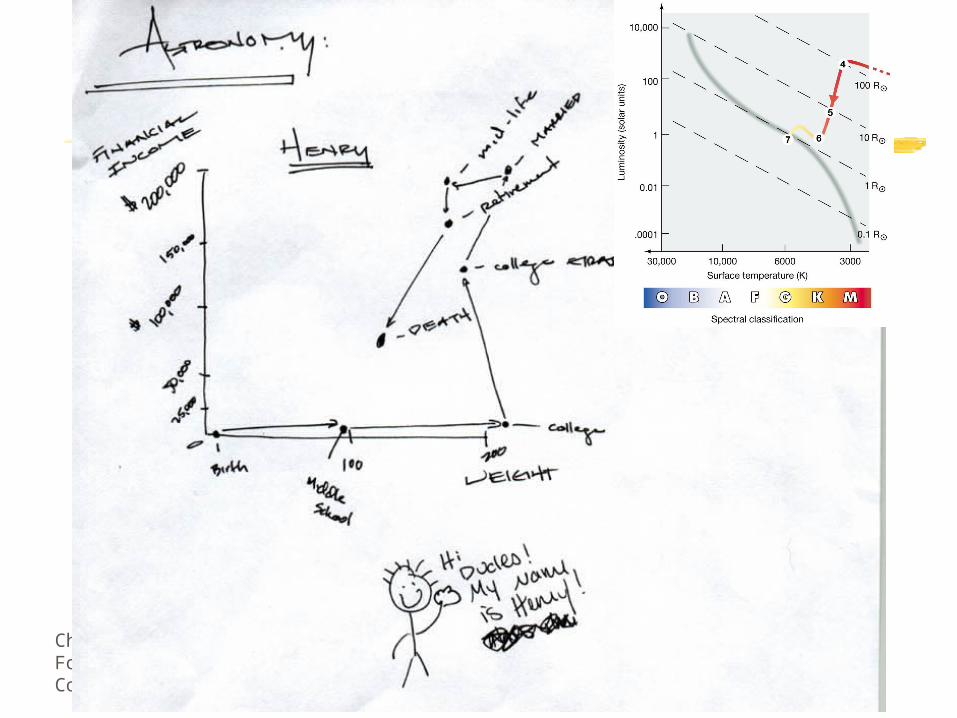
Group Exercise
• As a group, create a diagram with “financial income” on the vertical axis, and “weight” on the horizontal axis.
• Use this graph to describe the past and future of a fictitious person (or a group member).
• Label significant events, for example• birth• college• retirement• death
Charles HakesFort Lewis College 33
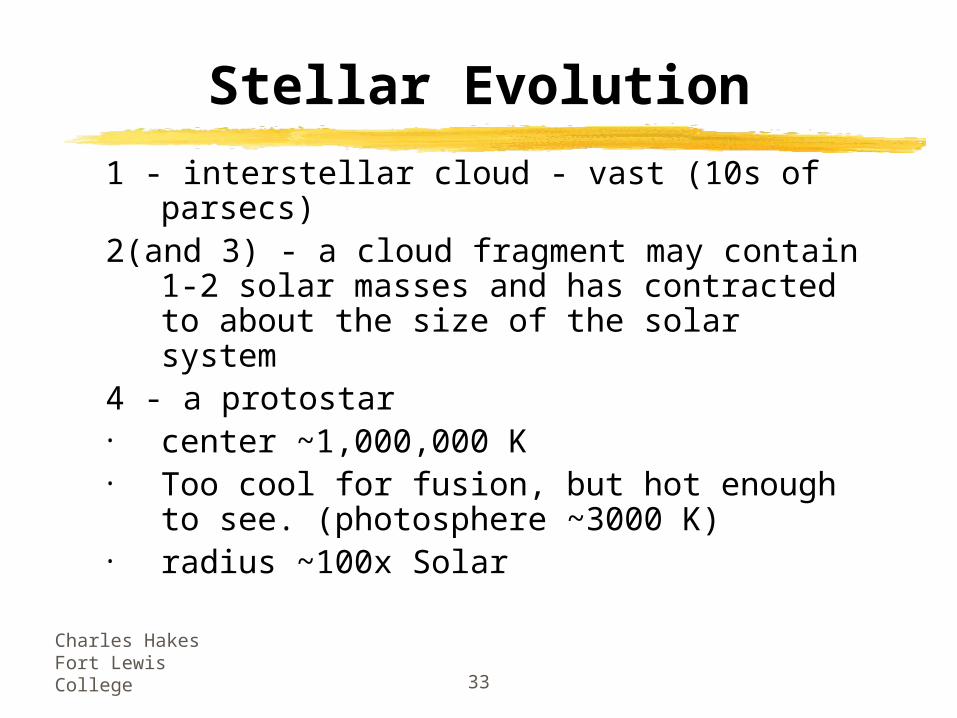
Stellar Evolution
1 - interstellar cloud - vast (10s of parsecs)2(and 3) - a cloud fragment may contain 1-2
solar masses and has contracted to about the size of the solar system
4 - a protostar• center ~1,000,000 K• Too cool for fusion, but hot enough to
see. (photosphere ~3000 K)• radius ~100x Solar
Charles HakesFort Lewis College 34
How would the luminosity of a one-solar-mass protostar compare to the sun?
A) Less than .1x as bright
B) A little lower.
C) About the same.
D) A little brighter
E) More than 10x brighter
Charles HakesFort Lewis College 35
How would the luminosity of a one-solar-mass protostar compare to the sun?
A) Less than .1x as bright
B) A little lower.
C) About the same.
D) A little brighter
E) More than 10x brighter

Charles HakesFort Lewis College 36
Figure 11.19Protostar on the H–R Diagram
Charles HakesFort Lewis College 37
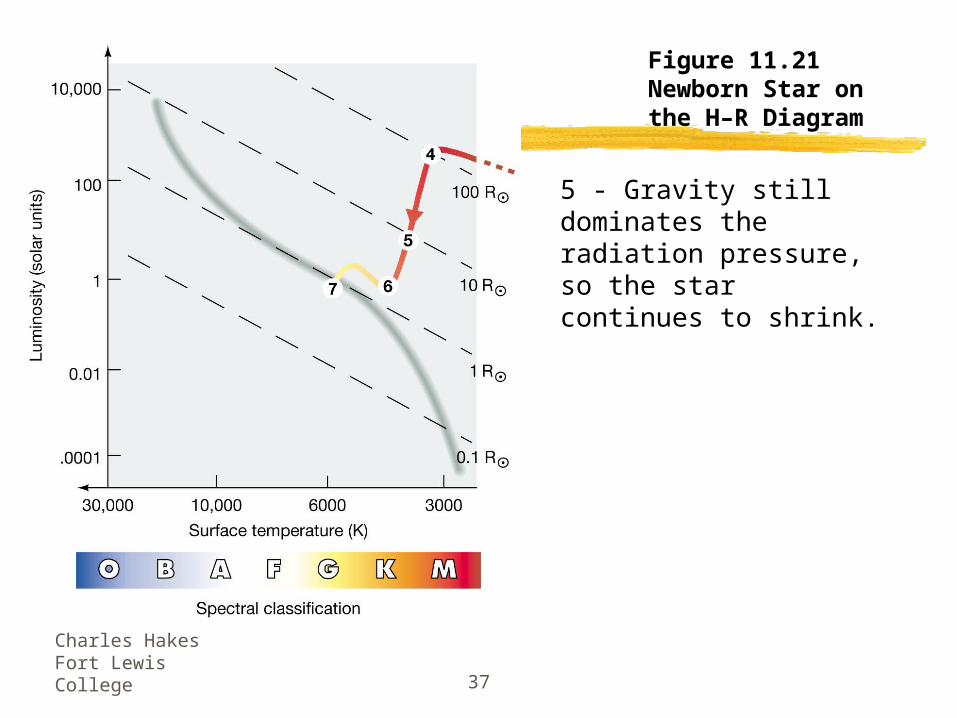
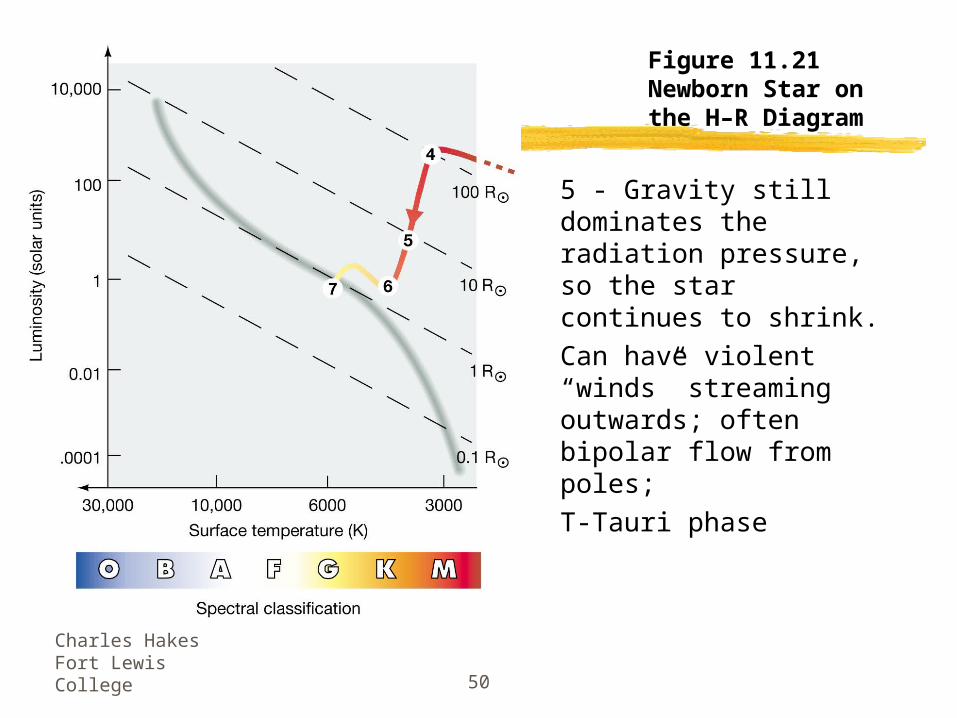
Figure 11.21Newborn Star on the H–R Diagram
5 - Gravity still dominates the radiation pressure, so the star continues to shrink.
Charles HakesFort Lewis College 38
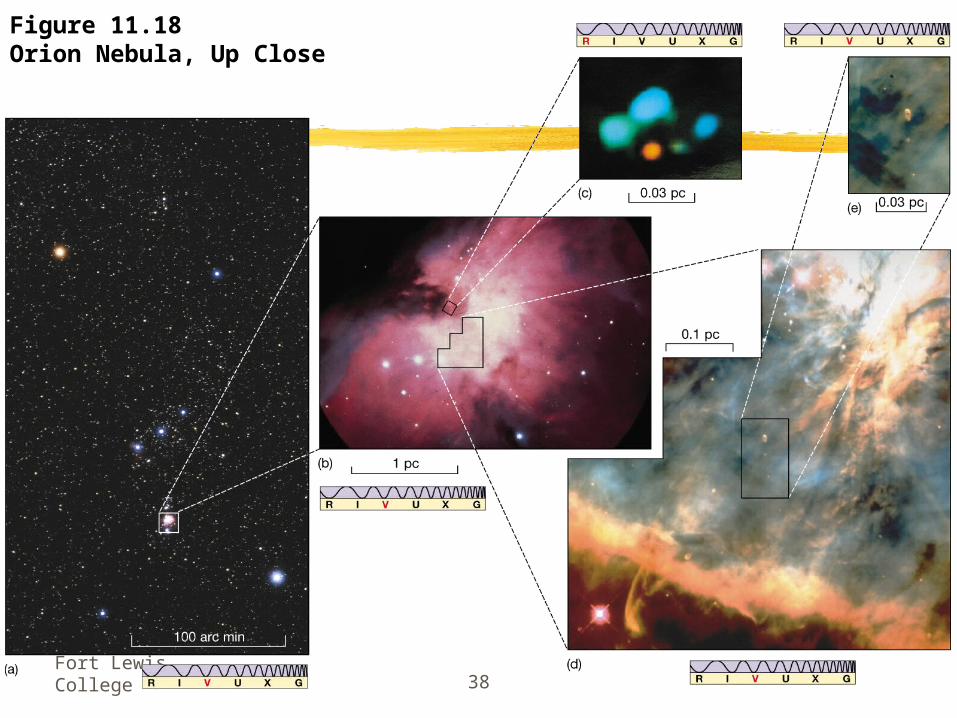
Figure 11.18Orion Nebula, Up Close
Charles HakesFort Lewis College 39
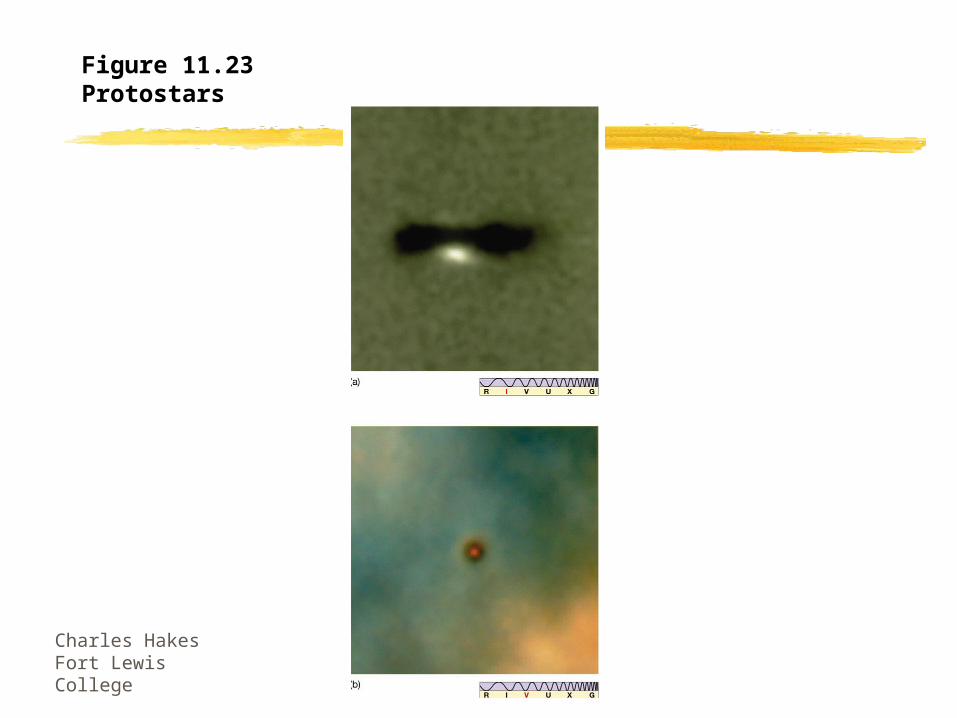
Figure 11.23Protostars

Charles HakesFort Lewis College 40
Figure 11.21Newborn Star on the H–R Diagram
Charles HakesFort Lewis College 41
Stars A and B formed at the same time. Star B has 3 times the mass of star A. Star A has an expected lifetime of 3 billion years. What is the expected lifetime of star B?
A) more than 9 billion years
B) about 9 billion years
C) 3 billion years
D) about 1 billion years
E) less than 1 billion years

Charles HakesFort Lewis College 42
Stars A and B formed at the same time. Star B has 3 times the mass of star A. Star A has an expected lifetime of 3 billion years. What is the expected lifetime of star B?
A) more than 9 billion years
B) about 9 billion years
C) 3 billion years
D) about 1 billion years
E) less than 1 billion years

Charles HakesFort Lewis College 43
Stellar Lifetimes
• Proportional to mass• Inversely proportional to luminosity• Big stars are MUCH more luminous,
so they use their fuel MUCH faster.• The distribution of star types is
representative of how long stars spend during that portion of their life.
• Example - snapshots of people.

Charles HakesFort Lewis College 44
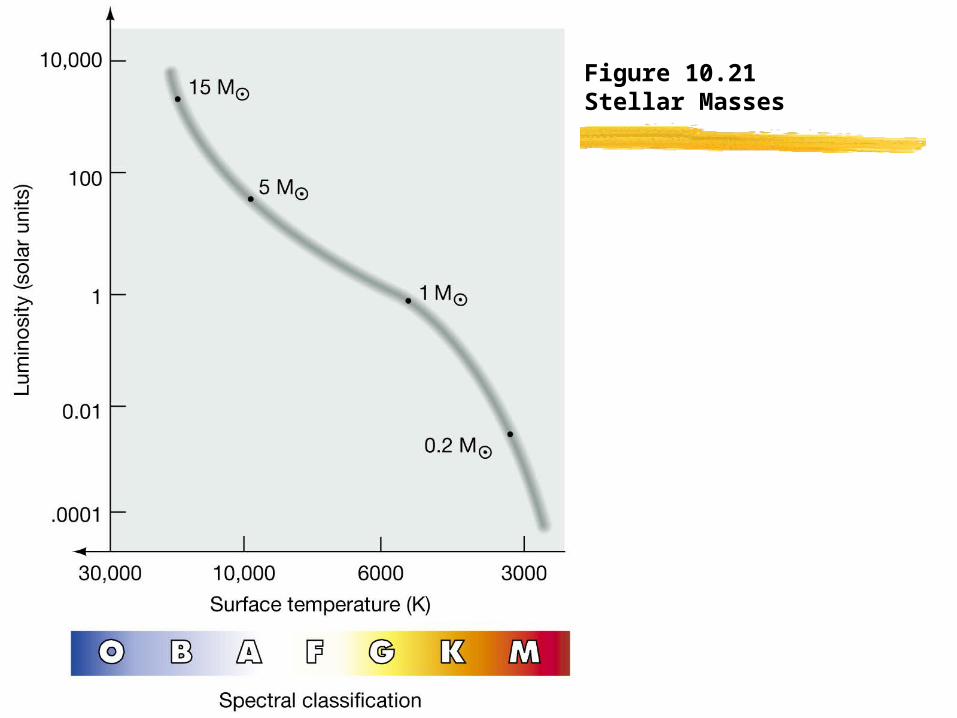
Figure 10.21Stellar Masses
Charles HakesFort Lewis College 45
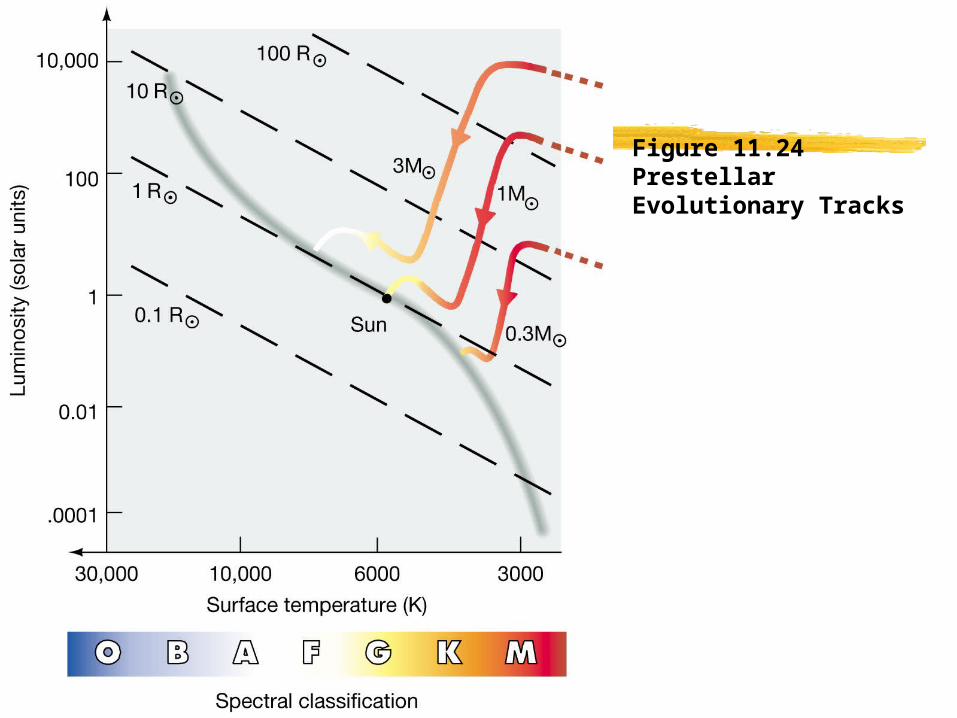
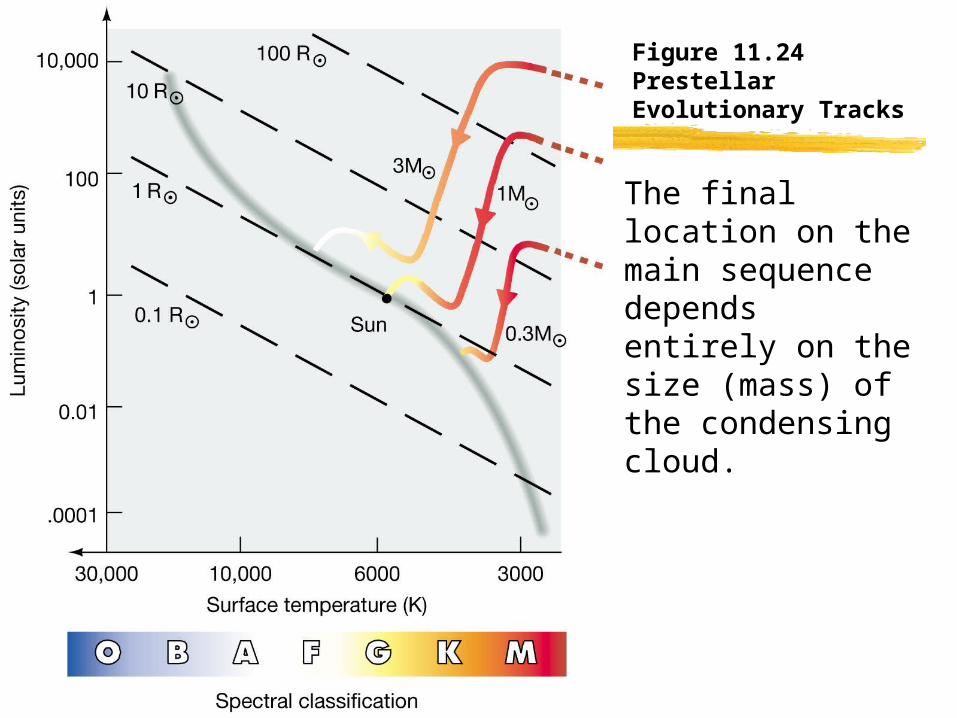
Figure 11.24Prestellar Evolutionary Tracks
Charles HakesFort Lewis College 46
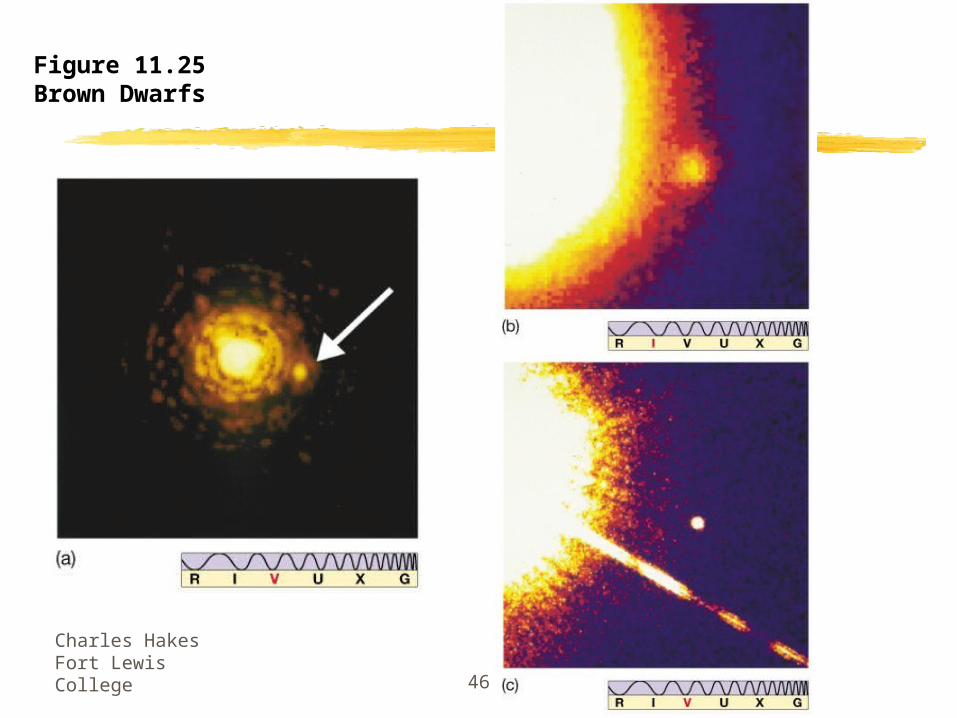
Figure 11.25Brown Dwarfs
Charles HakesFort Lewis College 47
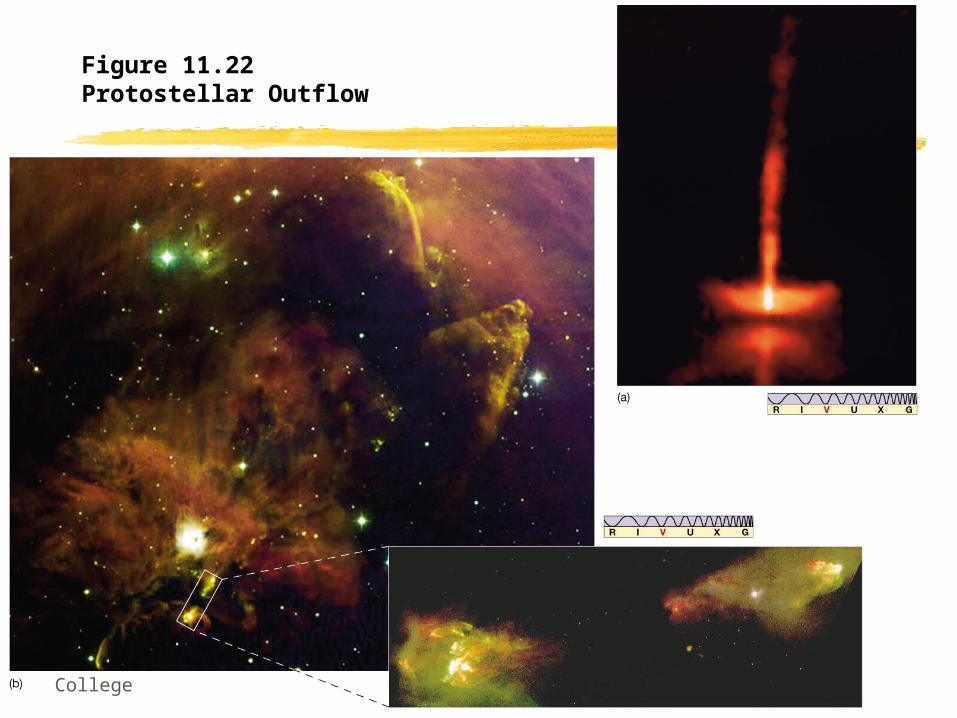
Figure 11.22Protostellar Outflow
Charles HakesFort Lewis College 48
Stellar Evolution

Charles HakesFort Lewis College 49
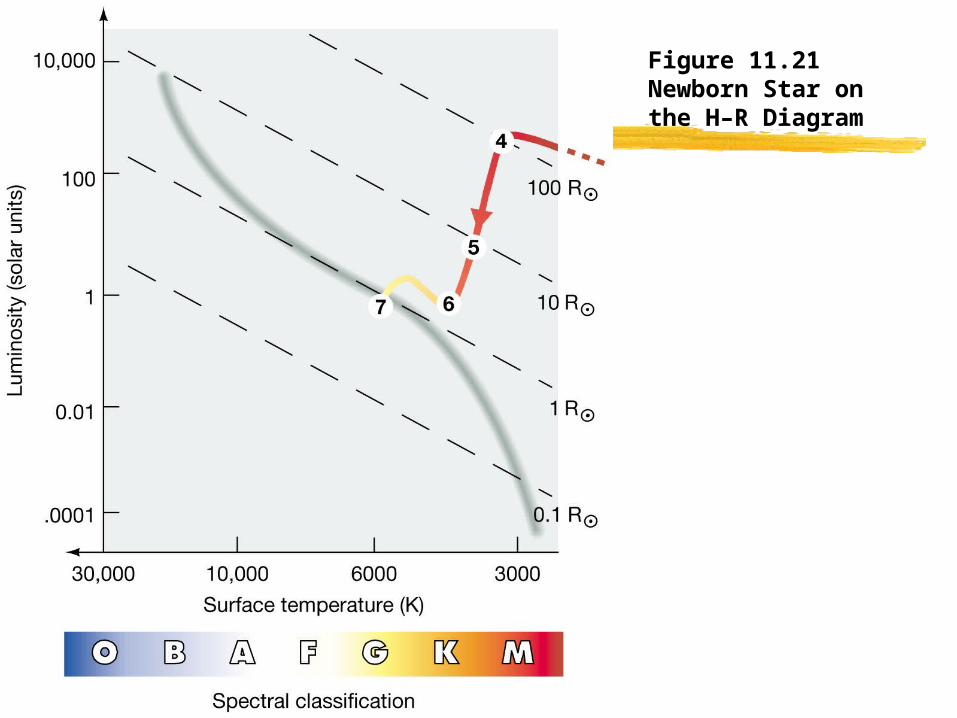
Figure 11.21Newborn Star on the H–R Diagram
5 - Gravity still dominates the radiation pressure, so the star continues to shrink.
Charles HakesFort Lewis College 50
Figure 11.21Newborn Star on the H–R Diagram
5 - Gravity still dominates the radiation pressure, so the star continues to shrink.
Can have violent “winds” streaming outwards; often bipolar flow from poles;
T-Tauri phase
Charles HakesFort Lewis College 51
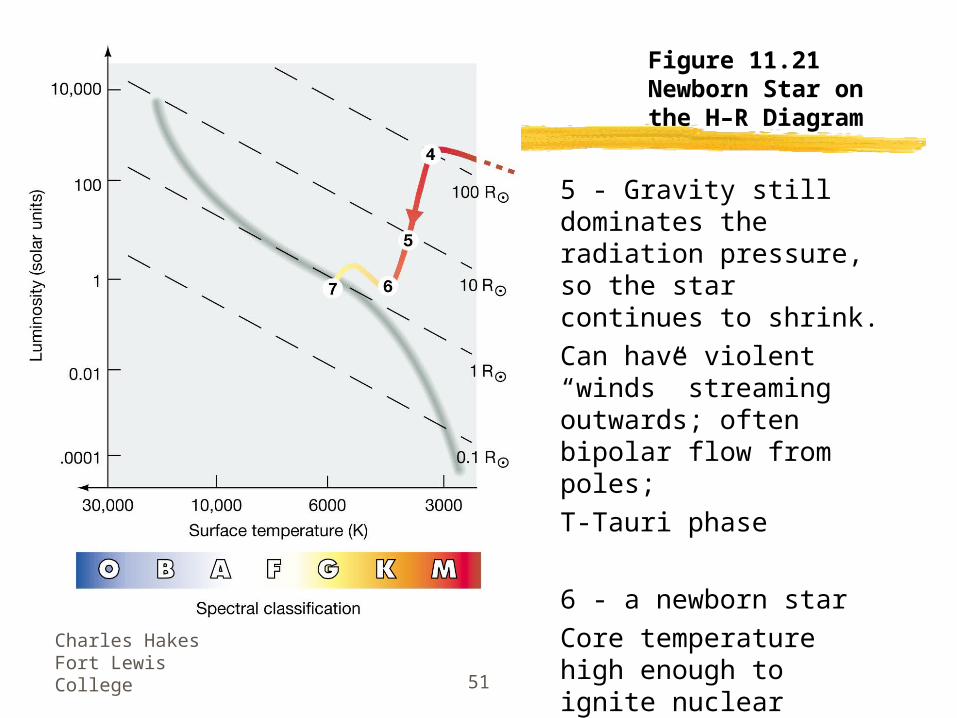
Figure 11.21Newborn Star on the H–R Diagram
5 - Gravity still dominates the radiation pressure, so the star continues to shrink.
Can have violent “winds” streaming outwards; often bipolar flow from poles;
T-Tauri phase
6 - a newborn star
Core temperature high enough to ignite nuclear fusion.
Charles HakesFort Lewis College 52
Figure 11.21Newborn Star on the H–R Diagram

Charles HakesFort Lewis College 53
Stars A and B formed at the same time. Star B has 3 times the mass of star A. Star A has an expected lifetime of 3 billion years. What is the expected lifetime of star B?
A) more than 9 billion years
B) about 9 billion years
C) 3 billion years
D) about 1 billion years
E) less than 1 billion years
Charles HakesFort Lewis College 54
Stellar Lifetimes
• Proportional to mass• Inversely proportional to luminosity• Big stars are MUCH more luminous,
so they use their fuel MUCH faster.• The distribution of star types is
representative of how long stars spend during that portion of their life.
• Example - snapshots of people.

Charles HakesFort Lewis College 55
Figure 10.21Stellar Masses

Charles HakesFort Lewis College 56
Figure 11.24Prestellar Evolutionary Tracks
Charles HakesFort Lewis College 57
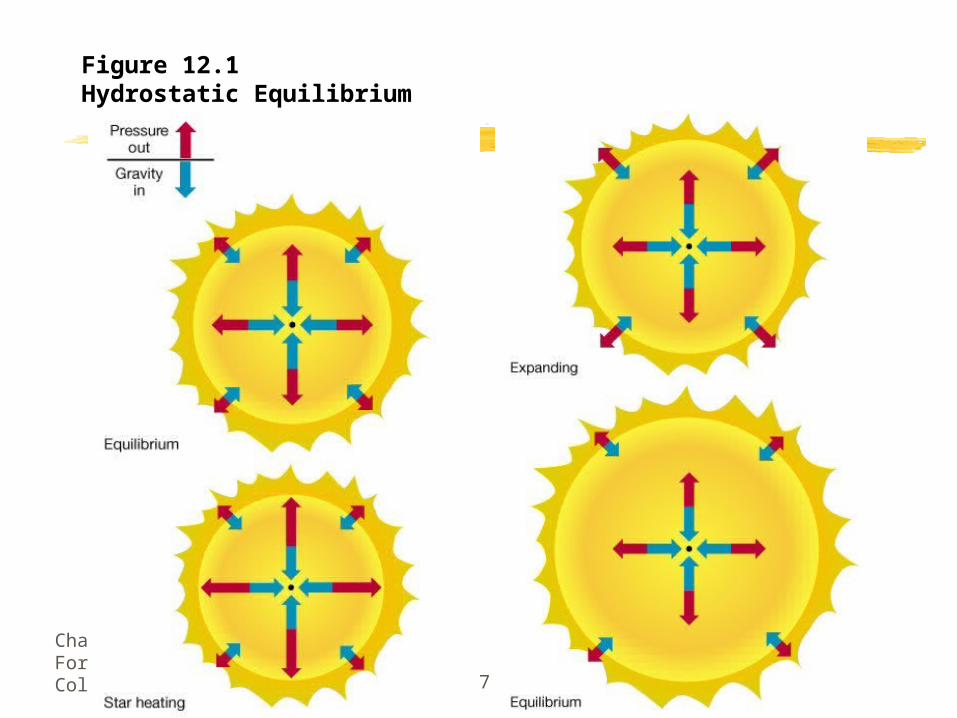
Figure 12.1Hydrostatic Equilibrium
Charles HakesFort Lewis College 58
Figure 11.24Prestellar Evolutionary Tracks
The final location on the main sequence depends entirely on the size (mass) of the condensing cloud.

Charles HakesFort Lewis College 59
Figure 11.25Brown Dwarfs
Not big enough to start fusion.
Mass <~ 0.08 solar masses
~=80x mass of Jupiter.
These are likely very numerous
Charles HakesFort Lewis College 60
Stellar Evolution
7 - the star stays on the main sequence for most (~90%) of its lifetime.
Charles HakesFort Lewis College 61
Figure 10.15Hipparcos H–R Diagram
Charles HakesFort Lewis College 62
Stars A and B formed at the same time. Star B has 3 times the mass of star A. Star A has an expected lifetime of 3 billion years. What is the expected lifetime of star B?
A) more than 9 billion years
B) about 9 billion years
C) 3 billion years
D) about 1 billion years
E) less than 1 billion years
Charles HakesFort Lewis College 63
Stars A and B formed at the same time. Star B has 3 times the mass of star A. Star A has an expected lifetime of 3 billion years. What is the expected lifetime of star B?
A) more than 9 billion years
B) about 9 billion years
C) 3 billion years
D) about 1 billion years
E) less than 1 billion years
Charles HakesFort Lewis College 64
Figure 10.21Stellar Masses
Charles HakesFort Lewis College 65
What forces a star like our Sun to evolve off the main sequence?
A) It loses all its neutrinos, so fusion must cease.
B) It completely runs out of hydrogen.
C) It builds up a core of inert helium.
D) It explodes as a violent nova.
E) It expels a planetary nebula to cool off and release radiation.
Charles HakesFort Lewis College 66
What forces a star like our Sun to evolve off the main sequence?
A) It loses all its neutrinos, so fusion must cease.
B) It completely runs out of hydrogen.
C) It builds up a core of inert helium.
D) It explodes as a violent nova.
E) It expels a planetary nebula to cool off and release radiation.
Charles HakesFort Lewis College 67
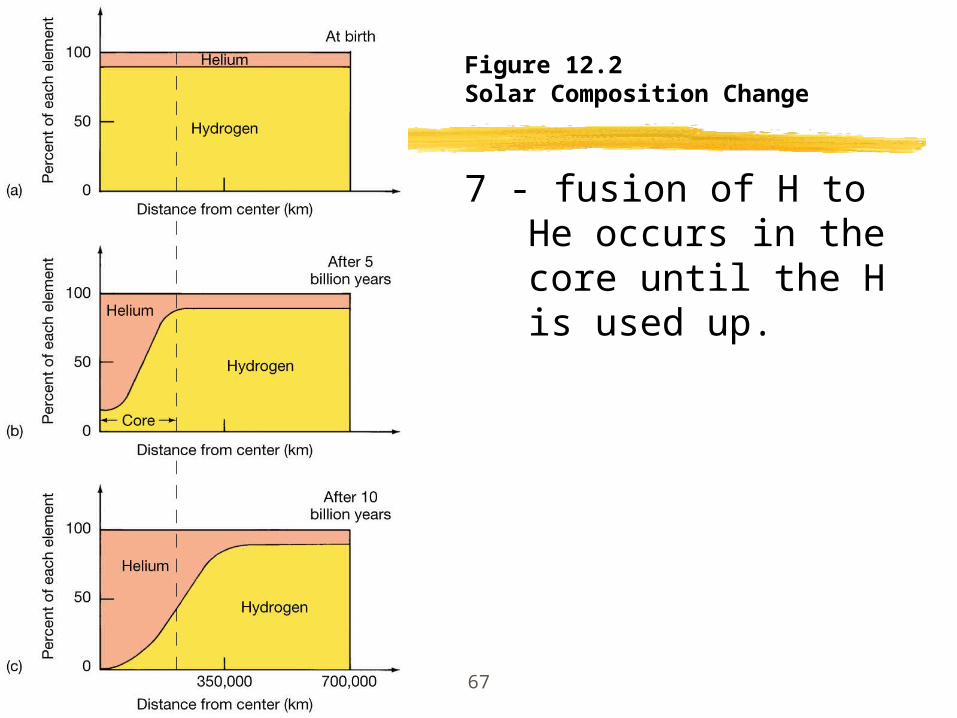
Figure 12.2Solar Composition Change
7 - fusion of H to He occurs in the core until the H is used up.

Charles HakesFort Lewis College 68
After hydrogen fusion stops in the core of a star, the core…
A) expands and cools
B) expands and heats
C) contracts and cools
D) contracts and heats
Charles HakesFort Lewis College 69
After hydrogen fusion stops in the core of a star, the core…
A) expands and cools
B) expands and heats
C) contracts and cools
D) contracts and heats

Charles HakesFort Lewis College 70
After hydrogen fusion stops in the core of a star, the star as a whole…
A) expands
B) contracts
Charles HakesFort Lewis College 71
After hydrogen fusion stops in the core of a star, the star as a whole…
A) expands
B) contracts

Charles HakesFort Lewis College 72
Figure 12.3Hydrogen Shell Burning
7 - fusion of H to He occurs in the core until the H is used up.
8 - the He core begins to shrink (and heat!), while the H-burning region moves out into a shell
Charles HakesFort Lewis College 73
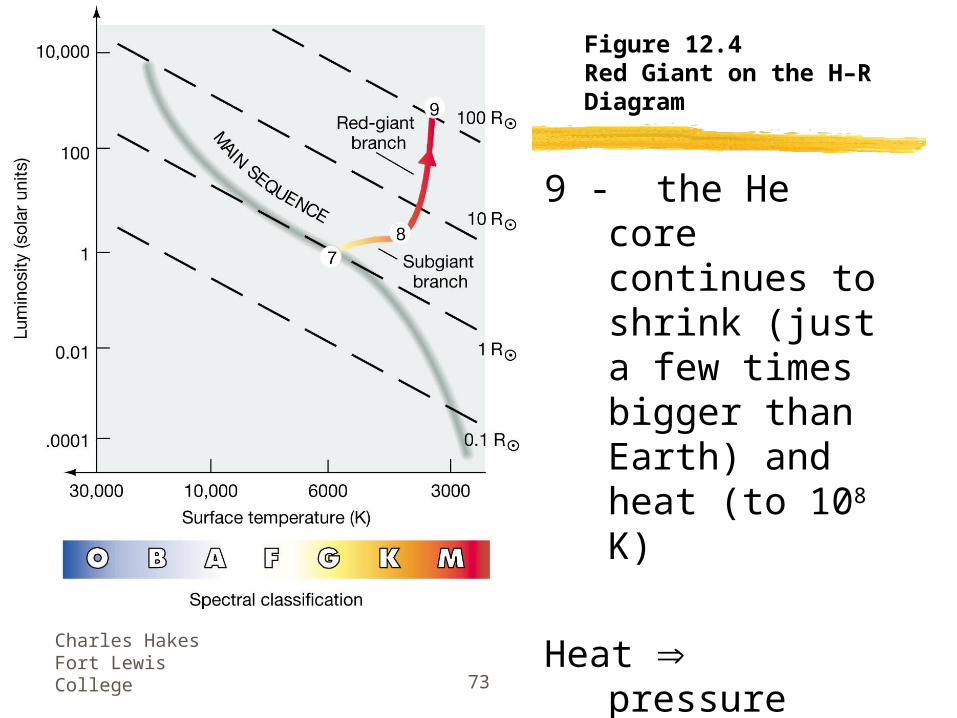
Figure 12.4Red Giant on the H–R Diagram
9 - the He core continues to shrink (just a few times bigger than Earth) and heat (to 108 K)
Heat pressure
demo

Charles HakesFort Lewis College 74
Figure 12.1Hydrostatic Equilibrium
Charles HakesFort Lewis College 75
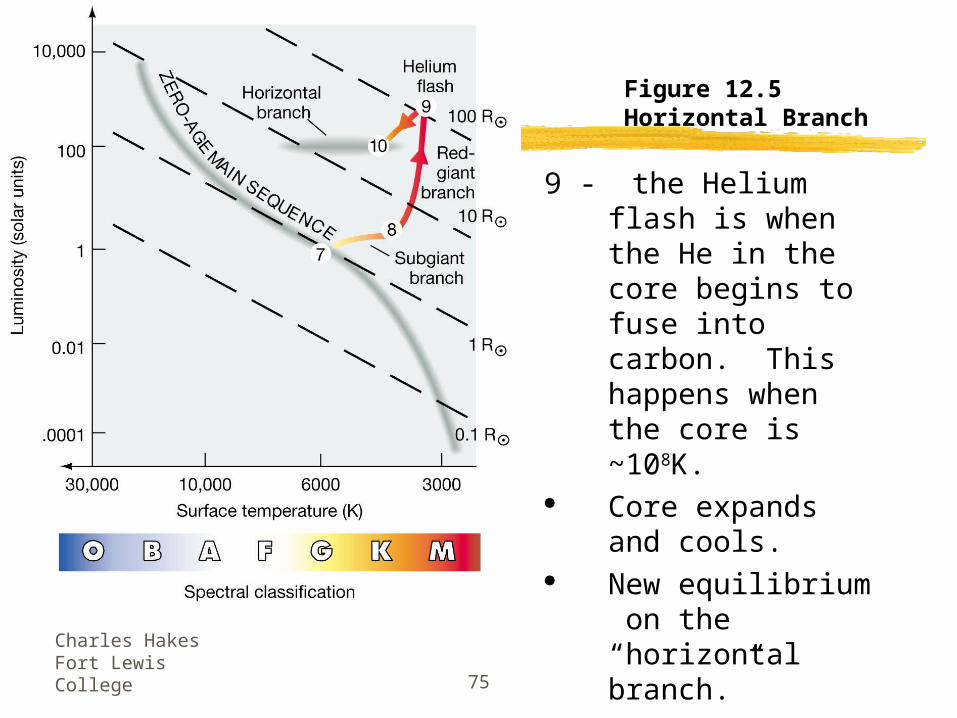
Figure 12.5Horizontal Branch
9 - the Helium flash is when the He in the core begins to fuse into carbon. This happens when the core is ~108K.
Core expands and cools.
New equilibrium on the “horizontal branch.”
10 - New equilibrium on the “horizontal branch.”

Charles HakesFort Lewis College 76
Figure 11.27bGlobular Cluster
Note the “horizontal branch”
Charles HakesFort Lewis College 77
Question
What happens when the He in the core is used up?
Charles HakesFort Lewis College 78
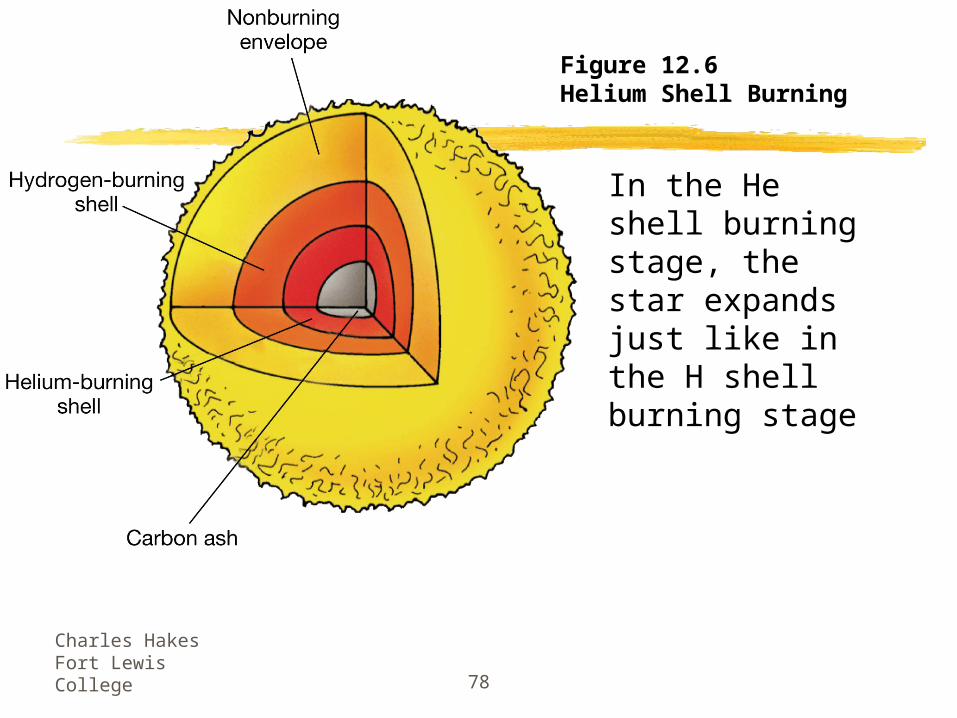
Figure 12.6Helium Shell Burning
In the He shell burning stage, the star expands just like in the H shell burning stage
Charles HakesFort Lewis College 79
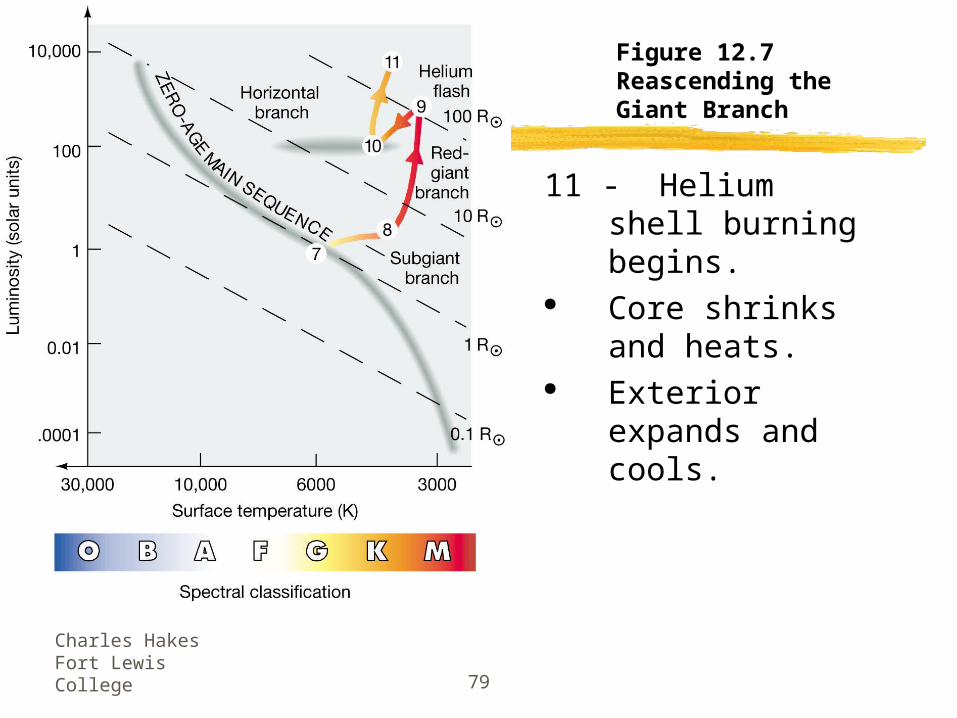
Figure 12.7Reascending the Giant Branch
11 - Helium shell burning begins.
Core shrinks and heats.
Exterior expands and cools.
Charles HakesFort Lewis College 80
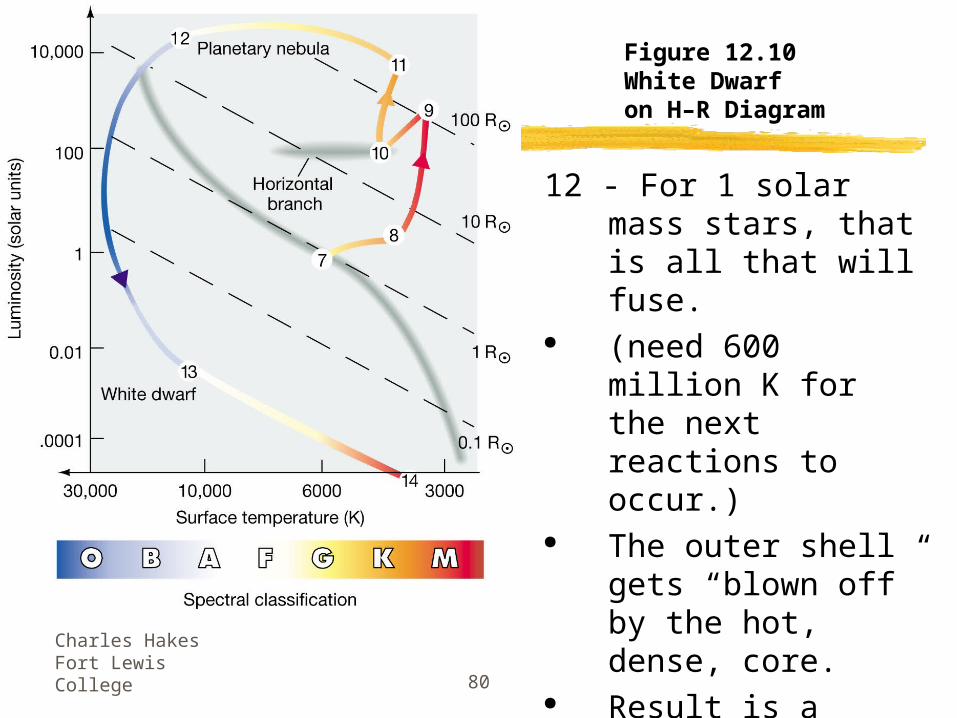
Figure 12.10White Dwarf on H–R Diagram
12 - For 1 solar mass stars, that is all that will fuse.
(need 600 million K for the next reactions to occur.)
The outer shell gets “blown off” by the hot, dense, core.
Result is a planetary nebula around a white dwarf (13).

Charles HakesFort Lewis College 81
Figure 12.9Planetary Nebulae
Charles HakesFort Lewis College 82
White Dwarf stage
Just the core of the star remains Very small - about the size of Earth Very dense - about half as massive as the
sun. Will eventually fade and become a black
dwarf (stage 14).
Charles HakesFort Lewis College 83
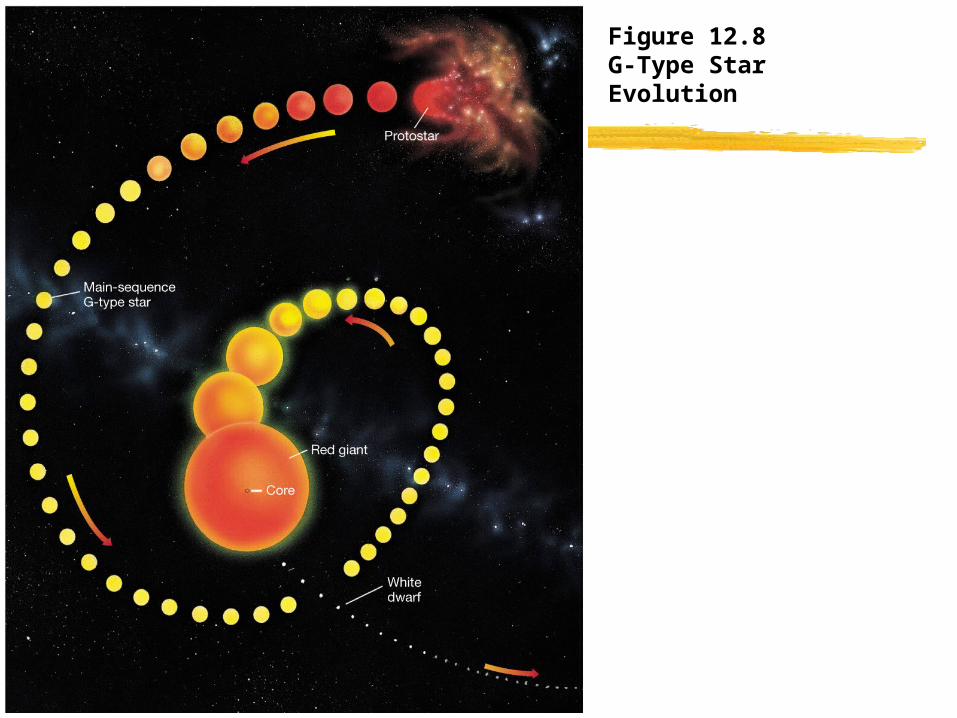
Figure 12.8G-Type Star Evolution
Charles HakesFort Lewis College 84
Three Minute Paper
• Write 1-3 sentences.• What was the most important thing
you learned today?• What questions do you still have
about today’s topics?
Charles HakesFort Lewis College 85
Earth Hour
• Saturday, March 27, 2010.• 8:30 P.M. • Turn off lights - save energy.• http://www.myearthhour.org/
Charles HakesFort Lewis College 86
How many Stars Can You See?• But who uses naked eye observing any more?• High quantum efficiency CCD cameras greatly
extend the depth of a telescope.• Image stacking lets you go even deeper.
• Depth scales linearly until star brightness is about the same as the background sky brightness.
• A dark sky on Earth is about magnitude 21/arcsec2.• For film, this would be about as deep as you could go.
• 16” SCT should reach magnitude 21.5 with a 5 minute exposure using SBIG full frame CCDs
• For deeper images, the signal only scales as the ~sqrt(time)