chauvin arnoux ca8335 user manual
TRANSCRIPT

C.A 8335 QUALISTAR PLUS
THREE-PHASE ELECTRICAL NETWORKS ANALYSER
Operating manual
ENGLISH

2
Thank you for purchasing this C.A 8335 energy analyser (Qualistar+) . To obtain the best service from your unit: Read these operating instructions carefully, Comply with the precautions for use.
Meaning of the symbols used on the unit:
CAUTION - DANGER! Read the User Manual
USB socket
The CE marking guarantees conformity with European directives and with regulations covering EMC.
Instrument fully protected by double insulation or reinforced insulation.
The rubbish bin with a line through it means that in the European Union, the product must undergo selective disposal for the recycling of electric and electronic material, in compliance with Directive WEEE 2002/96/EC.
PRECAUTIONS FOR USE
The precautions for use listed below are imperative when using the machine. Failure to comply with these instructions may lead to electric shocks, explosions or fire.
The operator will consult these instructions whenever the symbol is displayed. If you use this instrument in a way which is not specified, the protection which it provides may be compromised, putting
you in danger. When removing or inserting the battery and/or SD card, ensure that the measuring leads, sensors and mains power
are disconnected. The unit must be disconnected and powered down. The unit must not be used if the "battery/SD card" housing is absent, damaged or incorrectly fitted. The safety of any system incorporating this instrument is the responsibility of the system assembler. For your safety, only use the leads and suitable accessories delivered with the instrument: they comply with the norm
IEC 61010-031 (2002). When the sensors or accessories of lower voltage and/or category power to the unit, these lower voltages and/or categories become applicable to the entire set. Before using it, always check that the leads, boxes and accessories are in perfect condition. All leads, sensors or
accessories whose insulators are damaged (even partially) must be repaired or scrapped. Comply with environmental conditions (See para 4.4.3) It is advisable to use individual protective safety devices when the environment in which the unit is used require them. This unit must be used for category IV installations, for voltages that do not exceed 600 V (AC or DC) in relation to the
ground (according to IEC standard 61010-1) or for voltages that do not exceed 1000 V for category III installations. Never use voltage networks or categories and greater than those mentioned. Only use mains power blocs and battery packs supplied by the manufacturer. They have specific security mechanisms. Comply with the limits of the accessory or sensor safety mechanisms. Do not keep hands close to unused terminals. Certain current sensors cannot be inserted all removed from bare conductors under a dangerous voltage: see the
sensor’s manual and comply with handling instructions.
Use and connection procedures: Start the unit Configure the unit to obtain the required results and according to the type of network Connect the current leads and sensors to the unit Connect the ground and/or neutral lead to the network ground and/or neutral (when distributed) as well as the
corresponding current sensor Connect the L1 phase lead to the network L1 phase as well as the corresponding current sensor Repeat the procedure for phases L2, L3 and N
Note : complying with this procedure limits connection errors to a minimum and avoids wasting time.
Disconnection procedures: Proceed in the reverse order to connecting always finishing by disconnecting the ground and/or neutral (when
distributed) Disconnect the unit leads and power it down. Recharge the battery and recover the data registered where necessary. USB sockets can be used to connect the unit to any type of network and with battery recharge mains power supplies.

3
MEASUREMENT CATEGORIES
Definition of measurement categories according to the IEC standard 61010-1:
CAT I: Measurement category I corresponds to measurements taken on circuits not directly connected to the network.
CAT II: Measurement category II corresponds to measurements taken on circuits directly connected to the installation.
Example: measurement for electrodomestic units, portable tools and analogue devices
CAT III: Measurement category III corresponds to measurements on building installations. Example: measurement on distribution panels, cabling, etc.
CAT IV: Measurement category IV corresponds to measurements taken at the source of low-voltage installations Example: metering and measurements on overvoltage protection devices...
GUARANTEE
Our guarantee is applicable, unless otherwise stated, for three years following the date of supply of the equipment (extract from our General Sales Conditions, available on request).

CONTENTS
1. INTRODUCTION .................................................... 6 2. PACKAGING........................................... ............... 6 3. PRESENTATION ................................................... 7 3.1 Overview .............................................................. 7 3.2 On/Off key ............................................................ 7 3.3 Display screen...................................................... 7 3.4 Keypad keys......................................................... 8 3.5 Connectors........................................................... 9 3.6 Power ................................................................... 9 3.7 The stand ........................................................... 10 3.8 Summary of functions......................................... 10 3.9 Abbreviations...................................................... 10
4. CONFIGURATION KEY ........................ 12 4.1 Available sub-menus .......................................... 12 4.2 Display language................................................ 12 4.3 Date/Time..................................................... 12
4.4 Contrast/Brightness ...................................... 12 4.5 Colours ........................................................ 13 4.6 Calculation methods ................................... 13 4.7 Connection ................................................... 13 4.8 Current sensor......................................... 13
4.9 Trend mode............................................... 14 4.10 Alarm Mode .............................................. 15
4.11 Deleting data............................................... 16
4.12 Information................................................... 16
5. KEY WAVEFORM CAPTURE..................... 17 5.1 Available sub-modes .......................................... 17 5.2 Transient mode ......................................... 17 5.3 Inrush current mode.................................. 20
6. HARMONICS KEY ...................................... 24 6.1 Available sub-menus .......................................... 24 6.2 Single voltage ........................................ 24 6.3 Current ................................................... 26 6.4 Apparent power...................................... 27 6.5 Composite voltage .................................. 28 6.6 Expert mode .............................................. 29
7. WAVEFORM KEY....................................... 31 7.1 Available sub-menus .......................................... 31 7.2 Measurement of true effective value ........ 31 7.3 Measurement of total harmonic distortion33 7.4 Measurement of the peak factor ............ 34 7.5 Measurement of extreme and average voltage and current values ......................................... 36 7.6 Simultaneous display................................ 38 7.7 Display of Fresnel diagram...................... 39
8. ALARM MODE KEY.................................... 41
8.1 Available submenus............................................ 41 8.2 Alarm mode configuration........................ 41 8.3 Programming an alarm campaign ........... 42 8.4 Displaying alarm log ................................ 42 8.5 Deleting alarm log ................................... 43
9. TREND MODE KEY .................................... 44 9.1 Available sub-menus .......................................... 44 9.2 Programming and initiating recording...... 44 9.3 Trend mode configuration........................ 45 9.4 Displaying recording list........................... 46 9.5 Deleting recordings................................... 47
10. POWER AND ENERGY KEY ...................... 48 10.1 Available sub-menus .......................................... 48 10.2 Energy consumed .................................... 48 10.3 Energy generated..................................... 49 10.4 Start of energy metering.......................... 50 10.5 Stop of energy metering........................... 50 10.6 Zero resets of energy metering ............... 50
11. SCREEN SNAPSHOT KEY ........................... 51 11.1 Screen shots....................................................... 51 11.2 Handling of screen snapshots ............................ 51 12. HELP KEY.............................................. .............. 53 13. USE ...................................................................... 54 13.1 Start-up............................................................... 54 13.2 Configuration of the C.A 8335 ............................ 54 13.3 Installation of leads............................................. 55 13.4 Wave shape capture ................................... 55 13.5 Display of harmonics ................................... 55 13.6 Measuring wave shapes ............................. 55 13.7 Alarm detection ........................................... 56 13.8 Recording .................................................... 56 13.9 Measurement of energy .............................. 56 13.10 Transfer of data to the PC............................ 56 13.11 Deleting data ................................................ 56 13.12 Turning the C.A 8335 off .............................. 56 13.13 Supply of the C.A 8335 ................................ 56 14. MAINTENANCE ......................................... .......... 57 14.1 Important recommendation................................. 57 14.2 Battery recharge ................................................. 57 14.3 Cleaning the casing ............................................ 57 14.4 Replacing the screen film ................................... 57 14.5 Metrological verification ...................................... 57 14.6 Repairs ............................................................... 57 14.7 Updating of the internal software ........................ 57 14.8 Sensors .............................................................. 57 15. GENERAL SPECIFICATIONS ............................. 58 15.1 Casing ................................................................ 58 15.2 Power supply ...................................................... 58 15.3 Range for use ..................................................... 58 15.4 User safety ......................................................... 59

5
16. FUNCTIONAL CHARACTERISTICS ................... 60 16.1 Reference Conditions......................................... 60 16.2 Electrical characteristics..................................... 60 17. APPENDICES ...................................................... 67 17.1 Mathematical formulae ....................................... 67 17.2 Hysteresis........................................................... 69 17.3 Minimum scale values for waveforms and minimum RMS values ................................................ 70 17.4 Diagram of the 4 quadrants................................ 70 17.5 Mechanism for triggering transient sensors........ 71 17.6 Sensor conditions in Ringing Current mode. ...... 71 17.7 Glossary ............................................................. 72 18. TO ORDER........................................................... 73 18.1 C.A 8335 power analyser ................................... 73 18.2 Accessories ........................................................ 73 18.3 Spare parts......................................................... 73

6
1. INTRODUCTION
The C.A 8335 (Qualistar+) is a three-phase AC+DC 1000 VRMS category III or 600 VRMS category IV (IEC 61010-1) graphic display network analyser.
It has a triple role. It: measures electric distribution network values, powers
and disruptions provides an instant image of the main characteristics
of a triple phase network monitors variations i the different parameters over
time
The uncertainty of the CA 8335 is better than 1% (error due to current sensors not included). In addition, it provides great flexibility with a choice of different sensors to measure from hundreds of milliamps (MN93A) to several kiloamps (AmpFLEX™).
The unit is compact and shock resistant. The ergonomy and simplicity of its user interface make it easy and intuitive to use.
The CA8335 is aimed at technicians and engineers in installation and electric network control and maintenance teams.
The main measurements made are:
The values of alternative voltages up to 1000 V between terminals The values of alternative currents up to 6500 amps
(neutral included) Continuous value of voltages and currents (neutral
included)
Voltage and current minimal and maximal half-period values Peak values for voltages and current (neutral
included) Frequency of 50 Hz and 60 Hz networks Current and voltage peak factor (excluding neutral) Calculation of the K factor (KF) (application to
transformers in the presence of harmonic currents) Distortion factor (DF) for current and voltage
(excluding neutral) Global harmonics rate for current and voltage
(excluding neutral). Active, reactive (capacitive and inductive) and
apparent power by phase and cumulative (excluding neutral). Power factors (PF) and displacement power factors
(DPF) (excluding neutral). Short-term voltage flicker (PST) (excluding neutral). Active, reactive (capacitive and inductive) and
apparent (excluding neutral) energy. Harmonics and voltages (excluding neutral) up to 50:
RMS value, percentages in relation to fundamental, minimum and maximum and harmonics sequences. Harmonics for apparent power up to rank 50: value,
percentage in relation to the fundamental, minimum and maximum. Motor start-up currents
2. PACKAGING
Basic equipment
Designation Qty
Black banana-banana right-right security cables
5
Black crocodile clamps. 5
Operating manual on CD-ROM and miscellaneous documents
1
USB type A-B cord. 1
Specific 8-element battery (rechargeable NiMH) with a minimum capacity of 4000 mAh and nominal voltage of 9.6 V.
1
Special mains supply (600 VRMS category IV).
1
Carrying bag n°22 1
Slugs and rings to current identify leaves and sensors according to phase
12
Verification certificate 1
Safety record 1
Power Analyser Transfer (PAT) testing software
1
SD 2Gb SD memory card 1
Optional equipment
Designation
MN93, MN93A, C193 and PAC93 clips.
AmpFLEX™ A193 and Mini-AmpFLEX MA193 sensors.
Current sensors (6 models available)
Carrying bag no. 21
5A triphased adaptor box
Dataview program

7
3. PRESENTATION
3.1 Overview
1
8
Figure1: C.A 8335 (Qualistar+) general view
Item Function See para.
1 Measurement entry connectors
3.5.1
2 Display screen 3.3
3 Function keys (yellow keys)
3.4.1
4 Return key 3.4.2
5 Menu and configuration key
3.4.4
6 Print Screen key 3.4.3
7 Help key 3.4.4
8 On/Off switch 3.2
9 Mode keys (violet keys) 3.4.3
10 Navigation keys 3.4.2
11 Validation key 3.4.2
12 Connector to specific mains power box
3.5.2
13 USB connector 3.5.2
3.2 On/Off key
Pressing the key starts the unit.
The unit may operate either on battery only if it is sufficiently charged or if the battery is absent with a specific power supply.
Pressing the key turns off the unit. When it is turned off, a confirmation is required if the unit is saving, searching, displaying an alarm and/or acquiring an engine start-up.
3.3 Display screen
3.3.1 Presentation
This backlit 320x240 pixel graphic liquid crystal display shows measurement values associated with the curves, the unit parameters, the selection of curves, instant signal values and selects the type of measurement. When it starts, the C.A 8335 displays the Waveform screen automatically. Information on this screen can be found chapter 7, page 31. 1 2 3 4
EV
Figure2: example of a display screen
Item Description
1 Reminder of the mode activated by mode keys (See para 3.4 .3).
2 Active mode screen
3 Current date and time.
4 Battery charge level.
Automatic standby: Automatic standby is activated when an alarm the campaign or recording campaign (awaiting or in progress) is launched after five minutes of key inactivity. Pressing any key activates the unit.
2
314
5
6
7
13
12
11
10
9
8
< >
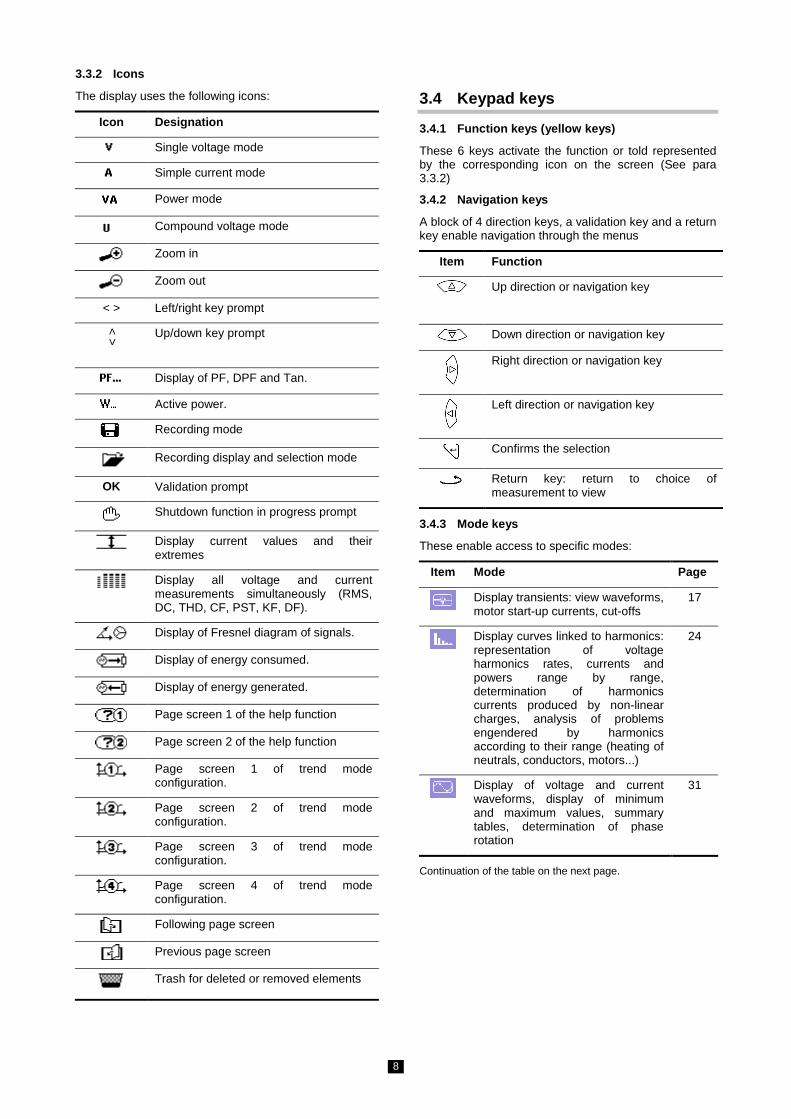
3.3.2 Icons
The display uses the following icons:
Icon Designation
Single voltage mode
Simple current mode
Power mode
Compound voltage mode
Zoom in
Zoom out
< > Left/right key prompt
Up/down key prompt
Display of PF, DPF and Tan.
Active power.
Recording mode
Recording display and selection mode
OK Validation prompt
Shutdown function in progress prompt
Display current values and their extremes
Display all voltage and current measurements simultaneously (RMS, DC, THD, CF, PST, KF, DF).
Display of Fresnel diagram of signals.
Display of energy consumed.
Display of energy generated.
Page screen 1 of the help function
Page screen 2 of the help function
Page screen 1 of trend mode configuration.
Page screen 2 of trend mode configuration.
Page screen 3 of trend mode configuration.
Page screen 4 of trend mode configuration.
Following page screen
Previous page screen
Trash for deleted or removed elements
3.4 Keypad keys
3.4.1 Function keys (yellow keys)
These 6 keys activate the function or told represented by the corresponding icon on the screen (See para 3.3.2)
3.4.2 Navigation keys
A block of 4 direction keys, a validation key and a return key enable navigation through the menus
Item Function
Up direction or navigation key
Down direction or navigation key
Right direction or navigation key
Left direction or navigation key
Confirms the selection
Return key: return to choice of measurement to view
3.4.3 Mode keys
These enable access to specific modes:
Item Mode Page
Display transients: view waveforms, motor start-up currents, cut-offs
17
Display curves linked to harmonics: representation of voltage harmonics rates, currents and powers range by range, determination of harmonics currents produced by non-linear charges, analysis of problems engendered by harmonics according to their range (heating of neutrals, conductors, motors...)
24
Display of voltage and current waveforms, display of minimum and maximum values, summary tables, determination of phase rotation
31
Continuation of the table on the next page.

9
Viewing alarms: list of alarms recorded according to thresholds programmed during configurations, a recording of network cutouts with half-period resolution (VRMS, ARMS, URMS), determination of energy over-consumption, control of compliance with energy supply quality contract.
41
Trend mode: recording of paralysis selected in the Configuration menu
43
Display measurements linked to powers and energies
48
Screen capture in progress and access to already memorised screens
51
3.4.4 Other keys
The other keys have the following functions:
Item Function Page
Menu and configuration key 12
Help key: provides information on the functions and symbols used for the current mode
53
3.5 Connectors
3.5.1 Measurement entry connectors
Located in the upper section, these connectors are distributed as follows:
1 2
Figure3: upper connectors
Item Function
1 4 current input connectors for amperemetric senses (MN clamp, C clamp, AmpFLEX™, PAC clamp, etc.).
2 5 voltage input connectors
3.5.2 Side connectors
Located on the right side of the CA 8335, these connectors are used as follows:
Figure 4 : the connectors on the right side
Item Function
1 USB connector. This connector links the unit up with a PC
2 Connected to the mains power box, it charges the battery and enables operation with or without a battery.
3.6 Power
3.6.1 Indication of battery level
The battery icon located in the upper right of the screen shows the battery level. The number of bars in the icon shows the battery level
Icon Charge status
Battery charged
Low battery
Mobile bars: battery charging
The C.A 8335 is powered by the mains and pre-charged.
When the capacity of the battery is too low, the following message is displayed:
Batt
Press to confirm. If you do not reconnect the CA8335 to the mains, one minute after this message.
3.6.2 Battery life
Battery life is 10 hours when the battery delivered with the unit is completely charged. If no recording is in progress, battery life is then 35 hours stop
3.6.3 Battery recharge
See also paragraph 14.2, page 57. The battery recharged using the mains supply delivered with the unit. It connects to the CA8335 by the jack socket (Figure 4, item 2).
1
2
10
Only not use the mains supply provided with the unit. This supplier is specific and maintains electric safety. For completely empty accumulators, the charge last about five hours. As soon as the battery is recharged, the unit uses the mains sector prior without discharging the battery.
3.6.4 Changing the battery
Disconnect the CA8335 from the mains supply and the network measured to change the battery. The unit must have no connection. The Qualistar+ maintains the date and time for about 24 hours.
3.6.5 The battery
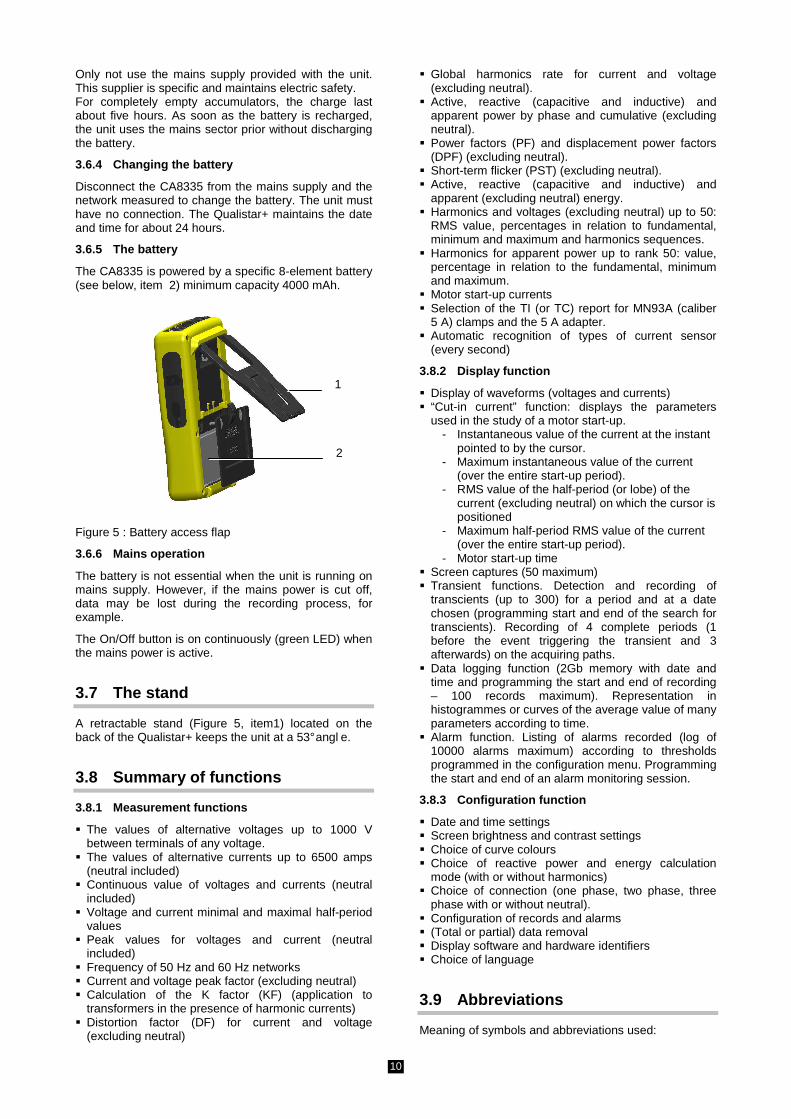
The CA8335 is powered by a specific 8-element battery (see below, item 2) minimum capacity 4000 mAh.
Figure 5 : Battery access flap
3.6.6 Mains operation
The battery is not essential when the unit is running on mains supply. However, if the mains power is cut off, data may be lost during the recording process, for example.
The On/Off button is on continuously (green LED) when the mains power is active.
3.7 The stand
A retractable stand (Figure 5, item1) located on the back of the Qualistar+ keeps the unit at a 53° angl e.
3.8 Summary of functions
3.8.1 Measurement functions
The values of alternative voltages up to 1000 V between terminals of any voltage. The values of alternative currents up to 6500 amps
(neutral included) Continuous value of voltages and currents (neutral
included) Voltage and current minimal and maximal half-period
values Peak values for voltages and current (neutral
included) Frequency of 50 Hz and 60 Hz networks Current and voltage peak factor (excluding neutral) Calculation of the K factor (KF) (application to
transformers in the presence of harmonic currents) Distortion factor (DF) for current and voltage
(excluding neutral)
Global harmonics rate for current and voltage (excluding neutral). Active, reactive (capacitive and inductive) and
apparent power by phase and cumulative (excluding neutral). Power factors (PF) and displacement power factors
(DPF) (excluding neutral). Short-term flicker (PST) (excluding neutral). Active, reactive (capacitive and inductive) and
apparent (excluding neutral) energy. Harmonics and voltages (excluding neutral) up to 50:
RMS value, percentages in relation to fundamental, minimum and maximum and harmonics sequences. Harmonics for apparent power up to rank 50: value,
percentage in relation to the fundamental, minimum and maximum. Motor start-up currents Selection of the TI (or TC) report for MN93A (caliber
5 A) clamps and the 5 A adapter. Automatic recognition of types of current sensor
(every second)
3.8.2 Display function
Display of waveforms (voltages and currents) “Cut-in current” function: displays the parameters
used in the study of a motor start-up. - Instantaneous value of the current at the instant
pointed to by the cursor. - Maximum instantaneous value of the current
(over the entire start-up period). - RMS value of the half-period (or lobe) of the
current (excluding neutral) on which the cursor is positioned
- Maximum half-period RMS value of the current (over the entire start-up period).
- Motor start-up time Screen captures (50 maximum) Transient functions. Detection and recording of
transcients (up to 300) for a period and at a date chosen (programming start and end of the search for transcients). Recording of 4 complete periods (1 before the event triggering the transient and 3 afterwards) on the acquiring paths. Data logging function (2Gb memory with date and
time and programming the start and end of recording – 100 records maximum). Representation in histogrammes or curves of the average value of many parameters according to time. Alarm function. Listing of alarms recorded (log of
10000 alarms maximum) according to thresholds programmed in the configuration menu. Programming the start and end of an alarm monitoring session.
3.8.3 Configuration function
Date and time settings Screen brightness and contrast settings Choice of curve colours Choice of reactive power and energy calculation
mode (with or without harmonics) Choice of connection (one phase, two phase, three
phase with or without neutral). Configuration of records and alarms (Total or partial) data removal Display software and hardware identifiers Choice of language
3.9 Abbreviations
Meaning of symbols and abbreviations used:
1
2

11
Unit Designation
Alternative and continuous components
Alternative component alone
= Continous component alone
φφφφ Phase shift of single voltage in relation to single current
Inductive phase shift.
Capacitive phase shift.
° Degree
-,+ Expert mode
−−−−−−−−−−−−−−−−ΣΣΣΣ
Sum of the values
L Phases (Line)
% Percentage
A Intensity in amps
Acf Crest factor of current.
Ah Current harmonic
Akf Factor K (for transformers).
Arms True effective current
Athd Full harmonic distortion of current.
Aunb Current imbalance (2φ, 3φ).
AVG True RMS value calculated on one second.
CF Peak factor (current or voltage)
DC Continuous component (current or voltage)
DPF Displacement factor.
Hz Frequency of network studied
KF See Akf.
MAX Maximum RMS value
MIN Minimum RMS value
ms Value in thousandth of a second
PEAK Signal maximum (+) or minimum (-) peak value
PF Power factor.
PST Short-term flicker.
RMS True effective value (current or voltage)
t Time factor
Tan Tangent.
THD Total harmonic distortion.
Ucf Compound voltage peak factor
Uh Compound voltage harmonic
Urms True effective compound voltage
Uthd Total compound voltage harmonic distortion
Uunb Compound voltage imbalance (2φ, 3φ).
V Voltage
VA Apparent power (total if 3φ)
VAh Apparent energy
VAR Reactive power.
VARh Reactive energy
Vcf Voltage peak factor (compound if 3φ).
Vrms True effective phase voltage
Vthd Full harmonic distortion of line-to-neutral voltage.
Vunb Voltage imbalance (2φ, 3φ).
W Active power (total if 3φ)
Wh Active energy

12
4. CONFIGURATION KEY
This key configures the CA 8335. The unit should be configured before using it and whenever necessary. The configuration stays in memory even when the unit is stopped.
4.1 Available sub-menus
Select the sub-menu with the keys and confirm by pressing on .
To return to the main screen, press .
SU00
Figure 6 : the screen displays sub-menus
Name Sub-menu See para.
Date/Time Date and time settings 4.3
Contrast Brightness
Screen brightness and contrast settings
4.4
Colours Definition of voltage curve and current curve colours
4.5
Calculation method
Choice of reactive parameters (with or without harmonics)
4.6
Connection Choice of typeof connection to the network (attention: certain calculations depend of the connection).
4.7
Current sensor Choice of sensors (clamp MN, C, PAC, AmpFlex™, adapter).
4.8
Trend mode Choice of paramters to record for .
4.9
Alarm Mode Definition of alarms used by .
4.10
Deleting data Choice to total or partially remove user data
4.11
Information Serial number, software and hardware versions
4.12
4.2 Display language
To select the display language, press the yellow key corresponding to the screen icons (Figure 6, item1). The active language is identified by the icon on the yellow background.
4.3 Date/Time
This parameter defines the system date and time. The display is as follows:
SUDT
Figure 7: Date/Time menu
The Date/Time field is underlined in yellow To change the date/time, press . The arrows
show the value that can be changed. To change a value, press or . To move from one field to another, press . To confirm, press .
To modify the dating system, position the yellow cursor on the field with keys or . Press . The arrows show the value that can be changed. Select DD/MM/YY or MM/DD/YY, press then confirm by pressing .
To modify the dating system, position the yellow cursor on the field with keys or been confirmed by pressing .. The arrows show the value that can be changed. To select the 12-hour or 24-hour clock 12/24 press
then confirm by pressing .
Note : 12/24 : display the time in 24-hour format.
AM/PM: display the time in 12-hour format. The time is followed by AM or PM.
To return to the Configuration menu, press .
4.4 Contrast/Brightness
Defines the contrast and brightness of the display. The display is as follows:
1

13
SU
Figure 8: the Contrast/Brightness menu
The selected field is highlighted in yellow. To modify the contrast, press .
To move to the next field, press .
To change the brightness, press .
To return to the Configuration menu, press .
4.5 Colours
Defines the colour of the voltage and current curves accessible with the , and keys. The
colours available are: green, dark green, yellow, pink, red, brown, blue, turquoise blue, dark blue, light grey, grey, dark grey and black.
The display is as follows:
SUCOL
Figure 9: the Colours menu
The selected field is highlighted in yellow. To select the colour of the voltage and current curves,
press .
To move to the next field, press . To select the curve colour, press .
To return to the Configuration menu, press .
4.6 Calculation methods
Defines the use or non-use of harmonics in calculating reactive parameters (powers and energies).
SUCM
Figure 10: the Calculation methods menu
To select With harmonics or Without harmonics, press .
- With harmonics: harmonics are taken into account when calculating reactive parameters.
- Without harmonics: only the fundamental is part of the calculation of reactive parameters
To confirm, press . Return to the Configuration menu is immediate.
4.7 Connection
Defines how the CA8335 connects depending on the type of network.
SUB
Figure 11: the Connection menu
To configure the type of connection, proceed as follows:
1. Select One Phase, Two Phase, 3 or 4 lead Three Phase or 5 lead Three Phase by pressing and
.
2. Validate by pressing (this validation is compulsory for the configuration application). Return to the Configuration menu is immediate.
4.8 Current sensor
Automatically displays the current sensor model connected.

14
SUCC
Figure 12: Current sensor menu
The possibilities are: Clamp MN93: 200A. Clamp MN93A: 100 A or 5 A. Clamp C193: 1000 A. Clamp PAC93: 1000 A AmpFLEX™ A193: 6500 A. Mini-AmpFLEX MA193:
6500 A. Three phase adapter: 5 A.
Caution: if a Clamp MN93A calibre 5 A or an Adapter is used, it is configured as follows:
Definition of the transformation ratio.
- For a 5A clamp: to configure the primary circuit current transformation ratio (1 A to 2999 A)/secondary circuit current (1 A or 5 A), press
. To select the fields, use the keys. To select the values, use the keys. Proceed in the same manner for primary and secondary circuit currents.
- Adapter: to configure the primary circuit current transformation ratio (1 A to 2999 A)/secondary circuit current (1 A or 5 A), press . To select the fields, use the keys. To select the values, use the keys. Proceed in the same manner for primary and secondary circuit currents.
To validate, press (this validation is compulsory for the configuration application).
To return to the Configuration menu, press .
4.9 Trend mode
The C.A 8335 has a recording function – key- (see chapter 9, page 44) for recording measured and calculated values (Urms, Vrms, Arms, etc.). For independent configurations may be set up depending on need.
To select the display language, press the yellow key corresponding to the icônes , , , icons (Figure 13, item1). The active configuration is identified by the icon on the yellow background. A configuration example is shown below:
SUMT
Figure 13: In this example, the Urms values are recorded for configuration 1
To define configuration 1, press the yellow key on the keypad corresponding to the icon . The icon appears on a yellow background.
To select the values, move the yellow cursor with the and keys. Press to validate. The red
item confirms validation.
The recordable values are:
Unit Designation
Urms Efficient line voltage (2φ, 3φ).
Vrms Efficient line-to-neutral voltage.
Arms Efficient current.
W Active power.
PF Power factor.
Uthd Harmonic distortion of line voltage (2φ, 3φ).
Vthd Full harmonic distortion of line-to-neutral voltage.
Athd Full harmonic distortion of current.
VAR Reactive power.
DPF Displacement factor.
Ucf Crest factor of line voltage (2φ, 3φ).
Vcf Crest factor of line-to-neutral voltage.
Acf Crest factor of current.
VA Apparent power.
Tan Tangent.
Vunb Line voltage unbalance (2φ, 3φ).
Aunb Current unbalance (2φ, 3φ).
Hz Network frequency.
PST Short-term flicker.
KF K factor.
? See comment herebelow.
1

15
Specific features for the last two lines These are set out below:
Figure 14: These two lines involve harmonics
These two lines involve the recording of VAh, Ah, Vh and Uh variable harmonics. You can select the ranks of harmonics to be recorded (between 0 and 50) for each of these harmonics and possibly only odd harmonics within this range. Perform the following:
To enter the value to be recorded: Line is highlighted in yellow. Press . Arrows appear. Select the value (VAh, Ah, Vh and Uh) for which harmonics shall be recorded via . The red item shows your selection. Confirm by pressing . The values field is highlighted in yellow.
Press to switch to the following field.
To select the starting harmonic range : the line is underlined in yellow, press . Arrows appear. Select the rank from which harmonics shall be recorded via , then validate via .
Press to switch to the following field.
To select the last harmonic : The second field (above or equal to the start harmonic rank) is highlighted in yellow. Press . Select the last harmonic rank to be recorded via , then validate via .
Press to switch to the following field.
Odd harmonics only: to select or deselect a field, press The red item shows your selection:
- selected, only odd harmonics between the two ranks of harmonics specified in the previous points shall be recorded.
- Not selected, all harmonics (even and odd) between the two ranks of harmonics specified in the previous points shall be recorded.
To return to the Configuration menu, press .
Proceed in the same manner to defined the other configurations.
4.10 Alarm Mode
This screen defines alarms used by the Alarm Mode (see chapter 8, page 41). You can configure 40
types of alarm.
SUMA00
1 2
Figure 15: the Alarm menu
Use keys to browse vertically in fields.
To select the field, press . Arrows appear.
To select the values (Vah, Ah, Uh, etc. See table in paragraph 4.9), press then confirm with . The field is highlighted in yellow.
To navigate horizontally in the fields, use the keys then confirm pressing . Arrows appear. Enter the values then confirm pressing . Do the same for all values to be entered in fields.
For each alarm to define, select:
- The type of alarm (Vah, Ah, Uh, Vh, Tan, PF, DPF, VA, VAR, W, Athd, Uthd, Vthd, KF, Hz, Aunb, Vunb, Vrms, Acf, Ucf, Vcf, PST, Arms Urms and Vrms – see the table of abbreviations in paragraph 3.9).
- The harmonics range (between zero and 50 for Vah, Ah, Uh and Vh).
- The alarm filter (3L: 3 individually monitored phases or N: monitoring neutral or Sigma/2 or Sigma/3 or Sigma).
- The meaning of the alarm (> or < for Arms, Urms, Vrms, Hz only, otherwise the direction is unique).
- The threshold for triggering the alarm (setting of the alarm to 10 possible in the following cases: W, VAR and VA).
- The minimum duration for exceeding the alarm validation threshold (in minutes, seconds or only for Vrms, Urms and Arms in hundredths of seconds).
- The hysteresis value (corresponds to the percentage added or taken away from the alarm threshold chosen that will stop the alarm in the event of overrun - Value 1, 2, 5 or 10% - See para 17.2).
- Activating the alarm (read item) or deactivating it (see below).
To activate the configured alarm, position the yellow cursor on the first column of the list using the key (Figure 15, item 1) and press . Activation is marked by the red item The alarm can be triggered.
To display in the alarm screen pages, press the yellow buttons corresponding to the icons (Figure 15, item2).

16
To return to the Configuration menu, press .
4.11 Deleting data
Partially or totally deletes the data recorded in the unit (configurations, transients, motor startup, alarms and detected, screen captures, records)
SUEM
Figure 16: Deleting data menu
To delete partially:
1. Select the parameters that you want to delete pressing the keys. The selected field is highlighted in yellow.
2. Confirm the selection by pressing . The red item confirms validation.
Note : If the Configuration parameter is selected, the "after deleting the configuration, the unit will be turned off" information appears on the screen
3. Press the yellow button on the keypad (Figure 16, item1) corresponding to the icon , then press
to confirm. The deletion has been completed.
To return to the Configuration menu, press .
To delete all:
1. To select all parameters, press the yellow key on the keypad corresponding to the icon . The selection is identified with the red item The "after deleting the configuration, the unit will be turned off" information is displayed.
Note : If the Configuration parameter is selected, the "after deleting the configuration, the unit will be turned off" information appears on the screen
2. Press the yellow button on the keypad (Figure 16, item1) corresponding to the icon , then press
to confirm. The deletion has been completed.
To untick the selection 1, press the yellow key on the keypad corresponding to the icon .
To return to the Configuration menu, press .
4.12 Information
This screen displays the unit serial number, the firmware version, the loader version, the basic card version, the CPLD (Complex Programmable Logic Device) version.
SUA
Figure 17: the Information menu
To return to the Configuration menu, press .
1

17
5. KEY WAVEFORM CAPTURE
This mode enables the current's transients and waveforms to be displayed and recorded.
5.1 Available sub-modes
The sub-modes are listed in the screen below and covered individually in the following paragraphs.
WFC00
Figure 18: the screen when the Waveform Capture mode is entered
Item Sub-menu See para.
1 Transient mode. 5.2
2 Inrush current mode. 5.3
To enter the sub-modes, proceed as follows:
1. Select the mode by using the keys. The selected field is highlighted in yellow.
2. Confirm by pressing .
To return to the Waveform capture screen, press .
5.2 Transient mode
This mode enables transients to be recorded, the list of recorded transients to be viewed, and if necessary these transients to be deleted. All tracks are stored in memory for each transient (regardless of the connection configuration). You can record up to 300 transients.
Note : when Transient mode is started the displayed screen will depend on the following conditions:
If … then …
no record has been made
the Programming a search screen is displayed.
transients have been recorded
the List of transients screen is displayed.
1 2 3 4 5
WFC01
6 7 8
Figure 19: the Programming a search screen in Transient mode.
Item Function
1 Reminder of the mode used
2 Display of sub-mode used.
3 Memory indicator. The black bar shows used memory; the white bar shows available memory.
4 Current date and time.
5 Battery charge level.
6 Display of the list of transients (See para 5.2.2).
7 Programming a search (See para 5.2.1).
5 OK: confirm programming of a search.
: delete a transient. This icon is displayed if a record has been made (See para 5.2.3).
5.2.1 Programming and starting a search
To program the search for a transient, proceed as follows:
Select the submenu by pressing the icon’s yellow key. The Programming a search screen is displayed.
1
2

18
1 2 3 4
WFC02
Figure 20: the Programming a search screen (in this example the search has been started)
Item Function
1 Reminder of the mode used
2 Display of sub-mode used.
3 Flashing icon: indicates that the search has been started.
4 Memory indicator. The black bar shows used memory; the white bar shows available memory.
5 Transients search start and end times
6 Adjustment of voltage and current activation thresholds (1%, 2%, 5%, 10%, 20%, 50%, 100% - see also paragraph 17.5).
7 Choice of number and name of transients.
8 Icon is displayed when programming starts.
5.2.1.1 STAGE 1: configuration of characteristics
Perform the following:
1. Select the Start field via . The selected field is highlighted in yellow. Press to enter the type of values. The arrows appear in the date and time field of the programming campaign start.
Press to increment or decrement a value and press to switch to the following data.
Note : The start timestamp must exceed present timestamp.
2. Press to validate the programming of Start date and time.
3. Select the End field via keys. The selected field is highlighted in yellow. Press to enter the type of values. The arrows appear in the date and time field of the programming campaign end.
Press to increment or decrement a value and press to switch to the following data.
Note : The end timestamp must exceed start timestamp.
4. Press to validate the programming of End date and time.
5. Select the Voltage threshold field using the keys. Press to enter the type of values. Arrows
appear. Choose the value with the keys and then confirm by pressing .
Proceed in the same way for the Current threshold , Number and Series name fields.
5.2.1.2 STAGE 2: start of programming
To start programming a search between the start and end times which you have defined press the yellow keypad key for the OK icon.
The OK icon disappears and the icon appears instead.
The message Search pending is displayed until the start time is reached and the icon flashes in the screen's upper display bar.
When the start time is reached the message Search pending is displayed.
When the end time is reached the screen Programming a search with the OK icon (bottom right-hand of screen) is displayed again. It is then possible to program a new search.
Note : transients are recorded in relation to the voltage and/or the current in accordance with the configured activation thresholds. If an activation occurs in relation to the current a record of the current waveform and voltage is made.
To return to the Waveform capture screen, press .
5.2.1.3 Voluntary alarm campaign stop
The search can be stopped deliberately before the end time and date stamp by pressing the yellow keypad key for the icon (bottom right of screen). The OK icon shall then reappear in the same place.
5.2.2 Displaying a transient
To display the recorded transients proceed as follows:
1. Select the submenu by pressing the icon’s yellow key. The List of transients screen is displayed.
5
6
7
8
19
1 2 3
WFC03
4 5
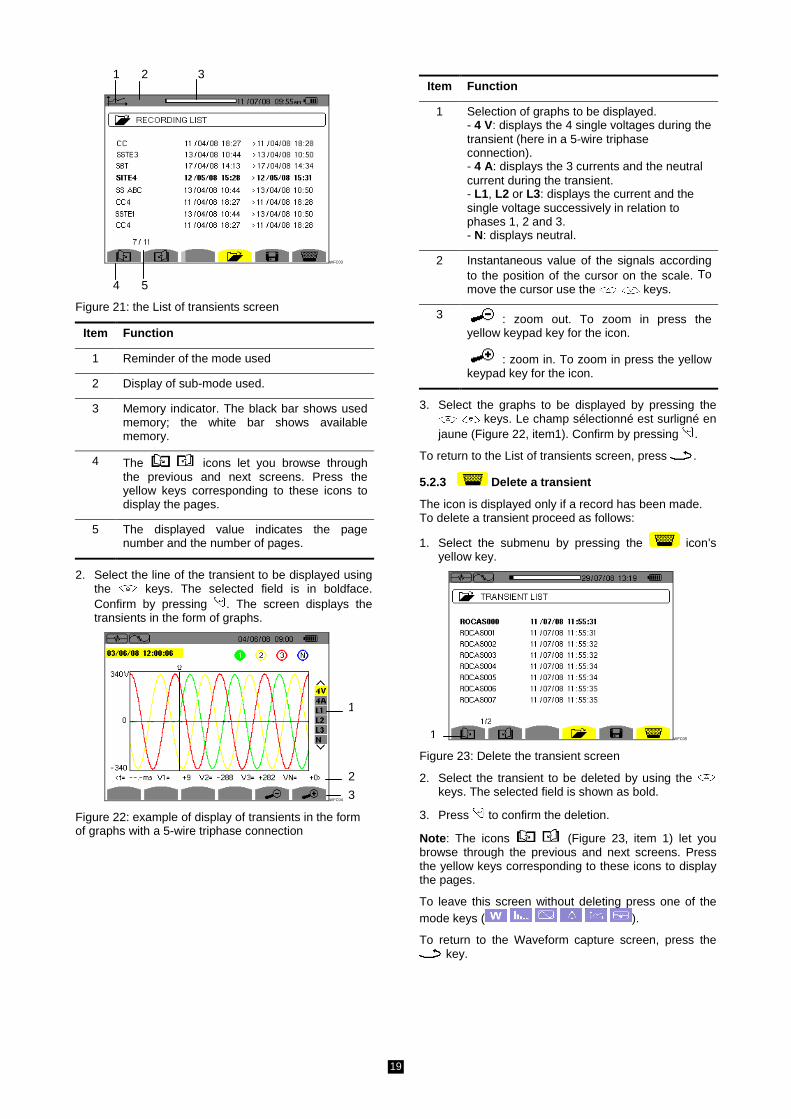
Figure 21: the List of transients screen
Item Function
1 Reminder of the mode used
2 Display of sub-mode used.
3 Memory indicator. The black bar shows used memory; the white bar shows available memory.
4 The icons let you browse through the previous and next screens. Press the yellow keys corresponding to these icons to display the pages.
5 The displayed value indicates the page number and the number of pages.
2. Select the line of the transient to be displayed using the keys. The selected field is in boldface. Confirm by pressing . The screen displays the transients in the form of graphs.
WFC04
Figure 22: example of display of transients in the form of graphs with a 5-wire triphase connection
Item Function
1 Selection of graphs to be displayed. - 4 V: displays the 4 single voltages during the transient (here in a 5-wire triphase connection). - 4 A: displays the 3 currents and the neutral current during the transient. - L1, L2 or L3: displays the current and the single voltage successively in relation to phases 1, 2 and 3. - N: displays neutral.
2 Instantaneous value of the signals according to the position of the cursor on the scale. To move the cursor use the keys.
3 : zoom out. To zoom in press the yellow keypad key for the icon.
: zoom in. To zoom in press the yellow keypad key for the icon.
3. Select the graphs to be displayed by pressing the keys. Le champ sélectionné est surligné en
jaune (Figure 22, item1). Confirm by pressing .
To return to the List of transients screen, press .
5.2.3 Delete a transient
The icon is displayed only if a record has been made. To delete a transient proceed as follows:
1. Select the submenu by pressing the icon’s yellow key.
WFC05
Figure 23: Delete the transient screen
2. Select the transient to be deleted by using the keys. The selected field is shown as bold.
3. Press to confirm the deletion.
Note : The icons (Figure 23, item 1) let you browse through the previous and next screens. Press the yellow keys corresponding to these icons to display the pages.
To leave this screen without deleting press one of the mode keys ( ).
To return to the Waveform capture screen, press the key.
1
2
3
1

20
5.3 Inrush current mode
This mode enables the waveform of the current to be recorded, and the capture made to be displayed and deleted. In capture display mode, two sub-menus, and , are available (See para 5.3.2). The C.A 8335 keeps in memory only a single current waveform capture.
Note : when Inrush current mode is started the displayed screen will depend on the following conditions:
If … then …
no capture has been made
the Programming the capture screen is displayed.
a capture has been made
the Characteristics of the capture screen is displayed.
5.3.1 Programming the capture
To program the capture of the current's waveform proceed as follows:
Select the submenu by pressing the icon’s yellow key. The Programming the capture screen is displayed.
1 2 3 4
WFI00
5 6 7
Figure 24: the Programming the capture screen in Inrush current mode
Item Function
1 Reminder of the mode used
2 Display of sub-mode used.
3 Current date and time.
4 Battery charge level.
5 Display of the characteristics of the capture (See para 5.3.2).
6 Programming of the capture (See para 5.3.1).
7 OK: confirm programming of a capture.
: delete a capture. This icon is displayed if a capture has been made (See para 5.2.3).
5.3.1.1 STAGE 1: configuration of characteristics
Perform the following:
1. Select the Activation threshold field using the keys. The selected field is highlighted in yellow. Press to enter the type of values. The arrows appear in the Activation threshold field.
Press to increment or decrement a value and press to switch to the following data.
2. Press to confirm programming of the activation threshold.
Proceed in the same manner for the Activation filter , Hysteresis and Start fields.
Note : for more information on the hysteresis, refer to section 17.2.
5.3.1.2 STAGE 2: starting the capture
To start programming the capture at the start date and time you have defined press the yellow keypad key for the OK icon.
The OK icon disappears and the icon appears instead.
The message capture pending is displayed until the start time is reached and the icon flashes in the screen's upper display bar.
When the activation conditions are met and the start time is reached, the message Capture pending is displayed and the memory occupation indicator appears in the upper part of the screen as follows:
The indicator is displayed only during the capture, and then disappears when the capture is completed.
If the capture is completed with a stop event (see conditions in paragraph 17.6) or if the recording memory of the C.A 8335 is full, the capture stops automatically. The screen Programming the capture with the OK icon (bottom right of screen) is displayed again.
Note : the C.A 8335 can keep in memory only a single current waveform capture. If you wish to make another capture firstly delete the previous one.
To return to the Waveform capture screen, press .
5.3.1.3 Deliberate stoppage of the capture
The capture can be stopped deliberately by pressing the yellow keypad key for the icon (bottom right of screen). The OK icon shall then reappear in the same place.
5.3.2 Displaying the characteristics of the capture
To display the characteristics of the capture proceed as follows:
1. Select the submenu by pressing the icon’s yellow key. The Characteristics of the capture screen is displayed.

21
WFI01 1 2
Figure 25: the Characteristics of the capture screen
Item Function See para.
1 Display in RMS mode. 5.3.3
2 Display in PEAK mode. 5.3.4
2. Choose the type of display, or , by pressing the yellow keypad keys for the icons. The C.A 8335 displays the waveform of the current. You can then move the cursor along the graph and zoom in and out.
Available information is: • Instantaneous value of the current at the instant
pointed to by the cursor. • Maximum instantaneous value of the current (over
the entire start-up period). • RMS value of the half-period (or lobe) of the
current on which the cursor is positioned. • Maximum half-period RMS value of the current
(over the entire start-up period). • Maximum instantaneous value of the start-up
period (PEAK). • Start time and duration of engine start-up.
Caution : The voltage must be present before the engine start-up proper for a stable and correct frequency servo-control.
5.3.3 True effective value of the current
This mode enables the record of the trend of the half-period true effective value of the current to be displayed.
5.3.3.1 The RMS display screen in 3A
Information is displayed as follows:
1 2 3 4
WFI02 8 9 10
Figure 26: the RMS display screen in 3A
Item Function
1 Display of mode used
2 Display of sub-mode used
3 Current date and time.
4 Battery charge level.
5 MAX: maximum half-period RMS value of the start-up.
: indicator of number attributed to the displayed graph.
A: value of the measured current.
6 Selection of graphs to be displayed:
-3 A: displays the 3 currents and the neutral current during the transient. - A1, A2 or A3 : displays the current successively in phases 1, 2 and 3.
7 t: temporal position relative to the cursor (t=0 corresponds to the start of the start-up).
A1, A2, A3 : instantaneous values of currents 1, 2 and 3 at the position of the cursor (item 9).
8 Scale of values in amperes.
9 Instantaneous measurement cursor at a point in the graph. Use the keys to move the cursor.
10 : zoom out. To zoom in press the yellow keypad key for the icon.
: zoom in. To zoom in press the yellow keypad key for the icon.
5
6
7

22
5.3.3.2 The RMS display screen in A2
Information is displayed as follows:
WFI03
3 4
Figure 27: the RMS display screen in A2
Item Function
1 MAX: maximum half-period RMS value of the start-up.
: indicator of number attributed to the displayed graph.
A: value of the measured current.
2 t: temporal position relative to the cursor (t=0 corresponds to the start of the start-up).
A2: instantaneous value of current 1 at the cursor position (item 3).
3 Instantaneous measurement cursor at a point in the graph. Use the keys to move the cursor.
4 : zoom out. To zoom in press the yellow keypad key for the icon.
: zoom in. To zoom in press the yellow keypad key for the icon.
Note : Filters A1 and A3 display the record of the trend of the half-period true effective value of the current over phases 1 and 3. The screen is identical to the one displayed for filter A2.
5.3.4 Instantaneous value of inrush current
This mode enables the envelope of the inrush current to be displayed.
5.3.4.1 The PEAK display screen in 3A
The screen of 3A filter appears only when the waveforms are displayed.
Information is displayed as follows:
1 2 3 4
WFI04
8 9 10
Figure 28: the PEAK display screen in 3A
Item Function
1 Display of mode used
2 Display of sub-mode used
3 Current date and time.
4 Battery charge level.
5 MAX: maximum half-period RMS value of the start-up.
: indicator of number attributed to the displayed graph.
A: value of the measured current.
6 Selection of graphs to be displayed:
-3 A: displays the 3 currents and the neutral current during the transient. - A1, A2 or A3 : displays the current successively in phases 1, 2 and 3.
7 t: temporal position relative to the cursor (t=0 corresponds to the start of the start-up).
A1, A2, A3 : instantaneous values of currents 1, 2 and 3 at the position of the cursor (item 9).
8 Scale of values in amperes.
9 Instantaneous measurement cursor at a point in the graph. Use the keys to move the cursor.
10 : zoom out. To zoom in press the yellow keypad key for the icon.
: zoom in. To zoom in press the yellow keypad key for the icon.
1
2
5
6
7

23
5.3.4.2 The PEAK display screen in A3
Information is displayed as follows:
WFI05
3 4
Figure 29: the PEAK display screen in A3
Item Function
1 MAX: maximum half-period RMS value of the start-up.
: indicator of number attributed to the displayed graph.
A: value of the measured current.
2 t: temporal position relative to the cursor (t=0 corresponds to the start of the start-up).
A3: instantaneous value of current at the cursor position (item 3).
3 Instantaneous measurement cursor at a point in the graph. Use the keys to move the cursor.
4 : zoom in. To zoom in press the yellow keypad key for the icon.
Note : Filters A1 and A2 display the record of the trend of the half-period true effective value of the current over phases 1 and 2. The screen is identical to the one displayed for filter A3.
1
2

24
6. HARMONICS KEY
This key displays the representation of the harmonics rates of the voltage, current and apparent power for each rank. It enables the harmonic currents produced by the non-linear charges to be determined, and the problems engendered by these same harmonics to be analysed in accordance with their rank (heating of neutrals, of conductors, of motors, etc.)
6.1 Available sub-menus
Submenus are listed on the screen below and individually processed in the following paragraphs.
The measurement type is selected using the yellow keys of the keypad under the screen.
MHA00
1 2 3 4 5 6
Figure 30: screen of Harmonics mode
Item Sub-menus See para.
1 Analysis of the harmonics of phase voltage.
6.2
2 Analysis of the harmonics of the current.
6.3
3 Analysis of the harmonics of the apparent power.
6.4
4 Analysis of the harmonics of the line voltage.
6.5
5 zoom out. To zoom in press the yellow keypad key for the icon.
-
6 zoom in. To zoom in press the yellow keypad key for the icon.
-
7 Select filters and expert mode. Use the keys to select the display.
-
6.2 Single voltage
This sub-menu displays the harmonics of the voltage.
Note: The choice of the graphs to be displayed depends on the type of connection (See para 4.7):
• Single-phase: no choice (L1) • Diphase: 2L, L1, L2 • Triphase 3, 4 or 5 wires: 3L, L1, L2, L3, -,+
The screen captures shown as examples are those obtained with a triphase connection. This observation is valid for the other sub-menus.
6.2.1 The display screen of the phase voltage harmonics in 3L
Information is displayed as follows:
1 2 3 4 5
MHA01
6 7 8
Figure 31: example of display of harmonics of phase voltage (harmonic n° 5: Vh05) in 3L
Item Function
1 Reminder of the mode used
2 Instantaneous frequency.
3
This information is relative to the harmonic under the cursor (Figure 31 , item 7).
Vh 05: number of harmonic.
% : rate of harmonic relative to the fundamental value.
V: effective voltage of the harmonic in question.
+000°: phase displacement relative to fundamental value (rank 1).
4 Current date and time.
5 Battery charge level.
7

25
6
The horizontal axis indicates the ranks of the harmonics (uneven marking).
Display of the level of the harmonics as a percentage relative to the fundamental value (rank 1).
DC rank: direct component.
Rank (1 to 25): rank of harmonics. When the cursor exceeds rank 25 range 26 to 50 appears.
7 Harmonic ranks selection cursor. Use the keys to move the cursor.
8 Display of expert mode (triphase connection only - See para 6.6) of the 3 x 3L phases, or of L1, L2 and L3 (*). To select the display press the keys.
(*) With a single-phase connection this display is not available. With a diphase connection the available information is: 2L, L1 and L2.
6.2.2 The display screen of the phase voltage harmonics in L1
Information is displayed as follows:
1
MHA02
2 3 4
Figure 32: example of display of harmonics of phase voltage (harmonic n° 3: Vh03) in L1
Item Function
1
This information is relative to the harmonic under the cursor (Figure 32, item 3).
Vh 03: number of harmonic.
% : rate of harmonic relative to the fundamental value.
V: effective voltage of the harmonic in question.
+000°: phase displacement relative to fundamental value (rank 1).
max – min : maximum and minimum indicators of the rate of harmonics in question (reset whenever the harmonic number is changed).
THD: total harmonic distortion.
2
The horizontal axis indicates the ranks of the harmonics (uneven marking).
Display of the level of the harmonics as a percentage relative to the fundamental value (rank 1).
DC rank: direct component.
Rank (1 to 25): rank of harmonics. When the cursor exceeds rank 25 range 26 to 50 appears.
3 Harmonic ranks selection cursor. Use the keys to move the cursor.
4 Display of expert mode (triphase connection only - See para 6.6) of the 3 x 3L phases, or of L1, L2 and L3 (*). To select the display press the keys.
Note : Filters L2 and L3 display the harmonics of the voltage respectively for phases 2 and 3. The screen is identical to the one displayed for filter L1.

26
6.3 Current
This sub-menu displays the harmonics of the current.
6.3.1 The current harmonics display screen in 3L
The displayed information is read as follows:
1 2 3 4 5
MHA03
6 7 8
Figure 33: example of display of harmonics of current (harmonic n° 5: Ah05) in 3L
Item Function
1 Reminder of the mode used
2 Instantaneous frequency.
3
This information is relative to the harmonic under the cursor (Figure 33, item 7).
Ah 05: number of harmonic.
% : rate of harmonics relative to the fundamental harmonic.
A: effective current of the harmonic in question.
+000°: phase displacement relative to fundamental value (rank 1).
4 Current date and time.
5 Battery charge level.
6
The horizontal axis indicates the ranks of the harmonics (uneven marking).
Display of the level of the harmonics as a percentage relative to the fundamental value (rank 1).
DC rank: direct component.
Rank (1 to 25): rank of harmonics. When the cursor exceeds rank 25 range 26 to 50 appears.
7 Harmonic ranks selection cursor. Use the keys to move the cursor.
8 Display of expert mode (triphase connection only - See para 6.6) of the 3 x 3L phases, or of L1, L2 and L3 (*). To select the display press the keys.
(*) With a single-phase connection this display is not available. With a diphase connection the available information is: 2L, L1 and L2.
6.3.2 The current harmonics display screen in L1
The displayed information is read as follows:
1
MHA04
2 3 4
Figure 34: example of display of harmonics of current (harmonic n° 5: Ah05) in L1
Item Function
1
This information is relative to the harmonic under the cursor (Figure 34, item 3).
Ah 05: number of harmonic.
% : rate of harmonics relative to the fundamental harmonic.
A: effective current of the harmonic in question.
+000°: phase displacement relative to fundamental value (rank 1).
max – min : maximum and minimum indicators of the rate of harmonics in question (reset whenever the harmonic number is changed).
THD: total harmonic distortion.
Continuation of the table on the next page.

27
2
The horizontal axis indicates the ranks of the harmonics (uneven marking).
Display of the level of the harmonics as a percentage relative to the fundamental value (rank 1).
DC rank: direct component.
Rank (1 to 25): rank of harmonics. When the cursor exceeds rank 25 range 26 to 50 appears.
3 Harmonic ranks selection cursor. Use the keys to move the cursor.
4 Display of expert mode (triphase connection only - See para 6.6) of the 3 x 3L phases, or of L1, L2 and L3 (*). To select the display press the keys.
Note : Filters L2 and L3 display the harmonics of the voltage respectively for phases 2 and 3. The screen is identical to the one displayed for filter L1.
6.4 Apparent power
This sub-menu displays the harmonics of the apparent power.
6.4.1 The display screen of the apparent power harmonics in 3L
The information is:
1 2 3 4 5
MHA05
6 7 8
Figure 35: example of display of harmonics of the apparent power (harmonic n° 3: VAh03) in 3L
Item Function
1 Reminder of the mode used
2 Instantaneous frequency.
3
This information is relative to the harmonic under the cursor (Figure 35, item 7).
Vah03: number of harmonic.
% : rate of harmonic relative to the fundamental harmonic (rank 1).
+000° : phase displacement of the voltage harmonic relative to the current harmonic for the rank in question.
Display of energy generated.
Display of energy consumed.
4 Current date and time.
5 Battery charge level.
6
The horizontal axis indicates the ranks of the harmonics (the bars of the bar chart above the horizontal axis signify consumed harmonic power, and those below signify generated harmonic power).
Display of the level of the harmonics as a percentage relative to the fundamental value (rank 1).
DC rank: direct component.
Rank (1 to 25): rank of harmonics. When the cursor exceeds rank 25 range 26 to 50 appears.
7 Harmonic ranks selection cursor. To move the cursor use the keys.
8 Display of expert mode (triphase connection only - See para 6.6) of the 3 x 3L phases, or of L1, L2 and L3 (*). To select the display press the keys.
(*) With a single-phase connection this display is not available. With a diphase connection the available information is: 2L, L1 and L2.

28
6.4.1.1 The display screen of the apparent power harmonics in L1
The information is:
1
MHA06
2 3 4
Figure 36: example of display of harmonics of current (harmonic n° 3: VAh03) in L1
Item
Function
1
This information is relative to the harmonic under the cursor (Figure 36, item 3).
Vah 03: number of harmonic.
% : rate of harmonics relative to the fundamental harmonic.
+000°: phase displacement relative to fundamental value (rank 1).
min – max: maximum and minimum indicators of the rate of harmonics in question (reset whenever the harmonic number is changed).
2
The horizontal axis indicates the ranks of the harmonics (uneven marking).
Display of the level of the harmonics as a percentage relative to the fundamental value (rank 1).
DC rank: direct component.
Rank (1 to 25): rank of harmonics. When the cursor exceeds rank 25 range 26 to 50 appears.
Display of energy consumed.
3 Harmonic ranks selection cursor. Use the keys to move the cursor.
4 Display of expert mode (triphase connection only - See para 6.6) of the 3 x 3L phases, or of L1, L2 and L3 (*). To select the display press the keys.
Note : Filters L2 and L3 display the harmonics of the voltage respectively for phases 2 and 3. The screen is identical to the one displayed for filter L1.
6.5 Composite voltage
This sub-menu is available only for diphase and triphase connections. This sub-menu displays the harmonics of the line voltage.
6.5.1 The display screen of the line voltage harmonics in 3L
Information is displayed as follows:
1 2 3 4 5
MHA07
6 7 8
Figure 37: example of display of harmonics of line voltage (harmonic n° 03: Uh03) in 3L
Item Function
1 Reminder of the mode used
2 Instantaneous frequency.
3
This information is relative to the harmonic under the cursor (Figure 37, item 7).
Uh 03: number of harmonic.
% : rate of harmonics relative to the fundamental harmonic.
v: effective voltage of the harmonic in question.
+000° : phase displacement relative to the fundamental harmonic (rank 1).
Continuation of the table on the next page.

29
4 Current date and time.
5 Battery charge level.
6
The horizontal axis indicates the ranks of the harmonics (uneven marking).
Display of the level of the harmonics as a percentage relative to the fundamental value (rank 1).
DC rank: direct component.
Rank (1 to 25): rank of harmonics. When the cursor exceeds rank 25 range 26 to 50 appears.
7 Harmonic ranks selection cursor. To move the cursor use the keys.
8 Display of expert mode (triphase connection only - See para 6.6) of the 3 x 3L phases, or of L1, L2 and L3 (*). To select the display press the keys.
(*) With a single-phase connection this display is not available. With a diphase connection the available information is: 2L, L1 and L2.
6.5.2 The display screen of the line voltage harmonics in L1
Information is displayed as follows:
1
MHA08
2 3 4
Figure 38: example of display of harmonics of line voltage (harmonic n° 03: Uh03) in L1
Item Function
1
This information is relative to the harmonic under the cursor (Figure 38, item 3).
Uh 03: number of harmonic.
% : rate of harmonics relative to the fundamental harmonic.
v: effective voltage of the harmonic in question.
+000°: phase displacement relative to fundamental value (rank 1).
max – min : maximum and minimum indicators of the rate of harmonics in question (reset whenever the harmonic number is changed).
THD: total harmonic distortion.
2
The horizontal axis indicates the ranks of the harmonics (uneven marking).
Display of the level of the harmonics as a percentage relative to the fundamental value (rank 1).
DC rank: direct component.
Rank (1 to 25): rank of harmonics. When the cursor exceeds rank 25 range 26 to 50 appears.
3 Harmonic ranks selection cursor. Use the keys to move the cursor.
4 Display of expert mode (triphase connection only - See para 6.6) of the 3 x 3L phases, or of L1, L2 and L3 (*). To select the display press the keys.
6.6 Expert mode
This mode is available with a triphase connection only. It enables the influence of the harmonics on the heating of the neutral or on the rotating machines to be displayed. To display expert mode press the keys of the keypad. The selection is underlined in yellow and the screen simultaneously displays the expert mode.
From this screen, two sub-menus, and , are available (see next page).

30
6.6.1 The screen displaying expert mode for phase voltage
This sub-menu displays the influence of the harmonics of the phase voltage on the heating of the neutral or on the rotating machines.
Information is displayed as follows:
1 2 3
MHA09
4
Figure 39: the expert mode screen for phase voltage
Item Function
1 Harmonics inducing a negative sequence.
2 Harmonics inducing a zero sequence.
3 Harmonics inducing a positive sequence.
4 % : rate of harmonics relative to the fundamental harmonic.
6.6.2 The screen displaying expert mode for current
This sub-menu displays the influence of the harmonics of the current on the heating of the neutral or on the rotating machines.
Information is displayed as follows:
1 2 3
MHA10
4
Figure 40: the expert mode screen for current
31
7. WAVEFORM KEY
This key enables the current and voltage graphs to be displayed, together with the values measured and calculated from the voltages and currents (except for power, energy and harmonics).
7.1 Available sub-menus
Submenus are listed on the screen below and individually processed in the following paragraphs.
The measurement type is selected using the yellow keys of the keypad under the screen.
WF00
1 2 3 4 5 6
Figure 41: Waveform mode screen
Item Sub-menus See para.
1 Measurement of the true effective value (current or voltage)
7.2
2 Measurement of total harmonic distortion.
7.3
3 Measurement of the peak factor (current or voltage).
7.4
4 Display of maximum, average and minimum values (current, voltage and current and voltage peak).
7.5
5 Simultaneous display of all voltage and current measurements (RMS, DC, THD, DF, CF, PST).
7.6
6 Display of Fresnel diagram of signals.
7.7
7 Select filters and expert mode. Use the keys to select the display.
-
7.2 Measurement of true effective value
This sub-menu displays the waveforms over a period of the measured signals and the true effective values of the voltage and the current.
Note : The choice of the graphs to be displayed depends on the type of connection (See para 4.7):
• Single-phase: no choice (L1) • Diphase: 2V, 2A, L1, L2 • Triphase 3 or 4 wires: 3U, 3V, 3A, L1, L2, L3 • Triphase 5 wires:
- For , and : 3U, 3V, 3A, L1, L2 and L3
- For , and : 3U, 4V, 4A, L1, L2, L3 and N
The screen captures shown as examples are those obtained with a triphase 5-wire connection.
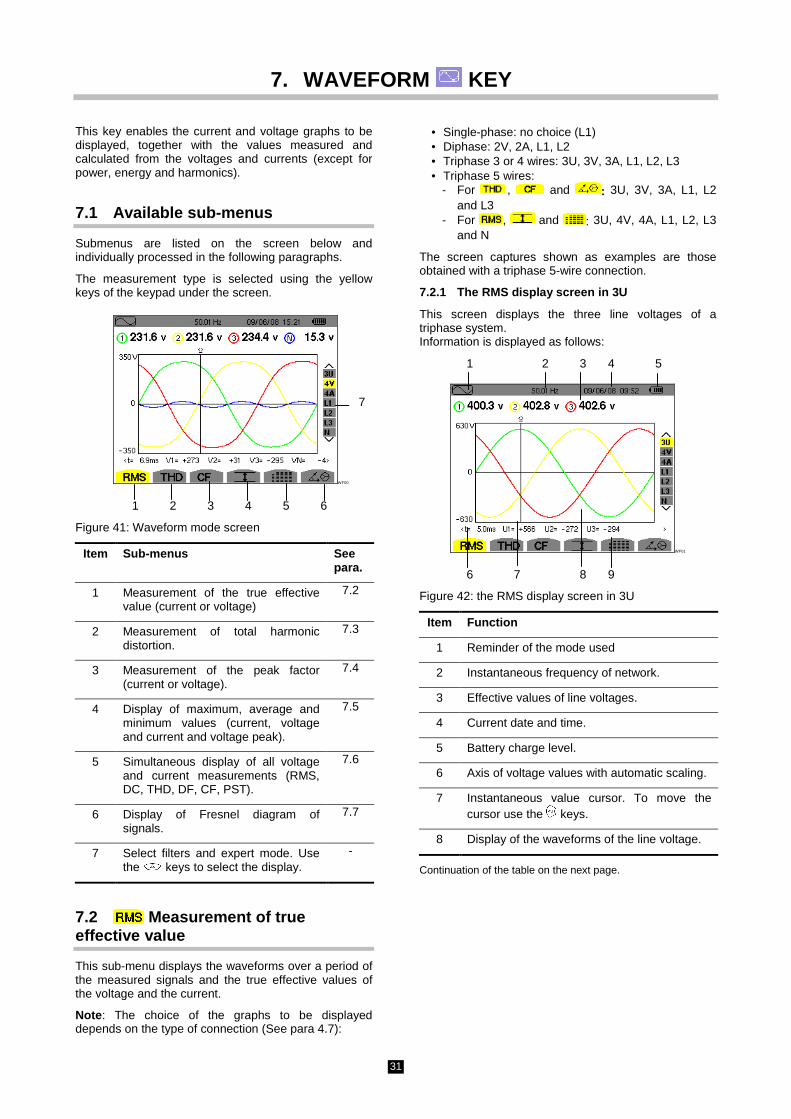
7.2.1 The RMS display screen in 3U
This screen displays the three line voltages of a triphase system. Information is displayed as follows:
1 2 3 4 5
WF01
6 7 8 9
Figure 42: the RMS display screen in 3U
Item Function
1 Reminder of the mode used
2 Instantaneous frequency of network.
3 Effective values of line voltages.
4 Current date and time.
5 Battery charge level.
6 Axis of voltage values with automatic scaling.
7 Instantaneous value cursor. To move the cursor use the keys.
8 Display of the waveforms of the line voltage.
Continuation of the table on the next page.
7

32
9
Instantaneous value of the signals at the intersection of the cursor (Figure 42, item 7) and of the graphs.
t: time relative to the start of the period (expressed in milliseconds).
U1: instantaneous value of the line voltage between phases 1 and 2 (U12).
U2: instantaneous value of the line voltage between phases 2 and 3 (U23).
U3: instantaneous value of the line voltage between phases 3 and 1 (U31).
7.2.2 The RMS display screen in 4V
This screen displays the three phase voltages and the neutral relative to the earth of a triphase system.
The displayed information is read as follows:
1 2 3
WF02 4 Figure 43: the RMS display screen in 4V.
Item Function
1 Axis of voltage values with automatic scaling.
2 Effective values of phase voltages.
3 Instantaneous value cursor. To move the cursor use the keys.
4 Instantaneous values of the signals at the intersection of the cursor (above, item 3) and of the graphs.
t: time relative to the start of the period (expressed in milliseconds).
V1: instantaneous value of the phase voltage of graph 1.
V2: instantaneous value of the phase voltage of graph 2.
V3: instantaneous value of the phase voltage of graph 3.
VN: instantaneous value of neutral.
7.2.3 The RMS display screen in 4A
This screen displays the three phase currents and the neutral current of a triphase system.
The displayed information is read as follows:
WF03
1 2 3 4
Figure 44: the RMS display screen in 4A
Item Function
1 Axis of current values with automatic scaling.
2 Instantaneous value cursor. To move the cursor use the keys.
3 Effective values of currents.
4 Instantaneous values of the signals at the intersection of the cursor (above, item 2) and of the graphs.
t: time relative to the start of the period (expressed in milliseconds).
A1: instantaneous value of the current of graph 1.
A2: instantaneous value of the current of graph 2.
A3: instantaneous value of the current of graph 3.
AN: instantaneous value of neutral.
7.2.4 The RMS display screen for neutral
This screen displays the neutral voltage relative to earth and the current of the neutral.

33
The displayed information is read as follows:
1 2 3
WF04
4 5
Figure 45: the RMS display screen for neutral
Item Function
1 Axis of voltage values of current and of voltage with automatic scaling.
2 Effective value of voltage.
3 Effective value of current.
4 Instantaneous values of the signals at the intersection of the cursor (above, item 5) and of the graphs.
t: time relative to the start of the period (expressed in milliseconds).
VN: instantaneous value of the voltage of neutral.
AN: instantaneous value of the current of neutral.
5 Instantaneous value cursor. To move the cursor use the keys.
Note : Filters L1, L2 and L3 display the current and voltage respectively in phases 1, 2 and 3. The screen is identical to the one displayed for neutral.
7.3 Measurement of total harmonic distortion
This sub-menu displays the waveforms over a period (alternance) of the measured signals and the total harmonic distortion rates for voltage and current.
7.3.1 The THD display screen in 3U
This screen displays the waveforms of a period of the line voltages and the total harmonic distortion rates.
The displayed information is read as follows:
1 2 3 4 5
WF05*
6 7 8 9 Figure 46: the THD display screen in 3U
Item Function
1 Reminder of the mode used
2 Harmonic distortion rate for each graph.
3 Instantaneous frequency of network.
4 Current date and time.
5 Battery charge level.
6 Axis of voltage values with automatic scaling.
7 Instantaneous value cursor. To move the cursor use the keys.
8 Instantaneous values of the signals at the intersection of the cursor (above, item 7) and of the graphs.
t: time relative to the start of the period (expressed in milliseconds).
U1: instantaneous value of the line voltage between phases 1 and 2 (U12).
U2: instantaneous value of the line voltage between phases 2 and 3 (U23).
U3: instantaneous value of the line voltage between phases 3 and 1 (U31).
9 Display of the waveforms of the line voltage.

34
7.3.2 The THD display screen in 3V
This screen displays the waveforms of a period of the phase voltages and the total harmonic distortion rates.
The displayed information is read as follows:
1 2
CW07* 3 4
Figure 47: the THD display screen in 3V
Item Function
1 Axis of voltage values with automatic scaling.
2 Harmonic distortion rate for each graph.
3 Instantaneous value cursor. To move the cursor use the keys.
4 Instantaneous values of the signals at the intersection of the cursor (above, item 3) and of the graphs.
t: time relative to the start of the period (expressed in milliseconds).
V1: instantaneous value of the phase voltage of graph 1.
V2: instantaneous value of the phase voltage of graph 2.
V3: instantaneous value of the phase voltage of graph 3.
7.3.3 The THD display screen in 3A
This screen displays the waveforms of a period of the phase currents and the total harmonic distortion rates.
The displayed information is read as follows:
1 2
WF07* 3 4
Figure 48: the THD display screen in 3A
Item Function
1 Axis of current values with automatic scaling.
2 Harmonic distortion rate for each graph.
3 Instantaneous value cursor. To move the cursor use the keys.
4 Instantaneous values of the signals at the intersection of the cursor (above, item 3) and of the graphs.
t: time relative to the start of the period (expressed in milliseconds).
A1: instantaneous value of the current of graph 1.
A2: instantaneous value of the current of graph 2.
A3: instantaneous value of the current of graph 3.
Note : Filters L1, L2 and L3 display the total harmonic distortion rates of the current and of the voltage respectively for phases 1, 2 and 3.
7.4 Measurement of the peak factor
This sub-menu displays the waveforms over a period of the measured signals and the voltage and current peak factor.
7.4.1 The CF display screen in 3U.
This screen displays the waveforms of a period of the line voltages and the peak factors.

35
The displayed information is read as follows:
1 2 3 4 5
WF08 6 7 8 9
Figure 49: the CF display screen in 3U
Item Function
1 Reminder of the mode used
2 Peak factor for each graph.
3 Instantaneous frequency of network.
4 Current date and time.
5 Battery charge level.
6 Axis of voltage values with automatic scaling.
7 Instantaneous value cursor. To move the cursor use the keys.
8 Instantaneous values of the signals at the intersection of the cursor (above, item 7) and of the graphs.
t: time relative to the start of the period (expressed in milliseconds).
U1: peak factor of the voltage between phases 1 and 2 (U12).
U2: peak factor of the voltage between phases 2 and 3 (U23).
U3: peak factor of the voltage between phases 3 and 1 (U31).
9 Display of the waveforms of the line voltage.
7.4.2 The display screen in 3V
This screen displays the waveforms of a period of the phase voltages and the peak factors.
The displayed information is read as follows:
1
WF09
2 3 4
Figure 50: the display screen in 3V
Item Function
1 Peak factor for each graph.
2 Axis of voltage values with automatic scaling
3 Instantaneous value cursor. To move the cursor use the keys.
4 Instantaneous values of the signals at the intersection of the cursor (above, item 3) and of the graphs.
t: time relative to the start of the period (expressed in milliseconds).
V1: instantaneous value of the phase voltage of graph 1.
V2: instantaneous value of the phase voltage of graph 2.
V3: instantaneous value of the phase voltage of graph 3.
7.4.3 The display screen in 3A
This screen displays the waveforms of a period of the currents and the peak factors.
The displayed information is read as follows:
1
WF10 2 3 4
Figure 51: the CF display screen in 3A

36
Item Function
1 Peak factor for each graph.
2 Axis of current values with automatic scaling.
3 Instantaneous value cursor. To move the cursor use the keys.
4 Instantaneous values of the signals at the intersection of the cursor (Figure 51, item 3) and of the graphs.
t: time relative to the start of the period (expressed in milliseconds).
A1: instantaneous value of the current of graph 1.
A2: instantaneous value of the current of graph 2.
A3: instantaneous value of the current of graph 3.
Note : L1, L2 and L3 display the peak factors of the current and of the voltage respectively for phases 1, 2 and 3.
7.5 Measurement of extreme and average voltage and current values
This sub-menu displays the RMS, maximum, minimum and average values for voltage and current, together with those for the instantaneous positive and negative voltage and current peaks.
7.5.1 The Max.-Min. display screen in 3U
This screen displays the RMS, maximum, minimum and average values and the instantaneous positive and negative peak values of the line voltages.
The following data is displayed:
1 2 3 4 5
WF11
Figure 52: the Max.-Min. display screen in 3U
Item Function
1 Reminder of the mode used
2 Columns of values relative to each graph (1, 2 and 3).
MAX: RMS value of the maximum line voltage from powering of the C.A 8335 or from the last time the key is pressed.
RMS : true effective value of line voltage MIN: RMS value of the minimum line voltage measured from powering of the C.A 8335 or from the last time the key is pressed.
PEAK+ : maximum peak value of the line voltage. PEAK-: minimum peak value of the line voltage.
3 Instantaneous frequency of network.
4 Current date and time.
5 Battery charge level.
Note : The Max. and Min. RMS measurements are calculated every half-period (i.e. every 10 ms for a signal at 50 Hz). The measurements are refreshed every 250 ms.
7.5.2 The Max.-Min. display screen in 4V
This screen displays the RMS, maximum, minimum and average values and the instantaneous positive and negative peak values of the phase voltages and of neutral.
The following data is displayed:
1 2
WF12
Figure 53: the Max.-Min. display screen in 4V

37
Item Function
1 Columns of values relative to each voltage graph (1, 2, 3).
MAX: RMS value of the maximum phase voltage from powering of the C.A 8335 or from the last time the key is pressed.
RMS : true effective value of phase voltage.
MIN: RMS value of the minimum phase voltage from powering of the C.A 8335 or from the last time the key is pressed.
PEAK+ : maximum peak value of the phase voltage.
PEAK- : minimum peak value of the phase voltage.
2 Column of values relative to neutral: RMS, PEAK+ and PEAK- parameters (see point 1).
Note : The Max. and Min. RMS measurements are calculated every half-period (i.e. every 10 ms for a signal at 50 Hz). The measurements are refreshed every 250 ms.
7.5.3 The Max.-Min. display screen in 4A
This screen displays the RMS, maximum, minimum and average values and the instantaneous positive and negative peak values of the phase currents and of neutral.
The following data is displayed:
1 2
WF13
Figure 54: the Max.-Min. display screen in 4A
Item Function
1 Columns of values relative to each current graph (1, 2, 3).
MAX: maximum RMS value of the current from powering of the C.A 8335 or from the last time the key is pressed.
RMS : true effective value of the current.
MIN: minimum RMS value of the current from powering of the C.A 8335 or from the last time the key is pressed.
PEAK+ : maximum peak value of current.
PEAK- : minimum peak value of current.
2 Column of values relative to neutral: RMS, PEAK+ and PEAK- parameters (see point 1).
Note : The Max. and Min. RMS measurements are calculated every half-period (i.e. every 10 ms for a signal at 50 Hz). The measurements are refreshed every 250 ms.
7.5.4 The Max.-Min. display screen in L1
This screen displays the RMS, maximum, minimum and average values and the instantaneous positive and negative peak values of the phase voltage and of the current for phase 1.
The following data is displayed:
1 2
WF14
Figure 55: the Max.-Min. display screen in L1
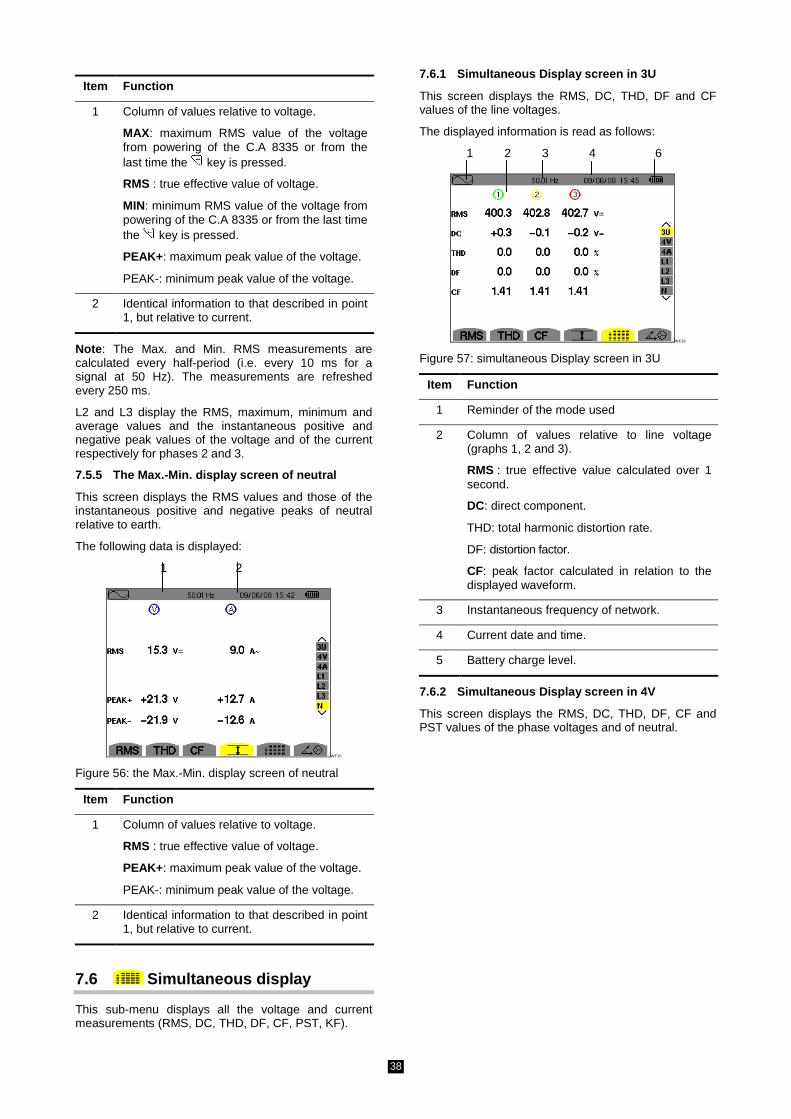
38
Item Function
1 Column of values relative to voltage.
MAX: maximum RMS value of the voltage from powering of the C.A 8335 or from the last time the key is pressed.
RMS : true effective value of voltage.
MIN: minimum RMS value of the voltage from powering of the C.A 8335 or from the last time the key is pressed.
PEAK+ : maximum peak value of the voltage.
PEAK-: minimum peak value of the voltage.
2 Identical information to that described in point 1, but relative to current.
Note : The Max. and Min. RMS measurements are calculated every half-period (i.e. every 10 ms for a signal at 50 Hz). The measurements are refreshed every 250 ms.
L2 and L3 display the RMS, maximum, minimum and average values and the instantaneous positive and negative peak values of the voltage and of the current respectively for phases 2 and 3.
7.5.5 The Max.-Min. display screen of neutral
This screen displays the RMS values and those of the instantaneous positive and negative peaks of neutral relative to earth.
The following data is displayed:
1 2
WF15
Figure 56: the Max.-Min. display screen of neutral
Item Function
1 Column of values relative to voltage.
RMS : true effective value of voltage.
PEAK+ : maximum peak value of the voltage.
PEAK-: minimum peak value of the voltage.
2 Identical information to that described in point 1, but relative to current.
7.6 Simultaneous display
This sub-menu displays all the voltage and current measurements (RMS, DC, THD, DF, CF, PST, KF).
7.6.1 Simultaneous Display screen in 3U
This screen displays the RMS, DC, THD, DF and CF values of the line voltages.
The displayed information is read as follows:
1 2 3 4 6
WF16
Figure 57: simultaneous Display screen in 3U
Item Function
1 Reminder of the mode used
2 Column of values relative to line voltage (graphs 1, 2 and 3).
RMS : true effective value calculated over 1 second.
DC: direct component.
THD: total harmonic distortion rate.
DF: distortion factor.
CF: peak factor calculated in relation to the displayed waveform.
3 Instantaneous frequency of network.
4 Current date and time.
5 Battery charge level.
7.6.2 Simultaneous Display screen in 4V
This screen displays the RMS, DC, THD, DF, CF and PST values of the phase voltages and of neutral.

39
The displayed information is read as follows:
1 2
WF17
Figure 58: simultaneous Display screen in 4V
Item Function
1 Column of values relative to voltage (graphs 1, 2 and 3).
RMS : true effective value calculated over 1 second.
DC: direct component.
THD: total harmonic distortion rate.
DF: distortion factor.
CF: peak factor calculated in relation to the displayed waveform.
PST : short-term flicker (over 10 minutes).
2 Column of RMS and DC values relative to neutral.
7.6.3 Simultaneous Display screen in 4A
This screen displays the RMS, DC, THD, DF, CF and KF values of the phase currents and of neutral.
The displayed information is read as follows:
1 2
WF18
Figure59: simultaneous Display screen in 4A
Item Function
1 Column of values relative to current (graphs 1, 2 and 3).
RMS : true effective value calculated over 1 second.
DC: direct component.
THD: total harmonic distortion rate.
DF: distortion factor.
CF: peak factor calculated in relation to the displayed waveform.
KF: K factor. Oversizing of transformer relative to harmonics.
2 Column of RMS value relative to neutral.
7.6.4 Simultaneous Display screen in L1
This screen displays the RMS, THD, DF, CF values of the voltage and of the current, together with the DC and PST parameters for voltage and KF for phase 1.
The displayed information is read as follows:
1 2
WF19
Figure 60: Simultaneous Display screen in L1
Item Function
1 Column of values relative to voltage.
RMS : true effective value calculated over 1 second.
DC: direct component.
THD: total harmonic distortion rate.
DF: distortion factor.
CF: peak factor calculated in relation to the displayed waveform.
PST : short-term flicker (over 10 minutes).
2 Column of values relative to current.
RMS, THD, DF and CF values: see point 1
KF: K factor. Oversizing of transformer relative to harmonics.
Note : L2 and L3 give information concerning simultaneous display of the current and of the voltage respectively for phases 2 and 3.
7.6.5 Screen for Simultaneous Display of neutral
This screen displays the RMS (true effective value) and DC (direct component) values of the voltage and the RMS value of the current of neutral.
7.7 Display of Fresnel diagram
This sub-menu displays the absolute values of the voltages and currents at the fundamental frequency, the phase displacement of the voltages relative to the

40
currents and the unbalances of the voltages and currents.
7.7.1 The screen Displaying the Fresnel diagram in 3U
This screen displays the absolute value of the voltage at the fundamental frequency, the phase displacement of the line voltages relative to the currents and the unbalance of the line voltages.
The displayed information is read as follows:
1 2 3 4 6
WF20
Figure 61: the screen Displaying the Fresnel diagram in 3U
Item Function
1 Reminder of the mode used
2 Column of values relative to each vector (1, 2 and 3).
V1, V2, V3: absolute values of the voltages at fundamental frequency.
φφφφ12 : phase displacement of phase 1 relative to phase 2.
φφφφ23 : phase displacement of phase 2 relative to phase 3.
φφφφ31 : phase displacement of phase 3 relative to phase 1.
3 Instantaneous frequency of network.
4 Fresnel diagram.
5 Current date and time.
6 Battery charge level.
7 Unb : unbalance of line voltages.
7.7.2 The screen Displaying the Fresnel diagram in 3V
This screen displays the absolute value of the phase voltage at the fundamental frequency, the phase displacement of the phase voltages relative to the currents and the unbalance of the phase voltages.
The displayed information is identical to that described in point 7.7.1 but relative to phase voltage.
7.7.3 The screen Displaying the Fresnel diagram in 3A
This screen displays the absolute value of the current at fundamental frequency, the phase displacement of the
currents relative to one another and the unbalance of the currents.
The displayed information is identical to that described in point 7.7.1 but relative to the current.
7.7.4 The screen Displaying the Fresnel diagram in L1
This screen displays the absolute value of the current and of the voltage at the fundamental frequency and the phase displacement of the voltage relative to the current in relation to phase 1.
The displayed information is read as follows:
WF21
Figure 62: the screen Displaying the Fresnel diagram in L1
Item Function
1 V1: absolute value of the phase voltage at the fundamental frequency.
A1: absolute value of the current at fundamental frequency.
2 φφφφVA: phase displacement of voltage (V) relative to current (A).
Note : L2 and L3 display the absolute value of the current and of the voltage at the fundamental frequency and the phase displacement of the voltage relative respectively to phases 2 and 3.
1
2

41
5
8. ALARM MODE KEY
This mode detects over thresholds (Vrms, Urms, Arms, PST, Vcf, Ucf, Acf, Vunb, Aunb, Hz, KF, Vthd, Uthd, Athd, Vdf, W, VAR, VA, DPF, PF, Vh, Uh, Ah and VAh) of values that you wish to monitor.
You must firstly select a hysteresis value that is valid for all alarms. Values to be monitored:
• were defined by the Configuration / Alarm mode screen (See para 4.10, page 15).
• must be activated (visible red item) on the same screen.
Stored alarms can then be transferred onto a PC via the PAT application (see corresponding manual). You can capture over 10,000 alarms.
8.1 Available submenus
Submenus are listed on the screen below and individually processed in the following paragraphs.
Sub-menus are selected using the yellow keys on the keypad under the screen.
AM00 1 2 3 4
Figure 63: the Alarm Mode screen
Item Sub-menus See para.
1 Access to Alarm mode configuration. 8.2
2 Alarm log. 8.4
3 Programming a campaign. 8.3
The icons OK and (above, item 4) have the following functions:
• OK: Validating the programming of a campaign and starting the alarm campaign (See para 8.3.2).
• : Voluntary alarm campaign stop (See para 8.3.3).
8.2 Alarm mode configuration
This submenu displays the list of configured alarms (See para 4.10, page 15). This shortcut key enables you to define or change alarm configurations.
Information is displayed as follows:
1 2 3 4
SUMA00 6 7 8 9 10 11 12
Figure 64: Configuration from alarm mode screen
Item Function
1 Reminder of the mode used.
2 Reminder of the submenu used.
3 Current date and time.
4 Battery charge level.
5 Activating alarm (red item) or deactivating it (see point 3 below).
6 Type of alarm (Vah, Ah, Uh, Vh, Tan, PF, DPF, VA, VAR, W, Athd, Uthd, Vthd, KF, Hz, Aunb, Vunb, Vrms, Acf, Ucf, Vcf, PST, Arms Urms and Vrms – see table of abbreviations in paragraph , page 10.
7 Harmonics classification (between 0 and 50, for Vah, Ah, Uh and Vh).
8 Alarm filter (3L: 3 individually monitored phases or N: monitoring neutral or Sigma/2 or Sigma/3 or Sigma).
9 Alarm direction (> or < only for Arms, Urms, Vrms, Hz, otherwise a single direction).
10 Alarm triggering threshold (it is possible to set the unit’s power of 10 for the following: W, VAR and VA).
11 Minimum duration and over threshold for validating the alarm (in minutes, seconds or only for Vrms, Urms and Arms in hundreds of a second).
Table continued on the next page

42
12 Hysteresis value (corresponds to the added or cut percentage of the chosen alarm threshold that shall stop the alarm if exceeded – Value of 1, 2, 5 or 10%).
Icon for browsing in the 1,365 video pages. Press the yellow keys corresponding to these icons to display the pages.
Reminder: Use keys to browse vertically in fields. Use .keys to browse horizontally in fields.
Perform the following to configure an alarm:
1. Select the field by pressing . Arrows appear.
2. Enter values (Vah, Ah, Uh, etc.) by pressing then validate via . The field is highlighted in yellow.
Do the same for all values to be entered in fields.
3. Activate the configured alarm by placing the yellow cursor on the browsing column (Figure 64, item 5) and press . Activation is marked by the red item The alarm can be triggered.
Note : Repeat Stage 3 if you wish to deactivate the alarm.
Press to return to the Programming a campaign screen.
8.3 Programming an alarm campaign
This submenu specifies the time schedule for the start and end of an alarm campaign.
AM00
Figure 65: Example of a campaign programming screen
8.3.1 STAGE 1: Parameterization of time schedule
Perform the following:
1. Select the Start field via . The selected field is highlighted in yellow. Press to enter the type of
values. The arrows appear in the date and time field of the programming campaign start.
Press to increment or decrement a value and press to switch to the following data.
Note : The start timestamp must exceed present timestamp.
2. Press to validate the programming of Start date and time.
3. Select the End field via keys. The selected field is highlighted in yellow. Press to enter the type of values. The arrows appear in the date and time field of the programming campaign end.
Press to increment or decrement a value and press to switch to the following data.
Note : The end timestamp must exceed start timestamp.
4. Press to validate the programming of End date and time.
8.3.2 Stage 2: Starting alarm campaign
Press the OK icon’s yellow key to launch the alarm campaign between the start and end times that you specified.
The OK icon disappears and the icon appears instead.
The Campaign on standby message is displayed while awaiting start time and the icon blinks on the screen’s top display bar.
The Campaign running message is displayed when start time begins.
The Programming a campaign screen with the OK icon (bottom right-hand side of the screen) are displayed when the end time is reached. You can then program a new campaign.
8.3.3 Voluntary alarm campaign stop
The alarm campaign can be voluntarily stopped before the end timestamp by pressing the icon’s yellow key (bottom right-hand side of the screen). The OK icon shall then reappear in the same place.
8.4 Displaying alarm log
This submenu displays the alarm log. The log can contain a maximum of 14,336 alarms. Press the icon’s yellow key to view this alarm log.
Note : the type of connection selected in the mode does not affect the possibilities of alarm filter choice and monitored parameter. Users are responsible for these choices.

43
The following data is displayed:
1 2
AM01 3 4 5 6
Figure 66: Alarm log screen
Item Function
1 Alarm date and time.
2 Alarm log filling rate. The black cursor corresponds to used memory.
3 Alarm filter.
4 Monitored parameter (Vrms, etc.).
5 Amplitude (min. or max.).
6 Alarm duration.
Reminder: Stored alarms can be transferred onto a PC via the PAT application (see corresponding manual). You can capture 10,920 alarms.
8.5 Deleting alarm log
This submenu deletes the whole log. Perform the following to delete this log:
1. Select the submenu by pressing the icon’s yellow key.
2. Press to delete the whole alarm log. Log is empty.
Press to quit this submenu without deleting stored data.
AM02
Figure 67: Alarm log in deletion mode screen To be changed
To be changed

44
9. TREND MODE KEY
This mode records the parameter changes previously specified by the Configuration / Trend mode screen (See para 4.9, p 14).
9.1 Available sub-menus
Sub-menus are listed on the screen below and mentioned one-by-one in the following paragraphs.
Sub-menus are selected using the yellow keys on the keypad under the screen.
TREND00
1 2 3 4
Figure 68: Trend mode screen
Item Sub-menus See para.
1 Access to Trend mode configuration. 9.3
2 Recording list. 9.4
3 Programming a recording. 9.2
The OK icon (item 4) enables to validate a recording’s programming (See para 9.2, page 44).
9.2 Programming and initiating recording
This submenu specifies the characteristics of a new recording campaign.
TREND00
Figure 69: Example of a screen for Programming a recording (configuration 1)
9.2.1 STAGE 1: Parameterization of characteristics
Perform the following:
1. Select the Configuration field via . The selected field is highlighted in yellow. Press to enter the type of configuration. Arrows appear.
2. Select the configuration to be used by browsing via keys. Press to validate.
Reminder: The to configurations were defined on the Configuration / Trend mode screen (See para 4.9, page 14). Also see point 9.3 for the configuration procedure.
1. Select the Start field via . The selected field is highlighted in yellow. Press to enter the type of values. Arrows appear in the programming a recording start date and time field.
Press to increment or decrement a value and press to switch to the following data.
Note : The start timestamp must exceed present timestamp.
2. Press to validate the programming of Start date and time.
3. Select the End field via keys. The selected field is highlighted in yellow. Press to enter the type of values. Arrows appear in the programming a recording end date and time field.
Press to increment or decrement a value and press to switch to the following data.
Note : The end timestamp must exceed start timestamp.
4. Press to validate the programming of End date and time.
5. Select the Period field via keys and press to enter the value. Arrows appear.
Press to increment or decrement possible values (1 s, 5 s, 20 s, 1 min, 2 min, 5 min, 10 min or 15 min). Press to validate.
Note : The recording integration period corresponds to the time during which each recorded value’s measurement shall be averaged.
6. Press again to highlight the Name box in yellow and press to enter edit mode. Input the recording name

45
(no more than 8 characters). Several recordings can carry the same name.
Available alphanumeric characters are A...Z, space and 0 to 9. Use keys to display a character and
to switch to the contiguous character.
7. Press to validate the name.
9.2.2 STAGE 2: Start programming a recording.
Press the OK icon’s yellow key (bottom right-hand side of the screen) to begin recording between your specified start and end times. The OK icon disappears and the icon appears instead.
The Recording on standby message is displayed while awaiting start time and the icon (figure 8, item 1) blinks on the screen’s top display bar.
The Recording running message is displayed when start time begins.
1
TREND01
Figure 70: Display screen during a current recording
The Programming a recording screen and OK icon (bottom right-hand side of the screen) reappear when the end time is reached. You can then program a new recording.
9.2.3 Voluntary current recording stop
The recording can be voluntarily stopped before the end timestamp by pressing the icon’s yellow key (bottom right-hand side of the screen). The OK icon shall then reappear in the same place.
9.3 Trend mode configuration
This submenu displays the recording list (See para 4.9, page 14). This shortcut key enables you to specify or change the configuration of recordings.
Information is displayed as follows:
1 2 3 4
SUMT 5 6 7
Figure 71: Trend mode configuration screen
Item Function
1 Reminder of the mode used
2 Reminder of submenu used.
3 Current date and time.
4 Battery charge level.
5 Configuration of VAh, Ah, Vh and Uh variable harmonics recording.
6 List of parameters to be recorded (Urms, Vrms, W, PF… etc).
Types of configuration icon ( to ). Press these icons’ yellow keys to display screen pages.
Perform the following to configure a recording:
Example for configuration 1:
1. To zoom in press the yellow keypad key corresponding to the icon. It is displayed against a yellow background.
2. Select values by moving the yellow cursor via and keys, then press to validate. The red item confirms validation.
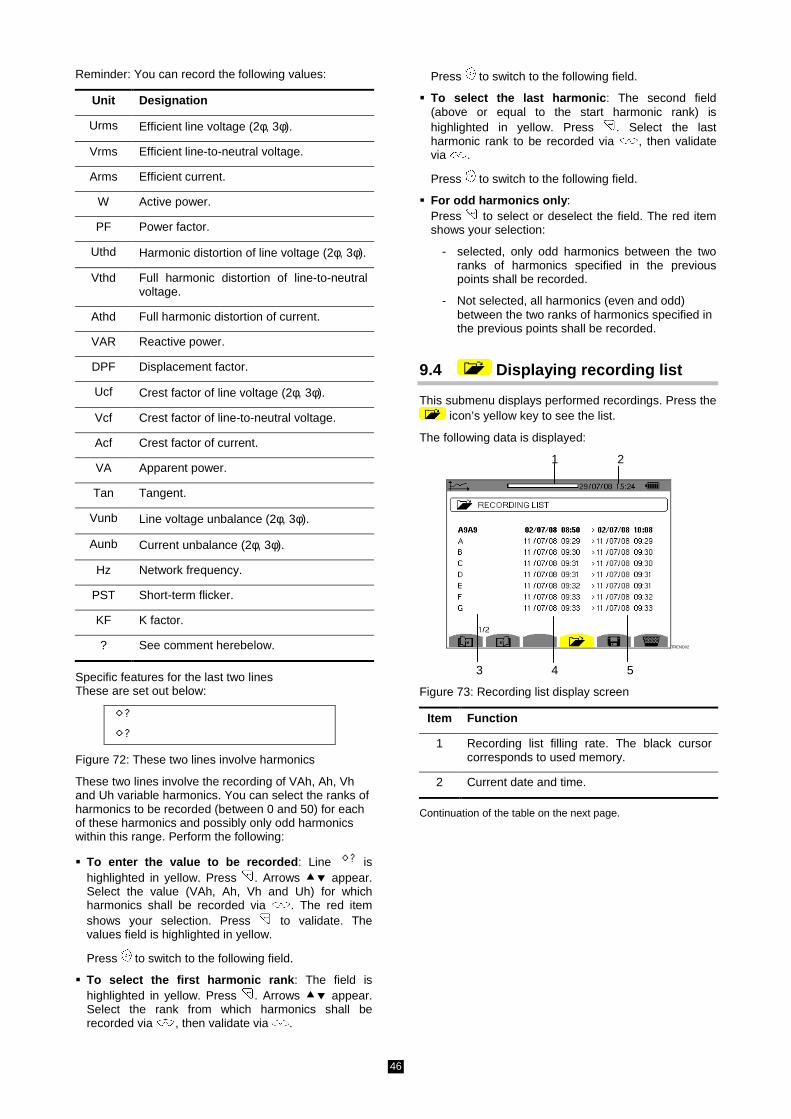
46
Reminder: You can record the following values:
Unit Designation
Urms Efficient line voltage (2φ, 3φ).
Vrms Efficient line-to-neutral voltage.
Arms Efficient current.
W Active power.
PF Power factor.
Uthd Harmonic distortion of line voltage (2φ, 3φ).
Vthd Full harmonic distortion of line-to-neutral voltage.
Athd Full harmonic distortion of current.
VAR Reactive power.
DPF Displacement factor.
Ucf Crest factor of line voltage (2φ, 3φ).
Vcf Crest factor of line-to-neutral voltage.
Acf Crest factor of current.
VA Apparent power.
Tan Tangent.
Vunb Line voltage unbalance (2φ, 3φ).
Aunb Current unbalance (2φ, 3φ).
Hz Network frequency.
PST Short-term flicker.
KF K factor.
? See comment herebelow.
Specific features for the last two lines These are set out below:
Figure 72: These two lines involve harmonics
These two lines involve the recording of VAh, Ah, Vh and Uh variable harmonics. You can select the ranks of harmonics to be recorded (between 0 and 50) for each of these harmonics and possibly only odd harmonics within this range. Perform the following:
To enter the value to be recorded : Line is highlighted in yellow. Press . Arrows appear. Select the value (VAh, Ah, Vh and Uh) for which harmonics shall be recorded via . The red item shows your selection. Press to validate. The values field is highlighted in yellow.
Press to switch to the following field.
To select the first harmonic rank : The field is highlighted in yellow. Press . Arrows appear. Select the rank from which harmonics shall be recorded via , then validate via .
Press to switch to the following field.
To select the last harmonic : The second field (above or equal to the start harmonic rank) is highlighted in yellow. Press . Select the last harmonic rank to be recorded via , then validate via .
Press to switch to the following field.
For odd harmonics only : Press to select or deselect the field. The red item shows your selection:
- selected, only odd harmonics between the two ranks of harmonics specified in the previous points shall be recorded.
- Not selected, all harmonics (even and odd) between the two ranks of harmonics specified in the previous points shall be recorded.
9.4 Displaying recording list
This submenu displays performed recordings. Press the icon’s yellow key to see the list.
The following data is displayed:
1 2
TREND02 3 4 5
Figure 73: Recording list display screen
Item Function
1 Recording list filling rate. The black cursor corresponds to used memory.
2 Current date and time.
Continuation of the table on the next page.

47
3 Recording name.
4 Recording start time.
5 Recording end time.
9.5 Deleting recordings
This submenu is used to deleted recordings. Perform the following:
1. Select the submenu by pressing the icon’s yellow key.
2. Select the recording to be deleted via . The selected field is in boldface.
3. Press to validate the deletion.
Press to quit this submenu without deleting stored data.
TREND03
Figure 74: Recording list screen in deletion mode.

48
10. POWER AND ENERGY KEY
This key displays measurements for power and energies.
10.1 Available sub-menus
Sub-menus are listed on the screen below and mentioned one-by-one in the following paragraphs.
Sub-menus are selected using the yellow keys on the keypad under the screen.
MPE00
1 2 3 4 5
Figure 75: the Power and energy screen
Item Sub-menus See para.
1 Display of PF, DPF and Tan. 10.2.3
10.3.3
2 Display of energy consumed. 10.2
3 Display of energy generated. 10.3
4 Start of energy metering 10.4
5 Zero resets of the counters. 10.6
10.2 Energy consumed
This sub-menu displays the active power, reactive power (capacitive and inductive) and apparent power.
10.2.1 The Energy consumed display for the 3 phases (3L)
This screen displays the following information:
MPE01
Figure 76: the Energy consumed display for the 3 phases (3L)
Unit Designation
W Active power (total if 3φ)
Wh Active energy consumed.
VAR Inductive reactive power .
WARh Reactive energy consumed:
Inductive.
Capacitive.
VA Apparent power (total if 3φ)
VAh Apparent energy consumed.
10.2.2 The Energy consumed display for phase L1
This screen displays the following information:
MPE02
Figure 77: the Energy consumed display for phase L1
Unit Designation
W Active power (total if 3φ)
Wh Active energy consumed.
VAR Inductive reactive power .
Continuation of the table on the next page.

49
WARh Reactive energy consumed:
Inductive.
Capacitive.
VA Apparent power (total if 3φ)
VAh Apparent energy consumed.
PF Power factor.
DPF Displacement factor.
Tan Tangent.
Note : The information displayed for filters L2 and L3 is identical to the information described above, but relates to phases 2 & 3. The filter screen also displays the Σsame information, but relates to total values.
10.2.3 Display screen
This screen page is only available for the 3L filter. To display information, press the yellow key on the keypad with the icon .
The following data is displayed:
MPE03
Figure 78: the Peak factor display for the 3 phases (3L)
Unit Designation
PF Power factor.
DPF Displacement factor.
Tan Tangent.
10.3 Energy generated
This sub-menu displays active power and energy, reactive power and energy (capacitive and inductive) and apparent power and energy.
10.3.1 The Energy generated display for the 3 phases (3L)
This screen displays the following information:
MPE04
Figure 79: the Energy generated display for the 3 phases (3L)
Unit Designation
W Active power (total if 3φ)
Wh Active energy generated.
VAR Inductive reactive power .
WARh Reactive energy generated:
Inductive.
Capacitive.
VA Apparent power (total if 3φ)
VAh Apparent energy generated.
10.3.2 The Energy generated display for phase L1
This screen displays the following information:
MPE05
Figure 80: the Energy generated display for phase L1
Unit Designation
W Active power (total if 3φ)
Wh Active energy generated.
VAR Inductive reactive power .
WARh Reactive energy generated:
Inductive.
Capacitive.
VA Apparent power (total if 3φ)
VAh Apparent energy generated.
Continuation of the table on the next page.

50
PF Power factor.
DPF Displacement factor.
Tan Tangent.
Note : the information displayed for filters L2 and L3 is identical to the information described above, but relates to phases 2 & 3. The filter screen also displays the ΣΣΣΣsame information, but relates to total values.
10.3.3 Display screen
This screen page is only available for the 3L filter (see Figure 78). To display information, press the yellow key on the keypad with the icon .
This page displays: • The power factor • The power displacement factor • Tangent
10.4 Start of energy metering
This key starts energy metering.
To start metering, press the yellow key on the keypad with the icon :
- The date and time at which measuring starts will appear in the upper left hand part of the screen (item 1).
- The icon appears on the screen (lower right hand part of the screen).
1
MPE06
Figure 81: the Power and energy mode screen when starting energy metering
10.5 Stop of energy metering
To stop energy metering, press the yellow key on the keypad with the icon . The date and time at which measuring stops will appear in the upper right hand part of the screen:
Note : if metering is stopped, this interruption is final. No continued measuring will be possible. All energy meters will be stopped.
10.6 Zero resets of energy metering
To reset metering, press the yellow key on the keypad with the icon and the key to confirm. All energy values (consumed and generated) are reset.
Note : refer to the diagram of the 4 quadrants for powers in paragraph 17.4, p 70.

51
11. SCREEN SNAPSHOT KEY
This key can be used to: • Shoot a maximum of 50 screens for future
reference (See para 11.1). • Display previously saved screen snapshots (See
para 11.2). Saved screens may then be transferred to a PC using the PAT application (Power Analyser Transfer).
11.1 Screen shots
Press for approx. 3 seconds to shoot a screen
( ). The icon will appear in the upper left hand part of the screen instead of the icon for the active mode
during the shoot ( ). The active mode icon will re-appear when you release the key: the C.A 8335 has saved the image.
Reminder: the Qualistar+ can save a maximum of 50 screen snapshots. If the user attempts to take a 51st screen snapshot, the icon will appear at the top left hand corner of the screen instead of the icon.
PH00
Figure 82: the display screen for the list of snapshots
11.2 Handling of screen snapshots
This function enables the handling of saved screen snapshots, i.e.:
• The display of the list of screen snapshots (See para 11.2.2).
• The display of one of the screen snapshots (See para 11.2.3).
• The deletion of one or several of the screen snapshots (See para 11.2.4).
11.2.1 Available functions
To enter screen snapshot mode, rapidly press the key.
Reminder: holding the key in for approximately 3 seconds will trigger the screen snapshot function (See para 11.1).
1 2 3 4
PH00
5 6 7 8
Figure 83: example of the display of a list of screen snapshots
Item Function
1 Reminder of the mode used
2 Indicator of available image memory. The black bar shows used memory; the white bar shows available memory.
3 Current date and time.
4 Battery charge level.
5 Browser icon on screen pages. To display pages, press the yellow keys on the keypad for these icons.
6 List of saved snapshots:
Each icon ( ) shows the type of snapshot saved (recordings, alarm, wave shapes, etc.) in accordance with the mode key icons. The date and time of the screen snapshot are mentioned to the right of the icon.
7 Display sub-menu for the list of screen snapshots (current sub-menu).
8 Deletion sub-menu for a screen snapshot.
11.2.2 Viewing of the list of snapshots
You may display the list of screen snapshots saved when using any active function. Press briefly to display this list. The screen presents the list of snapshots (see Figure 83).

52
11.2.3 View of a snapshot from the list
To display a snapshot, proceed as follows:
1. Press . The icon is active and the list of snapshots is displayed (see Figure 83).
2. Select the snapshot to be viewed using the keys. The date and time of the selected snapshot are noted in bold.
3. Press to display the selected snapshot. The top left hand side of the screen displays the icon, alternating with the icon corresponding to the active
mode ( ).
Press to return to the list of screen snapshots.
11.2.4 Deletion of a snapshot from the list
To delete a snapshot, proceed as follows:
1. The screen presents the list of snapshots (see Figure 83 for example). Select the sub-menu (bottom of the screen) by pressing the yellow key on the keypad with this icon.
2. Select the snapshot to be deleted using the keys. The date and time of the selected snapshot are noted in bold.
3. Press to delete the selected snapshot. The snapshot has been deleted from the list.
Press to return to the list of screen snapshots.

53
12. HELP KEY
The key provides information on the functions and symbols used for the current display mode.
Information is displayed as follows:
1 2 3 4
HELP
5 6 7
Figure 84: example of the help page for the power and energy mode, page 1
Item Function
1 Reminder of the mode used
2 Reminder of the current mode.
3 Current date and time.
4 Battery charge level.
5 Help page 1 .
6 Help page 2 .
7 List of information.

54
13. USE
The C.A 8335 must be configured in accordance with chapter 4 prior to measurements.
The following precautions for use must be complied with:
Do not connect any voltages exceeding 1,000V RMS in relation to the earth. When connecting and disconnecting accumulators,
check that measuring leads are disconnected.
13.1 Start-up
Press the key on the keypad to start the C.A. 8335. The illuminated indicator (green LED) will light up when pressed and then go out. The home page will be displayed during the loading of the software application. The version of the software application and the serial number of the C.A 8335 are indicated in the lower left hand part of the screen.
Splash
Figure 85: initial home page
The wave shapes page will appear after 5 seconds.
WF22
Figure 86: wave shapes' screen
The C.A 8335 is battery operated only if the battery is adequately charged. If the battery is not adequately charged, the alarm message "Low battery, the device will cease operating shortly" will appear (See para 3.6, p 9). The device may be used with the specific mains supply connected to the plug (Figure 4. item 2); the battery will not be required in this case.
The illuminated indicator will remain lit when the device is supplied by the specific mains supply. A flashing indicator implies that the machine is in stand-by mode when the mains supply is not connected.
13.2 Configuration of the C.A 8335
To configure the C.A. 8335, proceed as follows:
1. Press when the device is on. The configuration screen will appear.
2. Press to select the parameter to be modified. Press to enter the selected sub-menu.
SU00
Figure 87: Configuration screen
Use and to browse and to confirm in the displayed sub-menu. See paras 4.3 - 4.12 for details.
Note : The following points must be checked or adapted for each measurement:
Function See para.
Define the configuration for calculation methods.
4.6
Selection of the type of connection (5-wire single phase/three phase).
4.7
Programming of the transformation ratio depending on the type of current sensor connected.
4.8
Values to be recorded (trend mode). 4.9
Definition of alarm thresholds. 4.10
Press to return to the Configuration screen.

55
13.3 Installation of leads
Insert the leads as follows:
1 2
Figure 88: upper connectors
Item Function
1 4 current input connectors for current sensors (MN clamp, C clamp, AmpFLEX™, PAC clamp, etc.).
2 5 voltage input connectors
Connect the measuring leads to the C.A 8335 as follows:
Current measurement: 4-point connector (item 1). Do not forget to define the transformation ratio on the current sensor (See para 4.8 page 13).
Measurement of the voltage (item 2): L1/A, L2/B, L3/C & N/D terminals.
Measuring leads are connected to the circuit to be studied according to the following diagrams.
13.3.1 Single phase network
Figure89: single phase connection
13.3.2 Two phase network
Figure90: two phase connection
13.3.3 3 or 4 wire three-phase network
Figure 91: 3 or 4 wire three-phase connection
13.3.4 5-wire three phase network
Figure 92: 5-wire three phase connection
13.4 Wave shape capture
Reminder: all screens can be saved (screen snapshot) by pressing the key. See chapter 11, page 51.
Press when the C.A 8335 has a power supply and is connected to the network (current and voltage measuring leads).
13.4.1 Display of the Transition mode
See para 5.2, page 17.
13.4.2 Display of the inrush current mode
See para 5.3, page 20.
13.5 Display of harmonics
Reminder: all screens can be saved (screen snapshot) by pressing the key. See chapter 11, page 51.
Press when the C.A 8335 has a power supply and is connected to the network (current and voltage measuring leads).
13.5.1 Single voltage display
See para 6.2, page 24.
13.5.2 Current display
See para 6.3, page 26.
13.6 Measuring wave shapes
Reminder: all screens can be saved (screen snapshot) by pressing the key. See chapter 11, page 51.
Press when the C.A 8335 has a power supply and is connected to the network (current and voltage measuring leads).
13.6.1 Display of true RMS measurements
See para 7.2, page 31.
13.6.2 Display of measurements of total harmonic distorsion
See para 7.3, page 33.
13.6.3 Display of peak factor measurements
See para 7.4, page 34.
13.6.4 Display of extreme and mean values (voltage and current)
See para 7.5, page 36.

56
13.6.5 Simultaneous display
See para 7.6, page 38.
13.6.6 Display of Fresnel diagram
See para 7.7, page 39.
13.7 Alarm detection
Reminder: all screens can be saved (screen snapshot) by pressing the key. See chapter 11, page 51.
Press when the C.A 8335 has a power supply and is connected to the network (current and voltage measuring leads).
13.7.1 Configuration of alarm mode
Configure the values to be monitored in accordance with paragraph 8.2, page 41.
13.7.2 Programming of an alarm run
See para 8.3, page 42.
13.7.3 Auto power-off
The alarm recording run will automatically be stopped at the End time and date programmed by the operator.
13.7.4 Manual cut-off
Use the function in accordance with paragraph 8.3.3, page 42.
13.7.5 Display of the alarm log
See para 8.4, page 42.
13.7.6 Deletion of the alarm log
See para 8.5, page 43.
13.8 Recording
Reminder: all screens can be saved (screen snapshot) by pressing the key. See chapter 11, page 51.
Press when the C.A 8335 has a power supply and is connected to the network (current and voltage measuring leads).
13.8.1 Configuration of recording
See para 9.3, page 45.
13.8.2 Programming of recording
See para 9.2, page 44.
13.9 Measurement of energy
Reminder: all screens can be saved (screen snapshot) by pressing the key. See chapter 11, page 51.
Press when the C.A 8335 has a power supply and is connected to the network (current and voltage measuring leads).
13.9.1 Measurement of energy consumed
See para 10.2, page 48.
13.9.2 Measurement of energy generated
See para 10.3, page 49.
13.10 Transfer of data to the PC
The PAT transfer software automatically defines the communication speed between the PC and the C.A 8335. All measurements taken by the Qualistar+ will be saved. These measurements may be transferred to a PC for future reference.
Note : the transfer will not delete the data saved.
13.11 Deleting data
Data saved may be deleted prior to a new test run to free memory. See para 4.11 page 16.
13.12 Turning the C.A 8335 off
Press the key to turn the C.A. 8335 off.
The C.A 8335 may not be turned off during recording (See para 9.2.2, page 45) without confirmation. The following message will appears:
Sdown
Select Yes or No using the keys, and press to validate.
• If No is selected, the recording will continue. • If Yes is selected, the data recorded until that point
will be saved and the device will turn off.
13.13 Supply of the C.A 8335
13.13.1 Battery recharge
See para 3.6.3, page 9.
13.13.2 Mains operation
See para 3.6.6, page 10.
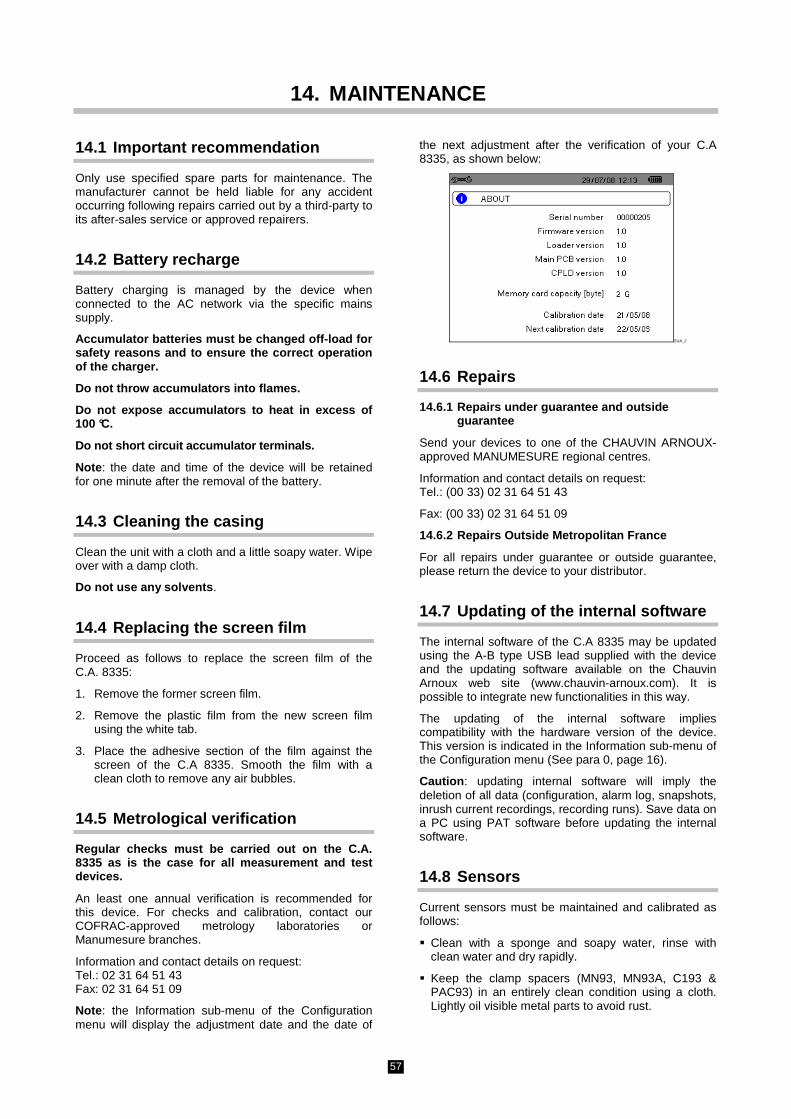
57
14. MAINTENANCE
14.1 Important recommendation
Only use specified spare parts for maintenance. The manufacturer cannot be held liable for any accident occurring following repairs carried out by a third-party to its after-sales service or approved repairers.
14.2 Battery recharge
Battery charging is managed by the device when connected to the AC network via the specific mains supply.
Accumulator batteries must be changed off-load for safety reasons and to ensure the correct operation of the charger.
Do not throw accumulators into flames.
Do not expose accumulators to heat in excess of 100 °C.
Do not short circuit accumulator terminals.
Note : the date and time of the device will be retained for one minute after the removal of the battery.
14.3 Cleaning the casing
Clean the unit with a cloth and a little soapy water. Wipe over with a damp cloth.
Do not use any solvents .
14.4 Replacing the screen film
Proceed as follows to replace the screen film of the C.A. 8335:
1. Remove the former screen film.
2. Remove the plastic film from the new screen film using the white tab.
3. Place the adhesive section of the film against the screen of the C.A 8335. Smooth the film with a clean cloth to remove any air bubbles.
14.5 Metrological verification
Regular checks must be carried out on the C.A. 8335 as is the case for all measurement and test devices.
An least one annual verification is recommended for this device. For checks and calibration, contact our COFRAC-approved metrology laboratories or Manumesure branches.
Information and contact details on request: Tel.: 02 31 64 51 43 Fax: 02 31 64 51 09
Note : the Information sub-menu of the Configuration menu will display the adjustment date and the date of
the next adjustment after the verification of your C.A 8335, as shown below:
SUA_2
14.6 Repairs
14.6.1 Repairs under guarantee and outside guarantee
Send your devices to one of the CHAUVIN ARNOUX-approved MANUMESURE regional centres.
Information and contact details on request: Tel.: (00 33) 02 31 64 51 43
Fax: (00 33) 02 31 64 51 09
14.6.2 Repairs Outside Metropolitan France
For all repairs under guarantee or outside guarantee, please return the device to your distributor.
14.7 Updating of the internal software
The internal software of the C.A 8335 may be updated using the A-B type USB lead supplied with the device and the updating software available on the Chauvin Arnoux web site (www.chauvin-arnoux.com). It is possible to integrate new functionalities in this way.
The updating of the internal software implies compatibility with the hardware version of the device. This version is indicated in the Information sub-menu of the Configuration menu (See para 0, page 16).
Caution : updating internal software will imply the deletion of all data (configuration, alarm log, snapshots, inrush current recordings, recording runs). Save data on a PC using PAT software before updating the internal software.
14.8 Sensors
Current sensors must be maintained and calibrated as follows:
Clean with a sponge and soapy water, rinse with clean water and dry rapidly.
Keep the clamp spacers (MN93, MN93A, C193 & PAC93) in an entirely clean condition using a cloth. Lightly oil visible metal parts to avoid rust.

58
15. GENERAL SPECIFICATIONS
15.1 Casing
Housing: rigid cast housing with a yellow thermo-adhesive elastomer.
Connectors: 5 for voltage measurement sockets.
4 special current connectors (automatic recognition of current sensors).
a connector for specific mains supply.
a connector for the USB link.
a connector for the SD memory board. This connector is located in the gate behind the C.A 8335, under the accumulators.
Keys: functions, browsing and modes. Use with the assigned gloves.
Metal ring: located on the back of the C.A 8335 to enable the attachment of the device with a lock.
Stand: to maintain the device at 53° from the horizontal.
Gate: to access the accumulators on the rear of the instrument.
Dimensions: Total: 200 x H 250 x D 67
Screen: 320 x 240 pixels l 118 mm x H 90 mm diagonal 148 mm
Weight: 1950 g (with accumulators).
15.2 Power supply
15.2.1 Mains power supply
Type: specific external mains supply: 600 V,RMS, category IV – 1000 V,RMS, category III.
Range for use:
230 V ± 10 % @ 50 Hz and 120 V ± 10 % @ 60 Hz.
Max. power: 40 VA.
15.2.2 Battery supply
The C.A 8335 may be used without any connection to the mains supply. The battery also enables the use of the Qualistar+ in power cuts.
Battery: 8 rechargeable NiMH accumulators.
Capacity: 4000 mAh as a minimum
Nominal voltage:
1.2 V per element, i.e. a total of 9.6 V
Life duration: a minimum of 500 recharge-discharge cycles
Charge current:
1 A
Charge time: approx. 5 hours
Service T°: [0 °C; 50 °C]
Recharge T° [10 °C; 40 °C]
Storage T° storage ≤ 30 days: [-20 °C; 50 °C]
storage of 30 - 90 days: [-20 °C; 40 °C]
storage of 90 days - 1 year: [-20 °C; 30 °C]
15.2.3 Consumption
With luminosity at 50%: 300 mA
Display-free stand-by mode: 100 mA
15.3 Range for use
15.3.1 Environmental conditions
15.3.1.1 Climatic conditions
The following chart shows conditions relating to ambient temperature and humidity:
1 = Field of reference.
2 = Range of use
Caution : in temperatures above 40 °C, the device must only be used with the "battery" OR with a "specific external mains supply" - the simultaneous use of the battery AND the specific external mains supply for the device is prohibited .
3 = Storage range with accumulators.
4 = Storage range without accumulators.
59
15.3.1.2 Altitude
Use: [0 m; 2,000 m]
Storage: [0 m; 10,000 m]
15.3.2 Mechanical conditions
According to IEC 61010-1, the C.A 8335 is considered as a MOBILE DEVICE (HAND-CARRIED) .
Operating position: indifferent.
Reference position during operation: on a horizontal plane, resting on its stand or lying flat.
Rigidity (IEC 61010-1): force of 30 N applied to the entire envelope of the supported device (at 40 °C).
Chute (IEC 61010-1): 1 m in the position assumed to be the most damaging; the chute sanction is: no permanent mechanical damage and no functional damage.
Impermeability: IP 50 as per NF EN 60529 A1 (electric IP2X for terminals).
15.3.3 Electromagnetic compatibility
15.3.3.1 Immunity as per NF EN 613261 - 1 A3
Resistance to electrostatic discharges (IEC 61000-4-2)
1st level : Gravity : 4 kV in contact Sanctions : CRITERION A
2nd level : Gravity : 8 kV in the air
Sanctions : CRITERION A
Resistance to radiation (as per IEC 61000-4-3 and IEC 61000-4-8)
Gravity: 10 V.m-1
Sanctions: CRITERION B (THDA altered on the Rogowsky chain)
Resistance to rapid transient bursts (IEC 61000-4-4)
Gravity: 2 kV on voltage input and supply 1 kV on current input Sanctions: CRITERION A
Resistance to electric shocks (as per IEC 61000-4-5)
Gravity: 2 kV on voltage input in differential mode 1 kV on voltage input in collective mode Sanctions: CRITERION A
Conducted RF interference (as per IEC 61000-4-6) Gravity: 3 V on voltage input and supply Sanctions: CRITERION A
Voltage interruption (as per IEC 61000-4-11)
Gravity: 100% loss over a supply period Sanctions: CRITERION A
15.3.3.2 Emission as per NF EN 61326 - 1 A3
Class A equipment (no supply – mains).
Class B equipment (with supply – mains - unit wire failure).
15.4 User safety
Application of safety rules as per IEC 61010-1. (Isolation of voltage input using protective impedances).
Pollution type 2.
Installation category IV* and service voltage 600 VRMS.
Double isolation on I/O in relation to the earth (symbol ).
Double isolation between the voltage and supply input and other I/O (symbol ).
Indoor use
(*) Caution : the assigned voltage and measuring category of the "device + current sensor" unit may differ from the characteristics of the device alone.
- the use of AmpFLEX™, of Mini-AmpFLEX and C clamps mains the "device + current sensor" unit at 600 V category IV or 1000 V category III.
- the use of PAC, MN93 and MN93A clamps damages the "device + current sensor" unit at 300 V category IV or 600 V category III.
- the use of the downgraded 5A adapter damages the "device + current sensor" unit at 150 V category IV or 300 V category III.
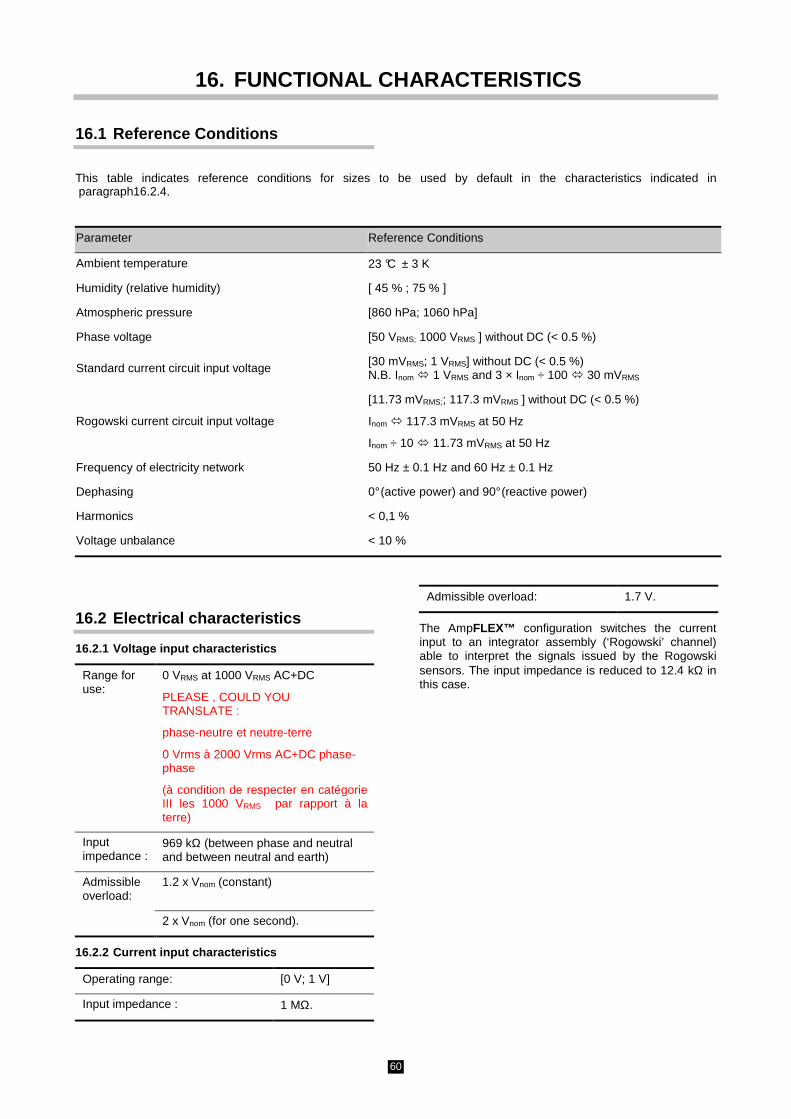
60
16. FUNCTIONAL CHARACTERISTICS
16.1 Reference Conditions
This table indicates reference conditions for sizes to be used by default in the characteristics indicated in paragraph 16.2.4.
Parameter Reference Conditions
Ambient temperature 23 °C ± 3 K
Humidity (relative humidity) [ 45 % ; 75 % ]
Atmospheric pressure [860 hPa; 1060 hPa]
Phase voltage [50 VRMS; 1000 VRMS ] without DC (< 0.5 %)
Standard current circuit input voltage [30 mVRMS; 1 VRMS] without DC (< 0.5 %) N.B. Inom 1 VRMS and 3 × Inom ÷ 100 30 mVRMS
Rogowski current circuit input voltage
[11.73 mVRMS;; 117.3 mVRMS ] without DC (< 0.5 %)
Inom 117.3 mVRMS at 50 Hz
Inom ÷ 10 11.73 mVRMS at 50 Hz
Frequency of electricity network 50 Hz ± 0.1 Hz and 60 Hz ± 0.1 Hz
Dephasing 0° (active power) and 90° (reactive power)
Harmonics < 0,1 %
Voltage unbalance < 10 %
16.2 Electrical characteristics
16.2.1 Voltage input characteristics
Range for use:
0 VRMS at 1000 VRMS AC+DC
PLEASE , COULD YOU TRANSLATE :
phase-neutre et neutre-terre
0 Vrms à 2000 Vrms AC+DC phase-phase
(à condition de respecter en catégorie III les 1000 VRMS par rapport à la terre)
Input impedance :
969 kΩ (between phase and neutral and between neutral and earth)
Admissible overload:
1.2 x Vnom (constant)
2 x Vnom (for one second).
16.2.2 Current input characteristics
Operating range: [0 V; 1 V]
Input impedance : 1 MΩ.
Admissible overload: 1.7 V.
The AmpFLEX™ configuration switches the current input to an integrator assembly (‘Rogowski’ channel) able to interpret the signals issued by the Rogowski sensors. The input impedance is reduced to 12.4 kΩ in this case.

61
16.2.3 Bandwidth
Means of measurement:
256 points per period, i.e.:
Per 50 Hz: 6.4 kHz (256 × 50 ÷ 2).
Per 60 Hz: 7.68 kHz (256 × 60 ÷ 2).
Analog at -3 dB: > 10 kHz.
16.2.4 Characteristics of the device alone
(excluding the current sensor)
The following data apply for ideal current sensors (full linearity and no phase displacement). Current characteristics (and derived values) are specified for each of the two configurations respectively: "excluding AmpFLEX™ & Mini-AmpFLEX" and "AmpFLEX™ & Mini-AmpFLEX".

62
Measurement scope
Measuring
Minimum Maximum
Display resolution
Maximum error in the
field of reference
Frequency 40 Hz 69 Hz 0.01 Hz ±(1 pt)
0.1 V V < 1000 V ±(0.5 % + 2 pts) Phase voltage
TRMS 10 V 1,000 V(1) 1 V
V ≥ 1000 V ±(0.5 % + 1 pt)
0.1 V V < 1000 V ±(0.5 % + 2 pts) Composite voltage
TRMS 10 V 2,000 V(2) 1 V
V ≥ 1000 V ±(0.5 % + 1 pt)
0.1 V V < 1000 V ±(1 % + 5 pts)
DC voltage 10 V 1000 V 1 V
V ≥ 1000 V ±(1 % + 1 pt)
0.1 A I < 1000 A ±(0.5 % + 2 pts)
Excluding AmpFLEX™
& Mini- AmpFLEX
Inom ÷ 1000 [A]
1.2 × Inom [A] 1 A
I ≥ 1000 A ±(0.5 % + 1 pt)
0.1 A I < 1000 A
Current TRMS
AmpFLEX™ &
Mini- AmpFLEX 10 A 6500 A
1 A I ≥ 1000 A
±(0.5 % + 1 A)
0.1 A I < 1000 A
Direct current 1 A 1200 A(3) 1 A
I ≥ 1000 A
±(1 % + 1 A)
Excluding AmpFLEX™
& Mini- AmpFLEX
Inom ÷ 1000 [A]
1.7 × Inom [A](4)
0.1 A I < 1000 A
Peak current AmpFLEX™
& Mini- AmpFLEX
10 A 9,190 A(5) 1 A
I ≥ 1000 A
±(1 % + 1 A)
0.1 A I < 1000 A
Excluding AmpFLEX™
& Mini- AmpFLEX
Inom ÷ 100 [A]
1.2 × Inom [A] 1 A
I ≥ 1000 A
±(1 % + 1 A)
0.1 A I < 1000 A
Half-period TRMS
current (7) AmpFLEX™ &
Mini- AmpFLEX 100 A 6500 A
1 A I ≥ 1000 A
±(1.5 % + 4 A)
0.1 V V < 1000 V
Peak phase voltage 10 V 1414 V(6) 1 V
V ≥ 1000 V
±(1 % + 1 V)
0.1 V U < 1000 V
Peak composite voltage 10 V 2828 V(7) 1 V
U ≥ 1000 V
±(1 % + 1 V)
(1) In 1000 VRMS, category III, providing that voltage between each of the terminals and the earth does not exceed 1000 VRMS. (2) Two phase (opposite phases) – same note as (1). (3) Limitation of the PAC clamp.
(4) nomInomI ×=×× 7,122,1
(5) 919026500 =×
(6) 141421000 =×
(7)(7)(7)(7) 282822000 =×

63
Measurement scope
Measuring
Minimum Maximum
Display resolution
Maximum error in
the field of reference
0.1 V V < 1000 V Phase voltage TRMS
half-period (3) 10 V 1,000 V(1) 1 V
V ≥ 1000 V
±(0.8 % + 1 V)
0.1 V U < 1000 V Composite voltage TRMS
half-period (3) 10 V 2,000 V(2) 1 V
U ≥ 1000 V
±(0.8 % + 1 V)
1 3,99 0,01 ±(1 % + 2 pts) Peak factor
4 9,99 0,01 ±(5 % + 2 pts)
±(1 %) Cos φ ≥ 0.8
Excluding AmpFLEX™
& Mini- AmpFLEX
0 Ω 9999 kW 1 V
U ≥ 1000 V ±(1.5 %+10 pts) 0,2 ≤ Cos φ < 0.8
±(1 %) Cos φ ≥ 0.8
Active power
AmpFLEX™ &
Mini- AmpFLEX 0 Ω 9999 kW 4 digits
±(1.5 %+10 pts) 0.5 ≤ Cos φ < 0.8
±(1 %) Sin φ ≥ 0.5
Excluding AmpFLEX™
& Mini- AmpFLEX
0 VAR 9999 kVAR 4 digits ±(1.5 %+10 pts) 0.2 ≤ Sin φ < 0.5
±(1.5 %) Sin φ ≥ 0.5
Reactive powers
inductive
& capacitive
AmpFLEX™ &
Mini- AmpFLEX 0 VAR 9999 kVAR 4 digits
±(2.5 %+20 pts) 0.2 ≤ Sin φ < 0.5
Apparent power 0 VA 9999 kVA 4 digits ±(1 %)
±(1.5 %) Cos φ ≥ 0.5
Power factor -1 1 0,001 ±(1.5 %+10 pts) 0,2 ≤ Cos φ < 0.5
(1) In 1000 VRMS, category III, providing that voltage between each of the terminals and the earth does not exceed 1000 VRMS. (2) Two phase (opposite phases) – same note as (1). (3) Caution : The absolute value of offset must not exceed 95% of peak amplitude. In other words, s(t) = S × sin(ωt) + O, we have |O| ≤ 0.95 × S (with positive S). MAX and MIN values in wave shape mode and the values VRMS and ARMS (excluding neutral channels) in Alarm and Inrush current modes are half-period values.
Note : the uncertainties given for power and energy measurements are maximum for |Cos φ| = 1 or |Sin φ| = 1 and are typical for other phase displacement values.

64
Measurement scope
Measuring
Minimum Maximum
Display resolution
Maximum error in
the field of reference
±(1 %) Cos φ ≥ 0.8
Excluding AmpFLEX™
& Mini- AmpFLEX
0 Wh 9999 MWh 4 digits ±(1,5 %)
0,2 ≤ Cos φ < 0.8 ±(1 %)
Cos φ ≥ 0.8
Active energy
AmpFLEX™ &
Mini- AmpFLEX 0 Wh 9999 MWh 4 digits
±(1,5 %) 0,5 ≤ Cos φ < 0.8
±(1 %) Sin φ ≥ 0.5
Excluding AmpFLEX™
& Mini- AmpFLEX
0 VARh 9999 MVARh 4 digits ±(1,5 %)
0,2 ≤ Sin φ < 0.5
±(1.5 %) Sin φ ≥ 0.5
Reactive energies
inductive
& capacitive
AmpFLEX™ &
Mini- AmpFLEX 0 VARh 9999 MVARh 4 digits
±(2,5 %) 0,2 ≤ Sin φ < 0.5
Apparent energy 0 VAh 9999 MVAh 4 digits ±(1 %)
Dephasing -179° 180° 1° ±(2°) 0.001
Tan φ < 10 Tangent VA ≥≥≥≥ 50 VA
-32.76 32.76 0.01
Tan φ ≥ 10
±(1°) for φ
Displacement factor (DPF) -1 1 0.001
±(1°) for φ &
±(5 pts) for DPF
Harmonic rates ∈∈∈∈ [1; 50]
(VRMS > 50 V)
Excluding AmpFLEX™ &
Mini- AmpFLEX (IRMS > 3 × Inom ÷ 100)
AmpFLEX™ &
Mini- AmpFLEX (IRMS > Inom ÷ 10)
0 % 999,9 % 0,1 % ±(1 % + 5 pts)
Harmonic angles (VRMS > 50 V)
Excluding AmpFLEX™ &
Mini- AmpFLEX (IRMS > 3 × Inom ÷ 100)
±(3°) ∈ [1; 25]
AmpFLEX™ &
Mini- AmpFLEX (IRMS > Inom ÷ 10)
-179° 180° 1°
±(10°) ∈ [26; 50]
Global harmonic rate (THD or THD-F)
rank ≤≤≤≤ 50 0 % 999,9 % 0,1 % ±(1 % + 5 pts)
Distorsion factor (DF or THD-R)
≤≤≤≤ 50 0 % 999,9 % 0,1 % ±(1 % + 10 pts)
Factor K 1 99,99 0,01 ±(5 %)
Unbalance (three phase network) 0 % 100 % 0,1 % ±(1 %)

65
16.2.5 Current sensor characteristics (after linearisation)
Sensor errors are offset by typical correction inside the device. This typical correction is applied for phase and amplitude depending on the type of sensor connected (detected automatically) and the gain in the current acquisition channel required.
The RMS current measurement error and phase error correspond to additional errors (added to device errors) indicated as parameters for the calculations carried out by the analyser (power, energy, power factors, tangents, etc.).

66
Type of sensor Current TRMS Maximum
error for I RMS
Maximum error for φφφφ
[1 A; 10 A] N.S.
[10 A; 100 A] ±(1.5 % + 1 A) ±(2°)
[100 A; 800 A] ±(3 %) PAC93 clamp
1000 A
[800 A; 1200 A] ±(5 %) ±(1,5°)
[1 A; 3 A] N.S.
[3 A; 10 A] ±(0,8 %) ±(1°)
[10 A; 100 A] ±(0,3 %) ±(0,5°) C193 clamp
1000 A
[100 A; 1200 A] ±(0,2 %) ±(0,3°)
[10 A; 100 A] ±(3 %) ±(1°) AmpFLEX™ A193 6500 A [100 A; 6500 A] ±(2 %) ±(0,5°)
[10 A; 100 A] ±(3 %) ±(1°) Mini- AmpFlex MA193 6500 A [100 A; 6500 A] ±(2 %) ±(0,5°)
[0.5 A; 2 A] N.S.
[2 A ; 10 A[ ±(3 % + 1 A)
±(6°) [10 A; 100 A] ±(2.5 % + 1 A) ±(3°)
MN93 clamp 200 A
[100 A; 240 A] ±(1 % + 1 A) ±(2°) [100 mA; 300 mA] N.S.
[300 mA; 1 A] ±(0.7 % + 2 mA) ±(1,5°) MN93A clamp
100 A [1 A; 120 A] ±(0,7 %) ±(0,7°)
[5 mA; 50 mA] ±(1 % + 0.1 mA) ±(1,7°)
[50 mA ; 500 mA[ ±(1 %) MN93A clamp
5 A [500 mA; 6 A] ±(0,7 %)
±(1°)
[5 mA; 50 mA] ±(1 %) ±(1°) Adapter 5 A [50 mA; 6 A] ±(0,5 %) ±(0°)
N.S. = "Not Specified"

67
17. APPENDICES
This chapter presents the mathematical formulae used for calculating different parameters for C.A.8335.
17.1 Mathematical formulae
17.1.1 Network frequency and sample
The sample is applied to the network frequency to obtain 256 samples per period of 40Hz to 70Hz. Feedback is essential for calculating reactive power, imbalance and harmonic rates and angles.
Frequency measurement is determined by analysing seven passes by zero positive and consecutive on the first voltage channel (V1) or the first current channel (I1) after digital low-pass filtering and deletion of the continuous component.
The precise temporal measurement of the zero pass point is achieved by linear interpolation between two samples to achieve better solution than 0.002%.
Signals are acquired with a 16 bit converter and (in the event of current acquisition) dynamic gain switches.
17.1.2 Efficient values of half-cycle voltage and current (excluding neutral)
Simple phase I+1 half-cycle voltage
[ ] [ ][ ] 1
Vdem
:
2∑⋅=suivantZéro
Zéron
niVNechDemPer
i
Efficient phase I+1 half-cycle voltage
[ ] [ ][ ] 1
Udem
:
2∑⋅=suivantZéro
Zéron
niUNechDemPer
i
Efficient phase I+1 half-cycle current
[ ] [ ][ ] 1
Adem
:
2∑⋅=suivantZéro
Zéron
niANechDemPer
i
Note: these values are calculated for each half-cycle so as not to miss any fault.
17.1.3 Minimum and maximum half-cycle efficient values (excluding neutral)
Vmax Vdem , Vmin Vdem i i i i= =max( ) min( )
Umax Udem , Umin Udem i i i i= =max( ) min( )
Amax Adem , Amin Adem i i i i= =max( ) min( )
17.1.4 Flicker for voltages (ex neutral)
Method inspired by the CEI 61000 – 4 –15 standard.
Input values are simple half-cycle voltages. Blocks 3 and 4 are created digitally. The classifier of block 5 has 128 levels.
The Vflk[i] values are updated every 10 minutes.
17.1.5 Peak values for voltages and currents
i = 3 neutral – except for Upp and Upm
Vpp V n , Vpm V n n 0..NECHPER -1i i i i= = ∈max( ) min( )
Upp U n , Upm U n n 0..NECHPER -1i i i i= = ∈max( ) min( )
App A n , Apm A n n 0..NECHPER -1i i i i= = ∈max( ) min( )
Peak factors for voltages (ex neutral)
Peak factor for simple phase i+1 voltage
[ ] [ ] [ ][ ][ ]∑
−
=
⋅=
1
0
21
)iVpm,imax(VppVcf
NECHPER
n
niVNECHPER
i
Peak factor for composite phase i+1 voltage
[ ] [ ] [ ][ ][ ]∑
−
=
⋅=
1
0
21
)iUpm,imax(UppUcf
NECHPER
n
niUNECHPER
i
Phase i+1 current peak factor
[ ] [ ] [ ][ ][ ]∑
−
=
⋅=
1
0
21
)iApm,imax(AppAcf
NECHPER
n
niANECHPER
i
17.1.6 Efficient values 1s of voltage and current
(i = 3 neutral – except Urms)
Simple efficient voltage i+1
[ ] [ ][ ] 1Vrms1
0
2∑−
=⋅=NechSec
n
niVNechSec
i
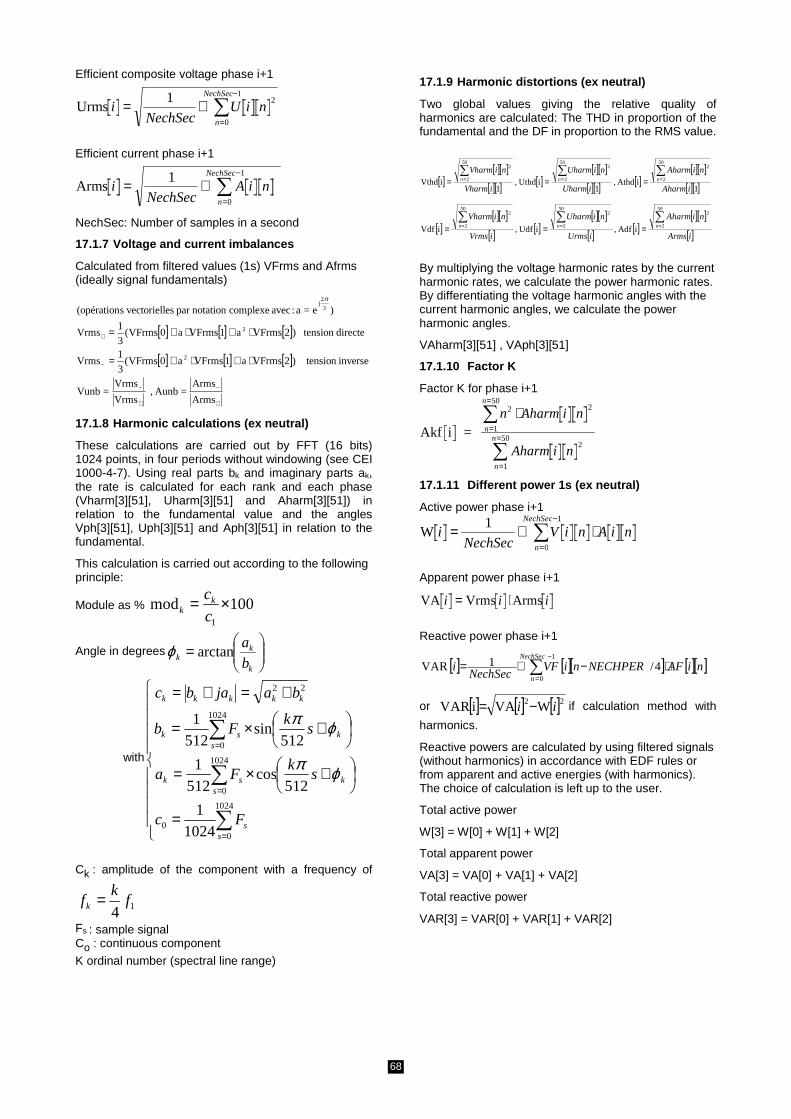
68
Efficient composite voltage phase i+1
Urms Tension composée efficace phase iiNechSec
U i nn
NechSec
= ⋅=
−
∑1 2
0
1
Efficient current phase i+1
Arms iNechSec
A i nn
NechSec
= ⋅=
−
∑1
0
1
NechSec: Number of samples in a second
17.1.7 Voltage and current imbalances
Calculated from filtered values (1s) VFrms and Afrms (ideally signal fundamentals)
[ ] [ ] [ ]
[ ] [ ] [ ]
Arms
Arms=Aunb ,
Vrms
Vrms=Vunb
inversen tensio)2VFrmsa1VFrmsa0VFrms(3
1Vrms
directe tension)2VFrmsa1VFrmsa0VFrms(3
1Vrms
)e=a : avec complexenotation par les vectoriels(opération
2
2
3
2j
+
−
+
−
−
+
⋅+⋅+=
⋅+⋅+=
π
17.1.8 Harmonic calculations (ex neutral)
These calculations are carried out by FFT (16 bits) 1024 points, in four periods without windowing (see CEI 1000-4-7). Using real parts bk and imaginary parts ak, the rate is calculated for each rank and each phase (Vharm[3][51], Uharm[3][51] and Aharm[3][51]) in relation to the fundamental value and the angles Vph[3][51], Uph[3][51] and Aph[3][51] in relation to the fundamental.
This calculation is carried out according to the following principle:
Module as % 100mod1
×=c
ckk
Angle in degrees
=
k
kk b
aarctanϕ
with
=
+×=
+×=
+=+=
∑
∑
∑
=
=
=
1024
00
1024
0
1024
0
22
10241
512cos
5121
512sin
5121
ss
sksk
sksk
kkkkk
Fc
sk
Fa
sk
Fb
bajabc
ϕπ
ϕπ
Ck : amplitude of the component with a frequency of
14f
kfk =
Fs : sample signal Co : continuous component
K ordinal number (spectral line range)
17.1.9 Harmonic distortions (ex neutral)
Two global values giving the relative quality of harmonics are calculated: The THD in proportion of the fundamental and the DF in proportion to the RMS value.
[ ][ ][ ]
[ ][ ] [ ][ ][ ]
[ ][ ] [ ][ ][ ]
[ ][ ]1iAthd ,
1i Uthd,
1iVthd
50
2
250
2
250
2
2
iAharm
niAharm
iUharm
niUharm
iVharm
niVharmnnn∑∑∑
=== ===
[ ][ ][ ]
[ ] [ ][ ][ ]
[ ] [ ][ ][ ]
[ ]iArms
niAharm
iUrms
niUharm
iVrms
niVharmnnn∑∑∑
=== ===
50
2
250
2
250
2
2
iAdf , i Udf, iVdf
By multiplying the voltage harmonic rates by the current harmonic rates, we calculate the power harmonic rates. By differentiating the voltage harmonic angles with the current harmonic angles, we calculate the power harmonic angles.
VAharm[3][51] , VAph[3][51]
17.1.10 Factor K
Factor K for phase i+1
Akf i = n Aharm i n
Aharm i n
n
n
n
n
2 2
1
50
2
1
50
⋅=
=
=
=
∑
∑
17.1.11 Different power 1s (ex neutral)
Active power phase i+1
W Puissance active phase iiNechSec
V i n A i nn
NechSec
= ⋅ ⋅=
−
∑1
0
1
Apparent power phase i+1
VA Vrms Arms Puissance apparente phase ii i i= ⋅
Reactive power phase i+1
[ ] [ ][ ] [ ][ ]∑−
=⋅−⋅=
1
0
4/1VARNechSec
n
niAFNECHPERniVFNechSec
i
or [ ] [ ] [ ]22 WVAiARV ii −= if calculation method with
harmonics.
Reactive powers are calculated by using filtered signals (without harmonics) in accordance with EDF rules or from apparent and active energies (with harmonics). The choice of calculation is left up to the user.
Total active power
W[3] = W[0] + W[1] + W[2]
Total apparent power
VA[3] = VA[0] + VA[1] + VA[2]
Total reactive power
VAR[3] = VAR[0] + VAR[1] + VAR[2]

69
17.1.12 Different rates (ex neutral)
PFW
VA Facteur de puissance phase i +1
DPF Facteur de déplacement phase i+1
Tan i Tangente phase i +1
ii
i
i i
i
=
=
=
cos( )
tan( )
φφφφ
φφφφ
Cosine angle between voltage fundamental and i + 1 phase current
cos(φφφφ iVF i n AF i n
VF i n AF i n
n
NechSec
n
NechSec
n
NechSec) cosinus angle entre fondamental tension et courant phase i=
⋅
⋅
=
−
=
−
=
−
∑
∑ ∑
0
1
2
0
12
0
1
[ ] [ ] [ ] [ ]
[ ] [ ] [ ] [ ]
[ ] [ ] [ ] [ ] totaleTangente
3
2Tan1Tan0Tan3Tan
t totaldéplacemen deeur Fact3
2DPF1DPF0DPF3DPF
totalpuissance deur Facte 3
2PF1PF0PF 3PF
++=
++=
++=
17.1.13 Different energies (ex neutral)
• Case 1 consumed energy (W[i] ≥ 0)
Consumed active power phase i+1
[ ][ ] [ ]
36000Wh
Tint∑= iW
i
Consumed apparent power phase i+1
[ ][ ] [ ]
36000VAh
Tint∑= iVA
i
Consumed reactive power phase i+1
[ ][ ] [ ] [ ] 0iVARpour 3600
0VARhLTint
≥=∑iVAR
i
Consumed capacitive reactive power phase i+1
[ ][ ] [ ] [ ] 0iVARpour 3600
0VARhCTint
≤−=∑iVAR
i
Total consumed active power
Wh[0][3] = Wh[0][0] + Wh[0][1] + Wh[0][2]
Total consumed apparent power
VAh[0][3] = VAh[0][0] + VAh[0][1] + VAh[0][2]
Total consumed reactive capacitive power
VARhC[0][3] = VARhC[0][0] + VARhC[0][1] + VARhC[0][2]
Total consumed reactive inductive power
VARhL[0][3] = VARhL[0][0] + VARhL[0][1] + VARhL[0][2]
• Case 2: generated energy (W[i] < 0)
Generated active power phase i+1
[ ][ ] [ ]
36001Wh
Tint∑= iW
i
Generated apparent power phase i+1
[ ][ ] [ ]
36001VAh
Tint∑= iVA
i
Generated inductive reactive power phase i+1
[ ] [ ] [ ] 0iVARfor 3600
VARhLTint
≥=∑iVAR
i
Generated capacitive reactive power phase i+1
[ ] [ ] [ ] 0iVARfor 3600
VARhCTint
≤=∑iVAR
i
Total generated active power
Wh[1][3] = Wh[1][0] + Wh[1][1] + Wh[1][2]
Total generated apparent power
VAh[1][3] = VAh[1][0] + VAh[1][1] + VAh[1][2]
Total generated reactive capacitive power
VARhC[1][3] = VARhC[1][0] + VARhC[1][1] + VARhC[1][2]
Total generated reactive inductive power
VARhL[1][3] = VARhL[1][0] + VARhL[1][1] + VARhL[1][2]
17.2 Hysteresis
Hysteresis is a principle of filtration that is often used after a threshold detection stage in Alarm mode (See para 4.10 page 15). Correct regulation of the hysteresis value avoids repeated status changes when the measurement oscillates around the threshold.
17.2.1 Surge detection
For a hysteresis of 2%, for example, the level of return for surge detection is equal to (100 %-2 %) or 98 % of the reference voltage threshold.
17.2.2 Detection of under-voltage or interruption
For a hysteresis of 2%, for example, the level of return in the event of under-voltage detection is equal to (100 %+2 %) or 102 % of the Uref voltage threshold.

70
17.3 Minimum scale values for waveforms and minimum RMS values
Type of current sensor Min RMS current value [A] Min scale value for current [A]
AmpFLEX™ 6500 A 30 60
Mini-AmpFLEX 6500 A 30 60
PAC93 1000 A clamp 1 10
C193 1000 A clamp 0.5 10
MN93 200 A clamp 0.5 2
MN93A 100 A clamp 0.2 1
MN93A clamp probe 5 A (Primary × 5) ÷ (Secondary × 1000) (Primary × 5 x 10) ÷ (Secondary × 1000)
5 A adaptor (Primary × 5) ÷ (Secondary × 1000) (Primary × 5 x 10) ÷ (Secondary × 1000)
• For all types of current sensors
ARMS < [minimum value of displayed current] ⇒ [ARMS = APP = APM = W = VA = VAR = WDC = AMAX = AMIN = AhMOD = AhANG = 0] AND [flattening of displayed current rates] AND [ACF = KF = ATHD = ADF = not calculated and not displayed] AND [VAFANG = AFANG = PF = DPF = Tan = not calculated and not displayed]
• For MN 93A clamp and 5 A adaptor
- Primary ∈∈∈∈ [1 ; 2999] [A] - Secondary ∈∈∈∈ [1 ; 5] [A]
[minimum displayed current value] <0.2⇒ [minimum displayed current value] = 0.2
[minimum current scale value] < 1 ⇒ [minimum current scale value] = 1
VRMS < 10 V ⇒ [VRMS = VPP = VPM = W = VA = VAR = WDC = VMAX = VMIN = VhMOD = VhANG = 0] AND
[flattening of displayed voltage rates] AND [VCF = PST = VTHD = VDF = not calculated and not displayed] AND [VAFANG = VFANG = PF = DPF = Tan = not calculated and not displayed]
URMS < 10 V ⇒ [URMS = UFRMS = UPP = UPM = UMAX = UMIN = UhMOD = UhANG = 0] AND [flattening of displayed voltage
rates] AND [UCF = UTHD = UDF = not calculated and not displayed] AND [UFANG = not calculated and not displayed]
Note : the minimum RMS voltage value is 10V. The minimum scale value for the waveform is 20V
17.4 Diagram of the 4 quadrants
This diagram is used as part of measuring power and energy (see chapter 10 Page 48 )
Figure 93: diagram of the 4 quadrants

71
17.5 Mechanism for triggering transient sensors
The sample rate is a constant value equivalent to 256 samples per cycle. When a transient search is launched, each sample is compared to the sample from the preceding cycle. The preceding cycle matches the middle of the tube; it is used as a reference. As soon as a sample leaves the tube, the trigger event comes; representation of the transient is then captured by the C.A. 8335. The cycle preceding the event and the three following cycles are saved to memory.
Here is a graphical representation of the transient capture trigger mechanism:
Here are the tube half-widths for voltage by type of sensor:
Threshold 100 % 50 % 20 % 10 % 5 % 2 % 1 % Type 199,79 99,88 39,96 19,97 9,97 3,98 1,98 MN 200 A 99,90 49,94 19,98 9,98 4,99 1,99 0,99 MN 100 A 2997 1498 599 299 150 60 30 MN 5 A / Adapter box 5 A [3000 / 1]
0,9990 0,4994 0,1998 0,0998 0,0499 0,0199 0,0099 MN 5 A / Adapter box 5 A [1 / 1] 999,0 499,4 199,8 99,8 49,9 19,9 9,9 SR-C / MR-PAC 1000 A 3002 1500 600 300 150 59 29 Amp FLEX / Mini FLEX 3000 A
Pipe half-width (L)
499,0 249,5 99,8 49,8 24,9 9,9 5,0 Voltage 500 V
17.6 Sensor conditions in Ringing Current mode.
Reminder: Sensors depend on the trigger event and a stop event. If capture ends with a stop event or if the save memory of the C.A. 8335 is full, capture stops automatically.
The stop threshold for capture is calculated as follows:
[End threshold [A]] = [Start threshold [A]] × (100 – [End hysteresis [%]]) ÷ 100
Here are the conditions for triggering and stopping capture:
Triggering filter type Start and end conditions
A1 Start condition [A1 half-period RMS value] > [Start threshold] End condition [A1 half-period RMS value] < [End threshold]
A2 Start condition [A2 half-period RMS value] > [Start threshold] End condition [A2 half-period RMS value] < [End threshold]
A3 Start condition [A3 half-period RMS value] > [Start threshold] End condition [A3 half-period RMS value] < [End threshold]
3A Start condition [the half-period RMS value of one current channel] > [Start threshold] End condition [the half-period RMS values of all current channels] < [End threshold]

72
17.7 Glossary
Ampere : unit of electrical current intensity (A symbole).
Bandwidth: frequency range on which an instrument supplies a precise measurement.
Fundamental component : component whose frequency is the fundamental frequency.
Cut: reduction in voltage at a point in the electrical power network below the cut threshold.
Voltage dip: temporary reduction in the voltage amplitude at a point in the electrical power network below a given threshold.
Imbalance in voltage in a polyphased electrical power network: status where efficient values for voltages between conductors (fundamental component) and/or differences in phase between successive conductors are not equal
Peak factor relation between the peak value and efficient value of the current.
Phase displacement factor: relationship between the active power and apparent power of the fundamental component.
Power displacement factor: expresses the difference between the apparent and active power when and only when the relationshop of the voltage phase and current to the fundamental is taken into account.
Factor K number based on the contents of a harmonic of a charge current that determines the maximum load on a source of energy. The K factor calculated by the C.A. 8335 is measured and compared with the one specified by the transformer manufacturer. It gives the percentage of “harmonics load” of the transformer.
Power factor relationship between active and apparent power
Flicker : The visual effect produced by the variation in electrical voltage.
Frequency: number of full voltage cycles produced in one second.
Harmonics voltage and current existing in electrical material at frequencies that are multiples of the fundamental frequency.
Hysteresis difference in amplitude between threshold incoming and outgoing values.
Peak : maximum (+) or minimum (-) peak value of the signal.
Phase temporal relationship between current and voltage in alternating current circuits.
PST : (Short term perception). Calculation of flicker over a ten minute cycle.
PLT : (Long term perception). Calculation of flicker over a two-hour cycle.
Harmonics level whole number equal to the relationship between the frequency of the harmonic and the fundamental frequency.
RMS : Root Mean Square. Efficient value of a current or voltage.
Dip threshold: specific voltage value to detect the start and end of a voltage dip.
Temporary surge at industrial frequency: temporary increase in the voltage amplitude at a point in the electrical power network above a given threshold.
Nominal voltage: voltage by which a network is named or identified.
THD: Total Harmonic Distortion. Total harmonic distortion. The rate of total harmonic distrotion gives the influence of harmonic components in a signal.
RMS value square root of the average squares of values for a specified interval.
Measurement method: all measurement methods associated to an individual measurement.
Phase and route: a measurement route corresponds to a difference in potential between two conductors. A phase is a simple conductor. In polyphased systems, a measurement route can be between two phases or a phase and neutral or a phase and earth or neutral and earth.
Watt : unit of measurement for power (W symbol).

73
18. TO ORDER
18.1 C.A 8335 power analyser
C.A 8335 alone P01 1605 77
C.A 8,335 MN P01 1605 71
C.A 8335 MN93A P01 1605 72
C.A 8335 AMP450 P01 1605 73
C.A 8335 AMP800 P01 1605 74
C.A 8335 PAC P01 1605 75
C.A 8335 C P01 1605 76
The equipment is always delivered with:
1 shoulder bag no. 22 1 specific 8-element battery (rechargeable NiMH) with
a minimum capacity of 4000 mAh and nominal voltage of 9.6 V. 5 black banana-banana right-right security cables. 5 black crocodile clamps. 4 current sensors (one type out of 6 possible). 1 USB type A-B cord. 1 specific power sector block (600 VRMS catégorie IV). 1 set of 12 pions and rings for identifying phases and
voltage and phases cords and current sensors. 1 Power Analyser Transfer (PAT) software. 1 2GB SD card. 1 verification certificate 1 security file. This instruction manual on CD-ROM and in 5
languages.
18.2 Accessories
MN93 clamp P01 1204 25
MN93A clamp P01 1204 34
PAC93 clamp P01 1200 79
C193 clamp P01 1203 23
AmpFLEX™ A193 450 P01 1205 26
AmpFLEX™ A193 800 P01 1205 31
Mini-AmpFLEX MA193 P01 1205 80
5A triphased adaptor box P01 1019 59
Qualistar+ film screen P01 1020 59
18.3 Spare parts
Black banana-banana right-right security cables
Please consult us
Black crocodile clamps. Please consult us
USB type A-B cord. P01 2952 91
Specific 8-element battery (rechargeable NiMH) with a minimum capacity of 4000 mAh and nominal voltage of 9.6 V.
P01 2960 24
PA30W specific sector power block.
P01 1020 57
Carrying bag no. 22 P01 2980 56
Carrying bag no. 21 P01 2980 55
Set of 12 pions and rings for identifying phases and voltage and phases cords and current sensors.
P01 1020 80

74
DEUTSCHLAND - Chauvin Arnoux GmbH Straßburger Str. 34 - 77694 Kehl / Rhein Tel: (07851) 99 26-0 - Fax : (07851) 99 26-60
SCHWEIZ - Chauvin Arnoux AG Einsiedlerstraße 535 - 8810 Horgen Tel: 044 727 75 55 - Fax: 044 727 75 56
ESPAÑA - Chauvin Arnoux Ibérica S.A. C/ Roger de Flor N° 293, Planta 1- 08025 Barcelona Tel: 902 20 22 26 - Fax: 934 59 14 43
UNITED KINGDOM - Chauvin Arnoux Ltd Waldeck House - Waldeck Road - Maidenhead SL6 8BR Tel: 01628 788 888 - Fax: 01628 628 099
ITALIA - Amra SpA Via Sant’Ambrogio, 23/25 - 20050 Bareggia di Macherio (MI) Tel: 039 245 75 45 - Fax: 039 481 561
MIDDLE EAST - Chauvin Arnoux Middle East P.O. BOX 60-154 - 1241 2020 JAL EL DIB (Beirut) - LEBANON Tel: (01) 89 04 25 - Fax: (01) 89 04 24
ÖSTERREICH - Chauvin Arnoux Ges.m.b.H Slamastrasse 29/3 - 1230 Wien Tel: 01 61 61 961-0 - Fax: 01 61 61 961-61
CHINA - Shanghai Pu-Jiang - Enerdis Instruments Co. Ltd 3 F, 3 rd Building - N° 381 Xiang De Road - 200081 SHANGHAI Tel: +86 21 65 21 51 96 - Fax: +86 21 65 21 61 07
SCANDINAVIA - CA Mätsystem AB Box 4501 - SE 18304 TÄBY Tel: +46 8 50 52 68 00 - Fax: +46 8 50 52 68 10
USA - Chauvin Arnoux Inc - d.b.a AEMC Instruments 200 Foxborough Blvd. - Foxborough - MA 02035 Tel: (508) 698-2115 - Fax: (508) 698-2118
07 – 2008
692272A02 - en - Ed.0
http ://www.chauvin -arnoux.com
190, rue Championnet - 75876 PARIS Cedex 18 - FRANCE Tel.: +33 1 44 85 44 85 - Fax: +33 1 46 27 73 89 - [email protected]
Export : Tel.: +33 1 44 85 44 86 - Fax: +33 1 46 27 95 59 - [email protected]