chem / bcmb 4190/6190/8189 introductory nmr
TRANSCRIPT

- 1 -
CHEM / BCMB 4190/6190/8189
Introductory NMR
Lecture 18
- 1 -
- 2 -
CHEM 4190/6190
The Nuclear Overhauser Effect
NOE: Nuclear Overhauser Effect or Nuclear Overhauser Enhancement
- Depends on dipole-dipole relaxation (an important mechanism of T1
relaxation)- Is based on through-space interactions that change Mz
- The NOE changes the intensities of particular signals- The magnitude of the NOE is related to nuclear distances and molecular
motions
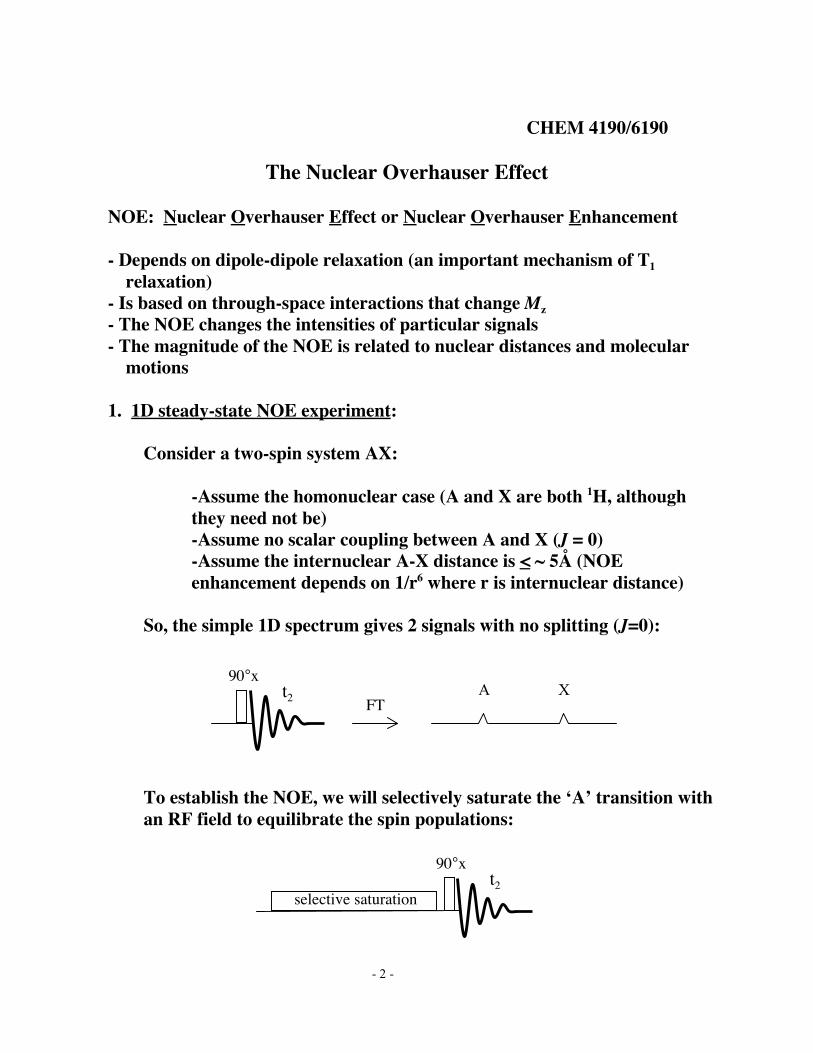
1. 1D steady-state NOE experiment:
Consider a two-spin system AX:
-Assume the homonuclear case (A and X are both 1H, althoughthey need not be)-Assume no scalar coupling between A and X (J = 0)-Assume the internuclear A-X distance is < ~ 5Å (NOEenhancement depends on 1/r6 where r is internuclear distance)
So, the simple 1D spectrum gives 2 signals with no splitting (J=0):
To establish the NOE, we will selectively saturate the ‘A’ transition withan RF field to equilibrate the spin populations:
FT
t2selective saturation
90°x
XAt2
90°x
- 3 -
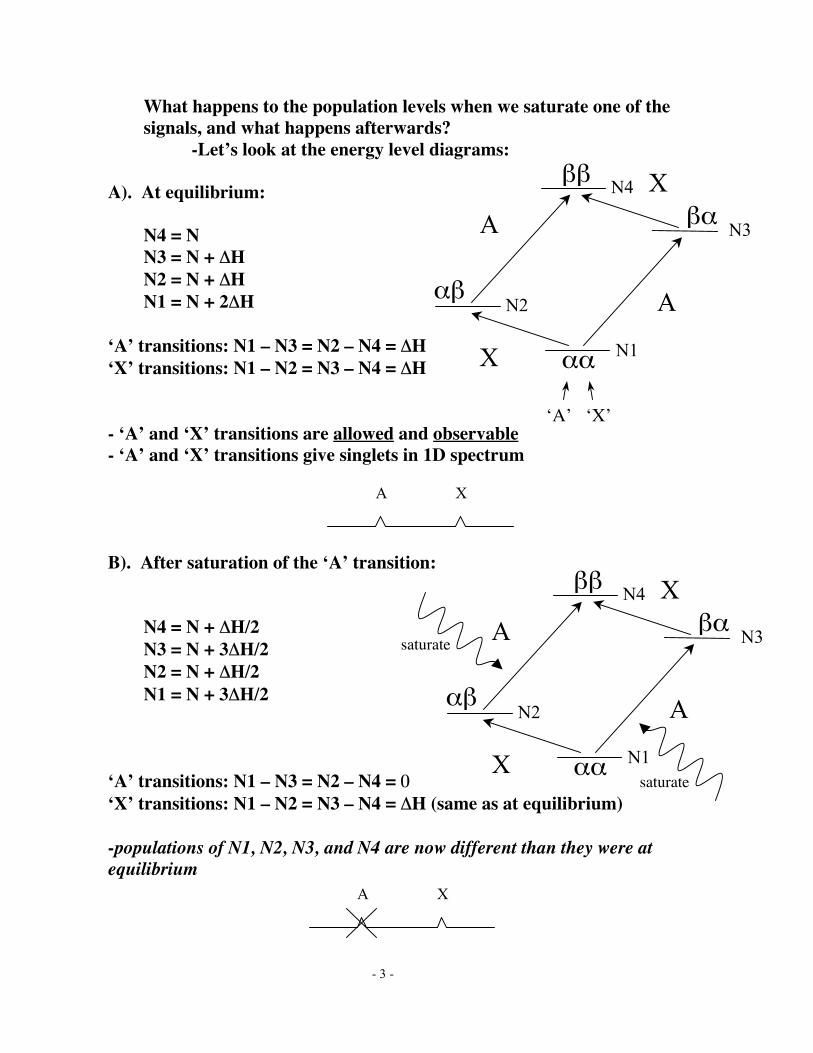
What happens to the population levels when we saturate one of thesignals, and what happens afterwards?
-Let’s look at the energy level diagrams:
A). At equilibrium:
N4 = NN3 = N + ∆HN2 = N + ∆HN1 = N + 2∆H
‘A’ transitions: N1 – N3 = N2 – N4 = ∆H‘X’ transitions: N1 – N2 = N3 – N4 = ∆H
- ‘A’ and ‘X’ transitions are allowed and observable- ‘A’ and ‘X’ transitions give singlets in 1D spectrum
B). After saturation of the ‘A’ transition:
N4 = N + ∆H/2N3 = N + 3∆H/2N2 = N + ∆H/2N1 = N + 3∆H/2
‘A’ transitions: N1 – N3 = N2 – N4 = 0‘X’ transitions: N1 – N2 = N3 – N4 = ∆H (same as at equilibrium)
-populations of N1, N2, N3, and N4 are now different than they were atequilibrium
saturate
saturate
A
N2
N1
N3
N4 X
αβ
βα
αα
ββ
X
A
‘A’ ‘X’
XA
A
N2
N1
N3
N4 X
αβ
βα
αα
ββ
X
A
XA
- 4 -
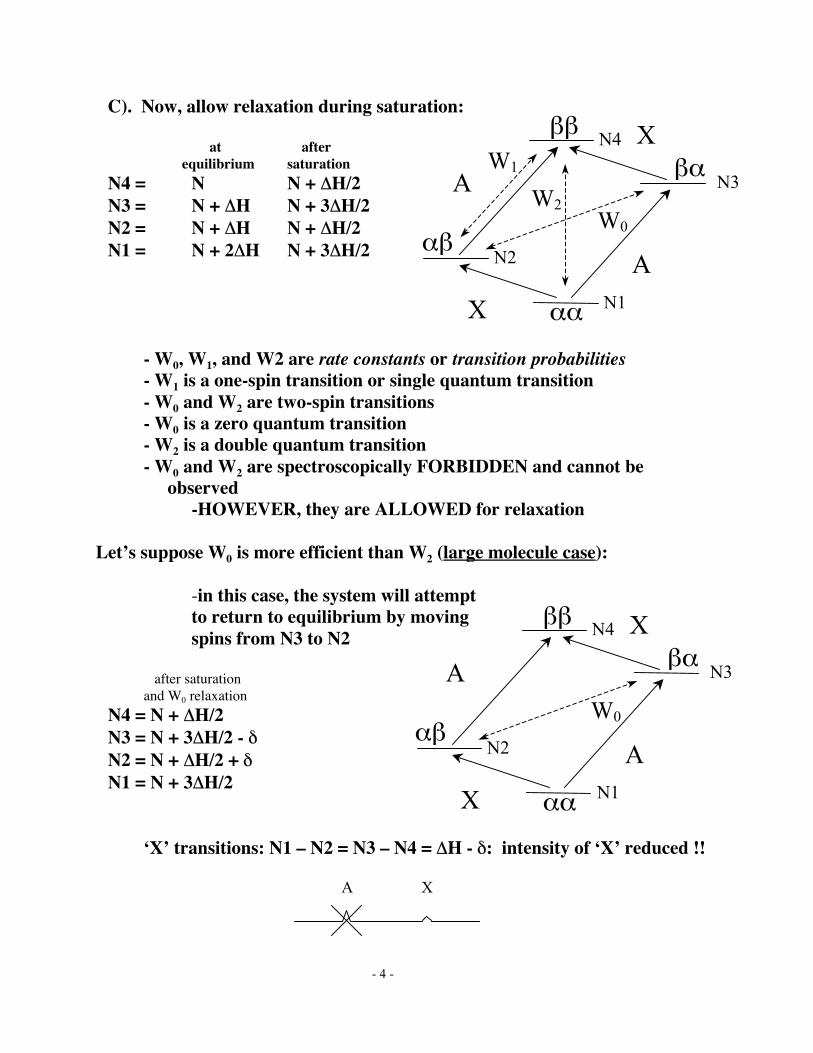
C). Now, allow relaxation during saturation:
at after equilibrium saturation
N4 = N N + ∆H/2N3 = N + ∆H N + 3∆H/2N2 = N + ∆H N + ∆H/2N1 = N + 2∆H N + 3∆H/2
- W0, W1, and W2 are rate constants or transition probabilities- W1 is a one-spin transition or single quantum transition- W0 and W2 are two-spin transitions- W0 is a zero quantum transition- W2 is a double quantum transition- W0 and W2 are spectroscopically FORBIDDEN and cannot be
observed-HOWEVER, they are ALLOWED for relaxation
Let’s suppose W0 is more efficient than W2 (large molecule case):
-in this case, the system will attemptto return to equilibrium by movingspins from N3 to N2
after saturationand W0 relaxation
N4 = N + ∆H/2N3 = N + 3∆H/2 - δN2 = N + ∆H/2 + δN1 = N + 3∆H/2
‘X’ transitions: N1 – N2 = N3 – N4 = ∆H - δ: intensity of ‘X’ reduced !!
XA
W2W0
A
W1A
N2
N1
N3
N4 X
αβ
βα
αα
ββ
X
W0
A
A
N2
N1
N3
N4 X
αβ
βα
αα
ββ
X
- 5 -
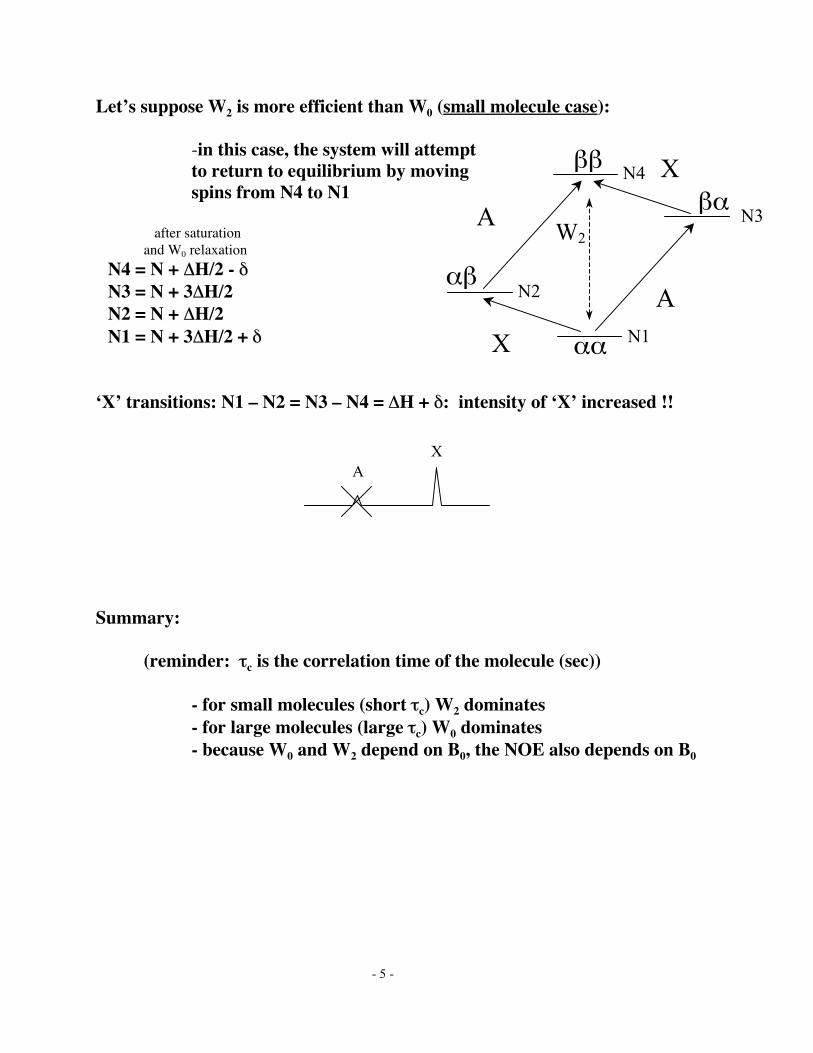
Let’s suppose W2 is more efficient than W0 (small molecule case):
-in this case, the system will attemptto return to equilibrium by movingspins from N4 to N1
after saturationand W0 relaxation
N4 = N + ∆H/2 - δN3 = N + 3∆H/2N2 = N + ∆H/2N1 = N + 3∆H/2 + δ
‘X’ transitions: N1 – N2 = N3 – N4 = ∆H + δ: intensity of ‘X’ increased !!
Summary:
(reminder: τc is the correlation time of the molecule (sec))
- for small molecules (short τc) W2 dominates- for large molecules (large τc) W0 dominates- because W0 and W2 depend on B0, the NOE also depends on B0
XA
W2
A
A
N2
N1
N3
N4 X
αβ
βα
αα
ββ
X
- 6 -
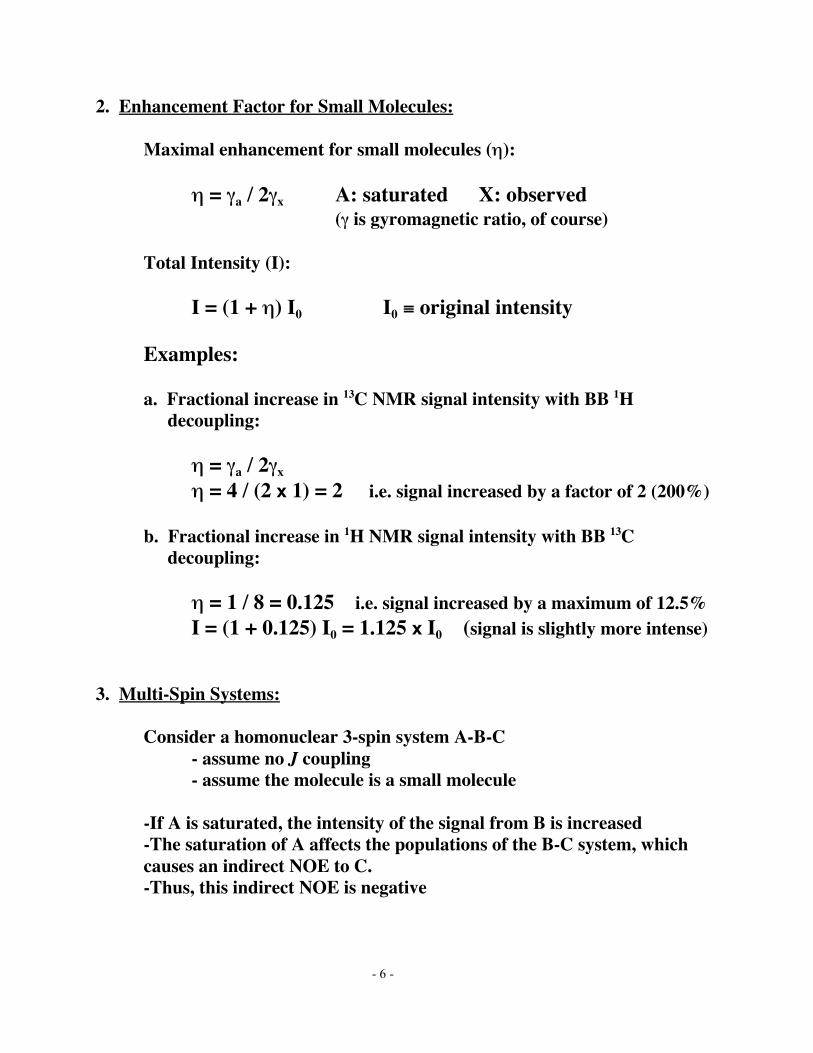
2. Enhancement Factor for Small Molecules:
Maximal enhancement for small molecules (η):
η = γa / 2γx A: saturated X: observed(γ is gyromagnetic ratio, of course)
Total Intensity (I):
I = (1 + η) I0 I0 ≡ original intensity
Examples:
a. Fractional increase in 13C NMR signal intensity with BB 1Hdecoupling:
η = γa / 2γx
η = 4 / (2 x 1) = 2 i.e. signal increased by a factor of 2 (200%)
b. Fractional increase in 1H NMR signal intensity with BB 13Cdecoupling:
η = 1 / 8 = 0.125 i.e. signal increased by a maximum of 12.5%I = (1 + 0.125) I0 = 1.125 x I0 (signal is slightly more intense)
3. Multi-Spin Systems:
Consider a homonuclear 3-spin system A-B-C- assume no J coupling- assume the molecule is a small molecule
-If A is saturated, the intensity of the signal from B is increased-The saturation of A affects the populations of the B-C system, whichcauses an indirect NOE to C.-Thus, this indirect NOE is negative
- 7 -
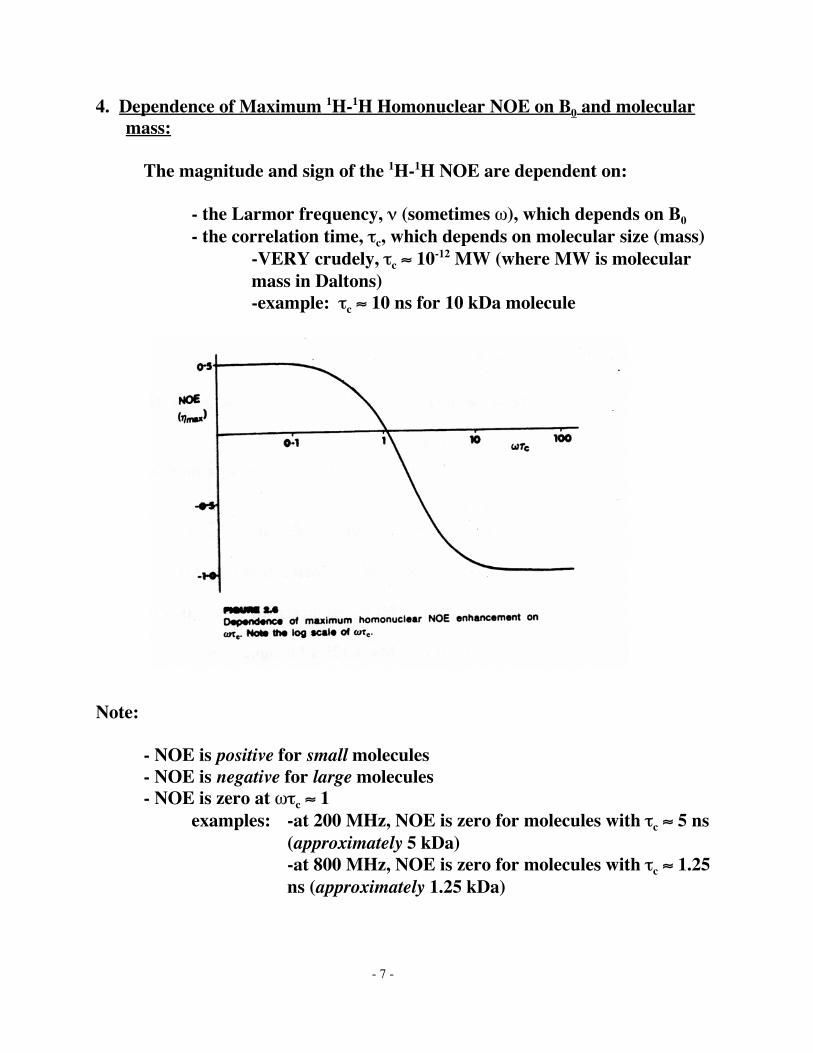
4. Dependence of Maximum 1H-1H Homonuclear NOE on B0 and molecularmass:
The magnitude and sign of the 1H-1H NOE are dependent on:
- the Larmor frequency, ν (sometimes ω), which depends on B0
- the correlation time, τc, which depends on molecular size (mass)-VERY crudely, τc ≈ 10-12 MW (where MW is molecularmass in Daltons)-example: τc ≈ 10 ns for 10 kDa molecule
Note:
- NOE is positive for small molecules- NOE is negative for large molecules- NOE is zero at ωτc ≈ 1
examples: -at 200 MHz, NOE is zero for molecules with τc ≈ 5 ns(approximately 5 kDa)-at 800 MHz, NOE is zero for molecules with τc ≈ 1.25ns (approximately 1.25 kDa)
- 8 -
5. Dependence of the magnitude of the NOE on Internuclear Distance:
In the absence of external relaxation:- the maximal enhancement in achieved- the NOE is distance independent
In the presence of external relaxation:- two-spin steady-state NOE depends on internuclear distance
f = NOE enhancement ∝ 1/r6
(r = internuclear distance)-this effect is usually observed only for 1H-1H distances < 5 Å
Examples of external relaxation:
a). intermolecular relaxation caused by paramagnetic agents-field at a nucleus depends on the presence of unpaired electrons-examples: dissolved O2, manganese and other metal impurities
b). quadrupolar relaxation-energy of quadrupole nuclei varies with the fluctuating electric
field gradient-dominant mechanism for nuclei with I > 1/2 (2H and 14N)
c). chemical shift anisotropy (CSA)-anisotropy produces a different field at the nucleus depending on
the orientation of the bond relative to the applied field-significant for nuclei with large CSA (19F, 31P)
- 1 -
CHEM / BCMB 4190/6190/8189
Introductory NMR
Lecture 19
- 2 -
CHEM 4190/6190
The NOESY Experiment
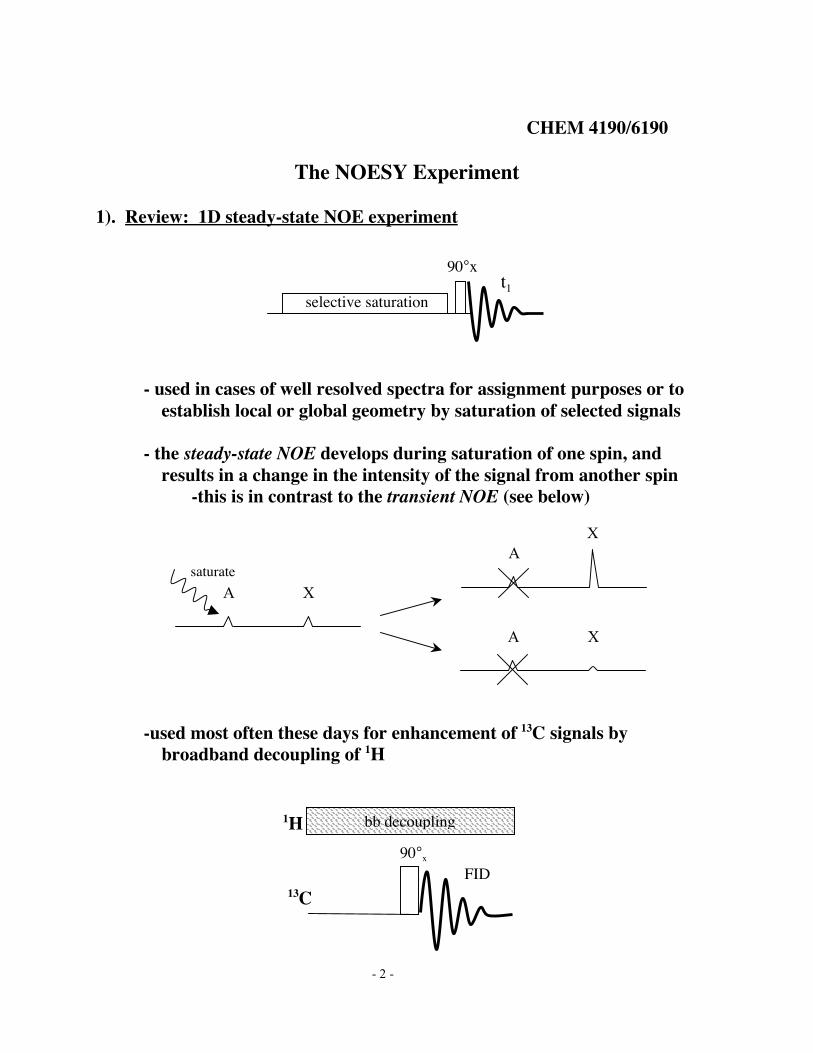
1). Review: 1D steady-state NOE experiment
- used in cases of well resolved spectra for assignment purposes or toestablish local or global geometry by saturation of selected signals
- the steady-state NOE develops during saturation of one spin, andresults in a change in the intensity of the signal from another spin
-this is in contrast to the transient NOE (see below)
-used most often these days for enhancement of 13C signals bybroadband decoupling of 1H
t1selective saturation
90°x
13C
1H
90°x
bb decoupling
FID
saturate
XA
XA
XA
- 3 -
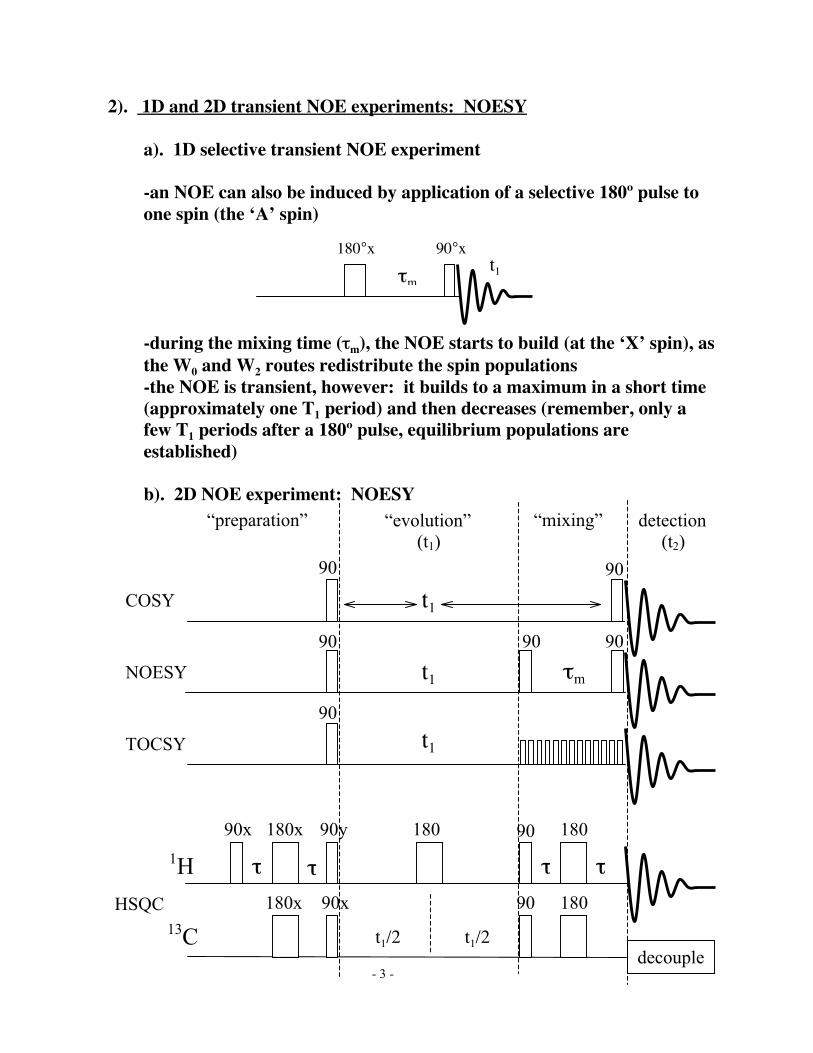
2). 1D and 2D transient NOE experiments: NOESY
a). 1D selective transient NOE experiment
-an NOE can also be induced by application of a selective 180º pulse toone spin (the ‘A’ spin)
-during the mixing time (τm), the NOE starts to build (at the ‘X’ spin), asthe W0 and W2 routes redistribute the spin populations-the NOE is transient, however: it builds to a maximum in a short time(approximately one T1 period) and then decreases (remember, only afew T1 periods after a 180º pulse, equilibrium populations areestablished)
b). 2D NOE experiment: NOESY
HSQC
τ
180x 90y
180x 90x
1H
13Cdecouple
90x 180 180
18090
90
τ τ τ
t1/2 t1/2
90
90
90
90
90
“preparation” “evolution” (t1)
“mixing” detection (t2)
τm
t1
t1
t1COSY
NOESY
TOCSY
90
180°xt1
90°x
τm
- 4 -
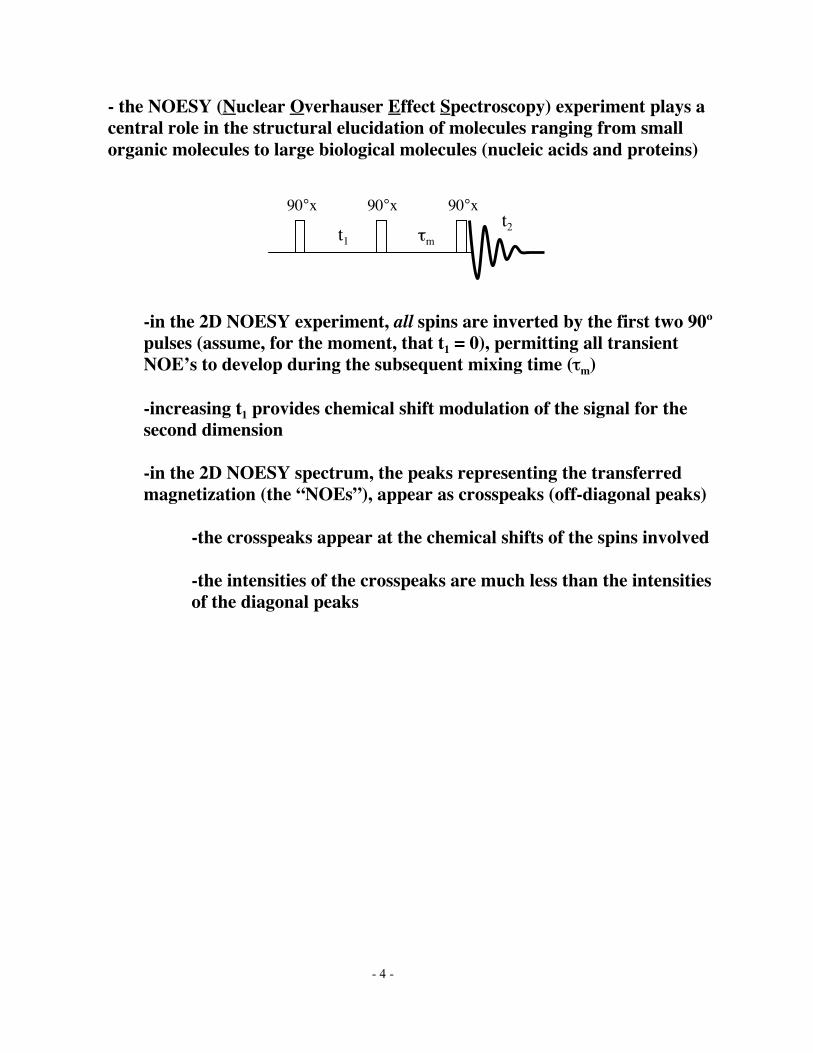
- the NOESY (Nuclear Overhauser Effect Spectroscopy) experiment plays acentral role in the structural elucidation of molecules ranging from smallorganic molecules to large biological molecules (nucleic acids and proteins)
-in the 2D NOESY experiment, all spins are inverted by the first two 90ºpulses (assume, for the moment, that t1 = 0), permitting all transientNOE’s to develop during the subsequent mixing time (τm)
-increasing t1 provides chemical shift modulation of the signal for thesecond dimension
-in the 2D NOESY spectrum, the peaks representing the transferredmagnetization (the “NOEs”), appear as crosspeaks (off-diagonal peaks)
-the crosspeaks appear at the chemical shifts of the spins involved
-the intensities of the crosspeaks are much less than the intensitiesof the diagonal peaks
90°x90°x
τmt1
t2
90°x
- 5 -
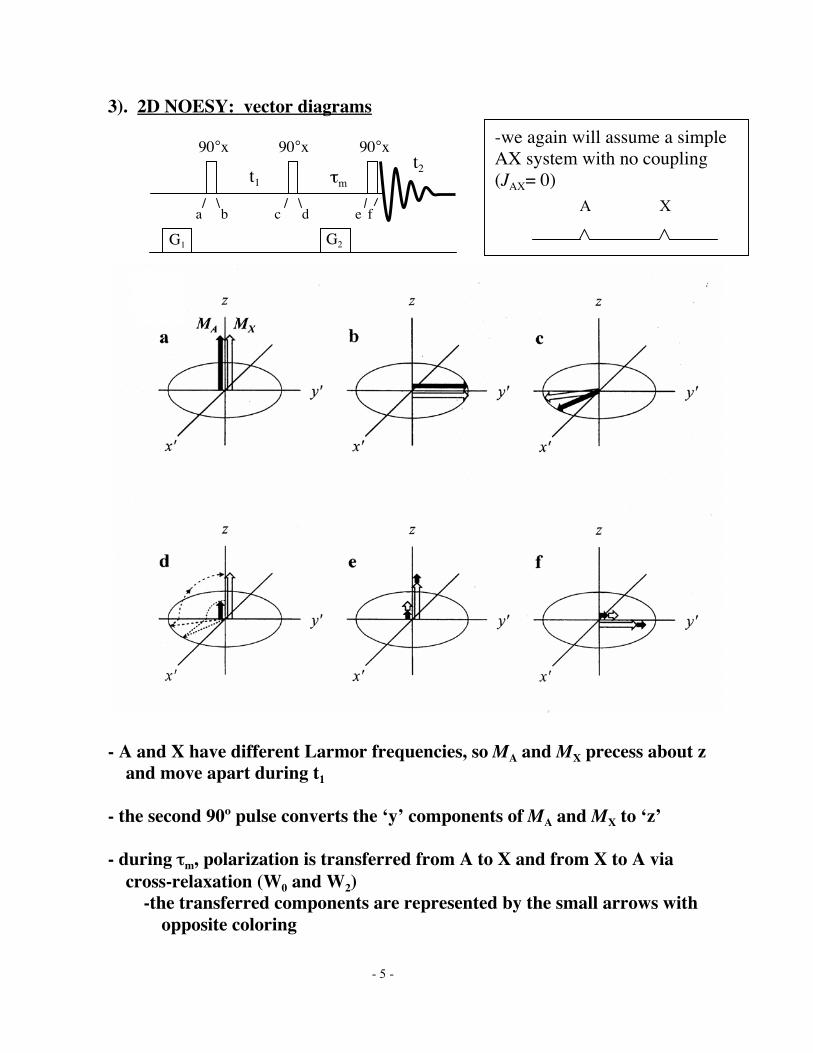
3). 2D NOESY: vector diagrams
- A and X have different Larmor frequencies, so MA and MX precess about zand move apart during t1
- the second 90º pulse converts the ‘y’ components of MA and MX to ‘z’
- during τm, polarization is transferred from A to X and from X to A viacross-relaxation (W0 and W2)
-the transferred components are represented by the small arrows withopposite coloring
d ecba
G2G1
90°x90°x
t1
t2
90°x
f
τm
-we again will assume a simpleAX system with no coupling(JAX= 0)
XA
- 6 -
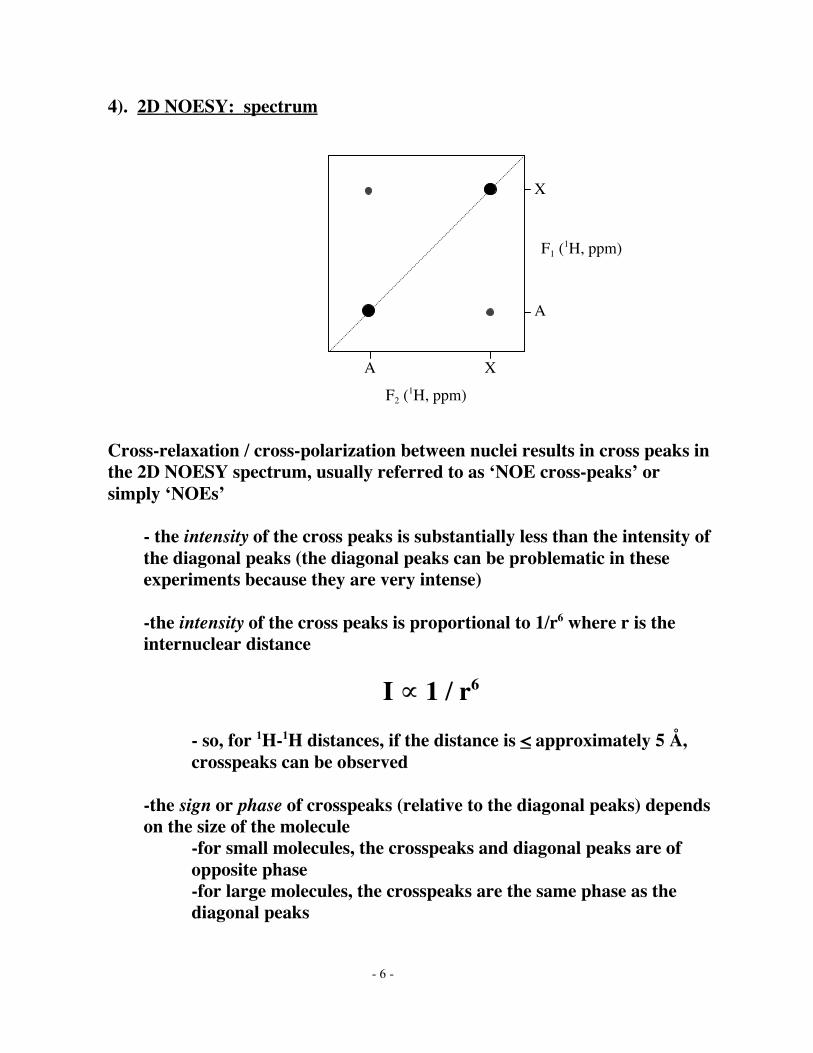
4). 2D NOESY: spectrum
Cross-relaxation / cross-polarization between nuclei results in cross peaks inthe 2D NOESY spectrum, usually referred to as ‘NOE cross-peaks’ orsimply ‘NOEs’
- the intensity of the cross peaks is substantially less than the intensity ofthe diagonal peaks (the diagonal peaks can be problematic in theseexperiments because they are very intense)
-the intensity of the cross peaks is proportional to 1/r6 where r is theinternuclear distance
I ∝ 1 / r6
- so, for 1H-1H distances, if the distance is < approximately 5 Å,crosspeaks can be observed
-the sign or phase of crosspeaks (relative to the diagonal peaks) dependson the size of the molecule
-for small molecules, the crosspeaks and diagonal peaks are ofopposite phase-for large molecules, the crosspeaks are the same phase as thediagonal peaks
A
X
XA
F2 (1H, ppm)
F1 (1H, ppm)
- 7 -
5). 2D NOESY: role of G1 and G2 gradient pulses
Normally, the data from many scans at each t1 are added together duringcollection of NOESY spectra
-ideally, one would wait ~5T1 between scans to allow the system toequilibrate-this of course require far too much time to acquire a complete 2D dataset-one can wait for <5T1 between scans, but this causes a loss in signalintensity and an increase in the appearance of artifacts in the 2D spectra(some of which can be alleviated by phase cycling and other techniques)-linear field gradient pulses can be used to
G1 gradient:-in the gradient NOESY experiment, the G1 gradient pulse will
dephase any transverse magnetization during the recycle delay,preventing artifacts in the spectra resulting from thesecomponents
G2 gradient:-performs a function similar to the G1 gradient, only during the
mixing time, τm. During τm, transverse magnetizationcomponents often can cause artifacts in NOESY spectra. G2dephases these components
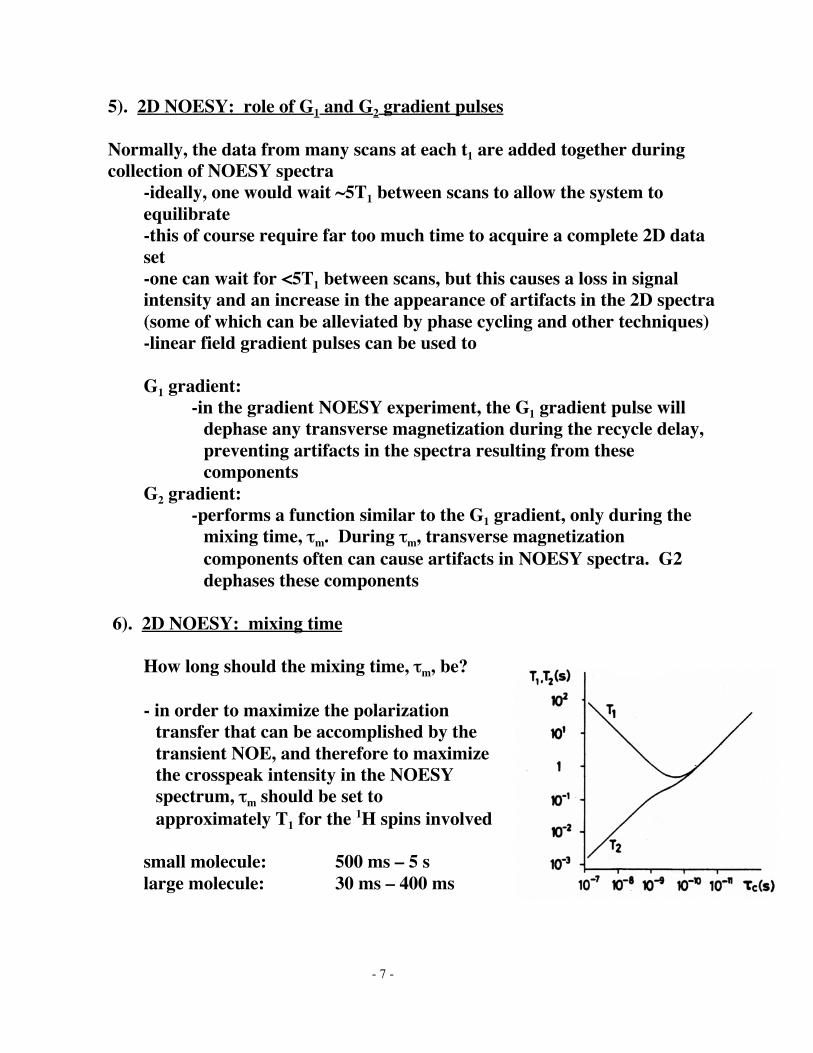
6). 2D NOESY: mixing time
How long should the mixing time, τm, be?
- in order to maximize the polarizationtransfer that can be accomplished by thetransient NOE, and therefore to maximizethe crosspeak intensity in the NOESYspectrum, τm should be set toapproximately T1 for the 1H spins involved
small molecule: 500 ms – 5 slarge molecule: 30 ms – 400 ms
- 8 -
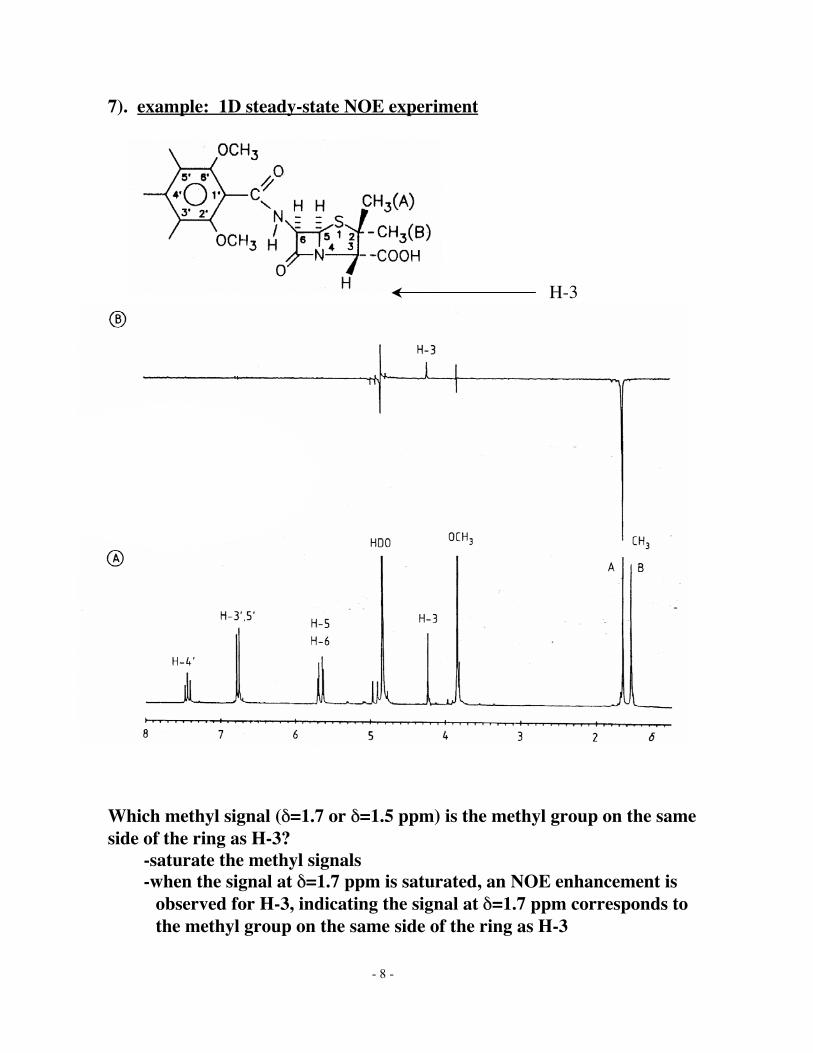
7). example: 1D steady-state NOE experiment
Which methyl signal (δ=1.7 or δ=1.5 ppm) is the methyl group on the sameside of the ring as H-3?
-saturate the methyl signals-when the signal at δ=1.7 ppm is saturated, an NOE enhancement is
observed for H-3, indicating the signal at δ=1.7 ppm corresponds tothe methyl group on the same side of the ring as H-3
H-3
- 9 -
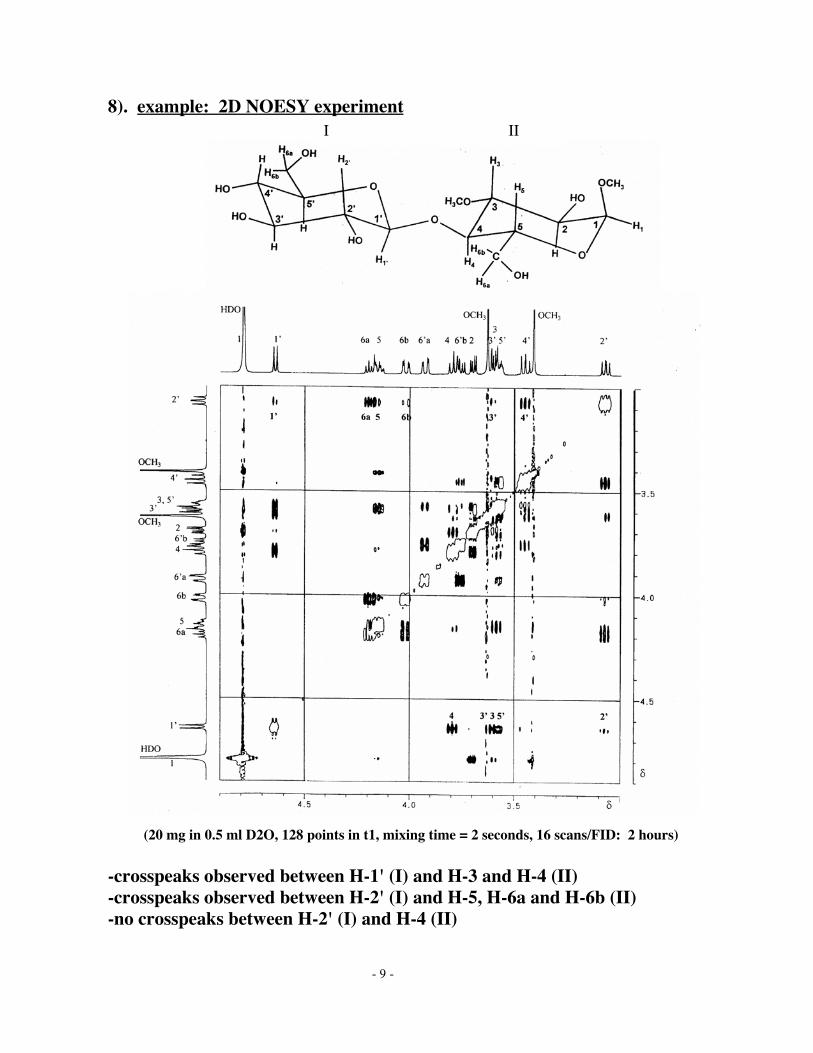
8). example: 2D NOESY experiment
(20 mg in 0.5 ml D2O, 128 points in t1, mixing time = 2 seconds, 16 scans/FID: 2 hours)
-crosspeaks observed between H-1' (I) and H-3 and H-4 (II)-crosspeaks observed between H-2' (I) and H-5, H-6a and H-6b (II)-no crosspeaks between H-2' (I) and H-4 (II)
I II