chemical engineering science - university oflior/documents/exergyefficiencyofplant... · exergy...
TRANSCRIPT

Exergy efficiency of plant photosynthesis
Cory S. Silva a, Warren D. Seider a, Noam Lior b,n
a Department of Chemical and Biomolecular Engineering, University of Pennsylvania, Philadelphia, PA 19104-6393, USAb Department of Mechanical Engineering and Applied Mechanics, University of Pennsylvania, Philadelphia, PA 19104-6393, USA
H I G H L I G H T S
� We analyze the exergy and energy efficiency of photosynthesis.� The analysis reconciles the current efficiency predictions that are from 2.6% to 41%, to 3.9%.� Written in a way to improve the bridge of understanding between biologists and thermodynamicists.
a r t i c l e i n f o
Article history:Received 6 October 2014Received in revised form17 January 2015Accepted 14 February 2015Available online 26 February 2015
Keywords:PhotosynthesisCarbon dioxideThermodynamicsExergySolar energyBio-energy
a b s t r a c t
With recent concerns about sustainability and environmental protection, growing attention has been focusedon biological sources for both chemicals and fuels; however, to analyze such bioprocesses for commercialviability, and to investigate possible efficiency improvements, the theoretical efficiencies must be known as anupper-bound on performance. Since almost all exergy contained in biomass originates from solar radiation,photosynthesis is the gateway to sustainable bioprocess development. The literature shows a wide range ofefficiency predictions, 2.6–41%, due to different definitions and methods of analysis. Therefore, the objective ofthis study is to dissect the complex bio-processes involved in photosynthesis and analyze the exergy flowsthrough the system, analyzing photosynthesis so as to be understandable by both biologists and thermo-dynamicists. The initial absorption of light has the lowest exergy efficiency, and it accounts for over 64% of theexergy lost throughout the system. For the light reactions, reduction potentials are used to analyze the flow ofexcited, high-energy electrons through photosystems II and I, resulting in an exergy efficiency for the lightreactions of 32 percent. For the dark reactions, the chemical exergy method proposed by Lems et al. (2007) isappropriate. The resulting efficiency of the dark reactions is 81 percent. Exergy losses to transpiration andphotorespiration are taken into account, although their effects are relatively small. The overall exergy efficiencyof photosynthesis is calculated to be 3.9 percent. The efficiencies of the sub-processes, as well as the overallefficiency, show good agreement with recent publications. Ultimately, the largest losses are due to poorabsorption of light and the inefficient electron transfer through the photosystems.
& 2015 Elsevier Ltd. All rights reserved.
1. Introduction
The flow of solar radiation into the earth’s upper-atmosphere isapproximately 174,000 TW, of which, 114,000 TW reaches the Earth’s
surface (Szargut, 2005). That radiation can be converted directly toelectricity using photovoltaic devices or indirectly by first converting itto biomass (using photosynthesis) and then combusting the biomass,generating heat for thermo-electric power plants.1 Other indirectmethods of converting solar radiation into electricity use the wind,ocean currents, and ocean temperature differences. Alternatively,photosynthesis can be used to produce energy-dense oils, which arethen converted to transportation fuels (Biswas et al., 2013; Dunlopet al., 2013; Silva et al., 2014).
Even more significant than being a source for heat, biofuels,and electricity, biomass is used for the growth of autotrophic
Contents lists available at ScienceDirect
journal homepage: www.elsevier.com/locate/ces
Chemical Engineering Science
http://dx.doi.org/10.1016/j.ces.2015.02.0110009-2509/& 2015 Elsevier Ltd. All rights reserved.
Abbreviations: ADP, adenosine diphosphate; ATP, adenosine triphosphate; CC,Calvin cycle; Ctyb, cytochrome b6f; ETC, electron-transport chain; GAl3P,glyceraldehyde-3-phosphate; G6P, glucose-6-phosphate; NADPþ , nicotinamideadenine dinucleotide phosphate (oxidized); NADPH, nicotinamide adenine dinu-cleotide phosphate (reduced); NAABB, National Alliance for Biofuels and Biopro-ducts; PAR, photo-active region; PGA, 3-phosphoglycerate; PSI, photosystem I; PSII,photosystem II; Pi, phosphoric acid; PC, plastocyanin; PO, photosynthetic organism;PMF, proton-motive force; RuBP, ribulose-1,5-bisphosphate; RuBisCO, ribulose-1,5-bisphosphate
n Corresponding author. Tel: þ1 215 898 4803.E-mail address: [email protected] (N. Lior).
1 Fossil fuels most likely originate from photosynthetically produced biomass(plankton and plants) from the distant past.
Chemical Engineering Science 130 (2015) 151–171

organisms, such as plants. Autotrophic organisms are complexchemical machines that serve as food and building materials forhumans and animals, and they also have a vital impact on theearth’s ecology and climate. Solar radiation is absorbed by plantsand transformed into biomass (chemical exergy) at a rate of37 TW, a large amount relative to the total exergy used by humans,which is estimated to be 13–14 TW (Barber, 2009; Szargut, 2005).If the photosynthetic efficiency could be improved so that auto-trophs can absorb a larger portion of the total incoming solarradiation, then biomass could potentially replace all non-renewable fuels (coal, petroleum, natural gas, peat, nuclear).Therefore, it is of great importance to have a detailed under-standing of the thermodynamic limits and processes of photo-synthesis and ways to approach these limits.
1.1. Scope
This work bridges the gap between previous literature studies(discussed in Section 2), which only consider the physical effects ofthe process (evaporation and carbon dioxide sequestration)(Petela, 2008; Reis and Miguel, 2006) and those that only examinethe mechanism of the photosynthetic reactions (Lems et al., 2010).Exergy balances are constructed for solar light absorption, the twophotosystems, ATP synthesis, the Calvin Cycle, plant metabolism,and environmental losses (transpiration and photorespiration).These, accompanied by a glossary in Appendix B, yield clearlydefined exergy efficiencies for photosynthesis understood by boththermodynamicists and biologists, thus facilitating and fosteringcooperation in this important field.
The exergy analysis obviously requires the detailed descriptionof the photosynthesis processes and reactions, which are pre-sented in the following section.
1.2. Photosynthetic organism cell physiology and system description
Plant cells are composed of numerous organelles2 – enclosedportions of the cellular medium (or cytoplasm) with designatedfunctions. A plant cell with the major organelles labeled isdepicted in Fig. 1a. It is beyond the scope of this article to explainall of the organelles. Instead, the focus is on the chloroplast, theorganelle that captures sunlight, using it to convert carbon dioxideand water to organic matter (glucose herein). In terms of theanalysis herein, two systems are specified and the efficiency isanalyzed for each. For the first, the system boundaries are drawnaround the chloroplast organelle; whereas, the second system isthe entire plant. An enlarged image of the chloroplast is shown asFig. 1b.
The chloroplast is surrounded by two layers of membranes thatisolate its internal solution (the stroma) from the cell’s maincytoplasm. Inside the chloroplast are numerous thylakoids, com-partments that contain light-absorbing pigments. These thylakoidsare stacked into columns called granum. The internal space of thethylakoids (called lumen) are approximately 3.5 pH units lowerthan the stroma, which plant cells use to store potential exergy inthe form of a proton gradient. This potential can be converted tohigh-energy carrier molecules (ATP, Section 1.3) by a giant proteincomplex known as ATP synthase; this process is examined in moredetail in Sections 3.1.3 and 4.1.3. An overall system diagram of thechloroplast is shown in Fig. 2.
As the double-sided arrows show, carbon dioxide, water, andoxygen are assumed to freely diffuse across the cellular boundarieswhile photosynthesis is occurring, and they are therefore in
equilibrium in the compartments of the plant cell; the validity ofthis assumption is analyzed in the error analysis Section 5. Everychemical species discussed in this paper – besides carbon dioxide,water, and oxygen – is present in the stroma, where the majorityof the chemical reactions (in the Calvin Cycle – described inSection 3.1.4) take place, with the concentrations of each speciestaken from the literature (Bassham and Buchanan, 1982). Exergyenters the system in the form of sunlight, which is absorbed bychlorophyll pigments. The pigments transform the sunlight’sexergy into proton gradient exergy and electrical energy, whichis stored in excited electrons (discussed in Section 1.3; see Fig. 3).The electrical exergy and proton exergy drive the reactions thatconvert carbon dioxide and water to glucose and molecularoxygen (using the Calvin Cycle). All exergy not transferred intothe chemical bonds of glucose is destroyed – lost to the environ-ment as waste heat (approximately at ambient temperature).
1.3. Photosynthesis at a glance
The overall reaction for photosynthesis (R1) and its standardGibbs free energy change per mole of glucose, ΔGo (Bassham andKrause, 1969; Voet et al., 2008) are:
6CO2þ6H2 O-light
C6H12O6þ6O2; ΔGo ¼ 2872 kJ=mol ðR1Þ
Within the chloroplast, reaction R1 occurs as a series of stepsdecomposed into the “light” and “dark” reactions (Calvin Cycle).During the light reactions, large protein complexes (photosystem IIand photosystem I) use chlorophyll pigment molecules (P680 andP700) to capture photons of light. The photons excite and displaceelectrons from these pigment molecules, leaving vacancies (Gustand Moore, 1985). The vacancies left by the displaced electrons arefilled by splitting water, generating protons and oxygen gas, asshown in reaction R2 with the standard change in electricalpotential, Δεo.
H2 O-12 O2þ2Hþ þ2e� ; Δεo ¼ 0:81 V ðR2Þ
The excited, high-energy electrons proceed through a system ofintermediate carriers (called the electron-transport chain or ETC)that pump protons against their gradient (into the lumen) andeventually reduce nicotinamide adenine dinucleotide phosphate(NADPþ), forming NADPH as shown in reaction R3. A diagram ofthe electron transport chain is presented as Fig. 3, with specificsdiscussed in Section 3.2. This diagramwas created with redox half-reaction potentials from the literature (Nicholls and Ferguson,2002; Voet et al., 2008; Walz, 1997a, b, c).
NADPþ þHþ þ2 e�-NADPH; Δεo ¼ �0:32 V ðR3ÞThe protons from water, as well as those pumped into the
thylakoid membrane, flow down their concentration gradient andpower ATP synthase, a proton turbine that drives the synthesis ofwater and adenosine triphosphate (ATP) from adenosine dipho-sphate (ADP) and phosphoric acid – shown as reaction R4. This isknown as phosphorylation.
ADPþPi-ATPþH2O; ΔGo ¼ 32:8 kJ=mol ðR4Þwhere Pi is phosphoric acid (H3PO4). Reactions R2, R3, and R4make up the individual light reactions; the overall light reaction isshown in reaction R5 (Lehninger, 1971):
12NADPþ þ18ADPþ18Piþ48 photons-12NADPHþ12Hþ
þ18ATPþ6H2Oþ6O2 ðR5ÞDuring the dark reactions (or Calvin Cycle), the ATP and NADPH
produced during the light reactions are consumed to convert inorganiccarbon (carbon dioxide from the air) to organic carbon (glucose).Initially, three molecules of carbon dioxide are reacted with ribulose-5-phosphate to produce six molecules of 3-phosphoglycerate. The six
2 Organelle is defined in the Glossary (Appendix B) at the end of this paper,along with many other biological and chemical terms.
C.S. Silva et al. / Chemical Engineering Science 130 (2015) 151–171152

molecules of 3-phosphoglycerate are reduced (using NADPH) andphosphorylated (using ATP), forming six molecules of glyceraldehyde-3-phosphate (GAl3P). One of these GAl3P molecules exits the cycle asthe product. Meanwhile, the other five GAl3P molecules proceedthrough a series of isomerization and recombination reactions untilthe three molecules of ribulose-5-phosphate are regenerated. Aftertwo molecules of GAl3P have been produced, they are reacted to formglucose and phosphoric acid, the final products of photosynthesis. Thisseries of reactions is described in more detail in Sections 3.1.4 and
4.1.4. The overall reaction is shown as reaction R6:
6CO2þ12NADPHþ12Hþ þ18ATPþ12H2O-C6H12O6
þ12NADPþ þ18ADPþ18Pi ðR6Þ
1.4. Definition of exergy
Exergy (B) is a thermodynamic property that expresses themaximum (reversible) mechanical work necessary to produce a
Fig. 1. (a) Plant cell with organelles labeled ((Webpage: Plant Cell Diagram; Reindl et al., 2014) By courtesy of Encyclopaedia Britannica, Inc., copyright 2013; used withpermission). The nucleus is the information storage portion of the cell, where DNA is housed. In the rough endoplasmic reticulum (with ribosomes), proteins aremanufactured using RNA (transcribed from DNA) as a template. The cell’s fats and oils are manufactured in the smooth endoplasmic reticulum. Its’ proteins are “packaged”for transport outside the cell in the Golgi apparatus. Vesicles are the packages used for transporting species to and from the cell. Vacuoles are large vesicles used for storagewithin the cell. Peroxisomes are chambers used for the breakdown of fats and protein components, using peroxides. Lysosomes are chambers that contain strong enzymesthat can break down virtually any organic molecules. Mitochondria are used to breakdown organic sugars, like glucose, storing their chemical energy in intermediate ATPmolecules. Finally, in chloroplasts (b), (Webpage: Chloroplast Diagram) photosynthesis takes place, which is the focus of this paper. Note that chloroplasts and mitochondriacontain their own sets of DNA, which are used for the reproduction and maintenance of these organelles. (See the color figure in the e-copy of this manuscript.)
Fig. 2. Chloroplast system diagram. (See the color figure in the e-copy of this manuscript.)
C.S. Silva et al. / Chemical Engineering Science 130 (2015) 151–171 153

material (glucose, in this case) in its specified state from compo-nents common in the natural environment (carbon dioxide andwater), heat being exchanged only with the environment (Szargut,2005). Stated differently, exergy is a measure of the quality ofenergy, obtained by combining the first and second laws ofthermodynamics. A standard definition is shown as Eq. (1)(Keenan, 1951), where B is exergy, H is enthalpy, S is entropy,and To is the “dead-state” temperature (usually of the lowestrelevant temperature of the surrounding environment).
B¼H–ToS ð1ÞAn exergy balance is defined based on the work of Szargut
(2005), as shown in Eq. (2). Note that this formulation of theexergy balance was selected over the first principles approach(explicitly involving H and S), because this work focuses on asystems analysis of the chloroplast and not on thermodynamicderivations of properties.
Bin ¼ Bout;prodþBout;wasteþΔBsysþWsysþΣQ res 1� To
TH
� �þΣδBi
ð2Þwhere Bin is the incoming exergy of the flowing streams, Bout,prod isthe exergy leaving with the product streams, Bout,waste is theexergy leaving with the waste streams, ΔBsys is the exergy changeof the system, Wsys is the work performed by the system, Qres isthe heat transferred from the system (at temperatures TH) to areservoir, To is the temperature of the “dead state”, TH is the “hot”temperature of the system, and ΣδBi is the sum of internal exergylosses (also called exergy destruction or lost work) due toirreversibilities within the system.
The “dead state” is described by the conditions (temperature,pressure, and concentration) of a system’s environment at whichno more useful work can be extracted from a system interactingwith this environment, and it is usually closely related to theambient conditions surrounding a system. The dead state isdefined herein as at a temperature of 298.15 K, a pressure of1 atm, and a concentration of 1 mol/L in solution (except forcarbon dioxide and oxygen, whose exergies are calculated relativeto their gaseous states at this temperature and pressure, andwater – whose exergy is calculated relative to saturated steam
at 298.15 K). These conditions were chosen to facilitate easycomparison with previous literature studies, which have used thisdead state as their reference state.
Each of the exergy terms in Eq. (2) can be decomposed into thephysical, chemical, electrical, and solar exergy components, asshown in Eq. (3). The meaning of each of these terms is defined inmore detail in Section 3.
Bj ¼ Bphys;jþBchem;jþBelec;jþBphoton;j ð3Þ
where Bj is the exergy of a particular stream or system; Bphys,j isthe physical exergy, which is due to temperature and pressureeffects; Bchem,j is the chemical exergy, which is due to chemicalmixing and reactions; Belec,j is the exergy of electrical effects; andBphoton,j is the exergy of sunlight.
Typically, biological systems operate at or near ambient tem-peratures and pressures; therefore, physical effects are small ornegligible herein. For chemical exergy, the method described byLems et al. (2007) is used. For the electrical effects, redox chemicalmethods are used, modified for system concentration (Lems et al.,2010; Nicholls and Ferguson, 2002). Lastly, the exergy effects ofsolar radiation are analyzed using the equations for photons (Lemset al., 2010; Zhu et al., 2008). The equations that describe each ofthese phenomena are presented in Section 3.
2. Literature review
The mechanism of photosynthesis has been known for decades,but conflicting definitions for the exergy efficiency remain, leadingto efficiencies that span orders of magnitude (41% (Lems et al.,2010) to 2.6% (Petela, 2008)). Most studies that attempt to rectifythis problem present yet more definitions and more variations inefficiency. The two main types of studies consider either thephysical effects (evaporation, carbon dioxide sequestration, tem-perature changes) and ignore the complex mechanism of thephotosynthetic reactions (Petela, 2008; Reis and Miguel, 2006),or the converse (Lems et al., 2010). This study incorporates bothbiological and mechanical effects to create a more completepicture.
Fig. 3. Transfer of high energy electrons through photosystem II (PSII) and photosystem I (PSI) (Nicholls and Ferguson, 2002; Voet et al., 2008; Walz, 1997a, b, c). Twochemical reactions are described in this figure. The first involves splitting water into protons, oxygen, and electrons (which are then excited to a higher energy level, P680*).The second is the reduction of NADPþ to NADPH using the high energy electrons and free protons. All other steps are the high-energy electrons passing through intermediatecarriers, which are various functional groups in the protein complexes of PSII and PSI. (See color figure in the e-copy of this manuscript.)
C.S. Silva et al. / Chemical Engineering Science 130 (2015) 151–171154

The exergy property has been adopted in recent analyses ofphotosynthesis (Bisio and Bisio, 1998; Lems et al., 2010; Petela,2008), but many of the earlier studies used the Gibbs free energy(defined in Eq. (4)) to calculate the “energy efficiency” (Asimov,1968; Bassham and Buchanan, 1982; Lehninger, 1971), althoughenthalpy or internal energy are the appropriate variables forenergy balances. Since biochemical reactions occur at approxi-mately the ambient (or dead-state) temperature and pressure, theGibbs free energy is essentially equal to the exergy (comparingEq. (3) to Eq. (4)). This assumption is applied in this work solely asa means of comparison (see Section 5 for more details).
G¼H–TS ð4Þwhere G is the Gibbs free energy, H is the enthalpy, S is theentropy, and T is the temperature of the system.
In principle, exergy efficiency can, and is, defined in theliterature in several ways, as critically reviewed in (Lior andZhang, 2007). Initially, the efficiency of photosynthesis was calcu-lated by dividing the Gibbs free energy change of reaction R1 bythe exergy contained in the photons (experimentally measured)(Asimov, 1968). It should be noted that these early studies used theenergy values for photons; however, the exergy and energy valuesfor photons differ only by approximately 5% (Section 3.1.1). Thisapproach is shown as Eq. (5), and yielded exergy efficienciesbetween 32% and 37%.
ηPS ¼ΔGrxn;R1
ΣBphoton¼ 2976
8033¼ 37% ð5Þ
where ηPS is the exergy efficiency of photosynthesis,3 ΔGrxn,R1 isthe Gibbs free energy change of reaction R1, and ΣBphoton is thesummation of the exergies for the photons required to drivereaction R1. Later studies (Albarran-Zavala and Angulo-Brown,2007; Bassham and Buchanan, 1982; Lehninger, 1971) separatedphotosynthesis into the light reactions (R5) and the dark reactions(R6). The efficiencies of the light reactions were calculated usingEq. (5), replacing ΔGrxn,R1 with ΔGrxn,R5. The efficiency of the darkreactions was then calculated by comparing the Gibbs freeenergies of synthesizing glucose (R1) with those of NADPH andATP, shown in Eq. (6). The total efficiency for the combinedreactions was given by Eq. 7, where ηLR is the exergy efficiencyof the light reactions and ηCC is the exergy of the Calvin Cycle (darkreactions, Sections 3.1.4 and 4.1.4). Efficiencies calculated using Eq.(7) are equivalent to those calculated using Eq. (5).
ηCC ¼ΔGrxn;R1
12ΔGrxn; R2þR3ð Þ þ18ΔGrxn;R4ð6Þ
ηPS ¼ ηLRηCC ð7ÞThe next phenomenon, which was elucidated by experimental
studies of chloroplast light absorption (Chain and Arnon, 1977),was that the photosystems (PSII and PSI) had limited ranges ofabsorption. In addition, models were constructed to represent theeffects of light reaching the organism, and how the organismbehaved with relation to the light-source and its environment(Albarran-Zavala and Angulo-Brown, 2007; Barber, 2009; Bisio andBisio, 1998; Bolton and Hall, 1991; Petela, 2008). The standardrange of absorption is known as the photo-active region (PAR), andis defined as the wavelength range from 400 nm to 700 nm(Webpage: Introduction to ozone; Bassham and Buchanan, 1982;Bolton and Hall, 1991). The relative exergy density within thisregion is determined using Planck’s radiation distribution function(shown as Eq. (8)) and accounting for the solar spectrum at theearth’s surface (Zhu et al., 2008). Note that energy density andexergy density are the same, since they are expressed on a relative
basis and for sunlight the two only differ by a factor of (1�Tearth/Tsun). From Eq. (8), the PAR region comprises roughly 43% of thetotal solar exergy at the earth’s surface (Webpage: Introduction toozone; Bassham and Buchanan, 1982; Bolton and Hall, 1991), andthe revised definition of photosynthetic exergy efficiency follows(Eq. (9)), yielding an efficiency of approximately 13% (Bolton andHall, 1991).
SR λ� �¼ 2hc2
λ5� 1
eðhc=λkBTsÞ �1ð8Þ
ηPS ¼ ηPARηLRηCC ð9ÞFrom here, there is a large divergence in the literature. Many
authors calculate the photosynthetic energy and exergy efficien-cies by employing heuristic estimations for the efficiencies (η)(Barber, 2009; Bugbee and Monje, 1992; Thorndike, 1996) orfractions lost (σ) (Bisio and Bisio, 1998) to the various sub-processes, as shown in Eqs. (10) and (11). These factors typicallyinvolve the light reactions, the Calvin Cycle, photorespiration(Bisio and Bisio, 1998; Kelly and Latzko, 2006c; Lems et al., 2010;Zhu et al., 2008) (Sections 3.2.3 and 4.2.3), photo-inhibition (Berryand Downton, 1982; Kelly and Latzko, 2006c), cellular metabolism(Bisio and Bisio, 1998; Zhu et al., 2008), and other stressors (mostof these effects are defined in the glossary, Appendix B). Efficien-cies derived from these equations are usually in the range of 2–13%, depending on the factors included.
ηPS ¼∏iηi ð10Þ
ηPS ¼∏ið1�σiÞ ð11Þ
Three in-depth exergy studies have been conducted on photo-synthesis within the last decade. The first study, by Reis andMiguel (2006), presents an exergy balance with a plant as thecontrol volume, examining solar exergy and water fluxes through-out the system. However, the complex mechanisms occurringwithin the organism are ignored, and thus, the majority of theexergy lost is attributed to an “internal exergy destruction” term,which does not provide insight about how to improve theefficiency. Petela (2008) completed a similar, more complexanalysis—analyzing the incoming solar radiation, the diffusivefluxes of chemical species, convective heat transfer between theleaf and the surroundings, and radiation emissions by the leaf. Hiscalculations yield an exergy efficiency of 2.6%. However, the mostsubstantial exergy efficiency loss (�93 percent) is due to thevaporization of liquid water, in which the plant dissipates excessheat. Thus, it provides no information on how to improve theefficiency. Lems et al. (2010) performs an exergy analysis of thelight and dark reactions of photosynthesis, using photon con-sumption data from Voet et al. (2008). They calculate exergyefficiencies for PSII, PSI, ATP synthase, two different versions ofthe Calvin cycle, and the overall process (41 percent). However, theeffect of poor absorbance outside the PAR and other physicalphenomena are not taken into account.
Finally, Melis (2009) completes a superficial theoretical energyefficiency calculation before comparing it with experimentallymeasured energy efficiencies for various plants and algae. Hisresults show that the energy efficiencies of actual organisms are3–50 times smaller than the theoretical efficiencies due to satura-tion effects in photosystem II (Sections 3.1.2 and 4.1.2) and theCalvin Cycle (Sections 3.1.4 and 4.1.4).
3. Methods
The analysis in this section and Section 4 is separated intoprocesses contained within the chloroplast and those performed3 Note that η is used herein to refer to exergy efficiency.
C.S. Silva et al. / Chemical Engineering Science 130 (2015) 151–171 155

by the plant as a whole. The reason for this distinction is thatchloroplasts should, in theory, perform similarly for all C3 plants.Issues concerning the overall organism (drawing water in throughthe roots, dealing with photorespiration, and metabolism), how-ever, are much more dependent upon the environment, the seasonand time of day, and the age of the organism. In addition, thisdivision provides guidance toward improving the efficiency usinggenetic modifications to adjust the chloroplast, as compared withimproving the plant-based inefficiencies, which depend, for exam-ple, on the availability of water.
3.1. Chloroplast considerations
The methods for calculating the exergy required to synthesizeone mole of glucose in the light and dark reactions (within thechloroplast) are presented in this section, with calculation resultsin Section 4.1. A qualitative exergy-flow diagram involving the fourmajor steps of the process is shown as Fig. 4.
The physical and biological processes are subdivided as much aspossible to estimate exergy flows through the latest photosyntheticmechanisms. The exergy required to drive reaction R1 is the desiredoutput, and its ratio to the total exergy input yields the exergyefficiency. To better resolve the mechanisms, several variables areanalyzed, including the exergy of photons and their imperfectabsorption, the electron transport chain, the proton-motive force(PMF) and ATP synthase, and the biochemical reactions of theCalvin Cycle.
Inefficiencies due to shading and indirect sunlight are not takeninto account, because these effects depend upon the organismgrowth location, which negatively impacts any solar radiationcollector. Carbon dioxide and oxygen within the chloroplast areassumed to be in equilibrium with the surrounding environment.Water is assumed to be available in excess. This assumption is dealtwith in Section 3.2.2, as drawing water from the surroundingenvironment is achieved by the entire organism, not the chloroplast.
3.1.1. Sunlight and absorptionPhotosynthesis begins with the absorption of packets of light
(photons) by light-sensitive pigments in the chloroplasts. These
light-absorbing pigments are called chlorophyll, and each chlorophylltype has a different radiation absorption spectrum. All of the exergyused in photosynthesis originates from photons (except for thechemical exergy of CO2 and water), which are collected andconverted to chemical exergy during the light reactions. To deter-mine the exergy of a mole of photons, a modified form of Planck’sLaw (Eq. (12)) is applied (Lems et al., 2010; Voet et al., 2008). Notethat the only difference between Planck’s Law and Eq. (12) is thefactor ð1�ðTearth=TsunÞÞ, which accounts for a 5 percent differencebetween the energy and exergy of photons:
BphotonðλÞ ¼NAhcλ
1� Tearth
Tsun
� �ð12Þ
where Bphoton is the photon exergy (J/mol photons) at a givenwavelength (λ), NA is Avogadro’s number (6.023�1023), h is Planck’sconstant (6.626�10–34 J s), c is the speed of light (3�108 m/s), λ isthe wavelength (m), Tearth is the ambient temperature of the earth(298.15 K), and Tsun is the temperature of the sun’s surface (5762 K)(Lems et al., 2010).
Photosynthetic pigments can absorb only certain ranges ofwavelengths, and imperfectly at that. Plants primarily absorbsunlight in the photo-active region (PAR), which is defined to befrom 400 to 700 nm (Webpage: Introduction to ozone; Bolton andHall, 1991). A plot of the percentage of sunlight energy absorbed asa function of photon wavelength (Eq. (8)) is shown as Fig. 5(Webpage: Introduction to ozone) Note that this is on a relativebasis, so that percentages of energy and exergy absorption are thesame. Factors are available for relative absorption within certainwavelength regions (Petela, 2008).
Because the calculation of photon exergy involves moles ofphotons, it is important to determine the average exergy for theentire mole, and to do this, the average exergy of the photon rangemust be taken into account. The mean-value theorem, shown asEq. (13), is useful for finding the average of a continuous functionover a well-defined interval (Webpage: Mean value theorem).More specifically, for a continuous function, f(x), on a closedinterval [a, b], the mean-value theorem states:
f cð Þ ¼ 1b�a
Z b
af xð Þdx ð13Þ
Fig. 4. Qualitative exergy-flow diagram. The color key describes the type of exergy flows between the different biological operations, as expressed in Eq. (3). (See the colorfigure in the e-copy of this manuscript.)
C.S. Silva et al. / Chemical Engineering Science 130 (2015) 151–171156

where f(c) is the average value of f(x) on the interval [a, b].Applying the mean-value theorem to Eq. (12), yields:
Bphoton;avg ¼NAhc 1� Tearth
Tsun
� �Ln λhigh� �� LnðλlowÞλhigh� λlow
ð14Þ
where Bphoton,avg is the average photon exergy (J/mol photon), NA isAvogadro’s number (6.023�1023), h is Planck’s constant(6.626�10–34 J� s), c is the speed of light (3�108 m/s), and λhighis the maximum wavelength (m), λlow is the minimum wavelength(m), Tearth is the ambient temperature of the earth (298.15 K), andTsun is the temperature of the sun’s surface (5762 K).
3.1.2. Electron transport chainReturning to Fig. 3, photons are absorbed by the electrons within
light-absorbing pigments (P680 and P700). The electrons areexcited to a higher energy state, moving farther away from thepigment’s core (the nuclei of a magnesium atomwithin a functionalgroup called a chlorin, which is explained in the Glossary –
Appendix B). Following the principle of charge-separation (Barber,2009; Gratzel, 2001; Gust and Moore, 1985, 1989; Gust et al., 1998,2001; Kim et al., 2012; Luo et al., 2013), the electrons are drawnaway from the pigment by a series of intermediate carriers (QA, QB,PC, Ao, A1, FX, FA, and FB) forming an electron-transport chain (ETC).It is beyond the scope of this article to focus on the intermediatecarriers; see references Nicholls and Ferguson (2002) and Walz(1997a, b, c) for specifics. The excited forms of both the pigmentsand intermediate carriers exist for only several nanoseconds(Scholes et al., 2012). In terms of exergy losses, these intermediatecarriers are analogous to resistors in a wire, in that the electronspass through, dissipating some of their potential as waste heat.
In exergy balances for carrier i (Eq. (15)), exergy that passesthrough an electron carrier is passed to the next carrier, used todo work within the chloroplast, or lost to the environment aslow-grade, waste heat (exergy destruction):
Bcarriers;i ¼ Bcarriers;i�1þWþδB ð15Þ
where Bcarrier,i is the exergy of carrier i, W is the work performedby the electron transfer, and δB is the exergy destroyed. The
standard reduction potentials is expressed by
ΔG1¼ �nFΔε1 ð16Þwhere ΔGo is the standard Gibbs free energy change, n is the numberof moles of electrons, F is the Faraday constant (96,485 C/mol e�),and Δεo is the standard change in reduction potential. It can bemodified to account for the effects of intracellular concentrations andused to calculate the exergy difference between electron carriers(Lems et al., 2010):
ΔBelec ¼ Bcarriers;i�Bcarriers;i�1 ¼ nF ΔεoþRTo Lnð∏½A��υii Þ ð17Þ
whereΔBelec is the exergy difference between carriers i and i�1, R isthe universal gas constant (8.3143 J/mol K), To is the ambienttemperature (298.15 K), [A]i is the activity of carrier i, and νi is thestoichiometric coefficient of carrier i. The changes in exergy arepresented in Tables 1 and 2 in Section 4.1.2. Comparing the changesof exergy throughout the system with the amount consumed byuseful work reveals the sources of exergy destruction (Eq. (15)).
3.1.3. ATP synthaseATP synthase is an assembly of hydrophobic and hydrophilic
proteins that form a transmembrane protein-complex, containinga proton-translocation channel (Voet et al., 2008). As protons flowdown their concentration gradient, ATP synthase acts as a turbine,using the proton-motive force (PMF) to drive its shaft. The shaft ofATP synthase forces ADP and phosphoric acid together andsupplies the necessary exergy for them to react, yielding ATPand water. ATP synthase can also function in reverse, consumingATP to pump protons against their concentration gradient. Apicture of ATP synthase is shown as Fig. 6 (Webpage: ATPsynthase). Note that for chloroplasts, four protons must flow fromthe lumen to the stroma to produce one ATP molecule (Zhu et al.,2008).
3.1.4. Dark reactions/Calvin cycleThe Calvin Cycle is the process by which inorganic carbon
(carbon dioxide from the air or bicarbonate in solution) is reducedand converted to organic sugar molecules (glucose in this analy-sis). Fig. 7 shows the chemical reaction mechanism as presentedbyBassham and Buchanan (1982), modified to include the reaction
Fig. 5. Energy absorbed as a function of wavelength of sunlight ((Webpage: Introduction to Ozone), reproduced with permission from the COMET Program). The types ofsolar electromagnetic radiation are shown, along with their wavelengths and the relative amount of energy they represent. The region of interest for photosynthesis is 400–700 nm, the photo-active region (PAR), which represents only 43% of the total incoming energy/exergy. (See the color figure in the e-copy of this manuscript.)
C.S. Silva et al. / Chemical Engineering Science 130 (2015) 151–171 157

numbers (used in Table 3), as well as to highlight the product-producing steps (red ovals). Note that the number of lines perarrow is the number of times a reaction occurs to produce onemolecule of glyceraldehyde-3-phosphate (GAl3P) – the intermedi-ate product. Two molecules of GAl3P are consumed to produce onemolecule of glucose-6-phosphate (G6P; repeating reactions C5, C6,and C7, followed by reaction C14), which is then converted toglucose by hydrolysis (not shown in Fig. 7). Finally, reactionsC1–C15 are shown in Table 3; whereas, the abbreviations for thespecies names, and thermochemical properties of the species andreactions, are given in Appendix A, Table A.1.
The dark reactions are assumed to occur isothermally andisobarically, with exergy changes due only to chemical effects.
All reaction exergy losses are released as low-grade heat (thedriving force). For each molecule in the reactions, its chemicalexergy is estimated using the method of Lems et al. (2007):
Bchem �Xk
υkBelement;i� �þΔGo
f þRTo Ln A½ �
þRTo Ln 1þXi
∏il ¼ 1 Kl
� �½Hþ �i
!
þRTo
Xj
Ln 1þXni
∏i
l ¼ 1Kl
!Mj� �i !
ð18Þ
where Bchem is the chemical exergy of a species (per mole), νi is thenumber of times that atom k occurs in the species (stoichiometric
Table 1Exergies and reduction potentials of PSII. (See the color table in the e-copy of this manuscript.)
Note: The starting point is colored yellow, all steps that proceed naturally are green, and all steps that require an input of exergy (sunlight) are red.
Table 2Exergies and reduction potentials of PSI. (See the color table in the e-copy of this manuscript.)
Note: The starting point is colored yellow, all steps that proceed naturally are green, and all steps that require an input of exergy (sunlight) are red.
C.S. Silva et al. / Chemical Engineering Science 130 (2015) 151–171158

Fig. 6. Schematic of ATP synthase (Webpage: ATP synthase), reproduced with permission from NDSU VCell Animation Project). The pink spheres represent protons, theviolet spheres represent phosphoric acid, and the blue spheres represent adenosine. As the protons flow down their concentration gradient (from the inside of the thylakoid,into the stroma), they turn the top of ATP synthase, as depicted by the arrows. The work from turning the top is transferred down the shaft (central or thinnest part of theprotein complex), powering the lower section. The lower section uses the shaft work to force ADP and phosphoric acid to react, generating ATP and water. (See color figure inthe e-copy of this manuscript.)
Fig. 7. The Calvin Cycle ((Bassham and Buchanan, 1982), reproduced with permission). The 14 reactions (C1–C14) shown correspond with the reaction numbers in Table 3. Forevery step, the number of lines that composes the arrow (for example, 6 for reaction C4) is the number of times that reaction occurs to produce one molecule of GAl3P, theintermediate product. Two molecules of GAl3P then proceed through reactions C5, C6, C7, and C14 to yield the final product G6P, which is hydrolyzed to glucose (how carbonleaves the system). In reaction C2, carbon dioxide is fixed by the enzyme RuBisCO, which is the only place carbon enters the cycle. Note that reactions C1 and C3 consume theATP generated by ATP synthase and reaction C4 consumes the NADPH generated by PSI. (See color figure in the e-copy of this manuscript.) This article was published inPhotosynthesis, Vol 2, Bassham J.A. and Buchanan B.B., Carbon Dioxide Fixation Pathways in Plants and Bacteria, page 147, Copyright Elsevier (Academic Press) (1982).
C.S. Silva et al. / Chemical Engineering Science 130 (2015) 151–171 159

coefficient when forming the species from reference atoms),ΔGof is
the standard Gibbs free energy of formation of the species, R is theuniversal gas constant, To is the dead-state temperature (298.15 K),[A] is the activity of the species, Kl is the chemical equilibrium
constant (for either acid, base, or metal ion dissociation) forreaction l, [Hþ] is the hydrogen ion concentration, [Mj] is theconcentration of metal ion j, k is the atom counter, i and l are thereaction counters, and j is the metal ion counter.
Table 3Exergy losses in the dark reactions. (See the color table in the e-copy of this manuscript.)
Note: The largest losses are shown in dark red, intermediate losses are shown as light red, then light green, and finally the smallest losses are shown as dark green.
C.S. Silva et al. / Chemical Engineering Science 130 (2015) 151–171160

3.2. Plant considerations
Five issues are considered for the organism as a whole:chloroplast performance (Section 3.1), sunlight reflection by theleaves (Section 3.2.1), transpiration (Section 3.2.2), photorespira-tion (Section 3.2.3), and plant metabolism (Section 3.2.4). Theseissues were chosen because they relate directly to the organism’sperformance in converting sunlight, carbon dioxide, and waterinto biomass. Other factors, such as incident sunlight andthe effects of water quality, are site dependent and thus notconsidered here.
3.2.1. Sunlight reflectionSome of the incident light is reflected by the surfaces of the
leaves or other portions of the plant cells before the light reachesthe chloroplasts. This phenomenon has been mentioned by twodifferent authors (Bisio and Bisio, 1998; Petela, 2008); however,little discussion on the specifics was presented by either source.Again, inefficiencies due to shading and indirect sunlight are nottaken into account, because these effects depend upon the organ-ism growth location, which negatively impacts any solar radiationcollector.
3.2.2. TranspirationWhile plants perform photosynthesis, their pores (stomata)
remain open, permitting carbon dioxide to diffuse in and oxygento diffuse out. Water, which enters plants through their roots, ispumped into their leaves, and emitted by transpiration throughtheir stomata. In this way, the plant cells accumulate water, whichis then used by chloroplasts in Photosystem II.
Exergy losses by transpiration are estimated using Eq. (19)–(21), used by Reis and Miguel (2006). Saturated steam at To is thereference state for water, with liquid water at a lower exergy. Notethat the chloroplasts (and leaves) are assumed to be at theenvironmental temperature, and carbon dioxide and oxygen areassumed to be in equilibrium with the surrounding environment.The total exergy loss is estimated by raising the water in the plantstem to height, z, and accounting for evaporation. In addition, theeffect of humidity in the air must be accounted for because, forlocations remote from the sea, the concentration of water vapor inthe ambient air may be the most important factor in determiningthe chemical exergy of water; the last term in Eq. (19) accounts forthis phenomena (Szargut, 2005).
Bw ¼ H�Hoð Þ–ToðS�SoÞþMwgz–RTo Ln Φoð Þ ð19Þ
WC ¼ r=ϕ�r ð20Þ
δBGluc ¼ WCð ÞBw ð21Þwhere Bw is the exergy of liquid water in the leaf (J/mol), To is thedead state temperature (298.15 K), H is the enthalpy of liquidwater (J/mol), Ho is the enthalpy of saturated steam (J/mol) at To, Sis the entropy of liquid water (J/mol-K), So is the entropy ofsaturated steam (J/mol-K) at To, g is the gravitational acceleration(9.81 m/s2), Mw is the molecular weight of water (0.01802 kg/mol),Φo is the relative humidity, R is the universal gas constant(8.3143 J/mol-K), ϕ is the fraction of water used in photosynthesis(the remainder is lost to evaporation), r is the ratio of water toglucose in reaction R1, WC is the number of moles of water lost toevaporation without being used in the reaction, and δBGluc is theexergy destruction due to transpiration per mole of glucoseproduced.
3.2.3. PhotorespirationRibulose-1,5-bisphosphate carboxylase/oxygenase (RuBisCO) is
the enzyme in the Calvin Cycle that catalyzes the reaction of
carbon dioxide with ribulose-1,5-bisphosphate (RuBP) in reactionC2, fixing carbon dioxide as organic carbon. About one-thirdto one-fourth of the time (Kelly and Latzko, 2006e), RuBisCOfixes oxygen (instead of carbon dioxide) to RuBP, forming onemolecule of 3-phosphoglycerate (PGA) and one molecule of2-phosphoglycolate (Kelly and Latzko, 2006a, c), as shown inFig. 8 (Webpage: Photorespiration wikicommons) This is knownas photorespiration (Kelly and Latzko, 2006a). The cell theninitiates a series of chemical reactions, which convert the2-phosphoglycolate to PGA and carbon dioxide (not shown inFig. 8); the former reenters the Calvin Cycle (Kelly and Latzko,2006a, c). Because most of these chemical reactions occur outsidethe chloroplast, photorespiration has been treated as associatedwith the entire plant. It is noteworthy, however, that the reactionthat initiates this process (RuBisCO fixing oxygen) occurs exclu-sively inside the chloroplast.
The literature shows no concrete conclusion concerning photo-respiration. In some opinions, it is considered to be an energy-dissipation mechanism to prevent photo-inhibition; that is, theoxidation of an intracellular component by excess sunlight andoxygen (Berry and Downton, 1982; Kelly and Latzko, 2006c). Inother opinions, photorespiration is due to the inefficiency ofRuBisCO, owing to the fact that oxygen concentrations in the airhave increased drastically since RuBisCO first appeared on theEarth (Ogren, 1982). This would explain mechanisms for mitigat-ing photorespiration, like the “C4 cycle” and crassulacean acidmetabolism (Kelly and Latzko, 2006a). In either case, photorespira-tion is a process, which lowers the efficiency of photosynthesis.
3.2.4. Plant metabolismMetabolism includes everything from the degradation of sugars
and biomass to produce high energy molecules (like ATP) to therepair, maintenance, and manufacture of the complex proteins inthe photosystems and enzymes in the Calvin Cycle. Its details aretoo vast to be covered in a single journal article. Simplifications aretherefore made herein.
The standard reaction for cellular metabolism (called respira-tion) is the reverse of reaction R1 and is shown as reaction R7. Itshighly spontaneous nature (due to the large chemical exergycontained within glucose) is used to drive the production ofhigh-exergy carrier molecules, like ATP, which sustain the plantduring periods of darkness. The production of ATP from glucose isshown as reaction R8 (Voet et al., 2008). Note that 38 ATP areproduced in reaction R8 – the theoretical maximum. In actualpractice, the number of ATP produced varies between 30 and 32,depending upon the organism that transports the moleculesinvolved between the organelles. In addition to complete degrada-tion, glucose can be converted to intermediates through variousmetabolic pathways, which build or repair organelles and othercellular components. In this way, metabolism is essentially anexergy cost for the various day-to-day intracellular operations.
C6H12O6þ6O2-6CO2þ6H2O; ΔG1¼ �2872 kJ=mol ðR7Þ
C6H12O6þ6O2þ38ADPþ38H3PO4-6CO2þ38ATPþ44H2 O;ΔG1¼ �1626 kJ=mol ðR8Þ
4. Analysis
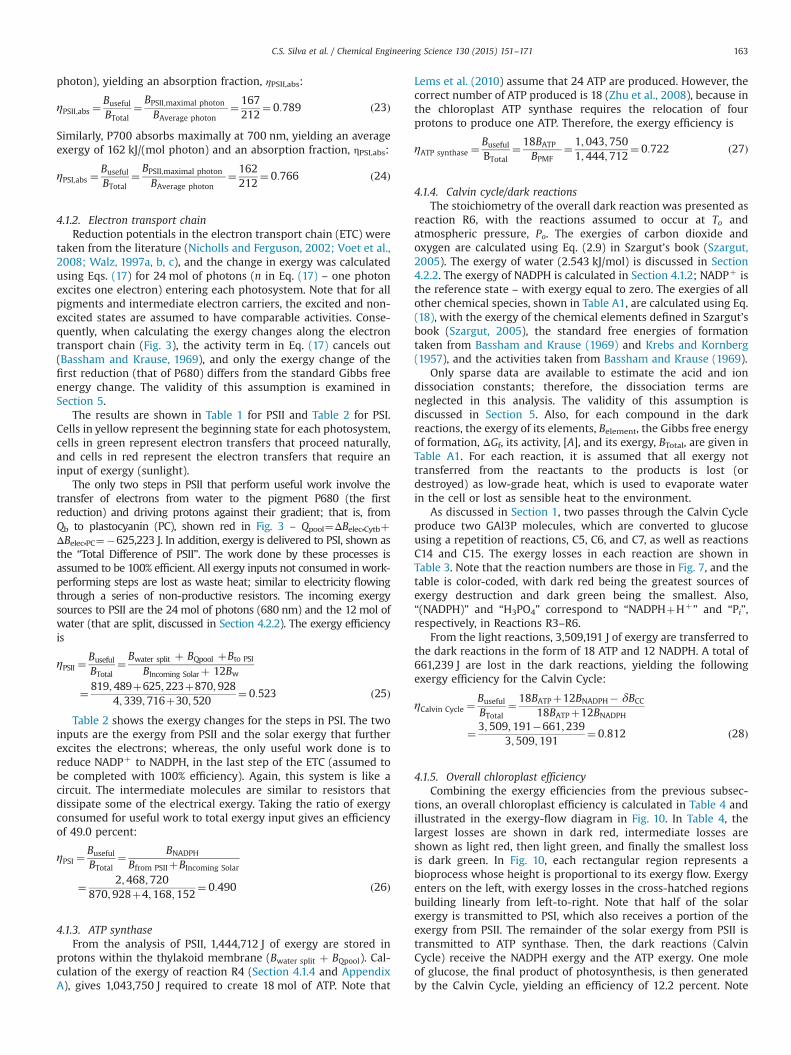
The photosynthetic exergy efficiency of a terrestrial plant thathas standard light absorption bands, shown in Fig. 9, is calculatedin this section, using the models in Section 3. Note that the relativeabsorption of energy and exergy is the same (Eq. 12), and is theamount of incident solar radiation absorbed by chloroplast pig-ments (P680 and P700) converted to electrical work in the form of
C.S. Silva et al. / Chemical Engineering Science 130 (2015) 151–171 161

high-energy electrons. The plant’s surrounding environment istemperate, with ample water, sunlight, carbon dioxide, and arelative humidity of 40 percent (arid stress conditions are notexamined herein). This yields the “maximum” efficiency of photo-synthesis and the causes for each exergy loss, suggestingapproaches to avoid or reduce these losses.
4.1. Chloroplast efficiency
The exergy efficiency for a typical C3 chloroplast is calculated inthis section and the accompanying subsections. It should be notedthat this efficiency is based upon reversible exergy changes, andthus, does not account for kinetic and diffusive bottlenecks. It isrepresentative of most C3 plant chloroplasts under non-stressconditions.
4.1.1. Sunlight and absorbanceOnly a fraction of the incident solar radiation is within the PAR
(Webpage: Introduction to ozone; Bolton and Hall, 1991)(ηPAR¼0.43), the active region for chloroplast pigment absorption.It is assumed that all PAR photons that reach the chloroplast areabsorbed. A small fraction of the non-PAR radiation is alsoabsorbed, αnon-PAR. Petela (2008) assigns a value of 0.05 for αnon-PAR, which is used herein. Therefore, the total chloroplast exergyefficiency is
ηsolar ¼Buseful
BTotal¼ ηPARBsunþαnon�PARð1�ηPARÞBsun
Bsun
¼ ηPARþαnon�PARð1�ηPARÞ ¼ 0:4585 ð22Þ
where Bsun is the total incoming solar exergy (J). Note that theabsorbed photons are split evenly between the two photosystems(24 photons to PSII and 24 photons to PSI).
Regarding the pigments P680 and P700, they absorb maximally(that is, the greatest amount of solar potential exergy absorbedand converted to electrical exergy) at 680 and 700 nm, respec-tively. The exergies of photons at these wavelengths are calculatedusing Eq. (12). Photons at shorter wavelengths (and, therefore,higher in exergy) are degraded to the maximal absorption wave-length (Barber, 2009). Photons at wavelenghts longer than 700 nmare instantly degraded to waste heat. When the vast majority ofabsorbed photons are in the PAR, it is assumed that theirwavelengths are evenly distributed, with Eq. (14) determiningthe average exergy per mole of photons. According to Petela(2008) chloroplasts absorb marginally in the ultraviolet region,but since such a small fraction of that exergy is absorbed, it isexcluded from the averaging.
The maximal wavelength, λhigh, is 700 nm and λlow is 400 nm,yielding an average exergy of 212 kJ/(mol photon). Since P680absorbs maximally at 680 nm, it absorbs roughly 167 kJ/(mol
Fig. 8. Photorespiration ((Webpage: Photorespiration wikicommons) reproduced with permission). The green oval represents the chloroplast, where the Calvin Cycle (CC)takes place. RuBisCO, the enzyme responsible for fixing carbon dioxide in reaction C2 (Fig. 7), can also fix oxygen, which leads to the cycle shown here, producing2-phosphoglycolate and 3-phosphoglycerate (molecules 3 and 2, respectively). 3-phosphoglycerate can reenter the Calvin Cycle immediately (reaction C3 in Fig. 7), but2-phosphoglycolate must be converted to 3-phosphoglycerate before it can be returned to the Calvin Cycle. The conversion of 2-phosphoglycolate to 3-phosphoglycerateoccurs between three organelles: the chloroplast, the peroxisome (shown in pink), and the mitochondria (shown in purple). (See color figure in the e-copy of thismanuscript.)
Fig. 9. Relative light absorption in the PAR (Webpage: Solar Radiation &Photosynthetically Active Radiation), reproduced with permission). Relativeabsorption is the amount of solar exergy absorbed by the chlorophyll pigments(P680 and P700) at a particular wavelength, relative to the total incoming solarexergy at that wavelength. (See the color figure in the e-copy of this manuscript.)
C.S. Silva et al. / Chemical Engineering Science 130 (2015) 151–171162
photon), yielding an absorption fraction, ηPSII,abs:
ηPSII;abs ¼Buseful
BTotal¼ BPSII;maximal photon
BAverage photon¼ 167212
¼ 0:789 ð23Þ
Similarly, P700 absorbs maximally at 700 nm, yielding an averageexergy of 162 kJ/(mol photon) and an absorption fraction, ηPSI,abs:
ηPSI;abs ¼Buseful
BTotal¼ BPSII;maximal photon
BAverage photon¼ 162212
¼ 0:766 ð24Þ
4.1.2. Electron transport chainReduction potentials in the electron transport chain (ETC) were
taken from the literature (Nicholls and Ferguson, 2002; Voet et al.,2008; Walz, 1997a, b, c), and the change in exergy was calculatedusing Eqs. (17) for 24 mol of photons (n in Eq. (17) – one photonexcites one electron) entering each photosystem. Note that for allpigments and intermediate electron carriers, the excited and non-excited states are assumed to have comparable activities. Conse-quently, when calculating the exergy changes along the electrontransport chain (Fig. 3), the activity term in Eq. (17) cancels out(Bassham and Krause, 1969), and only the exergy change of thefirst reduction (that of P680) differs from the standard Gibbs freeenergy change. The validity of this assumption is examined inSection 5.
The results are shown in Table 1 for PSII and Table 2 for PSI.Cells in yellow represent the beginning state for each photosystem,cells in green represent electron transfers that proceed naturally,and cells in red represent the electron transfers that require aninput of exergy (sunlight).
The only two steps in PSII that perform useful work involve thetransfer of electrons from water to the pigment P680 (the firstreduction) and driving protons against their gradient; that is, fromQb to plastocyanin (PC), shown red in Fig. 3 – Qpool¼ΔBelec,CytbþΔBelec,PC¼�625,223 J. In addition, exergy is delivered to PSI, shown asthe “Total Difference of PSII”. The work done by these processes isassumed to be 100% efficient. All exergy inputs not consumed in work-performing steps are lost as waste heat; similar to electricity flowingthrough a series of non-productive resistors. The incoming exergysources to PSII are the 24 mol of photons (680 nm) and the 12mol ofwater (that are split, discussed in Section 4.2.2). The exergy efficiencyis
ηPSII ¼Buseful
BTotal¼ Bwater split þ BQpool þBto PSI
BIncoming Solarþ 12Bw
¼ 819;489þ625;223þ870;9284;339;716þ30;520
¼ 0:523 ð25Þ
Table 2 shows the exergy changes for the steps in PSI. The twoinputs are the exergy from PSII and the solar exergy that furtherexcites the electrons; whereas, the only useful work done is toreduce NADPþ to NADPH, in the last step of the ETC (assumed tobe completed with 100% efficiency). Again, this system is like acircuit. The intermediate molecules are similar to resistors thatdissipate some of the electrical exergy. Taking the ratio of exergyconsumed for useful work to total exergy input gives an efficiencyof 49.0 percent:
ηPSI ¼Buseful
BTotal¼ BNADPH
Bfrom PSIIþBIncoming Solar
¼ 2;468;720870;928þ4;168;152
¼ 0:490 ð26Þ
4.1.3. ATP synthaseFrom the analysis of PSII, 1,444,712 J of exergy are stored in
protons within the thylakoid membrane (Bwater split þ BQpool). Cal-culation of the exergy of reaction R4 (Section 4.1.4 and AppendixA), gives 1,043,750 J required to create 18 mol of ATP. Note that
Lems et al. (2010) assume that 24 ATP are produced. However, thecorrect number of ATP produced is 18 (Zhu et al., 2008), because inthe chloroplast ATP synthase requires the relocation of fourprotons to produce one ATP. Therefore, the exergy efficiency is
ηATP synthase ¼Buseful
BTotal¼ 18BATP
BPMF¼ 1;043;7501;444;712
¼ 0:722 ð27Þ
4.1.4. Calvin cycle/dark reactionsThe stoichiometry of the overall dark reaction was presented as
reaction R6, with the reactions assumed to occur at To andatmospheric pressure, Po. The exergies of carbon dioxide andoxygen are calculated using Eq. (2.9) in Szargut’s book (Szargut,2005). The exergy of water (2.543 kJ/mol) is discussed in Section4.2.2. The exergy of NADPH is calculated in Section 4.1.2; NADPþ isthe reference state – with exergy equal to zero. The exergies of allother chemical species, shown in Table A1, are calculated using Eq.(18), with the exergy of the chemical elements defined in Szargut’sbook (Szargut, 2005), the standard free energies of formationtaken from Bassham and Krause (1969) and Krebs and Kornberg(1957), and the activities taken from Bassham and Krause (1969).
Only sparse data are available to estimate the acid and iondissociation constants; therefore, the dissociation terms areneglected in this analysis. The validity of this assumption isdiscussed in Section 5. Also, for each compound in the darkreactions, the exergy of its elements, Belement, the Gibbs free energyof formation, ΔGf, its activity, [A], and its exergy, BTotal, are given inTable A1. For each reaction, it is assumed that all exergy nottransferred from the reactants to the products is lost (ordestroyed) as low-grade heat, which is used to evaporate waterin the cell or lost as sensible heat to the environment.
As discussed in Section 1, two passes through the Calvin Cycleproduce two GAl3P molecules, which are converted to glucoseusing a repetition of reactions, C5, C6, and C7, as well as reactionsC14 and C15. The exergy losses in each reaction are shown inTable 3. Note that the reaction numbers are those in Fig. 7, and thetable is color-coded, with dark red being the greatest sources ofexergy destruction and dark green being the smallest. Also,“(NADPH)” and “H3PO4” correspond to “NADPHþHþ” and “Pi”,respectively, in Reactions R3–R6.
From the light reactions, 3,509,191 J of exergy are transferred tothe dark reactions in the form of 18 ATP and 12 NADPH. A total of661,239 J are lost in the dark reactions, yielding the followingexergy efficiency for the Calvin Cycle:
ηCalvin Cycle ¼Buseful
BTotal¼ 18BATPþ12BNADPH� δBCC
18BATPþ12BNADPH
¼ 3;509;191�661;2393;509;191
¼ 0:812 ð28Þ
4.1.5. Overall chloroplast efficiencyCombining the exergy efficiencies from the previous subsec-
tions, an overall chloroplast efficiency is calculated in Table 4 andillustrated in the exergy-flow diagram in Fig. 10. In Table 4, thelargest losses are shown in dark red, intermediate losses areshown as light red, then light green, and finally the smallest lossis dark green. In Fig. 10, each rectangular region represents abioprocess whose height is proportional to its exergy flow. Exergyenters on the left, with exergy losses in the cross-hatched regionsbuilding linearly from left-to-right. Note that half of the solarexergy is transmitted to PSI, which also receives a portion of theexergy from PSII. The remainder of the solar exergy from PSII istransmitted to ATP synthase. Then, the dark reactions (CalvinCycle) receive the NADPH exergy and the ATP exergy. One moleof glucose, the final product of photosynthesis, is then generatedby the Calvin Cycle, yielding an efficiency of 12.2 percent. Note
C.S. Silva et al. / Chemical Engineering Science 130 (2015) 151–171 163

that in Table 4, the inefficiencies due to photosystem absorption(due to the optimal absorption wavelengths) and the electrontransfer chain are separated into different categories; whereas, inFig. 10 they are lumped together inside the boxes. The impact ofTable 4’s results is analyzed in Section 4.2.5.
4.2. Plant efficiency
In this section, the analysis is expanded to include factors thataffect the plant’s efficiency, but are not contained within thechloroplast. The processes that occur within the chloroplast(Section 4.1) have a well-defined efficiency, involving clear inputsand outputs and well-defined processes. The four phenomenadiscussed in Section 4.2 can be thought of as sinks, which drain theplant’s resources without driving the production of glucose –
although some of these processes are necessary (metabolic repairand maintenance of the cellular machinery, for example).
4.2.1. Sunlight reflectionTo ensure an accurate comparison between chloroplasts and
other solar collectors, the reflectance of the incident solar exergyfrom the leaves must be taken into account (Webpage: PAR & thelight spectrum). It is beyond the scope of this paper to explore thecomplex mechanism of leaf radiation reflection, much of which iscovered by Berry and Downton (1982). Instead, a reflection factor,αPAR, is used herein. The literature lists values between 0.88 and0.80 (Bassham and Buchanan, 1982; Berry and Downton, 1982;Petela, 2008). Because the reflectance portion may be a result oflight degradation by chlorophyll pigments, the higher absorption
Fig. 10. Exergy-flow diagram. The exergy of the glucose product leaving the system is equal to the exergy of one mole of glucose. The 23,203 kJ of “Total Solar Exergy” wasback-calculated to achieve this final value for glucose. The exergy lost by reflection or as low-grade heat is shown using the crosshatched sections.
Table 4Overall chloroplast efficiency. (See the color table in the e-copy of this manuscript.)
Note: The largest losses are shown in dark red, intermediate losses are shown as light red, then light green, and finally the smallest losses as dark green.
C.S. Silva et al. / Chemical Engineering Science 130 (2015) 151–171164

factor (αPAR¼0.88) is used herein to avoid “double-counting”exergy destruction between these two phenomena.
4.2.2. TranspirationReturning to Section 3.2.2, transpiration is essentially water
leakage from the plant’s leaves, a process to minimize for optimalexergy performance. Because an efficiency does not apply, Eqs.(19)–(21) are used to determine the exergy loss to transpirationper mole of glucose produced.
Enthalpies and entropies are from the saturated steam tables atthe reference state (saturated steam at To), and from the unsatu-rated water tables for the “high-exergy” state (water at To and Po).For terrestrial plants, the height, z, is taken as 2.0 m. The relativehumidity, Φo, is set at 0.4 (Petela, 2008), and the water fractionwithin the leaf, ϕ, is set at 0.5 (Reis and Miguel, 2006).
Eq. (19) yields the exergy of water, Bw¼2.543 kJ/mol. The waterlost by evaporation without reacting is computed using Eq. (20); thatis, WC¼6/0.5–6¼6 mol of water. Using Eq. (21), the exergy destruc-tion per mole of glucose is δBG¼15,260 J/(mol glucose synthesized).
It is important to note that, while the exergy loss is relativelyinsignificant for the temperate environment selected herein,exergy losses would be significant in an arid climate. For example,taking Φo¼0.05 and ϕ¼4.31�10�4 (Kluge, 1982) yields an exergyloss of 107,100 kJ/(mol glucose), making photosynthesis infeasiblefor C3 plants. In this case, plants having a cassulacean acidmetabolism (CAM), a mechanism used to capture and store carbondioxide during dark hours, are needed to conserve water (Web-page: Photorespiration wikicommons). More information aboutCAM is provided in the Glossary (Appendix B).
4.2.3. PhotorespirationLike transpiration, photorespiration is a process that dissipates
exergy without aiding in the production of glucose. Similarly, itmust be eliminated to achieve optimal photosynthesis operation.Because an efficiency does not apply, given a mechanism forphotorespiration, such as that in Fig. 8, exergy losses in eachreaction can be estimated using the equations in Section 3.1.4.This, however, is beyond the scope of the analysis herein.
According to Kelly and Latzko (2006a), each “CO2 cycle” inphotorespiration uses 6 NADPH and 10 ATP, yielding 1813 kJexergy loss. Since RuBisCO has a carbon dioxide to oxygen affinityof 4:1 or 3:1, 453 kJ and 604 kJ, respectively, of photorespirationexergy losses per mole of glucose occur. Alternatively, photore-spiration is known to degrade one-third to one-fourth of fixedcarbon (glucose herein) (Kelly and Latzko, 2006e; Lems et al.,2010). Thus, a factor of 0.25 multiplied by the amount of fixedcarbon (glucose) could be used to estimate the exergy loss,
resulting in 712 kJ lost. Because the latter gives the most con-servative exergy loss, it is used herein.
4.2.4. Plant metabolismWhen analyzing the overall plant, plant metabolism is the most
difficult to quantify. The exergy consumed by plant metabolism ishigher for older plants which must maintain aged cellular compo-nents – during reproductive seasons as the plant diverts resourcesto producing seeds, and during the winter as less sunlight isavailable to provide exergy. The amount of exergy consumed isalso highly dependent on the plant type (or other autotrophicorganism) and the pressures associated with the surroundingenvironment (pests, poisons, photo-inhibition, etc.). For thesereasons, the effects of metabolism must be measured experimen-tally on a case-by-case basis to meaningfully affect its exergyefficiency. However, two studies (Bassham and Buchanan, 1982;Bisio and Bisio, 1998) estimate one-third of fixed carbon (glucose)as the “price” for metabolism. The more precise value of 0.375 isused herein (Bisio and Bisio, 1998), which is equivalent to 1068 kJexergy loss per mole of glucose generated.
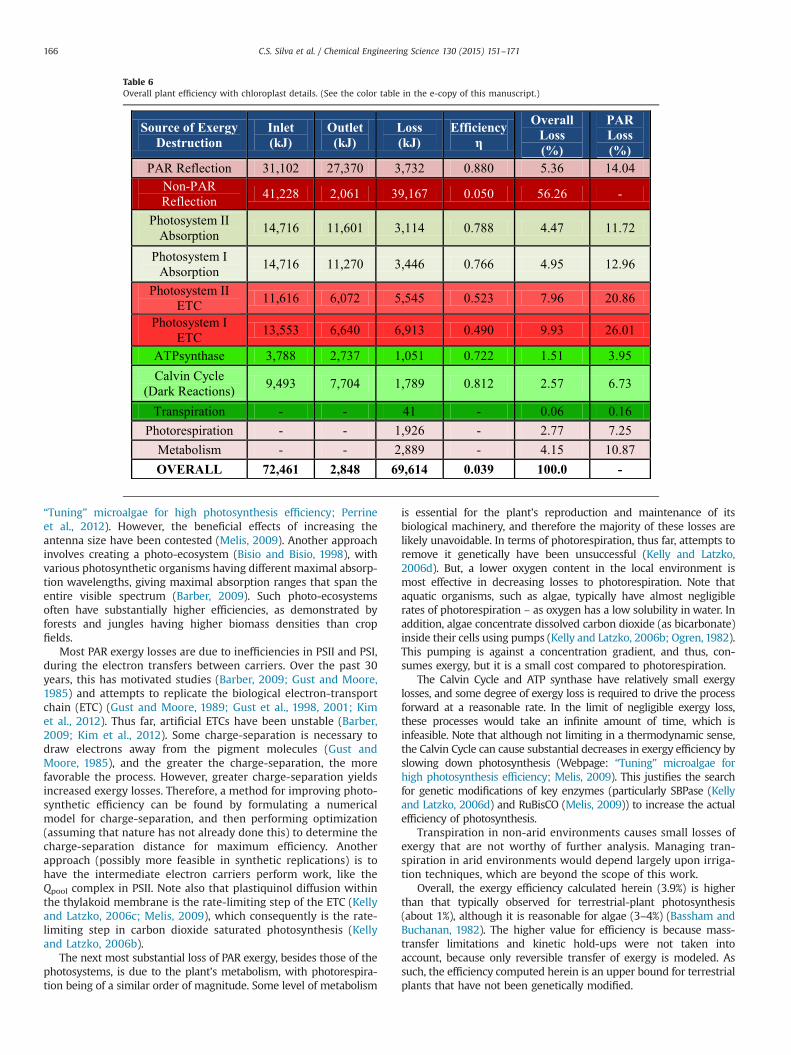
4.2.5. Overall plant efficiencyThe results of the previous subsections are tabulated as Table 5,
yielding an overall plant efficiency of 3.9%, in good agreement withPetela (2008). The vast majority of the losses (greater than 87%)occur within the chloroplast (Section 4.1.5), which explains thedisproportionate emphasis on the internal workings of the chlor-oplast herein. Table 6 is a combination of Table 4 (Section 4.1.5)and Table 5, showing the exergy losses for every step in photo-synthesis. Note that “PAR Reflection” represents the leaf reflection(Section 4.2.1) and “Non-PAR Reflection” represents the rejectionof non-PAR light by the chlorophyll pigments.
Clearly, the largest loss is due to the reflectance of non-PARradiation. The second largest PAR loss (third largest loss total) is dueto the degradation of photons relating to the maximal absorptionwavelength of each chlorophyll pigment (P700 and P680). Toimprove the efficiency of photon absorption, one option is to tunethe chlorophyll light-gathering antennas (Webpage: “Tuning”microalgae for high photosynthesis efficiency; Barber, 2009; Gustand Moore, 1985; Gust et al., 2001; Kelly and Latzko, 2006c; Perrineet al., 2012), which are usually composed of carotenoids that absorblight in regions of the solar spectrum where chlorophyll is ineffec-tive. In one approach, genetic modification of the antennas aresought to harness more light to be transferred to the chlorophyllpigment, where it enters the electron transport chain (Gust andMoore, 1985). Note that genetic modifications have been reportedthat boost the size and effectiveness of algae antennas (Webpage:
Table 5Overall Plant efficiency. (See the color figure in the e-copy of this manuscript.)
C.S. Silva et al. / Chemical Engineering Science 130 (2015) 151–171 165
“Tuning” microalgae for high photosynthesis efficiency; Perrineet al., 2012). However, the beneficial effects of increasing theantenna size have been contested (Melis, 2009). Another approachinvolves creating a photo-ecosystem (Bisio and Bisio, 1998), withvarious photosynthetic organisms having different maximal absorp-tion wavelengths, giving maximal absorption ranges that span theentire visible spectrum (Barber, 2009). Such photo-ecosystemsoften have substantially higher efficiencies, as demonstrated byforests and jungles having higher biomass densities than cropfields.
Most PAR exergy losses are due to inefficiencies in PSII and PSI,during the electron transfers between carriers. Over the past 30years, this has motivated studies (Barber, 2009; Gust and Moore,1985) and attempts to replicate the biological electron-transportchain (ETC) (Gust and Moore, 1989; Gust et al., 1998, 2001; Kimet al., 2012). Thus far, artificial ETCs have been unstable (Barber,2009; Kim et al., 2012). Some charge-separation is necessary todraw electrons away from the pigment molecules (Gust andMoore, 1985), and the greater the charge-separation, the morefavorable the process. However, greater charge-separation yieldsincreased exergy losses. Therefore, a method for improving photo-synthetic efficiency can be found by formulating a numericalmodel for charge-separation, and then performing optimization(assuming that nature has not already done this) to determine thecharge-separation distance for maximum efficiency. Anotherapproach (possibly more feasible in synthetic replications) is tohave the intermediate electron carriers perform work, like theQpool complex in PSII. Note also that plastiquinol diffusion withinthe thylakoid membrane is the rate-limiting step of the ETC (Kellyand Latzko, 2006c; Melis, 2009), which consequently is the rate-limiting step in carbon dioxide saturated photosynthesis (Kellyand Latzko, 2006b).
The next most substantial loss of PAR exergy, besides those of thephotosystems, is due to the plant’s metabolism, with photorespira-tion being of a similar order of magnitude. Some level of metabolism
is essential for the plant’s reproduction and maintenance of itsbiological machinery, and therefore the majority of these losses arelikely unavoidable. In terms of photorespiration, thus far, attempts toremove it genetically have been unsuccessful (Kelly and Latzko,2006d). But, a lower oxygen content in the local environment ismost effective in decreasing losses to photorespiration. Note thataquatic organisms, such as algae, typically have almost negligiblerates of photorespiration – as oxygen has a low solubility in water. Inaddition, algae concentrate dissolved carbon dioxide (as bicarbonate)inside their cells using pumps (Kelly and Latzko, 2006b; Ogren, 1982).This pumping is against a concentration gradient, and thus, con-sumes exergy, but it is a small cost compared to photorespiration.
The Calvin Cycle and ATP synthase have relatively small exergylosses, and some degree of exergy loss is required to drive the processforward at a reasonable rate. In the limit of negligible exergy loss,these processes would take an infinite amount of time, which isinfeasible. Note that although not limiting in a thermodynamic sense,the Calvin Cycle can cause substantial decreases in exergy efficiency byslowing down photosynthesis (Webpage: “Tuning” microalgae forhigh photosynthesis efficiency; Melis, 2009). This justifies the searchfor genetic modifications of key enzymes (particularly SBPase (Kellyand Latzko, 2006d) and RuBisCO (Melis, 2009)) to increase the actualefficiency of photosynthesis.
Transpiration in non-arid environments causes small losses ofexergy that are not worthy of further analysis. Managing tran-spiration in arid environments would depend largely upon irriga-tion techniques, which are beyond the scope of this work.
Overall, the exergy efficiency calculated herein (3.9%) is higherthan that typically observed for terrestrial-plant photosynthesis(about 1%), although it is reasonable for algae (3–4%) (Bassham andBuchanan, 1982). The higher value for efficiency is because mass-transfer limitations and kinetic hold-ups were not taken intoaccount, because only reversible transfer of exergy is modeled. Assuch, the efficiency computed herein is an upper bound for terrestrialplants that have not been genetically modified.
Table 6Overall plant efficiency with chloroplast details. (See the color table in the e-copy of this manuscript.)
C.S. Silva et al. / Chemical Engineering Science 130 (2015) 151–171166

5. Error analysis and validation
All data used herein were taken from previous literaturesources. It is assumed that these data are accurate. No standarddeviations were reported; thus, it was impossible to analyze theerrors originating from measurement inaccuracies. The compar-isons discussed in this section are calculated using Eq. (29) andtabulated in Table 7.
Maximum percent difference¼ LV�SVj jLVj j ð29Þ
where SV is the “standard value” (used herein) and LV is theliterature value that is the largest deviation from SV.
Different PAR radiation percentages are reported (Bassham andBuchanan, 1982; Bisio and Bisio, 1998). The true value depends onlocation, time of day, time of year, and weather conditions.However, all sources report absorption fractions between 0.40and 0.50; many agreeing on roughly 0.43.
With regard to the assumption that the excited and ground-state compounds are present in roughly equal concentrations, theappendix in Lems et al. (2010) provides a thorough calculation ofthe ratio of [P700]/[P700þ], which equals 11. This yields an exergychange proportional to ln([P700]/[P700þ])¼2.4. Because theexergies of the other carriers (e.g., NADPH) are on the order of200 kJ, differences of only one percent are anticipated. However,the redox potentials in Tables 1 and 2 (Nicholls and Ferguson,2002; Voet et al., 2008; Walz, 1997a, b, c), when compared withthe incoming exergy of the photons using Eq. (12), differ byapproximately nine percent for PSII and seven percent for PSI.When the factor, (1�Tearth/Tsun), is neglected, these differences arereduced to 4.2 and 1.6 percent. These differences are attributed tothe crude calculation of activities in Eq. (17). More accurateconcentration information would improve these estimates.
Comparing the exergy value of NADPH computed in Table 2(2468 kJ) with that of Lems et al. (2010) (2541 kJ), yields approxi-mately a 3% difference. Similarly, for the exergy transferred to the PMFfrom PSII, the values are 1508 kJ and 1444 kJ, yielding a 4.4%difference. In this work, the exergy change of ATP hydrolysis (R4) is58 kJ, in contrast with the commonly accepted 50–51 kJ (13.7 percentdifference). The 58 kJ value is in good agreement with Lems et al.
(2007) (the source of Eq. (18)), despite neglecting the acidic and ionicdissociation effects. Clearly, the exergy calculation method needsfurther attention. Note that this causes a decrease in Calvin Cycleefficiency (81 percent compared with 85 percent in Lems et al. (2010),and 83 percent in Bassham and Buchanan (1982)). The ATP synthaseefficiency is lower here when compared with Lems et al. (2010) (72percent compared with 82 percent in Lems et al. (2010)), because theyassume that an ATP molecule is generated for every three protonsmoved from the lumen to the stroma; however, most sources reportthat it takes four protons to generate an ATP molecule in thechloroplast (Voet et al., 2008; Zhu et al., 2008).
The overall efficiency of the light reactions, 32 percent herein,is in exact agreement with Bassham and Buchanan (1982). Lemset al. (2010) predict 47 percent, but they do not account for theimperfect absorption of the average photon. When the photonabsorption efficiencies of both PSII and PSI are set to unity, theefficiency herein rises to 41 percent (again, their assumption of3 protons per ATP leads to an artificially inflated efficiency).
Exergy loss due to water evaporation (transpiration) is notexamined in most studies, although the equations are fairlystandard (Szargut, 2005). The results of Reis and Miguel (2006)are most relevant, although their model is based upon fluxesthroughout a 24-hr cycle. Their result is an order of magnitudesmaller than 21 kJ reported herein. However, both are negligiblecompared to the losses in the other bioprocesses analyzed.Regarding photo-respiration, no rigorous modeling has been done.The estimates of exergy destruction are based upon two otherstudies (Bolton and Hall, 1991; Lems et al., 2010).
Finally, the overall exergy efficiency is comparable to flux-basedstudies (Petela, 2008; Reis and Miguel, 2006), even though it does notaccount for irreversible processes and fluxes (like carbon dioxidediffusion and ETC bottlenecks), which would need to be analyzedusing irreversible thermodynamics (Kjelstrup et al., 2010; Sliepcevichand Finn, 1963). This implies that diffusive fluxes have a small impacton the overall thermodynamic efficiency (even though they may havea substantial impact on the real/observed efficiency). Non-flux basedstudies report higher efficiencies (Bassham and Buchanan, 1982;Bolton and Hall, 1991; Bugbee and Monje, 1992), because they donot account for photo-degradation, incomplete PAR absorption (Petela,2008), photorespiration, or transpiration. However, when the PAR
Table 7Error analysis table.
Point of comparison Source of comparison Maximum percent difference
PAR reflection Bisio and Bisio (1998) 18.6PAR reflection Bassham and Buchanan (1982) 5.4Average photon exergy Zhu et al. (2008) 8.9Loss to reflection and re-transmittance Bisio and Bisio (1998) 2.9Excitation of P680 Nicholls and Ferguson (2002) and Walz (1997a, b, c) 9.0Excitation of P700 Nicholls and Ferguson (2002) and Walz (1997a, b, c) 7.0Redox potential of ETC (per step) Lems et al. (2010) 1.0Exergy of NADPH Lems et al. (2010) 3.0PMF exergy Lems et al. (2010) 4.4ATP hydrolysis Lems et al. (2010) 12.0Overall light reaction efficiency Bassham and Buchanan (1982) 0.0Overall light reaction efficiency Lems et al. (2010) 32.0a
ATP synthase efficiency Lems et al. (2010) 17.1Calvin cycle efficiency Bassham and Buchanan (1982) and Lems et al. (2010) 2.4Calvin cycle efficiency Lems et al. (2010) 4.7Transpiration Reis and Miguel (2006) 900.0b
Photorespiration Bolton and Hall (1991) 50.0Photorespiration Lems et al. (2010) 25.0Photorespiration Kelly and Latzko (2006a) 57.2Overall photosynthetic efficiency Bisio and Bisio (1998) 30.0Overall photosynthetic efficiency Bassham and Buchanan (1982) 95.0
a Ref. Lems et al. (2010) neglected reflectance and imperfect light absorption. Adjusting for this herein yields a difference of 4.3%.b Transpiration was calculated differently in the two studies. Even though the values were dissimilar, transpiration had a marginal effect on the overall efficiency.
C.S. Silva et al. / Chemical Engineering Science 130 (2015) 151–171 167

absorption factor and absorption efficiency factors are set to unity, andlosses due to transpiration and photorespiration are eliminated, theoverall efficiency rises to 14 percent, in nearly perfect agreement withChain and Arnon (1977), Bugbee and Monje (1992), and Bolton andHall (1991).
6. Conclusions
Photosynthesis produces 100 billion tons of dry biomassannually, which is equivalent to a hundred times the weight ofthe human population (Barber, 2009). The biomass created onearth every second amounts to approximately 37 TJ (Szargut,2005). In contrast, humans use only 13 TJ per second, whichmeans that biomass theoretically has the potential to satisfy allhuman needs. To be realizable, however, the photosyntheticefficiency would need to be increased substantially. Almost allexergy in biomass originates as the sun’s electromagnetic radia-tion before being converted into chemical exergy by photosyn-thetic organisms. Therefore, it is crucial that the mechanism andefficiencies of photosynthesis are well understood.
Prior to the analysis herein, a literature search over the last 53years was performed, uncovering a broad array of approaches,definitions, and efficiencies. Overall, theoretical efficiencydecreased with increasing knowledge of the process, decreasingfrom 37 percent (Asimov, 1968) to 2.61 percent (Petela, 2008). Themajor factors in the comprehensive analysis herein present a morethorough picture of the process and its inefficiencies.
In this study, photosynthesis is decomposed into processes thatoccur within the chloroplast (PAR Reflection, Non-PAR reflection,PSII Absorption, PSI Absorption, PSII ETC, PSI ETC, ATP synthase,and Calvin Cycle) and those that affect the organism as a whole(Leaf PAR Reflection, Transpiration, Photorespiration, and PlantMetabolism). The exergy changes associated with each sub-stepare calculated and summed to determine the exergy efficiency ofeach step. These steps, in turn, are combined to yield an overallphotosynthetic efficiency of 12.2% for the chloroplast and 3.9 per-cent for the organism as a whole.
Overall, the loss of most non-PAR radiation and the reflectanceof PAR radiation account for the majority of the exergy loss (64.35percent). Thus, it is crucial that work continue to tune thephotosynthetic antennas (Webpage: “Tuning” microalgae forhigh photosynthesis efficiency; Melis, 2009; Perrine et al., 2012).Perhaps coupling a photosynthetic system with a photovoltaicsystem will prove beneficial if the photovoltaic could absorb thenon-PAR radiation without the PAR radiation. Similarly, usingdifferent species of photosynthetic organisms (each of whichabsorbs different wavelengths) and building a photo-ecosystem(Barber, 2009; Bisio and Bisio, 1998; Scholes et al., 2012) couldsignificantly decrease the effect of photo-degradation.
Using a controlled environment also boosts the efficiency ofphotosynthesis by increasing access to nutrients (water, carbondioxide) and decreasing access to oxygen, which causes photorespira-tion. This is a key reason algae are promising (Sukenik et al., 1991) andhave higher efficiencies (in addition to their bicarbonate pumps).
With regard to the ETC, the losses are substantial, and theattempts to improve the efficiency of this process have beenmostly unsuccessful. More attention should be given to thisprocess in future studies and research work. It is generally agreedthat exergy losses to ATP synthase and the Calvin Cycle arerelatively low and likely to be unavoidable. Therefore, futureefforts to analyze and improve photosynthesis should focusprimarily upon absorbance and the ETC.
Lastly, the major limitation herein is that losses to kinetic bottle-necks are not taken into account. For example, photosynthetic
efficiencies in microalgae cultures are two to three times lower thantheir theoretical potential due to differences in the fast rate of lightcapture and the much slower downstream process of photosyntheticelectron transfer and carbon fixation (Webpage: “Tuning” microalgaefor high photosynthesis efficiency; Melis, 2009). This study excludessuch factors because of its focus on reversible exergy transfer, whichprovides an upper bound. However, irreversible effects should not beignored by those seeking to optimize the output of photosyntheticorganisms.
Nomenclature
Variable, quantity, units
B Exergy, JW Work, JQ Heat, JT Temperature, KNA Avagadro’s Number, molecules/molh Planck’s constant, J sc speed of light, m/sλ wavelength, nma lower bounding constant, dimensionlessb upper bounding constant, dimensionlessf(x) a function, dimensionlessf(c) average value of function f(x), dimensionlessG Gibbs free energy, JF Faraday’s constant, C/moln number of moles, molε redox potential, V[A] chemical activity, dimensionlessν stoichiometric coefficient, molR ideal gas constant, J/mol-KK equilibrium constant, varies[Hþ] concentration of protons, mol/L[M] concentration of a metal ion, mol/LH enthalpy, J/molS entropy, J/mol-KMw molecular weight, g/molg gravity constant, m/s2
z height, mΦ relative humidity, dimensionlessWC water lost to evaporation, moles of waterr ratio of water to glucose in R1, dimensionlessϕ fraction of water used in photosynthesis, dimensionlessη efficiency, dimensionless
Subscript
out leaving the systemin entering the systemprod productswaste wastesys internal to the systemres reservoir (Environment)o ambient/dead-stateH highphys physical (temperature and pressure)chem chemical (mixing and reactions)elec electricalphoton photon (sunlight)earth of the earthsun of the sunlow lower boundhigh upper bound
C.S. Silva et al. / Chemical Engineering Science 130 (2015) 151–171168

carriers refering to carriers in the ETCelement refers to chemical elementsf of formationi series counterj series counterk series counterl series counterGluc glucosew watersolar relating to incoming solar exergyuseful exergy used to do work or transferred to the next processTotal total incoming exergyPAR photo-active regionnon-PAR outside of the photo-active regionPSII photosystem IIPSI photosystem Iabs absorptionwater split involving the split of water in the light reactions into
protons and molecular oxygenQpool relating to the PSII complex that pumps protons against
their gradientto PSI sent to photosystem IIncoming Solar exergy entering the system from the sunNADPH NADPH formation reaction (R2þR3)from PSII Coming from photosystem IIATP Relating to the ATP hydrolysis reactionPMF proton-motive forceCC Calvin cycle
Greek letter
Δ changeδ destruction
Superscript
o standard and dead state for exergy
Acknowledgments
Financial support from the U.S. Department of Energy , USA forthe project, Algal Biofuels (Contract DE-EE0003046), awarded to theNational Alliance for Biofuels and Bioproducts (NAABB), is acknowl-edged gratefully. Assistance from Antonio Barberio, at the Universityof Pennsylvania, in formulating a quantitative model of the electron-transport chain is also gratefully appreciated.
Appendix A. Biochemical reference data
In this appendix, the thermophysical properties required toestimate the exergies of the species in the Calvin Cycle reactions(Sections 3.1.4 and 4.1.4) are discussed and tabulated in Table A1.The species are numbered in order of appearance in the CalvinCycle reactions. Also, each molecule is abbreviated using thenotation in Table 3. Note the chemical formula is that used herein;it may not represent the actual chemical formula; e.g., for NADPH/NADPþ and ATP/ADP. For these pairs, an “equivalent” formula isused (Lems et al., 2007) because the excluded atoms are sharedbetween the pairs (NADPH/NADPþ and ATP/ADP) and everyreaction containing ATP has ADP on the other side, and similarlywith NADPH/NADPþ .
Belement is the exergy of the elements, as defined by Szargut(2005) and described more thoroughly in Table A2; ΔGf is thestandard Gibbs free energy of formation for each compound, as
Table A1Calvin cycle – detailed values.
Number Molecule Name Formula Belements
(kJ/mol)ΔGf (kJ/mol) [A] RnTonLn([A]) (kJ/mol) Btotal (kJ/mol)
1 Ru5P Ribulose 5-phosphate C5H11O8P 4227.1 �1651.1 0.000012 �28.08753085 2547.852 ATP Adenosine triphosphate P3O9H4 3074.2 �2672.1 0.0018432 �15.6078331 386.543 RuBP Ribulose 1,5-bisphosphate C5H12O11P2 5212.5 �2551.5 0.00204 �15.35635622 2645.624 ADP Adenosine diphosphate P2O6H3 2088.8 �1794.5 0.00013924 �22.01100114 272.335 CO2 Carbon dioxide CO2 414.2 �394.4 – – 19.406 H2O Water (liquid) H2O 238.1 �237.2 – – 2.547 PGA 3-Phosphoglycerate C3H7O7P 2932.4 �1609.2 0.0014 �16.28960969 1306.938 NADPH Nicotinamide adenine dinucleotide phosphate (reduced) H:-þHþ 236.1 �17.1 0.001 �17.12369359 206.019 GAl3P Glyceraldehyde 3-phosphate C3H7O6P 2930.4 �1339.1 0.000032 �25.65614483 1565.6610 NADPþ Nicotinamide adenine dinucleotide phosphate (oxidized) – – 0.0 0.001 �17.12369359 0.0011 H3PO4 Phosphoric acid H3PO4 1223.5 �1147.6 0.001 �17.12369359 58.7612 DHAP Dihydroxyacetone phosphate C3H7O6P 2930.4 �1346.7 0.00064 �18.2299985 1565.4713 FBP Fructose 1,6-bisphosphate C6H14O12P2 5860.8 �2707.8 0.000097 �22.90709704 3130.1414 F6P Fructose 6-phosphate C6H13O9P 4875.4 �1811.8 0.00053 �18.69749876 3044.9515 E4P Eryhtrose 4-phosphate C4H9O7P 3578.7 �1492.6 0.00002 �26.82124084 2059.3616 Xu5P Xylulose 5-phosphate C5H11O8P 4227.1 �1652.1 0.000021 �26.70029449 2548.2417 SBP Sedoheptulose 1,7-bisphosphate C7H16O13P2 6509.1 �2862.8 0.000114 �22.50678437 3623.8118 S7P Sedoheptulose 7-phosphate C7H15O10P 5523.7 �1966.8 0.000248 �20.58010154 3536.3519 R5P Ribose 5-phosphate C5H11O8P 4227.1 �1653.4 0.000034 �25.50586194 2548.1720 G6P Glucose 6-phosphate C6H13O9P 4875.4 �1813.9 0.00073 �17.90383274 3043.6621 Glucose Glucose C6H12O6 3890.0 �917.2 0.001 �17.12369359 2955.67n Oxygen Oxygen O2 3.97 0 – – 3.97n Hydrogen Hydrogen H2 – – – – 236.09
Table A2Elemental exergies.
Element Ref.species
Standard chemicalexergy (species) (kJ)
Standard chemical exergy(element) (kJ/mol)
C (s,gr) CO2(g) 19.87 410.26H (H2(g)) H2O (g) 9.49 236.09O (O2(g)) O2(g) 3.97 3.97P (s,w) HPO4
�2 – 861.4
C.S. Silva et al. / Chemical Engineering Science 130 (2015) 151–171 169

described in the literature (Bassham and Krause, 1969; Krebs andKornberg, 1957); it should be noted that the value for phosphoricacid (which was missing from Bassham and Krause (1969)) istaken from Lems et al. (2007); [A] is the activity of the species,taken from the literature (Bassham and Krause, 1969); RT Ln([A]) isthe exergy change due to mixing; and Btotal is the exergy of themolecule, calculated using Eq. (18). The exergy changes andstandard Gibbs free energy changes for important reactions (notin the Calvin Cycle) are shown in Table A3.
Note that in Table A1, NADPH and NADPþ are assumed to bepresent in the concentration ratio, 1:1. Also, NADPþ is assumed to bethe ground state, and therefore, its exergy is zero. The values for theconcentrations of ATP and ADP presented by Lems et al. (2007) do notagree with those presented by Bassham and Krause (1969). The formerare more recent and are used herein. Different concentration valuesare tabulated for both glucose and glucose-6-phosphate, all of whichare within an order of magnitude, resulting in differences of less than1% in the overall Calvin Cycle calculations. Finally, as mentioned inSection 4.1.4, the exergies for CO2 and O2 are calculated using Eq. (2.9)in Szargut’s book (Szargut, 2005).
Appendix B. Glossary
1. ATP synthase – a giant protein complex that uses the exergystored in proton gradients to drive ATP synthesis, as seen inreaction R4.
2. Autotroph – an organism that uses radiant or inorganicsources of exergy to produce cellular components, sugars,and high exergy carrier molecules (like ATP). Plants and algaeare two examples of autotrophs.
3. C4 Cycle – a carbon fixation pathway, which lowers RuBisCO’stendency to fix oxygen and begin photorespiration. It is namedfor the 4-carbon molecule (oxaloacetate) which results fromthe first step of carbon fixation, in contrast to the 3-carbonmolecule (3-phosphoglycerate) that is produced by C3 (nor-mal) plants.
4. Chlorin – a large aromatic ring composed of carbon, nitrogen,and hydrogen. It is the central group of a chlorophyll molecule,having a magnesium atom at its center. The aromatic behaviorallows for easy excitation of the shared electrons by sunlight.
5. Chlorophyll – pigment molecules present within chloroplaststhat are responsible for capturing sunlight and converting it toelectrical energy (high-energy electrons).
6. Chloroplast – the organelle that captures sunlight, using it toconvert carbon dioxide and water to organic matter (biomass)(see Fig. 1b).
7. Crassulacean acid metabolism (CAM) – a carbon fixationpathway that reduces water loss in arid conditions. CAMplants keep their pores open at night to collect CO2 – which
is fixed into malate (a 4-carbon molecule) – and closedduring the day (the opposite of normal, or C3, plants) toreduce transpiration. The malate is concentrated aroundthe enzyme RuBisCO in the cells, essentially eliminatingphotorespiration.
8. Cyclic-photophosphorylation – the process by which electronsare excited by PSI and passed backward to the cytochrome b6fcomplex (top red node in Fig. 3), driving protons against theirgradient. The electrons are then returned to PSI by plastoqui-nol, and the protons are used by ATP synthase to produce ATPby reaction R4.
9. Electron transport chain (ETC) – a series of functional groupsthat capture solar exergy, as high energy electrons, andchannel these electrons through a series of carriers thatincrease their charge separation from the original nucleus,thus making them available for other purposes.
10. Metabolism – the physical and chemical processes in anorganism that produce and maintain its components as wellas those processes that absorb radiant exergy or degradesubstances to provide exergy.
11. Organelle – enclosed portion of the cellular medium (cyto-plasm) with a designated function (see Fig. 1).
12. P680 – a chlorophyll pigment molecule, most commonlyassociated with Photosystem II, that has maximal absorptionof sunlight with a wavelength of 680 nm.
13. P700 – a chlorophyll pigment molecule, most commonlyassociated with Photosystem I, that has maximal absorptionof sunlight with a wavelength of 700 nm.
14. Photo-inhibition – the overexposure of chlorophyll to sunlight,which damages these pigments through oxidation.
15. Photon – a quantum of electromagnetic radiation that has zeromass and charge, and a spin of one.
16. Photosystem I (PSI) – a protein complex that captures sunlight,using it to excite electrons to a higher energy state andeventually produce NADPH from NADPþ , Hþ , and two excitedelectrons. It is composed of a chlorophyll pigment molecule(typically P700) and electron transporter molecules, which areshown in Fig. 3.
17. Photosystem II (PSII) – a protein complex that captures sun-light, using it to drive protons against their gradient and splitwater – releasing protons, molecular oxygen, and electrons(which are excited to a higher energy state). It is composed ofa chlorophyll pigment molecule (typically P680) and electrontransporter molecules, which are shown in Fig. 3.
18. Plastiquinol (PQ) – the reduced form of plastoquinone. It is thelast carrier molecule in the Photosystem II electron-transportchain, bringing the electrons from Photosystem II toPhotosystem I.
19. Proton-motive force – the exergy stored in the proton gradientbetween the inside of the thylakoid (high concentration) andthe chloroplast fluid (low concentration).
20. Redox potential, ε (V) – a measure of the affinity for a chemicalspecies to acquire electrons, thereby becoming reduced. Mov-ing from a smaller redox potential to a larger redox potential isa process that occurs naturally, requiring no input of exergy.
21. Relative absorption – the amount of solar exergy (photons)that can be absorbed and converted to chemical or electricalexergy by chlorophyll pigments.
22. Respiration – the process by which cells decompose glucose toenergy-carrier molecules like ATP, or necessary intermediatesused to produce cellular components.
23. RuBisCO – official name: ribulose-1,5-bisphosphate carboxy-lase/oxygenase, is an enzyme which catalyzes carbon (CO2)fixation in the Calvin Cycle. It can also catalyze the reaction ofoxygen with 1,5-bisphosphate, which is the first step inphotorespiration.
Table A3Exergy and standard Gibbs free energy changes for important reactions.
rxn1:(NADPH)þ1/2O2-(NADPþ)þH2OΔGo¼�220.05 kJ/molΔB¼205.45 kJ/mol
rxn2: (ATP)þH2O-(ADP)þH3PO4
ΔGo¼�32.8 kJ/molΔB¼58.0 kJ/mol
rxn3: C6H12O6þ6O2-6H2Oþ6CO2
ΔGo¼�2872.23 kJ/molΔB¼2847.83 kJ/mol
rxn4: C6H12O6þ6(ATP)þ6O2-6CO2þ6(ADP)þ6H3PO4
ΔGo¼�3069.03 kJ/molΔB¼3195.75 kJ/mol
C.S. Silva et al. / Chemical Engineering Science 130 (2015) 151–171170

24. Transpiration – the loss of the plant’s water reserves throughpores in the leaves (known as stomata).
Appendix C. Supporting information
The spreadsheets containing these tables, as well as the othersused in the calculations, are available as a Supplement to this paper.Supplementary data associated with this article can be found in theonline version at http://dx.doi.org/10.1016/j.ces.2015.02.011.
References
ATP synthase, Image Credit: NDSU VCell Animation Project. ⟨http://vcell.ndsu.nodak.edu/animations/etc/atpsynthase.htm⟩ (accessed 27.01.14).
Chloroplast Diagram. ⟨https://upload.wikimedia.org/wikipedia/commons/thumb/c/c5/Chloroplast_%28borderless_version%29-en.svg/701px-Chloroplast_%28borderless_version%29-en.svg.png⟩ (accessed 03.04.14).
Introduction to ozone, ⟨http://www.ucar.edu/learn/1_5_1.htm ⟩ with permissionfrom the COMET Program. (accessed 27.01.14).
Mean value theorem, ⟨https://en.wikipedia.org/wiki/Mean_value_theorem⟩, (accessed27.01.14).
Photorespiration wikicommons, ⟨https://commons.wikimedia.org/wiki/File:Photorespiration_de.svg⟩ (accessed 29.01.14).
Plant cell diagram. ⟨http://media-1.web.britannica.com/eb-media/04/114904-004-29F75B95.jpg⟩ (accessed 28.07.14).
“Tuning” microalgae for high photosynthesis efficiency. ⟨http://www.lanl.gov/newsroom/news-stories/2013/March/microalgae-for-high-photosynthesis-efficiency.ph⟩ (accessed 06.02.14).
Solar Radiation & Photosynthetically Active Radiation. ⟨http://www.fondriest.com/environmental-measurements/parameters/weather/photosynthetically-active-radiation⟩ (accessed 13.03.15).
Albarran-Zavala, E., Angulo-Brown, F., 2007. A simple thermodynamic analysis ofphotosynthesis. Entropy 9, 152–168.
Asimov, I., 1968. Photosynthesis. Basic Books Inc, London.Barber, J., 2009. Photosynthetic energy conversion: natural and artificial. Chem. Soc.
Rev. 38, 185–196.Bassham, J.A., Buchanan, B.B., 1982. Photosynthesis. Academic Press, New York, NY.Bassham, J.A., Krause, G.H., 1969. Free energy changes and metabolic regulation in
steady-state photosynthetic carbon reduction. Biochim. Biophys. Acta 189,207–221.
Berry, J.A., Downton, W.J.S., 1982. Photosynthesis. Academic Press, New York, NY.Bisio, G., Bisio, A., 1998. Some thermodynamic remarks on photosynthetic energy
conversion. Energy Convers. Manage 39, 741–748.Biswas, B., Kazakoff, S.H., Jiang, Q., Samuel, S., Gresshoff, P.M., Scott, P.T., 2013.
Genetic and genomic analysis of the tree legume Pongamia pinnata as afeedstock for biofuels. Plant Genome 6, 1–15.
Bolton, J.R., Hall, D.O., 1991. The maximum efficiency of photosynthesis. Photo-chem. Photobiol. 53, 545–548.
Bugbee, B., Monje, O., 1992. The limits of crop productivity: theory and validation.BioScience 42, 494–502.
Chain, R.K., Arnon, D.I., 1977. Quantum efficiency of photosynthetic energyconversion. Proc. Natl. Acad. Sci. USA 74, 3377–3381.
Dunlop, E.H., Coaldrake, A.K., Silva, C.S., Seider, W.D., 2013. An energy-limitedmodel of algal biofuel production: towards the next generation of advancedbiofuels. AIChE J. 59, 4641–4654.
Gratzel, M., 2001. Molecular photovoltaics that mimic photosynthesis. Pure Appl.Chem. 73, 459–467.
Gust, D., Moore, T.A., 1985. A synthetic system mimicking the energy transfer andcharge separation of natural photosynthesis. J. Photochem. 29, 173–184.
Gust, D., Moore, T.A., 1989. Mimicking photosynthesis. Science 244, 35–41.Gust, D., Moore, T.A., Moore, A.L., 1998. Mimicking bacterial photosynthesis. Pure
Appl. Chem. 70, 2189–2200.Gust, D., Moore, T.A., Moore, A.L., 2001. Mimicking photosynthetic solar energy
transduction. Acc. Chem. Res., 34.Keenan, J.H., 1951. Availability and irreversibility in thermodynamics. Br. J. Appl.
Phys. 2, 183–192.
Kelly, G.J., Latzko, E., 2006a. Thirty years of photosynthesis,1974–2004. In: Kelly, G.J.,Latzko, E. (Eds.), Control of Carbon Metabolism Through Enzyme Regulation andMembrane-Mediated Metabolite Transport. Springer, Berlin.
Kelly, G.J., Latzko, E., 2006b. Thirty years of photosynthesis, 1974–2004. In: Kelly, G.J.,Latzko, E. (Eds.), Carbon Metabolism: On Land and at Sea. Springer, Berlin.
Kelly, G.J., Latzko, E., 2006c. Thirty years of photosynthesis, 1974–2004. In: Kelly, G.J.,Latzko, E. (Eds.), Carbon Metabolism: The Chloroplast’s Sesquicentenary, and SomeThoughts on the Limits to Plant Productivity. Springer, Berlin.
Kelly, G.J., Latzko, E., 2006d. Thirty years of photosynthesis, 1974–2004. In: Kelly, G.J.,Latzko, E. (Eds.), Carbon Metabolism: Quantification and Manipulation. Springer,Berlin.
Kelly, G.J., Latzko, E., 2006e. Thirty years of photosynthesis, 1974–2004. In: Kelly, G.J.,Latzko, E. (Eds.), Carbon Metabolism: The Calvin Cycle’s Golden Jubilee. Springer,Berlin.
Kim, J.H., Lee, M., Lee, J.S., Park, C.B., 2012. Self-assembled light-harvesting peptidenanotubes for mimicking natural photosynthesis. Angew. Chem. Int. Ed. 51,517–520.
Kjelstrup, S., Bedeaux, D., Johannessen, E., Gross, J., 2010. Non-Equilibrium Thermo-dynamics for Engineers. World Scientific, Hackensack, NJ, USA.
Kluge, M., 1982. Photosynthesis. Academic Press.Krebs, H.A., Kornberg, H.L., 1957. Energy Transformations in Living Matter, a Survey.
Springer-Verlag, Berlin, Gottingen, Heidelberg.Lehninger, A.L., 1971. Bioenergetics, 2nd ed W. A. Benjamin Inc., Menlo Park,
California.Lems, S., Van Der Kooi, H.J., De Swaan Arons, J., 2007. Thermodynamic analysis of
the living cell: design of an exergy-based method. Int. J. Exergy 4, 339–356.Lems, S., Van Der Kooi, H.J., De Swaan Arons, J., 2010. Exergy analyses of the
biochemical processes of photosynthesis. Int. J. Exergy 7, 333–351.Lior, N., Zhang, N., 2007. Energy, exergy, and second law performance criteria.
Energy 32 (4), 281–296.Luo, Y., Lee, J.K., Zhao, H., 2013. Challenges and opportunities in synthetic biology
for chemical engineers. Chem. Eng. Sci. 103, 115–119.Melis, A., 2009. Solar energy conversion efficiencies in photosynthesis: minimizing
the chlorophyll antennae to maximize efficiency. Plant Sci. 177, 272–280.Nicholls, D.G., Ferguson, S.J., 2002. Bioenergetics, vol. 3. Academic Press, San Diego,
CA.Ogren, W.L., 1982. Photosynthesis. Academic Press, New York, NY.Perrine, Z., Negi, S., Sayre, R.T., 2012. Optimization of photosynthetic light energy
utilization by microalgae. Algal Res. 1, 134–142.Petela, R., 2008. An approach to the exergy analysis of photosynthesis. Sol. Energy
82, 311–328.Reis, H.A., Miguel, A.F., 2006. Analysis of the exergy balance of green leaves. Int. J.
Exergy 3, 231–237.Scholes, G.D., Mirkovic, T., Turner, D.B., Fassioli, F., Buchleitner, A., 2012. Solar light
harvesting by energy transfer: from ecology to coherence. Energy Environ. Sci.5, 9374–9393.
Reindl, K.M., White, A.R., Johnson, C., Vender, B., Slator, B.M., McClean, P., 2014. Thevirtual cell animation collection: tools for teaching molecular and cellularbiology. PLoS Biology, in press.
Silva, C.S., Soliman, E., Cameron, G., Fabiano, L.A., Seider, W.D., Dunlop, E.H.,Coaldrake, A.K., 2014. Commercial-scale biodiesel production from algae. Ind.Eng. Chem. Res. 53, 5311–5324.
Sliepcevich, C.M., Finn, D., 1963. A macroscopic approach to irreversible thermo-dynamics. Ind. Eng. Chem. Fundam. 2, 249.
Sukenik, A., Levy, R.S., Levy, Y., Falkowski, P.G., Dubinksy, Z., 1991. Optimizing algalbiomass production in an outdoor pond: a simulation model. J. Appl. Phycol. 3,191–201.
Szargut, J., 2005. Exergy Method, Technical, and Ecological Applications. WIT Press,Billerica, MA.
Thorndike, E.H., 1996. Energy and the Environment. Addison-Wesley, Reading, MA,USA.
Voet, D., Voet, J.G., Pratt, C.W., 2008. Fundamentals of Biochemistry, 3rd ed. JohnWiley & Sons Inc., Hoboken, NJ.
Walz, D., 1997a. Bioenergetics. In: Graber, P., Milazzo, G. (Eds.), Chloroplasts.Birkhauser; Basel, Boston, Berlin, Chapter 5.
Walz, D., 1997b. Bioenergetics. In: Graber, P., Milazzo, G. (Eds.), Photosystem II andWater Oxidation in Cyanobacteria, Algae, and Higher Plants. Birkhauser; Basel,Boston, Berlin, Chapter 7.
Walz, D., 1997c. Bioenergetics. In: Graber, P., Milazzo, G. (Eds.), The Photosystem IReaction Center in Oxygenic Photosynthesis. Birkhauser; Basel, Boston, Berlin,Chapter 8.
Zhu, X., Long, S.P., Ort, D.R., 2008. What is the maximum efficiency with whichphotosynthesis can convert solar energy to biomass? Curr. Opin. Biotech. 19,153–159.
C.S. Silva et al. / Chemical Engineering Science 130 (2015) 151–171 171