chemicals - ibef · pdf file7 evolution of the indian chemical industry source: ficci, make in...
TRANSCRIPT
11
CHEMICALS
AUGUST 2015 For updated information, please visit www.ibef.org

22For updated information, please visit www.ibef.org
Executive Summary……………….............. 3
Advantage India……………………............. 4
Market Overview and Trends……………….6
Porters Five Forces Analysis……….…….23
Growth Drivers…………………………..…. 25
Opportunities………………………….…… 34
Success Stories…………………………… 42
Useful Information…………………………..50
CHEMICALS
AUGUST 2015
33For updated information, please visit www.ibef.org
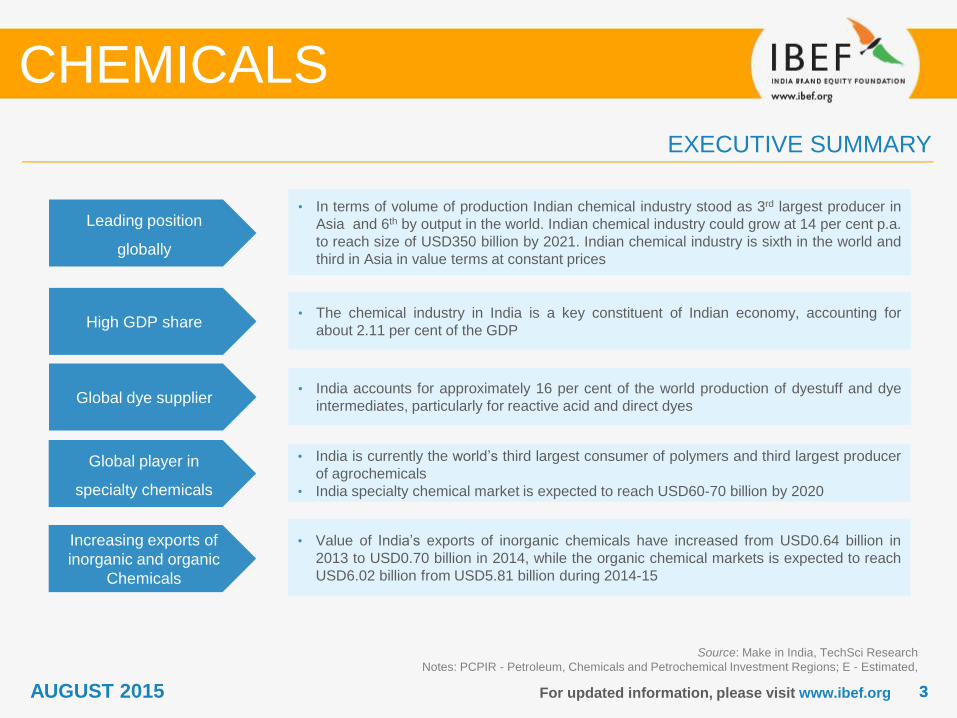
Leading position
globally
• In terms of volume of production Indian chemical industry stood as 3rd largest producer in
Asia and 6th by output in the world. Indian chemical industry could grow at 14 per cent p.a.
to reach size of USD350 billion by 2021. Indian chemical industry is sixth in the world and
third in Asia in value terms at constant prices
High GDP share• The chemical industry in India is a key constituent of Indian economy, accounting for
about 2.11 per cent of the GDP
Global dye supplier• India accounts for approximately 16 per cent of the world production of dyestuff and dye
intermediates, particularly for reactive acid and direct dyes
Source: Make in India, TechSci Research
Notes: PCPIR - Petroleum, Chemicals and Petrochemical Investment Regions; E - Estimated,
EXECUTIVE SUMMARY
CHEMICALS
Global player in
specialty chemicals
• India is currently the world’s third largest consumer of polymers and third largest producer
of agrochemicals
• India specialty chemical market is expected to reach USD60-70 billion by 2020
AUGUST 2015
Increasing exports of
inorganic and organic
Chemicals
• Value of India’s exports of inorganic chemicals have increased from USD0.64 billion in
2013 to USD0.70 billion in 2014, while the organic chemical markets is expected to reach
USD6.02 billion from USD5.81 billion during 2014-15

ADVANTAGE INDIA
CHEMICALS
AUGUST 2015

55
Growing demand
For updated information, please visit www.ibef.org
ADVANTAGE INDIA
Source: FICCI, Make in India, Department of Industrial Policy and Promotion (DIPP), TechSci Research
Notes: PCPIR - Petroleum, Chemicals and Petrochemical Investment Regions; E – Estimated
Robust demand
• A large population, dependence on agriculture, and strong export demand are the key growth drivers for the chemicals industry
• Per-capita consumption of chemicals in India is lower relative to Western peers and there exists a large latent demand
Attractive opportunities
• Polymers and agrochemicals industries in India present immense growth opportunities
• The size of India’s construction chemical market stood at USD597 million in 2013, which accounted for only 2 per cent of global demand, thereby representing ample growth opportunity
Policy support
• 100 per cent FDI is permissible in the Indian chemicals sector; manufacturing of most chemical products is de-licensed
• The government has been encouraging R&D in the sector
• Setting up of PCPIRs
• The Government of India has launched the Draft National Chemical Policy, which aims to increase India’s chemical sector in the GDP
Increasing
investments
• Lured by the size and returns of the Indian market, foreign firms have strengthened their presence in India
• From April 2000 to May 2015, total FDI inflows into the Indian chemicals industry (excluding fertilisers) were USD10.49 billion
2014
Market
size:
USD118
billion
2021E
Market
size:
USD235.12
billion
Advantage
India
CHEMICALS
AUGUST 2015

MARKET OVERVIEW AND TRENDS
CHEMICALS
AUGUST 2015

77
EVOLUTION OF THE INDIAN CHEMICAL INDUSTRY
Source: FICCI, Make in India, TechSci Research
Note: MNC – Multinational Corporation
CHEMICALS
• Chemical
products to
protect crops
• Agrochemicals,
dyes,
pharmaceuticals
• Public sector
companies were
set up to
develop the
petrochemical
industry
• Plastic and
fibres,
petrochemical
products
• Consolidation
started from
largely
fragmented firms
with small
capacities and
high cost
structures
• Paints, dyes,
pharmaceuticals
and detergents
• Alliances and
partnerships to achieve
scale
• Licensing requirements
removed except in the
case of hazardous
chemicals
• Increasing investments by
foreign players in India
through mergers &
acquisition and joint
ventures
• Allowed 100 per cent FDI
in the chemicals Industry
• To touch USD190 billion
by FY18
Basic needs
(1950-72)
Establishment
(1972-80)
Consolidation
(1980-92)
Liberalisation
(1992-95)
Expansion
(1995 onwards)
• Major investment
plans by both
Indian firms and
MNCs
• Lower tariff
barriers
• Diminishing role
of public sector
companies
• Petrochemicals,
engineering
plastic, specialty
fibres
AUGUST 2015 For updated information, please visit www.ibef.org

88For updated information, please visit www.ibef.org
Base chemicals• Petrochemicals, man-made fibres, industrial gases, fertilisers, chlor-alkali, and other
organic and inorganic chemicals
Specialty chemicals• Dyes and pigments, leather chemicals, construction chemicals, personal care ingredients
and other specialty chemicals
Pharmaceuticals • Active Pharmaceutical Ingredients (APIs) and formulations
Source: TATA Strategic Management Group, TechSci Research
MAJOR SEGMENTS OF THE INDIAN CHEMICAL INDUSTRY
CHEMICALS
Agrochemicals • Insecticides, herbicides, fungicides and other crop protection chemicals
Biotechnology • Bio-pharma, bio-agri, and bio-industrial products
AUGUST 2015

99For updated information, please visit www.ibef.org
Source: TechSci Research
PRODUCT-WISE CLASSIFICATION OF THE INDIAN CHEMICAL INDUSTRY
CHEMICALS
Alkali
chemicals
• Soda ash
• Caustic soda
• Liquid
• Chlorine
Inorganic chemicals
• Aluminum flouride
• Calcium carbide
• Carbon black
• Potassium chlorate
• Titanium dioxide
• Red phosphorus
Organic
chemicals
• Acetic acid
• Acetone
• Phenol
• Methanol
• Ortho Nitro
Chlorobenzene
(ONCB)
• Isobutyl
• Para
Nitrochlorobenzene
(PNCB)
• Ethyl
Pesticides
& insecticides
• Dichlorodiphenyltri-
chloroethane (DDT)
• Malathion
• Parathion
• Ethicon
• Endosulphan
• Phosalone
• Phorate
• Acephate
• Fenvalerate
Dyes
& dyestuffs
• Azo dyes
• Disperse dyes
• Fast colour bases
• Ingrain dyes
• Napthols
• Vat dyes
• Reactive dyes
• Pigment Emulsion
• Sulphur dyes
• Other dyes
AUGUST 2015

1010For updated information, please visit www.ibef.org
Source: FICCI, TechSci Research
Note: R&D – Research and Development
CHARACTERISTICS OF THE INDIAN CHEMICAL INDUSTRY
CHEMICALS
High domestic
demand potential
• The industry has changed over time to meet the dynamic needs of an emerging economy
• Strong economic growth and rise in per-capita income has meant a steady increase in demand for chemicals
• Expected to clock a growth of 10-13 per cent over the coming years
• The industry has left behind a low-growth and regulated environment to emerge more mature
• There is strong government support towards R&D; this would benefit the sector
• In 2015, Department of Chemicals and Petrochemicals added three new chemical and petrochemical products under its supervision.
Focus on new
segments such as
specialty and
knowledge
chemicals
Gujarat and
Maharashtra have
emerged as most
favoured zones
Fragmented
industry
Increase in focus
on R&D
Indian chemical
industry
AUGUST 2015

1111For updated information, please visit www.ibef.org
Total production of major chemicals (000’ MT)
Source: Department of Chemicals and Petrochemicals,
TechSci Research
Note: MT - Metric Tonne
Total production in the Indian chemical industry was 8,839
MT in FY14, clocking a CAGR of 1.97 per cent from FY07-
14
Favourable demographics and strong economic growth are
driving demand for chemicals
External demand and specialty chemicals have also
contributed strongly to the growth of the industry
India’s growing per capita consumption and demand for
agriculture-related chemicals offers huge scope of growth
for the sector in the future
DOMESTIC AND EXTERNAL DEMAND DRIVING GROWTH IN THE SECTOR … (1/2)
CHEMICALS
7,713 7,945 7,564 7,8958,509 8,730 8,690 8,839
FY 07 FY 08 FY 09 FY 10 FY 11 FY12 FY13 FY14
AUGUST 2015

1212For updated information, please visit www.ibef.org
Production of major chemicals (000’ MT)
Source: Department of Chemicals and Petrochemicals, TechSci Research
Notes: MT - Metric Tonne, Kg - Kilo gram,
CAGR - Compound Annual Growth Rate
Note*-April to September 2014
With 71 per cent of the total production share, alkali chemicals form the largest segment in the Indian chemical industry in
2014
During FY15 (April to September 2014), alkali chemicals’ production stood at 3,279 MT
Production share of major chemicals during FY15*
CHEMICALS
DOMESTIC AND EXTERNAL DEMAND DRIVING GROWTH IN THE SECTOR … (2/2)
AUGUST 2015
0
5000
10000
15000
20000
25000
30000
35000
AlkaliChemicals
InorganicChemicals
OrganicChemicals
Pesticides Dyes&Dyestuffs
FY11 FY12 FY13 FY14 FY15 (April14 toSep 14)
68.40%
9.24%
17.38%
1.90%3.09%
AlkaliChemicals
InorganicChemicals
OrganicChemicals
Pesticides
Dyes&Dyestuffs

1313For updated information, please visit www.ibef.org
BASE CHEMICALS ACCOUNT FOR MORE THAN HALF OF THE TOTAL PRODUCTION
Sector-wise Share of Indian Chemical Sales in FY13
(in USD Billion)
Source: FICCI, Department of Chemicals and Petrochemicals, TechSci Research
Bulk chemicals account for 39 per cent of the Indian chemical industry, followed by agrochemicals (20.3 per cent) and
specialty chemicals (19.5 per cent)
Pharmaceuticals and biotechnology, accounted for 17 per cent and 4.2 per cent, respectively, of the total production in FY13
Specialty chemicals are relatively high valued; their demand is rapidly growing, catering to a diverse end-product market
The Indian specialty chemicals market is estimated to reach USD60 to USD70 billion by 2020, from the current USD23 billion
CHEMICALS
AUGUST 2015
39.0%
20.3%
19.5%
17.0%
4.2% Bulk Chemicals
Agrochemicals
SpecialityChemicals
Pharmaceuticals
Biotechnology
46
24 2320
5
Bu
lk C
hem
ica
ls
Agro
chem
icals
Specia
lity
Chem
icals
Pharm
aceuticals
Bio
technolo
gy
Sector-wise Indian Chemical Production in FY13
(in USD Billion)

1414For updated information, please visit www.ibef.org
Chemical exports of India (USD billion)
Source: Ministry of Commerce, TechSci Research
Notes: FY15* - Upto September 2014
CAGR - Compound Annual Growth Rate
Total exports of chemicals grew from USD3.5 billion in
FY03 to USD29.62 billion in FY14, a CAGR of 9 per cent
Exports of the Indian chemical industry stood at USD14.94
billion for FY15*
Export of major chemicals stood at USD3.5 billion in FY03
EXPORTS HAVE BEEN RISING OVER THE YEARS …
CHEMICALS
CAGR: 9.0%
AUGUST 2015
*
22.90
28.9727.88
29.62
14.94
FY11 FY12 FY13 FY14 FY15*

1515For updated information, please visit www.ibef.org
India’s chemical imports (USD billion)
Source: Ministry of Commerce, TechSci Research
Notes: FY15* - Data for FY15 is up to September 2014,
CAGR - Compound Annual Growth Rate
Total imports of chemicals grew from USD3.7 billion in
FY03 to USD40.0 billion in FY14, a CAGR of 9.6 per cent
Total imports of chemicals reached USD23.2 billion in the
FY15*
Import of major chemicals stood at USD3.7 billion in FY03
… BUT, INDIA IS A NET IMPORTER OF CHEMICALS
CHEMICALS
CAGR: 9.6%
AUGUST 2015
30.4
37.6 38.7 40.0
23.2
FY11 FY12 FY13 FY14 FY15*

1616For updated information, please visit www.ibef.org
Shares in exports of chemicals in FY15 (Upto April
to September 2014)
Source: Department of Chemicals and Petrochemicals, TechSci Research
Note: CAGR - Compound Annual Growth Rate
During FY15, organic chemicals constituted 61.05 per cent
of India’s total chemical exports, followed by miscellaneous
chemical at 16.12 per cent
Over FY07–14, organic chemicals exports rose at a CAGR
of 16.1 per cent, followed by miscellaneous chemical at a
rate of 19.9 per cent during same period
Exports of inorganic chemicals and dyes & dyestuff grew at
a CAGR of 12.3 and 19.9 per cent, respectively, during
FY07–14
ORGANIC CHEMICALS DOMINATE BOTH EXPORTS AND IMPORTS … (1/2)
CHEMICALS
AUGUST 2015
16.12%
7.13%
61.05%
15.70%
MiscellaneousChemicalProducts
InorganicChemicals
OrganicChemicals
Tanning orDyeing

1717For updated information, please visit www.ibef.org
Shares in imports of chemicals in FY14
Source: Department of Chemicals and Petrochemicals, TechSci Research
Note: CAGR - Compound Annual Growth Rate
Organic chemicals also dominate imports, with a share of
62 per cent, followed by inorganic chemicals at 18 per cent
in FY14
Over FY07–14, miscellaneous chemical imports rose at a
CAGR of 20.1 per cent, followed by organic chemicals at a
rate of 20.9 per cent
Imports of dyes & dyestuff and inorganic chemicals grew at
a CAGR of 19.1 and 14.4 per cent, respectively, during
FY07–14
ORGANIC CHEMICALS DOMINATE BOTH EXPORTS AND IMPORTS … (2/2)
CHEMICALS
62%18%
6%
14% Organicchemicals
Inorganicchemicals
Dyes & dyestuffs
MiscellaneousChemical
AUGUST 2015

1818For updated information, please visit www.ibef.org
Source: FICCI, TechSci Research
Notes: Figures mentioned above is taken from Dept. of
Chemicals and Petrochemicals;
CHEMICAL INDUSTRY HOLDS A SIGNIFICANT POSITION IN THE ECONOMY
CHEMICALS
India’s
chemical
industry
(2013-15)
In 2015, Chemical
Industry is expected to
grow and
reach
USD100 billion mark
2.11 per cent of
national
GDP3rd
largest chemical
industry in Asia,
preceded
by China and
Japan
Government allows
100 per cent FDI in the
chemical sector
One of the
most diversified
sectors, covering
more than
70,000 commercial
Products*
9.2 per cent of
total exports
and 7.6 per cent
of total imports
AUGUST 2015

1919For updated information, please visit www.ibef.org
Contribution to global chemical industry
would increase
Source: FICCI, TechSci Research
Notes: CAGR - Compound Annual Growth Rate, E - Estimate
Strong growth outlook for the Indian chemicals
industry (USD billion)
CHEMICALS
HIGH GROWTH WOULD LEAD TO RISING GLOBAL POSITIONING
2015E
• Global chemical industry: USD3.26 trillion
• India chemical industry: USD100 billion
2021E
• Global chemical industry: USD5.8 trillion
• India chemical industry: USD235.12 billion
2015E 2021E
Global India
AUGUST 2015
96.93%
3.07%
95.95%
4.05%
118100
235.12
2013 2015E 2021E
CAGR: 9%

2020For updated information, please visit www.ibef.org
Regional concentration of basic chemical industry
(FY13)
Source: India-Chem, FICCI, TechSci Research,
Gujarat Manufacturing Sector Profile
Note: MoU - Memorandum of Understanding
Though the sector is spread across the country, there is
relatively high concentration along the West coast due to
proximity to raw materials and ports
Gujarat alone is estimated to contribute about 53 per cent of
the total production in the country
About 6,000 chemicals are produced in the state of Gujarat
alone
Gujarat and Maharashtra emerged as the most favored
zones for the industry, mainly because of government
policies, strategic location, and availability of raw material
WIDESPREAD CHEMICAL INDUSTRY INFRASTRUCTURE ACROSS INDIA … (1/2)
CHEMICALS
AUGUST 2015
33.50%
19.70%6.00%
5%
4.70%
5.30%
5.80%
20.0%
Gujarat
Maharashtra
Uttar Pradesh
West Bengal
Himachal Pradesh
Tamilnadu
Andhra Pradesh
Others

2121For updated information, please visit www.ibef.org
Source: D&B, TechSci Research
CHEMICALS
Jamnagar,
Thane, Pune, Chiplun
Ahmedabad
Hyderabad
Vadodara
Cochin
Haldia
Bengaluru
NCR
Chennai
Bharuch, Hazira, Vapi
Baddi
Derabassi
Panipat
Nagda
Visakhapatnam,
Kakinada
Cuddalore, Puducherry
Mangalore
WIDESPREAD CHEMICAL INDUSTRY INFRASTRUCTURE ACROSS INDIA … (2/2)
AUGUST 2015

2222For updated information, please visit www.ibef.org
Source: Company Annual Reports, TechSci Research
Notes: * For first six months (April-September ),
^ for FY14
KEY DOMESTIC AND INTERNATIONAL PLAYERS IN INDIAN CHEMICAL INDUSTRY … (1/2)
CHEMICALS
Domestic companySales in FY15*
(USD billion) Products
Tata Chemicals Limited (TCL) 0.8Soda ash, salt, marine chemicals,
caustic soda, cement, etc.
United Phosphorus Limited (UPL) 0.5 Agrochemicals
Nirma Ltd 1.2^Alkyl benzene, alfa olefin sulphonate,
sulfuric acid, soda ash
Gujarat Heavy Chemicals Ltd (GHCL) 0.2 Soda ash
Gujarat Alkalies and Chemicals Ltd (GACL) 0.2 Caustic soda
AUGUST 2015

PORTERS FIVE FORCES ANALYSIS
CHEMICALS
AUGUST 2015
2424For updated information, please visit www.ibef.org
PORTERS FIVE FORCES ANALYSIS
CHEMICALS
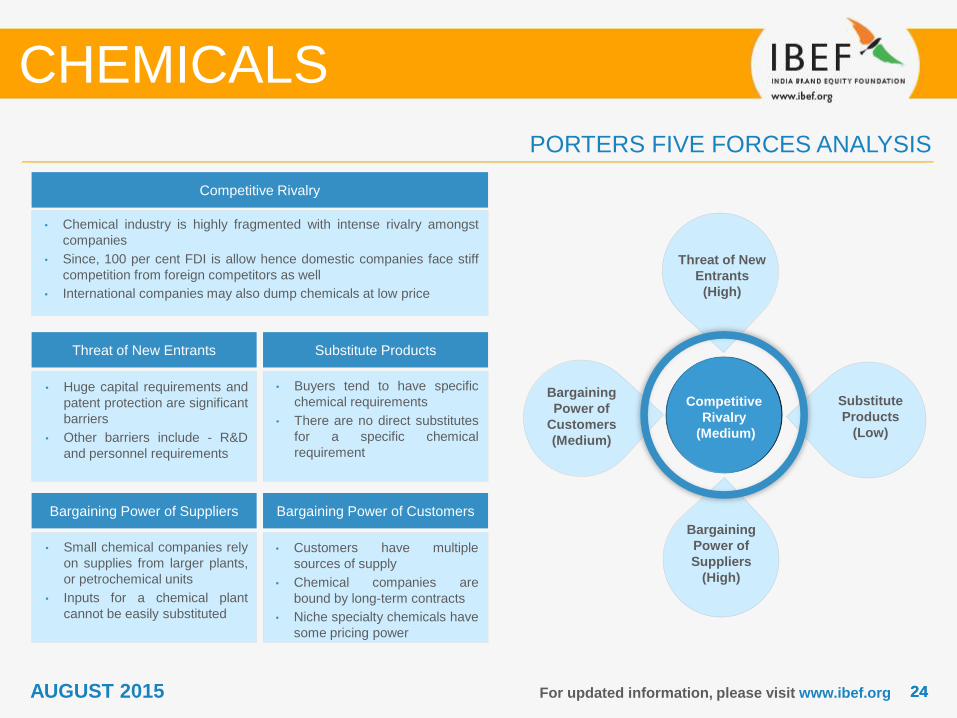
Competitive Rivalry
• Chemical industry is highly fragmented with intense rivalry amongst
companies
• Since, 100 per cent FDI is allow hence domestic companies face stiff
competition from foreign competitors as well
• International companies may also dump chemicals at low price
Threat of New Entrants
Bargaining Power of Suppliers Bargaining Power of Customers
• Customers have multiple
sources of supply
• Chemical companies are
bound by long-term contracts
• Niche specialty chemicals have
some pricing power
Substitute Products
• Huge capital requirements and
patent protection are significant
barriers
• Other barriers include - R&D
and personnel requirements
• Small chemical companies rely
on supplies from larger plants,
or petrochemical units
• Inputs for a chemical plant
cannot be easily substituted
• Buyers tend to have specific
chemical requirements
• There are no direct substitutes
for a specific chemical
requirement
Competitive
Rivalry
(Medium)
Threat of New
Entrants
(High)
Substitute
Products
(Low)
Bargaining
Power of
Customers
(Medium)
Bargaining
Power of
Suppliers
(High)
AUGUST 2015
GROWTH DRIVERS
CHEMICALS
AUGUST 2015

2626For updated information, please visit www.ibef.org
Source: TechSci Research
GROWTH DRIVERS OF THE INDIAN CHEMICAL INDUSTRY
CHEMICALS
Low-cost
manufacturing
Skilled science
professionals
and English
speaking
workforce
Rise in GDP and
purchasing
power
World class
engineering and
strong R&D
capabilities
Huge growth
potential for the
domestic market
AUGUST 2015

2727For updated information, please visit www.ibef.org
ECONOMIC EXPANSION WOULD CONTINUE TO DRIVE GROWTH IN THE CHEMICAL INDUSTRY
Real GDP growth
Source: IMF, TechSci Research
Being largely an intermediate product, strong economic growth is an important factor in sustaining demand for chemical
products
Per capita consumption of most of the finished products under chemicals sector is far below the world average; this points to
the vast potential for growth in the industry
As in a number of other industries in India, strong growth in discretionary income and changing lifestyles are counted as a
few of the other major growth drivers of the chemicals sector
Per capita GDP growth
CHEMICALS9
.3%
9.8
%
3.9
%
8.5
% 10
.3%
6.6
%
4.7
%
5.0
%
5.6
%
6.4
%
6.5
%
6.6
%
20
06
20
07
20
08
20
09
20
10
20
11
20
12
20
13
2014
20
15
F
20
16
F
20
17
F
7.7
%
8.3
%
2.5
%
7.0
%
8.7
%
5.2
%
3.4
%
3.7
%
4.3
% 5.0
%
5.1
%
5.2
%
20
06
20
07
2008
20
09
20
10
20
11
20
12
20
13
20
14
20
15
F
20
16
F
20
17
F
AUGUST 2015

2828For updated information, please visit www.ibef.org
POLICY SUPPORT FOR FOREIGN INVESTMENT
Annual FDI inflow to the chemical industry
(excluding fertilizer) (USD Million)
Source: Department of Industrial Policy & Promotion,
Ministry of Commerce and Industry, TechSci Research
Note: * - Up to May 2015
FDI in chemicals (other than fertilisers) stood at USD10,487 million in FY16;
Procedures relating to FDI have been simplified; most of the items in the chemicals sector fall under the automatic approval
route for FDI/NRI/OCB investment up to 100 per cent
The USD7.2 billion deal between Reliance Industries Limited and British Petroleum is the most significant deal in Indian
chemical sector
Share of chemical industry in total FDI
inflow (excluding fertiliser)
CHEMICALS
AUGUST 2015
2.30%
10.60%11.30%
1.30%
4.44% 4.16% 4.10%
FY10 FY11 FY12 FY13 FY14 FY15 FY16*
362
2354
4041
292878
10336 10487
FY10 FY11 FY12 FY13 FY14 FY15 FY16*

2929For updated information, please visit www.ibef.org
Source: Department of Chemicals and Petrochemicals,
TechSci Research
Notes: * - Revised estimate, FY14* - Budget estimate
GOVERNMENT SUPPORT TO THE SECTOR IS INCREASING … (1/2)
CHEMICALS
All figures are in USD million
Name of the
scheme
XI Plan outlay
(2007-2012)
Annual Plan
FY11
Annual Plan
FY12
Annual Plan
FY13*
Annual Plan
FY14*
Project based
support to PSUs29.1 4.3 0.0 5.4 1.9
Support to autonomous
bodies19.2 0.1 0.2 8.3 27.2
Other ongoing
schemes44.2 165.8 183.4 292.8 195.6
New schemes initiated
in XI plan25.0 17.9 10.1 - -
Total 117.5 188.1 193.7 306.5 224.7
AUGUST 2015

3030For updated information, please visit www.ibef.org
Source: Department of Chemicals and Petrochemicals, TechSci Research
GOVERNMENT SUPPORT TO THE SECTOR IS INCREASING … (2/2)
CHEMICALS
All figures are in USD million
Name of the
scheme
Non-plan outlay
(FY10)
Non-plan outlay
(FY11)
Non-plan outlay
(FY12)
Non-plan outlay
(FY13)
Non-plan outlay
(FY14)
Secretariat 2.21 2.52 2.79 2.3 2.4
Central Institute of Plastics
Engg. & Technology
(CIPET)
0.63 0.10 0.10 0 0
Bhopal Gas Leak Disaster 0 0 0 17.5 23.3
Institute of Pesticide
Formulation Technology
(IPFT)0 0 0 0.6 0.6
Others 0.50 0.54 0.63 0 0
Total 3.34 3.16 3.52 20.4 26.3
AUGUST 2015

3131For updated information, please visit www.ibef.org
Source: EXIM Bank of India, TechSci Research,
Note: PCPIR - Petroleum, Chemicals and Petrochemicals Investment Regions
The government has announced a number of measures to
improve competitiveness in the sector
Share of manufacturing approved by the Cabinet as per the
erstwhile Planning Commission would contribute 25% of the
GDP by 2025
Approval is granted for FDI up to 100 per cent in the
chemicals sector, excise duty reduced from 14 per cent to
10 per cent, strong laws on anti-dumping to further promote
the industry
The government is continuously reducing the list of
reserved chemical items for production in the small-scale
sector, thereby facilitating greater investment in technology
up-gradation and modernisation
Policies have been initiated to set up integrated Petroleum,
Chemicals and Petrochemicals Investment Regions
(PCPIR). PCPIR will be an investment region spread across
250 square kilometres for manufacturing of domestic and
export-related products of petroleum, chemicals and
petrochemicals
New initiatives are likely to attract large investments, both
domestic and foreign, with requisite improvements in
infrastructure and competition
GROWTH, COMPETITIVENESS AND PROCESS INITIATIVES
CHEMICALS
Industry-level initiatives
• The Indian Chemical Council (ICC ) is the nodal
agency/signatory representing India under the
‘Responsible Care Initiative’
• ICC has prepared codes and guidance for implementation
of process safety, employee health and safety, pollution
prevention, emergency response, and product safety
• Member companies of ICC are encouraged to interact with
local communities and groups such as students, teachers,
fire/police personnel
Firm-level initiatives
• Indian chemical firms have strived to increase their
market share through global presence
• They have in place technical agreements with
multinational firms to keep abreast of technological
progress in the global chemical industry
AUGUST 2015

3232
MILESTONES PROPOSED FOR 12TH FIVE-YEAR PLAN
For updated information, please visit www.ibef.org
Source: TechSci Research
Note: PCPIR - Petroleum, Chemicals and Petrochemicals Investment Regions
CHEMICALS
• Make PCPIRs a
reality
• Provide
infrastructure support
to the industry by
constructing roads,
ports and other
similar facilities
• Implementation of
strategy for sourcing
and allocation of
feedstock
• Setting up of
technology up-
gradation fund of
USD100 million
• Allocation of 10 per
cent share of the
USD1 billion
National Innovation
Fund to chemicals
• Development of the
first set of chemical
usage standards for
the industry
addressing key
issues related to
water supply,
environmental
impact, raw materials
supply, safety over
lifecycle, and energy
use
• Committee to frame
regulatory structure
and eliminate
redundancies
• Setting up of a
national chemical
inventory
• Government has
rationalized and
removed various tax
exemptions and
incentives to improve
the administration
and to reduce tax
disputes
Infrastructure Feedstock R&D and technology Sustainability Regulations
AUGUST 2015

3333
Source: Department of Chemicals and Petro Chemicals, TechSci Research
RECENT MAJOR M&A DEALS IN THE INDIAN CHEMICAL INDUSTRY …
CHEMICALS
Acquirer Target/ JV partner Valuation Synergies/ drivers
Inbound
April-14 Yanmar Ltd/ Mitsui Ltd Coromandel International Ltd - Manufactures rice transplanters and harvesters
April-14 Axiall LLC Shriram Vinyl Polytech Pvt Ltd USD6 million Launched new-generation polymer compounds
December-13 Multiplast Polymer Soft Clad Laminates - Manufacturer of plastic products
September-12 Chemtura Corporation Solaris Chemtech Industries USD142 million Increase in bromine production capacity
Outbound
September-14 Brenntag Pioma Chemicals NA Specialty chemicals
April-14 Asian Paints Ltd Kadisco Chemical Industry PLC - Sells paints, coatings & adhesives in Ethiopia
AUGUST 2015 For updated information, please visit www.ibef.org

OPPORTUNITIES
CHEMICALS
AUGUST 2015

3535For updated information, please visit www.ibef.org
GROWTH VALUE PROPOSITION OF THE INDIAN CHEMICAL INDUSTRY
CHEMICALS
Indianchemicals
sector
Critical size of thedomestic market
Customised application development
Availability of reliable and competitivefeedstock supply
Established process know-how and strong R&D capability
Source: KPMG International 2011, TechSci Research
AUGUST 2015
3636For updated information, please visit www.ibef.org
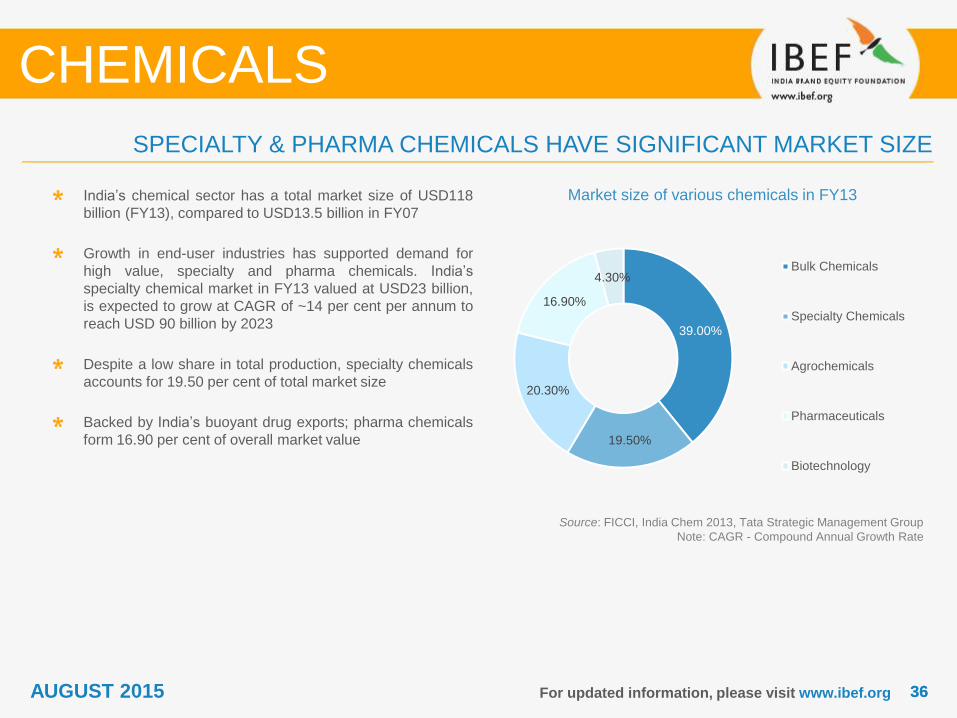
Market size of various chemicals in FY13
Source: FICCI, India Chem 2013, Tata Strategic Management Group
Note: CAGR - Compound Annual Growth Rate
India’s chemical sector has a total market size of USD118
billion (FY13), compared to USD13.5 billion in FY07
Growth in end-user industries has supported demand for
high value, specialty and pharma chemicals. India’s
specialty chemical market in FY13 valued at USD23 billion,
is expected to grow at CAGR of ~14 per cent per annum to
reach USD 90 billion by 2023
Despite a low share in total production, specialty chemicals
accounts for 19.50 per cent of total market size
Backed by India’s buoyant drug exports; pharma chemicals
form 16.90 per cent of overall market value
SPECIALTY & PHARMA CHEMICALS HAVE SIGNIFICANT MARKET SIZE
CHEMICALS
AUGUST 2015
39.00%
19.50%
20.30%
16.90%
4.30%Bulk Chemicals
Specialty Chemicals
Agrochemicals
Pharmaceuticals
Biotechnology

3737
3.6
2.3
0.6 0.8 0.6
8.2
5.3
1.4 1.51.1
Paints andcoatings
Specialitypolymers
Constructionchemicals
Textilechemicals
Waterchemicals
FY11 FY17*
For updated information, please visit www.ibef.org
SPECIALTY CHEMICALS: LUCRATIVE OPPORTUNITIES IN THIS SEGMENT
Specialty chemical growth outlook by FY23
(USD billion)
Source: FICCI, Dept. of Chemicals and Petrochemicals, TechSci Research,
Note: * - Estimates
Specialty chemicals market has expanded at a CAGR of about 12 per cent over FY07–11; the figure is expected to rise by
14.62 per cent from FY13 to reach USD90 billion by FY23, India is also gaining traction as an outsourcing hub
The Indian middle-class household is expected to grow from 31 million in 2008 to 148 million by 2030, leading to a huge
demand for specialty chemicals in automotives, water treatment and construction
Compared to developed markets, current usage of specialty chemicals in India is very low, with an increased focus on
improving products and usage intensity of specialty chemicals, the industry is poised for strong growth in future
During the 12th Five-Year Plan, an investment of USD7–10 billion is estimated in this segment
Major sub-segments and their growth outlook by FY17
(USD billion)
CHEMICALS
AUGUST 2015
23
90
FY13 FY23
CAGR: 14.62%
*
3838For updated information, please visit www.ibef.org
WITHIN SPECIALTY CHEMICALS, CONSTRUCTION CHEMICALS IS LIKELY TO SHINE
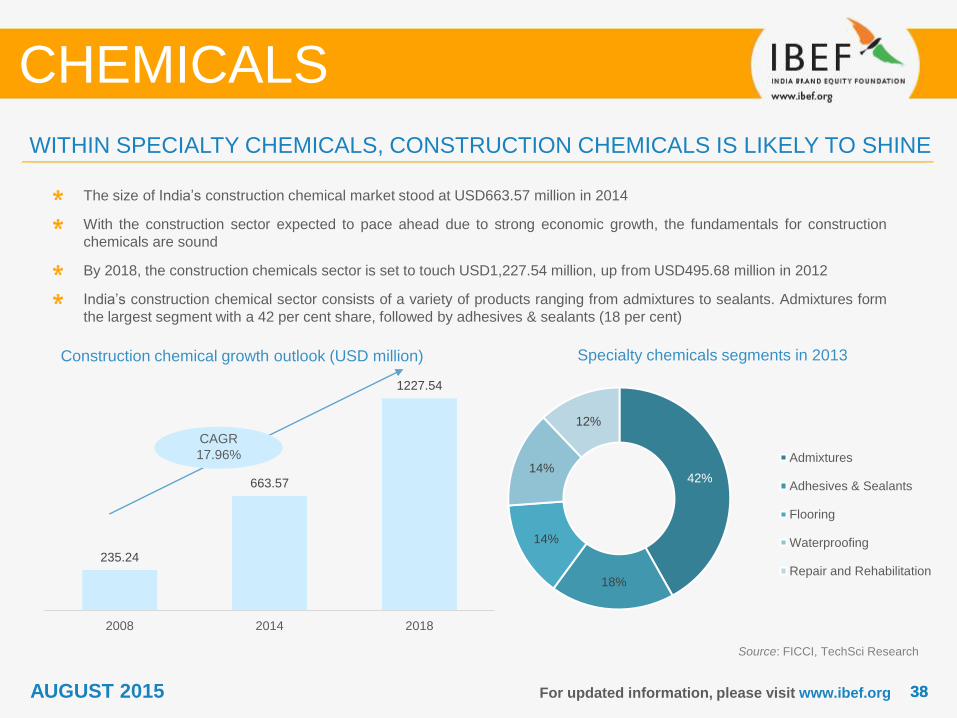
Construction chemical growth outlook (USD million)
Source: FICCI, TechSci Research
The size of India’s construction chemical market stood at USD663.57 million in 2014
With the construction sector expected to pace ahead due to strong economic growth, the fundamentals for construction
chemicals are sound
By 2018, the construction chemicals sector is set to touch USD1,227.54 million, up from USD495.68 million in 2012
India’s construction chemical sector consists of a variety of products ranging from admixtures to sealants. Admixtures form
the largest segment with a 42 per cent share, followed by adhesives & sealants (18 per cent)
Specialty chemicals segments in 2013
CHEMICALS
AUGUST 2015
42%
18%
14%
14%
12%
Admixtures
Adhesives & Sealants
Flooring
Waterproofing
Repair and Rehabilitation235.24
663.57
1227.54
2008 2014 2018
CAGR
17.96%

3939For updated information, please visit www.ibef.org
KEY GROWTH DRIVERS OF SPECIALTY CHEMICALS
Source: TechSci Research
CHEMICALS
Automotive
Construction
Water
Automotive sector in India has
been expanding at a CAGR of
~12 per cent over the last five
years. Automotive sector growth
will drive demand for automotive
components and consequently
for plastics, paints and coatings
used in their production
Water treatment chemicals
are widely used in purification
of water and also in large
power plants, refineries and
fertiliser factories
Construction industry in India has
been registering a CAGR of about 17
per cent over the last few years and is
likely to gather momentum in the near
future. Adoption of advanced coating,
ceiling and polymer-based reinforcing
material in construction will drive the
demand for related chemicals
AUGUST 2015

4040For updated information, please visit www.ibef.org
Polymer chemical growth outlook (USD million)
Source: TATA Strategic Analysis, TechSci Research
Notes: E - Estimates, CAGR - Compound Annual Growth Rate
Polymer chemicals
India is currently the world’s third largest consumer of
polymers, behind China and the US, with a global share of
5.7 per cent in the 2011; an increase from 3.5 per cent
share during 2000
The Indian polymer chemical market has expanded at a
CAGR of 10.5 per cent in the last five years
Polymer market is expected to expand at a CAGR of 11.7
per cent over 2005-15 to USD500 million
The sector is expected to grow at a higher rate due to
growth in plastic demand resulting from increased usage in
packaging, construction and automotive sectors
Due to increasing environmental concerns and cost,
replacement of wood, metal and glass by plastic will also
augment demand
POLYMER CHEMICALS WILL BE YET ANOTHER KEY SEGMENT OF SPECIALTY CHEMICALS
CHEMICALS
165
300
500
2005 2010 2015E
CAGR: 11.7%
AUGUST 2015

4141For updated information, please visit www.ibef.org
AGROCHEMICALS: THE FUTURE LOOKS BRIGHT
Agrochemical industry growth outlook (USD billion)
Source: FICCI, India Chem, TechSci Research
Notes: E - Estimates, CAGR - Compound Annual Growth Rate
Note: * - Data is of 2012
India is the third largest producer of agrochemicals globally, market size to reach USD6.4 billion by FY16
Agrochemical industry in India is set to grow at a significant pace; increasing population, decreasing per capita availability of
arable land and focus on increasing agricultural yield will fuel the demand for agrochemicals
India's per hectare agrochemical consumption is set to rise in the coming years, given the above-mentioned factors
India exports about 50 per cent of its current production; exports are likely to remain a key component of the industry
Insecticides India Ltd, a leading agrochemical company plans to invest USD22.9 million in the next two years to expand its
production capacity
Average crop protection consumption* (kg/ha)
CHEMICALS
CAGR: 24.18%
0.6
3.0 3.04.5
10.8
16.5
India Europe Gobalaverage
USA Japan Korea
AUGUST 2015
4.15
6.4
2014 2016

SUCCESS STORIES
CHEMICALS
AUGUST 2015

4343For updated information, please visit www.ibef.org
Revenue breakup of TATA chemicals (FY14)
Source: Company Annual Report, TechSci Research
Notes: STPP * - Sodium Tripolyphosphate
IMACID - Indo Maroc Phosphore S.A.
Tata Chemicals Limited (TCL) is one of the leading
chemical companies in India, with significant operations in
India and Africa
Second-largest soda ash producer in the world and the
largest in India
A market leader in edible salt; largest STPP player in the
country
Most energy-efficient urea fertiliser manufacturer in India;
amongst the most efficient globally
1/3rd stake holder in IMACID, Morocco, assured supply of
key inputs
TATA CHEMICALS: DIVERSIFYING THEIR WAY TO SUCCESS … (1/3)
CHEMICALS
40%
6%21%
11%
1%
19%
2%
Soda ash
Vacuum salt
Complex fertilisers
Urea
Cement
Others
Other income
AUGUST 2015

4444For updated information, please visit www.ibef.org
Source: Company website, TechSci Research
CHEMICALS
• Acquires
controlling stake
in Rallis India
Limited
• Acquires South
Africa’s Grown
Energy
• Tata Chemicals
Europe Ltd
acquires British
Salt, producing
approximately
half of the UK’s
pure salt
• Tata Chemicals wins
two awards at the
Brand Leadership
Award 2013 for
‘Emerging Brand’
and '50 Most
Talented Brand
Leaders of India'
2009
2010
2011
2012
2013
• India's first iodine
plus iron fortified
salt launched by
Tata Chemicals
TATA CHEMICALS: DIVERSIFYING THEIR WAY TO SUCCESS … (2/3)
AUGUST 2015
• Tata Chemicals was
awarded 'Dun &
Bradstreet Corporate
Awards 2015' in the
fertilizer’s sector
2014-15

4545For updated information, please visit www.ibef.org
Geographical diversification (FY14)
Source: Company website, TechSci Research
Notes: CAGR - Compounded Annual Growth Rate,
Turnover over the years (USD billion)
CHEMICALS
TATA CHEMICALS: DIVERSIFYING THEIR WAY TO SUCCESS … (3/3)
1.3
1.5
2.8
2.0
2.4
2.92.8
2.6
FY07 FY08 FY09 FY10 FY11 FY12 FY13 FY14
CAGR: 10.41%
AUGUST 2015
65%
18%
12%
5%
Asia
America
Europe
Africa

4646For updated information, please visit www.ibef.org
Total sales (USD billion)
Source: United Phosphorus Limited (UPL) Annual Reports,
TechSci Research
Notes: CAGR - Compound Annual Growth Rate,
UPL is mainly engaged in the business of agrochemicals,
other industrial chemicals, and chemical intermediates
Agrochemicals account for 92 per cent of the total sales of
the company, while the industrial chemicals and
intermediates segments together account for 8 per cent
UPL has 21 manufacturing sites – nine in India, four in
France, two in Spain, and one each in UK, Vietnam,
Netherlands, Italy, Argentina and China
The company has also strengthened its distribution reach
and access to new markets through strategic alliances with
agrochemical manufacturers in other countries
The company is planning to launch innovative technology,
farming solutions, and new products through its other arms
such as Advanta and Golden Seeds
UNITED PHOSPHORUS LIMITED (UPL): AN AGROCHEMICAL SUCCESS … (1/2)
CHEMICALS
CAGR: 18.99%
AUGUST 2015
0.5
0.91
1.11.2
1.61.7
1.8
2.01
FY07 FY08 FY09 FY10 FY11 FY12 FY13 FY14 FY15

4747For updated information, please visit www.ibef.org
Income by region - FY15
Source: Company Annual report, TechSci Research
Notes: EBIDTA - Earnings Before Interest, Taxes, Depreciation and Amortisation
UPL Limited comprises of UPL, Advanta and UEL companies that are listed in the Indian Stock Exchange
In 2015, UPL Mumbai won the Dun & Bradstreet Corporate Award in the agrochemicals sector
EBIDTA (USD billion)
CHEMICALS
UNITED PHOSPHORUS LIMITED (UPL): AN AGROCHEMICAL SUCCESS … (2/2)
CAGR: 15.87%
AUGUST 2015
28%
22%19%
17%
14%
Latin America
India
North America
Europe
Rest of World
0.12
0.18
0.21 0.22
0.26
0.31 0.32
0.36
0.39
FY07 FY08 FY09 FY10 FY11 FY12 FY13 FY14 FY15
4848For updated information, please visit www.ibef.org
ASIAN PAINTS: A COLORFUL GROWTH PATH
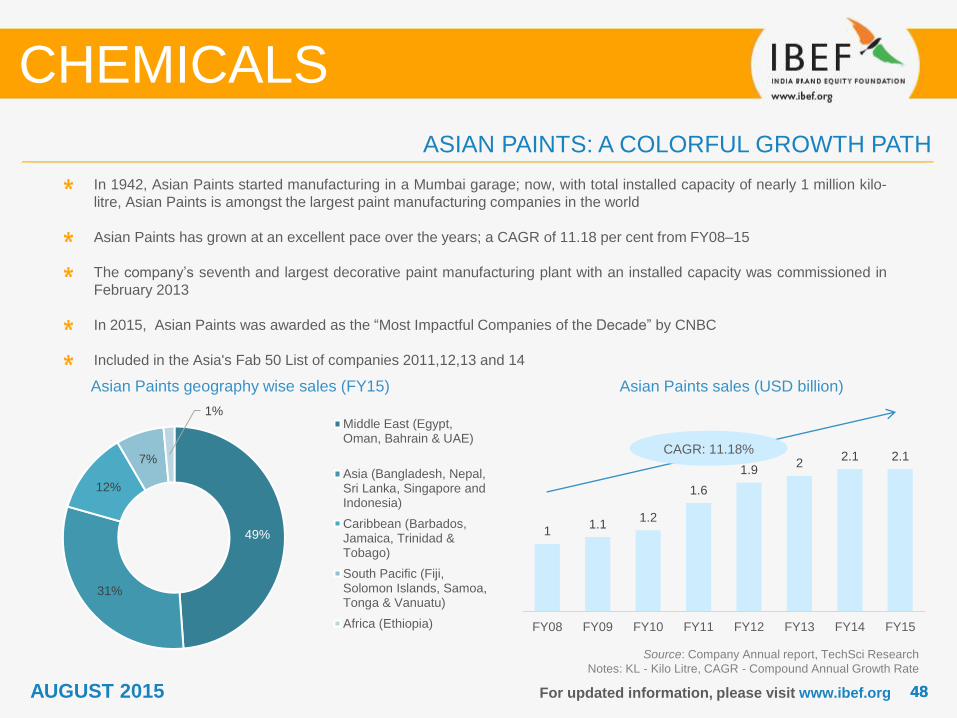
Asian Paints geography wise sales (FY15)
Source: Company Annual report, TechSci Research
Notes: KL - Kilo Litre, CAGR - Compound Annual Growth Rate
In 1942, Asian Paints started manufacturing in a Mumbai garage; now, with total installed capacity of nearly 1 million kilo-
litre, Asian Paints is amongst the largest paint manufacturing companies in the world
Asian Paints has grown at an excellent pace over the years; a CAGR of 11.18 per cent from FY08–15
The company’s seventh and largest decorative paint manufacturing plant with an installed capacity was commissioned in
February 2013
In 2015, Asian Paints was awarded as the “Most Impactful Companies of the Decade” by CNBC
Included in the Asia's Fab 50 List of companies 2011,12,13 and 14
Asian Paints sales (USD billion)
CHEMICALS
CAGR: 11.18%
AUGUST 2015
49%
31%
12%
7%
1%Middle East (Egypt,Oman, Bahrain & UAE)
Asia (Bangladesh, Nepal,Sri Lanka, Singapore andIndonesia)
Caribbean (Barbados,Jamaica, Trinidad &Tobago)
South Pacific (Fiji,Solomon Islands, Samoa,Tonga & Vanuatu)
Africa (Ethiopia)
11.1
1.2
1.6
1.92
2.1 2.1
FY08 FY09 FY10 FY11 FY12 FY13 FY14 FY15

4949For updated information, please visit www.ibef.org
India Glycols Limited sales (USD million)
Source: Company Annual Report, TechSci Research
Notes: CAGR - Compound Annual Growth Rate,
TTM – Trailing Twelve Months
Established in 1983, India Glycols is the only company that
manufactures green technology-based bulk, specialty and
performance chemicals and natural gums, spirits, industrial
gases, sugar and nutraceuticals in India
The company operates in five segments, including
Chemicals which form the largest segment
The company exports to more than 40 countries including
the US, Japan, and countries in Europe and Latin America
During FY08–15, the company’s sales have increased at a
CAGR of 3.72 per cent to USD431.44 million
INDIA GLYCOLS LIMITED
CHEMICALS
AUGUST 2015
334.2
224.5252.9
386.9
576.4
632.1
479431.44
FY08 FY09 FY10 FY11 FY12 FY13 FY14 FY15

USEFUL INFORMATION
CHEMICALS
AUGUST 2015

5151
INDUSTRY ASSOCIATIONS
For updated information, please visit www.ibef.org
CHEMICALS
Indian Chemical CouncilSir Vithaldas Chambers, 16-Mumbai Samachar Marg,
Mumbai – 400023
Phone: 91 22 22047649/ 22846852
Fax: 91 22 22048057
Website: www.icmaindia.com
Alkali Manufacturers Association of India3rd Floor, Pankaj Chambers, Preet Vihar Commercial Complex,
Vikas Marg, New Delhi – 110092
Phone: 91 11 22432003, 22410150, 55253401
Fax: 91 11 22468249
Website: www.ama-india.org
Indian Specialty Chemical Manufacturers' Association1156, Bole Smruti, Suryavanshi Kshatriya Sabhagriha Marg,
Off. Veer Savarkar Marg, Dadar (West)
Mumbai – 400 028
Tel: 91 22 2446 5003
Website: www.iscma.in
AUGUST 2015
5252
GLOSSARY
For updated information, please visit www.ibef.org
OCB: Overseas Corporate Bodies
NRI: Non-Resident Indian
FY: Indian Financial Year (April to March)
So FY10 implies April 2009 to March 2010
NA: Not Available
STPP: Sodium Tripolyphosphate
MT: Metric Tonnes
USD: US Dollar
Wherever applicable, numbers have been rounded off to the nearest whole number
CHEMICALS
AUGUST 2015

5353
Exchange rates (Fiscal Year)
For updated information, please visit www.ibef.org
EXCHANGE RATES
Exchange rates (Calendar Year)
Average for the year
CHEMICALS
AUGUST 2015
Year INR equivalent of one USD
2004–05 44.81
2005–06 44.14
2006–07 45.14
2007–08 40.27
2008–09 46.14
2009–10 47.42
2010–11 45.62
2011–12 46.88
2012–13 54.31
2013–14 60.28
2014-15(Expected) 60.28
Year INR equivalent of one USD
2005 43.98
2006 45.18
2007 41.34
2008 43.62
2009 48.42
2010 45.72
2011 46.85
2012 53.46
2013 58.44
2014 61.03
2015(Expected) 61.03

5454
India Brand Equity Foundation (“IBEF”) engaged TechSci to prepare this presentation and the same has been
prepared by TechSci in consultation with IBEF.
All rights reserved. All copyright in this presentation and related works is solely and exclusively owned by IBEF. The
same may not be reproduced, wholly or in part in any material form (including photocopying or storing it in any
medium by electronic means and whether or not transiently or incidentally to some other use of this presentation),
modified or in any manner communicated to any third party except with the written approval of IBEF.
This presentation is for information purposes only. While due care has been taken during the compilation of this
presentation to ensure that the information is accurate to the best of TechSci and IBEF’s knowledge and belief, the
content is not to be construed in any manner whatsoever as a substitute for professional advice.
TechSci and IBEF neither recommend nor endorse any specific products or services that may have been mentioned in
this presentation and nor do they assume any liability or responsibility for the outcome of decisions taken as a result of
any reliance placed on this presentation.
Neither TechSci nor IBEF shall be liable for any direct or indirect damages that may arise due to any act or omission
on the part of the user due to any reliance placed or guidance taken from any portion of this presentation.
For updated information, please visit www.ibef.org
DISCLAIMER
CHEMICALS
AUGUST 2015