chemistry a combined particle trap/htdma
TRANSCRIPT
ACPD8, 5235–5268, 2008
Hygroscopicity studyof inorganic/organic
particles
A. A. Zardini et al.
Title Page
Abstract Introduction
Conclusions References
Tables Figures
J I
J I
Back Close
Full Screen / Esc
Printer-friendly Version
Interactive Discussion
Atmos. Chem. Phys. Discuss., 8, 5235–5268, 2008www.atmos-chem-phys-discuss.net/8/5235/2008/© Author(s) 2008. This work is distributed underthe Creative Commons Attribution 3.0 License.
AtmosphericChemistry
and PhysicsDiscussions
A combined particle trap/HTDMAhygroscopicity study of mixedinorganic/organic aerosol particles
A. A. Zardini1, S. Sjogren2, C. Marcolli1, U. K. Krieger1, M. Gysel2,E. Weingartner2, U. Baltensperger2, and T. Peter1
1Institute for Atmospheric and Climate Science, ETH, CH-8092 Zurich, Switzerland2Laboratory of Atmospheric Chemistry, Paul Scherrer Institut, CH-5232 Villigen, Switzerland
Received: 22 January 2008 – Accepted: 12 February 2008 – Published: 12 March 2008
Correspondence to: U. K. Krieger ([email protected])
Published by Copernicus Publications on behalf of the European Geosciences Union.
5235
ACPD8, 5235–5268, 2008
Hygroscopicity studyof inorganic/organic
particles
A. A. Zardini et al.
Title Page
Abstract Introduction
Conclusions References
Tables Figures
J I
J I
Back Close
Full Screen / Esc
Printer-friendly Version
Interactive Discussion
Abstract
Atmospheric aerosols are often mixtures of inorganic and organic material. Organicscan represent a large fraction of the total aerosol mass and are comprised of water-soluble and insoluble compounds. Increasing attention was paid in the last decade tothe capability of mixed inorganic/organic aerosol particles to take up water (hygroscop-5
icity). We performed hygroscopicity measurements of internally mixed particles con-taining ammonium sulfate and carboxylic acids (citric, glutaric, adipic acid) in parallelwith an electrodynamic balance (EDB) and a hygroscopicity tandem differential mobil-ity analyzer (HTDMA). The organic compounds were chosen to represent three distinctphysical states. During hygroscopicity cycles covering hydration and dehydration mea-10
sured by the EDB and the HTDMA, pure citric acid remained always liquid, adipic acidremained always solid, while glutaric acid could be either. We show that the hygroscop-icity of mixtures of the above compounds is well described by the Zdanovskii-Stokes-Robinson (ZSR) relationship as long as the two-component particle is completely liquidin the ammonium sulfate/citric acid and in the ammonium sulfate/glutaric acid cases.15
However, we observe significant discrepancies compared to what is expected frombulk thermodynamics when a solid component is present. We explain this in terms of acomplex morphology resulting from the crystallization process leading to veins, pores,and grain boundaries which allow for water sorption in excess of bulk thermodynamicpredictions caused by the inverse Kelvin effect on concave surfaces.20
1 Introduction
Atmospheric aerosols influence the climate directly through scattering and absorptionof radiation, and indirectly through modification of clouds properties. The climate forc-ing resulting from these aerosol effects is still subject to large uncertainties (IPCC,2007). Organic material accounts for 20% to 50% in total fine aerosol mass at con-25
tinental mid-latitudes and for as much as 90% in tropical forested areas (Kanakidou
5236
ACPD8, 5235–5268, 2008
Hygroscopicity studyof inorganic/organic
particles
A. A. Zardini et al.
Title Page
Abstract Introduction
Conclusions References
Tables Figures
J I
J I
Back Close
Full Screen / Esc
Printer-friendly Version
Interactive Discussion
et al., 2005). Organics in the condensed phase comprise a large variety of chemi-cal compounds (Rogge et al., 1993). Although large uncertainty remains concerningthe detailed composition, it is established that a considerable fraction of the organicaerosol is water-soluble, thus contributing to aerosol hygroscopicity (Choi and Chan,2002; Saxena et al., 1995). Moreover, organics are typically found to be internally5
mixed with inorganic compounds (Middlebrook et al., 1998; Murphy et al., 2006), andmay therefore influence the water uptake and phase changes of the inorganic aerosolfraction (Saxena et al., 1995; Cruz and Pandis, 2000; Dick et al., 2000).
Considering the complex composition of atmospheric aerosols with thousands ofdifferent compounds, Marcolli et al. (2004) suggested that the physical state of the or-10
ganic aerosol fraction is typically liquid (or amorphous solid). The determination of thephysical state (liquid or crystalline) and the amount of water present in the condensedmatter is crucial to assess the aerosol impact on climate and atmospheric chemistry.
Chemical interactions between the inorganic and organic species may lead to a de-crease of the deliquescence relative humidity of the inorganic component, or even15
to water uptake by the aerosol particle at any relative humidity (Braban and Abbatt,2004; Choi and Chan, 2002). Alternatively, a liquid/liquid phase separation into a pre-dominantly organic and an aqueous inorganic phase may occur without change of theinorganic salt deliquescence relative humidity (Marcolli and Krieger, 2006).
Moreover, mass transfer limitations between gas and particle phase play a role in20
water uptake kinetics, increasing the time required by the particles to equilibrate withambient relative humidity (Chan and Chan, 2005; Sjogren et al., 2007). We observedslow water uptake for mixed inorganic/organic particles in HTDMA measurements andhypothesized that complex morphology of mixed solid/liquid aerosol particles is respon-sible for this behavior (Sjogren et al., 2007).25
The method of choice often used to predict the hygroscopic behavior of multi-component particles is the Zdanovskii-Stokes-Robinson’s approach (Zdanovskii, 1948;Stokes and Robinson, 1966). It assumes that there are no interactions between thedifferent components of the mixed solution particle, and therefore the total water up-
5237
ACPD8, 5235–5268, 2008
Hygroscopicity studyof inorganic/organic
particles
A. A. Zardini et al.
Title Page
Abstract Introduction
Conclusions References
Tables Figures
J I
J I
Back Close
Full Screen / Esc
Printer-friendly Version
Interactive Discussion
take is simply the sum of the individual uptakes by the single components. While thismethod proved to be valid for many systems, discrepancies still remain for other mix-tures, e.g. involving pinonic acid (Cruz and Pandis, 2000), succinic acid (Svenningssonet al., 2006), or adipic acid (Sjogren et al., 2007, and this study).
As pointed out by Fuzzi et al. (2006), despite the remarkable advances in recent5
years, physicochemical properties such as the hygroscopicity of organic particles needfurther investigation and improvements of measurement techniques.
This study sheds more light on the problem by investigating the hygroscopicity (interms of the growth factor) and morphologies (including phase changes) of mixed inor-ganic/organic particles made of ammonium sulfate as inorganic component and either10
citric, glutaric, or adipic acid as organic component. These organic compounds aretypically found in secondary or aged primary organic aerosols. Measurements areperformed in parallel with an electrodynamic balance and an HTDMA instrument, andresults are compared with literature data and/or bulk thermodynamics. A comparisonof the measured growth factors with the Zdanovskii-Stokes-Robinson approach is also15
shown. Characteristic deviations from ideality are identified and discussed.
2 Experiment and method
2.1 Electrodynamic balance
The basic experimental setup has been described previously (Krieger et al., 2000).Briefly, an electrically charged particle (typically 5–25µm in radius) is levitated in an20
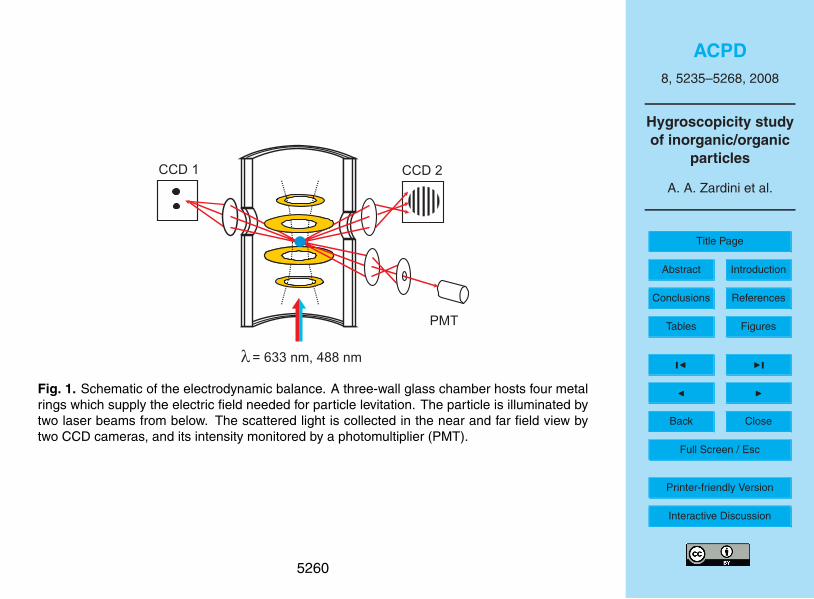
electrodynamic balance (Davis et al., 1990), see a schematic of the setup in Fig. 1.The balance is hosted within a three wall glass chamber with a cooling agent flowingbetween the inner walls and an insulation vacuum between the outer walls. A constantflow (typically 30 sccm) of an N2/H2O mixture with a controlled H2O partial pressureis pumped continuously through the chamber at a constant total pressure adjustable25
between 200 and 1000 mbar.
5238
ACPD8, 5235–5268, 2008
Hygroscopicity studyof inorganic/organic
particles
A. A. Zardini et al.
Title Page
Abstract Introduction
Conclusions References
Tables Figures
J I
J I
Back Close
Full Screen / Esc
Printer-friendly Version
Interactive Discussion
The temperature can be varied between 330 K and 160 K with a precision better than0.1 K and an accuracy of ±0.5 K. The relative humidity (RH) in the chamber is set byadjusting the N2/H2O ratio, using automatic mass flow controllers. The relative humidityis registered by a capacitive thin film sensor that is mounted in close vicinity (<10 mm)of the levitated particle. The sensor was calibrated directly in the electrodynamic bal-5
ance using the deliquescence relative humidity of different salts. Its accuracy is ±1.5%RH between 10% and 90% RH.
A single-particle generator (Hewlett-Packard 51633A ink jet cartridge) is used toinject a liquid particle from solutions prepared by mass percent with MilliQ waterusing an analytical balance and analytical grade reagents with purities of 99% or10
higher. Two collinear laser beams illuminate the particle from below (HeNe@633 nm,Ar+@488 nm).
To characterize the particle three different, independent methods are employed.First, we use the video image of the particle on CCD detector 1 and an automatic feed-back loop to adjust the DC-voltage for compensating the gravitational force (Richard-15
son, 1990). A change in DC voltage is therefore a direct measure of the mass change,allowing to calculate a radius change when the density of the particle is known or canbe estimated.
Second, the two-dimensional angular scattering pattern is recorded with CCD de-tector 2 by measuring the elastically scattered light from both lasers over observation20
angles ranging from 78◦ to 101◦. If the particle is liquid, and therefore of sphericalshape, the scattering pattern is regular, with the mean distance between fringes beinga good measure of the radius of the particle, almost independent of its refractive index(Davis and Periasamy, 1985).
Third, we use a photomultiplier with a relatively small conical detection angle (ap-25
proximately 0.2◦ half angle) to measure the scattering intensity at 90◦ to the incidentbeam, and feeding this signal to an analog lock-in amplifier (Stanford Research Systemmodel SR510) to measure the intensity fluctuations at the frequency of the AC fieldof the electrodynamic trap (with a 10 Hz ENBW). This yields the root mean squared
5239
ACPD8, 5235–5268, 2008
Hygroscopicity studyof inorganic/organic
particles
A. A. Zardini et al.
Title Page
Abstract Introduction
Conclusions References
Tables Figures
J I
J I
Back Close
Full Screen / Esc
Printer-friendly Version
Interactive Discussion
deviation (RMSD) from the intensity mean of the scattered intensity, which can be as-sociated with the particle morphology: low values for spherical homogeneous particleand high values for crystalline shape (see Videen, 1997, and Krieger and Braun, 2001,for details).
2.2 Hygroscopicity tandem differential mobility analyzer5
The HTDMA was used to determine the hygroscopic growth, i.e., the change of aerosolparticles diameter due to the uptake of water. The experimental set up has been fullydescribed before (Weingartner et al., 2002; Gysel et al., 2004; Sjogren et al., 2007).The compounds were dissolved in MilliQ water (typically 0.1–1 g/L) and all solute ap-peared completely dissolved at visual inspection. The particles were generated using10
an atomizer (TSI 3076) operated with purified compressed air. It is assumed that theresulting aerosol was internally mixed with the same mass ratio as in the solution as nobroadening of the growth factor distributions from the HTDMA could be detected whileswitching from the pure ammonium sulfate to the mixtures. The particles first entereda silica gel diffusion dryer (flow rate: 300 sccm) in order to dry the sample to RH<10%15
at 298 K. The dry aerosol is subsequently brought to charge equilibrium using a bipolardiffusion charger (85Kr) and then fed into the first differential mobility analyzer (DMA),where a narrow size cut of the dry aerosol (D0=100 nm) is selected. The particle diam-eter resulting after equilibration at a well defined higher RH (20 to 25 s residence time)is then measured using a second DMA and a condensation particle counter (CPC;20
TSI CPC 3022A). The exact D0 is determined by keeping the particles exposed todry conditions (RH≤10%), in which case no size change occurs. With this apparatus,hygroscopic growth of particles with diameters between 20 and 250 nm can be deter-mined in the temperature range of 253–303 K and humidity range of 10% to 95% RHwith an accuracy of ∆T=±0.1 K and ∆RH=±1.5% at 95% RH. The hygroscopic growth25
factor is determined with a precision of ±0.01 (at D0) and ±0.03 (at RH=80%) (Sjogrenet al., 2007).
Since the initial particle size selected with the HTDMA is D=100 nm, the Kelvin effect5240
ACPD8, 5235–5268, 2008
Hygroscopicity studyof inorganic/organic
particles
A. A. Zardini et al.
Title Page
Abstract Introduction
Conclusions References
Tables Figures
J I
J I
Back Close
Full Screen / Esc
Printer-friendly Version
Interactive Discussion
plays a role in limiting the water uptake due to high curvature of smaller droplets. Forsolution droplets with surface tension of pure water the growth factors measured withthe HTDMA are therefore expected to be 1–2% lower than those calulated with theEDB and bulk samples. No correction for this effect was applied.
2.3 Method5
During our measurements, particles are exposed to hygroscopicity cycles with relativehumidities increasing from RH≈10% to RH≈85% and again decreasing (at a typicalrate dRH/dt≈10%/h for the EDB), while pressure and temperature are kept constantat T≈291 K and P≈600 torr for the EDB, T≈292 K and atmospheric pressure for theHTDMA.10
Particle mass (for the EDB) and mobility diameter (for the HTDMA) are monitoredand the results are presented in so-called humidograms, where the mass growth factorg is plotted versus RH. In order to do so, the size change measured with the HTDMAis converted to a mass change via
g(RH)=m(RH)m0
=1 +(G3(RH) − 1
) ρw
ρ0, (1)15
where m(RH) is the mass of the particle depending on relative humidity, m0 and ρ0are the initial particle mass and density at dry conditions, ρw is the density of water,and G=D/D0 is the size growth factor. This equation assumes that the density of thesample is linearly dependent on the volume mixing ratio of the solute and the absorbedwater (i.e. that the volume occupied by a single solute molecule is independent from20
the presence of the water molecules). It is further assumed that the measured mobilitydiameter is equal to the volume equivalent diameter, which is the case for a dropletwith elevated water content, but might not be fulfilled for non-spherical dry particlesdue to dynamic shape factors being different from 1.0. As no significant deviations fromsphericity at dry conditions were observed, the use of the above equation is justified.25
5241

ACPD8, 5235–5268, 2008
Hygroscopicity studyof inorganic/organic
particles
A. A. Zardini et al.
Title Page
Abstract Introduction
Conclusions References
Tables Figures
J I
J I
Back Close
Full Screen / Esc
Printer-friendly Version
Interactive Discussion
The EDB technique measures relative mass changes as explained in the experimen-tal section. Therefore, it is necessary to identify a reference state to calculate the massgrowth factor. One option can be the choice of the voltage at very dry conditions, typ-ically RH=10%, as normalizing factor, in which case g(10%)=1. However, it is oftendifficult to assure that at a low RH the particle is completely free of water (Peng et al.,5
2001). In the present work, following previous hygroscopicity studies (e.g. Choi andChan, 2002), we measured the water activity of the compounds listed in Table 1 andtheir mixtures in various concentrations using the AquaLab water activity meter (Model3TE, Decagon Devices). The EDB voltage was then normalized to match the bulk dataat RH≈80%.10
For two-component particles as the ones studied in this paper, the Zdanovskii-Stokes-Robinson (ZSR) relation (Zdanovskii, 1948; Stokes and Robinson, 1966) canbe simply written as:
g(RH)=g1(RH)w1 + g2(RH)w2, (2)
where g is the total mass growth factor of the two-component particle as a func-15
tion of relative humidity, g1 is the ammonium sulfate mass growth factor calculatedwith the thermodynamic model proposed by Clegg et al. (1998) (available at: http://mae.ucdavis.edu/wexler/aim.htm/), g2 is the mass growth factor of pure organic parti-cles measured with the EDB, and w1 and w2 are the mass fractions of the two compo-nents in the dry particle. The ZSR relation assumes independent (i.e. linearly additive)20
hygroscopic behavior of the different components in the mixed particle.
3 Results
3.1 Ammonium sulfate and citric acid (AS/CA)
Hygroscopicity measurements of particles made of pure ammonium sulfate, pure citricacid, and mixtures of the two with different mixing ratios (AS:CA=4:1, 2:1, 1:1 mo-25
5242

ACPD8, 5235–5268, 2008
Hygroscopicity studyof inorganic/organic
particles
A. A. Zardini et al.
Title Page
Abstract Introduction
Conclusions References
Tables Figures
J I
J I
Back Close
Full Screen / Esc
Printer-friendly Version
Interactive Discussion
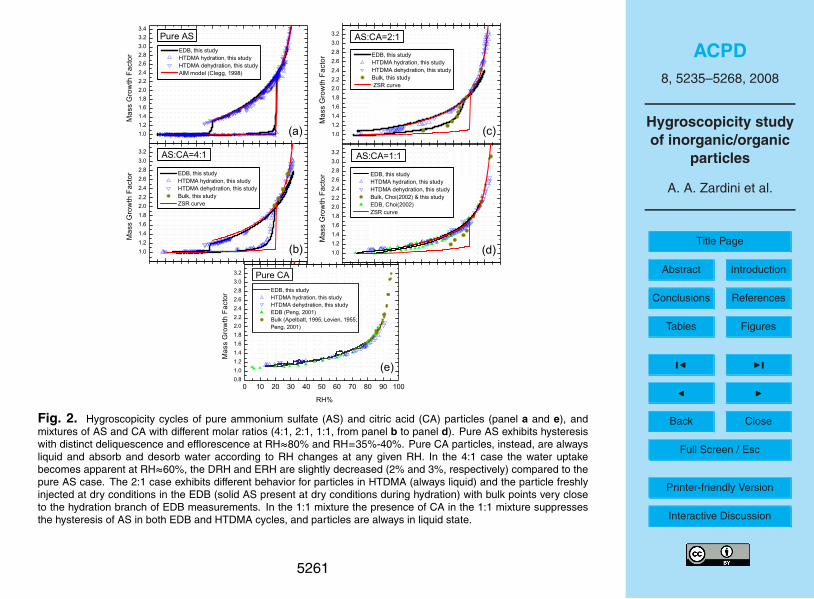
lar ratios) are performed with the EDB and HTDMA. The results are compared withliterature, bulk data and ZSR predictions in Fig. 2.
The uppermost panel shows the humidogram of pure ammonium sulfate particlesat ambient temperature. The hygroscopicity of a pure ammonium sulfate particle iswell known: solid ammonium sulfate exposed to increasing RH initially does not take5
up water until it exhibits discontinuity at RH≈80%, the thermodynamically determineddeliquescence relative humidity (DRH), where the crystalline to liquid phase transitionoccurs. After deliquescence, the particle takes up or releases water gradually uponRH changes without undergoing a phase change at the DRH. Rather, it remains in asupersaturated metastable state at intermediate RH and recrystallizes only at relative10
humidities below RH=35%–40% The latter is termed efflorescence relative humidity(ERH), although it is kinetically determined, depending on a nucleation event and there-fore not corresponding to a fixed value. The measured growth factors are in agreementwith the thermodynamic model by Clegg et al. (1998) (see Fig. 2).
In contrast, pure citric acid particles are always in liquid state during our experiments15
as shown in the lowermost panel of Fig. 2: they take up or release water graduallywithout phase changes in the whole range of relative humidities studied here. EDBand HTDMA measurements of this study are in reasonable agreement with EDB andbulk measurements of previous studies (Levien, 1955; Apelblat et al., 1995; Peng et al.,2001). Note that citric acid retains some water even at low RH (g > 1 for RH≈10%).20
Our pure citric acid cycles measured with the EDB together with bulk points werefitted to obtain the following parametrization for the pure citric acid growth factor:g2(RH)=1.27774 –5.705 RH +41.8 RH2 –143.806 RH3 +256.938 RH4 –227.958 RH5
+79.7803 RH6 for RH between 10% and 90%. This formula is used in Eq. 2 to calcu-late the ZSR predictions for the mixtures. In the AS:CA=4:1 case, panel (b) of Fig. 2,25
the particles start to take up water well before the full deliquescence of AS at RH≈80%.After passing the 80% RH, the particles are in fully liquid state and absorb or desorbwater according to RH changes until AS effloresces at ERH around 35% (HTDMA) or38% (EDB). The red line results from the ZSR calculations as in Eq. 2, assuming full
5243
ACPD8, 5235–5268, 2008
Hygroscopicity studyof inorganic/organic
particles
A. A. Zardini et al.
Title Page
Abstract Introduction
Conclusions References
Tables Figures
J I
J I
Back Close
Full Screen / Esc
Printer-friendly Version
Interactive Discussion
dissolution of the components for the dehydration branch, and no dissolution of AS upto its deliquescence point for the hydration branch. This underestimates the measuredwater uptake during hydration, indicating that in fact also AS starts dissolving beforefull deliquescence and takes up some water. For the dehydration branch, results fromboth techniques, EDB and HTDMA, are in agreement with the ZSR prediction (within5
10%).Panel (c) of Fig. 2 shows the hygroscopicity cycle of AS/CA particles, 2:1 mixture.
Here the measurements from EDB and HTDMA differ: the single particle in the EDBexhibits clearly separated hydration/dehydration branches, while the HTDMA does not.After injection of the particle into the EDB, a solid inclusion forms and dissolves com-10
pletely at RH≈76% during moistening. The water uptake before full dissolution is con-sistent with the measured water activity of the correspondent bulk solution and indicatethe capability of a hydrophylic organic to lower the deliquescence point of ammoniumsulfate. Upon subsequent drying the particle remains liquid and it cannot be forced toeffloresce even at RH as low as 10%.15
The presence of a solid inclusion, its deliquescence and the absence of efflores-cence are confirmed by the light fluctuation and radius signals in the uppermost andmiddle panels of Fig. 3: at the beginning of the hygroscopicity cycle the RMSD dat-apoints are typical of a liquid particle with a solid inclusion and decrease to valuestypical of a homogeneous, spherical particle (i.e., liquid) at t=20 ks. Also, the algo-20
rithm for calculating the particle radius works properly after t=20 ks, providing indirectevidence for spherical shape with a homogeneous particle phase. Nevertheless, evenbefore t=20 ks the radius datapoints provide a rough estimate of the radius (increasingmonotoneously from r≈4.2µm at t=0 s to r≈4.6µm at t=20 ks), indicating an almostspherical, but non-homogeneous particle taking up water with increasing RH.25
The physical reason for partial efflorescence only occurring at initial particle injectioninto the trap is not clear. The crystallization must be attributed to the ammonium sul-fate fraction (since citric acid is always in liquid state in our experiments) and it could bea consequence of the precipitous evaporation experienced by the particle immediately
5244
ACPD8, 5235–5268, 2008
Hygroscopicity studyof inorganic/organic
particles
A. A. Zardini et al.
Title Page
Abstract Introduction
Conclusions References
Tables Figures
J I
J I
Back Close
Full Screen / Esc
Printer-friendly Version
Interactive Discussion
after injection into the EDB. In fact, the liquid droplet of about 50µm diameter producedby the injection device shrinks suddenly (few ms) to the particle size in thermodynamicequilibrium (radius ≈5µm) with ambient conditions. The fast evaporation must induce acooling of the particle and a strong, rapidly changing concentration gradient within theparticle which in turn could be responsible for the AS crystallization. The reproducibility5
of partial efflorescence of the particle upon injection but not in subsequent hygroscop-icity cycles was tested and confirmed by several injections in the EDB. The particlesin the HTDMA, instead, are always liquid and gradually absorb or desorb water at anygiven RH.
Panel (d) of Fig. 2 shows the hygroscopicity cycle of AS/CA, 1:1 molar ratio. No efflo-10
rescence/deliquescence occurrence is detected with either technique, i.e., the particlesremain liquid and gradually absorb/desorb water. EDB and HTDMA measurementsagree with literature data and with the ZSR curve.
To summarize, the hygroscopicity of the two-component system ammonium sul-fate/citric acid is characterized by a distinct, reduced, and completely absent hysteresis15
when decreasing the molar mixing ratio from 4:1 via 2:1 to 1:1. In the 2:1 case bothDRH and ERH are reduced, the ERH potentially to such an extent that crystallizationdoes not occur at the lowest RH reached in the HTDMA and the EDB, but only occursfor initial particle injection into the EDB. For the dehydration branches of the fully liquidparticles, EDB and HTDMA measurements are in good agreement and the ZSR ap-20
proach provides a suitable description. For the hydration branches, the ZSR approachassuming no dissolution of AS before full deliquescence underestimates the observedwater uptake, indicating that AS dissolves partially in aqueous citric acid at low RH.
3.2 Ammonium sulfate and glutaric acid (AS/GA)
Hygroscopicity cycles of pure glutaric acid and mixed ammonium sulfate/glutaric acid25
(AS:GA=1:1 molar ratio) particles were performed with the EDB. HTDMA cycles werealso measured, but they are not shown because no reliable results could be achieveddue to substantial evaporative shrinking of the particles within the instrument. Such
5245
ACPD8, 5235–5268, 2008
Hygroscopicity studyof inorganic/organic
particles
A. A. Zardini et al.
Title Page
Abstract Introduction
Conclusions References
Tables Figures
J I
J I
Back Close
Full Screen / Esc
Printer-friendly Version
Interactive Discussion
evaporation artifacts in HTDMA instruments have previously been reported by Prenniet al. (2003), as well as Cruz and Pandis (2000) for submicrometer size glutaric acidparticles.
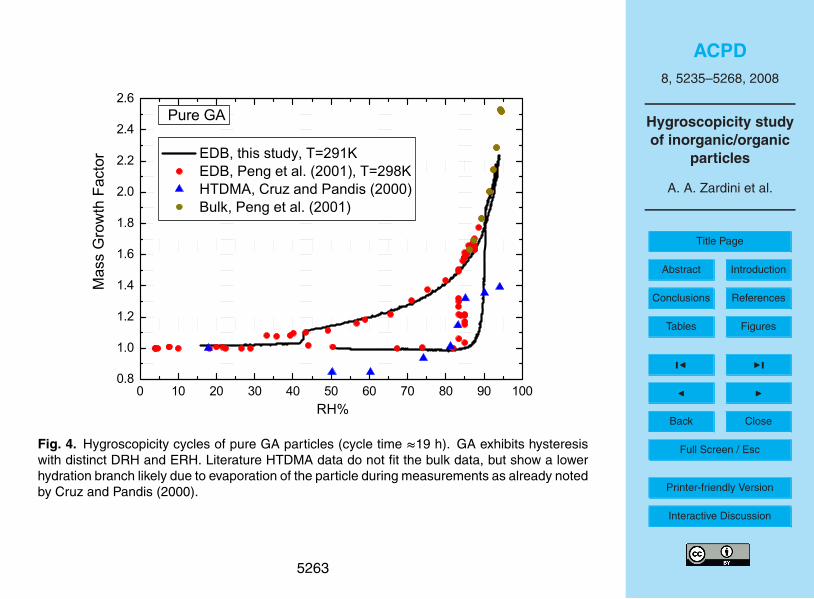
Pure glutaric acid exhibits hysteresis with distinct deliquescence and efflorescenceas shown in Fig. 4. The DRH of glutaric acid has been determined by several groups:5
Brooks et al. (2002): DRH=87.5%; Wise et al. (2003): DRH=88.9%; Marcolli etal. (2004) DRH=88.2% (all bulk measurements at 298 K). Pant et al. (2004) foundDRH≈89% by using a reflected-light microscope technique. In this study we findDRH≈90%, a slightly higher value likely due to the temperature dependence of glutaricacid DRH: unlike ammonium sulfate, the solubility of glutaric acid is strongly tempera-10
ture dependent.HTDMA data from Cruz and Pandis (2000) strongly underestimate the amount of
water uptake at deliquescence (DRH≈85%). In addition, a size decrease at RH≈50%possibly caused by structural rearrangements inside the particle or shrinking due toevaporation was observed. The DRH determined with EDB at 298 K by Peng et al.15
(2001) is 83.5%≤DRH≤85%. A reason for this lower value might be the presence ofimpurities in the glutaric acid used for their experiment.
In contrast, the efflorescence behavior is characterized by a low degree of repro-ducibility. The EDB cycles in Fig. 4, indicate efflorescence at RH≈43% (this study) andbetween 29% and 33% (Peng et al., 2001). However, during consecutive cycles that we20
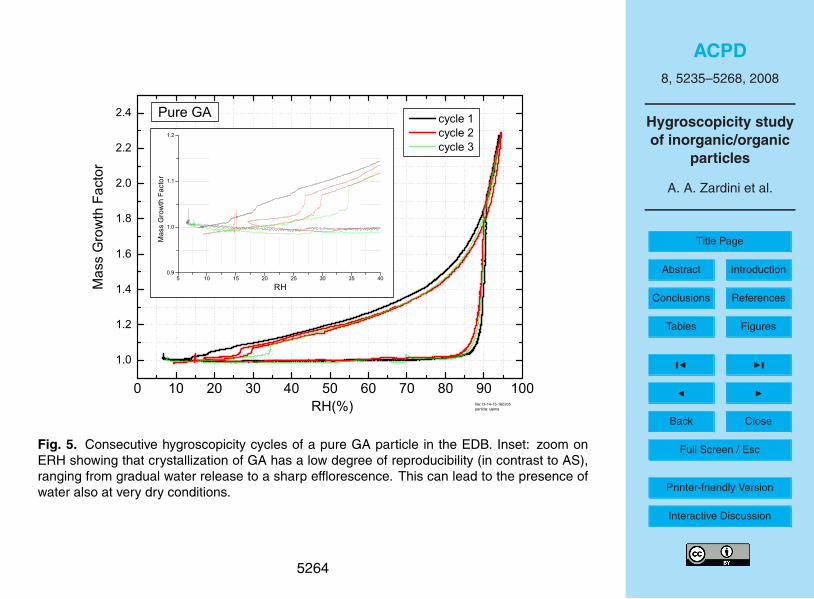
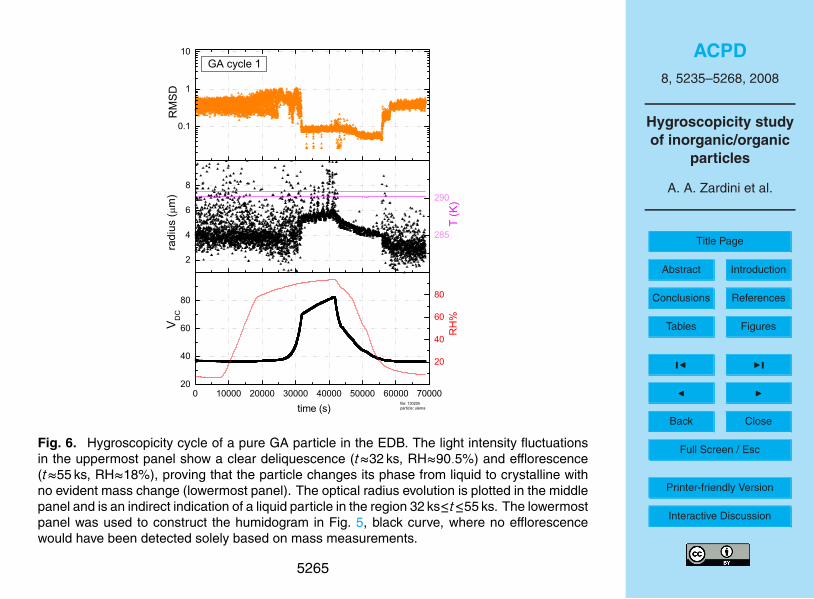
performed with another particle shown in Fig. 5, efflorescence occurred at RH between25% and 35% as a multi-step process, with a first mass decrease and a subsequentgradual water release (red and green curves), or as a gradual water release (blackcurve). In contrast, the analysis of scattered light fluctuations reveals that the phasechange from liquid to solid is a well defined efflorescence: during each cycle the par-25
ticle solidifies at a well defined RH as indicated in Fig. 6, where the experimental rawdata corresponding to the black curve in Fig. 5 are plotted. It is evident from the RMSDdata (uppermost panel) that the particle undergoes two phase changes, one from solidto liquid at t≈32 ks (RH≈90.5%), and one from liquid to solid at t≈55 ks (RH≈18%).
5246
ACPD8, 5235–5268, 2008
Hygroscopicity studyof inorganic/organic
particles
A. A. Zardini et al.
Title Page
Abstract Introduction
Conclusions References
Tables Figures
J I
J I
Back Close
Full Screen / Esc
Printer-friendly Version
Interactive Discussion
This reveals the physicochemical behavior of glutaric acid to be very complex and morethan one experimental technique has to be invoked to fully characterize it.
Figure 7 shows a complete hygroscopicity cycle of an ammonium sulfate/glutaricacid particle with 1:1 molar ratio of the mixture together with results from literature. Theparticle is completely crystalline and does not take up water until it fully deliquesces5
at DRH≈77.5%, while the efflorescence occurs at ERH≈32%. The molar ratio chosenis very close to the eutonic composition of the ammonium sulfate/glutaric acid solution(see Pant et al., 2004), thus resulting in a single step and well defined deliquescence.Our work and that from Choi and Chan (2002) show a lower water uptake than ZSRpredictions in the metastable region at dry conditions, while the growth factor at DRH10
matches the ZSR curve perfectly. Pant et al. (2004) investigated in detail the DRHand ERH occurrence for the AS/GA system. For the AS:GA=1:1 mixture they foundDRH≈78% and ERH≈28%, while DRH=76.7% was observed in bulk measurementsby Wise et al. (2003). These results are in good agreement with ours.
3.3 Ammonium sulfate and adipic acid (AS/AA)15
Pure adipic acid particles remain crystalline and do not deliquesce at relative humiditiesup to 99%, therefore adipic acid is generally regarded as an inert aerosol component(Sjogren et al., 2007; Hameri et al., 2002). We already presented hygroscopic mea-surements of mixed ammonium sulfate/adipic acid particles in Sjogren et al. (2007). Inthat study the kinetics and morphology of the system was investigated: we proposed20
that adipic acid, when present in major fractions stays always in solid state, as verifiedwith light fluctuation measurements in the EDB, encapsulating some of the inorganicspecies residing in the crystalline organic veins and pores.
The water uptake rate of the inorganic solution is then probably limited by solid phasediffusion (water through solid adipic acid). The conclusion was that sufficient residence25
time in the HTDMA is required for such systems to equilibrate, or measurements willbe misleading.
Here we report on two cases of mixed AS/AA particles consisting mostly of am-5247
ACPD8, 5235–5268, 2008
Hygroscopicity studyof inorganic/organic
particles
A. A. Zardini et al.
Title Page
Abstract Introduction
Conclusions References
Tables Figures
J I
J I
Back Close
Full Screen / Esc
Printer-friendly Version
Interactive Discussion
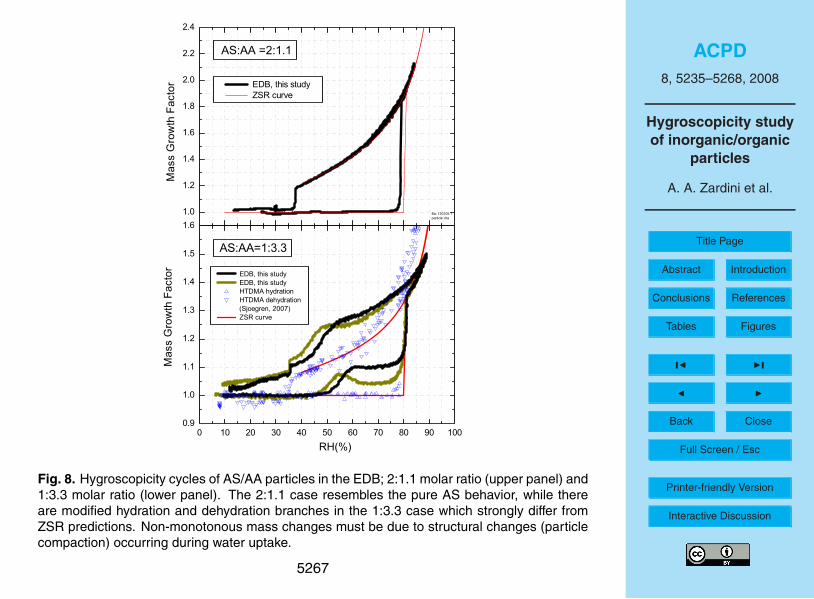
monium sulfate (AS:AA=2:1.1, molar ratio) or adipic acid (AS:AA=1:3.3, molar ratio),see Fig. 8. The 2:1.1 case (upper panel) resembles the behavior of pure ammoniumsulfate of Fig. 2, uppermost panel, except for the lower growth factors in the dehy-dration branch due to the presence of the inert adipic acid, in agreement with ZSRpredictions. However, in the 1:3.3 case (lower panel) the hygroscopic cycle strongly5
differs from the ZSR prediction in both hydration and dehydration branches of the EDBmeasurements. A pre-deliquescence water uptake starting at RH≈45% is followed byfull deliquescence of ammonium sulfate at RH≈80%. Upon dehydration, more waterthan predicted by the ZSR approach is retained by the particle until the efflorescenceof ammonium sulfate occurs at RH≈35%. The pre-deliquescence water uptake is not10
detected by the HTDMA (blue triangles in lower panel of Fig. 8), indicating no changein total particle volume and suggesting that the water must be taken up in the complexparticle inner structure as a consequence of Kelvin effect on concave surfaces. In par-ticular, the dark yellow curve in the lower panel indicates a pre-deliquescence wateruptake which is followed by a water loss despite growing RH - presumably due to the15
collapse of some pores and veins after partial dissolution of ammonium sulfate lead-ing to larger pore diameters and a decreased Kelvin effect. This morphology changewould cause part of the water taken up during pre-deliquescence to be released againby the particle. Consecutive cycles made on several particles reproducibly show sucha complex pre-deliquescence behavior of varying magnitude with water uptakes of 3–20
19% in mass starting at RH between 43% and 53%. Table 2 summarizes the EDBmeasurements for the AS:AA=1:3.3 system.
We think that the reproducibly varying pre-deliquescence and deliquescence are aconsequence of the complex morphology of the adipic acid matrix possessing veinsand pores that enhance water uptake and enclosures that reduce it. Also, the RH at25
full deliquescence, which shows a variability slightly above the measurement error, maybe influenced by the particle morphology (see detailed explanation in the discussionsection). None of the other investigated particles displays such a behavior.
We investigated whether the pre-deliquescence is a reversible process with respect
5248
ACPD8, 5235–5268, 2008
Hygroscopicity studyof inorganic/organic
particles
A. A. Zardini et al.
Title Page
Abstract Introduction
Conclusions References
Tables Figures
J I
J I
Back Close
Full Screen / Esc
Printer-friendly Version
Interactive Discussion
to relative humidity changes. Figure 9 shows the temporal evolution of two consecutiveincomplete cycles where RH, starting from less than 10%, is increased to 70% andthen lowered again to reach very dry ambient conditions. The scattered light intensityfluctuations (RMSD, orange symbols) are in opposite phase with the mass changes,indicating that the shape of the particle is getting more spherical while mass and RH5
are increasing (black and red curves). RMSD values are typical of crystalline particlesduring the whole experiment. This is consistent with a water uptake which fills the poresof the solid particle because of the Kelvin effect on concave surfaces, conferring a morespherical shape and possibly a more homogeneous refractive index. By decreasing therelative humidity, the water evaporates, pores and cavities are depleted of water and10
the particle turns back to a more irregular crystalline shape. The process is hencereversible with respect to relative humidity changes.
4 Discussion
We have studied three two-component inorganic/organic systems representing threedistinct physical states that also occur in atmospheric aerosols:15
– Liquid particles;
– Liquid/Solid particles;
– Solid particles.
In this study liquid particles appeared to remain always homogeneously mixed(i.e. liquid-liquid phase separations were not observed). The EDB experiments indi-20
cate that mixed phase particles, with liquid and solid phases, contain a conglomerateof nanocrystals with irregular shapes, with cracks, pores and veins. These pores andveins between the crystals fill with aqueous solution, depending on relative humidity.The water uptake in such pores and veins is enhanced compared to the one of a flatsurface or the convex particle surface (Camuffo, 1998). As we argued in Sjogren et al.25
5249
ACPD8, 5235–5268, 2008
Hygroscopicity studyof inorganic/organic
particles
A. A. Zardini et al.
Title Page
Abstract Introduction
Conclusions References
Tables Figures
J I
J I
Back Close
Full Screen / Esc
Printer-friendly Version
Interactive Discussion
(2007), the enhancement depends on the vein diameter, determining the concavity ofthe liquid surface at the opening of the vein, and results in a Kelvin effect that is inversecompared to that of a convex liquid droplet.
The ambient relative humidity in equilibrium with a micropore of radius r filled withaqueous solution has been calculated by Thomson, later Lord Kelvin (Thomson, 1871):5
RH(r)=aw exp(−
2σVmrRT
), (3)
where aw is the water activity (required when applying the equation to aqueous solu-tions), σ is the surface tension of the solution, Vm is the molar volume of water and Rthe gas constant. The same effect may lead to water uptake prior to deliquescencealso for solid particles consisting of conglomerates of nanocrystals. Below, we will dis-10
cuss the hygroscopicity of the different phase states for the systems investigated thisstudy.
4.1 Liquid
When both components of the particle are in the liquid state, the hygroscopicity can beadequately explained by the ZSR approach. The water uptake of the particle is the sum15
of the water uptakes of the single components. Our EDB and HTDMA measurementsagree with the ZSR predictions and with bulk measurements (see AS:CA=4:1, 2:1, 1:1,and AS:GA=2:1 cycles in Fig. 2, dehydration branches). Applicability of ZSR suggeststhat the hygroscopic behavior of the different components in the mixed particle mayindeed assumed to be linearly additive.20
4.2 Solid/liquid
For the mixed phase cases of AS:CA=4:1 and AS:CA=2:1 (see Fig. 2, hydrationbranches), with AS being the solid phase, we do not know the detailed compositionof the solution in the particle during the hydration before the deliquescence of AS.
5250
ACPD8, 5235–5268, 2008
Hygroscopicity studyof inorganic/organic
particles
A. A. Zardini et al.
Title Page
Abstract Introduction
Conclusions References
Tables Figures
J I
J I
Back Close
Full Screen / Esc
Printer-friendly Version
Interactive Discussion
Hence, the ZSR approach can not be applied without further assumptions. Applicationof ZSR with the assumption that AS is present as an inert mass before it deliquesces(being CA the only responsible for water uptake) underestimates the observed wateruptake for AS/CA mixtures. We therefore conclude that AS must be partially dissolvedin aqueous citric acid and contributes to water uptake. For the AS:CA 2:1 case, the5
water uptake before full deliquescence as observed in the EDB is in agreement withbulk data, indicating that morphology effects are minor in this system. In a similar study,Marcolli and Krieger (2006) observed higher water uptake than the bulk measurementsfor the system AS/PEG400 (solid AS, liquid organic).
The system AS:AA=1:3.3 can be regarded as an extreme case showing discrep-10
ancies from ZSR predictions both in the hydration and dehydration branches. In thedehydration branch (solid AA, liquid AS) more water is present than expected by theZSR predictions. We already explored the possibility that this higher water uptake isdue to morphological effects in Sjogren et al. (2007): The Kelvin effect leads to en-hanced water uptake during and after full deliquescence. During this process the veins15
and cavities swell to accommodate the excess water leading to a gradual decrease ofthe Kelvin effect. Depending on the morphology of the individual particle a part of ASmay be enclosed in the AA matrix. This part is only accessible to hygroscopic growthby solid state diffusion of water through the AA matrix. In our experiments enclosed ASwill lead to a smaller growth factor compared to the one expected from thermodynam-20
ics. Therefore, morphology effects may lead to an enhanced or reduced water uptake.This may also explain the scatter of growth factors shown in Table 2.
Upon drying the swollen veins start shrinking and water is released by the particleuntil the mechanical resistance against further shrinkage leads to the cavities deple-tion because the Kelvin effect can no longer be sustained; the mass growth factor25
decreases to values closer to the one of the ZSR prediction at this RH. Efflorescencemay occur by heterogeneous nucleation on the surface of AA at any RH below DRH,either in a series of small steps, or in one or few bigger decreases in mass growthfactor as indicated in Table 2.
5251
ACPD8, 5235–5268, 2008
Hygroscopicity studyof inorganic/organic
particles
A. A. Zardini et al.
Title Page
Abstract Introduction
Conclusions References
Tables Figures
J I
J I
Back Close
Full Screen / Esc
Printer-friendly Version
Interactive Discussion
4.3 Solid
The solid/solid case is realized for the AS/GA system, which shows no water uptakebefore deliquescence. In contrast, the hydration branch of the AS:AA=1:3.3 mixtureexhibits a pre-deliquescence water uptake below the DRH of an AS/AA mixture in theeutonic composition. We attribute this process to morphology effects. In short, there is5
evidence that the particle behaves like a sponge with partly elastic and partly inelasticproperties, taking up the water in various degrees of reversibility. The subsequentparagraphs provide some rough quantitative estimates illuminating the nature of theseparticles.
For an average RH≈53% between the onset and the maximum of the pre-10
deliquescence, Eq. 3 yields a vein radius of r=2.6 nm, if we use for σ the value ofpure water (σ=72.2 Jm−2 at T=290 K), and when we assume that aw=0.8 for a so-lution inside the veins. A value of aw=0.8 corresponds to the water activity of bulkaqueous AS in equilibrium with the crystalline phase, below this value no dissolutionis expected. The average growth factor prior to deliquescence is g≈1.1 as shown in15
Table 2. The total vein length follows simply from the formula for a cylindrical volumeand from the density definition: lv=mv/(ρvπr
2v ), where mv is the mass and ρv is the
density of the aqueous solution in the vein taken from Semmler et al. (2006).The optical radius of the particle in the EDB can not be exactly calculated for this
particular system because the particle is always non-spherical. Nevertheless, a rough20
estimate of r≈3µm can be inferred from the spread radius datapoints like those shownin the middle panel of Fig. 3 before deliquescence. The particle density averaged fromthe densities of crystalline AS and AA is ρ=1.464 g/cm3; the absolute mass of theparticle and hence of the water uptake, can then easily be calculated considering the10% relative mass increase estimate. The assumption that the veins are filled with a25
saturated AS solution results in a vein length of lv=110 cm which, compared with a3µm particle size, has to be taken as evidence for a highly porous morphology of theparticle required to accommodate the water.
5252
ACPD8, 5235–5268, 2008
Hygroscopicity studyof inorganic/organic
particles
A. A. Zardini et al.
Title Page
Abstract Introduction
Conclusions References
Tables Figures
J I
J I
Back Close
Full Screen / Esc
Printer-friendly Version
Interactive Discussion
Following Price (2000), we model the conglomerates of nanocrystals as consist-ing of grains of semiregular truncated octahedra of diameter (between square faces)D. The volume of a grain is D3/2; the grain has 36 edges, each of length
√2D/4
and shared with three other grains. The total fractional volume (f ) in veins is thenf=(6π
√2)(rvein/D)2. The fractional volume is calculated by dividing the fractional mass5
of the aqueous solution by its density. A mass growth factor of 1.1 as observed corre-sponds to a fractional volume of a saturated aqueous AS solution of 0.16. This yieldsa grain diameter of 34 nm for veins with 2.6 nm radius. This compares well with grainsizes observed in SEM images of dry AS/AA mixtures (Sjogren et al., 2007).
The thermodynamics of the AS/AA system together with the morphology described10
above leads to a consistent view of the hygroscopic cycles as shown in Fig. 8 andTable 2. During moistening, the particle takes up water into the veins at about 53%RH, without changing the vein size. Subsequently, the vein system may partly collapseleading to water release. At the deliquescence RH the AS dissolves and the veinsswell. In comparison to ZSR predictions the water uptake is enhanced, depending on15
the radius of the veins. This effect becomes smaller the more water is taken up athigher RH. A decreased water uptake compared to ZSR is observed when a fraction ofthe AS is completely enclosed in the AA matrix. Upon drying water is released and thevein radii shrink again leading to a stronger Kelvin effect. This results in an increasingdeviation from the ZSR prediction for the metastable aqueous solution. AS appears20
to effloresce at any given RH below the DRH either in small compartments of the AAmatrix separately leading to a series of small steps in the humidogram, or in one largerstep if the veins are interconnected.
5 Conclusions
This combined study aimed at shedding more light on the thermodynamic characteri-25
zation of mixed inorganic/organic aerosol particles by means of two widely used tech-niques: the electrodynamic balance and the hygroscopicity tandem differential mobility
5253
ACPD8, 5235–5268, 2008
Hygroscopicity studyof inorganic/organic
particles
A. A. Zardini et al.
Title Page
Abstract Introduction
Conclusions References
Tables Figures
J I
J I
Back Close
Full Screen / Esc
Printer-friendly Version
Interactive Discussion
analyzer. We focused on three organic acids of atmospheric relevance (citric, glutaricand adipic acid) in mixtures with an inorganic salt (ammonium sulfate). These organ-ics are representative of three different water uptake characteristics. The results showthat as long as the two-component particles are fully liquid, the Zdanovskii-Stokes-Robinson relation adequately predicts the water uptake (additivity of the water uptake).5
Whereas, in the presence of a solid phase (being it inorganic or organic), bulk thermo-dynamics alone appears to be insufficient to fully characterize the system. This cor-roborates a previous finding that morphology effects play an important role, resulting inwater uptake by two-component particles even at dry ambient conditions. In addition,at higher relative humidities the hygroscopic growth factor may deviate considerably10
from what is expected from bulk thermodynamics.
Acknowledgements. This work was supported by the National Science Foundation Switzerland(grant n◦ 200021-100280).
References
Apelblat, A., Dov, M., Wisniak, J., and Zabicky, J.: Osmotic and Activity Coefficients of15
HO2CCH2C(OH)(CO2H)CH2CO2H (Citric Acid) in Concentrated Aqueous Solutions at Tem-peratures from 298.15 K to 318.15 K, J. Chem. Thermodynamics, 27, 347–353, 1995. 5243
Braban C. F. and Abbatt, J. P. D.: A study of the phase transition behavior of internally mixedammonium sulfate – malonic acid aerosols, Atmos. Chem. Phys., 4, 1451–1459, 2004,http://www.atmos-chem-phys.net/4/1451/2004/. 523720
Brooks, S. D., Wise, M. E., Cushing, M., and Tolbert, M. A.: Deliquescence behavior of or-ganic/ammonium sulfate aerosol, Geophys. Res. Lett., 29(19), 1917, 2002. 5246
Camuffo, D.: Condensation–Evaporation cycles in pore and capillary systems according to theKelvin model, Water, Air, and Soil Pollution, 21, 151–159, 1984. 5249
Chan, C. K., Flagan, R. C., and Seinfeld, J. H.: Water activities of NH4NO3(NH4)2SO4 solu-25
tions. Atmos. Environ., 26, 1661–1673, 1992.Chan, M. N. and Chan, C. K.: Mass transfer effects in hygroscopic measurements of aerosol
5254
ACPD8, 5235–5268, 2008
Hygroscopicity studyof inorganic/organic
particles
A. A. Zardini et al.
Title Page
Abstract Introduction
Conclusions References
Tables Figures
J I
J I
Back Close
Full Screen / Esc
Printer-friendly Version
Interactive Discussion
particles, Atmos. Chem. Phys., 5, 2703–2712, 2005,http://www.atmos-chem-phys.net/5/2703/2005/. 5237
Choi, M. Y. and Chan, C. K.: The Effects of Organic Species on the Hygroscopic Behaviors ofInorganic Aerosols, Environ. Sci. Technol., 36, 11, 2422–2428, 2002. 5237, 5242, 5247
Clegg, S. L., Brimblecombe, P., and Wexler, A. S.: A thermodynamic model of the system H+5
– NH4+ – SO42 – – NO3 – – H2O at tropospheric temperatures, J. Phys. Chem. A, 102,2137–2154, 1998. 5242, 5243
Cruz, C. N. and Pandis, S. N.: Deliquescence and Hygroscopic Growth of Mixed Inorganic-Organic Atmospheric Aerosol, Environ. Sci. Technol., 34(20), 4313–4319, 2000. 5237, 5238,524610
Davis, E. J. and Periasamy, R.: Light-scattering and aerodynamic size measurements for ho-mogeneous and inhomogeneous microspheres, Langmuir, 1, 373–379, 1985. 5239
Davis, E. J., Buehler, M. F., and Ward, T. L.: The double-ring electrodynamic balance for mi-croparticle characterization, Rev. Sci. Instrum., 61, 1281–1288, 1990. 5238
Dick, W. D., Saxena, P., and McMurry, P. H.: Estimation of water uptake by organic compounds15
in submicron aerosols measured during the Southeastern Aerosol and Visibility Study, J.Geophys. Res., 105(D1), 1471–1479, 2000. 5237
Fuzzi, S., Andreae, M. O., Huebert, B. J., Kulmala, M., Bond, T. C., Boy, M., Doherty, S., J.,Guenther, A., Kanakidou, M., Kawamura, K., Kerminen, V M., Lohmann, U., Russell, L. M.,and Poschl, U.: Critical assessment of the current state of scientific knowledge, terminology,20
and research needs concerning the role of organic aerosols in the atmosphere, climate, andglobal change, Atmos. Chem. Phys., 6, 2017–2038, 2006,http://www.atmos-chem-phys.net/6/2017/2006/. 5238
Gysel, M., Weingartner, E., Nyeki, S., Paulsen, D., Baltensperger, U., Galambos, I. et al.:Hygroscopic properties of water-soluble matter and humic-like organics in atmospheric fine25
aerosol, Atmos. Chem. Phys., 4, 35–50, 2004,http://www.atmos-chem-phys.net/4/35/2004/. 5240
Hameri, K., Charlson, R., and Hansson, H. C.: Hygroscopic Properties of Mixed AmmoniumSulfate and Carboxylic Acids Particles, AIChE Journal, 48, 6, 1309–1316, 2002. 5247
Intergovernmental Panel on Climate Change (IPCC): Fourth Assessment Report, Working30
Group I Report “The Physical Science Basis”, Chapter 2, http://www.ipcc.ch/, 2007. 5236Jacobson, M. C., Hansson, H. C., Noone, K. J., and Charlson, R. J.: Organic atmospheric
aerosols: Review and state of science, Rev. Geophys., 38(2), 267–294, 2000.
5255
ACPD8, 5235–5268, 2008
Hygroscopicity studyof inorganic/organic
particles
A. A. Zardini et al.
Title Page
Abstract Introduction
Conclusions References
Tables Figures
J I
J I
Back Close
Full Screen / Esc
Printer-friendly Version
Interactive Discussion
Kanakidou, M., Seinfeld, J H., Pandis, S. N. et al.: Organic aerosol and global climate mod-elling: a review, Atmos. Chem. Phys., 5, 1053–1123, 2005,http://www.atmos-chem-phys.net/5/1053/2005/. 5236
Krieger, U. K, Colberg, A. C., Weers, U., Koop, T., and Peter, Th.: Supercooling of singleH2SO4/H2O aerosols to 158 K: no evidence for the occurrence of the octahydrate, Geophys.5
Res. Lett., 27, 2097–2100, 2000. 5238Krieger, U., K., Braun, C.: Light-scattering intensity fluctuations in single aerosol particles dur-
ing deliquescence, J. Quant. Spectrosc. Radiat. Transfer, 70, 545–554, 2001. 5240Levien, B. J.: A Physicochemical Study of Aqueous Citric Acid Solutions, J. Phys. Chem., 59,
640–644, 1955. 524310
Marcolli, C., and Krieger, U. K.: Phase Changes during Hygroscopic Cycles of Mixed Or-ganic/Inorganic Model Systems of Tropospheric Aerosols, J. Phys. Chem. A., 110, 1881–1893, 2006. 5237, 5251
Marcolli, C., Luo, B., and Peter, T.: Mixing of the organic aerosol fractions: liquids as thethermodynamically stable phases, J. Phys. Chem. A., 108, 2216–2224, 2004. 5237, 524615
Middlebrook, A. M., Murphy, D. M., and Thomson, D. S.: Observations of organic material in in-dividual marine particles at Cape Grim during the First Aerosol Characterization Experiment(ACE 1), J. Geophys. Res., 103(D13), 16 475–16 483, 1998. 5237
Murphy, D. M., Cziczo, D. J., Froyd, K. D., et al.: Single-particle mass spectrometry of tropo-spheric aerosol particles, J. Geophys. Res., 111, D23S32, 2006. 523720
Pant, A., Fok, A., Parson, M. T., Mak J., and Bertram, A. K.: Deliquescence and crystallizationof ammonium sulfate-glutaric acid and sodium chloride-glutaric acid particles, Geophys. Res.Lett, 31, L12111, doi:10.1029/2004GL020025, 2004. 5246, 5247
Peng, C.; Chan, M. N., and Chan, C. K.: The Hygroscopic Properties of Dicarboxylic andMultifunctional Acids: Measurements and UNIFAC Predictions, Environ. Sci. Technol., 35,25
4495–4501, 2001. 5242, 5243, 5246Prenni, A. J., De Mott, P. J., and Kreidenweis, S. M.: Water uptake of internally mixed particles
containing ammonium sulfate and dicarboxylic acids, Atmos. Environ., 37 (30), 4243–4251,2003. 5246
Price, P. B.: A habitat for psychrophiles in deep Antarctic ice, PNAS, 97 (3),1247–1251, 2000.30
Richardson, C. B.: A stabilizer for single microscopic particles in a quadrupole trap, Rev. Sci.Instrum., 61, 1334–1335, 1990. 5253
Rogge, W. F., Mazurek, M. A., Hildemann, L. M., and Cass, G. R.: Quantification of urban or-
5256
ACPD8, 5235–5268, 2008
Hygroscopicity studyof inorganic/organic
particles
A. A. Zardini et al.
Title Page
Abstract Introduction
Conclusions References
Tables Figures
J I
J I
Back Close
Full Screen / Esc
Printer-friendly Version
Interactive Discussion
ganic aerosols at a molecular level: identification, abundance and seasonal variation, Atmos.Environ., 27A, 8, 1309–1330, 1993. 5239
Saxena, P., Hildemann, L. M., McMurry, P. H., and Seinfeld, J. H. J.: Organics alter hygroscopicbehaviour of atmospheric particles, J. Geophys. Res., 100(D9), 18 755–18 770, 1995. 5237
Semmler, M., Luo, B.P., Koop, T.: Densities of liquid H+/NH+4 /SO2−
4 /NO−3 /H2O solutions at tro-5
pospheric temperatures, Atmos. Environ., 40, 467-483, 2006. 5237Sjogren, S., Gysel, M., Weingartner, E., Baltensperger, U., Cubison, M. J., Coe, H., Zardini, A.
A., Marcolli, C., Krieger, U. K., and Peter, T.: Hygroscopic growth and water uptake kinetics oftwo-phase aerosol particles consisting of ammonium sulfate, adipic and humic acid mixtures,J. Aerosol Sci., 38, 157–171, 2007. 525210
Stokes, R. H., and Robinson, R. A.: Interactions in aqueous nonelectrolyte solutions, solute-solvent equilibria, J. Phys. Chem., 70, 7, 2126–2131, 1966. 5237, 5238, 5240, 5247, 5249,5251, 5253
Svenningsson, B., Rissler, J., Swietlicki, E., Mircea, M., Bilde, M., Facchini, M. C., Decesari,S., Fuzzi, S., Zhou, J., Mønster, J., and Rosenørn, T.: Hygroscopic growth and critical super-15
saturations for mixed aerosol particles of inorganic and organic compounds of atmosphericrelevance, Atmos. Chem. Phys., 6, 1937–1952, 2006,http://www.atmos-chem-phys.net/6/1937/2006/. 5237, 5242
Thomson, W.: On the equilibrium of vapour at a curved surface of liquid, Phil. Mag. 42, 448–452, 1871. 523820
Videen G., Pellegrino P., Ngo D., Videen, J., S., Pinnick, R., G.: Light-scattering intensity fluc-tuations in microdroplets containing inclusions. Appl. Opt., 36, 6115–6118, 1997. 5250
Weingartner, E., Gysel, M., and Baltensperger, U.: Hygroscopicity of aerosol particles at lowtemperatures. 1. New low-temperature H-TDMA instrument: Setup and first applications,Env. Sci. Tech., 36, 1, 55–62, 2002. 524025
Wise, M., E., Surratt, J., D., Curtis, D., B., Shilling, J., E., and Tolbert, M., A.: Hygroscopicgrowth of ammonium sulfate/dicarboxylic acids, J. Geophys. Res., 108 (D20), 4638, 2003.5240
Zdanovskii, A. B., Novyi metod rascheta rastvorimostei elektrolitov v mnogokomponentnykh615
sistemakh 1,2, Zh. Fiz. Khim., 22, 1486–1495, 1478–1485, 1948. 5246, 52475237, 5242
5257
ACPD8, 5235–5268, 2008
Hygroscopicity studyof inorganic/organic
particles
A. A. Zardini et al.
Title Page
Abstract Introduction
Conclusions References
Tables Figures
J I
J I
Back Close
Full Screen / Esc
Printer-friendly Version
Interactive Discussion
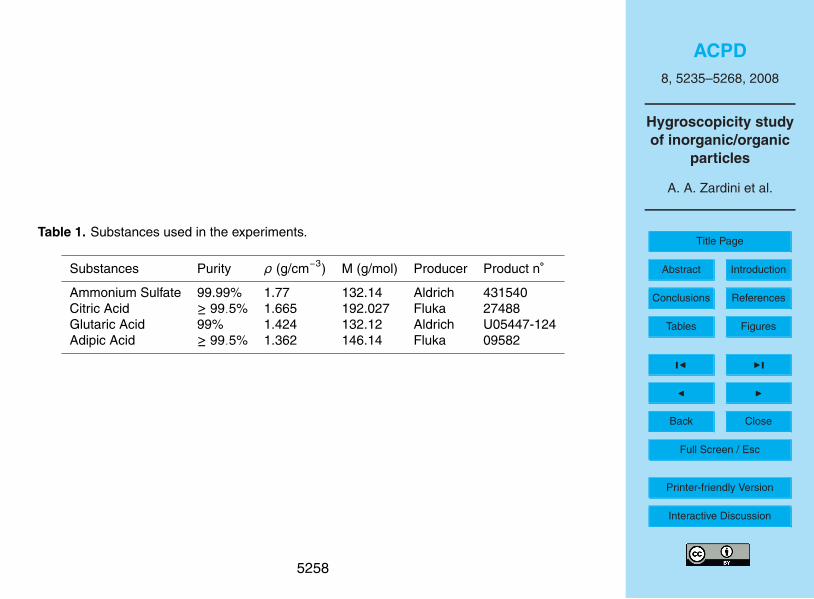
Table 1. Substances used in the experiments.
Substances Purity ρ (g/cm−3) M (g/mol) Producer Product n◦
Ammonium Sulfate 99.99% 1.77 132.14 Aldrich 431540Citric Acid ≥ 99.5% 1.665 192.027 Fluka 27488Glutaric Acid 99% 1.424 132.12 Aldrich U05447-124Adipic Acid ≥ 99.5% 1.362 146.14 Fluka 09582
5258

ACPD8, 5235–5268, 2008
Hygroscopicity studyof inorganic/organic
particles
A. A. Zardini et al.
Title Page
Abstract Introduction
Conclusions References
Tables Figures
J I
J I
Back Close
Full Screen / Esc
Printer-friendly Version
Interactive Discussion
Table 2. Summary of the hygroscopicity cycles for the AS:AA=1:3 system (interval and aver-aged values for 25 cycles and 9 different particles): relative humidity of the pre-deliquescenceonset and maximum, RH0 and RHm; mass growth factor at the maximum of pre-deliquescence,g(RHm); DRH; growth factor at DRH, g(DRH); efflorescence of ammonium sulfate, ERH.
RH0 RHm g(RHm) DRH g(DRH) ERH
43–53%, 48.1% 52–65%, 58% 1.03–1.19, 1.10 78–83%, 80.5% 1.16–1.45, 1.37 33-69%, 53%
5259
ACPD8, 5235–5268, 2008
Hygroscopicity studyof inorganic/organic
particles
A. A. Zardini et al.
Title Page
Abstract Introduction
Conclusions References
Tables Figures
J I
J I
Back Close
Full Screen / Esc
Printer-friendly Version
Interactive Discussion
CCD 1 CCD 2
�= 633 nm, 488 nm
PMT
Fig. 1. Schematic of the electrodynamic balance. A three-wall glass chamber hosts four metalrings which supply the electric field needed for particle levitation. The particle is illuminated bytwo laser beams from below. The scattered light is collected in the near and far field view bytwo CCD cameras, and its intensity monitored by a photomultiplier (PMT).
5260
ACPD8, 5235–5268, 2008
Hygroscopicity studyof inorganic/organic
particles
A. A. Zardini et al.
Title Page
Abstract Introduction
Conclusions References
Tables Figures
J I
J I
Back Close
Full Screen / Esc
Printer-friendly Version
Interactive Discussion
Fig. 2. Hygroscopicity cycles of pure ammonium sulfate (AS) and citric acid (CA) particles (panel a and e), andmixtures of AS and CA with different molar ratios (4:1, 2:1, 1:1, from panel b to panel d). Pure AS exhibits hysteresiswith distinct deliquescence and efflorescence at RH≈80% and RH=35%-40%. Pure CA particles, instead, are alwaysliquid and absorb and desorb water according to RH changes at any given RH. In the 4:1 case the water uptakebecomes apparent at RH≈60%, the DRH and ERH are slightly decreased (2% and 3%, respectively) compared to thepure AS case. The 2:1 case exhibits different behavior for particles in HTDMA (always liquid) and the particle freshlyinjected at dry conditions in the EDB (solid AS present at dry conditions during hydration) with bulk points very closeto the hydration branch of EDB measurements. In the 1:1 mixture the presence of CA in the 1:1 mixture suppressesthe hysteresis of AS in both EDB and HTDMA cycles, and particles are always in liquid state.
5261

ACPD8, 5235–5268, 2008
Hygroscopicity studyof inorganic/organic
particles
A. A. Zardini et al.
Title Page
Abstract Introduction
Conclusions References
Tables Figures
J I
J I
Back Close
Full Screen / Esc
Printer-friendly Version
Interactive Discussion
Fig. 3. Time evolution of the hygroscopicity cycle of a single AS/CA particle with 2:1 mo-lar ratio in the EDB. The uppermost panel shows the RMSD of scattered light indicating ASdeliquescence at t≈20 ks. Thereafter, the particle remains liquid without AS efflorescence re-occurring. The middle panel shows the radius calculated by means of the Mie phase functions(as explained in the experimental section). When the particle is not a homogeneous sphere(t≤20 ks), the phase function allows to derive only a coarse estimate. The lowermost panelwas used to construct the humidogram in Fig. 2, panel (c).
5262
ACPD8, 5235–5268, 2008
Hygroscopicity studyof inorganic/organic
particles
A. A. Zardini et al.
Title Page
Abstract Introduction
Conclusions References
Tables Figures
J I
J I
Back Close
Full Screen / Esc
Printer-friendly Version
Interactive Discussion
Fig. 4. Hygroscopicity cycles of pure GA particles (cycle time ≈19 h). GA exhibits hysteresiswith distinct DRH and ERH. Literature HTDMA data do not fit the bulk data, but show a lowerhydration branch likely due to evaporation of the particle during measurements as already notedby Cruz and Pandis (2000).
5263
ACPD8, 5235–5268, 2008
Hygroscopicity studyof inorganic/organic
particles
A. A. Zardini et al.
Title Page
Abstract Introduction
Conclusions References
Tables Figures
J I
J I
Back Close
Full Screen / Esc
Printer-friendly Version
Interactive Discussion
Fig. 5. Consecutive hygroscopicity cycles of a pure GA particle in the EDB. Inset: zoom onERH showing that crystallization of GA has a low degree of reproducibility (in contrast to AS),ranging from gradual water release to a sharp efflorescence. This can lead to the presence ofwater also at very dry conditions.
5264
ACPD8, 5235–5268, 2008
Hygroscopicity studyof inorganic/organic
particles
A. A. Zardini et al.
Title Page
Abstract Introduction
Conclusions References
Tables Figures
J I
J I
Back Close
Full Screen / Esc
Printer-friendly Version
Interactive Discussion
Fig. 6. Hygroscopicity cycle of a pure GA particle in the EDB. The light intensity fluctuationsin the uppermost panel show a clear deliquescence (t≈32 ks, RH≈90.5%) and efflorescence(t≈55 ks, RH≈18%), proving that the particle changes its phase from liquid to crystalline withno evident mass change (lowermost panel). The optical radius evolution is plotted in the middlepanel and is an indirect indication of a liquid particle in the region 32 ks≤t≤55 ks. The lowermostpanel was used to construct the humidogram in Fig. 5, black curve, where no efflorescencewould have been detected solely based on mass measurements.
5265

ACPD8, 5235–5268, 2008
Hygroscopicity studyof inorganic/organic
particles
A. A. Zardini et al.
Title Page
Abstract Introduction
Conclusions References
Tables Figures
J I
J I
Back Close
Full Screen / Esc
Printer-friendly Version
Interactive Discussion
Fig. 7. Hygroscopicity cycle of AS/GA particles, 1:1 molar ratio. DRH and ERH points are lowercompared to pure AS by 3% and 8%, respectively. DRH is lower than both deliquescence ofpure AS and pure GA. ERH of GA is now triggered by the presence of AS.
5266
ACPD8, 5235–5268, 2008
Hygroscopicity studyof inorganic/organic
particles
A. A. Zardini et al.
Title Page
Abstract Introduction
Conclusions References
Tables Figures
J I
J I
Back Close
Full Screen / Esc
Printer-friendly Version
Interactive Discussion
Fig. 8. Hygroscopicity cycles of AS/AA particles in the EDB; 2:1.1 molar ratio (upper panel) and1:3.3 molar ratio (lower panel). The 2:1.1 case resembles the pure AS behavior, while thereare modified hydration and dehydration branches in the 1:3.3 case which strongly differ fromZSR predictions. Non-monotonous mass changes must be due to structural changes (particlecompaction) occurring during water uptake.
5267

ACPD8, 5235–5268, 2008
Hygroscopicity studyof inorganic/organic
particles
A. A. Zardini et al.
Title Page
Abstract Introduction
Conclusions References
Tables Figures
J I
J I
Back Close
Full Screen / Esc
Printer-friendly Version
Interactive Discussion
Fig. 9. Two incomplete consecutive cycles of an AS/AA particle, 1:3.3 molar ratio. Light inten-sity fluctuations (orange symbols) are in phase opposition with the mass and ambient RH (blackand red curves, respectively), indicating that the pre-deliquescence water uptake described inthe lower panel of Fig. 8 is reversible.
5268