chemistry & biochemistry data booklet - office of …€¦ · · 2016-11-07chemistry &...
TRANSCRIPT

Chemistry & BiochemistryData Booklet
Spring Term 2017Quality Enhancement
Review

Department of Chemistry & Biochemistry
Spring Term 2017
Table of Contents Page Degree Programs ...............................................................................1
The Faculty ....................................................................................... 2
Enrollment by Major ......................................................................... 4
Degrees Awarded ........................................................................... 16
Average Class Size ........................................................................ 20
Credit Hours by Semester/Fall & Spring/Annual
Fundable ................................................................................... 21
Non-fundable ............................................................................. 22
Total .......................................................................................... 23
Credit Hours and Courses by Instructor Type ......................................
E&G Detail 2011-12 to 2015-16 ................................................ 24
Faculty Courses and Hours 2011-12 and 2015-16
(Individual Faculty Summary)
2011-12 ...................................................................................... 25
2015-16 ...................................................................................... 31
E&G Budgeted Faculty and Staff Lines .......................................... 37
E&G Expenditures by Summary Object Code ............................... 38
Graduate Admissions ..................................................................... 39

Department of Chemistry & BiochemistrySPRING TERM 2017
Most recent available statistics
ReportPage No(s)
Degrees Offered 26 1
Faculty 46 2-3
Majors (Fall 2016 Headcount) 4-15Undergraduate 522 Graduate - Masters - Graduate - Specialist - Graduate - Doctorate 157 Total 679
2015-2016 Degrees Awarded 16-19Bachelors 120 Masters 14 Specialist - Doctorate 30 Total 164
Average Class Size (Fall 2016) 20Undergraduate
Lower - classroom 125.7Upper - classroom 85.0
Graduate - classroom 16.4
Credit Hours - Annual (2015-2016)Fundable 37,274 21Non-fundable 884 22Total 38,158 23University (fundable) 1,056,133 SIF*2015-2016 Department Fundable Hours As Percent of University Fundable Hours 3.5% calculated
Student FTE's- Annual (state fundable 2015-2016); National FTE definition 21Lower 875.1 Upper 206.5 Grad I 2.9 Grad II 198.2 Total 1,282.7
Credit Hours Percentages by Instructor Type (Fall 2015) 24Faculty 90.7% calculatedOPS Regular Faculty 0.0% calculatedOPS Faculty Adjuncts 9.3% calculatedGraduate Assistants 0.0% calculatedA&P/USPS 0.0% calculatedPhased Retirement 0.0% calculatedOthers 0.0% calculated
Average Total Credit Hours Taught per Faculty FTE (All Hours, 2015-2016) 24Fall Term 403.7 Spring Term 405.2 Academic Year 808.9 calculated
Annual Student FTE's Taught by all Faculty (Fall & Spring total hrs converted to annual FTE's, 2015-2016) 36Undergraduate (academic year hours/30) 855.5 calculatedGraduate (academic year hours/24) 143.9 calculatedTotal 999.4 calculated
Note: most statistics are based on the Chemistry & Biochemistry account 075xxx. Related accounts may not be included
in expenditures and in faculty courses and hours taught. *SIF=Student Information File

College of Arts and SciencesDepartment of Chemistry and BiochemistryDegree Programs
Major Name Major Code Academic Plan Code CIP Code Degree OfferedPre-Chemistry 111610 CHMAPR 400501 Undergraduate StudiesChemistry 111610 CHMABS 400501 Bachelor of ScienceChemistry 111610 CHMAMS 400501 Master of ScienceChemistry 111610 CHMAMT 400501 Master of Science/ThesisChemistry 111610 CHMAPD 400501 Doctorate
Major Name Major Code Academic Plan Code CIP Code Degree OfferedPre-Biochemistry 111612 CHMBLGYPR 260202 Undergraduate StudiesBiochemistry 111612 CHMBLGYBS 260202 Bachelor of Science
Major Name Major Code Academic Plan Code CIP Code Degree OfferedPre-Environmental Chemistry 111617 CHMENVPR 400501 Undergraduate StudiesEnvironmental Chemistry 111617 CHMENVBS 400501 Bachelor of Science
Major Name Major Code Academic Plan Code CIP Code Degree OfferedMaterials Chemistry 111618 CHMMATRLPD 400501 Doctorate
Major Name Major Code Academic Plan Code CIP Code Degree OfferedPre-Chemical Science 111620 CHMSCIPR 400599 Undergraduate StudiesChemical Science 111620 CHMSCIBS 400599 Bachelor of Science
Major Name Major Code Academic Plan Code CIP Code Degree OfferedPre-Chemical Sciences/FSU-Teach 111621 CHMSCINZPR 400599 Undergraduate StudiesChemical Sciences/FSU-Teach 111621 CHMSCINZBS 400599 Bachelor of Science
Not Published Degree ProgramsMajor Name Major Code Academic Plan Code CIP Code Degree OfferedAnalytical Chemistry 111611 CHMANALYMS 400501 Master of ScienceAnalytical Chemistry 111611 CHMANALYPD 400501 Doctorate
Major Name Major Code Academic Plan Code CIP Code Degree OfferedBiochemistry 111612 CHMBLGYMS 400501 Master of ScienceBiochemistry 111612 CHMBLGYPD 400501 Doctorate
Major Name Major Code Academic Plan Code CIP Code Degree OfferedInorganic Chemistry 111613 CHMINORGMS 400501 Master of ScienceInorganic Chemistry 111613 CHMINORGPD 400501 Doctorate
Major Name Major Code Academic Plan Code CIP Code Degree OfferedNuclear Chemistry 111614 CHMNUKEMS 400501 Master of ScienceNuclear Chemistry 111614 CHMNUKEPD 400501 Doctorate
Major Name Major Code Academic Plan Code CIP Code Degree OfferedOrganic Chemistry 111615 CHMORGANMS 400501 Master of ScienceOrganic Chemistry 111615 CHMORGANPD 400501 Doctorate
Major Name Major Code Academic Plan Code CIP Code Degree OfferedPhysical Chemistry 111616 CHMPHYCLMS 400501 Master of SciencePhysical Chemistry 111616 CHMPHYCLPD 400501 Doctorate
Source: Degree Program Inventory, FSU and SUS
1
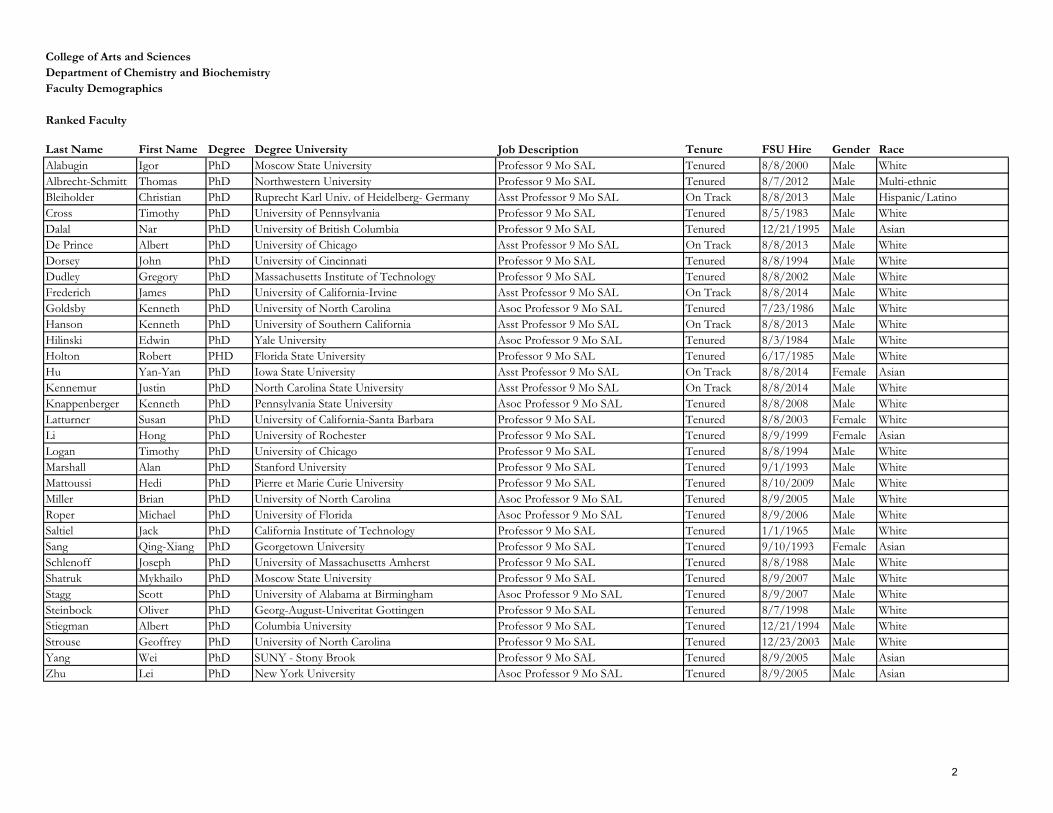
College of Arts and SciencesDepartment of Chemistry and BiochemistryFaculty Demographics
Ranked Faculty
Last Name First Name Degree Degree University Job Description Tenure FSU Hire Gender RaceAlabugin Igor PhD Moscow State University Professor 9 Mo SAL Tenured 8/8/2000 Male WhiteAlbrecht-Schmitt Thomas PhD Northwestern University Professor 9 Mo SAL Tenured 8/7/2012 Male Multi-ethnicBleiholder Christian PhD Ruprecht Karl Univ. of Heidelberg- Germany Asst Professor 9 Mo SAL On Track 8/8/2013 Male Hispanic/LatinoCross Timothy PhD University of Pennsylvania Professor 9 Mo SAL Tenured 8/5/1983 Male WhiteDalal Nar PhD University of British Columbia Professor 9 Mo SAL Tenured 12/21/1995 Male AsianDe Prince Albert PhD University of Chicago Asst Professor 9 Mo SAL On Track 8/8/2013 Male WhiteDorsey John PhD University of Cincinnati Professor 9 Mo SAL Tenured 8/8/1994 Male WhiteDudley Gregory PhD Massachusetts Institute of Technology Professor 9 Mo SAL Tenured 8/8/2002 Male WhiteFrederich James PhD University of California-Irvine Asst Professor 9 Mo SAL On Track 8/8/2014 Male WhiteGoldsby Kenneth PhD University of North Carolina Asoc Professor 9 Mo SAL Tenured 7/23/1986 Male WhiteHanson Kenneth PhD University of Southern California Asst Professor 9 Mo SAL On Track 8/8/2013 Male WhiteHilinski Edwin PhD Yale University Asoc Professor 9 Mo SAL Tenured 8/3/1984 Male WhiteHolton Robert PHD Florida State University Professor 9 Mo SAL Tenured 6/17/1985 Male WhiteHu Yan-Yan PhD Iowa State University Asst Professor 9 Mo SAL On Track 8/8/2014 Female AsianKennemur Justin PhD North Carolina State University Asst Professor 9 Mo SAL On Track 8/8/2014 Male WhiteKnappenberger Kenneth PhD Pennsylvania State University Asoc Professor 9 Mo SAL Tenured 8/8/2008 Male WhiteLatturner Susan PhD University of California-Santa Barbara Professor 9 Mo SAL Tenured 8/8/2003 Female WhiteLi Hong PhD University of Rochester Professor 9 Mo SAL Tenured 8/9/1999 Female AsianLogan Timothy PhD University of Chicago Professor 9 Mo SAL Tenured 8/8/1994 Male WhiteMarshall Alan PhD Stanford University Professor 9 Mo SAL Tenured 9/1/1993 Male WhiteMattoussi Hedi PhD Pierre et Marie Curie University Professor 9 Mo SAL Tenured 8/10/2009 Male WhiteMiller Brian PhD University of North Carolina Asoc Professor 9 Mo SAL Tenured 8/9/2005 Male WhiteRoper Michael PhD University of Florida Asoc Professor 9 Mo SAL Tenured 8/9/2006 Male WhiteSaltiel Jack PhD California Institute of Technology Professor 9 Mo SAL Tenured 1/1/1965 Male WhiteSang Qing-Xiang PhD Georgetown University Professor 9 Mo SAL Tenured 9/10/1993 Female AsianSchlenoff Joseph PhD University of Massachusetts Amherst Professor 9 Mo SAL Tenured 8/8/1988 Male WhiteShatruk Mykhailo PhD Moscow State University Professor 9 Mo SAL Tenured 8/9/2007 Male WhiteStagg Scott PhD University of Alabama at Birmingham Asoc Professor 9 Mo SAL Tenured 8/9/2007 Male WhiteSteinbock Oliver PhD Georg-August-Univeritat Gottingen Professor 9 Mo SAL Tenured 8/7/1998 Male WhiteStiegman Albert PhD Columbia University Professor 9 Mo SAL Tenured 12/21/1994 Male WhiteStrouse Geoffrey PhD University of North Carolina Professor 9 Mo SAL Tenured 12/23/2003 Male WhiteYang Wei PhD SUNY - Stony Brook Professor 9 Mo SAL Tenured 8/9/2005 Male AsianZhu Lei PhD New York University Asoc Professor 9 Mo SAL Tenured 8/9/2005 Male Asian
2
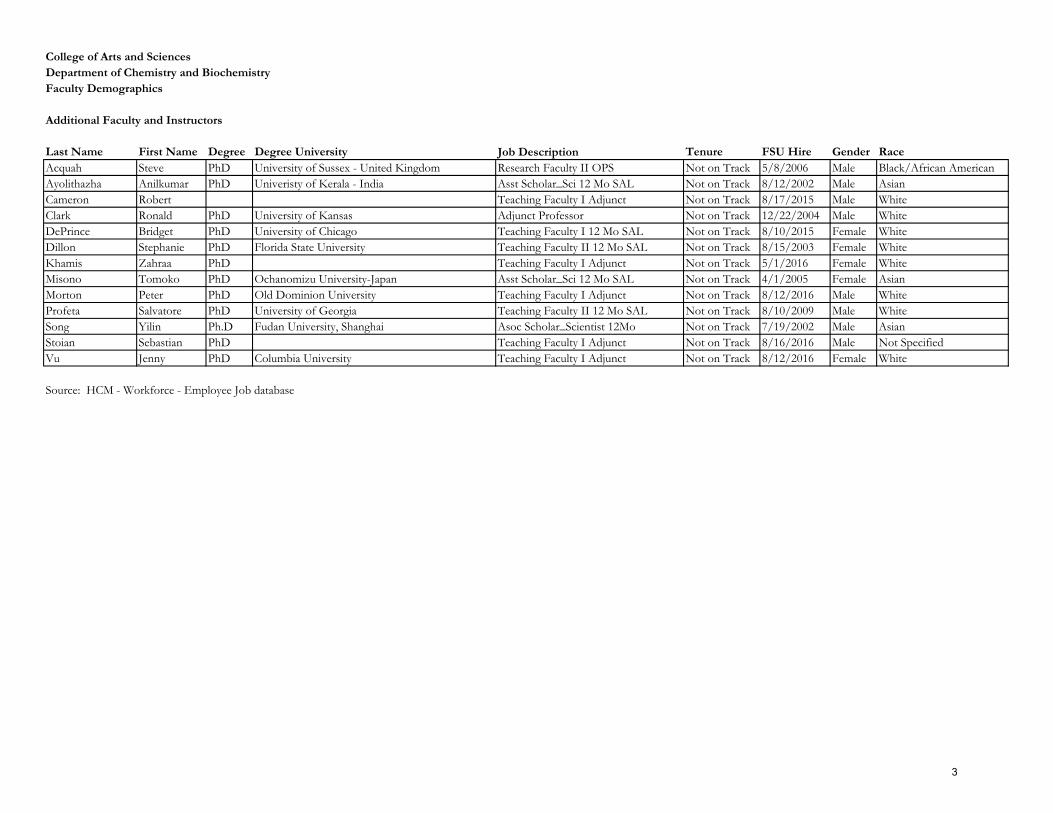
College of Arts and SciencesDepartment of Chemistry and BiochemistryFaculty Demographics
Additional Faculty and Instructors
Last Name First Name Degree Degree University Job Description Tenure FSU Hire Gender RaceAcquah Steve PhD University of Sussex - United Kingdom Research Faculty II OPS Not on Track 5/8/2006 Male Black/African AmericanAyolithazha Anilkumar PhD Univeristy of Kerala - India Asst Scholar_Sci 12 Mo SAL Not on Track 8/12/2002 Male AsianCameron Robert Teaching Faculty I Adjunct Not on Track 8/17/2015 Male WhiteClark Ronald PhD University of Kansas Adjunct Professor Not on Track 12/22/2004 Male WhiteDePrince Bridget PhD University of Chicago Teaching Faculty I 12 Mo SAL Not on Track 8/10/2015 Female WhiteDillon Stephanie PhD Florida State University Teaching Faculty II 12 Mo SAL Not on Track 8/15/2003 Female WhiteKhamis Zahraa PhD Teaching Faculty I Adjunct Not on Track 5/1/2016 Female WhiteMisono Tomoko PhD Ochanomizu University-Japan Asst Scholar_Sci 12 Mo SAL Not on Track 4/1/2005 Female AsianMorton Peter PhD Old Dominion University Teaching Faculty I Adjunct Not on Track 8/12/2016 Male WhiteProfeta Salvatore PhD University of Georgia Teaching Faculty II 12 Mo SAL Not on Track 8/10/2009 Male WhiteSong Yilin Ph.D Fudan University, Shanghai Asoc Scholar_Scientist 12Mo Not on Track 7/19/2002 Male AsianStoian Sebastian PhD Teaching Faculty I Adjunct Not on Track 8/16/2016 Male Not SpecifiedVu Jenny PhD Columbia University Teaching Faculty I Adjunct Not on Track 8/12/2016 Female White
Source: HCM - Workforce - Employee Job database
3

College of Arts and SciencesDepartment of Chemistry and BiochemistryEnrollment by Fall Semester
UG G UG G UG G UG G UG G
Department of Chemistry and Biochemistry 505 139 516 140 517 151 560 162 522 157
Female 243 52 254 45 256 49 287 56 291 45American Indian/Native Alaskan 1 0 1 0 0 0 0 0 1 0Asian 13 3 17 2 9 2 10 3 11 4Black 29 3 29 2 21 3 34 4 42 2Hispanic 47 1 51 1 53 3 56 4 55 4Native Hawaiian or Pacific Islander 0 0 1 0 1 0 0 1 0 1White 139 18 145 15 153 14 165 15 163 13Non-Resident Alien 2 23 1 21 1 23 2 25 1 20Two or More Races 11 1 6 1 14 1 14 1 13 0Not Reported 1 3 3 3 4 3 6 3 5 1
Male 262 87 262 95 261 102 273 106 231 112American Indian/Native Alaskan 1 0 2 0 2 0 1 0 1 0Asian/Pacific Islander 20 2 10 3 8 3 12 3 10 4Black 14 1 16 2 19 2 20 4 21 6Hispanic 47 2 44 2 47 4 63 6 55 7Native Hawaiian or Pacific Islander 0 0 0 0 0 0 1 0 2 0White 166 46 173 51 167 52 161 50 129 48Non-Resident Alien 3 33 1 34 2 37 2 37 0 40Two or More Races 5 2 9 1 10 2 8 3 9 3Not Reported 6 1 7 2 6 2 5 3 4 4
UG = Undergraduate; G = GraduateSource: Fall Preliminary Student Instruction Files (SIFP)
2012 2013 2014 2015 2016Fall Fall Fall Fall Fall
243 254 256 287 291
52 45 4956 45
262 262 261273
231
87 95 102
106
112
0
100
200
300
400
500
600
700
800
2012 2013 2014 2015 2016Undergraduate Female Graduate Female Undergraduate Male Graduate Male
4

College of Arts and SciencesDepartment of Chemistry and BiochemistryEnrollment by Fall SemesterMajor Description: Chemistry
Fall Fall Fall Fall Fall2012 2013 2014 2015 2016
Undergraduate 141 137 163 188 179Freshman 26 27 33 47 46Sophomore 30 37 36 46 38Junior 34 28 45 42 53Senior 51 45 49 53 42
Graduate 27 66 31 63 93Graduate - Masters 0 0 0 0 0Graduate - Doctorate 27 66 31 63 93
Total for Major 168 203 194 251 272
Source: Fall Preliminary Student Instruction Files (SIFP)
Chemistry
26 27 3347 46
30 37 36
46 3834 28
45
42 5351 45
49
53 4227
6631
6393
0
50
100
150
200
250
300
2012 2013 2014 2015 2016
Freshman Sophomore Junior Senior Graduate
5

College of Arts and SciencesDepartment of Chemistry and BiochemistryEnrollment by Fall SemesterMajor Description: Biochemistry
Fall Fall Fall Fall Fall2012 2013 2014 2015 2016
Undergraduate 262 282 263 298 290Freshman 49 47 42 74 62Sophomore 47 66 53 60 58Junior 73 63 66 83 85Senior 93 106 102 81 85
Graduate 16 12 14 9 7Graduate - Masters 0 0 0 0 0Graduate - Doctorate 16 12 14 9 7
Total for Major 278 294 277 307 297
Source: Fall Preliminary Student Instruction Files (SIFP)
Biochemistry
49 47 4274 62
4766
53
6058
7363
66
8385
93106
102
8185
16
12
14
97
0
50
100
150
200
250
300
350
2012 2013 2014 2015 2016
Freshman Sophomore Junior Senior Graduate
6

College of Arts and SciencesDepartment of Chemistry and BiochemistryEnrollment by Fall SemesterMajor Description: Environmental Chemistry
Fall Fall Fall Fall Fall2012 2013 2014 2015 2016
Undergraduate 7 8 11 10 7Freshman 2 2 1 0 0Sophomore 1 1 1 2 0Junior 1 2 3 1 1Senior 3 3 6 7 6
Graduate 0 0 0 0 0Graduate - Masters 0 0 0 0 0Graduate - Doctorate 0 0 0 0 0
Total for Major 7 8 11 10 7
Source: Fall Preliminary Student Instruction Files (SIFP)
Environmental Chemistry
2 21
0 0
1 1
12
0
12
3
1
1
3
3
6
7
6
0
2
4
6
8
10
12
2012 2013 2014 2015 2016
Freshman Sophomore Junior Senior
7

College of Arts and SciencesDepartment of Chemistry and BiochemistryEnrollment by Fall SemesterMajor Description: Materials Chemistry
Fall Fall Fall Fall Fall2012 2013 2014 2015 2016
Undergraduate 0 0 0 0 0Freshman 0 0 0 0 0Sophomore 0 0 0 0 0Junior 0 0 0 0 0Senior 0 0 0 0 0
Graduate 11 9 25 22 15Graduate - Masters 0 0 0 0 0Graduate - Doctorate 11 9 25 22 15
Total for Major 11 9 25 22 15
Source: Fall Preliminary Student Instruction Files (SIFP)
Materials Chemistry
119
25
22
15
0
5
10
15
20
25
30
2012 2013 2014 2015 2016
Graduate
8

College of Arts and SciencesDepartment of Chemistry and BiochemistryEnrollment by Fall SemesterMajor Description: Chemical Science
Fall Fall Fall Fall Fall2012 2013 2014 2015 2016
Undergraduate 90 83 75 54 40Freshman 12 7 5 2 6Sophomore 15 21 13 3 3Junior 20 24 27 15 12Senior 43 31 30 34 19
Graduate 0 0 0 0 0Graduate - Masters 0 0 0 0 0Graduate - Doctorate 0 0 0 0 0
Total for Major 90 83 75 54 40
Source: Fall Preliminary Student Instruction Files (SIFP)
Chemical Science
127 5 2
6
1521
13
33
2024
27
1512
43 31
30
34
19
0
10
20
30
40
50
60
70
80
90
100
2012 2013 2014 2015 2016
Freshman Sophomore Junior Senior
9
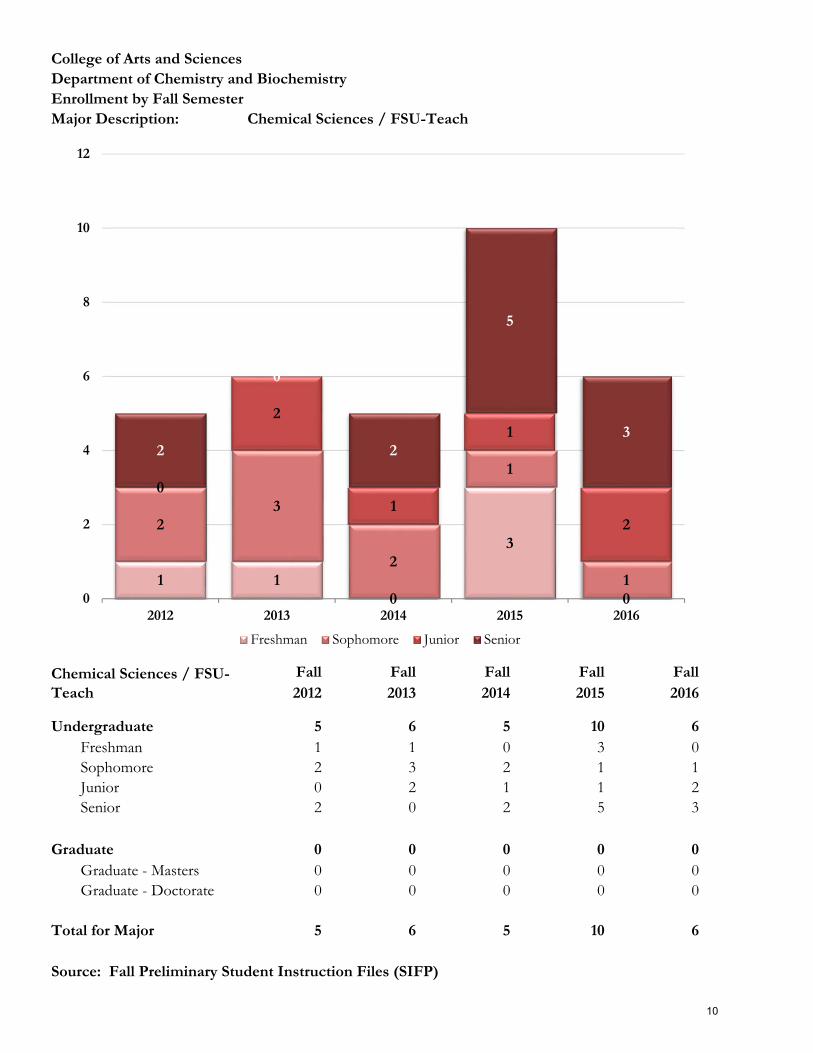
College of Arts and SciencesDepartment of Chemistry and BiochemistryEnrollment by Fall SemesterMajor Description: Chemical Sciences / FSU-Teach
Fall Fall Fall Fall Fall2012 2013 2014 2015 2016
Undergraduate 5 6 5 10 6Freshman 1 1 0 3 0Sophomore 2 3 2 1 1Junior 0 2 1 1 2Senior 2 0 2 5 3
Graduate 0 0 0 0 0Graduate - Masters 0 0 0 0 0Graduate - Doctorate 0 0 0 0 0
Total for Major 5 6 5 10 6
Source: Fall Preliminary Student Instruction Files (SIFP)
Chemical Sciences / FSU-Teach
1 10
3
0
23
2
1
1
0
2
1
1
2
2
0
2
5
3
0
2
4
6
8
10
12
2012 2013 2014 2015 2016
Freshman Sophomore Junior Senior
10

College of Arts and SciencesDepartment of Chemistry and BiochemistryEnrollment by Fall SemesterMajor Description: Analytical Chemistry
Fall Fall Fall Fall Fall2012 2013 2014 2015 2016
Undergraduate 0 0 0 0 0Freshman 0 0 0 0 0Sophomore 0 0 0 0 0Junior 0 0 0 0 0Senior 0 0 0 0 0
Graduate 30 16 22 18 9Graduate - Masters 0 0 0 0 0Graduate - Doctorate 30 16 22 18 9
Total for Major 30 16 22 18 9
Source: Fall Preliminary Student Instruction Files (SIFP)
Analytical Chemistry
30
16
22
18
9
0
5
10
15
20
25
30
35
2012 2013 2014 2015 2016
Graduate
11

College of Arts and SciencesDepartment of Chemistry and BiochemistryEnrollment by Fall SemesterMajor Description: Inorganic Chemistry
Fall Fall Fall Fall Fall2012 2013 2014 2015 2016
Undergraduate 0 0 0 0 0Freshman 0 0 0 0 0Sophomore 0 0 0 0 0Junior 0 0 0 0 0Senior 0 0 0 0 0
Graduate 14 10 17 14 8Graduate - Masters 0 0 0 0 0Graduate - Doctorate 14 10 17 14 8
Total for Major 14 10 17 14 8
Source: Fall Preliminary Student Instruction Files (SIFP)
Inorganic Chemistry
14
10
17
14
8
0
2
4
6
8
10
12
14
16
18
2012 2013 2014 2015 2016
Graduate
12

College of Arts and SciencesDepartment of Chemistry and BiochemistryEnrollment by Fall SemesterMajor Description: Organic Chemistry
Fall Fall Fall Fall Fall2012 2013 2014 2015 2016
Undergraduate 0 0 0 0 0Freshman 0 0 0 0 0Sophomore 0 0 0 0 0Junior 0 0 0 0 0Senior 0 0 0 0 0
Graduate 22 14 22 19 12Graduate - Masters 0 0 0 0 0Graduate - Doctorate 22 14 22 19 12
Total for Major 22 14 22 19 12
Source: Fall Preliminary Student Instruction Files (SIFP)
Organic Chemistry
22
14
22
19
12
0
5
10
15
20
25
2012 2013 2014 2015 2016
Graduate
13

College of Arts and SciencesDepartment of Chemistry and BiochemistryEnrollment by Fall SemesterMajor Description: Physical Chemistry
Fall Fall Fall Fall Fall2012 2013 2014 2015 2016
Undergraduate 0 0 0 0 0Freshman 0 0 0 0 0Sophomore 0 0 0 0 0Junior 0 0 0 0 0Senior 0 0 0 0 0
Graduate 19 13 20 17 12Graduate - Masters 0 0 0 0 0Graduate - Doctorate 19 13 20 17 12
Total for Major 19 13 20 17 12
Source: Fall Preliminary Student Instruction Files (SIFP)
Physical Chemistry
19
13
20
17
12
0
5
10
15
20
25
2012 2013 2014 2015 2016
Graduate
14

College of Arts and SciencesDepartment of Chemistry and BiochemistryEnrollment by Fall SemesterMajor Description: Nuclear Chemistry
Fall Fall Fall Fall Fall2012 2013 2014 2015 2016
Undergraduate 0 0 0 0 0Freshman 0 0 0 0 0Sophomore 0 0 0 0 0Junior 0 0 0 0 0Senior 0 0 0 0 0
Graduate 0 0 0 0 1Graduate - Masters 0 0 0 0 0Graduate - Doctorate 0 0 0 0 1
Total for Major 0 0 0 0 1
Source: Fall Preliminary Student Instruction Files (SIFP)
Nuclear Chemistry
0 0 0 0
1
0
0
0
1
1
1
1
2012 2013 2014 2015 2016
Graduate
15

College of Arts and SciencesDepartment of Chemistry and BiochemistryDegrees Awarded by SemesterCIP Code: 260202
Bachelors Masters Doctorate Total2011-12 Summer '11 8 0 0 8
Fall '11 4 0 0 4Spring '12 40 0 0 40
2011-12 Total 52 0 0 52
2012-13 Summer '12 6 0 0 6Fall '12 4 0 0 4Spring '13 24 0 0 24
2012-13 Total 34 0 0 34
2013-14 Summer '13 15 0 0 15Fall '13 9 0 0 9Spring '14 33 0 0 33
2013-14 Total 57 0 0 57
2014-15 Summer '14 16 0 0 16Fall '14 5 0 0 5Spring '15 32 0 0 32
2014-15 Total 53 0 0 53
2015-16 Summer '15 10 0 0 10Fall '15 8 0 0 8Spring '16 39 0 0 39
2015-16 Total 57 0 0 57
Source: Final Student Instruction Files (SIF)
52
34
5753
57
0
10
20
30
40
50
60
2011-12 2012-13 2013-14 2014-15 2015-16
BachelorsBachelors
16

College of Arts and SciencesDepartment of Chemistry and BiochemistryDegrees Awarded by SemesterCIP Code: 400501
Bachelors Masters Doctorate Total2011-12 Summer '11 4 2 4 10
Fall '11 1 4 13 18Spring '12 16 1 10 27
2011-12 Total 21 7 27 55
2012-13 Summer '12 6 1 4 11Fall '12 1 4 11 16Spring '13 21 2 9 32
2012-13 Total 28 7 24 59
2013-14 Summer '13 13 5 10 28Fall '13 2 1 5 8Spring '14 14 2 4 20
2013-14 Total 29 8 19 56
2014-15 Summer '14 3 0 4 7Fall '14 4 3 7 14Spring '15 17 3 7 27
2014-15 Total 24 6 18 48
2015-16 Summer '15 13 4 2 19Fall '15 2 5 16 23Spring '16 14 5 12 31
2015-16 Total 29 14 30 73
Source: Final Student Instruction Files (SIF)
2128 29
2429
7
7 8
6
14
2724 19
18
30
0
10
20
30
40
50
60
70
80
2011-12 2012-13 2013-14 2014-15 2015-16
Bachelors Masters Doctorate
17

College of Arts and SciencesDepartment of Chemistry and BiochemistryDegrees Awarded by SemesterCIP Code: 400599
Bachelors Masters Doctorate Total2011-12 Summer '11 6 0 0 6
Fall '11 4 0 0 4Spring '12 10 0 0 10
2011-12 Total 20 0 0 20
2012-13 Summer '12 10 0 0 10Fall '12 3 0 0 3Spring '13 22 0 0 22
2012-13 Total 35 0 0 35
2013-14 Summer '13 7 0 0 7Fall '13 2 0 0 2Spring '14 10 0 0 10
2013-14 Total 19 0 0 19
2014-15 Summer '14 7 0 0 7Fall '14 4 0 0 4Spring '15 11 0 0 11
2014-15 Total 22 0 0 22
2015-16 Summer '15 5 0 0 5Fall '15 4 0 0 4Spring '16 18 0 0 18
2015-16 Total 27 0 0 27
Source: Final Student Instruction Files (SIF)
20
35
1922
27
0
5
10
15
20
25
30
35
40
2011-12 2012-13 2013-14 2014-15 2015-16
BachelorsBachelors
18

College of Arts and SciencesDepartment of Chemistry and BiochemistryDegrees Awarded by Semester - Double MajorsCIP Code: All Chemistry & Biochemistry CIP Codes
Bachelors Masters Doctorate Total2011-12 Summer '11 0 0 0 0
Fall '11 0 0 0 0Spring '12 5 0 0 5
2011-12 Total 5 0 0 5
2012-13 Summer '12 2 0 0 2Fall '12 1 0 0 1Spring '13 5 0 0 5
2012-13 Total 8 0 0 8
2013-14 Summer '13 0 0 0 0Fall '13 4 0 0 4Spring '14 7 0 0 7
2013-14 Total 11 0 0 11
2014-15 Summer '14 3 0 0 3Fall '14 1 0 0 1Spring '15 2 0 0 2
2014-15 Total 6 0 0 6
2015-16 Summer '15 4 0 0 4Fall '15 0 0 0 0Spring '16 3 0 0 3
2015-16 Total 7 0 0 7
Source: Final Student Instruction Files (SIF)
Double degrees are earned by students who declared two majors, but earned one degree. The degrees represented on this page were reported as secondary and thus not otherwise reported to a CIP in Chemistry and Biochemistry.
5
8
11
67
0
2
4
6
8
10
12
2011-12 2012-13 2013-14 2014-15 2015-16
Bachelors
19

College of Arts and SciencesDepartment of Chemistry and BiochemistryAverage Class Size
TermCourse Classification Enrolled
Number of Sections
Class Size Enrolled
Number of Sections
Class Size Enrolled
Number of Sections
Class Size
Fall 2012 Lower 2,903 90 32.3 2,107 99 21.3
Upper 751 15 50.1 155 14 11.1Graduate 197 11 17.9 95 7 13.6Total 3,851 116 33.2 95 7 13.6 2,262 113 20.0
Fall 2013 Lower 2,998 105 28.6 2,089 99 21.1Upper 825 13 63.5 157 14 11.2Graduate 194 11 17.6 87 6 14.5Total 4,017 129 31.1 87 6 14.5 2,246 113 19.9
Fall 2014 Lower 2,899 21 138.0 2,692 103 26.1 2,031 99 20.5Upper 855 8 106.9 346 20 17.3Graduate 176 15 11.7 91 7 13.0Total 3,930 44 89.3 2,783 110 25.3 2,377 119 20.0
Fall 2015 Lower 2,930 23 127.4 2,846 102 27.9 2,001 97 20.6Upper 849 8 106.1 345 21 16.4Graduate 194 16 12.1 96 7 13.7Total 3,973 47 84.5 2,942 109 27.0 2,346 118 19.9
Fall 2016 Lower 3,016 24 125.7 2,936 106 27.7 2,060 96 21.5Upper 680 8 85.0 277 21 13.2Graduate 262 16 16.4 91 7 13.0Total 3,958 48 82.5 3,027 113 26.8 2,337 117 20.0
Source: Fall Final Student Instruction Files (SIF) except Fall 2016 (SIF-Preliminary)
Class Lecture Discussion Laboratory
0
10
20
30
40
50
60
70
80
90
100
Fall 2012 Fall 2013 Fall 2014 Fall 2015 Fall 2016
Class Lecture Discussion Laboratory
20

College of Arts and SciencesDepartment of Chemistry and BiochemistryFundable Student Credit Hours and FTE
Fundable SCH Produced Annual Fundable FTE Contribution
Summer 2011 2012 2013 2014 2015 Summer 2011 2012 2013 2014 2015Lower 3,310 3,265 3,205 3,254 3,209 Lower 110.3 108.8 106.8 108.5 107.0Upper 654 654 737 699 1,096 Upper 21.8 21.8 24.6 23.3 36.5Grad I 18 24 0 12 0 Grad I 0.8 1.0 0.0 0.5 0.0Grad II 1399 1354 1376 1484 1536 Grad II 58.3 56.4 57.3 61.8 64.0Total 5,381 5,297 5,318 5,449 5,841 Total 191.2 188.1 188.7 194.1 207.5
Fall 2011 2012 2013 2014 2015 Fall 2011 2012 2013 2014 2015Lower 10,563 10,841 11,137 10,685 11,336 Lower 352.1 361.4 371.2 356.2 377.9Upper 2,665 2,677 2,748 2,836 3,003 Upper 88.8 89.2 91.6 94.5 100.1Grad I 40 21 16 51 25 Grad I 1.7 0.9 0.7 2.1 1.0Grad II 1,687 1,645 1,665 1,558 1,683 Grad II 70.3 68.5 69.4 64.9 70.1Total 14,955 15,184 15,566 15,130 16,047 Total 512.9 520.0 532.9 517.7 549.1
Spring 2012 2013 2014 2015 2016 Spring 2012 2013 2014 2015 2016Lower 10,971 11,810 10,881 11,148 11,707 Lower 365.7 393.7 362.7 371.6 390.2Upper 2,196 2,354 2,183 2,322 2,097 Upper 73.2 78.5 72.8 77.4 69.9Grad I 26 6 55 36 44 Grad I 1.1 0.3 2.3 1.5 1.8Grad II 1520 1511 1538 1673 1538 Grad II 63.3 63.0 64.1 69.7 64.1Total 14,713 15,681 14,657 15,179 15,386 Total 503.3 535.3 501.8 520.2 526.1
Annual 2011-12 2012-13 2013-14 2014-15 2015-16 Annual 2011-12 2012-13 2013-14 2014-15 2015-16Lower 24,844 25,916 25,223 25,087 26,252 Lower 828.1 863.9 840.8 836.2 875.1Upper 5,515 5,685 5,668 5,857 6,196 Upper 183.8 189.5 188.9 195.2 206.5Grad I 84 51 71 99 69 Grad I 3.5 2.1 3.0 4.1 2.9Grad II 4,606 4,510 4,579 4,715 4,757 Grad II 191.9 187.9 190.8 196.5 198.2Total 35,049 36,162 35,541 35,758 37,274 Total 1,207.4 1,243.4 1,223.5 1,232.1 1,282.7
Note: Student annual FTE is based on the national definition. Undergraduate hours are divided by 30, and graduate hours by 24.Source: Final Student Instruction Files (SIF)
828.1 863.9 840.8 836.2 875.1
183.8189.5 188.9 195.2
206.5
195.4190.0 193.8 200.6
201.1
0
200
400
600
800
1,000
1,200
1,400
2011-12 2012-13 2013-14 2014-15 2015-16
An
nu
al F
un
dab
le F
TE
Lower Upper Graduate
21

College of Arts and SciencesDepartment of Chemistry and BiochemistryNon-Fundable Student Credit Hours and FTE
Non-Fundable SCH Produced Annual Non-Fundable FTE Contribution
Summer 2011 2012 2013 2014 2015 Summer 2011 2012 2013 2014 2015Lower 261 273 246 175 111 Lower 8.7 9.1 8.2 5.8 3.7Upper 3 4 0 8 12 Upper 0.1 0.1 0.0 0.3 0.4Grad I 0 0 0 0 0 Grad I 0.0 0.0 0.0 0.0 0.0Grad II 12 0 0 0 0 Grad II 0.5 0.0 0.0 0.0 0.0Total 276 277 246 183 123 Total 9.3 9.2 8.2 6.1 4.1
Fall 2011 2012 2013 2014 2015 Fall 2011 2012 2013 2014 2015Lower 301 317 302 341 339 Lower 10.0 10.6 10.1 11.4 11.3Upper 21 18 9 12 22 Upper 0.7 0.6 0.3 0.4 0.7Grad I 0 0 0 0 0 Grad I 0.0 0.0 0.0 0.0 0.0Grad II 0 0 0 0 0 Grad II 0.0 0.0 0.0 0.0 0.0Total 322 335 311 353 361 Total 10.7 11.2 10.4 11.8 12.0
Spring 2012 2013 2014 2015 2016 Spring 2012 2013 2014 2015 2016Lower 338 391 403 320 382 Lower 11.3 13.0 13.4 10.7 12.7Upper 16 6 9 15 18 Upper 0.5 0.2 0.3 0.5 0.6Grad I 0 0 3 0 0 Grad I 0.0 0.0 0.1 0.0 0.0Grad II 0 1 0 0 0 Grad II 0.0 0.0 0.0 0.0 0.0Total 354 398 415 335 400 Total 11.8 13.3 13.9 11.2 13.3
Annual 2011-12 2012-13 2013-14 2014-15 2015-16 Annual 2011-12 2012-13 2013-14 2014-15 2015-16Lower 900 981 951 836 832 Lower 30.0 32.7 31.7 27.9 27.7Upper 40 28 18 35 52 Upper 1.3 0.9 0.6 1.2 1.7Grad I 0 0 3 0 0 Grad I 0.0 0.0 0.1 0.0 0.0Grad II 12 1 0 0 0 Grad II 0.5 0.0 0.0 0.0 0.0Total 952 1,010 972 871 884 Total 31.8 33.7 32.4 29.0 29.5
Note: Student annual FTE is based on the national definition. Undergraduate hours are divided by 30, and graduate hours by 24.Source: Final Student Instruction Files (SIF)
30.032.7 31.7
27.9 27.7
1.30.9
0.6
1.2 1.7
0.50.0
0.1
0.0 0.0
0
5
10
15
20
25
30
35
40
2011-12 2012-13 2013-14 2014-15 2015-16
An
nu
al N
on-F
un
dab
le F
TE
Lower Upper Graduate
22

College of Arts and SciencesDepartment of Chemistry and BiochemistryTotal Student Credit Hours and FTE
Total SCH Produced Annual Total FTE Contribution
Summer 2011 2012 2013 2014 2015 Summer 2011 2012 2013 2014 2015Lower 3,571 3,538 3,451 3,429 3,320 Lower 119.0 117.9 115.0 114.3 110.7Upper 657 658 737 707 1,108 Upper 21.9 21.9 24.6 23.6 36.9Grad I 18 24 0 12 0 Grad I 0.8 1.0 0.0 0.5 0.0Grad II 1,411 1,354 1,376 1,484 1,536 Grad II 58.8 56.4 57.3 61.8 64.0Total 5,657 5,574 5,564 5,632 5,964 Total 200.5 197.3 196.9 200.2 211.6
Fall 2011 2012 2013 2014 2015 Fall 2011 2012 2013 2014 2015Lower 10,864 11,158 11,439 11,026 11,675 Lower 362.1 371.9 381.3 367.5 389.2Upper 2,686 2,695 2,757 2,848 3,025 Upper 89.5 89.8 91.9 94.9 100.8Grad I 40 21 16 51 25 Grad I 1.7 0.9 0.7 2.1 1.0Grad II 1,687 1,645 1,665 1,558 1,683 Grad II 70.3 68.5 69.4 64.9 70.1Total 15,277 15,519 15,877 15,483 16,408 Total 523.6 531.2 543.2 529.5 561.2
Spring 2012 2013 2014 2015 2016 Spring 2012 2013 2014 2015 2016Lower 11,309 12,201 11,284 11,468 12,089 Lower 377.0 406.7 376.1 382.3 403.0Upper 2,212 2,360 2,192 2,337 2,115 Upper 73.7 78.7 73.1 77.9 70.5Grad I 26 6 58 36 44 Grad I 1.1 0.3 2.4 1.5 1.8Grad II 1,520 1,512 1,538 1,673 1,538 Grad II 63.3 63.0 64.1 69.7 64.1Total 15,067 16,079 15,072 15,514 15,786 Total 515.1 548.6 515.7 531.4 539.4
Annual 2011-12 2012-13 2013-14 2014-15 2015-16 Annual 2011-12 2012-13 2013-14 2014-15 2015-16Lower 25,744 26,897 26,174 25,923 27,084 Lower 858.1 896.6 872.5 864.1 902.8Upper 5,555 5,713 5,686 5,892 6,248 Upper 185.2 190.4 189.5 196.4 208.3Grad I 84 51 74 99 69 Grad I 3.5 2.1 3.1 4.1 2.9Grad II 4,618 4,511 4,579 4,715 4,757 Grad II 192.4 188.0 190.8 196.5 198.2Total 36,001 37,172 36,513 36,629 38,158 Total 1,239.2 1,277.1 1,255.9 1,261.1 1,312.2
Note: Student annual FTE is based on the national definition. Undergraduate hours are divided by 30, and graduate hours by 24.Source: Final Student Instruction Files (SIF)
858.1 896.6 872.5 864.1 902.8
185.2190.4 189.5 196.4
208.3
195.9190.1 193.9 200.6
201.1
0
200
400
600
800
1,000
1,200
1,400
2011-12 2012-13 2013-14 2014-15 2015-16
An
nu
al T
otal
FT
E
Lower Upper Graduate
23

Department of Chemistry and Biochemistry
E & G Student Credit Hours and Headcount Productivity
By Instructor Type
Student Headcount/ Student Headcount/
FTE Credit Hrs SCH/FTE Headcount FTE FTE Credit Hrs SCH/FTE Headcount FTE
Fall 2011 Spring 2012
Faculty 33.52 12,189.6 363.7 6,139.0 183.1 Faculty 33.5446 10,462.8 311.9 5,149 153.5OPS Regular Faculty 0 0.0 0.0 0.0 0.0 OPS Regular Faculty 0 0.0 0.0 0 0.0OPS Faculty Adjuncts 0 0.0 0.0 0.0 0.0 OPS Faculty Adjuncts 0.73052 1,911.0 2,615.9 637 872.0Graduate Assistants 42.0541 3,151.1 74.9 5,032.0 119.7 Graduate Assistants 39.8591 2,293.9 57.6 4,820 120.9A & P / USPS 0 0.0 0.0 0.0 0.0 A & P / USPS 0 0.0 0.0 0 0.0Others 0.98 0.0 0.0 100.0 102.0 Others 0 0.0 0.0 0 0.0
76.5541 15,340.7 200.4 11,271 147.2 74.13422 14,667.7 197.9 10,606 143.1
Fall 2012 Spring 2013
Faculty 32.69 9,682.8 296.2 5,376.0 164.4 Faculty 33 9,869.4 299.1 4,967 150.5OPS Regular Faculty 0.4993 1,464.0 2,932.1 488.0 977.4 OPS Regular Faculty 0 0.0 0.0 0 0.0OPS Faculty Adjuncts 0 0.0 0.0 0.0 0.0 OPS Faculty Adjuncts 1.8274 4,381.0 2,397.4 1,451 794.0Graduate Assistants 42.4702 4,395.5 103.5 5,948.0 140.1 Graduate Assistants 31.3838 1,394.6 44.4 4,858 154.8A & P / USPS 0 0.0 0.0 0.0 0.0 A & P / USPS 0 0.0 0.0 0 0.0Others 0 0.0 0.0 0.0 0.0 Others 0 0.0 0.0 0 0.0
75.66 15,542.3 205.4 11,812 156.1 66.2112 15,645.0 236.3 11,276 170.3
Fall 2013 Spring 2014
Faculty 35.6792 12,856.0 360.3 5,742 160.9 Faculty 36 12,561.1 348.9 5,360 148.9OPS Regular Faculty 0.9642 3.0 3.1 1 1.0 OPS Regular Faculty 0 0.0 0.0 0 0.0OPS Faculty Adjuncts 1.4844 2,694.0 1,814.9 898 605.0 OPS Faculty Adjuncts 1.001 2,148.0 2,145.9 726 725.3Graduate Assistants 0 0.0 0.0 0 0.0 Graduate Assistants 0 0.0 0.0 0 0.0A & P / USPS 0 0.0 0.0 0 0.0 A & P / USPS 0 0.0 0.0 0 0.0Others 0 0.0 0.0 0 0.0 Others 0 0.0 0.0 0 0.0
38.1278 15,553.0 407.9 6,641 174.2 37.001 14,709.1 397.5 6,086 164.5
Fall 2014 Spring 2015
Faculty 38.643 13,308.0 344.4 8,181.0 211.7 Faculty 37.9062 12,491.0 329.5 7,472 197.1OPS Regular Faculty 0 0.0 0.0 0.0 0.0 OPS Regular Faculty 0.6675 5.0 7.5 2 3.0OPS Faculty Adjuncts 1 1,773.0 1,773.0 1,075.0 1,075.0 OPS Faculty Adjuncts 1.001 2,547.0 2,544.5 1,666 1,664.3Graduate Assistants 0 0.0 0.0 0.0 0.0 Graduate Assistants 0 0.0 0.0 0 0.0A & P / USPS 0 0.0 0.0 0.0 0.0 A & P / USPS 0 0.0 0.0 0 0.0Others 0 0.0 0.0 0.0 0.0 Others 0 0.0 0.0 0 0.0
39.643 15,081.0 380.4 9,256 233.5 39.5747 15,043.0 380.1 9,140 231.0
Fall 2015 Spring 2016
Faculty 36.00 14,532.3 403.7 8,532.0 237.0 Faculty 36 14,586.3 405.2 8,710 241.9OPS Regular Faculty 1 5.0 5.0 2.0 2.0 OPS Regular Faculty 0.035 2.0 57.1 1 28.6OPS Faculty Adjuncts 0.238 1,488.0 6,252.1 992.0 4,168.1 OPS Faculty Adjuncts 0.25 741.0 2,964.0 494 1,976.0Graduate Assistants 0 0.0 0.0 0.0 0.0 Graduate Assistants 0 0.0 0.0 0 0.0A & P / USPS 0 0.0 0.0 0.0 0.0 A & P / USPS 0 0.0 0.0 0 0.0Others 0 0.0 0.0 0.0 0.0 Others 0 0.0 0.0 0 0.0
37.24 16,025.3 430.3 9,526 255.8 36.285 15,329.3 422.5 9,205 253.7
Source: Instruction Research Data Files. 24
FTE represents a calculated term FTE; the portion of full-time effort each term for all of an individual>s instruction and research activities, as represented on therespective exempt FACET certifications.
* Unlike credit hours, student headcount and course sections are NOT prorated by workload for faculty who are teaching the same class section. In these instances,headcount and section is repeated for each faculty member.
Excludes any course offered by the College of Medicine.
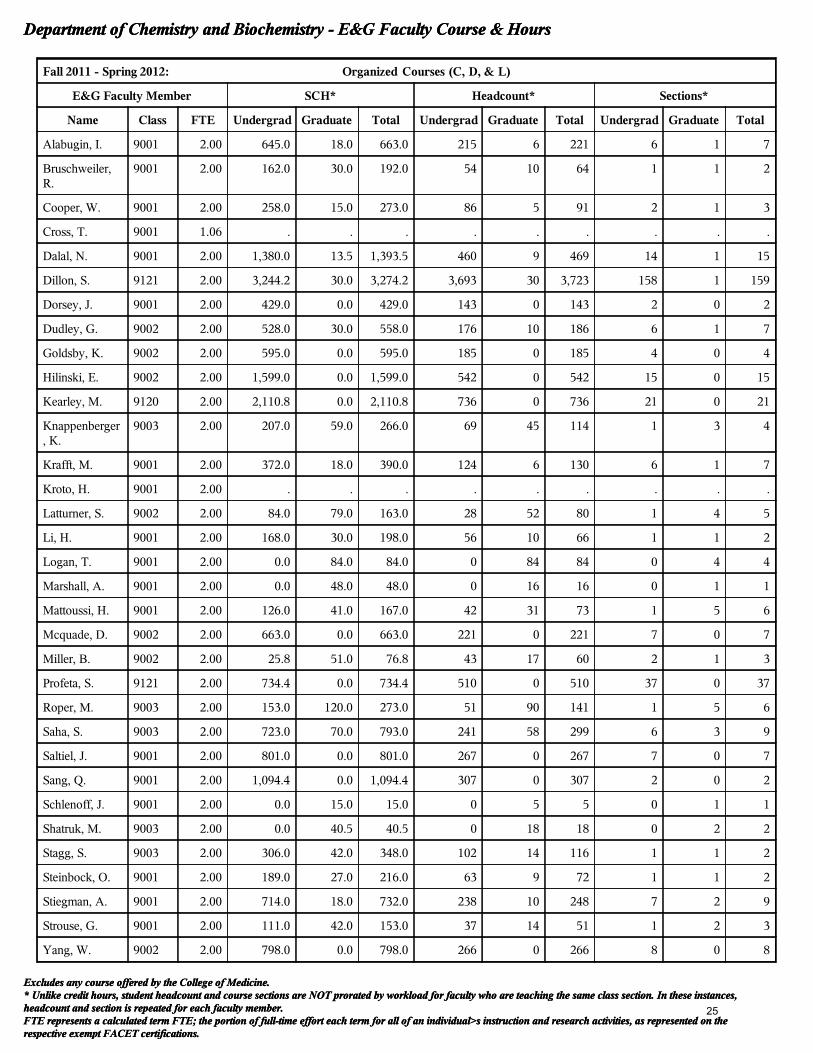
Department of Chemistry and Biochemistry - E&G Faculty Course & Hours
FTE represents a calculated term FTE; the portion of full-time effort each term for all of an individual>s instruction and research activities, as represented on therespective exempt FACET certifications.
* Unlike credit hours, student headcount and course sections are NOT prorated by workload for faculty who are teaching the same class section. In these instances,headcount and section is repeated for each faculty member.
Excludes any course offered by the College of Medicine.
Department of Chemistry and Biochemistry - E&G Faculty Course & Hours
Fall 2011 - Spring 2012: Organized Courses (C, D, & L)
E&G Faculty Member SCH* Headcount* Sections*
Name Class FTE Undergrad Graduate Total Undergrad Graduate Total Undergrad Graduate Total
Alabugin, I. 9001 2.00 645.0 18.0 663.0 215 6 221 6 1 7
Bruschweiler,R.
9001 2.00 162.0 30.0 192.0 54 10 64 1 1 2
Cooper, W. 9001 2.00 258.0 15.0 273.0 86 5 91 2 1 3
Cross, T. 9001 1.06 . . . . . . . . .
Dalal, N. 9001 2.00 1,380.0 13.5 1,393.5 460 9 469 14 1 15
Dillon, S. 9121 2.00 3,244.2 30.0 3,274.2 3,693 30 3,723 158 1 159
Dorsey, J. 9001 2.00 429.0 0.0 429.0 143 0 143 2 0 2
Dudley, G. 9002 2.00 528.0 30.0 558.0 176 10 186 6 1 7
Goldsby, K. 9002 2.00 595.0 0.0 595.0 185 0 185 4 0 4
Hilinski, E. 9002 2.00 1,599.0 0.0 1,599.0 542 0 542 15 0 15
Kearley, M. 9120 2.00 2,110.8 0.0 2,110.8 736 0 736 21 0 21
Knappenberger, K.
9003 2.00 207.0 59.0 266.0 69 45 114 1 3 4
Krafft, M. 9001 2.00 372.0 18.0 390.0 124 6 130 6 1 7
Kroto, H. 9001 2.00 . . . . . . . . .
Latturner, S. 9002 2.00 84.0 79.0 163.0 28 52 80 1 4 5
Li, H. 9001 2.00 168.0 30.0 198.0 56 10 66 1 1 2
Logan, T. 9001 2.00 0.0 84.0 84.0 0 84 84 0 4 4
Marshall, A. 9001 2.00 0.0 48.0 48.0 0 16 16 0 1 1
Mattoussi, H. 9001 2.00 126.0 41.0 167.0 42 31 73 1 5 6
Mcquade, D. 9002 2.00 663.0 0.0 663.0 221 0 221 7 0 7
Miller, B. 9002 2.00 25.8 51.0 76.8 43 17 60 2 1 3
Profeta, S. 9121 2.00 734.4 0.0 734.4 510 0 510 37 0 37
Roper, M. 9003 2.00 153.0 120.0 273.0 51 90 141 1 5 6
Saha, S. 9003 2.00 723.0 70.0 793.0 241 58 299 6 3 9
Saltiel, J. 9001 2.00 801.0 0.0 801.0 267 0 267 7 0 7
Sang, Q. 9001 2.00 1,094.4 0.0 1,094.4 307 0 307 2 0 2
Schlenoff, J. 9001 2.00 0.0 15.0 15.0 0 5 5 0 1 1
Shatruk, M. 9003 2.00 0.0 40.5 40.5 0 18 18 0 2 2
Stagg, S. 9003 2.00 306.0 42.0 348.0 102 14 116 1 1 2
Steinbock, O. 9001 2.00 189.0 27.0 216.0 63 9 72 1 1 2
Stiegman, A. 9001 2.00 714.0 18.0 732.0 238 10 248 7 2 9
Strouse, G. 9001 2.00 111.0 42.0 153.0 37 14 51 1 2 3
Yang, W. 9002 2.00 798.0 0.0 798.0 266 0 266 8 0 8
25

FTE represents a calculated term FTE; the portion of full-time effort each term for all of an individual>s instruction and research activities, as represented on therespective exempt FACET certifications.
* Unlike credit hours, student headcount and course sections are NOT prorated by workload for faculty who are teaching the same class section. In these instances,headcount and section is repeated for each faculty member.
Excludes any course offered by the College of Medicine.
Department of Chemistry and Biochemistry - E&G Faculty Course & Hours
Fall 2011 - Spring 2012: Organized Courses (C, D, & L)
E&G Faculty Member SCH* Headcount* Sections*
Name Class FTE Undergrad Graduate Total Undergrad Graduate Total Undergrad Graduate Total
Zhu, L. 9002 2.00 807.0 0.0 807.0 269 0 269 7 0 7
Avg. perFaculty
1.97 594.6 28.8 623.4 288 17 305 10 1 12
Grand Total 67.1 19,027.6 921.0 19,948.6 9,224 549 9,773 326 43 369
26

FTE represents a calculated term FTE; the portion of full-time effort each term for all of an individual>s instruction and research activities, as represented on therespective exempt FACET certifications.
* Unlike credit hours, student headcount and course sections are NOT prorated by workload for faculty who are teaching the same class section. In these instances,headcount and section is repeated for each faculty member.
Excludes any course offered by the College of Medicine.
Department of Chemistry and Biochemistry - E&G Faculty Course & Hours
Fall 2011 - Spring 2012: Individualized Courses (G, T, I, O, P, R, S, & Z)
E&G Faculty Member SCH* Headcount* Sections*
Name Class FTE Undergrad Graduate Total Undergrad Graduate Total Undergrad Graduate Total
Alabugin, I. 9001 2.00 49.8 112.5 162.3 18 69 87 17 23 40
Bruschweiler,R.
9001 2.00 0.0 47.4 47.4 0 21 21 . 14 14
Cooper, W. 9001 2.00 4.0 52.8 56.8 3 48 51 3 11 14
Cross, T. 9001 1.06 3.0 57.5 60.5 1 11 12 1 6 7
Dalal, N. 9001 2.00 0.0 127.6 127.6 0 62 62 . 19 19
Dillon, S. 9121 2.00 3.0 0.0 3.0 1 0 1 1 . 1
Dorsey, J. 9001 2.00 0.0 203.1 203.1 0 88 88 . 22 22
Dudley, G. 9002 2.00 15.0 114.8 129.8 5 52 57 5 16 21
Goldsby, K. 9002 2.00 1.0 7.4 8.4 1 21 22 1 5 6
Hilinski, E. 9002 2.00 11.0 13.1 24.1 6 10 16 6 4 10
Kearley, M. 9120 2.00 9.0 0.0 9.0 4 0 4 4 . 4
Knappenberger, K.
9003 2.00 21.0 106.1 127.1 7 59 66 7 15 22
Krafft, M. 9001 2.00 . . . . . . . . .
Kroto, H. 9001 2.00 5.9 55.8 61.7 2 20 22 2 7 9
Latturner, S. 9002 2.00 6.0 64.3 70.3 2 33 35 2 12 14
Li, H. 9001 2.00 0.0 161.6 161.6 0 46 46 . 17 17
Logan, T. 9001 2.00 3.0 72.3 75.3 2 25 27 2 12 14
Marshall, A. 9001 2.00 0.0 148.7 148.7 0 62 62 . 20 20
Mattoussi, H. 9001 2.00 0.0 39.0 39.0 0 268 268 . 6 6
Mcquade, D. 9002 2.00 18.0 80.1 98.1 6 29 35 6 11 17
Miller, B. 9002 2.00 16.0 74.4 90.4 6 51 57 6 20 26
Profeta, S. 9121 2.00 . . . . . . . . .
Roper, M. 9003 2.00 6.0 121.3 127.3 2 73 75 2 18 20
Saha, S. 9003 2.00 3.0 27.0 30.0 1 5 6 1 4 5
Saltiel, J. 9001 2.00 16.0 8.8 24.8 6 7 13 6 3 9
Sang, Q. 9001 2.00 6.9 86.4 93.3 5 26 31 5 12 17
Schlenoff, J. 9001 2.00 3.0 74.9 77.9 1 23 24 1 7 8
Shatruk, M. 9003 2.00 31.0 81.2 112.2 11 61 72 11 19 30
Stagg, S. 9003 2.00 7.0 68.7 75.7 3 26 29 3 10 13
Steinbock, O. 9001 2.00 3.0 66.5 69.5 1 51 52 1 15 16
Stiegman, A. 9001 2.00 23.0 102.4 125.4 9 43 52 9 14 23
Strouse, G. 9001 2.00 4.0 128.6 132.6 2 62 64 2 22 24
Yang, W. 9002 2.00 16.0 46.9 62.9 6 11 17 6 8 14
27

FTE represents a calculated term FTE; the portion of full-time effort each term for all of an individual>s instruction and research activities, as represented on therespective exempt FACET certifications.
* Unlike credit hours, student headcount and course sections are NOT prorated by workload for faculty who are teaching the same class section. In these instances,headcount and section is repeated for each faculty member.
Excludes any course offered by the College of Medicine.
Department of Chemistry and Biochemistry - E&G Faculty Course & Hours
Fall 2011 - Spring 2012: Individualized Courses (G, T, I, O, P, R, S, & Z)
E&G Faculty Member SCH* Headcount* Sections*
Name Class FTE Undergrad Graduate Total Undergrad Graduate Total Undergrad Graduate Total
Zhu, L. 9002 2.00 0.0 68.0 68.0 0 41 41 . 15 15
Avg. perFaculty
1.97 8.9 75.6 84.5 3 44 47 4 13 16
Grand Total 67.1 284.6 2,419.2 2,703.8 111 1,404 1,515 110 387 497
28

FTE represents a calculated term FTE; the portion of full-time effort each term for all of an individual>s instruction and research activities, as represented on therespective exempt FACET certifications.
* Unlike credit hours, student headcount and course sections are NOT prorated by workload for faculty who are teaching the same class section. In these instances,headcount and section is repeated for each faculty member.
Excludes any course offered by the College of Medicine.
Department of Chemistry and Biochemistry - E&G Faculty Course & Hours
Fall 2011 - Spring 2012: All Courses
E&G Faculty Member SCH* Headcount* Sections*
Name Class FTE Undergrad Graduate Total Undergrad Graduate Total Undergrad Graduate Total
Alabugin, I. 9001 2.00 694.8 130.5 825.3 233 75 308 23 24 47
Bruschweiler,R.
9001 2.00 162.0 77.4 239.4 54 31 85 1 15 16
Cooper, W. 9001 2.00 262.0 67.8 329.8 89 53 142 5 12 17
Cross, T. 9001 1.06 3.0 57.5 60.5 1 11 12 1 6 7
Dalal, N. 9001 2.00 1,380.0 141.1 1,521.1 460 71 531 14 20 34
Dillon, S. 9121 2.00 3,247.2 30.0 3,277.2 3,694 30 3,724 159 1 160
Dorsey, J. 9001 2.00 429.0 203.1 632.1 143 88 231 2 22 24
Dudley, G. 9002 2.00 543.0 144.8 687.8 181 62 243 11 17 28
Goldsby, K. 9002 2.00 596.0 7.4 603.4 186 21 207 5 5 10
Hilinski, E. 9002 2.00 1,610.0 13.1 1,623.1 548 10 558 21 4 25
Kearley, M. 9120 2.00 2,119.8 0.0 2,119.8 740 0 740 25 0 25
Knappenberger, K.
9003 2.00 228.0 165.1 393.1 76 104 180 8 18 26
Krafft, M. 9001 2.00 372.0 18.0 390.0 124 6 130 6 1 7
Kroto, H. 9001 2.00 5.9 55.8 61.7 2 20 22 2 7 9
Latturner, S. 9002 2.00 90.0 143.3 233.3 30 85 115 3 16 19
Li, H. 9001 2.00 168.0 191.6 359.6 56 56 112 1 18 19
Logan, T. 9001 2.00 3.0 156.3 159.3 2 109 111 2 16 18
Marshall, A. 9001 2.00 0.0 196.7 196.7 0 78 78 0 21 21
Mattoussi, H. 9001 2.00 126.0 80.0 206.0 42 299 341 1 11 12
Mcquade, D. 9002 2.00 681.0 80.1 761.1 227 29 256 13 11 24
Miller, B. 9002 2.00 41.8 125.4 167.2 49 68 117 8 21 29
Profeta, S. 9121 2.00 734.4 0.0 734.4 510 0 510 37 0 37
Roper, M. 9003 2.00 159.0 241.3 400.3 53 163 216 3 23 26
Saha, S. 9003 2.00 726.0 97.0 823.0 242 63 305 7 7 14
Saltiel, J. 9001 2.00 817.0 8.8 825.8 273 7 280 13 3 16
Sang, Q. 9001 2.00 1,101.3 86.4 1,187.7 312 26 338 7 12 19
Schlenoff, J. 9001 2.00 3.0 89.9 92.9 1 28 29 1 8 9
Shatruk, M. 9003 2.00 31.0 121.7 152.7 11 79 90 11 21 32
Stagg, S. 9003 2.00 313.0 110.7 423.7 105 40 145 4 11 15
Steinbock, O. 9001 2.00 192.0 93.5 285.5 64 60 124 2 16 18
Stiegman, A. 9001 2.00 737.0 120.4 857.4 247 53 300 16 16 32
Strouse, G. 9001 2.00 115.0 170.6 285.6 39 76 115 3 24 27
Yang, W. 9002 2.00 814.0 46.9 860.9 272 11 283 14 8 22
29
FTE represents a calculated term FTE; the portion of full-time effort each term for all of an individual>s instruction and research activities, as represented on therespective exempt FACET certifications.
* Unlike credit hours, student headcount and course sections are NOT prorated by workload for faculty who are teaching the same class section. In these instances,headcount and section is repeated for each faculty member.
Excludes any course offered by the College of Medicine.
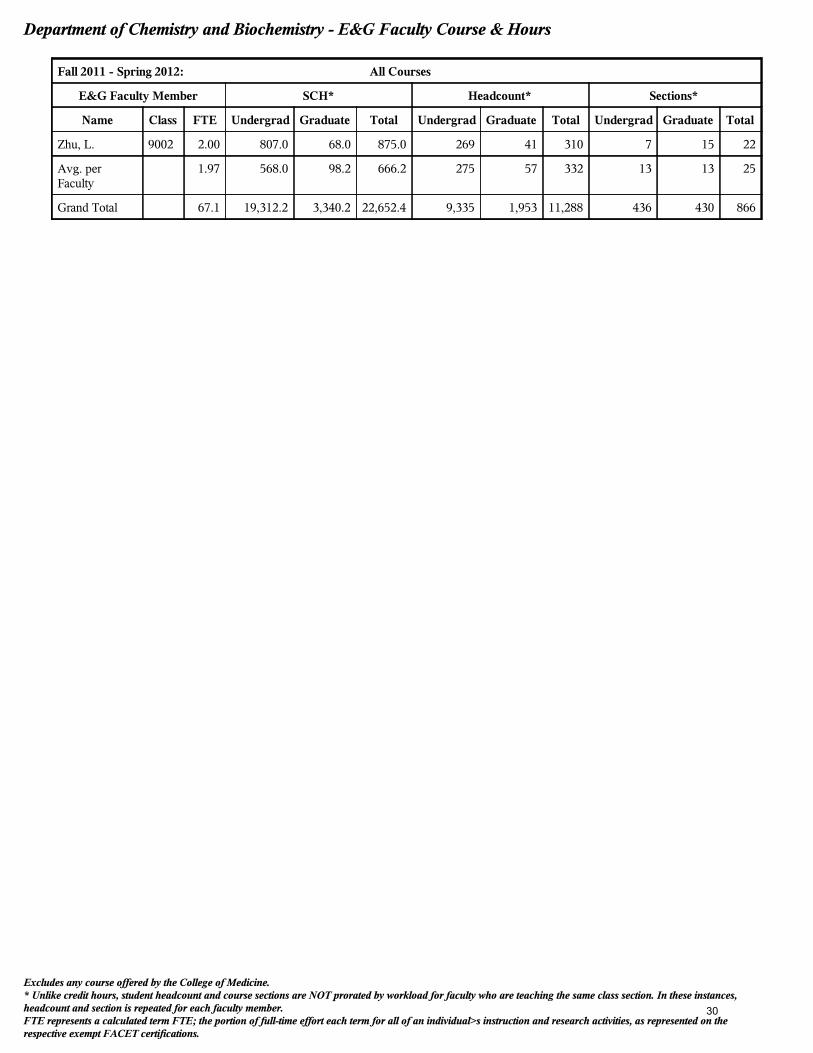
Department of Chemistry and Biochemistry - E&G Faculty Course & Hours
Fall 2011 - Spring 2012: All Courses
E&G Faculty Member SCH* Headcount* Sections*
Name Class FTE Undergrad Graduate Total Undergrad Graduate Total Undergrad Graduate Total
Zhu, L. 9002 2.00 807.0 68.0 875.0 269 41 310 7 15 22
Avg. perFaculty
1.97 568.0 98.2 666.2 275 57 332 13 13 25
Grand Total 67.1 19,312.2 3,340.2 22,652.4 9,335 1,953 11,288 436 430 866
30

FTE represents a calculated term FTE; the portion of full-time effort each term for all of an individual>s instruction and research activities, as represented on therespective exempt FACET certifications.
* Unlike credit hours, student headcount and course sections are NOT prorated by workload for faculty who are teaching the same class section. In these instances,headcount and section is repeated for each faculty member.
Excludes any course offered by the College of Medicine.
Department of Chemistry and Biochemistry - E&G Faculty Course & Hours
Fall 2015 - Spring 2016: Organized Courses (C, D, & L)
E&G Faculty Member SCH* Headcount* Sections*
Name Class FTE Undergrad Graduate Total Undergrad Graduate Total Undergrad Graduate Total
Alabugin, I. 9001 2.00 90.0 30.0 120.0 30 10 40 1 1 2
Albrecht-Schmitt, T.
9001 2.00 198.0 68.0 266.0 66 44 110 2 5 7
Bleiholder, C. 9003 2.00 0.0 90.0 90.0 0 58 58 0 5 5
Cross, T. 9001 2.00 354.0 0.0 354.0 118 0 118 1 0 1
Dalal, N. 9001 2.00 0.0 69.0 69.0 0 25 25 0 2 2
De Prince, A. 9003 2.00 228.0 0.0 228.0 76 0 76 2 0 2
Deprince, B. 9060 2.00 1,497.0 0.0 1,497.0 737 0 737 13 0 13
Dillon, S. 9061 2.00 3,494.0 8.0 3,502.0 3,428 8 3,436 148 2 150
Dorsey, J. 9001 2.00 363.0 0.0 363.0 121 0 121 2 0 2
Dudley, G. 9001 2.00 969.0 12.0 981.0 646 4 650 13 1 14
Frederich, J. 9003 2.00 90.0 24.0 114.0 30 8 38 1 1 2
Goldsby, K. 9002 2.00 2,009.0 0.0 2,009.0 1,303 0 1,303 32 0 32
Hanson, K. 9003 2.00 732.0 9.0 741.0 488 3 491 10 1 11
Hilinski, E. 9002 2.00 1,965.0 0.0 1,965.0 1,279 0 1,279 28 0 28
Hu, Y. 9003 2.00 447.0 33.0 480.0 149 33 182 2 2 4
Kearley, M. 9062 2.00 2,388.0 0.0 2,388.0 1,288 0 1,288 23 0 23
Kennemur, J. 9003 2.00 93.0 61.1 154.1 31 21 52 1 1 2
Knappenberger, K.
9002 2.00 138.0 15.0 153.0 46 5 51 1 1 2
Latturner, S. 9002 2.00 732.0 27.0 759.0 488 9 497 10 1 11
Li, H. 9001 2.00 0.0 53.0 53.0 0 19 19 0 2 2
Marshall, A. 9001 2.00 0.0 30.0 30.0 0 10 10 0 1 1
Mattoussi, H. 9001 2.00 321.0 0.0 321.0 107 0 107 2 0 2
Miller, B. 9002 2.00 138.0 45.0 183.0 92 15 107 3 1 4
Profeta, S. 9061 2.00 1,184.0 14.0 1,198.0 831 14 845 36 1 37
Roper, M. 9002 2.00 960.0 21.0 981.0 640 7 647 13 1 14
Saha, S. 9003 2.00 1,473.0 46.0 1,519.0 982 46 1,028 20 2 22
Saltiel, J. 9001 2.00 414.0 2.0 416.0 276 2 278 9 1 10
Sang, Q. 9001 2.00 150.0 0.0 150.0 50 0 50 1 0 1
Schlenoff, J. 9001 2.00 726.0 24.0 750.0 485 8 493 10 1 11
Shatruk, M. 9002 2.00 24.0 187.0 211.0 8 103 111 1 6 7
Stagg, S. 9002 2.00 600.0 2.0 602.0 200 2 202 1 1 2
Steinbock, O. 9001 2.00 249.0 16.0 265.0 83 6 89 1 1 2
Stiegman, A. 9001 2.00 744.0 63.0 807.0 496 21 517 10 1 11
31

FTE represents a calculated term FTE; the portion of full-time effort each term for all of an individual>s instruction and research activities, as represented on therespective exempt FACET certifications.
* Unlike credit hours, student headcount and course sections are NOT prorated by workload for faculty who are teaching the same class section. In these instances,headcount and section is repeated for each faculty member.
Excludes any course offered by the College of Medicine.
Department of Chemistry and Biochemistry - E&G Faculty Course & Hours
Fall 2015 - Spring 2016: Organized Courses (C, D, & L)
E&G Faculty Member SCH* Headcount* Sections*
Name Class FTE Undergrad Graduate Total Undergrad Graduate Total Undergrad Graduate Total
Strouse, G. 9001 2.00 744.0 15.0 759.0 496 5 501 10 1 11
Yang, W. 9002 2.00 0.0 121.0 121.0 0 83 83 0 6 6
Zhu, L. 9002 2.00 732.0 15.0 747.0 489 5 494 10 1 11
Avg. perFaculty
2.00 673.5 30.6 704.1 432 16 448 12 1 13
Grand Total 72.0 24,246.0 1,100.1 25,346.1 15,559 574 16,133 417 50 467
32

FTE represents a calculated term FTE; the portion of full-time effort each term for all of an individual>s instruction and research activities, as represented on therespective exempt FACET certifications.
* Unlike credit hours, student headcount and course sections are NOT prorated by workload for faculty who are teaching the same class section. In these instances,headcount and section is repeated for each faculty member.
Excludes any course offered by the College of Medicine.
Department of Chemistry and Biochemistry - E&G Faculty Course & Hours
Fall 2015 - Spring 2016: Individualized Courses (G, T, I, M, O, P, R, S, & Z)
E&G Faculty Member SCH* Headcount* Sections*
Name Class FTE Undergrad Graduate Total Undergrad Graduate Total Undergrad Graduate Total
Alabugin, I. 9001 2.00 17.0 121.0 138.0 8 19 27 8 6 14
Albrecht-Schmitt, T.
9001 2.00 17.0 135.0 152.0 7 294 301 7 8 15
Bleiholder, C. 9003 2.00 3.0 38.0 41.0 1 6 7 1 3 4
Cross, T. 9001 2.00 1.0 68.0 69.0 1 9 10 1 5 6
Dalal, N. 9001 2.00 3.0 52.0 55.0 2 8 10 2 4 6
De Prince, A. 9003 2.00 3.0 32.0 35.0 3 6 9 3 5 8
Deprince, B. 9060 2.00 . . . . . . . . .
Dillon, S. 9061 2.00 1,154.0 0.0 1,154.0 290 0 290 7 . 7
Dorsey, J. 9001 2.00 0.0 41.0 41.0 0 4 4 . 2 2
Dudley, G. 9001 2.00 17.0 71.0 88.0 7 11 18 7 5 12
Frederich, J. 9003 2.00 6.0 63.0 69.0 3 13 16 3 5 8
Goldsby, K. 9002 2.00 11.0 0.0 11.0 5 0 5 5 . 5
Hanson, K. 9003 2.00 12.0 76.0 88.0 4 13 17 4 7 11
Hilinski, E. 9002 2.00 4.0 0.0 4.0 2 0 2 2 . 2
Hu, Y. 9003 2.00 0.0 48.0 48.0 0 11 11 . 4 4
Kearley, M. 9062 2.00 . . . . . . . . .
Kennemur, J. 9003 2.00 10.0 88.0 98.0 4 16 20 4 4 8
Knappenberger, K.
9002 2.00 6.0 127.0 133.0 2 19 21 2 6 8
Latturner, S. 9002 2.00 2.0 85.0 87.0 1 14 15 1 6 7
Li, H. 9001 2.00 10.0 57.0 67.0 4 9 13 4 6 10
Marshall, A. 9001 2.00 7.0 150.2 157.2 3 22 25 3 6 9
Mattoussi, H. 9001 2.00 9.0 95.0 104.0 3 14 17 3 5 8
Miller, B. 9002 2.00 4.0 80.3 84.3 2 14 16 2 7 9
Profeta, S. 9061 2.00 1.0 0.0 1.0 1 0 1 1 . 1
Roper, M. 9002 2.00 11.0 81.0 92.0 6 17 23 6 6 12
Saha, S. 9003 2.00 6.0 38.0 44.0 2 5 7 2 4 6
Saltiel, J. 9001 2.00 17.0 4.0 21.0 9 2 11 9 2 11
Sang, Q. 9001 2.00 6.0 63.0 69.0 6 10 16 6 7 13
Schlenoff, J. 9001 2.00 3.0 106.0 109.0 1 16 17 1 6 7
Shatruk, M. 9002 2.00 2.0 153.0 155.0 1 23 24 1 6 7
Stagg, S. 9002 2.00 19.0 21.0 40.0 7 3 10 7 3 10
Steinbock, O. 9001 2.00 18.0 49.0 67.0 7 9 16 7 8 15
Stiegman, A. 9001 2.00 6.0 123.0 129.0 2 24 26 2 6 8
33
FTE represents a calculated term FTE; the portion of full-time effort each term for all of an individual>s instruction and research activities, as represented on therespective exempt FACET certifications.
* Unlike credit hours, student headcount and course sections are NOT prorated by workload for faculty who are teaching the same class section. In these instances,headcount and section is repeated for each faculty member.
Excludes any course offered by the College of Medicine.
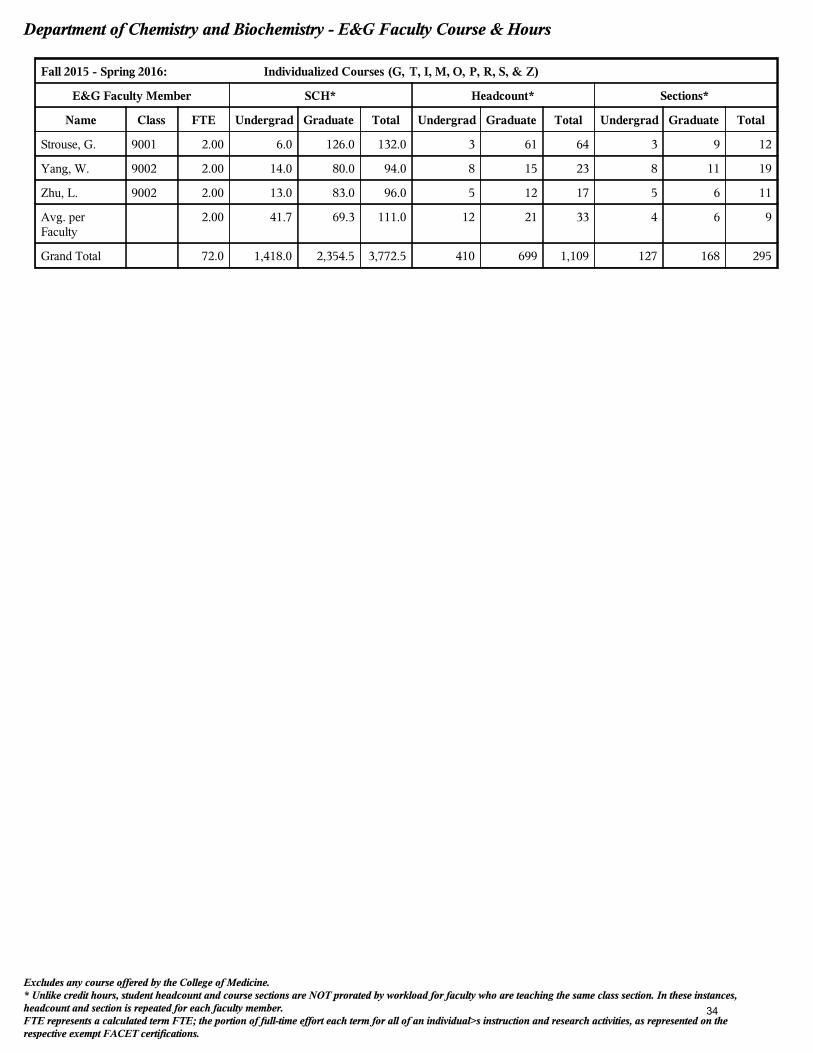
Department of Chemistry and Biochemistry - E&G Faculty Course & Hours
Fall 2015 - Spring 2016: Individualized Courses (G, T, I, M, O, P, R, S, & Z)
E&G Faculty Member SCH* Headcount* Sections*
Name Class FTE Undergrad Graduate Total Undergrad Graduate Total Undergrad Graduate Total
Strouse, G. 9001 2.00 6.0 126.0 132.0 3 61 64 3 9 12
Yang, W. 9002 2.00 14.0 80.0 94.0 8 15 23 8 11 19
Zhu, L. 9002 2.00 13.0 83.0 96.0 5 12 17 5 6 11
Avg. perFaculty
2.00 41.7 69.3 111.0 12 21 33 4 6 9
Grand Total 72.0 1,418.0 2,354.5 3,772.5 410 699 1,109 127 168 295
34
FTE represents a calculated term FTE; the portion of full-time effort each term for all of an individual>s instruction and research activities, as represented on therespective exempt FACET certifications.
* Unlike credit hours, student headcount and course sections are NOT prorated by workload for faculty who are teaching the same class section. In these instances,headcount and section is repeated for each faculty member.
Excludes any course offered by the College of Medicine.
Department of Chemistry and Biochemistry - E&G Faculty Course & Hours
FTE represents a calculated term FTE; the portion of full-time effort each term for all of an individual>s instruction and research activities, as represented on therespective exempt FACET certifications.
* Unlike credit hours, student headcount and course sections are NOT prorated by workload for faculty who are teaching the same class section. In these instances,headcount and section is repeated for each faculty member.
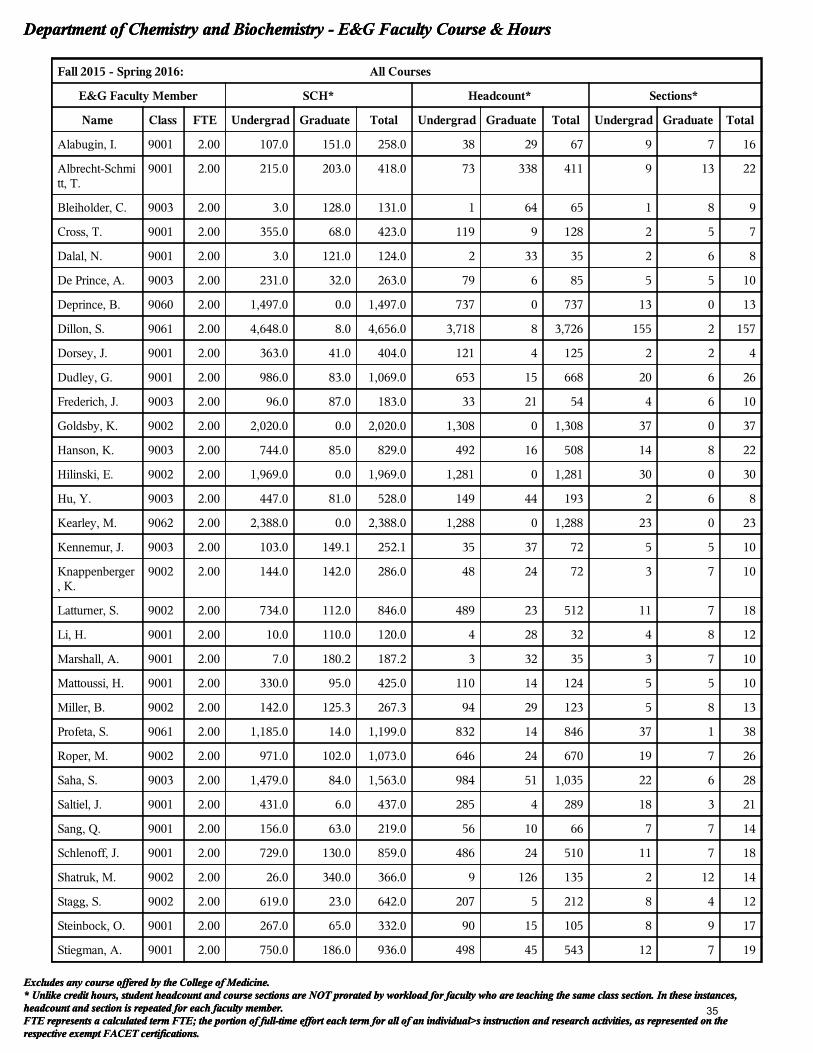
Excludes any course offered by the College of Medicine.
Department of Chemistry and Biochemistry - E&G Faculty Course & Hours
Fall 2015 - Spring 2016: All Courses
E&G Faculty Member SCH* Headcount* Sections*
Name Class FTE Undergrad Graduate Total Undergrad Graduate Total Undergrad Graduate Total
Alabugin, I. 9001 2.00 107.0 151.0 258.0 38 29 67 9 7 16
Albrecht-Schmitt, T.
9001 2.00 215.0 203.0 418.0 73 338 411 9 13 22
Bleiholder, C. 9003 2.00 3.0 128.0 131.0 1 64 65 1 8 9
Cross, T. 9001 2.00 355.0 68.0 423.0 119 9 128 2 5 7
Dalal, N. 9001 2.00 3.0 121.0 124.0 2 33 35 2 6 8
De Prince, A. 9003 2.00 231.0 32.0 263.0 79 6 85 5 5 10
Deprince, B. 9060 2.00 1,497.0 0.0 1,497.0 737 0 737 13 0 13
Dillon, S. 9061 2.00 4,648.0 8.0 4,656.0 3,718 8 3,726 155 2 157
Dorsey, J. 9001 2.00 363.0 41.0 404.0 121 4 125 2 2 4
Dudley, G. 9001 2.00 986.0 83.0 1,069.0 653 15 668 20 6 26
Frederich, J. 9003 2.00 96.0 87.0 183.0 33 21 54 4 6 10
Goldsby, K. 9002 2.00 2,020.0 0.0 2,020.0 1,308 0 1,308 37 0 37
Hanson, K. 9003 2.00 744.0 85.0 829.0 492 16 508 14 8 22
Hilinski, E. 9002 2.00 1,969.0 0.0 1,969.0 1,281 0 1,281 30 0 30
Hu, Y. 9003 2.00 447.0 81.0 528.0 149 44 193 2 6 8
Kearley, M. 9062 2.00 2,388.0 0.0 2,388.0 1,288 0 1,288 23 0 23
Kennemur, J. 9003 2.00 103.0 149.1 252.1 35 37 72 5 5 10
Knappenberger, K.
9002 2.00 144.0 142.0 286.0 48 24 72 3 7 10
Latturner, S. 9002 2.00 734.0 112.0 846.0 489 23 512 11 7 18
Li, H. 9001 2.00 10.0 110.0 120.0 4 28 32 4 8 12
Marshall, A. 9001 2.00 7.0 180.2 187.2 3 32 35 3 7 10
Mattoussi, H. 9001 2.00 330.0 95.0 425.0 110 14 124 5 5 10
Miller, B. 9002 2.00 142.0 125.3 267.3 94 29 123 5 8 13
Profeta, S. 9061 2.00 1,185.0 14.0 1,199.0 832 14 846 37 1 38
Roper, M. 9002 2.00 971.0 102.0 1,073.0 646 24 670 19 7 26
Saha, S. 9003 2.00 1,479.0 84.0 1,563.0 984 51 1,035 22 6 28
Saltiel, J. 9001 2.00 431.0 6.0 437.0 285 4 289 18 3 21
Sang, Q. 9001 2.00 156.0 63.0 219.0 56 10 66 7 7 14
Schlenoff, J. 9001 2.00 729.0 130.0 859.0 486 24 510 11 7 18
Shatruk, M. 9002 2.00 26.0 340.0 366.0 9 126 135 2 12 14
Stagg, S. 9002 2.00 619.0 23.0 642.0 207 5 212 8 4 12
Steinbock, O. 9001 2.00 267.0 65.0 332.0 90 15 105 8 9 17
Stiegman, A. 9001 2.00 750.0 186.0 936.0 498 45 543 12 7 19
35

FTE represents a calculated term FTE; the portion of full-time effort each term for all of an individual>s instruction and research activities, as represented on therespective exempt FACET certifications.
* Unlike credit hours, student headcount and course sections are NOT prorated by workload for faculty who are teaching the same class section. In these instances,headcount and section is repeated for each faculty member.
Excludes any course offered by the College of Medicine.
Department of Chemistry and Biochemistry - E&G Faculty Course & Hours
Fall 2015 - Spring 2016: All Courses
E&G Faculty Member SCH* Headcount* Sections*
Name Class FTE Undergrad Graduate Total Undergrad Graduate Total Undergrad Graduate Total
Strouse, G. 9001 2.00 750.0 141.0 891.0 499 66 565 13 10 23
Yang, W. 9002 2.00 14.0 201.0 215.0 8 98 106 8 17 25
Zhu, L. 9002 2.00 745.0 98.0 843.0 494 17 511 15 7 22
Avg. perFaculty
2.00 712.9 96.0 808.9 444 35 479 15 6 21
Grand Total 72.0 25,664.0 3,454.6 29,118.6 15,969 1,273 17,242 544 218 762
36
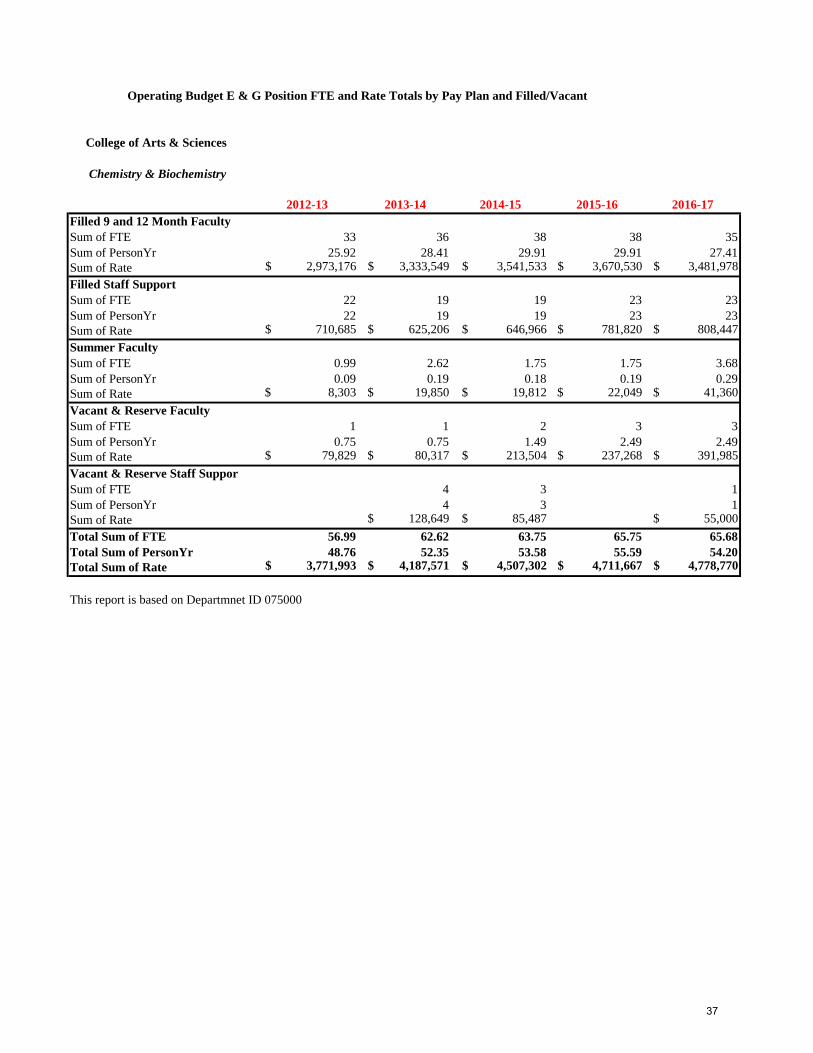
Operating Budget E & G Position FTE and Rate Totals by Pay Plan and Filled/Vacant
College of Arts & Sciences
Chemistry & Biochemistry
2012-13 2013-14 2014-15 2015-16 2016-17
Filled 9 and 12 Month Faculty
Sum of FTE 33 36 38 38 35
Sum of PersonYr 25.92 28.41 29.91 29.91 27.41
Sum of Rate $ 2,973,176 $ 3,333,549 $ 3,541,533 $ 3,670,530 $ 3,481,978
Filled Staff Support
Sum of FTE 22 19 19 23 23
Sum of PersonYr 22 19 19 23 23
Sum of Rate $ 710,685 $ 625,206 $ 646,966 $ 781,820 $ 808,447
Summer Faculty
Sum of FTE 0.99 2.62 1.75 1.75 3.68
Sum of PersonYr 0.09 0.19 0.18 0.19 0.29
Sum of Rate $ 8,303 $ 19,850 $ 19,812 $ 22,049 $ 41,360
Vacant & Reserve Faculty
Sum of FTE 1 1 2 3 3
Sum of PersonYr 0.75 0.75 1.49 2.49 2.49
Sum of Rate $ 79,829 $ 80,317 $ 213,504 $ 237,268 $ 391,985
Vacant & Reserve Staff Suppor
Sum of FTE 4 3 1
Sum of PersonYr 4 3 1
Sum of Rate $ 128,649 $ 85,487 $ 55,000
Total Sum of FTE 56.99 62.62 63.75 65.75 65.68
Total Sum of PersonYr 48.76 52.35 53.58 55.59 54.20
Total Sum of Rate $ 3,771,993 $ 4,187,571 $ 4,507,302 $ 4,711,667 $ 4,778,770
This report is based on Departmnet ID 075000
37

E & G Expenditures by Budget Category , By Object Code, Department within Colleges
College of Arts & Sciences
Chemistry & Biochemistry
2011-12 2012-13 2013-14 2014-15 2015-16
SALARY
A&P 225,045$ 224,151$ 192,813$ 226,556$ 287,340$
FACULTY 2,181,444$ 2,923,622$ 3,197,485$ 3,573,796$ 3,854,885$
FRINGE BENEFITS 776,505$ 934,438$ 1,093,505$ 1,261,355$ 1,338,354$
OTHER SALARY 11,334$ 30,637$ 1,661$ 414$
USPS 410,679$ 429,037$ 427,267$ 494,691$ 527,406$
SALARY Total 3,593,673$ 4,522,582$ 4,941,707$ 5,558,059$ 6,008,399$
EXPENSE
BEDDING & TEXTILES 214$ 7$
CONSTRUCTION SUPPLIES 185$ 2,759$ 7,547$
CONSULTING & OTHER 8,519$ 28,554$ 10,950$ 16,859$ 6,348$
EDUCATIONAL SUPPLIES 20,765$ 22,302$ 21,344$ 9,041$ 5,197$
EQUIPMENT & BOOKS 43,096$ 83,522$ 108,104$ 46,191$ 61,874$
EXPENSE OTHER 5,263$ 3,512$ 2,145$ 1,368$
FREIGHT 33$
INSURANCE & BENEFITS 342$ 195$
MAINT & HEATING SUPPLIES 7,105$ 27,290$ 16,665$ 36,022$ 10,754$
MOTOR FUELS & LUBRICANTS 1,107$ 1,007$ 818$ 544$ 529$
OFFICE SUPPLIES 15,439$ 17,327$ 17,000$ 12,348$ 12,344$
OTHER CURRENT CHARGES 2,212$ 753$ 2,256$ 18$
OTHER MATERIALS & SUPPLIES 1,656$ 3,217$ 5,189$ 2,693$ 2,584$
POSTAGE 1,013$
PRINTING 1,310$ 1,664$ 1,034$ 522$ 180$
PURCHASE FOR RESALE 219$ 194$ 905$ 650$ 650$
RENTAL OF BUILDINGS 495$ 1,118$ 823$ 336$ 323$
RENTAL OF EQUIPMENT 16,689$ 18,860$
REPAIRS & MAINTENANCE 44,667$ 32,521$ 17,050$ 29,394$ 18,395$
TELEPHONE 43,648$ 46,329$ 50,105$ 47,127$ 48,825$
TRAVEL 1,112$ 16,872$ 2,759$ 5,636$ 9,001$
EXPENSE Total 192,738$ 288,332$ 258,521$ 229,151$ 204,797$
OPS
ADJUNCT FACULTY 16,038$
FACULTY ADJUNCTS 368,071$ 255,719$ 185,761$ 156,229$
FRINGE BENEFITS 5,685$ 4,352$ 3,292$ 2,253$
GRAD ASST 357,234$ 1,833,736$ 1,994,775$ 2,077,568$ 2,047,134$
OPS FACULTY 29,960$
OPS FRINGE BENEFITS 1,673$
OPS OTHER 21,907$ 49,582$ 48,882$ 43,906$ 29,897$
POST DOCTORAL ASSOC 45,249$
STUDENT ASST 14,953$ 177,745$ 79,237$ 70,908$ 104,266$
OPS Total 487,014$ 2,434,819$ 2,382,965$ 2,381,435$ 2,339,779$
Grand Total 4,273,425$ 7,245,733$ 7,583,193$ 8,168,645$ 8,552,975$
38

College of Arts and SciencesDepartment of Chemistry and BiochemistryGraduate Admissions
Level Gender Citizenship Ap
plie
d
Acc
epte
d
En
rolle
d
Ap
plie
d
Acc
epte
d
En
rolle
d
Ap
plie
d
Acc
epte
d
En
rolle
d
Ap
plie
d
Acc
epte
d
En
rolle
d
Ap
plie
d
Acc
epte
d
En
rolle
d
Ap
plie
d
Acc
epte
d
En
rolle
d
Domestic 12 9 4 28 18 7 23 17 5 29 13 5 31 17 5 29 19 4International 44 14 8 33 8 3 36 12 5 50 16 3 36 17 5 38 12 3Domestic 33 26 11 46 26 12 47 32 19 46 28 15 50 37 14 46 40 19International 62 14 6 49 11 7 49 17 7 61 22 8 56 15 8 53 20 7
151 63 29 156 63 29 155 78 36 186 79 31 173 86 32 166 91 33
*Spring 2017 admissions data is not included.
Source: Admissions Files
2016-17
GraduateFemale
Male
Graduate Total
CIP: 500703 2011-12 2012-13 2013-14 2014-15 2015-16
39

College of Arts and SciencesDepartment of Chemistry and BiochemistryGraduate Admissions - Average GRE and College GPA
Enrolled New Graduate Students
CIP Code YearNumber of
GRE ScoresQuantitative
AverageVerbal
AverageTotal
AverageNumber of GPAs
Average GPA
2011-12 29 717 481 1198 29 3.3
2012-13 15 705 499 1205
2012-13* 13 156 155 311
2013-14* 31 157 152 309 36 3.4
2014-15* 28 157 153 310 31 3.5
2015-16* 32 159 154 313 32 3.5
2016-17* 33 160 154 314 33 3.4
*Spring 2017 admissions data not included.
Source: Admissions Files
400501
*FSU began using GRE 2 scores in 2012-13. Some students took the GRE in a prior year, and are are not included in the averages. For 2012-13, both areincluded in the table; 5 students were excluded in 2013-14; 3 students were excluded in 2014-15.
29 3.3
40