chemistry, etc. values and interpretations
TRANSCRIPT
8/8/2019 Chemistry, Etc. Values and Interpretations
http://slidepdf.com/reader/full/chemistry-etc-values-and-interpretations 1/28
Presented by:
12400 High Bluff DriveSan Diego, CA 92130
This course has been approved for two (2.0) contact hours.This course expires on October 14, 2008.
Copyright © 2005 by RN.com.All Rights Reserved. Reproduction and distribution
of these materials are prohibited without theexpress written authorization of RN.com.
First Published: October 14, 2005
Lab Value Interpretation for Nurses:
Chemistries and Renal Studies
8/8/2019 Chemistry, Etc. Values and Interpretations
http://slidepdf.com/reader/full/chemistry-etc-values-and-interpretations 2/28
1
Acknowledgements ________________________________________________________2
Purpose & Objectives ______________________________________________________3
Introduction ______________________________________________________________4
Chemistries_______________________________________________________________5
Sodium (NA) ______________________________________________________________5
Chloride (CL) _____________________________________________________________6
Potassium (K)_____________________________________________________________ 7
Calcium (CA)______________________________________________________________7
Magnesium (MG) __________________________________________________________9
Phosphate (P)_____________________________________________________________ 9
Carbon Dioxide (CO2) _____________________________________________________10
Serum Osmolality_________________________________________________________10
Glucose _________________________________________________________________ 10 Hemoglobin A1C (Hgb A1C)__________________________________________________11
Case Studies: ____________________________________________________________12
Case Study Responses ____________________________________________________14
Renal Function Tests______________________________________________________15
Blood Urea Nitrogen (BUN) _________________________________________________15
Creatinine _______________________________________________________________16
BUN and Creatinine Ratios _________________________________________________16
Creatinine Clearance ______________________________________________________17
Case Studies_____________________________________________________________18
Case Study Responses ____________________________________________________19
Urinalysis _______________________________________________________________20
Case Studies_____________________________________________________________22
Case Study Responses ____________________________________________________24
Conclusion ______________________________________________________________25
References ______________________________________________________________26
Post Test Viewing Instructions______________________________________________27

8/8/2019 Chemistry, Etc. Values and Interpretations
http://slidepdf.com/reader/full/chemistry-etc-values-and-interpretations 3/28
2
ACKNOWLEDGEMENTS
RN.com acknowledges the valuable contribution of…
… Lori Constantine MSN, RN, C-FNP , author of Lab Value Interpretation for Nurses: Chemistries and Renal Studies . Lori has been a nurse for nine years and has a broad range of clinical experience.She has worked as a staff nurse, charge nurse, and nurse preceptor on many different medicalsurgical units including vascular, neurology, neurosurgery, urology, gynecology, ENT, generalmedicine, geriatrics, oncology, and blood and marrow transplantation. She received her Bachelors inNursing in 1994 and a Masters in Nursing in 1998, both from West Virginia University. Additionally, in1998, she was certified as a Family Nurse Practitioner. She has worked in staff development as aNurse Clinician and Education Specialist since 1999 at West Virginia University Hospitals,Morgantown, WV.

8/8/2019 Chemistry, Etc. Values and Interpretations
http://slidepdf.com/reader/full/chemistry-etc-values-and-interpretations 4/28
3
PURPOSE & OBJECTIVES
The purpose of this continuing education module is to provide nurses with the knowledge and skills torecognize changes in common chemistry and renal lab values. Additionally, after completing thismodule, you will be able to discuss reasons why these common lab values may be either elevated or decreased.
After successful completion of this course, participants will be able to:
1. Define the normal ranges for the key chemistry values described in this course.
2. Name one reason for an increase or decrease in the key chemistries.
3. Define the difference between the two key lab values related to renal function
4. Describe how creatinine clearance values in combination with BUN and creatinine outline therenal function of an individual.
5. Name 2 key parts of the urinalysis and what they test for.
You may find that both generic and trade names are used incourses produced by RN.com. The use of trade names does notindicate any preference of one trade named agent or company
over another. Trade names are provided to enhance recognition of agents described in the course.

8/8/2019 Chemistry, Etc. Values and Interpretations
http://slidepdf.com/reader/full/chemistry-etc-values-and-interpretations 5/28
4
INTRODUCTION
RN.com is presenting a series of courses on lab values. Evaluation of labs by nursing staff is a criticalfunction. Although the reports we receive often indicate high or low values, understanding the truemeaning of these values in the context of the patient’s condition, history, and other factors is critical tosafe care of the patient.
In this first part of the series, we will cover common chemistry values and renal function studies.These two types of labs are often grouped together to give a basic overview of the status of thepatient, excluding issues surrounding hematology. These basic tests and their interpretation shouldbe familiar to all nurses. Common chemistry values that this course will review include: sodium (NA),chloride (CL), potassium (K), calcium (CA), magnesium (MG), phosphate (P), carbon dioxide (CO2),serum osmolality, glucose and hemoglobin A1C, (Hgb A1C). BUN, Creatinine, and CreatinineClearance will also be discussed. The common urinalysis will be reviewed at the conclusion of thecourse.

8/8/2019 Chemistry, Etc. Values and Interpretations
http://slidepdf.com/reader/full/chemistry-etc-values-and-interpretations 6/28
5
CHEMISTRIES
Sodium (NA) Normal Range: 135-146 mEq/L
Sodium is the most abundant cation (positively charged ion) in the extracellular fluidand the chief base of the body. It functions in the body to maintain osmotic pressure,acid-base balance, and to transmit nerve impulses. Some nurses find it easier to thinkof the net sodium content of the body as fixed and the water content of the body asvariable. This way, interpretation of abnormal sodium values focus on determining thecause of abnormal water volume. Since sodium is reported per liter of plasma water,when a sodium value is abnormal, you must determine if it is the sodium that is alteredor the body’s water content that is altered (Traub, 1996).
Causes ofHyponatremia
(associated with lowtotal body sodium)
Causes of Hyponatremia (associated with normal total body
sodium) AKA Euvolemic or dilutional hyponatremia
Causes ofHyponatremia
(associated with hightotal body sodium)
Rapid infusion of hypotonic solution(dilutional)Fluid replacementwith D5W (dilutional)Vomiting and/or diarrheaIntravascular lossesdue to burn,
peritonitis,pancreatitisHypoaldosteronism(Addison’s Disease)Aggressive diuresisHyperglycemia &mannitol infusions(due to osmoticdiuresis)
Any mechanism which enhances ADHsecretion or potentiates its action in thecollecting tubules of the kidneysGlucocorticoid deficiencySevere hypothyroidismAdministration of water to a patient withimpaired water excretion capacitySIADH (syndrome of inappropriate anti-diuretic hormone)
Drugs that increase ADH secretion(carbamazapine, chlorpropamide,chlofibrate, diuretics, narcotics,nicotine, vincristine)Drugs that have ADH-like action or potentiate ADH renal effect(acetaminophen, ADH analogs,chlorpropamide, cyclophosphamide,diuretics, non-steroidal anti-inflammatory drugs –NSAIDS-)
Edematous statessuch as CHF,cirrhosis, nephroticsyndrome, chronicrenal failure
(Traub, 1996)

8/8/2019 Chemistry, Etc. Values and Interpretations
http://slidepdf.com/reader/full/chemistry-etc-values-and-interpretations 7/28
6
Causes ofHypernatremia
(associated with lowtotal body sodium)
Causes ofHypernatremia
(associated with normal totalbody sodium) AKA Euvolemic
hypernatremia
Causes of Hypernatremia (associated with high total body
sodium) Least Common
Impaired thirstmechanismHypotonic fluidlosses (profusesweating, diarrhea)
Increased insensible water loss (Fever, extensive burns,mechanical ventilation)Central and nephrogenicdiabetes insipidus
Exogenous administration of high-sodium containing fluidsResuscitative efforts usinghypertonic sodium bicarbonateInadvertent IV infusion of hypertonic sodium solutionsInadvertent dialysis againsthigh-sodium containing solutionSea-water near drowningPrimary hyperaldosteronismCushing’s disease
(Traub, 1996)
Chloride (CL)
Normal Range: 96-106 mEq/L
Chloride is the most abundant anion (negatively charged ion) in the extracellular fluid.Chloride is influenced by the extracellular fluid balance and acid-base balance. Chloridepassively follows water and sodium. Chloride is typically used as a confirmation of awater or acid-base imbalance in the body. Chloride increases as sodium increases, anddecreases as sodium decreases – except when your patient is experiencing significant
GI losses. Chloride can be three times more abundant in the stomach than sodium. Sowhen your patient is on acid-suppression therapy (i.e. cimetidine or omeprazole), has anasogastric tube or is excessively vomiting, you may see a lower than normal chloride inthe presence of a normal sodium (Sherwood, 1997 & Traub, 1996).
Causes of Hyperchloremia Causes of Hypochloremia
Salt and water retention (corticosteroids,guanethidine, NSAIDs)AcetazolamideParenteral nutritionMetabolic or respiratory acidosis (increased
renal retention)Interstitial renal disease (obstruction,pyelonephritis, analgesic neuropathy)GI: Bicarbonate loss (cholera,staphylococcus infections of the intestines)Bromide toxicity (false elevation)
Acid suppression therapyNasogastric tube suctionExcessive vomitingGastric outlet obstructionMetabolic alkalosis (increased renal
excretion)
(Traub, 1996)

8/8/2019 Chemistry, Etc. Values and Interpretations
http://slidepdf.com/reader/full/chemistry-etc-values-and-interpretations 8/28
7
Potassium (K)
Normal Range: 3.5-5.0 mEq/L
Potassium is the major cation in the intracellular space. Potassium regulates muscle andnerve excitability. Other less known roles include: regulation of intracellular volume,protein synthesis, enzymatic reaction, and carbohydrate metabolism (Oh & Carroll, 1994 &Zull, 1989). Although potassium influences muscle contraction and nerve excitability allover the body, the potential for life threatening cardiac arrhythmias make alteredpotassium values very concerning.
Causes of Hyperkalemia Causes of Hypokalemia
Extracellular shifting of potassium (metabolicacidosis)Increased exogenous intake (salt
substitutes, drugs such as penicillinpotassium)Increased endogenous intake (hemolysis,rhabdomyolysis, muscle crush injuries,burns)Decreased output of potassium due tochronic or acute renal failureDecreased potassium output due to drugs(potassium-sparing diuretics, angiotension-converting enzyme inhibitors, NSAIDs, B-adrenergic agonists, heparin, trimethoprim)Deficiency of adrenal steroids
Addison’s disease
Intracellular shifting of potassium (alkalosis,B-Adrenergic stimulation, Insulin)Decreased intake (alcoholism, potassium
free IV fluids, anorexia nervosa, bulimia)Increased output due to extrarenal causes(vomiting, diarrhea, laxative abuse, intestinalfistula)Increased output of potassium due to renalcauses (corticosteroids, amphotericin B,diuretics, hyperaldosteronism, Cushing’ssyndrome, licorice abuse)
(Sherwood, 1997 & Traub, 1996)
Calcium (CA)
Normal Range: 8.5-10.8 mg/dl
Calcium plays a key role in neuromuscular excitability, muscle contraction, regulation of endocrine functions, blood coagulation, and bone and tooth metabolism. Only a fractionof calcium is found outside of the bones. Only 0.5% of the body’s total calcium is foundextracellularly and exists in three forms: Complex bound (small amount), protein bound(mostly albumin), and ionized or free. The equilibrium among these three forms of calcium determines the overall homeostasis of calcium.

8/8/2019 Chemistry, Etc. Values and Interpretations
http://slidepdf.com/reader/full/chemistry-etc-values-and-interpretations 9/28
8
Certain factors influence the amount of calcium in the body. Vitamin D is important for the intestinalabsorption of calcium, PTH-induced movement of calcium from the bone and calcium re-absorption inthe kidneys, and parathyroid hormone (PTH). Calcitonin, secreted by the thyroid gland, inhibits boneand kidney re-absorption of calcium, and is a common treatment for hypercalcemia. PTH is secretedby the parathyroid glands in response to low serum-ionized calcium – generally working to increaseserum calcium. Finally, the most important determinant of ionized calcium is the amount of calciumthat is protein-bound – especially to albumin. The normal serum calcium is 8.5-10.8 g/dl for patients
that have a normal albumin (4.0 g/dl). For patients you have a low serum albumin, the normal rangeof calcium must be corrected based upon their serum albumin concentration. You may use thefollowing formula to determine the corrected calcium in patients with hypoalbuminemia:
CAcorrected = [(4.0-albumin) X 0.8 mg/dl] + CAuncorrected
For example, you may be administering parenteral nutrition to a cachectic (malnourished) patientwhose albumin is 1.7 g/dl. The patient’s uncorrected calcium is 7.9 mg/dl. You may think thispatient’s serum calcium is low. Actually, this patient’s calcium is within the normal range, oncecorrected for the low albumin.
CAcorrected = [(4.0-1.7g/dl) X 0.8 mg/dl] + 7.9 mg/dlCAcorrected = 9.74 mg/dl
Causes of Hypercalcemia Causes of Hypocalcemia
Malignancy (most common)Primary hyperparathyroidism (verycommon)Excessive administration of calcium salts
Calcium supplementsProlonged immobilityPaget’s diseaseSarcoidosisHyperthyroidismAcute adrenal insufficiencyLithium-induced renal calcium re-absorptionExcessive vitamin D, vitamin A or thyroidhormone intakeTamoxifenAndrogenic hormonesEstrogenProgesterone
Diminished intakeMedications (calcitonin, EDTA,glucocorticoids, loop diuretics,plicamycin, phosphate salts)HyperphosphatemiaHypoalbuminemia (most common)HypomagnesemiaHypoparathyroidism (common)PancreatitisRenal FailureSecondary hyperparathyroidismVitamin D deficiency (common)
(Fischbach, 1995 & Traub, 1996)
8/8/2019 Chemistry, Etc. Values and Interpretations
http://slidepdf.com/reader/full/chemistry-etc-values-and-interpretations 10/28
9
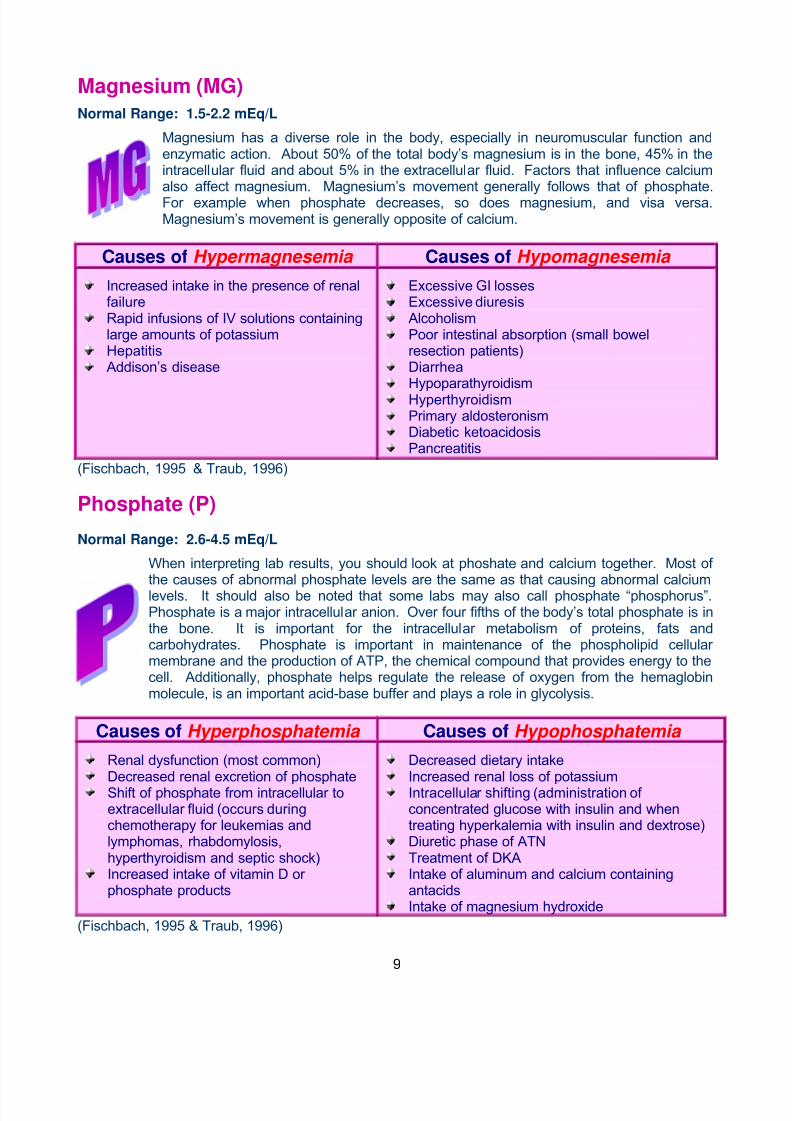
Magnesium (MG)
Normal Range: 1.5-2.2 mEq/L
Magnesium has a diverse role in the body, especially in neuromuscular function andenzymatic action. About 50% of the total body’s magnesium is in the bone, 45% in theintracellular fluid and about 5% in the extracellular fluid. Factors that influence calciumalso affect magnesium. Magnesium’s movement generally follows that of phosphate.For example when phosphate decreases, so does magnesium, and visa versa.Magnesium’s movement is generally opposite of calcium.
Causes of Hypermagnesemia Causes of Hypomagnesemia
Increased intake in the presence of renalfailureRapid infusions of IV solutions containinglarge amounts of potassiumHepatitisAddison’s disease
Excessive GI lossesExcessive diuresisAlcoholismPoor intestinal absorption (small bowelresection patients)DiarrheaHypoparathyroidismHyperthyroidismPrimary aldosteronismDiabetic ketoacidosisPancreatitis
(Fischbach, 1995 & Traub, 1996)
Phosphate (P)
Normal Range: 2.6-4.5 mEq/L
When interpreting lab results, you should look at phoshate and calcium together. Most of the causes of abnormal phosphate levels are the same as that causing abnormal calciumlevels. It should also be noted that some labs may also call phosphate “phosphorus”.Phosphate is a major intracellular anion. Over four fifths of the body’s total phosphate is inthe bone. It is important for the intracellular metabolism of proteins, fats andcarbohydrates. Phosphate is important in maintenance of the phospholipid cellular membrane and the production of ATP, the chemical compound that provides energy to thecell. Additionally, phosphate helps regulate the release of oxygen from the hemaglobinmolecule, is an important acid-base buffer and plays a role in glycolysis.
Causes of Hyperphosphatemia Causes of Hypophosphatemia
Renal dysfunction (most common)Decreased renal excretion of phosphateShift of phosphate from intracellular toextracellular fluid (occurs duringchemotherapy for leukemias andlymphomas, rhabdomylosis,hyperthyroidism and septic shock)Increased intake of vitamin D or phosphate products
Decreased dietary intakeIncreased renal loss of potassiumIntracellular shifting (administration of concentrated glucose with insulin and whentreating hyperkalemia with insulin and dextrose)Diuretic phase of ATNTreatment of DKAIntake of aluminum and calcium containingantacidsIntake of magnesium hydroxide
(Fischbach, 1995 & Traub, 1996)

8/8/2019 Chemistry, Etc. Values and Interpretations
http://slidepdf.com/reader/full/chemistry-etc-values-and-interpretations 11/28
10
Carbon Dioxide (CO2)
Normal Range: 22-32 mEq/L
The CO2 level is related to the respiratory exchange of carbon dioxide in the lungs and ispart of our bodies buffering system. Generally when used with the other electrolytes, it isa good indicator of acidosis and alkalosis. The total carbon dioxide level is determinedby acidifying serum to convert all of the bicarbonate present to carbon dioxide. Then,the total carbon dioxide content is determined. Since 95% of total serum carbon dioxideis made of converted bicarbonate, this lab test is actually a measure of bicarbonateconcentration. The terminology “serum bicarbonate” is used synonymously to describethis value. It is important to understand that this value actually represents bicarbonate,the end product of the carbonic acid/bicarbonate buffer system. It does not measure theacid content in the blood (Fischbach, 1995 & Traub, 1996).
Serum Osmolality
Normal Range: 280-295 mOsm/kg
Serum osmolality is the measure of a pressure caused by soluteconcentration difference between opposite sides of a semi-permeable membrane. Serum osmolarity which is practically thesame as serum osmolalitiy can be derived by:
Serum osmolarity = (2 X Sodium) + Glucose/18 + BUN/2.8
Serum osmolality tells us about the solute concentration in the vasculature. It is increased duringtimes of decreased fluid volume or increased solutes that occur with dehydration or diabeticketoacidosis. It is decreased in situations such as hypervolemia or true hyponatremia (Traub, 1996).
Glucose
Normal Range: 70-126 mg/dL
The Expert Committee (2003) recognized a group of people whose glucose levels, although notmeeting criteria for diabetes, are still too high to be considered normal. This group is defined ashaving fasting plasma glucose (FPG) levels >100 mg/dl but <126 mg/dl or 2-hour values in the oralglucose tolerance test (OGTT) of >140 mg/dl but <200 mg/dl. Therefore, the Expert Committee(2003) implemented the following guidelines for fasting blood glucose:
FPG <100 mg/dl = normalFPG =100–125 mg/dl = impaired fasting glucoseFPG >126 mg/dl = provisional diagnosis of diabetes (the diagnosis must be confirmed by a
physician or advanced practice nurse).
Additionally, the Expert Committee (2003) revised its diagnostic criteria for diabetes. It requiresevidence of only one of the following:
Casual plasma glucose concentration >200 mg/dl + symptoms of diabetes. Casual is defined asany time of day without regard to time since last meal. The classic symptoms of diabetes includepolyuria, polydipsia and unexplained weight loss.FPG >126 mg/dl. Fasting is defined as no caloric intake for at least 8 h.2-hour post-load glucose >200 mg/dl during an OGTT.
↑ Serum Osmolality = Dry
↓ Serum Osmolality = Overload

8/8/2019 Chemistry, Etc. Values and Interpretations
http://slidepdf.com/reader/full/chemistry-etc-values-and-interpretations 12/28
11
Causes of Hyperglycemia Causes of Hypoglycemia
Diabetes mellitusGestational diabetesGlucose intoleranceDiureticsSteroids/hormones
AntihypertensivesPhenothiazinesPyriminil (used in rodent poisons)
Diabetes mellitusPregnancyStrenuous exerciseProlonged fastingAcute alcohol ingestion
Insulin overdoseBeta-blockersSalicylate overdoseSulfonylureas
Hemoglobin A1C (Hgb A1C)
Normal Range: 4-6%
Hemoglobin A1C or glycosylated hemoglobin measures the quality of glucose
control a patient has experienced over the previous two to three months. Hgb A1C is based on the premise that a healthy red blood cell lives about 120 days.Glucose is irreversibly bound to the red blood cell. Hgb A1C is used to monitor andadjust therapy in diabetic patients. It is important to bear in mind that A1C levels donot tell the whole story about glucose control. For example, you could have lots of lows and lots of highs and have an excellent "average" blood sugar, and hence anexcellent A1C. Labs report the normal non-diabetic range as 4-6%. Therecommended goal for HbA1c levels for diabetics is less than 7%. Levelsconsistently greater than 8% require re-evaluation of the diabetic treatment plan(ADA, 1998 & Diabetes Care, 2005).
8/8/2019 Chemistry, Etc. Values and Interpretations
http://slidepdf.com/reader/full/chemistry-etc-values-and-interpretations 13/28
12
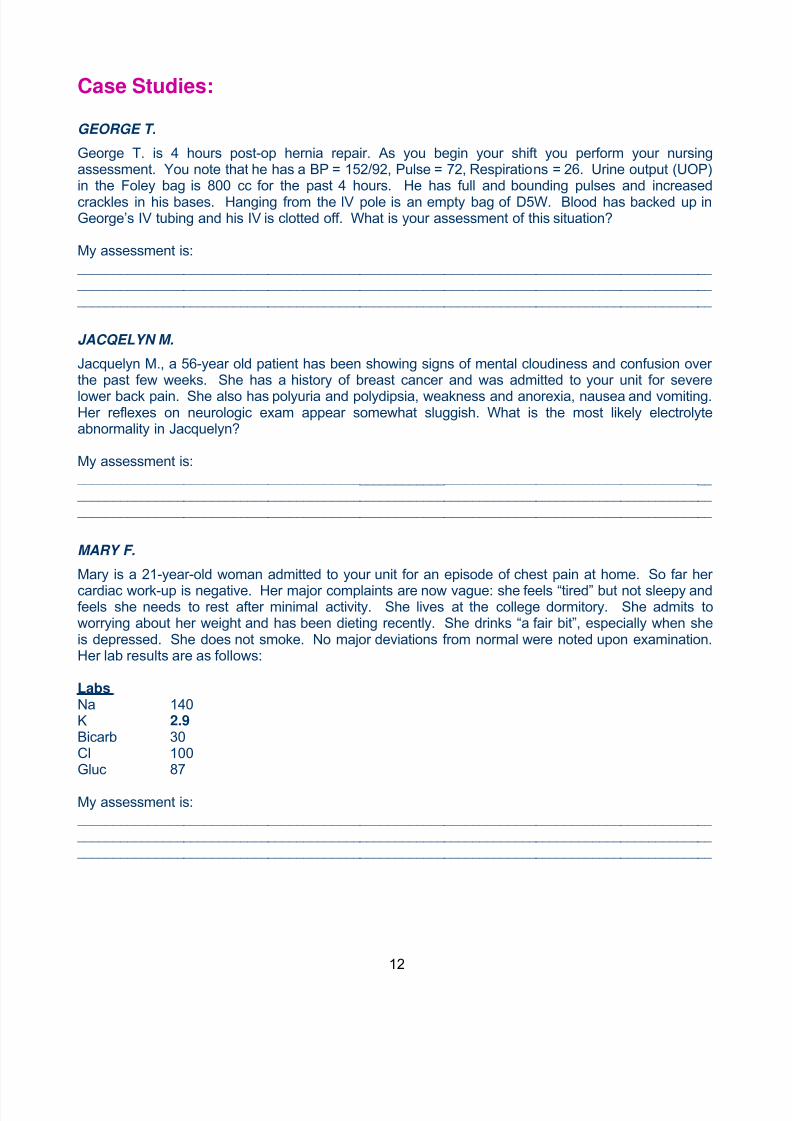
Case Studies:
GEORGE T.
George T. is 4 hours post-op hernia repair. As you begin your shift you perform your nursingassessment. You note that he has a BP = 152/92, Pulse = 72, Respirations = 26. Urine output (UOP)in the Foley bag is 800 cc for the past 4 hours. He has full and bounding pulses and increasedcrackles in his bases. Hanging from the IV pole is an empty bag of D5W. Blood has backed up inGeorge’s IV tubing and his IV is clotted off. What is your assessment of this situation?
My assessment is: __________________________________________________________________________________________
__________________________________________________________________________________________
__________________________________________________________________________________________
JACQELYN M.
Jacquelyn M., a 56-year old patient has been showing signs of mental cloudiness and confusion over the past few weeks. She has a history of breast cancer and was admitted to your unit for severe
lower back pain. She also has polyuria and polydipsia, weakness and anorexia, nausea and vomiting.Her reflexes on neurologic exam appear somewhat sluggish. What is the most likely electrolyteabnormality in Jacquelyn?
My assessment is: __________________________________________________________________________________________
__________________________________________________________________________________________
__________________________________________________________________________________________
MARY F.
Mary is a 21-year-old woman admitted to your unit for an episode of chest pain at home. So far her
cardiac work-up is negative. Her major complaints are now vague: she feels “tired” but not sleepy andfeels she needs to rest after minimal activity. She lives at the college dormitory. She admits toworrying about her weight and has been dieting recently. She drinks “a fair bit”, especially when sheis depressed. She does not smoke. No major deviations from normal were noted upon examination.Her lab results are as follows:
LabsNa 140K 2.9 Bicarb 30Cl 100Gluc 87
My assessment is: __________________________________________________________________________________________
__________________________________________________________________________________________
__________________________________________________________________________________________

8/8/2019 Chemistry, Etc. Values and Interpretations
http://slidepdf.com/reader/full/chemistry-etc-values-and-interpretations 14/28
13
SALLY K.
Sally K. is a 32 year-old post-op thyroidectomy patient on your unit. At the beginning of your shift, younote she has the following labs:
LabsNa 139
K 4.2Bicarb 29Cl 99Glucose 124CA 7.0 P 5.1
What is the most likely cause of Sally’s hypocalcemia?
My assessment is: __________________________________________________________________________________________
__________________________________________________________________________________________
__________________________________________________________________________________________

8/8/2019 Chemistry, Etc. Values and Interpretations
http://slidepdf.com/reader/full/chemistry-etc-values-and-interpretations 15/28
14
Case Study Responses
GEORGE T
George is hypervolemic. If we checked a serum sodium, it would probably be low right now, due to dilutional effects of fluid overload. A serum osmolality would be low due to the over dilution of solutes
in the serum. Additionally, these lab values may be low due to the administration of D5W – which should not be used as a volume expander. Furosemide administration and electrolyte studies are indicated. Be careful when administering electrolytes, because when the excess fluid is removed,electrolytes will most likely return to normal. If you give replacements now, you run the risk of over- correcting their deficits.
JACQELYN M.
Normally, polyuria and polydipsia are signs of increased sodium concentration or increased osmolality. Your concern with this patient is that she may have metastatic brain cancer that is altering the normal function of her pituitary gland – and thus decreasing ADH release. A deficiency in this hormone would cause increased urination and a subsequent increase in thirst for Jacquelyn.
MARY F.
The only abnormality in these labs is a low potassium, which may have contributed to her chest pain.This is a case of a young girl with decreased caloric intake and a subsequent hypokalemia.
SALLY K.She may have had an accidental removal of her parathyroid glands during her thyroidectomy.

8/8/2019 Chemistry, Etc. Values and Interpretations
http://slidepdf.com/reader/full/chemistry-etc-values-and-interpretations 16/28
15
RENAL FUNCTION TESTS
Common values that assess for renal dysfunction include: blood urea nitrogen (BUN), creatinine,BUN/Creatinine Ratios and Creatinine Clearance.
Blood Urea Nitrogen (BUN)Normal Range: 8-20 mg/dl
BUN is the concentration of nitrogen (within urea) within the serum and is a wasteproduct of protein metabolism. It is filtered and reabsorbed along the length of theentire nephron. It is not as reliable at measuring kidney function because it isdependent upon urine flow, renal blood flow, catabolism, protein metabolism,drugs, and diet. BUN better monitors hydration status, protein tolerance, anddegree of catabolism. It can also predict the risk of uremic syndrome (whenconcentrations are greater than 100 mg/dl).
Causes of BUN Elevation (Azotemia) Causes of BUN depletion
Prerenal causes▪ Decreased renal perfusion (dehydration, blood loss,
shock, CHF)▪ Increased protein breakdown (GI bleed, crush injury,
burns, fever, corticosteroid administration,tetracyclines, excessive amino acid or protein intake)
Intrarenal causes:▪ Acute renal failure due to nephrotoxicy, severe
hypertension, glomerulonephritis or tubular necrosis
▪ Chronic renal dysfunction as with pyelonephritis,diabetes, glomerulonephritis, renal tubular disease,amyloidosis, arteriosclerosis, polycystic kidney andchronic analgesic overuse
Postrenal causes:▪ Obstruction of ureter, bladder neck or urethra▪ High protein diet including amino acid ingestion▪ Upper GI bleed (blood is digested as protein)▪ Administration of corticosteroids, tetracyclines, or
other drugs with anti-anabolic effects
MalnourishedProfound liver diseaseFluid overloadStreptomycin and chloramphenicolmay produce falsely low values
8/8/2019 Chemistry, Etc. Values and Interpretations
http://slidepdf.com/reader/full/chemistry-etc-values-and-interpretations 17/28
16
Creatinine
Normal Range: 0.7-1.5 mg/dl
Creatinine is a by-product of muscle metabolism. The amount of creatinineproduced per day is constant and dependant upon the body’s muscle mass.
It is freely filtered so that production should equal excretion. Because of this, measuring one’s serum creatinine is a very reliable indicator of renalfunction. As a nurse, you should always suspect renal dysfunction withelevations in serum creatinine, in the absent of changes in the patient’smuscle mass.
Causes of Creatinine Elevation Causes of Creatinine Depletion
Hemoconcentration (dehydration)Decreased excretion (Urinary tract obstruction,renal dysfunction)Increased production (Excess catabolism, excessexercise, hyperpyrexia, hyperthyroidism, muscular dystrophy, myasthenia gravis)Nephrotoxicity due to drugs (aminoglycosides,amphotericin B, cistplatin, cyclosporine, dextran,gallium, hydroxyurea, lithium, methicillin,methoxyflurane, nitrofurantoin, pentamidine,plicamycin, streptozocin)
Decreased muscle mass – cachexiaDecreased activity – muscle atrophySpinal cord injuriesPatient in a coma or on neuromuscular blocking agents
BUN and Creatinine Ratios
Looking at your patient’s BUN and creatinine together can provide valuableinformation. The normal BUN/Creatinine ratio is approximately 20:1. Butwith renal disease this ratio varies. For example, BUN and creatinine areelevated in patients with acute renal failure and suspected dehydration.However, the BUN/Creatinine ratio is usually greater than 20:1. Another example is a patient with renal insufficiency experiencing a GI bleed. In thiscase the BUN/Creatinine ratio is elevated because of low circulating volumeand the simultaneous digestion of blood. Typically prerenal causes are
responsible for BUN/Creatinine ratios greater than 20:1. Intra renal causessuch as nephrotoxicity cause BUN/Creatinine ratios to be between 10:1 and20:1. Also, ratios greater than 20:1 are not important or reliable if both theBUN and creatinine are within normal limits.

8/8/2019 Chemistry, Etc. Values and Interpretations
http://slidepdf.com/reader/full/chemistry-etc-values-and-interpretations 18/28
17
Creatinine Clearance
Normal Range: 90-140 ml/min/1.73 m2
Creatinine clearance provides great information about your patient’sglomerular filtration rate. When looked at in conjunction with other renal
function tests, creatinine clearance provides a clear picture about your patient’s kidney function in suspected acute or chronic renal failure, allowsyou to monitor the negative, nephrotoxic effective of some drugs, andassists the physician or pharmacist to make adjustments to renally excreteddrugs. The relationship between creatinine clearance and serum creatinineis inverse. That is as serum creatinine increases, your patient’s creatinine
clearance should be decreasing or slowing. It is important to note that creatinine clearance will giveyou information about your patient’s kidney function during early dysfunction. Serum creatinine on theother hand does not begin to rise until your patient has lost about half of their nephrons. BUN issensitive in early renal failure as well. However, used alone, BUN is not reliable because too manyother factors can influence your BUN level. Therefore, when assessing kidney function, especiallyearly on, you should monitor creatinine clearance, BUN and creatinine together.
It is imperative that ALL of the patient’s urine produced in a 24-hour period is collected.
Tips to ensure accurate 24-hour collection:
Instruct the patient to void, then note the time. This is when the 24-hour collection begins. Throw thatsample away.
Collect all voided urine under ice for the next 24 hours.Post signs everywhere – especially near the commode.Stress the importance of NOT dumping any urine in the commode to the support staff.Stress that if it is dumped, to be honest and report it, as it will affect the patient’s test results, andmay affect their treatment plan.
Encourage the patient if able to remind caregivers not to dump his or her urine when entering theroom.

8/8/2019 Chemistry, Etc. Values and Interpretations
http://slidepdf.com/reader/full/chemistry-etc-values-and-interpretations 19/28
18
Case Studies
TRICIA W.
Tricia is a 34-year-old female with a 20-year history of type I diabetes. She has a HGB A1C of 7.0%and a blood pressure of 136/84 mmHg. Although her weight has remained stable for years, she hasput herself on the latest (high-protein) Atkins diet. Her weight has dropped by 10 lb, her fastingserum triglyceride level has fallen from 175 to 125 mg/dl, and her blood pressure has decreased to120/72 mmHg. Please discuss Tricia’s lab values in context with her history.
My assessment is: __________________________________________________________________________________________
__________________________________________________________________________________________
__________________________________________________________________________________________
MARY M.
MARY is an 84 year-old woman admitted to your unit with fever and altered mental status. She livesin a nursing home and was found to be unresponsive and febrile this morning prior to her admission toyour unit. She has an indwelling Foley catheter and her urinalysis has numerous WBC’s and bacteriaand was started on gentamycin. What lab values would be important to obtain and monitor closely?
My assessment is: __________________________________________________________________________________________
__________________________________________________________________________________________
__________________________________________________________________________________________
8/8/2019 Chemistry, Etc. Values and Interpretations
http://slidepdf.com/reader/full/chemistry-etc-values-and-interpretations 20/28
19
Case Study Responses
TRICIA W.
Tricia’s lab values are consistent with kidney damage. An increasing serum creatinine and a decreasing creatinine clearance. The changes may have been brought on by the high protein diet
and her baseline history of type I diabetes – which predisposes Tricia to renal damage.
MARY M.
You should obtain and monitor Mary’s serum creatinine and creatinine clearance. Because Mary is elderly, gentamycin (a nephrotoxic drug) may be particularly difficult for her kidneys to handle. Her dose may need to be adjusted.

8/8/2019 Chemistry, Etc. Values and Interpretations
http://slidepdf.com/reader/full/chemistry-etc-values-and-interpretations 21/28
20
URINALYSIS
Often we use the results of the urinalysis to give us more clues about the content and consistency of our patient’s urine. The urinalysis identifies pathology of the urinary tract and may identify metabolicabnormalities as well. Review the following component of the urinalysis and how abnormal valuesmay be indicative of urinary dysfunction.
COLOR (Normal: Yellow to Amber) - Urochrome gives urine its color. Factors that may alter color include specific gravity, foods, bilirubin, and drugs (pyridium-orange stains that are permanent).
CHARACTER (Normal: Clear) – If urine is cloudy or hazy instead of normally clear, it may be due towhite blood cells, bacteria, fecal contamination, prostatic fluid, or vaginal secretions.
SPECIFIC GRAVITY (Normal: 1.015-1.025) is the weight of urine. A low specific gravity indicatesdilute urine and a high specific gravity indicates concentrated urine.
pH (Normal: 4.5 –8.0) - Changes seen with acid base imbalances. Values will increase with urinarytract infections and if the specimen is old (ammonia – a base, is produced).
GLUCOSE (Normal: Negative) – The renal threshold for blood sugar is 160-180 mg/dl. Pregnancy,endocrine, and renal problems can lower the renal threshold – thus glucose spills over more easily.
KETONES (Normal: Negative) – Ketones are a product of fat metabolism. Causes of ketonuria
include DKA, starvation, fasting, vomiting, strenuous exercise, and dehydration.
PROTEIN (Normal: Negative) – Benign conditions that increase protein in urine are stress,
pregnancy, cold, fever, strenuous exercise, and vaginal secretions. Non-benign conditions arehypertension, diabetes (renal damage), post-renal infection (renal damage), and multiple myeloma(also serum protein elevated, A/G ratio abnormal, urine protein up, Bence-Jones proteins up).
BILIRUBIN (Normal: Negative) - Bilirubin in urine is water-soluble – When bilirubin is present in the
urine, it is usually due to a hepatobiliary obstruction.
UROBILINOGEN (Normal: Negative to Trace) – When decreased or absent, it may be due to
hepatobiliary duct obstruction. When increased, may mean liver damage or hemolytic disease.
BLOOD (Normal: Negative) - If positive, urine is usually cloudy. If dipstick is positive, must look at
urine microscopically in the lab for:(1) Red Blood Cells (RBCs) (urinary tract infection, pyelonephritis, glomerulonephritis, renalcancer, bladder cancer, strenuous exercise, or menses)(2) Myoglobin (MI, trauma, crush injuries, or burns)
(3) Hemoglobin (transfusion reaction, sickle cell, DIC, or hypertension).
NITRITE (Normal: Negative) – Bacteria is broken down into urinary nitrites and nitrate. Nitrites are
positive when bacteria are in urine.
LEUKOCYTE ESTERASE (Normal: Negative) – Reflects presence of white blood cells. Positive
findings suggest urinary tract infection.

8/8/2019 Chemistry, Etc. Values and Interpretations
http://slidepdf.com/reader/full/chemistry-etc-values-and-interpretations 22/28
21
BACTERIA (Normal: Negative) – If positive, suspect either your patient has a urinary tract infection
or the specimen was contaminated.
RBCs (RED BLOOD CELLS) (Normal: Negative) – If >5, think glomerulonephritis, pyelonephritis,renal trauma, tumor, kidney stones, cystitis, or genitourinary malignancy.
WBCS (WHITE BLOOD CELLS) (Normal: Negative) – If > 50, think urinary tract infection. If < 50, itis usually due to exercise, fever, renal disease, or urinary tract disease.
EPITHELIAL CELLS (Normal: Negative) – When present in large to moderate amounts, worry abouteither acute tubular necrosis or acute glomerulonephritis.
CASTS (Normal: Negative) - When present, may be due to nephrotic syndrome, glomerulonephritis,kidney failure, or renal malignancy. (Traub, 1996)

8/8/2019 Chemistry, Etc. Values and Interpretations
http://slidepdf.com/reader/full/chemistry-etc-values-and-interpretations 23/28
22
Case Studies
CHRIS C.Chris is a 20 year-old runner with dysuria. Her clean catch urine sample results are listed below.Should we be worried that Chris has a UTI?
Abnormal values within Chris’s U/A are:
Protein *30Bacteria +1
My assessment is: __________________________________________________________________________________________
__________________________________________________________________________________________
__________________________________________________________________________________________
U/A PARAMETER RESULT
Color Yellow
Character Hazy
Glucose Negative
Bilirubin Negative
Ketones Negative
Specific Gravity 1.025
Blood Negative
PH 6.6
Protein 30
Urobilinogen 1.0
Nitrite Trace
Leukocytes Negative
WBC 1-5
RBC Occasional
Bacteria +1
Collection Clean Catch

8/8/2019 Chemistry, Etc. Values and Interpretations
http://slidepdf.com/reader/full/chemistry-etc-values-and-interpretations 24/28
23
ADELE S.
Adele is a 40 year-old female with dysuria. Her clean catch urine sample results are listed below.Should we be worried that Adele has a UTI?
Abnormal values within Adele’s U/A are:
Color – Dark Yellow
Character – HazyKetones – TraceSpecific Gravity 1.035Blood TraceProtein *30Bacteria +1
My assessment is: __________________________________________________________________________________________
__________________________________________________________________________________________
__________________________________________________________________________________________
U/A PARAMETER RESULT
Color Dark Yellow
Character HazyGlucose Negative
Bilirubin Negative
Ketones Trace
Specific Gravity 1.035
Blood Trace
PH 7.6
Protein 30
Urobilinogen 1.0
Nitrite Positive
Leukocytes Negative
WBC 1-5
RBC Occasional
Bacteria +1
Collection Clean Catch

8/8/2019 Chemistry, Etc. Values and Interpretations
http://slidepdf.com/reader/full/chemistry-etc-values-and-interpretations 25/28
24
Case Study Responses
CHRIS C.
Chris probably does not have a UTI, but rather exercise-related proteinuria.A history of increased exercise or prolonged physical exertion would be consistent with her U/A
findings.
ADELE S.
Adele probably does not have a UTI because the only abnormal value associated with UTIs is the +1Bacteria. UTIs usually have > +1 Bacteria, Increased pH, Increased leukocyte esterase & possibly increased WBCs. Other values that may be increased with UTIs include casts and blood. A straight catheterization would be helpful in this case.

8/8/2019 Chemistry, Etc. Values and Interpretations
http://slidepdf.com/reader/full/chemistry-etc-values-and-interpretations 26/28
25
CONCLUSION
Interpretation of lab values is more than looking to see if a value is inside or outside of the normalrange. With today’s complex patients, you will find that you need to understand what these valuesmean, implications of high or low values, and the relationship of different results. Remembering everynormal value is probably not as critical as being able to interpret the meanings of the values and how
they relate to your patient’s clinical condition.
Please Read:This publication is intended solely for the use of healthcare professionals taking this course, for credit, fromRN.com It is designed to assist healthcare professionals, including nurses, in addressing many issuesassociated with healthcare. The guidance provided in this publication is general in nature, and is not designedto address any specific situation. This publication in no way absolves facilities of their responsibility for theappropriate orientation of healthcare professionals. Hospitals or other organizations using this publication as a
part of their own orientation processes should review the contents of this publication to ensure accuracy andcompliance before using this publication. Hospitals and facilities that use this publication agree to defend andindemnify, and shall hold RN.com, including its parent(s), subsidiaries, affiliates, officers/directors, andemployees from liability resulting from the use of this publication. The contents of this publication may not bereproduced without written permission from RN.com.
8/8/2019 Chemistry, Etc. Values and Interpretations
http://slidepdf.com/reader/full/chemistry-etc-values-and-interpretations 27/28
26
REFERENCES
American Association of Critical Care Nurses (AACN) (2001). The gastrointestinal system. In J. Alspach (Ed.),Core Curriculum for Critical Care Nurses (5th ed., Rev.) Philadelphia: W.B. Saunders. pp. 647-714).
American Diabetes Association: Clinical Practice Recommendations (1998) Standards of medical care for
patients with diabetes mellitus. Diabetes Care (21) (suppl 1): pp 23-31.
Adult Treatment Panel III (ATP III) guidelines. NHLBI slide show. Available at:http://hin.nhlbi.nih.gov/ncep_slds/atpiii/slide101.htm. Accessed June 4, 2005.
Anderson KM, Castelli WP, Levy D. (1987). Cholesterol and mortality: 30 years of follow-up from theFramingham study. JAMA. 257 (16): pp. 2176-80.
Expert Committee on the Diagnosis and Classification of Diabetes Mellitus: Follow-up report on the diagnosis of diabetes mellitus. (2003) Diabetes Care (26) pp. 3160–3167.
Fischbach, F. (1995) Quick reference to common laboratory and diagnostic tests. J.B. Lippencott:Philadelphia.
Gumaste, V. Dave, P. and Sereny, G (1992). Serum lipase: a better test to diagnose acute alcoholicpancreatitis. American Journal of Medicine (92) pp. 239-242.
Oh, M. & Carroll, H. (1994). Electrolyte and Acid Base Disorders. In Chernow B, ed. The pharmacologicapproach to the critically ill patient, 3
rded. Baltimore, Williams & Wilkins. pp. 957-968
Reproductive Endocrinology: Clinical Conditions and Disease States. Available at:http://www.dpcweb.com/medical/reproductive_endocrinology/infertility.html Accessed May 23, 2005
Shaw, M. (Ed.). (1998). Assessment made incredibly easy. Springhouse, PA: Springhouse.
Sherwood, L. (1997). The digestive system. In P. Lewis (Ed.), Human physiology: From cells to systems (3rded.) Belmont, CA: Wadsworth Publishing. pp. 546 - 598.
Summary of Revisions for the 2005 Clinical Practice Recommendations Diabetes Care (2005) 28: S3. Harper & Row.
Tortora, G. (1989). The digestive system. In E. Dollinger (Ed.), Principals of human anatomy (5th ed.) New Yorkpp. 644 -686.
Traub, S. (Ed.). (1996). Basic skills in interpreting laboratory data. (2nd ed.). Bethesda, MD: American Societyof Health-System Pharmacists.
Zull, D. (1989) Disorders of Potassium Metabolism. Emergency Medical Clinics of North America. (7) pp. 771-794
Uthman, E. Reproductive Endocrinology: Clinical Conditions and Disease States. Available at:http://www.dpcweb.com/medical/reproductive_endocrinology/infertility.html Accessed May 23, 2005
© Copyright 2005, AMN Healthcare, Inc.

8/8/2019 Chemistry, Etc. Values and Interpretations
http://slidepdf.com/reader/full/chemistry-etc-values-and-interpretations 28/28
POST TEST VIEWING INSTRUCTIONS
In order to view the post test you may need to minimize this window and click “TAKE TEST.” You canthen restore the window in order to review the course material if needed.