copyright · langin, chet southern illinois university usa ... site) through the proactive support...
TRANSCRIPT


COPYRIGHT
Copyright and Reprint Permission: Abstracting is permitted with credit to the source. Libraries are permitted to photocopy for private use. Instructors are permitted to photocopy, for private use, isolated articles for non-commercial classroom use without fee. For other copies, reprint, or republication permission, write to IIIS Copyright Manager, 13750 West Colonial Dr Suite 350 – 408, Winter Garden, Florida 34787, U.S.A. All rights reserved. Copyright 2013. © by the International Institute of Informatics and Systemics. The papers of this book comprise the proceedings of the conference mentioned on the title and the cover page. They reflect the authors’ opinions and, with the purpose of timely disseminations, are published as presented and without change. Their inclusion in these proceedings does no necessarily constitute endorsement by the editors. ISBN: 978-1-936338-96-2

International Conference on Complexity, Cybernetics, and Informing Science and Engineering: CCISE 2013
ADDITIONAL REVIEWERS (Reviewers who contributed reviewing at least one paper)
Affenzeller, Michael Heuristic and Evolutionary Algorithms Laboratory Austria Anuar, Nor Badrul University of Malaya Malaysia Arteaga Bejarano, José R. University of the Andes Colombia Aveledo, Marianella Simon Bolivar University Venezuela Bangert, Patrick Algorithmica Technologies USA Bangyal, Waqas Iqra University Islamabad Pakistan Bönke, Dietmar Reutlingen University Germany Bulegon, Ana Marli Federal University of Rio Grande do Sul Brazil Carnes, Patrick Kirtland Air Force Base USA Caron-Pargue, Josiane University of Poitiers France Chen, Jingchao DongHua University China Chen, Zengqiang Nankai University China Cheng, Zhengdong Texas A&M University USA Cho, Vincent Hong Kong Polytechnic University Hong Kong Coffman, Michael G. Southern Illinois University Carbondale USA Cunha Lima, Guilherme Rio de Janeiro State University Brazil Darsey, Jerry A. University of Arkansas at Little Rock USA Debono, Carl James University of Malta Malta Demestichas, K. National Technical University of Athens Greece El Kashlan, Ahmed Arab Academy for Science and Technology Egypt Fallah, M. Hosein Stevens Institute of Technology USA Fikret Ercan, M. Singapore Polytechnic Singapore González Soriano, Juncal University Complutense of Madrid Spain Gonzalo-Ruiz, Alicia University of Valladolid Spain Gosukonda, Ramana Fort Valley State University USA Gotoh, Noriko University of Tokyo Japan Grasso, Giovanni University of Palermo Italy Grau, Juan B. Technical University of Madrid Spain Hanakawa, Noriko Hannan University Japan Hasenclever B., Carlos C. National Laboratory for Scientific Computation Brazil Hawke, Gary Victoria University of Wellington New Zealand Hespel, Christiane National Institute of Applied Sciences of Rennes France Hudson, Clemente Charles Valdosta State University USA Jia, Lei New York University USA Jinwala, Deveshkumar Sardar Vallabhbhai National Institute of Technology India Jirina, Marcel Academy of Sciences of the Czech Republic Czech Republic Johnson, Mark Army Research USA Jong, Din Chung Hwa University of Medical Technology Taiwan Kaivo-Oja, Jari Turku School of Economics Finland Karpukhin, Oleksandr Kharkiv National University of Radio and Electronics Ukraine Kasapoglu, Ercin Hacettepe University Turkey Kess, Pekka University of Oulu Finland

Lalchandani, Jayprakash Indian Institute of Technology Kharagpur India Langin, Chet Southern Illinois University USA Lau, Newman Hong Kong Polytechnic University Hong Kong Lunsford, Suzanne Wright State University USA Matsuda, Michiko Kanagawa Institute of Technology Japan Matsuno, Akira Teikyo University Japan McGowan, Alan H. Eugene Lang College the New School for Liberal Arts USA McIlvried, Howard G. National Energy Technology Laboratory USA Minoro Abe, Jair Paulista University Brazil Mussoi, Eunice Maria Universidade Federal do Rio Grande do Sul Brazil Neyra Belderrain, Mischel Instituto Tecnologico de Aeronautica Brazil Normand, Alain Brampton Flower City Canada Ostrowski, David Ford Motor Company USA Parker, Brenda C. Middle Tennessee State University USA Rajan, Amala V. S. Higher Colleges of Technology UAE Rodríguez, Mª Dolores University of Alcala Spain Rodríguez-M., Antonio Autonomous University of the State of Morelos Mexico Rosete, Juan Technological Institute of Queretaro Mexico Rutherfoord, Rebecca H. Southern Polytechnic State University USA Safia, Nait Bahloul University of Oran Algeria Sathyamoorthy, Dinesh Science Malaysia Savva, Andreas University of Nicosia Cyprus Schumacher, Jens University of Applied Sciences Vorarlberg Austria Segall, Richard S. Arkansas State University USA Shing, Chen-Chi Radford University USA Siemieniuch, Carys Loughborough University UK Stasytyte, Viktorija Vilnius Gediminas Technical University Lithuania Su, J. L. Shanghai University China Sun, Baolin Wuhan University China Tam, Wing K. Swinburne University of Technology Australia Woodthorpe, John The Open University UK Zeidman, Robert Zeidman Consulting USA Zmazek, Blaž IMFM Slovenia Zyubin, Vladimir Institute of Automation and Electrometry Russian Federation

International Conference on Complexity, Cybernetics, and Informing Science and Engineering: CCISE 2013
ADDITIONAL REVIEWERS FOR THE NON-BLIND REVIEWING
(Reviewers who contributed reviewing at least one paper)
Acharya, Sushil Robert Morris University USA Ahmed, Mahmoud National Authority for Remote Sensing Egypt Alhayyan, Khalid N. University of South Florida USA Andersson, Jonas Chalmers University of Technology Sweden Arabnia, Hamid R. University of Georgia USA Behr, Franz-Josef Stuttgart University of Applied Sciences Germany Beukes, Denzil R. Rhodes University South Africa Bots, Jan Nyenrode Netherlands Dobronravin, Nicolay St. Petersburg State University Russian Federation Dodig-Crnkovic, Gordana Malardalen University Sweden Effat, Hala National Authority for Remote Sensing and Space Sciences Egypt Erkollar, Alptekin University of Applied Sciences Wiener Neustadt Austria Feng, Yaokai Kyushu University Japan Foster, Harold The University of Akron USA Gallerano, Gianpiero ENEA Italy Gómez Santillán, Claudia Instituto Tecnológico de Ciudad Madero Mexico Hegazy, Mohamed Nagib National Authority for Remote Sensing and Space Sciences East Timor Jurik, Lubos Slovak Agricultural University in Nitra Slovakia Knoll, Matthias Darmstadt University of Applied Sciences Germany Laarni, Jari Technical Research Centre of Finland Finland Landero Nájera, Vanesa Universidad Politécnica de Apodaca Mexico Laux, Friedrich Reutlingen University Germany Niewiadomska-S., Ewa Warsaw University of Technology Poland Nikolic, Hrvoje Rudjer Boskovic Institute Croatia Otterstad, Ann Merete Oslo Akershus University College Norway Ramírez-Díaz, Humberto CICATA Mexico Rehak, Stefan Water Research Institute Slovakia Reis, Arsénio Universidade de Trás-os-Montes e Alto Douro Portugal Samant, Bhupesh Rhodes University South Africa Shoham, Snunith Bar-Ilan University Israel Simeonov, Plamen I. INBIOSA Germany Skrinar, Andrej Faculty of Civil Engineering Slovakia Smith, Debbie Poland High School USA Soshnikov, Dmitry Microsoft Russia Russian Federation Sowilem, Mohamed National Authority for Remote Sensing and Space Science Egypt Strikwerda, Johannes University of Amsterdam Netherlands Usmanov, Zafar D. Tajik Academy of Sciences Tajikistan Wolfengagen, Vyacheslav Institute for Contemporary Education JurInfoR-MSU Russian Federation Wu, Yingjie Fuzhou University China Zimmermann, Alfred Reutlingen University Germany

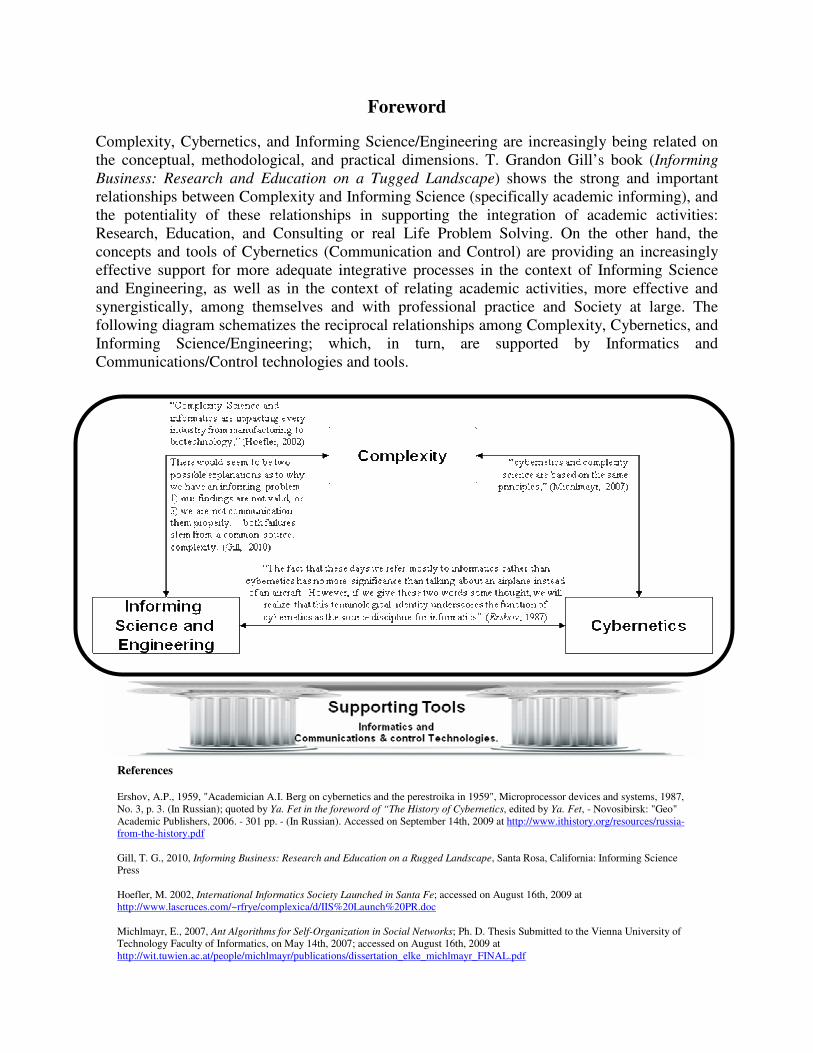
Foreword Complexity, Cybernetics, and Informing Science/Engineering are increasingly being related on the conceptual, methodological, and practical dimensions. T. Grandon Gill’s book (Informing Business: Research and Education on a Tugged Landscape) shows the strong and important relationships between Complexity and Informing Science (specifically academic informing), and the potentiality of these relationships in supporting the integration of academic activities: Research, Education, and Consulting or real Life Problem Solving. On the other hand, the concepts and tools of Cybernetics (Communication and Control) are providing an increasingly effective support for more adequate integrative processes in the context of Informing Science and Engineering, as well as in the context of relating academic activities, more effective and synergistically, among themselves and with professional practice and Society at large. The following diagram schematizes the reciprocal relationships among Complexity, Cybernetics, and Informing Science/Engineering; which, in turn, are supported by Informatics and Communications/Control technologies and tools.
References Ershov, A.P., 1959, "Academician A.I. Berg on cybernetics and the perestroika in 1959", Microprocessor devices and systems, 1987, No. 3, p. 3. (In Russian); quoted by Ya. Fet in the foreword of “The History of Cybernetics, edited by Ya. Fet, - Novosibirsk: "Geo" Academic Publishers, 2006. - 301 pp. - (In Russian). Accessed on September 14th, 2009 at http://www.ithistory.org/resources/russia-from-the-history.pdf Gill, T. G., 2010, Informing Business: Research and Education on a Rugged Landscape, Santa Rosa, California: Informing Science Press Hoefler, M. 2002, International Informatics Society Launched in Santa Fe; accessed on August 16th, 2009 at http://www.lascruces.com/~rfrye/complexica/d/IIS%20Launch%20PR.doc Michlmayr, E., 2007, Ant Algorithms for Self-Organization in Social Networks; Ph. D. Thesis Submitted to the Vienna University of Technology Faculty of Informatics, on May 14th, 2007; accessed on August 16th, 2009 at http://wit.tuwien.ac.at/people/michlmayr/publications/dissertation_elke_michlmayr_FINAL.pdf

Consequently, the purpose of the Organizing Committee of the International Conference on Complexity, Cybernetics, and Informing Science and Engineering: CCISE 2013 was to bring together scholars and professionals from the three fields (including scholars/professionals in their supporting tools and technologies), in order to promote and foster inter-disciplinary communication and interactions among them; oriented to foster the formation of the intellectual humus required for inter-disciplinary synergies, inter-domain cross-fertilization, and the production of creative analogies. There are many good disciplinary, specific and focused conferences in any one of the major themes of CCISE 2013. There are also good general conferences, which have a wider scope and are more comprehensive. Each one of these kinds of conferences has its typical audience. CCISE 2013 Organizing Committee purpose was to bring together both kinds of audiences, so participants with a disciplinary and focused research would be able to interact with participants from other related disciplines for interdisciplinary communication and potential inter-disciplinary collaborative research. CCISE 2013 was organized in the context of the larger event “InSITE 2013: Informing Science + IT Education Conferences” organized by the Informing Science Institute in collaboration with Universidade Fernando Pessoa (UFP) in Porto, Portugal (a UNESCO designated World Heritage Site) through the proactive support of the conference Chairs UFP Rector Salvato Trigo and Associate Professor Luis Borges Gouveia. The venue of the conference was the campus of Universidade Fernando Pessoa. The organizing Committee received 33 submissions to be considered for their presentation in the conference. 92 reviewers from 35 countries evaluated and commented the submissions according to the traditional double-blind method, and 40 reviewers, from 21 countries, evaluated and commented submissions according a non-anonymous reviewing method. Submissions were accepted if, and only if, they were recommended to be accepted by the majority of the reviewers of both methods. To be accepted in each method was a necessary condition but not a sufficient one. All submissions had to be accepted as a result of each of both methods. A total of 224 reviews were made with an average of 1.7 reviews per reviewer and 6.79 reviews per submission. These proceedings include 13 accepted papers which is 39.39% of the number of the submitted articles. The following table resumes the numbers that we included in this section.
# of submissions
received
# of reviewers that made at
least one review
# of reviews made
Average of reviews per
reviewer
Average of reviews per submission
# of papers included in the proceedings
% of submissions included in the proceedings
33 132 224 1.70 6.79 13 39.39%
We would like to extend our gratitude to: 1. The program Committee’s members who supported the quality of these conference by means
of their quality as scholars/researchers and their support.

2. The 132 reviewers from 46 countries who supported the organizers in the selection process, by means of their evaluations and recommendations, and the authors by means of the constructive comments they made to the respective articles they reviewed.
3. The co-editors of these proceedings, for the work, energy and eagerness they displayed in
their respective activities.
4. Professor T. Grandon Gill for Chairing the Program Committee and for delivering a great plenary keynote address to the audience of all collocated conferences.
5. Professors Paulo Fonseca Matos Silva Ramos, Luis Borges-Gouveia, and Linda V. Knight for their keynote addresses.
6. Dr. Eli Cohen as General Co-Chair of CCISE 2013 who conceived and, with Betty Boyd, made possible the collocation of CCISE 2013 in the context of the main event by means of thinking and implementing the necessary adaptation between the main conference and CCISE 2013.
7. Betty Boyd for contributing with the design and implementation of the required organizational adaptation for this joint event.
8. Belkis Sánchez Callaos for chairing the Organizing Committee and for co-implementing the required organizational adaptation.
9. María Sánchez, Dalia Sánchez, Keyla Guedez, and Marcela Briceño, for their knowledgeable
effort in supporting the organizational process and for producing these proceedings.
Dr. Nagib C. Callaos, CCISE 2013 General Co-Chair


i
CCISE 2013 International Conference on Complexity, Cybernetics, and Informing Science and Engineering
CONTENTS
Contents i
Ammann, Eckhard (Germany): ''Knowledge Development Taxonomy and Application Scenarios'' 1
Błaszczyk, Jacek *; Malinowski, Krzysztof *; Allidina, Alnoor ** (* Poland, ** Canada): ''Optimal Pump Scheduling by Non-Linear Programming for Large Scale Water Transmission System''
7
Balvetti, R.; Botticelli, A.; Bargellini, M. L.; Battaglia, M.; Casadei, G.; Filippini, A.; Pancotti, E.; Puccia, L.; Zampetti, C.; Bozanceff, G.; Brunetti, G.; Guidoni, A.; Rubini, L.; Tripodo, A. (Italy): ''Towards the Construction of a Cybernetic Organism: The Place of Mental Processes''
13
Braseth, Alf Ove; Øritsland, Trond Are (Norway): ''Seeing the Big Picture: Principles for Dynamic Process Data Visualization on Large Screen Displays'' 16
Djuraev, Simha; Yitzhaki, Moshe (Israel): ''Factors Associated with Digital Readiness in Rural Communities in Israel'' 22
Koolma, Hendrik M. (Netherlands): ''Information and Adaptation in a Public Service Sector: The Example of the Dutch Public Housing Sector'' 25
Monat, André S.; Befort, Marcel (Germany): ''The Usage of ISOTYPE Charts in Business Intelligence Reports - The Impact of Otto Neurath Work in Visualizing the Results of Information Systems Queries''
31
Normantas, Vilius (Tajikistan): ''Statistical Properties of Ordered Alphabetical Coding'' 37
Schroeder, Marcin J. (Japan): ''The Complexity of Complexity: Structural vs. Quantitative Approach'' 41
Turrubiates-López, Tania; Schaeffer, Satu Elisa (Mexico): ''Studying the Effects of Instance Structure in Algorithm Performance'' 47
Yukech, Christine M. (USA): ''Paradigm Shifting through Socio-Ecological Inquiry: Interdisciplinary Topics & Global Field Study Research'' 53
Zvonnikov, Victor; Chelyshkova, Marina (Russian Federation): ''The Optimization of Formative and Summative Assessment by Adaptive Testing and Zones of Students Development''
58

ii
Zykov, Sergey V. (Russian Federation): ''Pattern-Based Enterprise Systems: Models, Tools and Practices'' 62
Authors Index 69

Knowledge Development Taxonomy and Application Scenarios
Eckhard Ammann School of Informatics, Reutlingen University
72762 Reutlingen, Germany
ABSTRACT Knowledge development in an enterprise is about approaches, methods, techniques and tools that will support the advancement of individual and organizational knowledge for the purpose of an improvement of businesses. A modeling basis for knowledge development is provided with a new conception of knowledge and of knowledge conversions, which introduces three dimensions of knowledge and general conversions between knowledge assets. This modeling basis guides the definition of a taxonomy of knowledge development scenarios. In this taxonomy, constructive and analytic scenarios are distinguished as main categories and subsequently refined into more specific ones. In order to indicate the usefulness of this taxonomy, example implementations of two knowledge development scenarios are briefly outlined: a modeling notation for knowledge-intensive business processes as a constructive scenario and a rule-processing system based on an knowledge ontology as an analytic scenario. Keywords: Knowledge Development, Taxonomy, Application Scenarios, Constructive and Analytic Scenarios, Knowledge-Intensive Business Processes, Semantic Knowledge Development.
1. INTRODUCTION Knowledge development in an enterprise is about approaches, methods, techniques and tools that will support the advancement of knowledge for the purpose of an improvement of businesses. This notion includes as well individual knowledge as group and organizational knowledge. It can be seen as integral part of knowledge management, see [1], [9] and [11] for a description of several existing approaches for knowledge management. While the management aspect of knowledge management seems to be rather well understood and practiced in many companies [11], there is no common concept and understanding of knowledge and of knowledge development as basis of it. In this paper we investigate and classify possible application scenarios for knowledge development. This leads to a taxonomy of knowledge development scenarios. This taxonomy is based on a new conception of knowledge and knowledge development, which is shortly described in this paper (see [2] for a complete description). The conception of knowledge is represented by a knowledge cube, a three-dimensional model of knowledge with types, kinds and qualities. Using this conception we introduce general knowledge conversions between the various knowledge variants as a model for knowledge dynamics and development in the enterprise. First a basic set of such conversions is defined,
which extends the set of the four conversions of the well-known SECI-model [12]. Building on this set, general knowledge conversions can be defined, which reflect knowledge transfers and development more realistically and do not suffer from the restrictions of the SECI-model. Built on this conception, application scenarios for knowledge development are classified. Application scenarios are understood as typical processes, which lead to an advancement of individual and organizational knowledge in the enterprise. Two main categories of application scenarios are identified: constructive and analytic scenarios. Constructive scenarios build knowledge development processes. For example, knowledge dynamics in knowledge-intensive business processes can be modeled. Analytic scenarios can be represented by general nets of general knowledge conversions, which are introduced in this paper. They are characterized by gaps, i.e., by unknown knowledge or conversion parts in these nets. Important knowledge development requirements in an enterprise can be covered by analytic scenarios. Assume for example, that the knowledge requirements for a project are known as well as the learning options in the company. From that, one would try to identify minimal knowledge requirements for a new employee, which should work in the project and should be able to fulfil the requirements of this scenario at least after some learning efforts. At least for simple cases, analytic scenarios can be supported by a rule-processing system based on a knowledge ontology, which has been built as representation of our knowledge and knowledge dynamics concept. A set of corresponding rules for addressing these scenarios and their representations has been developed. Therefore, possible solutions for those scenarios, i.e. filling the gaps in the scenarios, can be gained. The structure of the paper is as follows. After an introduction and section II on related work, the two sections III and IV will introduce the knowledge conception and general knowledge conversions between knowledge and information assets, respectively. Section V discusses knowledge development scenarios and presents a taxonomy of these scenarios, while section VI outlines example implementation of the two main scenario categories. Finally, section VII summarizes and concludes the paper.
2. RELATED WORK One specific approach for enterprise knowledge development is EKD (Enterprise Knowledge Development), which aims at articulating, modeling and reasoning about knowledge, and which supports the process of analyzing, planning, designing, and changing your business; see [8] and [5] for a description of
1
Proceedings of International Conference on Complexity, Cybernetics, and Informing Science and Engineering

EKD. EKD does not provide a conceptual description of knowledge and knowledge development. For the conception part, there exists one well-known approach by Nonaka/Takeuchi [12], which is built on the distinction between tacit and explicit knowledge and on four knowledge conversions between the knowledge types (SECI-model). However, many discussions exist, whether to interpret the explicit knowledge part as still bound to the human being, or as already detached from him. Also the linear spiral model of knowledge development has turned out to be limiting. Another important work is the introduction of the type/quality dimensions of knowledge in [7]. Finally, important distinctions of implicit knowledge are given in [10].
3. CONCEPTION OF KNOWLEDGE General Understanding of Knowledge In this section we briefly provide a conception of knowledge, and of knowledge types, kinds and qualities. More details can be found in [2]. As our base notion, knowledge is understood as justified true belief, which is (normally) bound to the human being, with a dimension of purpose and intent, identifying patterns in its validity scope, brought to bear in action and with a generative capability of new information, see [7], [8] and [12]. It is a perspective of “knowledge-in-use” [7] because of the importance for its utilisation in companies and for knowledge management. In contrast, information is understood as data in relation with a semantic dimension, but is lacking the pragmatic and pattern-oriented dimension, which characterises knowledge. We distinguish three main dimensions of knowledge, namely types, kinds and qualities, and describe those in the following three sub-sections. The whole picture leads to the three-dimensional knowledge cube, which is introduced at the end of this section. Type Dimension of Knowledge The type dimension is the most important for knowledge management in a company. It categorizes knowledge according to its presence and availability. Is it only available for the owning human being, or can it be communicated, applied or transferred to the outside, or is it externally available in the company’s organisational memory, detached from the individual human being? It is crucial for the purposes of the company, and hence a main goal of knowledge management activities, to make as much as possible knowledge available, i.e. let it be converted from internal to more external types of knowledge. Our conception for the type dimension of knowledge follows a distinction between the internal and external knowledge types, seen from the perspective of the human being. As third and intermediary type, explicit knowledge is seen as an interface for human interaction and for the purpose of knowledge externalisation, the latter one ending up in external knowledge. Internal (or implicit) knowledge is bound to the human being. It is all that, what a person has “in its brain” due to experience, history, activities and learning. Explicit knowledge is “made explicit” to the outside world e.g. through spoken language, but is still bound to the human being. External knowledge finally is detached from the human being and may be kept in appropriate storage media as part of the organisational memory. Fig. 1 depicts the different knowledge types.
Fig. 1 Conception of knowledge types Internal knowledge can be further divided into tacit, latent and conscious knowledge, where those subtypes partly overlap with each other, see [10]. Conscious knowledge is conscious and intentional, is cognitively available and may be made explicit easily. Latent knowledge has been typically learning as a by-product and is not available consciously. It may be made explicit, for example in situations, which are similar to the original learning situation, however. Tacit knowledge is built up through experiences and (cultural) socialisation situations, is specific in its context and based on intuition and perception. Statements like “I don’t know, that I know it” and “I know more, than I am able to tell” (adapted from Polanyi [13]) characterise it. Kind Dimension of Knowledge In the second dimension of knowledge, four kinds of knowledge are distinguished: propositional, procedural and strategic knowledge, and familiarity. It resembles to a certain degree the type dimension as described in [7]. Propositional knowledge is knowledge about content, facts in a domain, semantic interrelationship and theories. Experience, practical knowledge and the knowledge on “how-to-do” constitute procedural knowledge. Strategic knowledge is meta-cognitive knowledge on optimal strategies for structuring a problem-solving approach. Finally, familiarity is acquaintance with certain situations and environments, it also resembles aspects of situational knowledge, i.e. knowledge about situations, which typically appear in particular domains [7]. Quality Dimension of Knowledge The quality dimension introduces five characteristics of knowledge with an appropriate qualifying and is independent of the kind dimension, see [7]. The level characteristics aims at overview vs. deep knowledge, structure distinguishes isolated from structured knowledge. The automation characteristic of knowledge can be step-by-step-doing by a beginner in a domain of work or automated fast acting by an expert. All these qualities measure along an axis and can be subject to knowledge conversions (see section III). Modality as the fourth quality asks for the representation of knowledge, be it words versus pictures in situational knowledge kinds, or propositions versus pictures in procedural knowledge kinds. Finally, generality differentiates general versus domain-specific knowledge. Knowledge qualities apply to each knowledge asset.
2
Proceedings of International Conference on Complexity, Cybernetics, and Informing Science and Engineering

Fig. 2 The knowledge cube
The Knowledge Cube Bringing all three dimension of knowledge together, we gain an overall picture of our knowledge conception. It can be represented by the knowledge cube, as is shown in Fig. 2. Note, that the dimensions in the knowledge cube behave different. In the type and kind dimensions, the categories are mostly distinctive (with the mentioned exception in the sub-types), while in the quality dimension each of the given five characteristics are always present for each knowledge asset.
4. KNOWLEDGE CONVERSIONS In this section we give a conception of knowledge conversions. The transitions between the different knowledge types, kind and qualities are responsible to a high degree for knowledge development in an organisation. More details can be found in [2]. Most important for knowledge management purposes are conversions between the knowledge types and they will be the focus in the following. Among those, especially those conversions making individual and internal knowledge of employees usable for a company, are crucial for knowledge management. The explicitation and externalisation conversions described in this section achieve this. Implicitly socialisations between tacit knowledge of different people also may contribute to this goal. Conversions in the kind dimension of knowledge are seldom, normally the kind dimension of knowledge remains unchanged in a knowledge conversion changing the type dimension. Those in the quality dimension are mostly knowledge developments aiming at quality improvement and will not change the type and kind dimensions of the involved knowledge assets. Five basic knowledge conversions (in the type dimension) are distinguished here: socialisation, explicitation, externalisation, internalisation and combination. Basic conversion means, that exactly one source knowledge asset is converted into exactly one destination knowledge asset and that only one knowledge dimension is changed during this conversion. More complex conversions may be easily gained by building on this set as described later in this section. They will consist of m-to-n-conversions and include information assets in addition. Socialisation converts tacit knowledge of one person into tacit knowledge of another person. For example, this succeeds by exchange of experience or in a learning-by-doing situation
under supervision of an experienced person. Explicitation is the internal process of a person, to make internal knowledge of the latent or conscious type explicit, e.g. by articulation and formulation (in the conscious knowledge type case) or by using metaphors, analogies and models (in the latent type case). Externalisation is a conversion from explicit knowledge to external knowledge or information and leads to detached knowledge as seen from the perspective of the human being, which can be kept in organisational memory systems. Internalisation converts either external or explicit knowledge into internal knowledge of the conscious or latent types. It leads to an integration of experiences and competences in your own mental model. Finally, combination combines existing explicit or external knowledge in new forms. These five basic knowledge conversions are shown in Fig. 3. As generalisation of basic knowledge conversions, general knowledge conversions are modeled converting several source assets (possibly of different types, kinds and quality) to several destination assets (also possibly different in their knowledge dimensions). In addition, information assets are considered as possible contributing or generated parts of general knowledge conversions. For example, in a supervised learning-by-doing situation seen as a complex knowledge conversion a new employee may extend his tacit and conscious knowledge by working on and extending an external knowledge asset in a general conversion, using and being assisted by the tacit and conscious knowledge of an experienced colleague. A piece of relevant information on the topic may also be available on the source side of the conversion. Here on the source side of the general conversion we have two tacit, two conscious and one external knowledge assets plus one information asset, while on the destination side one tacit, one explicit and one external knowledge asset (i.e. the resulted enriched external knowledge) arise. Completing this section, we shortly mention knowledge conversions in the quality dimension of knowledge. In three out of the five quality measures, basic conversions can be identified, which are working gradually. Those are, firstly, a deepening conversion, which converts overview knowledge into a deeper form of this knowledge. Secondly, there may be a structuring conversion performing improvement in the singular-versus-structure scale of the structural measure. Finally, conscious and step-by-step-applicable knowledge may convert into automated knowledge in a automation conversion, which describe a process from beginner to expert in a certain domain. The remaining two quality measures of knowledge, namely modality and generality, do not lend themselves to knowledge conversions. They just describe unchangeable knowledge qualities.
Fig. 3 Knowledge conversions in the type dimension
3
Proceedings of International Conference on Complexity, Cybernetics, and Informing Science and Engineering
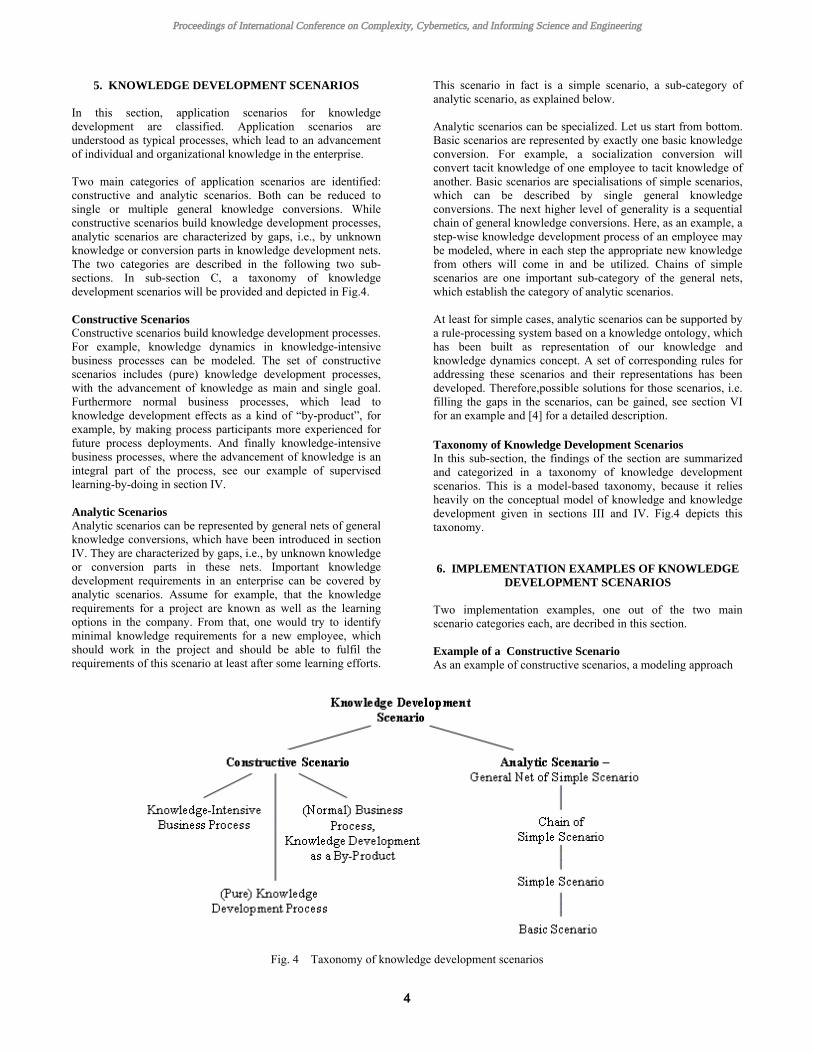
5. KNOWLEDGE DEVELOPMENT SCENARIOS In this section, application scenarios for knowledge development are classified. Application scenarios are understood as typical processes, which lead to an advancement of individual and organizational knowledge in the enterprise. Two main categories of application scenarios are identified: constructive and analytic scenarios. Both can be reduced to single or multiple general knowledge conversions. While constructive scenarios build knowledge development processes, analytic scenarios are characterized by gaps, i.e., by unknown knowledge or conversion parts in knowledge development nets. The two categories are described in the following two sub-sections. In sub-section C, a taxonomy of knowledge development scenarios will be provided and depicted in Fig.4. Constructive Scenarios Constructive scenarios build knowledge development processes. For example, knowledge dynamics in knowledge-intensive business processes can be modeled. The set of constructive scenarios includes (pure) knowledge development processes, with the advancement of knowledge as main and single goal. Furthermore normal business processes, which lead to knowledge development effects as a kind of “by-product”, for example, by making process participants more experienced for future process deployments. And finally knowledge-intensive business processes, where the advancement of knowledge is an integral part of the process, see our example of supervised learning-by-doing in section IV. Analytic Scenarios Analytic scenarios can be represented by general nets of general knowledge conversions, which have been introduced in section IV. They are characterized by gaps, i.e., by unknown knowledge or conversion parts in these nets. Important knowledge development requirements in an enterprise can be covered by analytic scenarios. Assume for example, that the knowledge requirements for a project are known as well as the learning options in the company. From that, one would try to identify minimal knowledge requirements for a new employee, which should work in the project and should be able to fulfil the requirements of this scenario at least after some learning efforts.
This scenario in fact is a simple scenario, a sub-category of analytic scenario, as explained below. Analytic scenarios can be specialized. Let us start from bottom. Basic scenarios are represented by exactly one basic knowledge conversion. For example, a socialization conversion will convert tacit knowledge of one employee to tacit knowledge of another. Basic scenarios are specialisations of simple scenarios, which can be described by single general knowledge conversions. The next higher level of generality is a sequential chain of general knowledge conversions. Here, as an example, a step-wise knowledge development process of an employee may be modeled, where in each step the appropriate new knowledge from others will come in and be utilized. Chains of simple scenarios are one important sub-category of the general nets, which establish the category of analytic scenarios. At least for simple cases, analytic scenarios can be supported by a rule-processing system based on a knowledge ontology, which has been built as representation of our knowledge and knowledge dynamics concept. A set of corresponding rules for addressing these scenarios and their representations has been developed. Therefore,possible solutions for those scenarios, i.e. filling the gaps in the scenarios, can be gained, see section VI for an example and [4] for a detailed description. Taxonomy of Knowledge Development Scenarios In this sub-section, the findings of the section are summarized and categorized in a taxonomy of knowledge development scenarios. This is a model-based taxonomy, because it relies heavily on the conceptual model of knowledge and knowledge development given in sections III and IV. Fig.4 depicts this taxonomy. 6. IMPLEMENTATION EXAMPLES OF KNOWLEDGE
DEVELOPMENT SCENARIOS Two implementation examples, one out of the two main scenario categories each, are decribed in this section. Example of a Constructive Scenario As an example of constructive scenarios, a modeling approach
Fig. 4 Taxonomy of knowledge development scenarios
4
Proceedings of International Conference on Complexity, Cybernetics, and Informing Science and Engineering

Fig. 5 Expanded process “Propose Product Idea”
for knowledge-intensive business processes with human interactions is described. It uses our knowledge development conception and represents a constructive knowledge development scenario. We introduce an integrated model for knowledge management, which covers task-driven, knowledge-driven and human-driven processes in an organisation. It is based on seven very general entities (Process, People, Topic, Implicit, Explicit and External Knowledge, and Document) and the various interconnections between them. The model covers process-oriented approaches, reflects the human role in various forms (as individuals, groups, or knowledge communities plus the interaction between those) and the various types of knowledge with their mutual conversions. It is an extension of the model in [1] and reflects the new knowledge conception. As notation for our model we propose an expressional extension of the Business Process Modeling Notation BPMN [6], which we call BPMN-KEC2 (KEC stands for knowledge, employees, and communities, 2 indicates the second version). BPMN is widely used for business process modeling, there exists a whole body of tools to support the visual modeling procedure, to integrate it in service-oriented architectures and to map models to execution environments for appropriate IT-support. For a detailed description of BPMN-KEC2 see [3]. The most important notational objects may be categorized as objects for knowledge and information, for knowledge conversions, for associations between knowledge and persons, and for persons. Knowledge objects are tagged with type/kind information according to the two knowledge dimensions as introduced in Section III. The quality dimension of knowledge is not reflected in this approach. Quality characteristics of knowledge assets may be implicitly denoted in the knowledge name if necessary. General knowledge conversions are denoted with an elliptical symbol. As an example, we model a business process for product renewal planning. The product is assumed to be knowledge-intensive and complex. The existing version of it should be possibly renewed by a new version. The overall process is
modeled as sequence of four activities in BPMN notation: Propose product idea, define product characteristics, plan product development and finally decide on renewal. Here we will focus on the first one, which is really knowledge-intensive and requires human interactions. The expansion of this process using the BPMN-KEC2 notation is shown in Fig. 5. The main human actors are the product manager responsible for the product in the company, a knowledge community named Expert Community, and finally a product strategist. The expanded sub-process relies on two knowledge conversions. Generate Product Idea is a general and complex knowledge conversion, Formulate Product Idea a basic externalisation conversion. The main origins for Generate Product Idea are on the one side explicit knowledge on new technologies (of the propositional knowledge kind), conscious knowledge on actual relevant research themes, both available in a knowledge community named Expert Community. On the other side, knowledge on market trends and the product position of the existing product in the market is available at the product manager as conscious and explicit knowledge, respectively.
Thirdly, the product strategist applies his internal knowledge (of the types conscious and tacit and of the strategic kind). Relevant information (Market Information) is available. Bringing this together via the knowledge conversion Generate Product Idea will end in a general product idea, being explicit knowledge associated to the product manager. This explicit knowledge now will be externalised in the second conversion to end up in external knowledge, the documented product idea. Example of an Analytic Scenario An knowledge ontology with reasoning support and a rule-processing system have been built. Fig. 6 shows the main procedure for the handling of analytic scenarios. They are represented by general knowledge conversions with gap(s), processed with the help of the rule system, and finally interpreted as scenarios with all parts known. This work is already completed with respect to basic scenarios, the following shows a rule resolving a basic scenario with the gap at the source side, externalisation as known conversion and a known
5
Proceedings of International Conference on Complexity, Cybernetics, and Informing Science and Engineering

Fig. 6 Rule support of analytic scenarios
destination knowledge piece. The rule is formulated with the Semantic Web Rule Language (SWRL, see [14]):
Knowledge(?k2) ^ Externalisation(?e) ^ hasDestination(?e, ?k2) ^ swrlx:makeOWLThing(?k1, ?k2) → Explicit_Knowledge(?k1) ^ hasSource(?e, ?k1)
Here, given knowledge k2 and the externalisation e, where k2 is the destination knowledge of conversion e, a new piece of knowledge (k1) is generated, which is of type explicit and is the source knowledge of conversion e. As a result, the rule produces a new source knowledge of type explicit knowledge, which fills the gap in the basic scenario. The next step, the support of simple scenarios is under development currently. Because of the rapidly increasing complexity of general knowledge conversions compared to basic ones, rule processing could no longer lead to unique solutions. Instead heuristics have to be introduced to support the scenario handling. Support of chains or nets of simple scenarios will be straightforward then, once the simple ones can be handled.
7. SUMMARY AND CONCLUSION
A new conception of knowledge and knowledge conversions is given, which serves as modeling basis for knowledge development in an enterprise. Investigation and classification of possible applications lead to a taxonomy of knowledge development scenarios. The main categories in this taxonomy are constructive and analytic scenarios. Derived from them important sub-categories are described. Two implementation examples are given. First, a modeling notation for knowledge-intensive business processes is introduced, which serves for constructive scenarios. This extends the potential of business process modeling by further recognition of knowledge, which is needed, generated, transferred through those processes. Second, a semantic approach with rule processing is described, which
can handle analytic scenarios. It offers the potential, to fill gaps in knowledge chains by semantic reasoning. Further research is needed, to address hybrid scenarios with both constructive as analytic characteristics. This would include cases, where only a model of knowledge-intensive business processes could be reached, which is incomplete in the sense that there are gaps in the modelled topology of activities.
REFERENCES [1] Ammann, E., “Enterprise Knowledge Communities and Business Process Modeling”, in: Proc. of the 9th ECKM Conference, Southampton, UK, 2008, pp. 19-26. [2] Ammann, E., “The Knowledge Cube and Knowledge Conversions, in: World Congress of Engineering 2009, Int. Conf. on Data Mining and Knowledge Endineering, London, UK, 2009, pp.319-324 [3] Ammann, E., “BPMN-KEC2 – An Extension of BPMN for Knowledge-Related Business Process Modeling”, Internal Report, Reutlingen University, 2011. [4] Ammann, E., Ruiz-Montiel, M., Navas-Delgado, I., Aldana-Montes, J., “A Knowledge Development Conception and its Implementation: Knowledge Ontology, Rule System and Application Scenarios”, in: Proceedings of the 2nd International Conference on Advanced Cognitive Technologies and Applications (COGNITIVE 2010), Lisbon, Portugal, November 21-25, 2010, pp. 60-65 [5] Bubenko, J.A., Jr., Brash, D., Stirna, J.: EKD User Guide, Dept. of Computer and SystemScience, KTH and Stockholm University, Elektrum 212, S-16440, Sweden. [6] “ Business Process Modeling Notation Specification”, OMG Final Adopted Specification, http://www.omg.org/spec/BPMN/1.1/, 2008. [7] De Jong, T., Fergusson-Hessler, M.G.M., “Types and Qualities of Knowledge”, Educational Psychologist, 31(2), 1996, pp.105-113. [8] EKD – Enterprise Knowledge Development, skd.dsv.su.se/home.html [9] Gronau, N.,Fröming, J., “KMDL® - Eine semiformale Beschreibungssprache zur Modellierung von Wissenskonversionen“ (in German), Wirtschaftsinformatik, Vol. 48, No. 5, pp. 349-360, 2006. [10] Hasler Rumois, U., Studienbuch Wissensmanagement (in German), UTB orell fuessli, Zürich, 2007. [11] Lehner, F., Wissensmanagement (in German), 2nd ed., Hanser, München, 2008. [12] Nonaka, I., Takeuchi, H., The Knowledge-Creating Company, Oxford University Press, London, 1995. [13] Polanyi, M., The Tacit Dimension, Routledge and Keegan, London, 1966. [14] SWRL: A Semantic Web Rule Language Combining OWL and RuleML, http://www.w3.org/Submission/SWRL/
6
Proceedings of International Conference on Complexity, Cybernetics, and Informing Science and Engineering

Optimal Pump Scheduling by Non-Linear Programmingfor Large Scale Water Transmission System
Jacek Błaszczyk∗1, Krzysztof Malinowski†1,2, and Alnoor Allidina‡3
1Research and Academic Computer Network (NASK), ul. Wawozowa 18, 02-796 Warsaw, Poland2Institute of Control and Computation Engineering, Faculty of Electronics and Information Technology, Warsaw University of Technology, ul. Nowowiejska
15/19, 00-665 Warsaw, Poland3IBI-MAAK Inc., 9133 Leslie Street, Suite 201, Richmond Hill, Ontario, Canada L4B 4N1
Abstract Large scale potable water transmission system considered in this paper is theToronto Water System (TWS), one of the largest potable water supply networks in NorthAmerica. The main objective of the ongoing Transmission Operations Optimizer (TOO)project consists in developing an advanced tool for providing such pumping schedulesfor 153 pumps, that all quantitative requirements with respect to the system operation aremet, while the energy costs are minimized. We describe here, in general, the concept ofTOO system, and, in detail, a large-scale non-linear, so-called Full Model (FM), basedon system of hydraulic equations, which is solved over 24-hour horizon and deliversoptimal aggregated flows and pressure gains for all pumping stations.
Keywords large-scale nonlinear programming, minimum cost operative planning,
pump scheduling, water supply
1. INTRODUCTION
The City of Toronto water transmission system is a large complex integrated
system consisting of pumping, storage and transmission (water mains, me-
ters, and valves). The City of Toronto water supply system capacity is the
largest in Canada and the fifth largest in North America. The Water Supply
function is responsible for providing services 24 hours per day, seven days
per week. The system consists of treated water pumping at four filtration
plants and pumping stations, and floating storage at reservoirs and elevated
tanks, and approximately 500 km of large transmission mains, ranging from
400 to 2500 mm in diameter, that transport treated water from the lake up
through the system. Water is pumped through a hierarchy of pressure dis-
tricts with elevated storage facilities (reservoirs and tanks).
Within each district, there are a number of water supply connections from the
transmission water mains to the local water distribution systems. Combina-
tions of the pumping stations and floating storage facilities provide water to
the City’s local water distribution systems. The system serves a population
of approximately 3,000,000 of which 2,500,000 are in the City of Toronto
and 500,000 are in the Region of York. The system service area is about
630 square kilometres. The Water Transmission System facilities are spread
throughout the City of Toronto and the Region of York. The Region of York
Water Transmission System (in the southern part of the Region of York) con-
sists of pumping stations, ground level storage reservoirs, elevated tanks, a
standpipe, and wells.
At present a large part of the system within the City of Toronto is essentially
manually operated, where an operator decides for example when to turn a
pump on or off. The Region of York part of the system works automati-
cally where the pumps are turned on or off based on measured tank levels;
however, the level set-points are manually set. Even when there are no abnor-
mal situations (pumping units out-of-service, hydro failure, plant down-time,
etc.), manual decision making within the City of Toronto system is a com-
plex process. The problem is further aggravated when the operators have to
deal with abnormal situations.
With this background, the City of Toronto and Region of York decided to
develop the Optimizer that automatically determines control strategies for
the Water Transmission System, based on certain criteria, including meet-
ing service delivery levels (pressures, reservoir levels, water quality), and
the Simulator that allows simulating and predicting the system performance
under various what-if situations.
The Optimizer works on-line alongside the City of Toronto’s and Region of
York’s SCADA (Supervisory Control and Data Acquisition) Systems, while
the simulator is an off-line tool.
∗Email: [email protected]†Email: [email protected]‡Email: [email protected]
2 . OV E RV IE W OF TOO S Y S TE M
The primary objective of the Optimizer (TOO) is to ensure that required
water delivery standards are met, while minimizing electrical power costs.
The TOO ensures fundamental service delivery standards including pressure,
flow, and storage are not compromised and water quality is optimized. The
pumping strategies must safeguard meeting the prevailing Water Q uality re-
quirements.
• The TOO ensures that pre-set minimum (critical) storage levels are not
violated.
• The TOO ensures that optimal strategies are achieved for different sea-
sonal, weekday/weekend and peak-day demands, as well as when ab-
normal events occur (pumping station/filtration plant/reservoir cell out-
of-service).
• The TOO includes capability for evaluating situations for buying and
selling electricity to examine the impact of H ydro spot market prices.
• The TOO consider the production cost of water which varies from plant
to plant in developing the optimal solution.
• The Transmission Operations Optimizer (TOO) is based on a water de-
mand forecast model, system hydraulic and water quality model, con-
trol strategies and practices that enables optimization of water pumping
and water quality in the Transmission System.
• The hydraulic and water quality model defined in EPANET format is
used by the Optimizer and Simulator.
• A water demand forecast model has been developed to forecast and
input short term demands for use with the Optimizer.
• A full hydraulic model based approach for determining optimal strate-
gies has been developed for use with the Optimizer.
In general, the Optimizer runs as follows:
1. Collect external factors (weather, energy rates), system status and data.
This includes, but is not limited to, reservoir levels, equipment out-of-
service, equipment auto/manual modes, production costs.
2. Run demand model to predict demand.
3. Determine potential optimal strategies.
4. Run hydraulic/quality model to check strategies.
5. Analyse results.
6. If results are acceptable, apply strategy to SCADA systems, otherwise
re-run Optimizer with objective and/or constraints.
Figure 1 depicts the overall approach/architecture for the Optimizer.7
Proceedings of International Conference on Complexity, Cybernetics, and Informing Science and Engineering
F ig u re 1 : Transmission Operations Optimizer (TOO) architecture
3 . OP TIM A L NE TW ORK S CH E DUL ING P ROB L E M
Optimization methods described in this paper are model based and, as such,
require hydraulic model of the network to be optimized. Such hydraulic
model is provided as the Epanet INP file and consists of three main compo-
nents: boundary conditions (water sources and demands), a hydraulic non-
linear network made up of pipes, pumps, valves, and reservoirs dynamics.
The NLP algorithm that has been used to compute the continuous schedules,
and also the schedule discretization method, require the Epanet simulator of
the hydraulic network. In the TOO system the Epanet Toolkit has been used
to provide the initial feasible solution to the NLP solver by simulating the
network, and also Epanet Toolkit has been utilized by the TOO scheduler for
discretization of the continuous solution.
The main objective is to minimize the pumping cost subject to the hydraulic
network equations and operating constraints over a given time horizon with
hourly discretization. The relationships between different components of
cost and operating constraints in the whole hydraulic network have a very
complex nature, thus they can only be solved by use of an advanced nonlin-
ear programming solver and optimal scheduler.
The goal of the optimal network scheduling is to calculate the least-cost op-
erational schedules for pumps, valves, and water treatment plants for a given
period, typically for 24 hours or one week. The optimization problem is
given as:
1. minimize objective function consisting of pumping cost and water treat-
ment cost,
2. subject to hydraulic network equations, and
3. operational constraints.
These three parts of the problem are discussed in the following subsections.
The optimization problem is expressed in discrete-time, i.e., in the FM model
an hourly time-step is used.
3 .1. Ob je c tiv e fu n c tio n
The objective function is the sum of two costs associated with the system:
pumping cost cost and the water treatment cost:
J = JP + JT. (1)
The main component of objective function is pumping cost (considered over
a given time horizon [0,N −1]), given by the following equation:
JP = β ·∆t ·N−1
∑k=0
NLPS
∑l=1
cul (k)
Ql(k) ·∆hl(k)
ηl
, (2)
where:
k – hourly interval index, k = 0, . . . ,N,
N – total number of hourly intervals (typically N = 24),
l – logical pumping station (LPS) index, l = 1, . . . ,NLPS,
NLPS – total number of LPSs,
p – physical pumping station (PPS) index, p = 1, . . . ,NPPS,
NPPS – total number of PPSs,
i – pump index, i = 1, . . . ,NPl ,
NPl – number of pumps at l-th logical PS,
cul (k) – electricity tariff at time period k for pumping station l (usually a
function of time),
Ql(k) – average aggregated flow (in MLD) for l-th PS at k-th hour,
∆hl(k) – average head gain (in meters) for l-th PS at k-th hour,
ηl – average aggregated efficiency for l-th PS (parameter),
β – unit conversion coefficient,
∆t – length of time period in hours (by default equal to 1).
The water treatment cost for each water treatment plant (WTP) is propor-
tional to the flow output from l-th WTP with the unit price of ctl(k):
JT = ∆t ·N−1
∑k=0
NWTP
∑l=1
ctl(k) ·Ql(k), (3)
where:
l – water treatment plant (WTP) index, l = 1, . . . ,NWTP;
NWTP – total number of WTPs,
ctl(k) – treatment tariff at time period k for l-th WTP.
In the case of TOO system a water treatment plant is also treated as a pump-
ing station.
The term:
Pl(k) = fl(Ql(k),∆hl(k)) =Ql(k) ·∆hl(k)
ηl
, (4)
in the objective function (2), represents the electrical power consumed by the
pumping station l. The mechanical power of water is obtained by multiplying
the aggregated flow (Ql(k)) and the aggregated head gain (∆hl(k)) across the
pumping station. The consumed electrical power can then be determined by
dividing the mechanical power of water by the average aggregated efficiency
for pumping station (ηl ), which is computed as the weighted average from
the maximum (best) efficiencies of all pumps included in the l-th pumping
station:
ηl =∑
NPl
i=1 QBEPi ·ηBEP
i
∑NP
li=1 QBEP
i
, (5)
where:
QBEPi – flow at best efficiency point (BEP) for the i-th pump,
ηBEPi – maximum (best) efficiency for the i-th pump,8
Proceedings of International Conference on Complexity, Cybernetics, and Informing Science and Engineering

The pumping cost depends on the efficiency of the pumps used and the elec-
tricity power tariff over the pumping duration. The tariff is usually a function
of time with alternating cheap and more expensive energy periods. In the case
of TOO system the unit energy price is computed as follows:
cul (k) = 0.22 · ccon
l +0.78 · cspotl (k), (6)
where the first unit price component is fixed according to long term contract
with electrical power supplier, and the second term is related to local energy
market spot price cspotl (k) at given location and hour k. This price is unknown
for a decision maker before actual real time occurrence, and so has to be
forecasted prior to performing the optimization.
For the TOO system the cost is based on the monthly usage, and the total
monthly pumping cost for a physical station p is defined as:
Jp = CCp +(DCRp −TARp) ·MaxKV Ap
+TCNRp ·PeakKWp +TCCRp ·MaxKWp
+(DRCRp +WOCRp ·LFactorp) ·PKWH totalp, (7)
where:
CCp – Commodity Charge, per kWh; flat or increasing block tariffs
charge,
DCRp – Distribution Charge, per maximum KV A through the month,
TARp – Transmission Allowance, per maximum KV A through the month,
TCNRp – Transmission Charge–Network, per maximum kW from tTCNRb
(e.g., 7:00 a.m.) to tTCNRe (e.g., 11:00 p.m.) weekdays (referred
to as " peak kW" ), through the month,
TCCRp – Transmission Charge–Connection, per maximum kW from
tTCCRb (e.g., 11:00 p.m.) to tTCCR
e (e.g., 7:00 a.m.), through the
month,
DRCRp – Debt Retirement Charge, per kWh in the month,
WOCRp – Wholesale Operation Charge, per kWh in the month; cost is mul-
tiplied by a loss factor LFactorp (e.g., 1.0376),
and
PKWH totalp = β ·∆t ·N−1
∑k=0
∑l:l∈p
Pl(k). (8)
The commodity charge (CCp) is variable, dependent on the time of day and
the energy rate structure, i.e., the values of unit energy prices cul (k) over a
control horizon:
CCp = β ·∆t ·N−1
∑k=0
∑l:l∈p
cul (k) ·Pl(k). (9 )
Maximum KV A through the month is:
MaxKV Ap = max
{
∑l:l∈p
PV Al (k)
}N−1
k=0
,
PV Al (k) =
Pl(k)
PFp, (10)
where PFp is the power factor for the p-th physical pumping station (e.g.,
0.9 2).
Peak KW through the month is:
PeakKWp = max
{
∑l:l∈p
Pl(k), k = tTCNRb to tTCNR
e weekdays
}N−1
k=0
(11)
Maximum KW through the month is:
MaxKWp = max
{
( ∑l:l∈p
Pl(k), k = tTCCRb to tTCCR
e
}N−1
k=0
(12)
The cost function (7) depends on the maximum values over the time period
of optimization:
JMDCp = (DCRp −TARp) ·MaxKV Ap
+TCNRp ·PeakKWp +TCCRp ·MaxKWp. (13)
The above component can be converted into a conventional optimization
form by introducing auxiliary variables z1p, z2
p and z3p to represent peak fac-
tors. We express the transformed model as:
JMDCp = (DCRp −TARp) · z1
p +TCNRp · z2p +TCCRp · z3
p, (14)
subject to constraints:
∑l:l∈p
PV Al (k) ≤ z1
p, k = 0, . . . ,N −1,
∑l:l∈p
Pl(k) ≤ z2p, k = tTCNR
b to tTCNRe weekdays and k = 0, . . . ,N −1,
∑l:l∈p
Pl(k) ≤ z3p, k = tTCCR
b to tTCCRe and k = 0, . . . ,N −1. (15)
In the objective function (2) we should take into account only ∆hl(k)≥ 0, i.e.,
when the pumping stations provides a flow (Ql(k) > 0) by use of its pumps
(there maybe a flow for some pumping stations by use of a bypass pipe, but
in that case ∆hl(k)≤ 0). Thus, the equation (2) could be reformulated as:
JP = β ·∆t ·N−1
∑k=0
NLPS
∑l=1
cul (k)
Ql(k) ·max(0,∆hl(k))
ηl(∆hl(k)), (16)
and finally replaced by the well-know formulation for a “ min-max” objective
function:
JP = β ·∆t ·N−1
∑k=0
NLPS
∑l=1
cul (k) ·P+
l (k),
P+l (k) ≥ 0,
P+l (k) ≥ Ql(k) ·∆hl(k)
ηl(∆hl(k)), (17)
where P+l (k) is an auxiliary variable defined for each pumping station and
for each k = 0, . . . ,N −1.
In general, the pumping cost may be reduced by decreasing the water quan-
tity pumped, decreasing the total system head, increasing the overall effi-
ciency of the pumping station by proper pump selection, or using reservoirs
and elevated tanks to maintain uniform highly efficient pump operations. In
most instances, efficiency can be improved by using an optimization algo-
rithm to select the most efficient combination of pumps to meet a given
demand. Additional cost savings may be achieved by shifting pump oper-
ations to off-peek water-demand periods through proper filling and draining
of reservoirs and elevated tanks. Off-peek pumping is particularly beneficial
for systems operating under a variable-electric-rate schedule.
3.1.1. D ecision variables
The decision variables in the resulting aggregated nonlinear optimization
problem are the average aggregated flows and average head gains for all log-
ical pumping stations at each hour of the control horizon. Also, the deci-
sion variables might be the settings for some throttled valves (minor losses
or valve openings) and settings for pressure reducing valves (set-point pres-
sures) in the hydraulic system.
The indirect decision variables in the optimization problem are:
• flows and head losses for every pipe and valve,
• heads at every junction and demand node,
• heads, volumes and water levels for every reservoir and elevated tank.
For all those variables there are simple bounds constraints. All variables are
related mutually through the hydraulic model.
3 .2 . H y d ra u lic m o d e l
Each network element has a hydraulic equation. In the optimal scheduling
problem it is required that all calculated variables satisfy the hydraulic model
equations. The network equations are usually non-linear and are embedded
as inequality and equality constraints in the optimization problem. In the
following subsections we describe the network equations used in modelling
of:
• flow continuity at connection nodes,
• mass-balance, average head and volume curve for reservoirs and ele-
vated tanks,9
Proceedings of International Conference on Complexity, Cybernetics, and Informing Science and Engineering

• head-loss for pipes,
• head-loss for TCV valves,
• check valves,
• PRV valves,
• pumping stations.
3.2.1. Flow continuity eq uations at connection nodes
For each i-th network’s node the flow continuity equation (resulting from
Kirchhoff’s law I) must be met:
∑j∈L:Λc
i j 6=0
Λci j ·Q j(k) = di(k), k = 0, . . . ,N −1, (18)
where:
Λc – node-component incidence matrix for connection nodes,
Q j(k) – flow through j-th link at k-th hour,
di(k) – i-th node demand at k-th hour (nonzero for demand node, zero for
connecting node),
L – set of network links.
3.2.2. Mass-balance state eq uations for reservoirs and elevated tanks
For each r-th reservoir or elevated tank the following mass-balance state
equation must be fulfilled:
Vr(k+1) =Vr(k)+ ∑j∈L:Λr
r j 6=0
Λrr j ·Q j(k) ·∆t, k = 0, . . . ,N −1, (19 )
where:
r – reservoir or elevated tank index, r = 1, . . . ,NR,
NR – total number of reservoirs and elevated tanks,
Vr(k),Vr(k+1) – r-th reservoir or elevated tank volume at k-th and (k+1)-th hours,
Λr – node-component incidence matrix for reservoir and ele-
vated tank nodes,
∆t – time step (equal to one hour in the FM model).
3.2.3. Average head eq uations for reservoirs and elevated tanks
For the k-th hour and for each r-th reservoir or elevated tank, average head
Hr(k) required for flow modeling is computed as:
Hr(k) = Er +1
12(−xr(k−1)+8 · xr(k)+5 · xr(k+1)) ,
xr(k−1) = f−1(Vr(k−1)),
xr(k) = f−1(Vr(k)),
xr(k+1) = f−1(Vr(k+1)), k = 1, . . . ,N −1, (20)
where:
Er – reservoir or elevated tank elevation,
xr(k) – reservoir or elevated tank level,
Vr(k−1),Vr(k),Vr(k+1) – reservoir or elevated tank volumes for previous,
current, and next hour,
f (.) – level-volume curve, i.e., at each time Vr(k) =f (xr(k)).
In the equation (20) we used two-interval extended Simpson’s rule because it
was more numerically stable for the resulting non-linear optimization prob-
lem.
3.2.4. Volume curves for reservoirs and elevated tanks
A V olume Curve determines how storage tank volume (in ML) varies as a
function of water level (in meters). It is used when it is necessary to ac-
curately represent tanks whose cross-sectional area varies with height. The
lower and upper water levels supplied for the curve must contain the lower
and upper levels between which the tank operates.
In the FM model a volume curve is approximated by a linear curve or a cubic
polynomial. For r-th reservoir or elevated tank, and at k-th hour, we have:
Vr(k) = ar · xr(k)3 +br · xr(k)
2 + cr · xr(k)+dr, k = 0, . . . ,N, (21)
where:
Vr(k) – volume,
xr(k) – level,
ar,br,cr,dr – cubic polynomial coefficients.
Most of the reservoirs and elevated tanks in the FM model have a simple
linear volume curve:
Vr(k) = cr · xr(k)+dr, k = 0, . . . ,N. (22)
3.2.5. Head-loss eq uations for pipes
A pipe segment, with heads h1(k) and h2(k) at bordering nodes 1 and 2,
and flow Q(k) considered positive when directed from node 1 to node 2, is
described by the H azen-Williams (H W) empirical head-loss formula:
h1(k)−h2(k) = A · sgnQ(k) · |Q(k)|α , k = 0, . . . ,N −1, (23)
where:
A – resistance coefficient for the pipe,
α – flow exponent (α = 1.852).
Equation (23) models pressure loss in water pipes due to friction. For each
pipe, it uses a single constant A to characterize the pipe’s resistance which
depends on the diameter, length and roughness of pipe (the roughness de-
pends only on the material the pipe is made). Introduced in 19 02, the H azen-
Williams equation is an accepted model for fully turbulent flow in water net-
works that, because of its simplicity, has had large diffusion in hydraulic
computations.
Because of numerical difficulty with the absolute value term in the H W for-
mula (i.e., the non-differentiability when the flow is 0), we use its smooth
approximation on interval [−δ ,+δ ]:
h1(k)−h2(k) =
(
3δ α−5
8+
1
8(α −1)αδ α−5 − 3
8αδ α−5
)
Q(k)5
+
(
− 5δ α−3
4− 1
4(α −1)αδ α−3 +
5
4αδ α−3
)
Q(k)3
+
(
15δ α−1
8+
1
8(α −1)αδ α−1 − 7
8αδ α−1
)
Q(k) (24)
Outside of the interval we use the original H W formula.
3.2.6. Head-loss eq uations for TCVs
The throttle valves (TCV ) are modeled in a similar way as a pipe segment
with α = 2. Also for TCV s we are using the smoothing approximation for
function:
f (x) =
{
x2 x ≥ 0,
−x2 x < 0.(25)
3.2.7. CV model
A pipe can contain a check valve (CV ) restricting flow in one direction –
always from the start node to the end node.
∆h+(k) ·Q(k) ≤ 0,
A ·Q(k)α − (h1(k)−h2(k))−∆h+(k) = 0, k = 0, . . . ,N −1, (26)
where:
h1(k) – head at the start node of CV ,
h2(k) – head at the end node of CV ,
Q(k) – flow through the CV , Q(k)≥ 0,
∆h+(k) – auxiliary variable, ∆h+(k)≥ 0.
3.2.8. PRV model
A Pressure Reducing V alve (PRV ) limits the pressure at a point in the pipe
network. EPANET computes in which of three different states a PRV can be
in:
1. partially opened (i.e., active) to achieve its pressure setting on its down-
stream side when the upstream pressure is above the setting,
2. fully open if the upstream pressure is below the setting,10
Proceedings of International Conference on Complexity, Cybernetics, and Informing Science and Engineering

3. closed if the pressure on the downstream side exceeds that on the up-
stream side (i.e., reverse flow is not allowed).
A pressure reducing valve will throttle the flow to prevent the downstream
pressure or hydraulic grade from exceeding a user-defined pre-set value. In
order to achieve its pressure reducing ability, a specific head-loss will be
induced through the PRV , such that the resulting downstream pressure obeys
the setting.
The valve can be in one of three states:
1. V alve is CLOSED if downstream pressure exceeds the pressure setting or
is greater than the upstream pressure (to prevent reverse flow).
2. V alve is OPEN if upstream pressure is less than setting and downstream
pressure is less than upstream pressure.
3. V alve CONTROLS if upstream pressure is greater than setting and down-
stream pressure equals setting.
Modeling of PRV s has to be, for purpose of optimization, different from de-
scription of those component as used in EPANET simulator. Thus, PRV s in
the FM model are modeled by set of nonlinear constraints involving multi-
plication of two or three variables:
(h1(k)−h2(k)) ·Q(k) ≥ 0,
(hs(k)−h2(k)) ·Q(k) ≥ 0,
(h1(k)−hs(k)) ·Q(k) · (h1(k)−h2(k)) ≥ 0,
(h2(k)−hs(k)) ·Q(k) · (h1(k)−h2(k)) ≥ 0, k = 0, . . . ,N −1,(27)
where:
h1(k) – head at the upstream side of PRV ,
h2(k) – head at the downstream side of PRV ,
hs(k) – PRV setting (downstream elevation + pressure setting),
Q(k) – flow through the PRV .
3.2.9. Constraints for pumping stations
We formulate the following set of constraints for the l-th pumping station:
∆hl(k)− (h2(k)−h1(k)) = 0, (28)
(h2(k)− (E2 + pminl )) ·Ql(k) ≥ 0, (29 )
(∆hl(k)−∆hminl ) ·Ql(k) ≥ 0, (30)
(h1(k)−hNPSHl ) ·Ql(k) ≥ 0, (31)
Ql(k)− ∑i∈MON
l
Q+i (k) ≥ 0, (32)
Ql(k)−NP
l
∑i=1
(
1
1+ e−L·Q+i (k)
)
·Q+i (k) ≤ 0, k = 0, . . . ,N −1, (33)
where:
∆hl(k) – average head gain for the PS,
h1(k) – head at the suction side of PS,
h2(k) – head at the discharge side of PS,
Ql(k) – flow through the PS, Ql(k)≥ 0,
E2 – elevation of discharge node for PS,
pminl – requested minimum pressure at PS discharge,
∆hminl – requested minimum head gain for the PS,
hNPSHl – Net Positive Suction H ead (NPSH ),
MONl – set of pumps in manual ON mode at l-th logical PS,
Ai,Bi,Ci – coefficients of the exponential H -Q curve for i-th pump:
∆hi(Qi(k)) = Ai −Bi ·Qi(k)Ci , i = 1, . . . ,NP
l ; (34)
The Q -H pump curve is given as:
Qi(k) =
(
Ai −∆hi(k)
Bi
)1
Ci, i = 1, . . . ,NP
l , (35)
Q+i (k) – flow through i-th pump for given ∆hl(k) (Q+
i (k)≥ 0):
Q+i (k) =
(
max{0,Ai −∆hl(k)}Bi
)1
Ci, (36)
L – sufficiently large scaling parameter (L = 40).
The non-smooth function max{0,g(x)} in the equation (36) is replaced by
a smoothed reformulationg(x)+
√g(x)2+ε
2. For sufficiently small ε > 0 this
function provides a reasonable approximation of the max operator.
The equation (28) defines an average head gain for PS as a difference be-
tween heads at discharge and suction sides of PS. The equation (29 ) requests
a predefined minimum pressure at discharge side only when there is a flow
through the PS, i.e., Ql(k) > 0, and the equation (30) is a constraint for the
minimum average head gain for PS (again only when Ql(k)> 0). The equa-
tion (31) requests the minimum head at suction side of the PS (named NPSH ),
only when Ql(k)> 0. The equation (32) defines the minimum nonzero flow
for a PS, when there is a pump switched manually ON, and the equation (33)
defines the maximum flow for a PS taking into account the sum of flows for
each pump, only when it provides a feasible flow for given ∆hl(k).
3 .3 . Op e ra tio n a l c o n s tra in ts
The operational constraints have the form of simple inequalities and are ap-
plied to keep the system state within its feasible operating range.
Thus, we must take into account time varying minimum and maximum reser-
voir and elevated tank volumes:
V minr (k)≤Vr(k)≤V max
r (k), k = 1, . . . ,N, (37)
where V minr (k) and V max
r (k) are the minimum and maximum storage volumes
specified (typically these will be constants with respect to time k). The reser-
voir and elevated tank volumes (state variables) should remain within the
prescribed simple bounds in order to prevent emptying or overflowing, and
to maintain sufficient storage for emergency purposes.
Similar constraints must be applied to the heads at critical nodes (SYPs) in
order to maintain required pressures throughout the water network:
hmins ≤ hs(k)≤ hmax
s , k = 0, . . . ,N −1, (38)
where hmins and hmax
s are the minimum and maximum heads specified for SYP
nodes.
The other variables, such as:
• flows for all links (pipes including CV s, TCV and PRV valves, and
pumping stations),
• head-losses for pipes and valves, and head-gains for pumping stations,
• heads at all nodes (connection junctions, demand nodes, suctions and
discharges of pumping stations),
• water levels for reservoirs and elevated tanks,
are also constrained by lower and upper constraints determined by the fea-
tures of particular network elements.
Other important constraints are on the final water level (and final water vol-
ume) of reservoirs and elevated tanks, such that the final level is not smaller
than the initial level:
xr(N)≥ xr(0), r = 1, . . . ,NR. (39 )
Without such constraints the least-cost optimization would result in empty-
ing all reservoirs. In the case of TOO system such constraint is applied over a
long-horizon (up to 7 days) when solving a mass-balance optimization prob-
lem.
3 .4 . M a x im u m De m a n d Ch a rg e s (M DC) c o n s tra in ts
In calculation of pumping cost two types of electricity pricing are applicable:
1. unit electricity tariff,
2. maximum demand tariff.
The second is difficult to handle and is not widely used by water companies.
The maximum demand charge (MDC) is calculated for the power peak (in
kWs or kV As) which occurred during the month. This calculations are made
independently for each physical pumping station (i.e., for each electrical fa-
cility), and the total charge is:
JMDC =NPPS
∑p=1
cMDCp · max
k=0,...,N−1Jp(k), (40)
where:11
Proceedings of International Conference on Complexity, Cybernetics, and Informing Science and Engineering

cMDCp – maximum demand charge for p-th electrical facility,
Jp(k) – sum of power consumed by all logical pumping stations included in
the p-th physical pumping station:
Jp(k) = ∑l:l∈p
Pl(k). (41)
The operational monthly cost of running the water supply system can finally
be expressed as:
J = JP + JT + JMDC (42)
The terms JP and JT in equation (42) are separable in time and they can be
used to formulate a control problem over any period of time shorter than one
month. The maximum demand charge JMDC expressed by equation (40) is
not separable and causes problems if the control horizon is shorter than one
month. Thus, the common approach is to ignore the MDC term, and optimize
only the unit charge and treatment cost.
H owever, in the case of TOO system the MDC could affect the optimal solu-
tion significantly, thus the special mechanism is incorporated into a one-day
network scheduling problem (i.e., for N = 24). We formulate the objective
function for the i-th day scheduling (during MDC period) as:
J = JP + JT + JMDC, (43)
where:
JMDC =NPPS
∑p=1
cMDCp ·wi ·max{MDp(prev),MDp(i)}, (44)
and where the following notation is employed:
wi – weight coefficient representing the rate of MDC on different
days (i.e., dependent on the day of the month under consid-
eration); suppose lMDC to be the length of the MDC period
(maybe 30 days); then, wi =i
lMDC,
MDp(prev) – previous maximum demand for p-th electrical facility until the
i-th day;
MDp(i) – current maximum demand for p-th electrical facility on the
i-th day:
MDp(i) = maxk=0,...,N−1
Jp(k). (45)
By a proper choice of the values of wi as the month progresses we can pre-
serve a balance between the term (JP + JT) and the term JMDC and achieve a
solution which is close to the optimal solution over a one-month horizon.
The objective function (44) may be reformulated by as:
JMDC =NPPS
∑p=1
cMDCp ·wi ·
(
MDp(prev)+MD+p (i)
)
,
MD+p (i) ≥ 0,
MD+p (i) ≥ MD++
p (i)−MDp(prev),
MD++p (i) ≥ 0,
MD++p (i) ≥ Jp(k), k = 0, . . . ,N −1, (46)
where MD+p (i) and MD++
p (i) are an auxiliary variables defined for each elec-
tric facility.
3 .5 . F le x ib le fi n a l s ta te s fo r re s e r v o irs a n d e le v a te d ta n k s
The objective function, representing the total operating cost to be minimized,
is usually comprised of energy cost for pumping water and the cost for treat-
ing water, although other cost such as penalties for deviation from the final
reservoir (and elevated tank) target levels are sometimes included. The final
penalty charge is associated with the cost imposed on the state variables for
deviation from the specified final reservoirs levels.
In the case of TOO system final reservoir states for the 24-hour FM prob-
lem are taken from solution of the full mass-balance model (FMBM). The
FMBM model is a large-scale linear programming model solved usually over
one week horizon, and emerges directly from the FM model for which all
pressure dependent variables (heads, levels, head losses and head gains) and
constraints were omitted or substituted by parameters.
Thus, the objective function, representing operative cost, is the sum of the
pumping, treatment, maximum demand charges, and final state penalty costs:
J = JP + JT + JMDC + JF, (47)
where the final term JF is a penalty function associated with the final levels
of reservoirs and elevated tanks xr(N),r = 1, . . . ,NR. In the FM model the
JF is modeled by use of the slack variables x+r (N)≥ 0 and x−r (N)≥ 0 in the
following way:
JF =NR
∑r=1
ρr ·(
x+r (N)+ x−r (N))
, (48)
and by an additional equation for each reservoir:
xr(N) = xr(N)+ x+r (N)− x−r (N), (49 )
where:
ρr – penalty coefficient (equal to a large value, e.g., 1000),
xr(N) – desired final level for r-th reservoir or elevated tank (in the TOO
system obtained from solution of the FMBM problem).
4 . CONCL US IONS A ND F UTURE W ORK
We described, in general, the concept of TOO system, and, in detail, a large-
scale non-linear, so-called Full Model, based on system of hydraulic equa-
tions, which is solved over 24-hour horizon and delivers optimal aggregated
flows and pressure gains for all pumping stations. The resulting NLP model
is a truly large-scale nonlinear optimization problem. The basic, 24-hour
period, version involves over 9 0000 variables and nearly 100000 equality
and inequality constraints. For the solution of such NLP problem we use
the IPOPT solver [9 ] , implementing a primal-dual interior-point algorithm
with line-search minimization based on the filter method. The IPOPT solver
was found to provide very good performance, stability and robustness when
solving real-time NLP problems generated by the TOO system.
Re fe re n c e s
[1] J. Błaszczyk, A. Karbowski, K. Krawczyk, K. Malinowski, and A. Allidina. Op-timal pump scheduling for large scale water transmission system by linear pro-gramming. Journal of Telecommunications and Information Technology (JTIT),2012(3):9 1–9 6, 2012.
[2] J. Błaszczyk, K. Malinowski, and A. Allidina. Aggregated pumping station op-eration planning problem (APSOP) for large scale water transmission system. InK. Jó nasson, editor, Applied Parallel and Scientifi c Computing, 10th InternationalConference, PARA 2010, Reykjavik, Iceland, June 6-9, 2010, Revised Selected Pa-pers, Part I, volume 7133 of Lecture Notes in Computer Science, pages 260–269 ,Berlin / H eidelberg, 2012. Springer-V erlag Inc.
[3] M. A. Brdys and B. U lanicki. Operational Control of Water Systems: Structures,algorithms and applications. Prentice H all, New York, 19 9 4.
[4] J. Burgschweiger, B. G nä dig, and M. C. Steinbach. Nonlinear programming tech-niques for operative planning in large drinking water networks. The Open AppliedMathematics Journal, 3:14–28, 2009 .
[5] J. Burgschweiger, B. G nä dig, and M. C. Steinbach. Optimization models for opera-tive planning in drinking water networks. Optimization and Engineering, 10(1):43–73, 2009 .
[6] L. W. Mays. Optimal Control of Hydrosystems. Marcel Dekker, New York, firstedition, 19 9 7.
[7] H . Methods. Advanced Water D istribution Modeling and Management. H aestadPress, Waterbury, CT U SA, first edition, 2003.
[8] L. A. Rossman. EPANET 2 users manual. Technical Report EPA/600/R-00/057,U .S. States Environmental Protection Agency, National Risk Management Re-search Laboratory, Office of Research and Development, Cincinnati, Ohio, U SA,2000.
[9 ] A. Wä chter and L. T. Biegler. On the implementation of a primal-dual interior-pointfilter line-search algorithm for large-scale nonlinear programming. MathematicalProgramming, 106(1):25–57, 2006.
12
Proceedings of International Conference on Complexity, Cybernetics, and Informing Science and Engineering

Towards the construction of a cybernetic organism: the place of mental processes
R. Balvetti, A. Botticelli, M.L. Bargellini, M. Battaglia, G. Casadei, A. Filippini, E. Pancotti, L. Puccia, C. Zampetti.
ENEA C.R. Frascati
Roma Italy
and
G. Bozanceff, G. Brunetti, A. Guidoni, L. Rubini, A.Tripodo
ENEA guest C.R. Frascati Roma Italy
ABSTRACT
Observing the process that generates actions inside our
Biological System, we ask ourselves the question: where is the
mind placed?
The paper describes the cybernetic model GIASONE: a
synthetic emulator of the Biological Intelligent System, and its
mental processes. Starting from the GIASONE model, several
intelligent applications have been realized both as aids for
people, and as implementations into already existing machines,
making some processes "intelligent", or also to improve
functions on existing technologically advanced processes.
Keywords: cybernetic model, mind, brain, GIASONE, synthetic
intelligence
1. INTRODUCTION
Observing the process, that generates actions inside the
Biological System, we wondered where the wellspring of the
mind was. How does the environmental clue reach the mind?
how does the germ expand to build action sequences? and,
finally, how do these sequences become interior sequences of
postures and trajectories of motion made into environment?
2. THE MENTAL PROCESSES
The mind, which is considered as place of expansion of mental
processes [1], is usually studied separately from the rest of the
body that includes it. It is difficult to consider the mind as a set
of elements distributed throughout the body, but if we analyze
the body we find scattered "places" of mind and all concur to
mental events.
This is the achievement of technology as Synthetic Intelligence:
mental processes that led to the conception of GIASONE [2]
model, a synthetic emulator of the Biological Intelligent System,
and of its mental processes. For synthetic emulator we mean a
system that can perceive the environment and perform
autonomously consistent actions on it, this is based on a new
technology philosophy called Olocontrollo emulative,
Olocontrollo emulativo is a technology that comes directly from
the cybernetic GIASONE model [3]. This is to provide a new
place (emulative space) into a machine that already exists. In
this place occurs the interference of temporal reconstructions or
emulates of concrete reality, which includes the machine itself.
The interference between emulates creates new emulates that
still interfere with each other. The process of interference is
reiterative without limits; this generates an architecture that is
spread over several levels, in the present and in the past. The
differential (∆) produced drives the machine to perform actions
on the environment through actuators. All this is achieved by
zeroing the differential.
The olocontrollo emulative schema for the INTELLIGENT
PROSTHETIC application [4] is represented in Fig.1.
Fig.1 Representation of the Olocontrollo emulative schema
The olocontrollo emulative technology uses different tools and
methods of investigation as: Physics, Engineering, Physiology,
Philosophy, etc. that are harmonized in a single integrated and
organic cognitive approach, the cybernetic approach.
The objective of our project is a technological synthetic
emulation of the Intelligent Biological System and its
elementary processes [5].
For intelligent system we mean a system that is able to perceive
the environment and perform autonomously actions coherent on
it.
The project is developed along a search path that starts from the
observation of the behaviour of an Intelligent Biological System
to get to know, and artificially emulate the process that leads
from the perception to the action.
13
Proceedings of International Conference on Complexity, Cybernetics, and Informing Science and Engineering
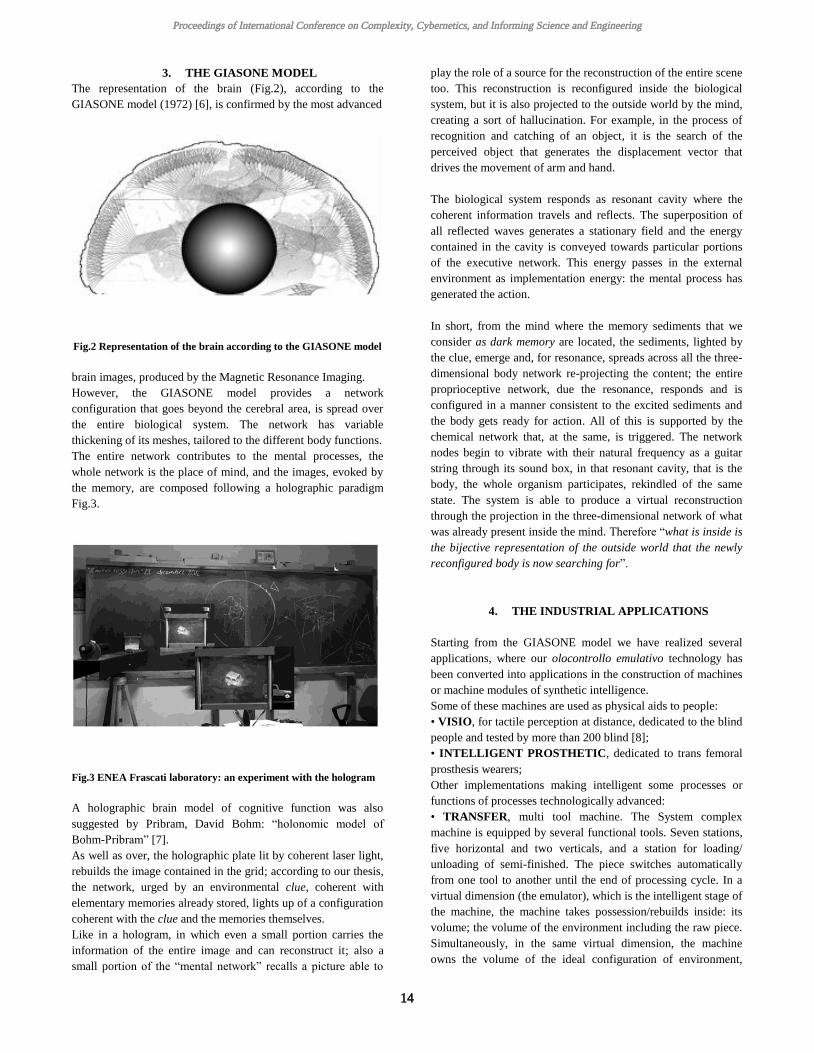
3. THE GIASONE MODEL
The representation of the brain (Fig.2), according to the
GIASONE model (1972) [6], is confirmed by the most advanced
Fig.2 Representation of the brain according to the GIASONE model
brain images, produced by the Magnetic Resonance Imaging.
However, the GIASONE model provides a network
configuration that goes beyond the cerebral area, is spread over
the entire biological system. The network has variable
thickening of its meshes, tailored to the different body functions.
The entire network contributes to the mental processes, the
whole network is the place of mind, and the images, evoked by
the memory, are composed following a holographic paradigm
Fig.3.
Fig.3 ENEA Frascati laboratory: an experiment with the hologram
A holographic brain model of cognitive function was also
suggested by Pribram, David Bohm: “holonomic model of
Bohm-Pribram” [7].
As well as over, the holographic plate lit by coherent laser light,
rebuilds the image contained in the grid; according to our thesis,
the network, urged by an environmental clue, coherent with
elementary memories already stored, lights up of a configuration
coherent with the clue and the memories themselves.
Like in a hologram, in which even a small portion carries the
information of the entire image and can reconstruct it; also a
small portion of the “mental network” recalls a picture able to
play the role of a source for the reconstruction of the entire scene
too. This reconstruction is reconfigured inside the biological
system, but it is also projected to the outside world by the mind,
creating a sort of hallucination. For example, in the process of
recognition and catching of an object, it is the search of the
perceived object that generates the displacement vector that
drives the movement of arm and hand.
The biological system responds as resonant cavity where the
coherent information travels and reflects. The superposition of
all reflected waves generates a stationary field and the energy
contained in the cavity is conveyed towards particular portions
of the executive network. This energy passes in the external
environment as implementation energy: the mental process has
generated the action.
In short, from the mind where the memory sediments that we
consider as dark memory are located, the sediments, lighted by
the clue, emerge and, for resonance, spreads across all the three-
dimensional body network re-projecting the content; the entire
proprioceptive network, due the resonance, responds and is
configured in a manner consistent to the excited sediments and
the body gets ready for action. All of this is supported by the
chemical network that, at the same, is triggered. The network
nodes begin to vibrate with their natural frequency as a guitar
string through its sound box, in that resonant cavity, that is the
body, the whole organism participates, rekindled of the same
state. The system is able to produce a virtual reconstruction
through the projection in the three-dimensional network of what
was already present inside the mind. Therefore “what is inside is
the bijective representation of the outside world that the newly
reconfigured body is now searching for”.
4. THE INDUSTRIAL APPLICATIONS
Starting from the GIASONE model we have realized several
applications, where our olocontrollo emulativo technology has
been converted into applications in the construction of machines
or machine modules of synthetic intelligence.
Some of these machines are used as physical aids to people:
• VISIO, for tactile perception at distance, dedicated to the blind
people and tested by more than 200 blind [8];
• INTELLIGENT PROSTHETIC, dedicated to trans femoral
prosthesis wearers;
Other implementations making intelligent some processes or
functions of processes technologically advanced:
• TRANSFER, multi tool machine. The System complex
machine is equipped by several functional tools. Seven stations,
five horizontal and two verticals, and a station for loading/
unloading of semi-finished. The piece switches automatically
from one tool to another until the end of processing cycle. In a
virtual dimension (the emulator), which is the intelligent stage of
the machine, the machine takes possession/rebuilds inside: its
volume; the volume of the environment including the raw piece.
Simultaneously, in the same virtual dimension, the machine
owns the volume of the ideal configuration of environment,
14
Proceedings of International Conference on Complexity, Cybernetics, and Informing Science and Engineering

including the finished piece. Now, in the machine there are two
different configurations of the same environment. Inside the
machine, these volumes of the environment are interfering. This
interference drives the machine that transforms the raw piece
into finished piece.
• SECURCRANE, anti-sway module [9]. The module aim is to
solve the most important problem of the containers movement
into the port: the swaying crane load movement, during all
phases of loading and unloading of the container (caused also
from event not foreseeable, for example the wind). The sway is
predicted and avoided before it appears. The “anti-sway”
module is a module in side of the European SECURCRANE
project.
• A ROBOT VISION laser welding. The System was designed
with an innovative type of control that allows the seam
autonomous tracking, and the on-line parallel control of the
quality of the weld. The System is equipped with an intelligent
agent system the emulator that emulates the welding and
manages the run of welding over the seam line: in a dynamic
way. The emulator emulates the next spot of welding and drives
the laser's head in the run of welding. This System with an
artificial vision robot was used for flat sheets up to 16 meters in
length.
5. CONCLUSION
At previous question: where is the place of the mind? we answer
that the place of the mind and of the mental processes cannot
confined into the brain, but whole body by its resonant net is the
place of the mental process, which resonates from the
imaginative phase to pre-actuative phase.
6. REFERENCES
[1] M.Battaglia, A. Botticelli, G.Gazzi, A.Guidoni, G. La Rosa,
N. Pacilio, S.Taglienti, C. Zampetti Processi mentali, 2003
ENEA
[2] R.Balvetti, M.L.Bargellini, M. Battaglia, A. Botticelli,
G.Casadei, A.Filippini, A.Guidoni, E.Pancotti, L.Puccia,
L.Rubini, C.Zampetti, F.Bernardo, A.Grandinetti, B.Mussi,
G.Bozanceff, C.Iencenelli; From Natural Intelligence To
Synthetic Intelligence Through Cybernetic Model, The
International Symposium on Design and Research in the
Artificial and the Natural Sciences: Proceeding DRANS 2010
Orlando/Florida
[3] http://www.frascati.enea.it/UTAPRAD/olem.htm
[4] R.Balvetti, M.LBargellini, M.Battaglia, A.Botticelli, G.
Casadei, A.Filippini, E.Pancotti, L.Puccia, C.Zampetti., G.
Bozanceff, G.Brunetti, A.Chiapparelli, A.Guidoni, L.Rubini,
A.Tripodo, M.Traballesi, S.Brunelli, F.Paradisi, A.Grandinetti,
E.Di Stanislao, R.Rosellini The Cybernetic can improve the
quality of life: An Intelligent Limb Prosthesis, Proceeding
BMIC2012 Orlando/Florida
[5] A.Botticelli, N. Pacilio, Cento Lavagne Edizioni Controluce,
2008
[6] http://antonio.controluce.it/giasone
[7] http://en.wikipedia.org/wiki/Holonomic_brain_theory
[8] Il SOLE-24 ORE (Newspaper) Venerdì 12 Maggio 1995
Informatica-Robotica Visio sostituisce la vista con la sensibilità
tattile.
[9]http://cordis.europa.eu/search/index.cfm?fuseaction=result.do
cument&RS_LANG=FR&RS_RCN=12385922&q=
ENEA: Italian National Agency for New Technologies, Energy
and Sustainable Economic Development
The Agency’s activities are targeted to research, innovation
technology and advanced services in the fields of energy.
ENEA performs research activities and provides agency
services in support to public administrations, public and private
enterprises, and citizens. (www.enea.it)
15
Proceedings of International Conference on Complexity, Cybernetics, and Informing Science and Engineering

Seeing the Big Picture: Principles for dynamic process data visualization on Large Screen Displays
Alf Ove BRASETH
Institute for Energy Technology, OECD Halden Reactor Project Halden, Norway
and
Trond Are ØRITSLAND, PhD Norwegian University of Science and Technology, Interaction Design
Trondheim, Norway
ABSTRACT
Control room operators in time-constrained situations easily lose track of what is happening in complex large-scale pro-cesses, coping with thousands of variables and control-loops. Information-Rich Design (IRD) is an industry-tested approach to Large Screen Display (LSD) design that aims to close the gap through an easy perceivable big picture. This paper develops a theoretical basis and proposes design principles for IRD, focusing on visualization of dynamic behaviour of complex large-scale processes.
The theoretical basis is discussed in light of initial evaluations of the IRD concept, other display concepts for complex pro-cesses, scientific findings on visualization and perception of displays, and psychological literature on rapid, intuitive, infor-mation perception. Design principles are discussed using the case of an on-going installation of a third generation IRD large screen display for a nuclear research reactor.
Keywords: Large Screen Display, Complex Processes, fast Visual Perception
1. INTRODUCTION & MOTIVATION
Control room operators face a huge challenge in monitoring thousands of variables and control-loops in large industrial processes. They may experience difficulty in seeing the greater picture if complexity goes too far. Endsley [1] noted that operators have difficulties developing satisfactory Situation Awareness (SA) in complex processes because of the necessity to perceive critical factors, comprehend them in a meaningful context in relation to goals and to support projection of future status.
Display technology suitable for control room installations has evolved rapidly in recent years. High-definition video projectors and flat screen power-walls have enabled the display of process information on much larger surfaces than in the past. Andrews et al. [2] refer to studies showing that high-resolution Large Screen Displays (LSDs) can positively affect user performance for spatial visualizations. Thus it is plausible that LSDs can contribute to improving the operator´s SA, presenting much more information than on smaller desktop displays.
Unfortunately, larger scale displays in control rooms are often only up-scaled traditional schematic process and instrumenta-tion type pictures, using traditional process symbols, numbers and bar graphs. Andrews et al. [2] suggest, however, that designing effective large displays is not a matter of scaling up existing visualizations; designers should adopt a human-centric
perspective on these matters, taking limited human capabilities into consideration.
Endsley [1] refer to studies showing that experts use pattern-matching mechanisms to draw upon long-term memory structures, enabling them to quickly understand a given situa-tion. This mechanism is recognized by the US nuclear regulator, which has worked with issues related to information presentation in control rooms for many years. For example, NUREG-0700 [3] section 6: Group-view display system states that: “An overview display should provide a characterization of the situation as a whole in a concise form that can be recognized at a glance”, it is also referring to object categorization schemes and pattern matching cues to reduce demands on attention. There is, however, a scarcity of scientific literature or design approaches that attempt to answer the question: “How should one display process information on LSDs to support fast information perception for complex large-scale processes?”
The IRD approach discussed in this paper is a scientifically based LSD concept developed at the Norwegian Institute for Energy Technology. It has been applied for industrial and re-search purposes so far through 13 live applications in the petro-leum, mining and nuclear domains. Its objective is to give the big picture of the process state, and to support rapid visual perception of data.
Figure 1 illustrates qualitatively how the process operator experiences reduction in information acquisition capacity in increasingly faster-paced, data-driven situations. IRD addresses fast information acquisition, inspired by Rasmussen’s Skills-Rules-Knowledge (SRK) model [4].
Figure 1: Positioning IRD, modified from [9]
Information-Acquisition
researcher analyst pilot fire-fighter
Max. info. load
SituationSelf-paced-Top-down
Task paced Tight-Bottom-up
Information Rich Design
SkillsRulesKnowledge
16
Proceedings of International Conference on Complexity, Cybernetics, and Informing Science and Engineering
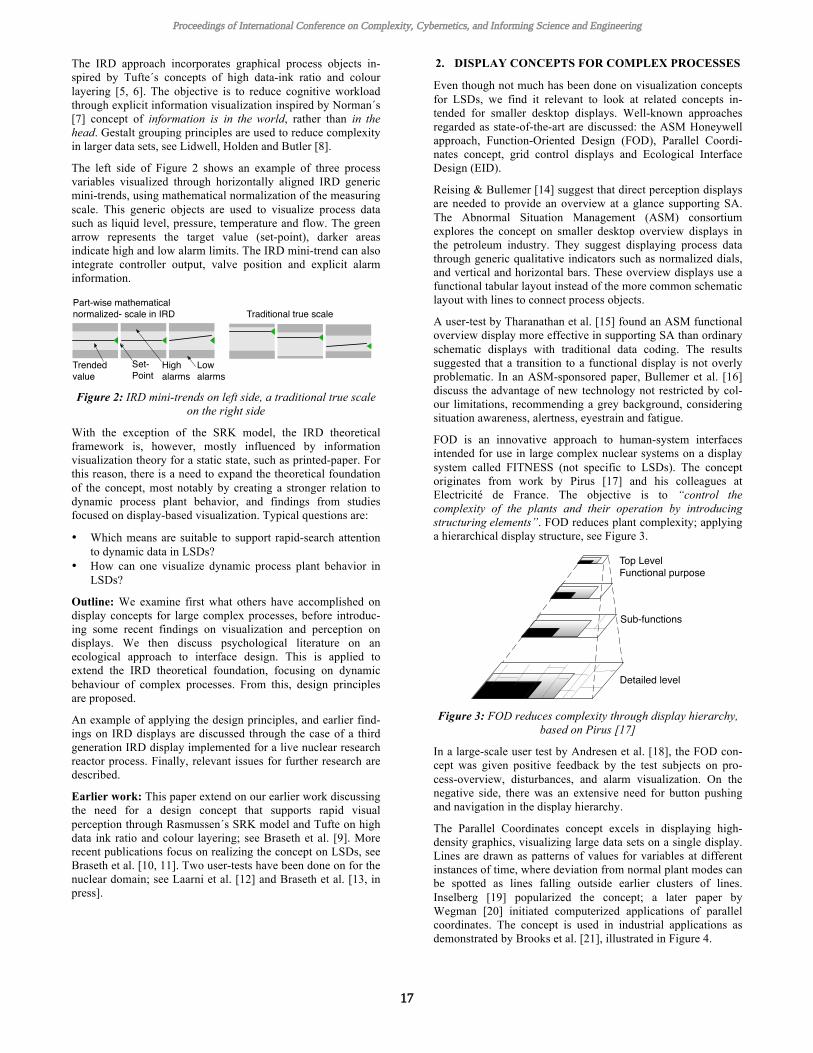
The IRD approach incorporates graphical process objects in-spired by Tufte´s concepts of high data-ink ratio and colour layering [5, 6]. The objective is to reduce cognitive workload through explicit information visualization inspired by Norman´s [7] concept of information is in the world, rather than in the head. Gestalt grouping principles are used to reduce complexity in larger data sets, see Lidwell, Holden and Butler [8].
The left side of Figure 2 shows an example of three process variables visualized through horizontally aligned IRD generic mini-trends, using mathematical normalization of the measuring scale. This generic objects are used to visualize process data such as liquid level, pressure, temperature and flow. The green arrow represents the target value (set-point), darker areas indicate high and low alarm limits. The IRD mini-trend can also integrate controller output, valve position and explicit alarm information.
Figure 2: IRD mini-trends on left side, a traditional true scale
on the right side
With the exception of the SRK model, the IRD theoretical framework is, however, mostly influenced by information visualization theory for a static state, such as printed-paper. For this reason, there is a need to expand the theoretical foundation of the concept, most notably by creating a stronger relation to dynamic process plant behavior, and findings from studies focused on display-based visualization. Typical questions are:
• Which means are suitable to support rapid-search attention to dynamic data in LSDs?
• How can one visualize dynamic process plant behavior in LSDs?
Outline: We examine first what others have accomplished on display concepts for large complex processes, before introduc-ing some recent findings on visualization and perception on displays. We then discuss psychological literature on an ecological approach to interface design. This is applied to extend the IRD theoretical foundation, focusing on dynamic behaviour of complex processes. From this, design principles are proposed.
An example of applying the design principles, and earlier find-ings on IRD displays are discussed through the case of a third generation IRD display implemented for a live nuclear research reactor process. Finally, relevant issues for further research are described.
Earlier work: This paper extend on our earlier work discussing the need for a design concept that supports rapid visual perception through Rasmussen´s SRK model and Tufte on high data ink ratio and colour layering; see Braseth et al. [9]. More recent publications focus on realizing the concept on LSDs, see Braseth et al. [10, 11]. Two user-tests have been done on for the nuclear domain; see Laarni et al. [12] and Braseth et al. [13, in press].
2. DISPLAY CONCEPTS FOR COMPLEX PROCESSES
Even though not much has been done on visualization concepts for LSDs, we find it relevant to look at related concepts in-tended for smaller desktop displays. Well-known approaches regarded as state-of-the-art are discussed: the ASM Honeywell approach, Function-Oriented Design (FOD), Parallel Coordi-nates concept, grid control displays and Ecological Interface Design (EID).
Reising & Bullemer [14] suggest that direct perception displays are needed to provide an overview at a glance supporting SA. The Abnormal Situation Management (ASM) consortium explores the concept on smaller desktop overview displays in the petroleum industry. They suggest displaying process data through generic qualitative indicators such as normalized dials, and vertical and horizontal bars. These overview displays use a functional tabular layout instead of the more common schematic layout with lines to connect process objects.
A user-test by Tharanathan et al. [15] found an ASM functional overview display more effective in supporting SA than ordinary schematic displays with traditional data coding. The results suggested that a transition to a functional display is not overly problematic. In an ASM-sponsored paper, Bullemer et al. [16] discuss the advantage of new technology not restricted by col-our limitations, recommending a grey background, considering situation awareness, alertness, eyestrain and fatigue.
FOD is an innovative approach to human-system interfaces intended for use in large complex nuclear systems on a display system called FITNESS (not specific to LSDs). The concept originates from work by Pirus [17] and his colleagues at Electricité de France. The objective is to “control the complexity of the plants and their operation by introducing structuring elements”. FOD reduces plant complexity; applying a hierarchical display structure, see Figure 3.
Figure 3: FOD reduces complexity through display hierarchy,
based on Pirus [17]
In a large-scale user test by Andresen et al. [18], the FOD con-cept was given positive feedback by the test subjects on pro-cess-overview, disturbances, and alarm visualization. On the negative side, there was an extensive need for button pushing and navigation in the display hierarchy.
The Parallel Coordinates concept excels in displaying high-density graphics, visualizing large data sets on a single display. Lines are drawn as patterns of values for variables at different instances of time, where deviation from normal plant modes can be spotted as lines falling outside earlier clusters of lines. Inselberg [19] popularized the concept; a later paper by Wegman [20] initiated computerized applications of parallel coordinates. The concept is used in industrial applications as demonstrated by Brooks et al. [21], illustrated in Figure 4.
Part-wise mathematical normalized- scale in IRD Traditional true scale
Trendedvalue
Low alarms
Highalarms
Set-Point
Top LevelFunctional purpose
Detailed level
Sub-functions
17
Proceedings of International Conference on Complexity, Cybernetics, and Informing Science and Engineering
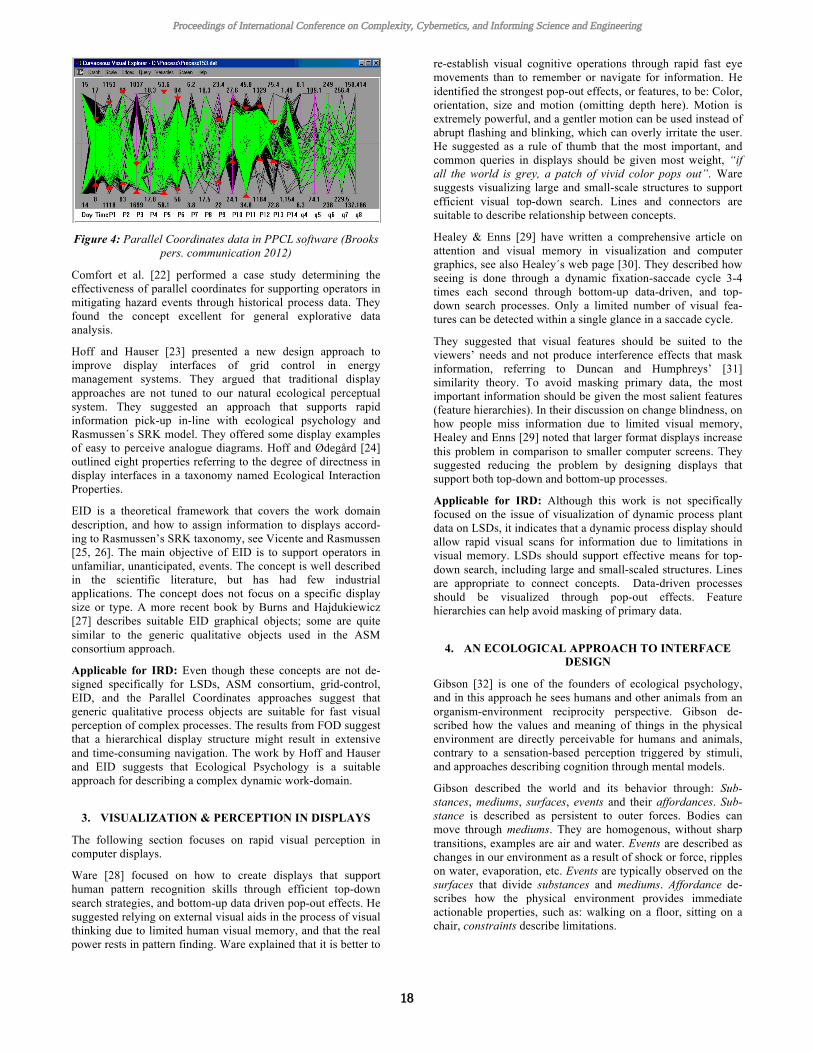
Figure 4: Parallel Coordinates data in PPCL software (Brooks
pers. communication 2012)
Comfort et al. [22] performed a case study determining the effectiveness of parallel coordinates for supporting operators in mitigating hazard events through historical process data. They found the concept excellent for general explorative data analysis.
Hoff and Hauser [23] presented a new design approach to improve display interfaces of grid control in energy management systems. They argued that traditional display approaches are not tuned to our natural ecological perceptual system. They suggested an approach that supports rapid information pick-up in-line with ecological psychology and Rasmussen´s SRK model. They offered some display examples of easy to perceive analogue diagrams. Hoff and Ødegård [24] outlined eight properties referring to the degree of directness in display interfaces in a taxonomy named Ecological Interaction Properties.
EID is a theoretical framework that covers the work domain description, and how to assign information to displays accord-ing to Rasmussen’s SRK taxonomy, see Vicente and Rasmussen [25, 26]. The main objective of EID is to support operators in unfamiliar, unanticipated, events. The concept is well described in the scientific literature, but has had few industrial applications. The concept does not focus on a specific display size or type. A more recent book by Burns and Hajdukiewicz [27] describes suitable EID graphical objects; some are quite similar to the generic qualitative objects used in the ASM consortium approach.
Applicable for IRD: Even though these concepts are not de-signed specifically for LSDs, ASM consortium, grid-control, EID, and the Parallel Coordinates approaches suggest that generic qualitative process objects are suitable for fast visual perception of complex processes. The results from FOD suggest that a hierarchical display structure might result in extensive and time-consuming navigation. The work by Hoff and Hauser and EID suggests that Ecological Psychology is a suitable approach for describing a complex dynamic work-domain.
3. VISUALIZATION & PERCEPTION IN DISPLAYS
The following section focuses on rapid visual perception in computer displays.
Ware [28] focused on how to create displays that support human pattern recognition skills through efficient top-down search strategies, and bottom-up data driven pop-out effects. He suggested relying on external visual aids in the process of visual thinking due to limited human visual memory, and that the real power rests in pattern finding. Ware explained that it is better to
re-establish visual cognitive operations through rapid fast eye movements than to remember or navigate for information. He identified the strongest pop-out effects, or features, to be: Color, orientation, size and motion (omitting depth here). Motion is extremely powerful, and a gentler motion can be used instead of abrupt flashing and blinking, which can overly irritate the user. He suggested as a rule of thumb that the most important, and common queries in displays should be given most weight, “if all the world is grey, a patch of vivid color pops out”. Ware suggests visualizing large and small-scale structures to support efficient visual top-down search. Lines and connectors are suitable to describe relationship between concepts.
Healey & Enns [29] have written a comprehensive article on attention and visual memory in visualization and computer graphics, see also Healey´s web page [30]. They described how seeing is done through a dynamic fixation-saccade cycle 3-4 times each second through bottom-up data-driven, and top-down search processes. Only a limited number of visual fea-tures can be detected within a single glance in a saccade cycle.
They suggested that visual features should be suited to the viewers’ needs and not produce interference effects that mask information, referring to Duncan and Humphreys’ [31] similarity theory. To avoid masking primary data, the most important information should be given the most salient features (feature hierarchies). In their discussion on change blindness, on how people miss information due to limited visual memory, Healey and Enns [29] noted that larger format displays increase this problem in comparison to smaller computer screens. They suggested reducing the problem by designing displays that support both top-down and bottom-up processes.
Applicable for IRD: Although this work is not specifically focused on the issue of visualization of dynamic process plant data on LSDs, it indicates that a dynamic process display should allow rapid visual scans for information due to limitations in visual memory. LSDs should support effective means for top-down search, including large and small-scaled structures. Lines are appropriate to connect concepts. Data-driven processes should be visualized through pop-out effects. Feature hierarchies can help avoid masking of primary data.
4. AN ECOLOGICAL APPROACH TO INTERFACE DESIGN
Gibson [32] is one of the founders of ecological psychology, and in this approach he sees humans and other animals from an organism-environment reciprocity perspective. Gibson de-scribed how the values and meaning of things in the physical environment are directly perceivable for humans and animals, contrary to a sensation-based perception triggered by stimuli, and approaches describing cognition through mental models.
Gibson described the world and its behavior through: Sub-stances, mediums, surfaces, events and their affordances. Sub-stance is described as persistent to outer forces. Bodies can move through mediums. They are homogenous, without sharp transitions, examples are air and water. Events are described as changes in our environment as a result of shock or force, ripples on water, evaporation, etc. Events are typically observed on the surfaces that divide substances and mediums. Affordance de-scribes how the physical environment provides immediate actionable properties, such as: walking on a floor, sitting on a chair, constraints describe limitations.
18
Proceedings of International Conference on Complexity, Cybernetics, and Informing Science and Engineering

Ecological psychology aims in general to address human behav-iour in our complex multisensory, dynamic, physical world, not for abstract displays visualizing process plant´s behaviour. It offers, however, several useful concepts when considering the process control operator as an integral, mutual, part of a complex process plant. Most notably, it enables us to explore direct perception of a complex domain.
Direct perception suggests that information should be presented in a manner appropriate for rapid visual perception, for intuitive pick-up, in-line with: substances, mediums, surfaces, events and affordances.
Figure 5 suggests that only the left vessel visualizes process plant disturbances in a manner directly perceivable through surface movement. The number, bar and dial to the right only afford an immediate description of the actual value and con-straints (measuring-scale bar & dial). The events happen inside a physical structure of unchangeable substance.
Figure 5: Vessels with three variables. Dynamic events directly
perceivable through left side trend-lines, surfaces
The use of affordance in HCI is, however, debated. Norman [33], stated that the concept has taken on a life far beyond its original meaning. He suggested instead perceived affordance when applied to screen-based interfaces. Hartson [34] extended this further for use in context of interaction design and evalua-tion, and proposed: cognitive affordance, physical affordance, sensory affordance, and functional affordance.
Applicable for IRD: We conclude that LSDs should be rich in perceived affordances, providing many clues to the complex process plant, enabling the operator to detect and see the big-picture with enough detail to comprehend the whole situation. Dynamic process disturbances can be described through events, directly perceived through trended surfaces and their constraints. Physical vessels and structures in the process plant can be visualized as substances.
5. DISCUSSION
Due to the large scale and high complexity of LSDs, we find the approach of attempting to address our limited visual memory to be particularly interesting. That work gives us further insights and support on how to support fast top-down search in large displays. It suggests including both large and small-scale struc-tures in a process display, for which we have earlier used the term landmarks. However, we had not previously considered that they should be given different size and shape (typically large vessels) to better support rapid top-down search. This is somewhat contradictory to our intention of creating displays that focus on dynamic information, reducing static clutter. The problem can, however, be minimized through the use of colour layering to avoid masking primary dynamic information.
Furthermore, it is interesting that the use of lines to connect shapes is encouraged. We have in earlier displays been very cautious in the use of lines, only using grey colours for fear of generating unnecessary clutter. This could be a reason why it has proven challenging to make IRD displays easily interpretable. On the whole, this suggests that we need to focus
more on connecting process objects in the display to enhance top-down search.
Early IRD displays were found overly information dense, so in-troducing more space, as open areas, might also be beneficial. More research is needed to determine the right balance for fast top-down search between static large- and small-scale structures, lines and information density.
Attention to dynamic data-driven processes is a challenge in LSDs, and we find the work on pop-out effects to be particularly appropriate to this. In many ways, our earlier work on colour layering supports this, but we have given limited attention to masking issues. This work suggests that we must introduce greater differences in features between information classes in the display than we have done in the past. Users have also complained that IRD displays are too dim, with too little contrast - “everything is grey, nothing stands out”. Ware [28] suggested, however, being cautious of blinking, applying a gentler motion instead. This indicates that the IRD dynamic alarm-spot is an appropriate solution to visualize new, unacknowledged alarms, see Figure 6.
Figure 6: Pop-out effect: incoming unacknowledged alarm
visualized through dynamic alarm-spot on green valve
There seems to be a consensus that qualitative indicators as process objects are suitable for rapid visual perception. In IRD displays, we have used mathematically normalized bar graphs, polar diagrams and mini-trends to make them even easier to perceive also in LSDs. The ecological surfaces and events suggest, however, that the mini-trend is probably best suited to visualize dynamic process plant behaviour.
In summary, we find the theory and approaches described here relevant for the IRD concept, and we propose the following design principles for dynamic process data on LSDs:
• Display graphics should support direct perception of the system situation. One should design dynamic graphics rather than lists and numbers. Data should be rich in perceived affordances, presented as graphics designed to visualize substances, mediums, surfaces, and their constraints.
• The design should include large- and small-scale structuring elements that support top-down visual search. One should layout the system using lines, grouping, and open space.
• Data should be given lower level pop-out effects, to provide cognitive support through rapid eye movements. One should apply graphics orientation, colour, size, and motion and substitute blinking for a gentler animation. A grey back-ground is suitable for pop-out effects.
• Colour layering should be used for a visual hierarchy rather than display hierarchies, avoiding too low contrast.
In our opinion, what separates IRD from smaller desktop oriented concepts is: firstly, a stronger focus on simplification of visual complexity, secondly, its use of animated objects (dynamic alarm-spot), and finally, its focus on visual search in
4,4
New alarm Stable spotlight
AcknowledgedApproximately 2 seconds
19
Proceedings of International Conference on Complexity, Cybernetics, and Informing Science and Engineering
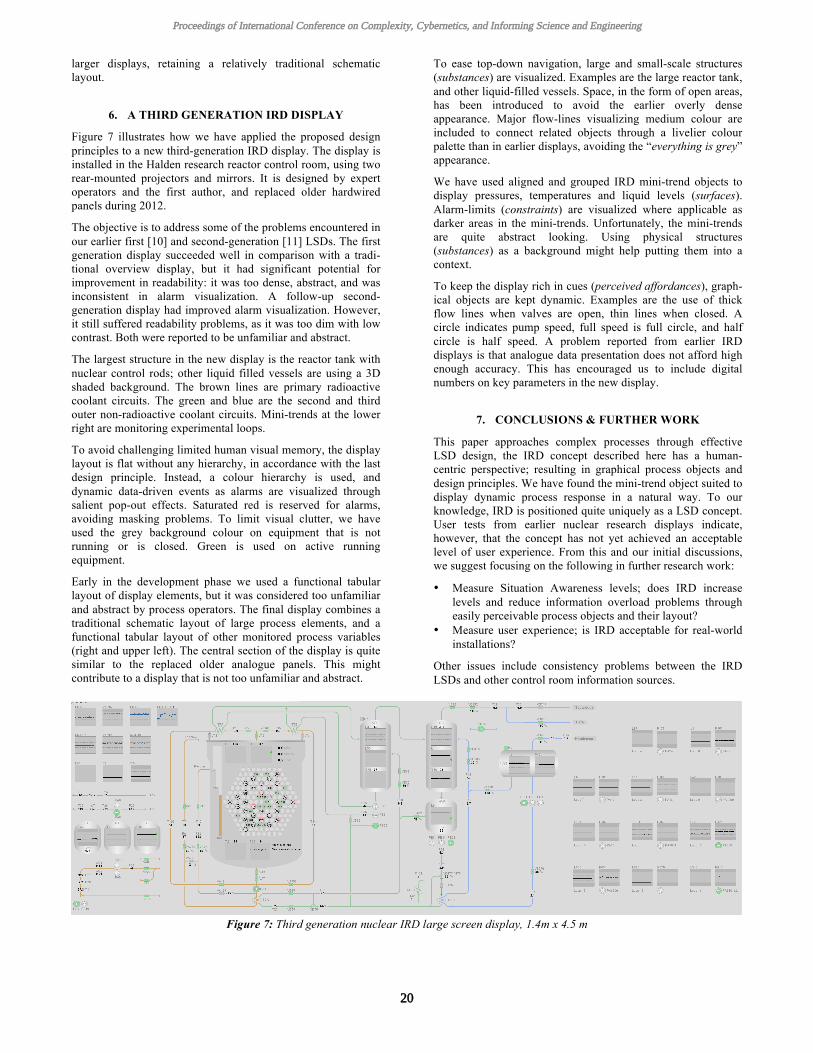
larger displays, retaining a relatively traditional schematic layout.
6. A THIRD GENERATION IRD DISPLAY
Figure 7 illustrates how we have applied the proposed design principles to a new third-generation IRD display. The display is installed in the Halden research reactor control room, using two rear-mounted projectors and mirrors. It is designed by expert operators and the first author, and replaced older hardwired panels during 2012.
The objective is to address some of the problems encountered in our earlier first [10] and second-generation [11] LSDs. The first generation display succeeded well in comparison with a tradi-tional overview display, but it had significant potential for improvement in readability: it was too dense, abstract, and was inconsistent in alarm visualization. A follow-up second-generation display had improved alarm visualization. However, it still suffered readability problems, as it was too dim with low contrast. Both were reported to be unfamiliar and abstract.
The largest structure in the new display is the reactor tank with nuclear control rods; other liquid filled vessels are using a 3D shaded background. The brown lines are primary radioactive coolant circuits. The green and blue are the second and third outer non-radioactive coolant circuits. Mini-trends at the lower right are monitoring experimental loops.
To avoid challenging limited human visual memory, the display layout is flat without any hierarchy, in accordance with the last design principle. Instead, a colour hierarchy is used, and dynamic data-driven events as alarms are visualized through salient pop-out effects. Saturated red is reserved for alarms, avoiding masking problems. To limit visual clutter, we have used the grey background colour on equipment that is not running or is closed. Green is used on active running equipment.
Early in the development phase we used a functional tabular layout of display elements, but it was considered too unfamiliar and abstract by process operators. The final display combines a traditional schematic layout of large process elements, and a functional tabular layout of other monitored process variables (right and upper left). The central section of the display is quite similar to the replaced older analogue panels. This might contribute to a display that is not too unfamiliar and abstract.
To ease top-down navigation, large and small-scale structures (substances) are visualized. Examples are the large reactor tank, and other liquid-filled vessels. Space, in the form of open areas, has been introduced to avoid the earlier overly dense appearance. Major flow-lines visualizing medium colour are included to connect related objects through a livelier colour palette than in earlier displays, avoiding the “everything is grey” appearance.
We have used aligned and grouped IRD mini-trend objects to display pressures, temperatures and liquid levels (surfaces). Alarm-limits (constraints) are visualized where applicable as darker areas in the mini-trends. Unfortunately, the mini-trends are quite abstract looking. Using physical structures (substances) as a background might help putting them into a context.
To keep the display rich in cues (perceived affordances), graph-ical objects are kept dynamic. Examples are the use of thick flow lines when valves are open, thin lines when closed. A circle indicates pump speed, full speed is full circle, and half circle is half speed. A problem reported from earlier IRD displays is that analogue data presentation does not afford high enough accuracy. This has encouraged us to include digital numbers on key parameters in the new display.
7. CONCLUSIONS & FURTHER WORK
This paper approaches complex processes through effective LSD design, the IRD concept described here has a human-centric perspective; resulting in graphical process objects and design principles. We have found the mini-trend object suited to display dynamic process response in a natural way. To our knowledge, IRD is positioned quite uniquely as a LSD concept. User tests from earlier nuclear research displays indicate, however, that the concept has not yet achieved an acceptable level of user experience. From this and our initial discussions, we suggest focusing on the following in further research work:
• Measure Situation Awareness levels; does IRD increase levels and reduce information overload problems through easily perceivable process objects and their layout?
• Measure user experience; is IRD acceptable for real-world installations?
Other issues include consistency problems between the IRD LSDs and other control room information sources.
Figure 7: Third generation nuclear IRD large screen display, 1.4m x 4.5 m
20
Proceedings of International Conference on Complexity, Cybernetics, and Informing Science and Engineering

8. ACKNOWLEDGEMENT
Thanks to M. Gustavsen, M. Louka, S Nilsen, S. Collier and G Skraaning for valuable discussions and comments. We are grateful to J. Laarni and J. Andersson for thoroughly reviewing the paper.
9. REFERENCES
[1] M.R. Endsley, Situation Awareness, In J.D Lee & A. Kirlik (Eds.), The Oxford Handbook of Cognitive Engineering, pp. 89, 99, Oxford University Press, 2013.
[2] C. Andrews, A. Endert, B. Yost, C. North, Information visualization on large, high-resolution displays: Issues, challenges, and opportunities, Information Visualization SAGE, pp. 341-355, 2011.
[3] NUREG-0700 rev. 2, Human-system Interface Design review Guideline. U.S. Nuclear Regulatory Commission Office of Nuclear Regulatory Research, Washington DC, pp. 309-329.
[4] J. Rasmussen, Skills, rules, and Knowledge; signal, signs, and symbols, and other distinctions in human performance models, IEEE Trans. Syst., Man, Cybern. SMC-13, pp. 257-266, 1983.
[5] E. Tufte, The Visual Display of Quantitative Infor-mation. Graphics Press, pp. 123-137, 1983.
[6] E. Tufte, Envisioning Information. Graphics Press, pp. 53-65, 1990.
[7] D.A. Norman, The psychology of everyday things, Basic Books, pp. 52-55, 1988.
[8] W. Lidwell, K. Holden, J. Butler, Universal Principles of Design, Rockport Publishers Inc., pp. 44-45, 116-117, 144-145, 196-197, 2010.
[9] A.O. Braseth, Ø. Veland, R. Welch, Information Rich Display Design, Paper at NPIC & HMIT, Columbus, 2004.
[10] A.O. Braseth, V. Nurmilaukas, J. Laarni, Realizing the Information Rich Design for the Loviisa Nuclear Power Plant, Paper at NPIC & HMIT, Knoxville, 2009.
[11] A.O. Braseth, T. Karlsson, H. Jokstad, Improving alarm visualization and consistency for a BWR large screen dis-play using the Information Rich Concept, paper at NPIC & HMIT, Las Vegas, 2010.
[12] J. Laarni, H. Koskinen, L. Salo, L. Norros, A.O. Braseth, V. Nurmilaukas, Evaluation of the Fortum IRD Pilot, Pa-per at NPIC & HMIT, Knoxville, 2009.
[13] A.O. Braseth, T.A. Øritsland, (in press, 2013), Information Rich Design: A Theoretical Discussion and in-depth User Test of a Nuclear Large Screen Display.
[14] D.V. Reising, P.T. Bullemer, A Direct Perception, Span-of-Control Overview Display to Support a Process Control Operator´s Situation Awareness: A Practice-oriented De-sign Process, Proc. HF 52 meeting, SAGE, 2008.
[15] A. Tharanathan, P. T. Bullemer, J. Laberge, D.V. Reising, R. Mclain, Impact of Functional and Schematic Overview Displays on Console Operator´s Situation Awareness, Journal of Cogn. Eng. And Dec. Making, Vol. 6, no. 2, 2012.
[16] P. Bullemer, D.V. Reising, J. Laberge, Why Gray Back-grounds for DCS Operating Displays? The human Factors Rationale for an ASM Consortium Recommended Prac-
tice, 2011, ASM sponsored paper, accessed http://www.asmconsortium.net/ 29. May 2012.
[17] D. Pirus, Future trends in Computerized Operation. Proc. 2002 IEEE, 7th. Conference on human factors and power plants, Arizona, 2002
[18] G. Andresen, M Friberg, A. Teigen, D. Pirus, Function-Oriented Display System, First Usability Test; HWR-789, OECD Halden Reactor Project, 2005.
[19] Inselberg A., The plane with parallel coordinates, The Visual Computer, Springer-Verlag, pp. 69-91, 1985.
[20] E.J Wegman, Hyperdimensional Data Analysis Using Parallel Coordinates, Journal of the American Statistical Association, Vol. 85, No. 411, pp. 664-675, 1990.
[21] R. Brooks, J. Wilson, R. Thorpe, Geometry Unifies Pro-cess Control, Production and Alarm Management, IEE comp. & Contr. Eng., 2004.
[22] J.R. Comfort, T.R. Warner, E.P. Vargo, E.J. Bass, Parallel Coordinates Plotting as a Method in Process Control Haz-ard Identification, Proc. IEEE Syst. 6 Info. Eng. Design Symposium, USA, 2011.
[23] T. Hoff, A. Hauser, Applying a Cognitive Engineering Approach to Interface Design of Energy Management Sys-tems: PsychNology Journal, Vol. 6, No3, 2008.
[24] T. Hoff, K.I. Øvergård, Explicating the Ecological Interaction Properties. In T. Hoff & C. A. Bjørkli (Eds.), Embodied Minds – Technical Environments, pp. 147-160. Trondheim, Norway: Tapir Academic Press, 2008.
[25] K J. Vicente, Ecological Interface Design: Theoretical foundations, IEEE Trans. On Sys. Man. And Cybern. Vol. 22 No. 4 July/August, 1992.
[26] J. Rasmussen, K.J. Vicente, Coping with human error through system design: Implications for ecological inter-face design, Int. J. Man-Machine Studies, vol. 31, pp. 517-534, 1989.
[27] C.M. Burns, J.R. Hajdukiewicz, Ecological Interface Design, CRC Press, Florida, 2004.
[28] C. Ware, Visual Thinking for Design, Elsevier, Morgan Kaufmann Publishers, pp. 10-17, 29, 36-41, 58-59, 74, 84, 2008.
[29] C.G. Healey, J.T. Enns, Attention and Visual Memory in Visualization and Computer Graphics, IEEE Trans. On Visualization and Comp. Graphics, 2011, accessed June 2012.
[30] C.G. Healey, Perception in Visualization, http://www.csc.ncsu.edu/faculty/healey/PP/
[31] J. Duncan, G.W. Humphreys, Visual search and stimulus similarity, Psychological Review, vol. 96, no. 3, pp. 433-458, 1989.
[32] J.J. Gibson, The Ecological Approach To Visual Perception, Psychology Press, pp. 8, 16-24, 93-96, 127-132, 147-148, 1979.
[33] D.A. Norman, Affordances and Design, www.jnd.org, 2004, accessed Dec. 2012.
[34] R.H. Hartson, Cognitive, physical, sensory, and functional affordances in interaction design, Behaviour & Infor-mation Technology, 22, pp.315-338, 2003.
21
Proceedings of International Conference on Complexity, Cybernetics, and Informing Science and Engineering

Factors Associated with Digital Readiness
in Rural Communities in Israel
Simha DJURAEV
and
Moshe YITZHAKI Department of Information Studies, Bar-Ilan University
Ramat-Gan, Israel 52900
Abstract
In the age of the information and knowledge society, digital readiness has become an important element of economical and social development. The Purpose of the study was to assess the level of "digital readiness" in rural communities in Israel and to find factors associated with it. A closed questionnaire designed to measure six different aspects of digital readiness was filled out by 200 people living in four rural settlements. A digital readiness index was composed of these six measures. Additionally, an open questionnaire was rendered to each governing council representative in these communities. Main findings were: reported rate of domestic internet connection and use (60%) was lower than the national average, probably due to a combination of two factors, known in the literature as deterrents of technological progress, namely, the rural nature of the settlements and their remoteness from the center and the unique religious character of the residents. Demographic features found to be associated to at least three measures of digital readiness were: age group, income, education and level of religion observance. Ultra-orthodox respondents were found at the lowest level of digital readiness, probably due to relatively better adaptation of the modern orthodox sector to the internet, unlike the ultra-orthodox one. Keywords: Digital Readiness; Rural Communities; Israel
Introduction
In the age of the information and knowledge society, digital readiness has become an important element of economical and social development. A country wishing to maintain its competitiveness capacity aspires to elevate the level of its digital readiness nationwide and to reduce digital gaps between different sectors. Assessment of digital readiness in quantitative terms is essential for monitoring and forming an efficient public policy regarding digital gaps. We assumed that obtaining such information about rural communities, a hitherto unaddressed population sector, would contribute to the reduction of existing digital gaps. Additionally, the study might act as an impetus to community development through ICT, promoting both digital readiness and community development goals.
Purpose of the study To assess the level of "digital readiness" in rural communities in Israel. To reveal factors associated with the "digital readiness" level of these rural communities.
Research procedure Definitions
"Digital readiness" was defined as "the extent of ability and willingness to make use of a local site as a tool for personal and community development". Practically, the "digital readiness" of residents of the studied communities was defined as a multi-facet variable composed of the digital readiness of the residents and that of their governing councils.
Population
The population studied included the adult residents of four rural settlements as well as the representatives of their governing councils.
Research Tools and Sample
The research included two parts: A closed questionnaire which was disseminated to 200 randomly chosen residents, forming a representative sample of the entire population living in the four rural settlements chosen as the target population of the study. The questionnaire was designed to measure six different aspects of digital readiness of the residents: (1) domestic computer and internet infrastructure (2) extent of internet use (3) level of internet proficiency (4) perception of internet importance (5) inhibitions to internet use (6) level of interest in community internet. These six aspects comprised the "digital readiness" index. In addition, the following demographic features were examined: residence, sex, age, status, number of family members, religious level, occupation, income, education, disability and ethnic group. The answers were analyzed using SPSS. Additionally, an open questionnaire was issued to each governing council representative in the studied communities, aiming to determine two measures of community digital readiness: activity and infrastructure for community development through the internet as well as their view of the internet as a community development tool. The open questionnaire sought to determine the "digital readiness" of the governing councils, i.e. (1) the extent of current internet activity and infrastructure for community development, and (2) the perception of representatives of the internet as a community development tool. Responses from the open questionnaires were analyzed by qualitative means.
Findings and discussion The main findings were: Internet Ownership and use
22
Proceedings of International Conference on Complexity, Cybernetics, and Informing Science and Engineering

About 56% of the respondents reported having a computer at home and using a domestic internet connection, while 21% had a home computer not connected to the internet and another 23% did not own a computer at all. These numbers were 10-20 percent lower than the then prevailing national average in the Jewish sector. Former studies have indicated that peripheral location and rural character are known inhibitors of technological progress, slowing the pace of internet penetration in such communities, refuting the common assumption that internet use serves to alleviate isolation among geographically remote populations. The lower rates of domestic internet connection and use may also be attributed to the unique religious character of the respondents, 97% of whom defined themselves as religious or ultra-orthodox, unlike the Jewish sector in general, where these sectors comprise only 20 percent. While 40% of respondents reported not using the internet for other than job related purposes, the majority (60%) used it on a daily basis, with the extent ranging from less than one hour (60%) to over 3 hours a day (11%). One-third of the subjects considered the internet important or very important, with the remainder attaching to it slight importance (33%) or none (33%). The vast majority (76%) expressed some interest in developing a community internet, while 24% were indifferent. About half the respondents assessed themselves as lacking internet skills, 37% reported having low skills and only 17% ascribed to themselves medium to high level of internet skills. Interestingly, while the vast majority (82%) reported having no technological block regarding the internet, the religious block, or inhibition, was found much more imminent, reported by 42% of the respondents. Factors associated with "digital readiness"
The demographic features (excluding residence) found to be related to at least three measures of digital readiness were: age group, income, education and level of religiousness.
Gender
Female residents of the four settlements were found to be more interested in establishing and developing a community internet than men.
Age group
Predictably, older age groups (40 and up) utilized the internet less for personal non-work related purposes, felt less technically proficient and attributed lower importance to it, than members of the younger age groups (19-29 and 30-39). This suggests that despite the high prevalence of internet in Israel, a generation gap remains between older and younger age groups in the ability and desire to use the internet. Lower rates of internet use were also found among unemployed people and housewives as opposed to working people and students.
Number of children
Contrary to our hypothesis, digital readiness was found to be associated with family size: households with 2-4 children reported greater internet use than those having 5-6 children. Apparently, child care demands leave less spare time for leisure internet use.
Income
As in previous surveys, income was found to be related to both the extent of internet use and perceived internet importance: respondents with a higher monthly income (above $2200) compared to those earning $2200 or less, were found to have the highest level of digital readiness in the following measures: number of internet uses, perceived importance of the internet and general digital readiness index. These findings reemphasize the long-proven connection between income and education on one hand and digital gaps on the other hand, which still exists in Israel and in most developed countries.
Education level
Similarly, education level was also found to be positively associated with digital readiness. Higher educated (rabbinic or academic) respondents scored higher on the digital readiness index, made more use of the internet and attached greater importance to it than those with only an elementary or high school education. Religiousness level
Unlike previous surveys, our findings do not indicate a consistent reverse relation between one's religiousness level and digital readiness. Respondents who defined themselves as modern-orthodox reported higher internet use, displayed more interest in developing community internet and scored above the average in the digital readiness index, as compared to those who defined themselves as ultra-orthodox or others. Ownership of a personal computer with internet connection was reported by most modern-orthodox (61%), but by only 32% of ultra-orthodox residents. However, respondents defining themselves as ultra-orthodox had the lowest level of digital readiness. This finding can be explained by a religious inhibition to use the internet that was reported by 68% of the ultra-orthodox but only by 37% of the modern-orthodox. Evidently, strict religiousness level apparently creates a certain psychological block against use of the internet and other digital readiness measures. The gap between the above-mentioned Jewish religious groups may result from the relatively better adaptation of the so-called "modern-orthodox" sector to the internet and other advanced forms of IT, unlike the more conservative ultra-orthodox one. No indication was found, however, of a negative connection between religious level and extent of internet use, within each of the religious groups analyzed. Differences between studied communities
The four studied communities were found to significantly differ in demographic features of income and religiousness level. Apparently, the significant differences found between the four communities 23
Proceedings of International Conference on Complexity, Cybernetics, and Informing Science and Engineering

concerning the extent of internet use and digital readiness index measures are related to these two demographic variables.
Community digital readiness
Analyzing the questionnaires filled by the governing council representative in each of the four settlements, significant differences were found in the level of community digital readiness and local use of ICT. However, all four representatives considered the internet an important means for promoting community quality of life. Nevertheless, some of them complained about lack of resources, or a lack of keen interest on the part of their colleagues in the local council or many local residents.
Further study
In light of the findings regarding the connection between religious level and the consequent reluctance to use the internet, a further study within the various religious sectors is recommended, in order to better clarify the connection between those variables. Such research may help to formulate a policy aimed at reducing the digital gap among certain religious groups. Regarding the practical aspects of community digital development, the settlement best suited to establish a community internet project was obviously that whose residents and governing council had the highest digital readiness measures and maintained a community site.
24
Proceedings of International Conference on Complexity, Cybernetics, and Informing Science and Engineering

Information and adaptation in a public service sector:
The example of the Dutch Public housing sector
Hendrik M. Koolma
Faculty of Social Sciences, VU University Amsterdam, 1081 HV The Netherlands
ABSTRACT
A public service sector can be conceived as a multi agent system subordinated to a principal, mostly a department of a national government. The agents are relative autonomous and have decisional discretion, as long as they respect the boundaries setup by law and legislation. The hierarchy is less compulsory than in a command-and-control structure. Central control opponents presume more adaptational capacities of semi-autonomous organizations. The line of thinking is that the
distributed intelligence structures can cope better with variance in circumstances. Such a multi agent system would be more suitable to handle environmental complexity. The paper gives insight into the way such a particular kind of multi agent system makes decision on issues of adaptation. Empirical evidence from the case of the Dutch housing sector shows that the expectations of scientist and policy makers are exaggerated. The agents use strategies which reduces decisional complexity,
whereby the adaptation to environmental circumstances is low and arbitrary and rationality of the adaptation is limited by self-reference and overconfidence. This observation provides new thoughts to the ongoing rationality debate. Keywords: adaptation, MAS, portfolio management, nonprofit, KDD, overconfidence, self-reference, rationality
1. INTRODUCTION
The case in this paper, the Dutch public housing sector, is an example of private nonprofit organizations which are the executioners of public tasks. The number of organizations is decreasing from 552 ultimo 2002 to 400 ultimo in 2010. The organizations are foundations or associations. Their private status provides them the protection of property rights, while the public law gives them certain privileges in comparison to for profit housing organizations [1]. Law and legislation prescribe the objectives, although ambiguously regarding the vagueness
of the multiple goals. One goal is to be read in the text of the core regulation: housing corporations are supposed to deal with differing local circumstances, tracking and serving the target groups in their working area, and taking into account the market situation. This expectation is neither operationalized nor instrumentalized, so the text is no more than an intentional instruction given by the public legislator to the private agents. The implementation is left to the own responsibility and
discretion of the local agents.
2. MAIN QUESTIONS
The theoretical question is how multi agents systems involve information in decisions on adaptation to the environment. Empirically the question is elaborated: Which kind of information correlates to the decisions made? Which information processing strategies reflect the observations from the case to the Dutch public housing sector?
The two questions need conceptual elaboration. All kinds of
information could be discerned, depending on the chosen point of view. For this purpose the following two taxonomies are crossed (see figure 1). Firstly, the decision process is divided in blocks, each containing types of information:
• Static information, like retrospective statistics on processes
and facts in the environment, and statutory objectives.
• Dynamic information, reflecting the working processes in
action.
• Conditions for decision making.
• Forecasts of action programs and expected effects of these
programs. This conception is an example of the construction of the ontology [2] of decision-making by housing corporations and owners of real estate portfolios in general. The second taxonomy concerns the level of information, considering the sector to be an open, social and anthropogenic
system [3]:
• Environment of the organization.
• Organizational level.
• The level of the decision maker.
Because of the aggregation level of the data set, the level of separate decisions is not available. The level of the decision makers requires some explanation.
Although organizations ought to be considered as impersonal system of human effort, the function of the chief executive has personal aspects according to Barnard [4]. The chief executive has influence on which information is admitted to the decision making, clearly illustrated in situations of groupthink [5]. Assuming this, the CEO has a determining role in the complexity of the decision making. Also the CEO is a major ‘node’ in the linkage between organization and sector networks,
bringing in ideas for innovation and so on. The two taxonomies are crossed in next figure, and filled with information items which are possibly relevant to a service delivering organization. Figure 1 Conceptual model
Static
information
Process
information Conditions Forecasts
Environment
Organization
Decision makers
Decision on
Adaptation Not all cells of the table are filled, due to limitations of the data set. Transactions in the working area could comprise relevant information. Most missing cells are on the decision maker’s level. Items like education, tenure, incentive compensation contracts, reputation, personal values, heuristics, beliefs, scores
25
Proceedings of International Conference on Complexity, Cybernetics, and Informing Science and Engineering
on overconfidence scales, etcetera would be interesting and should get attention in further research. Yet, we make do with
what we have at this moment.
Information strategies The second question is what information strategies can be observed. Simon [6] coined the concept of bounded rationality. March [7] applies this concept to organizational decision making. Bounded rationality implies that decision makers cannot process all incoming and available information. They
have the intention to be rational but they are as humans restricted by computational limitations. However, limited use of information can also be attributed to an adverse choice of heuristics [8], for instance when they rely on intuition in issues which were better handled with cold headed arithmetic. Barnard [9] addresses this phenomenon in an essay in which he introduces a useful taxonomy of types of information:
• Precise information, like business registers.
• Hybrid information, neither complete nor unambiguous,
but probably most relevant to the problem issue of the decision maker.
• Speculative kind of information.
Regarding the subject of rationality Luhmann [10] provides a differentiation. Rationality is usually conceived as guided by objectives. In his opinion however, three kinds of rationality
have to be considered:
• Guided by objectives and rules.
• Attracted by perceptions of chance.
• Assignment to a problem solving approach.
Luhmann reveals strategies of complexity reduction. Firstly, if the relations between situation, objectives, actions, and effects are undetermined, inner complexity of the system will be low.
In other words, the degree to which collected information, outspoken objectives and decisions are related, is varying. Secondly, the connection of social systems to their environment is indirect and interfered by self-reference [11]. The implication of this theory is that references that the necessity and the success of adjustments to the environment will be proved by prepossessed beliefs and opinions inside the organizations.
If success of action is believed to be predetermined, we encounter the phenomenon of overconfidence. In this paper overconfidence is put in an informational frame. In spite of uncertainty and risks not all available and relevant information is used for the decision making, relying on a delusion of success [12]. Charness and Gneezy [13] show that when complexity reducing techniques like portfolio analysis are applied to highly complex problems, the perception of risks will decrease
substantially. Presumably, information regarding the risks will be rather avoided than digested.
3. DESIGN AND OPERATIONALIZATION
The research is an example of knowledge discovery in databases (KDD) [14] applied to an open multi-agent system of public housing providers.
Adaptation Adaptation is conceived as a deliberate adjustment of the
housing portfolios to norms, demands, and market forecasts. Portfolio analysis implies separate decisions investments and divestments [15]. However, project decisions are aggregated in
the data set to the level of the organizations and report years. Portfolio adjustments are realized by means of:
• Acquisition of houses from other owners and landlords.
• Building of rental houses.
• Building of houses for sale.
• Sale of existing rental houses.
• Demolition and joining small houses to a smaller number
of large houses. The last two bullets represent divestments. The last item is a combination of two measures due to an aggregation in the provided original data set.
Operationalization of the input variables A selection is made of variables in the data set to cover the scheme of potentially relevant information items.
Figure 2 Scheme with input items
static
information
proces
information conditions forecasts
regulatory
objectives
local
arrangements
long-term
market
local stock
composition
local field
position
demographics
statutory
objectives actual supply
size
own stock
composition
actual
demand assets future assets
fit demand
supply hidden assets
decision makers prominence in
fields
environment
organization
Some remarks on the variables. The regulatory objectives on the environmental level are equal to all organizations, for which reason they are not selected as variable. Housing corporations
have to comply to these objectives in order to be admitted, so there is neither differentiation in the statutory objectives. Analysis of 144 of the 522 annual reports does not show differences between by state prescribed objectives on the one hand and the expressed operational objectives on the other hand. This smaller sample includes also the variable local arrangements on objectives and agreed performance. The items are elaborated into 26 variables. Some remarks can be made. One of the variables is the size of
the organizations, because of regulatory practices expressed in the number of rental houses and other objects in exploitation. The point of view determines whether size of an organization is a (human) resource or an attribute for the position in the local field. Study of motivation to mergers in the annual reports shows both points of view. In this paper organizational size is conceived as an attribute of resources. The organization field position is measured as ‘prominence’ by a combination of two
variables, one measuring the activity of the chief officers as speaker on national symposia and the other measuring the participation of chief officers in committees of the national sector organization. The first variable is weighted twice.
Hypotheses Each independent variable has an implicit hypothesis. Assumed is that all variable are correlated to adaptation decisions. If not,
the null hypotheses cannot be rejected. For the sake of reader’s digest, the paper leaves the null hypotheses unmentioned, and only presents values if a variable has a significant correlation.
26
Proceedings of International Conference on Complexity, Cybernetics, and Informing Science and Engineering

Hypotheses on informational strategies The question on the informational strategies is elaborated in sub
questions. In the paper the question on informational strategies is elaborated in sub questions: 1. Do organizations use all available information (full use)?
Full use is measured true if all cells are covered by significant variables. This hypothesis is tested for each dependant variable and for the aggregate.
2. Or, are they limited by computational limitations (bounded
rationality)? Bounded rationality is found if only one or two cells are covered by significant values, assuming that information is restricted to simple one-to-one or two-to-one causations.
3. Which of the three kinds of rationality is reflected by the
patterns of information selection: a) guidance by
objectives, b) chance orientation, or c) problem solving
approach? Problem solving rationality is ascertained if one of three
variables (fit between supply and demand, vacancy, satisfying low income households’ demand) has the highest partial correlation value in the estimation models. In those cases is assumed that adaptation is a reaction on direct observable disturbances in the public service delivery. Chance orientation is difficult to measure. In the data the variable for hidden assets is used as indicator for an
orientation to chances. Guidance by objectives is not operationalized, but the disassociation between objectives and action (see 8.)
4. Which type of information is preferred: a) precise, b)
hybrid, or c) speculative?
From the information type taxonomy only the precise information is selected. Precise information is determining adaptation if only static information items have significant
correlation values. 5. Can self-reference be ascertained in the balance between
information inside and outside the organizations? Self-reference is tested by measuring the correlation values on the row of the organization in comparison to the values on the level of the environment. If in the row of the organization two cells contain the highest correlation scores, self-reference is ascertained.
6. Are information-reducing scopes like self-reference and
closure attributes of the process or of the position of the
organization? Self-reference on the action is the case if the level of precedent investment activity determines the decision on future adaptation. This is called inertia, and is proven if the investment level in the preceding years has the highest t-value in the estimation model. Process closure is ascertained if only the organization row contains
significant correlation values. Position closure is the case if only the condition column holds significant values.
7. Do the observations show signs of overconfidence? Overconfidence is not tested by a hypothesis but deduced by argumentation. Indicators are low use of presumably relevant information items in relation to the decision.
8. Are there indications of disassociation between objectives
and actions?
This question is also answered by argumentation.
Methods Empirical evidence comes from a data set (2002) provided by Dutch regulatory agency and supplemented with demographic
and market information. On most items the data set covers the whole population of agents (N = 552).
Testing is made by multiple regression according to the Tobit method. This method is of use for data set where the dependant variable has restrictions. The restriction in this inquiry is that there are both zero values, and a descending range of values approximating zero. The sets of independent variables are controlled for collinearity by a series of Pearson bi-variate regressions. Variables with a significant correlation to the dependant variable are selected and
used as input for the Tobit regression analysis. The measured t-values are presented in the result schema as far as the selected variables correlates significantly. Thresholds for significance are in descending order 1%, 5%, and 10%.
4. ANALYSES
The use of information is described by means of filled version of the input scheme. Subsequently the hypotheses on information strategies are tested. The procedure is done for each of the five items of portfolio adaption.
Acquisition The first dependant variable concerns the acquisition of houses from other owners and other landlords. Figure 3 Scheme with results on acquisition Tobit regression
Acquisition n=521
static
information
process information conditions forecasts
environment
organization Supply to low-
incomes households
(1.9901**)
Size (1.9309*)
decision makers Prominence
(1.8489*) 1. Full use of information not the case.
2. Bounded rationality is tested false because of the measurement of 3 significants.
3. Problem solving rationality is ascertained, because the supply presents the highest t-value. The variable for hidden assets has not a significant score, so chance orientation is not found.
4. Static information items do not show significant correlations. Therefore there is not a preference to precise information.
5. The self-reference on the organizational level requires two highest scores in the row. This is the case, so the hypothesis is accepted.
6. Inertia is not found, because the investment level in preceding years has not a significant score. Process closure is not observed, because of significants in other rows than the one of organization. Process closure is tested false, because of significants outside the conditions column.
7. As acquisition is a market depending operation, the absence of correlations to market forecast variables indicates overconfidence.
8. Actual performance in the supply to low-income households is related to the level of acquisitions. The reason for this observation is not clear. There is no clear argument to state a dissociation between objectives and action, so the hypothesis is rejected.
27
Proceedings of International Conference on Complexity, Cybernetics, and Informing Science and Engineering

Building new rental housing Building of rental houses is a core business of housing
corporations, because it achieve a renewal of their stock. The following significant correlations are found. Figure 4 Scheme with results on building rental houses Tobit regression
building rental housing
n=447
static information process information conditions forecasts
environment
organization
Share low quality
houses (1.6965*)
Investments
preceding years
(3.8194***)
∆ Solvability
(-6.4146***)
decision makers 1. The full information hypothesis is easily rejected. 2. Bounded rationality is tested false. 3. Problem solving rationality is not ascertained, because of
the fact that low quality is not chosen as indicator of a problem solving approach. The variable for hidden assets has not a significant score, so chance orientation cannot be stated.
4. One static information item has a significant correlation,
but there are other kind of information items. 5. The self-reference on the organizational level requires two
highest scores in the row, so the hypothesis is accepted. 6. Inertia is found, because the investment level in preceding
years has a significant score. Process closure occurs when significant information is only found in the organization row. This is the case. There are no significant scores in the condition column, so position closure is not ascertained.
7. Although low information dependency is observed, there are at first glance no arguments for stating overconfidence. However, taken into account the negative correlation to the solvability trend, building of new rental houses should give financial concerns. However, the decisions are indifferent to the actual financial state, although the financial impact of the decision is remarkably negative. So, it is allowed to indicate overconfidence. Also the indifference to market
forecasts supports the claim of overconfidence. 8. The results suggest that another objective plays a role,
namely a concern on technical quality. The regulation comprises a quality objective, namely the maintenance of the level of quality. Therefore there is no ground for the statement of objective disassociation.
Building houses for sale
Building houses for sale is not a traditional activity to housing corporations. However shortage of affordable owner-occupied houses could bring housing corporations to invest in such houses. The next figure shows on which items the choice between activity and no activity depends. Figure 5 Scheme with results on building of houses for sale Tobit regression
building houses for
sale n=429
static information process information conditions forecasts
environment Share owner-occupied
houses (-2.1967**)
organization Investments preceding
years (7.7763***)
Size (6.9819***)
decision makers
1. The full information hypothesis is rejected. 2. Bounded rationality is tested false, because of the
observation that more than two cells are covered. 3. Problem solving rationality is not ascertained. The variable
for hidden assets does not have a significant score, so the hypothesis on chance orientation is rejected.
4. One static information item shows a significant correlation. However the correlation is not exclusive, so the preference to precise information is not proven.
5. The self-reference on the organizational level requires two
highest scores in the row. This requirement is met. 6. Inertia effect is found, because the investment level in
preceding years has the highest t-value. Process closure occurs when significant correlations are only found in the organization row. This is not the case. The significant correlation scores are not restricted to the condition column, so position closure is absent.
7. Considering that building of houses is not a core business and housing corporations have to operate in a demanders’
market, it is astonishing to observe indifference to market forecasts. Therefore overconfidence can attributed to the decision to develop houses for sale. The inertia observation enhances the risk of building for periods without demand.
8. There is no correlation to forecasted demand from buyers of low-priced houses. The correlation to the share of owner-occupied housing stock in the municipalities could reflect considerations with the local housing policy.
However, the type of housing is private and the potential demand of low-income has no influence, so a disassociation between objectives and action is stated.
Divestment by sale of existing rental houses Sale of existing rental houses can serve certain objectives. Common practice is that investment in new rental houses is combined with sale of existing houses. The analyses provide the
following results. Figure 6 Scheme with results on sale of existing rental houses Tobit regression
sale rental houses
n=475
static information process information conditions forecasts
environment Low-income
households
(-2.0787**)
organization Vacancy rental
houses (3.6062***)
Size (4,1785***)
Solvability (-1,8133**)
decision makers 1. The full information hypothesis is rejected. 2. Bounded rationality is tested false too. 3. Problem solving rationality is ascertained because of the
significant correlation of vacancy to the sales. However the t-value of Size is higher, therefore the problem orientation is not leading. The variable for hidden assets has no significant score, so chance orientation is absent.
4. One static information item shows a significant correlation.
However the correlation is not exclusive, so the preference to precise information is not proven.
5. The self-reference on the organizational level requires two highest scores in the row. This requirement is met, so the decision is characterized by organizational self-reference
6. Inertia effects are absence, because the investment level in preceding years has no significant score. Process closure occurs when significant information is only found in the
organization row. This is not the case. The significant
28
Proceedings of International Conference on Complexity, Cybernetics, and Informing Science and Engineering

correlation scores are not restricted to the condition column, so position closure is absent.
7. Decisions on sale of rental houses are made without sensitivity for market forecasts. Consequently, the profits of a sale program might be overestimated, so also on this decision overconfidence is observed.
8. The decision to sell houses has a negative correlation to the share of low-income households in the local situation. This indicates a reverse response. However the regulation mentions also the aspect of livability, an objective that in
state documents is associated which a policy against geographical concentration of low income groups. Ambiguity of regulatory objectives is a reason to reject the hypothesis of disassociation between objectives and actions.
Divestments by means of demolition and joining of houses The number of houses in stock decreases by demolition and the practice of joining small houses to larger ones. Analyses of the
decision on these divestments have the following results: Figure 7 Scheme with demolition and joining of houses Tobit regression
divestments n=521
static information process
information
conditions forecasts
environment Share owner-
occupied houses
(-1.6930*)
organization Share appartments
(-2.0613**)
Vacancy rental
houses
(3,1094***)
Size (5,7346***)
Hidden assets
(-1.9598*)
decision makers 1. Here, the full information hypothesis is also rejected. 2. Bounded rationality is tested false, because more than two
cells are covered. 3. Problem solving rationality could be ascertained, when not
the t-value of Size would be higher. The variable for hidden assets does have a significant score, so chance orientation is found. The negative value implies that corporations with hidden assets are more reluctant to demolish or join their houses.
4. Two static information item show significant correlations.
However the correlations are not exclusive, so the preference to precise information is not proven.
5. The self-reference on the organizational level requires two highest scores in the row. This requirement is met, so the decision is characterized by organizational self-reference.
6. Inertia effect is absent, because the investment level in preceding year does not have a significant score. Process closure occurs when significant information is only found
in the organization row. This is not the case. The significant correlation scores are not restricted to the condition column, so position closure is absent.
7. There are no arguments to state overconfidence. 8. The divestment decisions are depending on characteristics
of the housing stock. As mentioned before, quality aspects are connected to a second statutory objective. So, there is no ground for stating a disassociation between objectives and action.
Results summarized The paper has to deal with two questions: firstly which information is related to organizations’ adaptation, and secondly, which information strategies can explain the observed
sensitivity to information items. The answer on the first question is presented in the next table.
Figure 8 Information items correlated to portfolio decisions Aggregation of
portfolio
adjustments
static information process
information
conditions forecasts
environment Demographics Local field position Long-term market
•
Local stock
••
organization Own stock Vacancy Size ∆ Solvability
• ●● ●●●- ●
Quality Actual supply Assets
- ●●• ••
decision makers prominence
-
significane to 1% ●
significane to 5% •
significane to 10% - The used items are spread over the scheme. The implicit hypothesis was that the selected information items would be relevant to the decision making. Market forecasts do not make
difference to portfolio decisions. Local field position is irrelevant. Remarkably, size is the most prominent variable. It has more influence on adaptation than public housing issues. It could be that more human resources are available. It might be a matter of position as well: bigger corporation have presumably more power to impose portfolio adjustment upon actors in their environment. Several hypotheses are postulated regarding to the information
strategies, based on rationality types and heuristics. In the following table the summarized result of the analyses is given. Figure 9 Results on testing information stategies
Aggregate
investment investment sale of divestments
acquisition rental for sale rental stock (demolition) Total
Full use False
Bounded False
Problem oriented True 1 True 4 False
Chance orientation True True 1 True 4 False
Preference precise False
Selfrefence org. level True True True True True True
Inertia True 1 True 4 False
Closure process True 1 True 4 False
Closure position False
Overconfidence True True True True 4 True 1 False
Task avoidance True True 2 True 3 False
ActionsHypotheses test results
All five analyses are negative on the full use of information items. The hypothesis of bounded rationality is also rejected. The hypothesis of problem solving rationality is both rejected and accepted. Items indicating problem orientation are found,
however they have lower t-values than other items. The hypothesis of chance oriented rationality is found at acquisition and divestment decisions. At the building and sales decisions the chance orientation is absent. The hypothesis of a preference to precise information is rejected overall. The hypothesis on organizational self-reference is accepted in all five issue of portfolio adjustment, bearing for a large part on
the influence of Size in the regression analyses. The inertia hypothesis is only confirmed in the decision to build houses for sale. This is an intriguing result for a commercial activity in a competing market. For that reason the observation is related to overconfidence. Insight observations of the organizations demonstrate that housing corporations set up departments for commercial real estate development. Probably
29
Proceedings of International Conference on Complexity, Cybernetics, and Informing Science and Engineering

production becomes a goal in itself as soon as such departments are in operation.
Informational closure of processes is only observed in the decision of building new rental houses. A probable explanation is that it is a self-inducing routine of housing corporations. Informational closure related to position is overall rejected. The overconfidence hypothesis is not tested straightforwardly, but by argumentation. On four portfolio issues argumentation indicates overconfidence, so overconfidence is a rather present attribute of portfolio decisions by housing corporations.
Disassociation between regulatory objectives and actions is indicated by argumentation on two issues. The confirmation concerns building of houses for sale and the sale of existing rental houses. A tentative explanation for this observation is that these commercial activities trigger goal displacement.
5. CONCLUSION AND DISCUSSION
The paper has to deal with two questions: firstly which information correlates to organizational adaptation, and secondly, which information strategies can explain to the
observed sensitivity to the information items. Adaptation is operationalized as portfolio adjustments by Dutch housing corporations. Empirical evidence is based on a data set of annual report information (2002), supplemented with demographic statistics and market forecasts. Answering the first question, it is remarkable that Size of the organization dominates the portfolio decisions. Also notable is the insignificance of market forecasts and financial concerns.
Self-reference and overconfidence appears to be the most significant information strategies of housing corporations. The operationalization of 3 strategies, namely full use, bounded-rationality and preference of precise information might be reconsidered for future research. The research has been designed to provide insight in the relation
between information and adaptation in a public service sector. Starting point was the expectation of policy makers that a privatized multi agent system would have more capacity to deal with local differences. The paper is not set up to prove or to reject the expectation of Dutch policy makers, however it gives a lot of second thoughts. Do the results converge of diverge with other inquiries into the
Dutch housing sector? De Kam [16] concludes that building of houses for sale has a weak correlation to market circumstances, and a strong relation to internal attributes of the organizations. Nieboer [17] indicates on basis of interior observations in case studies, that although general portfolio policy comprises market information and demand of target groups, actual investment decisions are decoupled from this policy. The research design has obviously blank spots, so more and
other information on the environmental and personal level could shed new light on the relation between information and adaptation. A data set which allows longitudinal research would be welcome. More comprehensive information could provide higher correlation values of multiple regression models, although the scores presented are not uncommon for research into social systems and institutionalized environments.
At the end one question remains: can the results of the paper be generalized to other sectors. The Dutch housing corporations are an example of nonprofit organization. Nonprofit
organizations have other drives than the profit maximand, even if they expand to commercial activities. So a generalization to
other nonprofit sectors might be considered, especially if their public task comprises investments and divestments. Although a transfer of results to profit sectors is not recommendable, application of the research design to these sectors would be a challenge. Can we find the homo economicus, or do we find organizations which apply complexity reducing strategies when they have to decide on adaptation?
6. REFERENCES
[1] European Commission, State aid No E 2/2005 and N
642/2009 - The Netherlands Existing an special project aid to housing corporations, Bruxelles: Commission Européenne, 2009.
[2] B.F. Fomin & T.L. Kachanova, Physics of Open Systems: Generation of System Knowledge, 2012 http:www.iiis.org/CDs2012/CD2012I<C/IMCIC_2012/PapersPdf/ZA477TJ.pdf
[3] Idem
[4] C. I. Barnard, The Functions of the Executive,. Cambridge, MA: Harvard University Press, 1938, p. 216.
[5] G.R. Whyte, “Recasting Janis' groupthink model - The key role of collective efficacy in decision fiascos”,
Organizational Behavior and Human Decision Processes, Vol. 54, pp. 185 - 209.
[6] H.A. Simon, Models of man - social and rational. New York: John Wiley & Sons, 1957, p. 198.
[7] J.G. March, “Understand How Decisions Happen in Organizations”, J.G March, The Pursuit of
Organizational Intelligence, Malden MA: Blackwell Publishers, 2000, p. 16.
[8] K.E. Stanovich & R.F. West, “Individual Differences in Reasoning - Implications for the Rationality Debate?” Behavioral and Brain Sciences Vol. 23, No. 5, 2000, pp. 645-665.
[9] C.I. Barnard, “Mind in Everyday Affairs”, C. I. Barnard, The Functions of the Executive, Cambridge MA: Harvard University Press, 1936, p.309.
[10] N. Luhmann, Zweckbegriff und Systemrationalität -
über die Funktion von Zwecken in sozialen Systemen, Tübbingen: J. C. B. Mohr, 1968, p. 179.
[11] N. Luhmann, Social Systems, Stanford CA: Stanford University Press, 1995; D.D. Reneman, Self-Reference
and Policy Success - An exploration into the role of self-
referential conduct of organizations in the effectiveness of policies, Amsterdam: VU University of Amsterdam Press, 1998.
[12] D. Lovallo & D. Kahneman, “Delusions of Success: How Optimism Undermines Excutives’ Decisions”, Harvard
Bussiness Review, July, 2003, product 4279 [13] G. Charness & U. Gneezy, Portfolio Choice and Risk
Attitudes - An experiment (working paper), Santa
Barbara CA: University of California. 2003 [14] E.E. Vityaev & B.Y. Kovalerchuk, “Relational
methodology for data mining and knowledge discovery”, Intelligent Data Analysis, Vol. 12, 2008, pp. 189-210.
[15] Markowitz, H. M., Portfolio selection - Efficient
diversification of investments, New York: Wiley, 1959. [16] G. de Kam. Bouwgrond voor de Volkshuisvesting.
Almere: Nestas Communicatie, 2012, p 164.
[17] Nieboer, N. E. (2009). Het lange koord tussen portefeuillebeleid en investeringen van woningcorporaties. Amsterdam: IOS Press, p. 241
30
Proceedings of International Conference on Complexity, Cybernetics, and Informing Science and Engineering

The usage of ISOTYPE Charts in Business Intelligence Reports - The Impact of Otto Neurath Work in Visualizing the Results of Information Systems
Queries
André S. Monat Post Doctorate Researcher - sponsored by CNPq-Brazil Scholarship
Marcel Befort Dipl. Des.
Program of Industrial Design in the field of design theory for methodology, planning and strategy
Wuppertal University, North Rhine-Westphalia, Germany
ABSTRACT Business Intelligence (BI) systems are designed to provide managers with a user-friendly way to build and analyze reports. Nowadays, BI systems make available a large range of graphics tools for displaying such reports. Nevertheless, these systems disregard so far the immense potential of using ISOTYPE approach for graphic display of statistics. ISOTYPE was created by the Austrian social scientist Otto Neurath (1882-1945). It is the acronym for International System of TYpographic Picture Education. ISOTYPE aims to create a system for communicating the analysis of social and management data for a broad audience that includes the laymen and the experts. The reason for not using ISOTYPE in BI systems may rely on the difficult to build algorithms that realize what Neurath described as the transformation phase of working over collected data. In this phase, data must be grouped in a proper way that facilitates further display and understanding about what we can conclude out of the data. In this article, we propose that BI systems could include ISOTYPE based tools for visualization. In order to illustrate our ideas we built a BI system that displays statistics on charts built according to ISOTYPE approach.
1. INTRODUCTION
Business Intelligence (BI) systems are designed to provide managers with a user-friendly way to build and analyze reports. These reports are usually meant to facilitate the management and decision taking in enterprises where a huge amount of data is generated and must be somehow analyzed. Business Intelligence systems are normally built in a multi-dimensional approach where the business enterprise is analyzed according to dimensions. As illustration, typical dimensions are date, product, enterprise branch, client and sales among others. A pivotal factor for making a successful BI system is to use a graphic system that display BI reports in an interactive and easy to understand way. Furthermore, BI reports must conduct the user to what is most interesting about the data being reported. The user must have his or her attention captured to what is special, different or exceptional about the data being portrayed. Nowadays, BI systems make available a large range of graphics
tools for displaying reports. This includes the well-known graphics tools available in spreadsheets systems and also more sophisticated business-oriented tools provided by the processing language project conducted by MIT media lab [3]. Nevertheless, BI systems so far disregard the immense potential of using ISOTYPE approach for graphic display of statistics. ISOTYPE is a graphical language created by the Austrian social scientist Otto Neurath (1882-1945). It is the acronym for International System of TYpographic Picture Education. ISOTYPE aims to create a system for communicating the analysis of social and management data for a broad audience that includes the laymen and the experts on the specific field being studied. Otto Neurath´s ideas were first applied in an exhibition held in Vienna (and later printed as an atlas) of social data in 1930 called Gesellschaft und Wirtschaft, or Society and Economics in English [1]. Later, all these ideas were applied in several others contexts [8]. Despite the huge acceptance of Neurath´s work, information systems tend not to list ISOTYPE based tools among those they make available. The reason for this attitude may rely on the difficult to build algorithms that realize what Neurath described as the transformation phase of working over collected data. In this phase, data must be grouped in a proper way that facilitates further display and understanding about what we can conclude out of the data. In this article, we propose that BI systems could include ISOTYPE based tools for visualization. We suggest the usage of ISOTYPE especially in BI systems that attend the broad public. The BI system must use a graphic framework built according to ISOTYPE principles and display the quantities and statistics over it. The numerical values may vary according to the parameters submitted to the BI system, but the graphics will always exhibit the values according to Neurath’s ideas. In order to illustrate these concepts we built a BI system that displays information about the usage of the Rio de Janeiro underground transport system. This system example is supposed to be available for the general public in underground stations or on the Internet.
2. THE ISOTYPE SYSTEM
31
Proceedings of International Conference on Complexity, Cybernetics, and Informing Science and Engineering
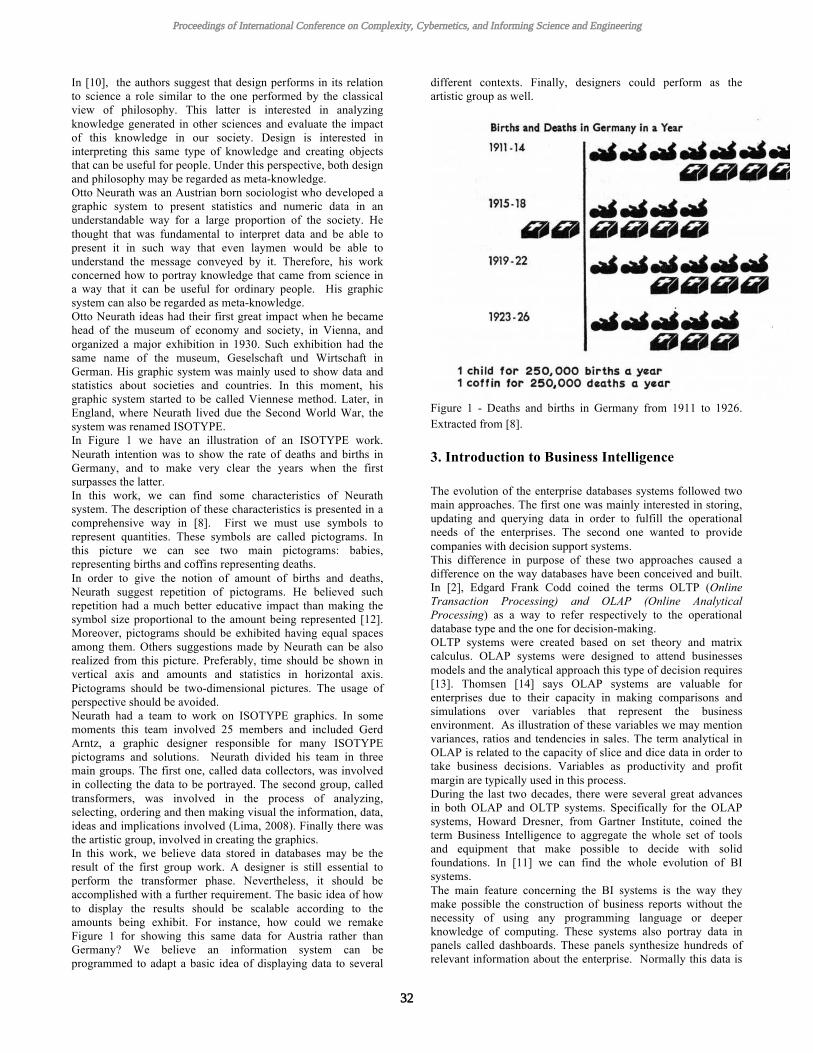
In [10], the authors suggest that design performs in its relation to science a role similar to the one performed by the classical view of philosophy. This latter is interested in analyzing knowledge generated in other sciences and evaluate the impact of this knowledge in our society. Design is interested in interpreting this same type of knowledge and creating objects that can be useful for people. Under this perspective, both design and philosophy may be regarded as meta-knowledge. Otto Neurath was an Austrian born sociologist who developed a graphic system to present statistics and numeric data in an understandable way for a large proportion of the society. He thought that was fundamental to interpret data and be able to present it in such way that even laymen would be able to understand the message conveyed by it. Therefore, his work concerned how to portray knowledge that came from science in a way that it can be useful for ordinary people. His graphic system can also be regarded as meta-knowledge. Otto Neurath ideas had their first great impact when he became head of the museum of economy and society, in Vienna, and organized a major exhibition in 1930. Such exhibition had the same name of the museum, Geselschaft und Wirtschaft in German. His graphic system was mainly used to show data and statistics about societies and countries. In this moment, his graphic system started to be called Viennese method. Later, in England, where Neurath lived due the Second World War, the system was renamed ISOTYPE. In Figure 1 we have an illustration of an ISOTYPE work. Neurath intention was to show the rate of deaths and births in Germany, and to make very clear the years when the first surpasses the latter. In this work, we can find some characteristics of Neurath system. The description of these characteristics is presented in a comprehensive way in [8]. First we must use symbols to represent quantities. These symbols are called pictograms. In this picture we can see two main pictograms: babies, representing births and coffins representing deaths. In order to give the notion of amount of births and deaths, Neurath suggest repetition of pictograms. He believed such repetition had a much better educative impact than making the symbol size proportional to the amount being represented [12]. Moreover, pictograms should be exhibited having equal spaces among them. Others suggestions made by Neurath can be also realized from this picture. Preferably, time should be shown in vertical axis and amounts and statistics in horizontal axis. Pictograms should be two-dimensional pictures. The usage of perspective should be avoided. Neurath had a team to work on ISOTYPE graphics. In some moments this team involved 25 members and included Gerd Arntz, a graphic designer responsible for many ISOTYPE pictograms and solutions. Neurath divided his team in three main groups. The first one, called data collectors, was involved in collecting the data to be portrayed. The second group, called transformers, was involved in the process of analyzing, selecting, ordering and then making visual the information, data, ideas and implications involved (Lima, 2008). Finally there was the artistic group, involved in creating the graphics. In this work, we believe data stored in databases may be the result of the first group work. A designer is still essential to perform the transformer phase. Nevertheless, it should be accomplished with a further requirement. The basic idea of how to display the results should be scalable according to the amounts being exhibit. For instance, how could we remake Figure 1 for showing this same data for Austria rather than Germany? We believe an information system can be programmed to adapt a basic idea of displaying data to several
different contexts. Finally, designers could perform as the artistic group as well.
Figure 1 - Deaths and births in Germany from 1911 to 1926. Extracted from [8].
3. Introduction to Business Intelligence
The evolution of the enterprise databases systems followed two main approaches. The first one was mainly interested in storing, updating and querying data in order to fulfill the operational needs of the enterprises. The second one wanted to provide companies with decision support systems. This difference in purpose of these two approaches caused a difference on the way databases have been conceived and built. In [2], Edgard Frank Codd coined the terms OLTP (Online Transaction Processing) and OLAP (Online Analytical Processing) as a way to refer respectively to the operational database type and the one for decision-making. OLTP systems were created based on set theory and matrix calculus. OLAP systems were designed to attend businesses models and the analytical approach this type of decision requires [13]. Thomsen [14] says OLAP systems are valuable for enterprises due to their capacity in making comparisons and simulations over variables that represent the business environment. As illustration of these variables we may mention variances, ratios and tendencies in sales. The term analytical in OLAP is related to the capacity of slice and dice data in order to take business decisions. Variables as productivity and profit margin are typically used in this process. During the last two decades, there were several great advances in both OLAP and OLTP systems. Specifically for the OLAP systems, Howard Dresner, from Gartner Institute, coined the term Business Intelligence to aggregate the whole set of tools and equipment that make possible to decide with solid foundations. In [11] we can find the whole evolution of BI systems. The main feature concerning the BI systems is the way they make possible the construction of business reports without the necessity of using any programming language or deeper knowledge of computing. These systems also portray data in panels called dashboards. These panels synthesize hundreds of relevant information about the enterprise. Normally this data is
32
Proceedings of International Conference on Complexity, Cybernetics, and Informing Science and Engineering

presented in a familiar way to business managers, using well know graphic styles. The advantage of using BI systems become clear when we face data about their wide spread usage by all sectors of the economy. Examples of such usage may be found in Kimball and Ross (2002). These examples cover areas as sales, human resources, production, and telecommunication among others.
4. THE STAR SCHEMA
In BI systems, it is very common to analyze data according to the facts stored and the several dimensions we can use to categorize those facts. We may illustrate this using the Rio de Janeiro underground transport system. Such system, shown in Figure 2, has two main lines, simply called line 1 and line 2, and each one of these lines have two directions. Line 1 has directions Saens Peña and Ipanema, and line 2 has directions Botafogo and Pavuna.
. Figure 2: Rio de Janeiro underground map.
Extracted from [9] Rio de Janeiro underground transport system, called Metrô Rio, is able to control the number of passengers that enter each station. Through the usage of the turnstiles, it is also possible to monitor the direction each passenger takes. In BI terms, we would call a fact each moment a passenger performs his or her trip involving two stations of the Metrô. Each passenger may be recorded by his or her ticket number. Table 1 shows the variables involved in this type of control. Since each line in Table 1 represents a passenger on a trip, we have a line for each fact we are analyzing. The system we are going to use as illustration is supposed to communicate to the general public
information about the intensity of the flow of passengers in different moments and dates. The public could rely on the reports generated by this system in order to decide the best moments and stations to perform its trips.
TRIP IDENTIFIER
TRIP ATRIBUTES
Id_TICKET STATION_ORIGIN
STATION_DESTINY
LINE
LINE_DIRECTION
DATE
TRIP_START
TRIP_END
TIME_ELAPSED
OCCUPANCY_RATE
Table 1 – Variables associated to a trip Each fact associates the passenger with the origin station of the trip and the destiny one. It also records the line direction and the line itself. The fact contains also the date and time when the trip occurred. In BI terms, we say that stations, lines, date and hour are dimensions for data in Table 1. The time spent on the trip is called a measure for the system. All measures must portray numerical values associated with the fact being stored. The occupancy rate is regarded as a calculated variable. It shows an estimative of the occupancy of the average wagon on that trip. Figure 3 synthesizes what should be regarded as dimensions, and measures for Table 1. Figure 4 shows the so-called Star Schema for the situation depicted in Figure 3. The Star Schema is highly used in modeling BI systems. It describes how data is going to be regarded by those who are going to manipulate it. We have a central table where we store the measures. This central table is called fact table. Around the Fact Table, we have the dimensions that allow us to categorize and organize the data. Kimball and Ross [7] introduce the Star Schema concept in details. Star Schemas are called logical models of data. It may be implemented in several ways. A possible physical model to store data according to it is the ROLAP model. In this popular model, dimensions and facts are stored as tables or relations. Figure 5 illustrate how this model could be adapted to the Metrô Rio situation. For each dimension in Figure 4 we establish a table with rows for each possible value this dimension may assume. Each dimension has an identifier (in our case called id_dimension) to link the row from the table dimension with
33
Proceedings of International Conference on Complexity, Cybernetics, and Informing Science and Engineering

rows in the fact table. For those who are familiar with data base theory, id_dimension works as foreign key for the fact table.
Figure 3: Dimensions and measures for the
Rio de Janeiro underground BI system
Figure 4: Star Schema for the Rio de Janeiro underground BI system example
Figure 5: Relational model for the Rio de Janeiro Underground example
A BI system built around one Star Schema is called a Data Mart. When we have several Star Schemas somehow interconnected the system is called a Data Warehouse. Both types of systems are used to store huge amount of data and it is not uncommon to deal with BI system with trillions rows in their fact tables. Despite this storage capacity, the system is conceived to deliver reports and aggregated values in very fast and efficient way. Nevertheless, how this can be achieved, and the techniques applied for it, are beyond the scope of this work. Anyone interested in this aspect of a BI system is suggested to read [14].
5. PIVOT TABLES
In this work we are interested in showing an alternative way, based on Otto Neurath´s work, for displaying data stored in a DM or DW. For this, aspects of data storage are not relevant. Actually, BI systems tend to keep the data base structure transparent for their users. It is very common also that users are stimulated to access data using a spreadsheet system they are familiar with. For instance, Microsoft suit for BI, called Analysis Services, use Excel as interface to access BI systems. Therefore, users access and manipulate data as they were using a simple spreadsheet rather than a gigantic database. The main tool for promoting interaction with BI systems is the Pivot Table. According to [6], the concept of Pivot Table was first introduced by Pito Salas for the 1991 release of the Lotus Improv system. In the popular Microsoft Excel spreadsheet system, Pivot Tables were made available in 1993, for the Excel 5 version. Currently, it is regarded as the most used form of visualization for data retrieved from BI systems. Pivot Tables are also used to build business reports in a friendly way. There are several good introductions for using and applying Pivot Tables. In this work we are not concerning with how to build Pivot Tables but how to employ them as data visualization tool. Those interested in how Pivot Tables are available in a spreadsheet system could read [5] or [4]. One of the best advantage concerning Pivot Tables is the use of a drag and drop procedure to select the rows and columns of the table or report we are interested in. In Figure 6 we show a simple report built by this way. It is shown the average amount
TRIP
IDENTIFIER
id_TICKET
DIMENSIONS
STATION_ORIGIN
STATION_DESTINY
LINE
LINE_DIRECTION
DATE
TRIP_START
TRIP_END
MEASURES
TIME_ELAPSED
OCCUPANCY_RATE
Id_TICKET(Id_STATION_ORIGIN(Id_STATION_DESTNY(
ID_LINE(ID_LINE_DIRECTION(
ID_DATE(ID_TRIP_START(ID_TRIP_END(
(TIME_ELAPSED(
OCCUPANCY_RATE((
STATION(
LINE(
DATE(hour(
ID_HOUR((HOUR(
ID_STATION((NAME_STATION((CAPACITY(
ID_DATE(((DATE((((DATE_TYPE(
ID_LINE(((LINE_NAME(
ID_TICKET(ID_STATIO_ORIGIN(ID_STATION_DESTINY((ID5LINE(ID_LINE_DIRECTION(ID_DATE((ID_TRIP_START(ID_TRIP_ENDE(
TIME_ELAPSED((((OCCUPANCY_RATE(
34
Proceedings of International Conference on Complexity, Cybernetics, and Informing Science and Engineering

of passengers that enters and leaves Maracanã Station from 14:15 and 14:30. These quantities should be multiplied by 100. Nevertheless, the type of chart shown in this picture may be regarded as unfriendly for being used by the public in general. People tend to associate statistics in charts as a mathematical visualization and consider then hard to understand. Automatic and dynamic sizing of the axes make this problem even worse. In an underground transport system as Metrô Rio it is necessary a more friendly way to portrait reports.
Figure 6 – Chart showing entrance and exit
From an underground station
6. ISOTYPE AND BI SYSTEMS
A system oriented to provide numeric information for a broad audience must consider the difficulties people face to understand and analyze the quantities involved. Therefore we cannot disregard people resistance in dealing with charts, graphs and other mathematical tools to visualize numeric data. ISOTYPE is a good option for dealing with this problem. It can even be applied to communicate statistics that come out of an information system. For instance, Figure 7 shows how data shown in Figure 6 could be portrayed using ISOTYPE. Basically, this type of solution displays quantities in a more familiar way to the layman who uses the Metro system. In order to use ISOTYPE associated with an information system, we need to provide scalable solutions. Therefore, we are no longer interested in building a solution to a limited and previously specified numeric set. We must find a framework that can fit the range of possible numeric data associated to the context being analyzed. Therefore, the solution shown on Figure 7 must be adaptable to data from other underground stations and for all moments of the day. In this solution, the ordinary user of Metrô Rio can take several conclusions more easily than observing Figure 6. In Figure 7 becomes quite clear that if a typical passenger waits more fifteen minutes, he or she is going to face a less busy station than it is now. Also the volume of the flow of passengers is more easily grasped by the shown pictograms. Figure 8 shows a possible ISOTYPE solution for data concerning the flow of passengers using one of the lines available in Metrô Rio. Again, the solution provided was designed to portray data regardless of the stations involved or the moments selected. From this solution, users of Metrô Rio can easily realize that to wait fifteen further minutes would allow a much more comfortable trip. In order to design this
solution we imagined a typical 280 passengers wagon having 40 seats available.
Figure 7: Flow of passengers in an underground station
7. CONCLUSIONS
When we want to make a presentation displaying numeric data, we can face two main different types of audience. The audience may be a specialized one, familiar with statistics jargon, and well versed in mathematical tools to visualize data. A second type of audience is the general public. In this case, we have to figure out solutions that entitle the layman to interpret, take conclusions and make decisions out of the data being displayed. Otto Neurath introduced a very useful solution for this second type of audience. Although his ideas were introduced in a pre computer era, they are still valuable resources for communicating data generated by modern BI systems for broad audiences. Some problems may occur when we try to use ISOTYPE ideas to the first type of audience, the specialized one. Sometimes, pictograms are not so accurate as the numbers they represent. It is more evident when we are dealing with fractions or numbers that are not exact multiples of the scale we adopted. Nevertheless ISOTYPE is an excellent tool for exhibiting tendencies within data and produces a powerful communication effect.
0
10
20
30
40
50
60
70
Entrance Exit
2:00-‐2:15
2:15-‐2:30
35
Proceedings of International Conference on Complexity, Cybernetics, and Informing Science and Engineering

Figure 8: Occupancy rate for the Rio de Janeiro
Underground example.
References [1].Bibliographisches Institut AG (1930). Gesellschaft und Wirtschaft – Bildstatistisches Elementarwerk. Leipzig: Bibliographisches Institut AG.
[2]. Codd, E. F. Saley, C. T. (1993) Providing OLAP to User-Analysts: An IT Mandate. Manchester: Hyperion Solutions Europe, E. F. Codd & Associates.
[3]. Fry, B. (2007) Visualizing Data. USA: O’Reilly Media.
[4]. Frye, C. (2011). Excel 2010: Pivot Tables in Depth. USA: lynda.com publisher. ISBN-13 9768-1596717237.
[5]. Hill, T. (2011). EXCEL 2010 Pivot Tables. USA: Questing Vole Press. ISBN-13 978-0789734358.
[6]. Jelen, B. Alexander, M. (2005). Pivot Table Data Crunching. Que Publisher.
[7]. Kimball, R. Ross, M. (2002) The data warehouse toolkit – The complete guide to dimensional modeling. 2. Edition. New York, EUA: Wiley Publishing.
[8]. Lima, Ricardo C. (2008). Otto Neurath e o legado do ISOTYPE. InfoDesign – Revista Brasileira de Design da Informação, 5(2), 36-49.
[9]. Metrô Rio (2013). Metrô Rio official site. Retrieved April 12, 2013, from http://www.metrorio.com.br/mapas.htm.
[10]. Monat, A. S., Campos, J. L., Lima, R. C. (2008). Metaconhecimento: Um esboço para o design e seu conhecimento próprio. BOCC-Biblioteca on-line de ciências da comunicação, v 1 page 1518.
[11]. Mundy, J. Thornthwaite, W. Kimball, R. (2006) The Microsoft data warehouse toolkit: With Microsoft business intelligence toolset. 1. Edition. Indianapolis, EUA: Wiley Publishing.
[12]. Neurath, M. Kinross, R. (2009) The transformer: Principles of making ISOTYPES charts. Hyphen Press: First Edition
[13]. Peter, R. Coronel, C. (2011) Sistemas de banco de dados: Projeto, implementação e administração. 8. Edition. São Paulo. Cengage Learning. 711 p.
[14]. Thomsen, E. (1997) OLAP solutions – Building multidimensional information systems. 1. Edition. New York, EUA: Wiley Computer Publishing. 576 p.
36
Proceedings of International Conference on Complexity, Cybernetics, and Informing Science and Engineering

Statistical Properties of Ordered Alphabetical Coding
Vilius NORMANTASInstitute of Mathematics AS Republic of Tajikistan, Dushanbe
ABSTRACT
The paper presents a type of text coding, called αβ-coding. The essence of αβ-coding is that letters of ev-ery word of a given text are arranged in a specific wayto create a code of that word. List of codes obtainedby scanning text corpora is stored in a database to-gether with words that could be transformed into eachcode. Word frequencies are stored as well. Decoding isperformed by transforming possibly scrambled wordsaccording to the algorithm of the coding and findingin the database the most frequent word correspond-ing to the resulting code. As more than one wordmay result in the same code, decoding is inherentlyambiguous. However a study on corpora of five lan-guages has shown that about 95% of word-tokens canbe correctly decoded.
Keywords: Ordered Alphabetical Coding, Coding,Ambiguous Decoding, Anagram, Corpora.
1. INTRODUCTION
It is widely known [1] that human readers are able tounderstand most words of a text where every letter,except the first one and the last one are scrambled inrandom order. This study is an attempt to describethis phenomenon as a type of text coding and demon-strate that a simple computer program is also able toperform decoding even when all letters are scrambled.
Ordered alphabetical coding (or αβ-coding) was in-troduced by Z.D. Usmanov in [4].
In this paper the coding was studied on corporaof four natural languages: English, Lithuanian, Rus-sian and Tajik; and one artificially created language -Esperanto. These particular languages were chosenpartially for subjective reasons (the author alreadypossessed corpora). Another reason was the intentionto test this coding on sufficiently diverse languages.Results of the statistical study are presented in twotables.
This type of coding could be used to introduce re-silience against certain distortions of text, for exampletyping errors, in applications where indexing of tex-tual data is needed. Concrete examples being spellingcheckers and textual database search engines.
2. DEFINITION OF ORDEREDALPHABETICAL CODING
Let L be a natural language with alphabet A, letW = a1a2...an be a word in that language of lengthn consisting of letters ak ∈ A, k ∈ 1..n. Let’s intro-duce a string of letters CW = as1as2...asn consistingof the same letters as the word W , but arranged inthe alphabetical order of the alphabet A.
Definition 1. We will call an image F : W → CWan ordered alphabetical coding (αβ-coding) of theword W , and string of letters CW - it’s αβ-code.
Example. Given the Latin alphabet A,F : W = spring → CW = ginprs.
Assuming that all written natural languages havetotally ordered alphabets (comparison of two distinctletters always results in “less” or “greater”[3]), imageof any word W under F will always be a single αβ-codeCW . However the inverse image F−1 : CW → Wmay be ambiguous, because more than one wordmay have the same αβ-code. For example, CW =eimst may be an image of several different words{W : W = times, items, mites, smite}.
A finite set of at least two words consisting of thesame letters arranged in different ways will be calledan anagram in this paper. The words belonging to theanagram will be called anagram elements.
Every anagram may be described by a single αβ-code. However the inverse image F−1 of the ana-gram’s αβ-code always corresponds to at least two el-ements of set {W}, therefore decoding of anagram’simage is always ambiguous.
In order to evaluate ability of αβ-coding to restorepreimages of αβ-codes, it is necessary to evaluate thecardinality of anagram set in natural languages. Sta-tistical study of corpora of four natural languages: En-glish, Lithuanian, Russian, Tajik, and an artificiallycreated language Esperanto have been made in [5]and [6]. The results suggest that the ratio betweenthe number of word tokens belonging to the anagramset and total number of word tokens in the corpusfluctuates about the value of 0.5. This suggests thatabout half of word tokens in the studied corpora areelements of anagrams. This fact raises serious doubts
37
Proceedings of International Conference on Complexity, Cybernetics, and Informing Science and Engineering

regarding the usefulness of αβ-coding, as about 50%of words potentially could be decoded incorrectly.
3. VARIATIONS OF ORDEREDALPHABETICAL CODING
In order to reduce the ambiguity of decoding, twomodified versions of αβ-coding have been presented in[6]: F f and F f,l. Just as F , the modified images aredifined on a set of words {W} in a natural languageL.
Definition 2. Image F f of word W is a stringα1C(W/α1), where α1 is the first letter of the wordW and C(W/α1) is αβ-code of the word W withoutthe first letter.
This image, unlike F , leaves the first letter of theword in its original position and arranges the remain-ing letters by the alphabetical order of A.
Following is another variation of αβ-coding.
Definition 3. F f,l : W → α1C(W/{α1, αn})αn.
In this image both the first letter of the originalword α1 and the last one αn remain intact. The re-maining letters W/{α1, αn} are arranged according tothe alphabetical order of A.
Example. Image F f of elements of anagram{W : W = times, items, mites, smite} wouldbe encoded as teims, iemst, meist, seimt.
This should be an improvement over F image, asless words are represented by the same code. Howevercodes of some other words would still be ambiguous,when the first letters match, for example both ele-ments of anagram {W : W = protein, pointer}would be encoded as peinort. In case of F f,l imageeven more words would have unambiguous codes. Forexample, elements of the last anagram would result intwo distinct codes: peiortn and peinotr.
In comparison to the original αβ-coding F , bothvariations F f and F f,l offer some improvement interms of accuracy of decoding.
4. STATISTICAL STUDY OF WORDFREQUENCY LIST
Corpora of the following sizes has been used to gatherthe data:
• English 11,252,496 words;
• Lithuanian 34,165,084 words;
• Russian 19,175,074 words;
• Tajik 2,323,965 words;
• Esperanto 5,080,195 words.
Lan-guagecode[2]
Cod-ing
Uniquecodes
Unam-biguouscodes,in %
Ambi-guouscodes,in %
EnF 119,055 89.74 10.26F f 130,644 95.19 4.81F f,l 135,618 98.49 1.51
LtF 605,039 90.28 9.72F f 654,475 94.96 5.04F f,l 675,208 97.44 2.56
RuF 462,886 93.01 6.99F f 488,286 96.32 3.68F f,l 500,433 98.39 1.61
TgF 80,080 93.05 6.95F f 84,220 96.77 3.23F f,l 85,805 98.48 1.52
EoF 147,220 90.92 9.08F f 158,310 95.94 4.06F f,l 162,940 98.45 1.55
Table 1: Anagram statistics
Results of the statistical study of the corpora arepresented in table 1. First of all, a list of all uniquewords with absolute frequencies of their occurrencewas created. Size of the list, which is equal to thetotal number of unique words found in the corpus ispresented in the second column of the table.
Second step was to encode every word from the listaccording to the algorithm of the particular modifi-cation of αβ-coding and group words resulting in thesame code. The codes were divided into two groups.One includes codes generated by a single word, calledunambiguous codes. The other group contains codesgenerated by at least two distinct words. The thirdand fourth columns of table 1 represent amount of re-spectively unambiguous and ambiguous codes as per-centage of total number of distinct codes. The resultsshow that about 90 to 98% of word types can be un-ambiguously decoded for all languages. As expected,the modified versions of αβ-coding performed betterthan the original version, and F f,l performed best onall languages.
However this evaluation does not take into accountthe frequencies of the word occurrences.
5. UNAMBIGUOUS INVERSE IMAGES
As discussed above, images F , F f and F f,l assign asingle code to every word. However the inverse imagesin general case does not provide unambiguous decod-ing. To overcome this limitation images F , F f andF f,l are presented.
Definition 4. Images F , F f and F f,l have the fol-lowing properties:
38
Proceedings of International Conference on Complexity, Cybernetics, and Informing Science and Engineering

• they are defined on a set of words {W} of lan-guage L;
• encode words in the same way as correspondingcodings F , F f and F f,l;
• the inverse images F−1
, F f−1
and F f,l−1
match
the inverse images F−1, F f−1and F f,l−1
, whenthe word can be decoded unambiguously;
• when decoding is ambiguous, inverse images F−1
,
F f−1
and F f,l−1
return a single word W ∗, whichhas the largest frequency of all words with thesame code.
Example. Two words have been found, which areencoded as eenprst by image F . The absolute fre-quency of the first word present is 4129, the otherword serpent occurred 22 times in the corpus. As theformer word has a larger frequency, therefore the in-
verse image F−1
would decode eenprst as present.It is clear that this type of decoding cannot avoid
mistakes when the less frequent element of an anagramis expected. However statistical study of the corporapresented in the following section suggests that thepercentage of correctly decoded words may be highenough for some applications.
6. STATISTICAL STUDY OF INVERSEUNAMBIGUOUS IMAGES
The fourth column of table 2 presents ratio of occur-rences of words which could be decoded unambigu-ously by each image, as percentage of total numberof word tokens in the corpus. Unlike data presentedin table 1, this table takes into account the word fre-quencies.
It is important to notice, that for all studied lan-guages only about 50% of words tokens are not el-ements of an anagram, thus can be unambiguously
decoded by inverse image F−1
. Russian languagehas slightly less occurrences of anagrams - it hasabout 54% non-anagram words. Esperanto particu-larly stands our by having very low number of non-anagram words, comparing to other studied languages- just about 35% of word occurrences.
Images F f and F f,l offer significantly higher per-centage of unambiguously decoded word tokens. Re-sults tend to cluster around about 75% and 90% re-spectively.
The last column of table 2 gives a quantitative eval-uation of the effectiveness of decoding by every αβ-coding. For all five languages error rates are within
1% when decoding by images F f−1
and F f,l−1
. Error
rates of decoding by image F−1
stay within 3% for alllanguages except Esperanto, where error rate is about6%.
Lan-guagecode[2]
Numberof wordsin cor-pus
Cod-ing
Frequ-ency ofunam-biguouscodes,in %
Cor-rectlyde-codedwords,in %
En 11,252,496F 42.11 97.42
F f 73.60 99.35
F f,l 96.25 99.75
Lt 34,165,084F 45.77 97.17
F f 69.48 99.03
F f,l 84.88 99.60
Ru 19,175,074F 54.31 97.65
F f 75.57 99.42
F f,l 85.79 99.85
Tg 2,323,965F 49.59 98.12
F f 75.70 99.37
F f,l 86.99 99.67
Eo 5,080,195F 35.21 94.14
F f 82.39 99.09
F f,l 95.16 99.77
Table 2: Efficiency of decoding
7. EXAMPLE OF DECODING
The following two sentences (taken from Wikipedia’sarticle about English language) were scrambled sothat letters of every word were ordered randomly.
English is a West Germanic language that was firstspoken in early medieval England and is now the mostwidely used language in the world. It is spoken asa first language by the majority populations of sev-eral sovereign states, including the United Kingdom,the United States, Canada, Australia, Ireland, NewZealand and a number of Caribbean nations.
The texts looks as follows when scrambled. Capi-talization of letters is removed, the punctuation marksand white spaces are left intact:
hleigsn si a wtse arngmeic gaaleung taht saw ftirsknsope in lerya dmaelive nlanegd dan is now eth stmowdleyi sude gnauglae ni het orlwd. it is pekons saa tsfri aaengulg by hte ytrmajoi otunlpsioap of eervlsanresvegoi ettass, cgiidnuln the euidnt nmdokgi, teh un-edti ssetta, cdaana, uasrtaial, ndairle, enw eaazdnlnda a nmerub of eicarbanb ntsoina.
Text restored by F−1
image:
english is a west germanic language that was firstspoken in early medieval england and is now the mostwidely used language in the world. it is spoken as afirst language by the majority populations of severalsovereign states, including the united kingdom, theunited states, canada, australia, ireland, new zealandand a number of caribbean nations.
39
Proceedings of International Conference on Complexity, Cybernetics, and Informing Science and Engineering

In this example, the text has been completely re-stored to the original state, excluding the capital let-ters.
8. DISCUSSION AND CONCLUSIONS
Although the problem of ambiguous decoding is un-avoidable in αβ-coding, the results of the statisticalstudy presented above suggest that this type of cod-ing may be accurate enough for some applications. Forexample, if we assume that the average length of asentence of some language is 20 words, decoding by Fwould on average make about one error per every 1.6sentence. In most cases this level of accuracy wouldmake the resulting text easily legible comparing to thescrambled input (for example see section 7).
Although linguistic aspects of the chosen languageswere not subject of this study, it is interesting to noticethat statistical properties of αβ-coding remain consis-tent through the languages. Even though the lan-guages were sufficiently distinct. It is also interestingto notice that artificially created language Esperantostands out from the other languages by having signifi-cantly larger number of words belonging to anagrams.
This study also may provide an explanation to thewidely known phenomenon where people can success-fully read text with scrambled letters, except the firstand the last ones (this corresponds to F f,l coding).Human readers may have this peculiar ability, becausemost words do in fact have distinct sets of letters.Even when several words belong to an anagram, it isvery likely that frequencies of their occurrence woulddiffer by as much as several orders of magnitude.
References
[1] M. Davis, http://www.mrc-cbu.cam.ac.uk/
people/matt.davis/Cmabrigde/, 2003, accessed2013-05-04.
[2] Library of Congress, “Codes for theRepresentation of Names of Languages”,http://www.loc.gov/standards/iso639-2/
php/English_list.php, accessed 2013-05-04.
[3] B. Smyth, Computing Patterns in Strings, Es-sex, England: Pearson Addison-Wesley, 2003, p. 6.
[4] З.Д. Усманов, “Об упорядоченном алфавитномкодировании слов естественных языков”, ДАНРеспублики Таджикистан, т. 55, № 7, 2012.
[5] З.Д. Усманов and V. Normantas, “Статистиче-ские свойства - кодирования слов естественныхязыков”, ДАН Республики Таджикистан, т.55, № 8, 2012.
[6] З.Д. Усманов and V. Normantas, “О множе-стве анаграмм и распознавании их элементов”,Proceeding of the 16th seminar Новые ин-формационные технологии в автоматизи-рованных системах, Moscow, 2013, pp. 287-292.
40
Proceedings of International Conference on Complexity, Cybernetics, and Informing Science and Engineering

The Complexity of Complexity: Structural vs. Quantitative Approach
Marcin J. Schroeder Akita International University Akita, 010-1211 Akita, Japan
ABSTRACT The first part of this paper is devoted to a short critical review of the concepts frequently used to characterize complexity. It will be followed by a choice of the conceptual framework for this study based on methodological reflection of the author from his earlier publications in which concept of information plays fundamental role. Finally, more comprehensive approach will be proposed for the study of complexity in which both selective and structural manifestations of information are considered. The former is associated with the quantitative characterization of complexity, the latter with the structural one. The choice of the conceptual framework of information and the use of the formalism developed for the study of information in the study of complexity is justified by their explanatory power regarding several aspects of complex systems. Keywords: Complexity, Information, Information integration, Selective and structural manifestations of information, State of a system, Formalism for information and its integration.
1. INTRODUCTION Complexity is more complex, than it was described by Warren Weaver in his very influential early study of the concept and its role in scientific inquiry [1].
Weaver distinguished three levels of complexity. Simple systems devoid of complexity involve small number of variables easily separable in analysis.
Systems of disorganized complexity involve numerically intimidating number of variables, but because of limited interaction of the components, they may be successfully analyzed using statistical methods. Here, an example is gas consisting of so big number of molecules that the tracking of their individual states is impossible, but whose collective behavior can be easily analyzed in terms of macro variables.
Finally, systems of organized complexity reflect “the essential feature of organization” of the big number of components, and escape statistical analysis. In systems of this type components are interacting in an organized way making statistical analysis ineffective.
In spite of its importance for the initiation of the study of complexity, Weaver’s categorization has several deficiencies. The simplest is in not taking into account systems involving small number of variables, but exhibiting some form of complexity. An example can be a pair of entangled elementary particles. Crystal gives us another example which can be used as an argument against the merit of Weaver’s categorization. The system is not much different from gas in the number of components, and its organization is of much higher level, but it can be well described and analyzed in terms of symmetry. In this case, the components (atoms or molecules) are interacting in a
highly organized manner, and it is this organized interaction which allows analysis.
More serious deficiency is in the conceptual ambiguity of Weaver’s approach. This objection can be also applied to the majority of other attempts to define, describe and analyze complexity, that refer to variables, systems, organization, interaction, or causation. Even the assumption that the big number of components is a prerequisite of complexity can be objected. It is easy to predict preferences of the big number of customers in a shop, while virtually impossible for a single customer.
Finally, Weaver’s study of complexity does not address issues of hierarchic levels of organization and complexity arising in the mutual relationship of the levels. This type of complexity can be found in the study of life, which in turn is a paradigmatic object of the study of complexity.
First part of this paper will be devoted to a critical review of the concepts used to characterize complexity. It will be followed by a choice of the conceptual framework for this study based on methodological reflection of the author from his earlier publications [2]. Finally, more comprehensive approach will be proposed for the study of complexity together with its justification.
2. UNDERSTANDING COMPLEXITY Complexity is an abstraction derived from the adjective “complex” and therefore there is a natural question about the term it qualifies. Here is the first source of ambiguity. An obvious answer is that complexity characterizes a system, but typically there is no explanation of the meaning of this concept.
It is a wild card term, even in the context of highly formalized disciplines such as mechanics. The same term is used when the system under consideration has an epistemic status and is simply that which is considered, and when it is used in the ontological meaning of independently existing and objectively distinguished object of study.
In physics, there is frequently an additional qualification of a closed or isolated system. This indicates an idealization of complete independence of the system from external influence, however typically there is no explanation of the topological expressions such as “external” or “closed.” Moreover, the isolated system can be under influence of controlled external forces, or can fill out all space, for instance in the case of a force field. It can be a vacuum in a specified region of space. In any case, the physical system is capable of assuming many states, at least potentially, as otherwise it could not be a subject of study.
Systems are studied not only in physics, and not only in physics they are so enigmatic. The use of the term “system” always presupposes some form of identity and some level of potential or actual multiplicity of either membership type, part-whole type, or in the form of the variability of qualitative or quantitative
41
Proceedings of International Conference on Complexity, Cybernetics, and Informing Science and Engineering

characteristics. But this does not go much beyond an exclusive characterization in terms of two opposite very general concepts of unity (identity, whole) and potential or actual multiplicity.
Weaver’s categorization of the levels of complexity makes an important distinction between simple increase in the number of the multiplicity characterizing a system and interdependence of the elements of this multiplicity [1].
This interdependence is described in a temporal fashion as interaction. But again, what does it mean “interaction”? In physics, interaction is through action of forces, and presence of force means simply change of a state. Mechanical system does not change its state in the absence of forces. If observed in a reference frame associated with a system influenced by some forces, observed system will exhibit virtual change of state by pseudo-forces.
At this point, we should be aware of the possible terminological confusion in the use of the term state, which frequently is used in a different meaning, synonymous with coordinate configuration.
An important characteristic of the physical interactions introduced already by Isaac Newton as the Third Principle of Mechanics is that they are always mutual and symmetric. If one object is acting on the other with some force, then the other is acting on the first one with a force of the same magnitude, but in opposite direction. It is in strong contrast to human perception of the one-way actions and has important consequences for the underlying concept of causality.
At the level of mechanical interactions, dynamic of the systems is symmetric with respect to the inversion of time coordinate, which makes the concept of causal relationship between a cause and its effect inadequate. However, in compound systems with sufficiently large number of components, the Second Law of Thermodynamics is breaking the symmetry with respect to time inversion and the causal relationship becomes relevant.
Thus, from the point of view of mechanics, it is impossible to decide whether I am pushing the wall causing its crumbling, or the wall is pushing me and crumbles due to my resistance. However, thermodynamic analysis shows that only my body can be a source of energy necessary to destroy the wall. Thus, my body was the active side, and the wall passive one. My action was the cause of wall’s destruction. It is complexity of the system which allows for transition from interaction to causal relationship.
Physical interaction through forces is associated with the change of the state of a system. However, the concept of a state is not clear either. Uri Abraham observed “Considering its central place, it is surprising that the general notion state has received so little attention.” [3] Even in physics, where the term “state” is one of the most frequently used, its meaning, or rather an interpretation of mathematical concepts from the formalisms used by physical theories associated with this term, is sometimes ambiguous, in particular in classical mechanics.
Textbook explanations of a state of a system consisting of n point masses (particles) identify the state with a point in a 6n dimensional space (phase space) with dimensions representing possible three spatial coordinates of each particle and its possible three momentum coordinates. Of course the values of coordinates depend on the choice of the observer or reference frame, but this dependence of the state on coordinatization can
be avoided when we consider the state to be a vector in vector space.
Bigger problem is that this vector is changing in time, even when there are no forces acting on it, for instance when we have a single free particle moving along a straight line. Change of the position without any change of the momentum is a matter of the choice of reference frame and of the identification of the system in this frame, not of a change of the state. Thus, the interpretation of what in the mechanical formalism constitutes a description of the mechanical state is different from the question of what we need to make predictions regarding the future of the system.
When we consider more general systems, a state of the system can be identified with the selection of accidental properties of the system. It is necessary to make distinction between the properties which identify the system (usually we would say object) and can be considered essential properties, i.e. those which are necessary for the existence of the object, and accidental or variable properties, which are involved in interactions. Using this approach it would be appropriate to distinguish in mechanical systems spatial description (position vector) as a description of its identity, and the vector of momentum as a description of its state.
In the general case, the properties can have qualitative form, or can be associated with quantitative representation. Interaction between systems here can also be understood as change of the state. Of course there is a question under what conditions changes of the states of the systems can be understood as interaction. Simultaneity of the changes can be coincidental, so it is not a reliable criterion. If we can identify physical interactions of the components of the systems the answer is easy. It is more difficult to answer the question in more general context. An attempt to answer this question will be given later in the proposed conceptual framework for the study of complexity.
One more concept used by Weaver in his original study of complexity should be considered, that of organization. Certainly, organization is associated with some structural characteristics. Actually Weaver considers an adjective “organized” to qualify complexity.
Disorganized complexity means that the components can be considered in separation, and the only problem in the analysis of a complex system of this type is their large number. We could observe in the example of a crystal mentioned above that the large number of components may not be a problem, if the structure which describes organization, in this case a group of transformations corresponding to the symmetries of the crystal, has simple description. Thus, complexity becomes a source of problems when structural characteristics of the system are highly involved.
3. METHODS TO RESOLVE PROBLEMS OF COMPLEXITY
We can trace the attempts to overcome difficulties arising in handling complexity even in very remote past of humanity. Two early examples can be found in the use of numbers and in language. Humans have very limited capacity in direct comprehension of the number of objects. The classical article of George Miller “The Magical Number Seven Plus or Minus Two” sets the limit surprisingly low [4]. It tells us that in this
42
Proceedings of International Conference on Complexity, Cybernetics, and Informing Science and Engineering

respect we are not much better than other animals, for instance ravens or parrots [5, 6].
To avoid problems in dealing with larger number of objects various numerical systems were introduced which represented groups of several objects by a single, but possibly compound symbol. Next step was a positional numerical system which allows with a fixed set of fundamental symbols (digits) construction of a numeral representing an arbitrary number. Positional numerical system has an additional advantage, that the arithmetical operations representing compounding operations on sets (addition corresponding to disjoint sum and multiplication corresponding to direct product of sets) could be performed in a sequence of elementary operations involving manipulation exclusively of single digit numerals. Thus, the process of a high level of complexity could be decomposed into elementary steps involving relatively small number of symbolic manipulations whose outcomes could be easily memorized. This decomposition was the original form of an algorithm.
Alan Turing detached this process of manipulation of symbols from the human brain in his model of an A-machine [7]. Moreover, he showed that it is possible to describe a universal machine which can perform any algorithmic process, when it is appropriately described on the input tape. The universal character of this type of Turing machines had great practical consequences, but also was a bridge to another ancient method of dealing with complexity.
This other method of overcoming complexity has much more remote sources in the use of language preceding the introduction of numerical systems. Here too, relatively simple words representing complex systems were constructed from small number of units, first sounds, later written characters. We can observe that probably without any intentional intervention there was some correlation between complexities of the meaning of the words and their linguistic representations. Simple concepts, whose word representations were frequently used, acquired simple, short form.
Greek Antiquity brought the recognition of another type of relationship among the words reflecting the structure of comprehended reality. Aristotle used differences in generality of universals, i.e. terms representing classes of objects to develop a structure which allowed creation of new concepts out of those earlier defined. Moreover he provided a system of syllogistic which allowed derivation of some sentences expressing relationships between scopes of terms, from other (premises).
This first form of logic, syllogistic required specific form of sentences. Stoics developed a logical system of logical consequences based on analysis of connectives used to combine simple sentences into compound ones. Much later predicate logic was developed combining both earlier logical systems.
Deduction was a tool to reduce complexity. Originally, Greeks believed that the truth of a complicated statement can be shown by deriving it from the set of so simple and obviously true axioms, that nobody would question them. Today we know that no axioms are obviously true, but that their selection is either arbitrary, or is dictated by the process of induction from the results of an empirical process. However, we still can agree that axiomatic systems reduce complexity.
Aristotle created the first axiomatic system for his syllogistic, but it was the formulation of geometry in this way by Euclid in the “Elements” which became a paradigm of the
method. It is interesting that the Greeks had their own “Turing machine” in their studies of geometry. The logical process was frequently represented by a sequence of operations made with the use of the ruler (straightedge) and compass. Almost two thousand years later, Rene Descartes in his “La Géométrie” published in 1673 as an appendix to “Discourse on Method” showed that these geometric constructions are equivalent to operations on numbers when geometry is formulated in the analytical form. But the relationship was with real numbers, not integers.
The revolution of Turing’s approach consisted in realization that all algorithmic processes, including logical proofs, can be modeled with a very simple mechanism which can be interpreted as a device working with natural numbers.
Moreover, several different measures of complexity were introduced with the use of the concept of computation, although after the death of Turing. From the present perspective they seem quite obvious, but their invention was a great achievement. For each process carried out by a universal Turing machine we can count either the number of steps leading to the result, the minimal length of the program which is producing the outcome, and the minimal size of the tape, or memory necessary for its implementation. Each gives us evaluation of some quantitative aspect of complexity.
The fact that we can measure something is frequently dangerous for the development of the understanding the subject of study, as it creates an illusion that our knowledge is complete. What do we know about complexity in a consequence of the availability of these measures? Does it help us to understand what does it mean “complexity”?
4. CONCEPT OF INFORMATION Information is an apparently equally enigmatic concept. However, a suitable definition of information can reduce the study of complexity to that of information. It is not a surprise, because even without deeper reflection of the two concepts, it is quite convincing that complexity is a characteristic of information, or information systems. Moreover, the second of the measures of complexity mentioned above is considered a variant of the measure of information. Certainly, for this purpose information has to be defined in a very general way.
Concept of information, introduced and studied by the author in his earlier publications [8], is understood as an identification of a variety, which presupposes only categorical opposition of one and many and nothing else. The variety in this definition, corresponding to the “many” side of the opposition is a carrier of information. Its identification is understood as anything which makes it one, i.e. which moves it into or towards the other side of the opposition. The preferred word “identification” (not the simpler, but possibly misleading word “unity”) indicates that information gives an identity to a variety. However, this identity is considered an expression of unity or “oneness”. We could interpret this formulation of the concept of information as a resolution of the one-many opposition.
There are two basic forms of identification. One consists in the selection of one out of many in the variety (possibly with a limited degree of determination described for instance by probability), the other in a structure binding many into one (with a variable degree of such binding reflected by decomposability of the structure). This brings two manifestations of information,
43
Proceedings of International Conference on Complexity, Cybernetics, and Informing Science and Engineering

the selective and the structural. The two possibilities are not dividing information into two types, as the occurrence of one is always accompanied by the other, but not on the same variety, i.e. not on the same information carrier.
It is easy to recognize in the selective aspect of information subject of Shannon’s information theory, in which a probability distribution of the selection is utilized to define the measure of information in terms of entropy [9]. It is usually overlooked that in this approach it is the probability distribution of the choice which describes information and its entropy is only a secondary concept which characterizes the distribution. It is naïve to expect that the concept of information appears out of nothing between the probability distribution and the calculated value of entropy.
The structural aspect of information can be identified in the attempts to link the concept of information with topological or geometric structures defined on the objects functioning as carriers of information.
For the concept of information formulated in so general way, the formalism has to be equally general [10]. The concept of information requires a variety, which here is understood as an arbitrary set S (called a carrier of information). Information system is this set S equipped with the family of subsets ℑ satisfying conditions: S is in the family ℑ, and together with every subfamily of ℑ, its intersection belongs to ℑ, i.e. ℑ is a Moore family.
Information itself is a distinction of a subset ℑ0 of ℑ, such that it is closed with respect to (pairwise) intersection and with each subset belonging to ℑ0, all subsets of S including it belong to ℑ0 (i.e. in mathematical terminology ℑ0
is a filter).
This description can be translated into simpler explanation. The Moore family ℑ, represents a variety of structures (e.g. geometric, topological, algebraic, etc.) of a particular type which can be defined on the subsets of S. This corresponds to the structural manifestation of information. Filter ℑ0 in turn, serves identification, i.e. selection of an element within the family ℑ, and under some conditions in the set S.
For instance, in the context of Shannon’s selective information based on probability distribution of the choice of an element in S, ℑ0 consists of elements in S which have probability measure 1, while ℑ is simply the set of all subsets of S. This approach clearly combines the both manifestations of information, selective and structural.
Since every Moore family ℑ of subsets of a set S corresponds to the family of closed subsets of some closure operator defined on S, each information system can be characterized in terms of an algebraic structure £, called complete lattice, introduced on the family ℑ. This structure is a generalization of the concept of a Boolean algebra, and at the same time it assumes the role of the generalized logic going beyond its special instance of the traditional logic for linguistic information systems [11].
The analysis of the logic £ of an information system gives us description of the level of information integration. Direct product reducibility or factorizability (i.e. decomposability into a product of simpler component structures) of this lattice can be used as a characterization of the level of information integration.
If the logic, i.e. lattice representing it in the algebraic form cannot be decomposed into a product, we have completely integrated information. If it can be decomposed into trivially
indecomposable two element structures (the case of a Boolean algebra), it is not integrated at all. And between these two extreme possibilities we have a wide range of partially decomposable logics.
Moreover, it is possible to describe a mathematical model of the theoretical device (gate) integrating information, and therefore the verb form of the term “integration” is fully justified [12].
Finally, in the formalism for information in terms of the closure operators a symbolic representation can be defined as mapping from one information system to another which preserves structural characteristics of information [13]. Thus, instead of the difficult to comprehend relationship between objects of different ontological status (symbol and its denotation), we can think of a symbol as an image of a function which assigns to elements of one information system elements of the other.
5. COMPLEXITY AND INFORMATION In the earlier part of this paper, complex systems were characterized in terms of the identity and multiplicity. This opens connection between complexity and information understood as an identification of a variety. Complex systems are simply information systems with the high level of complexity which can be understood in terms of selective information or structural information.
Systems whose complexity Weaver described as disorganized can be associated with the former manifestation with a high value of the measure of information, those with organized complexity with the latter of high level of integration. It can be easily observed that now we can include complex systems with small number of components, as the high level of information integration is not necessarily related to the number of components.
In the present conceptual framework, we can consider many different types of complexity related to information in geometric, topological or other structures. Also, the study of hierarchic information systems, such as systems describing life, gives us a new perspective on complexity involving multiple levels of organization [14].
6. WHY INFORMATION? There is a legitimate question regarding the choice of the concept of information, as defined by the author, as a framework for the study of complexity. What are the reasons? What are the advantages of this approach?
Some reasons were already given above. Complexity was already in its earlier studies associated with information, for instance, when the quantitative characterizations of complexity were formulated in terms of algorithms or computation. But this association, although important for practical reasons, does not help in understanding of what is complexity, or how to overcome the limitations imposed by it.
Thus, it is not so important that complexity can be associated with information, but that complexity can be described using structural characteristics of information and its integration.
As it was stated above, the level of information integration in the formalism proposed by the author is essentially the level of decomposability of an algebraic structure identified as a logic of information. Decomposability of the algebraic, or in general
44
Proceedings of International Conference on Complexity, Cybernetics, and Informing Science and Engineering

mathematical structures is probably the most important subject of all mathematical theories, and immense amount of work has been done in mathematics on this subject, especially in relation to the task of the classification of the simple, indecomposable structures.
It may seem to be a smile of the history of human endeavor, but actually should not be a surprise, that the issue of decomposability of mathematical structures into a small number of simple structures has its source in the attempt to reduce the complexity of the study of these structures.
Typically, the paradigm of this study is explained using not very well fitting example of prime numbers. Every natural number greater than two can be written in a unique way as a product (here simply a result of multiplication) of some prime numbers (numbers greater than one which are divisible only by one and itself) or their powers. Thus, prime numbers serve as indecomposable, simple components. Very often, proofs of theorems in number theory are done first for prime numbers, and only then an extension is made to all numbers which are built from these numbers, or it is known that some theorems can be easily proven for all numbers, if we can only find a proof for prime numbers.
The example is not perfect because unfortunately we have as many prime numbers as all numbers (questionable reduction of complexity), the long-standing problem of finding an algorithm generating the n-th prime number has not been solved, and the algorithms of decomposition of the natural numbers into products of prime numbers is notorious of its high level of computational complexity.
However, we have another example of the one of the greatest mathematical achievements, the completion in 2008 of the classification of all finite simple groups as a result of the publication of the work of about one hundred authors in the second half of the 20th Century.
For our purpose of the study of complexity in terms of information integration, we can focus on the subject of decomposability not of all mathematical or algebraic structures, but of complete lattices, as they serve as the structures characterizing every logic of information. The study has also very extensive literature from similar period of time as in the case of finite groups, although probably due to much smaller interest in the domain of lattices the results are less advanced.
More important than already existing results are highly developed methods of inquiry which can be easily adapted for the purpose of the study of information.
Another advantage of this formalism is the possibility to consider semantics of information programmatically neglected in the orthodox, quantitative analysis of information in terms of entropy, or more exactly in the analysis of information transmission.
As it was stated above in earlier sections, some of the most effective methods to deal with complexity consisted in the use of symbolic representation and manipulation of symbols, i.e. the use of abstraction or the algorithmic decomposition of complex processes into simple manipulations of symbols in computation or logical reasoning. But the concept of meaning for centuries created more philosophical problems, than solutions.
Meaning as a mapping between the objects and states of reality and some structure of symbols (for instance a language) is a quite obvious idea explored in many works. However, in the earlier attempts there was nothing which would explain which of a large variety of possible mappings should be associated with the meaning and how the choice of a function generates the mechanism of meaning.
Completely different status of the elements of the domain of the function and the set of its values made the choice impossible without involving external and arbitrary concepts, such as for instant of a mind with distinctive mental characteristics (Brentano) or a more abstract interpreter (Peirce).
In the present approach, meaning is defined by functions which preserve closure structure of the two information systems. In mathematical language we can say that such a function is continuous with respect to respective closure operators.
Someone could object: “What? Is a cow an information system when I use the word ‘cow’?” Of course! Every cow is a much more sophisticated information system than a mainframe computer. Try to milk it. This is not necessarily a joke, considering for instance immunological information in milk and taking into account that every existing computer is processing information at only two levels of hierarchical structure of information dynamics, while life requires multi-level hierarchy [14]. Using more serious terminology to defend against the objection of frivolity, all objects of our experience are information systems or their elements. This does not require adoption of the “bit for it” John A. Wheeler’s philosophy of information giving this concept primary ontological status. The definition of information used here is neutral with respect to ontological issues.
7. WHY COMPLEXITY? We have to consider another legitimate question “Why complexity?” What is the reason for extending the quantitative study of algorithmic or computational complexity to structural study involving information? Do we need more than what we knew about complexity before?
There are many reasons going beyond the most obvious, that the quantitative methods apply to very special instances of complexity and do not give us any answers to the question “What is complexity?” It is a very typical illusion that the assignment of numbers is a measuring of something and that this “something” is an existing entity [15]. But is this question just an expression of curiosity?
Complexity became recently the main obstacle in the progress of many disciplines. Probably the most clear is the recognition of the problem in the study of the foundations of life [2]. But the other disciplines are exposed to similar difficulties.
Programs to solve the mystery of consciousness are blocked by extreme complexity of human brain. Some research centers are trying to reduce complexity by limiting their ambitions to mapping of the brain of mouse which has “only” 70 million neurons, instead of that of human with about a thousand times bigger number. It is still an expression of the extreme optimism, as the similar task to explain functioning of the brain of roundworm Caenorhabditis elegans with its 302 neurons and 8,000 synapses turned out to be extremely difficult.
45
Proceedings of International Conference on Complexity, Cybernetics, and Informing Science and Engineering

Human brain is very likely the most complex system in the Universe, hence maybe we should not start from this end. However, the issues of complexity pop up everywhere. The fact that we know algorithms to solve some relatively simple problems is very often of no practical relevance, since algorithms require time of execution exceeding the age of the universe.
Probably the most important challenge for the human intellect is at present finding a way to curb complexity, and without knowing what it is and what are its structural characteristics, the task would be hopeless.
Acknowledgements. The author would like to express his gratitude for the valuable comments and suggestions to improve this paper from Gordana Dodig-Crnkovic, Plamen L. Simeonov, and other, anonymous reviewers.
8. REFERENCES
[1] W. Weaver, “Science and Complexity”, American Scientist,
Vol.36, No.4, 1948, pp. 536-544. [2] M. J. Schroeder, “The Role of Information Integration in
Demystification of Holistic Methodology”, in P. L. Simeonov, L. S. Smith, A. C. Ehresmann (Eds.) Integral Biomathics: Tracing the Road to Reality, Berlin: Springer, 2012, pp. 283-296.
[3] U. Abraham, “What is a State of a System? (an outline)”, in Manfred Droste, Yuri Gurevich (Eds.) Semantics of Programming Languages and Model Theory. Algebra, Logic and Applications Series, Vol. 5. Newark, N.J.: Gordon and Breach, 1993, pp. 213-244.
[4] G. Miller, “The Magical Number Seven, Plus or Minus Two: Some Limits on Our Capacity for Processing Information”, Psychological Review, Vol. 63, 1956, pp. 81-97 (reprinted in Vol. 101, No.2, pp. 343-352).
[5] O. Koehler, “The Ability of Birds to ‘Count’”, in J.R. Newman, The World of Mathematics. New York, NY: Simon and Schuster, 1956, pp.489-496.
[6] H. Davis, J. Memmott, “Counting behavior in animals: A critical evaluation”, Psychological Bulletin, Vol. 92, 1982, pp. 547-571.
[7] A. M. Turing, “On computable numbers, with an application to Entscheidungsproblem”, Proc. London Math. Soc., Ser 2, Vol 42. 1936, pp. 230-265.
[8] M. J. Schroeder, “Philosophical Foundations for the Concept of Information: Selective and Structural Information”, in: Proceedings of the Third International Conference on the Foundations of Information Science, Paris 2005, http://www.mdpi.org/fis2005.
[9] E. C. Shannon, “A mathematical theory of communication”, Bell Sys. Tech. J., Vol. 27, 1948, pp. 323-332; 379-423.
[10] M. J. Schroeder, “From Philosophy to Theory of Infor-mation”, Intl. J. Information Theor. and Appl., Vol.18, No. 1, 2011, pp. 56-68.
[11] M. J. Schroeder, “Search for Syllogistic Structure of Semantic Information”, J. of Applied Non-Classical Logic, Vol. 22, 2012, pp. 101-127.
[12] M. J. Schroeder, “Quantum Coherence without Quantum Mechanics in Modeling the Unity of Consciousness”, in: P. Bruza et al. (Eds.) QI 2009, LNAI 5494, Berlin, Germany: Springer, 2009, pp. 97-112.
[13] M. J. Schroeder, “Semantics of Information: Meaning and Truth as Relationships between Information Carriers”, in C. Ess & R. Hagengruber (Eds.) The Computational Turn: Past, Presents, Futures? Proceedings IACAP 2011, Aarhus University – July 4-6, 2011. Munster: Monsenstein und Vannerdat Wiss., 2011, pp. 120-123.
[14] M. J. Schroeder, “Dualism of Selective and Structural Manifestations of Information in Modelling of Information Dynamics”, in: G. Dodig-Crnkovic, R. Giovagnoli (Eds.) Computing Nature, SAPERE 7, Springer, Berlin, 2013, pp. 125-137.
[15] M. J. Schroeder, “Crisis in science: In search for new theoretical foundations”, Progress in Biophysics and Molecular Biology, 2013, http://dx.doi.org/10.1016/ j.pbiomolbio.2013.03.003/
46
Proceedings of International Conference on Complexity, Cybernetics, and Informing Science and Engineering

Studying the Effects of Instance Structure in AlgorithmPerformance
Tania TURRUBIATES-LOPEZ
Computer Systems Engineering, Instituto Tecnologico Superior deAlamo TemapacheAlamo,Veracruz 92750, Mexico
Satu Elisa SCHAEFFER
Faculty of Mechanical and Electrical Engineering, Universidad Autonoma de Nuevo LeonSan Nicolas de los Garza, Nuevo Leon, 66450, Mexico
ABSTRACT
Classical computational complexity studies theasymptotic relationship between instance sizeand the amount of resources consumed in theworst case. However, it has become evidentthat the instance size by itself is an insufficientmeasure and that the worst-case scenario is of-ten uninformative in practice. As a comple-mentary analysis, we propose the examination ofstructural properties present in the instances andthe effects they have on algorithm performance;our goal is to characterize complexity in termsof instance structure. We propose a frameworkfor identifying and characterizing hard instancesbased on algorithm behaviour as well as a casestudy applying the framework on the graph col-oring problem.
Keywords. Algorithm performance, computa-tional complexity, instance difficulty, structuraleffects.
1. INTRODUCTION
It is intuitive that the difficulty of a problem in-stance varies with its size: large instances areusually harder to solve than small ones. How-ever, in practice, it is becoming recognized thatmeasuring complexity only in terms of the in-stance size implies overlooking any structuralproperty of the instance that could affect theproblem complexity [5]. Individual problem in-stances can be inherently hard, independent of
any particular algorithm used to solve the prob-lem [12].
In this work, we attempt a move towards apractical theory of structural computational com-plexity for graph problems that permits to char-acterize the inherent difficulty of instances ofequal size but different structure. To achievethis, we propose a framework for detecting struc-tural properties and their influence on algorithmperformance. We focus ongraph optimizationproblems and iterative (typically heuristic) algo-rithms, and propose a measure of algorithm per-formance to classify instances as easy or hard interms of the algorithm behaviour when workingtowards the optimum. It is important to empha-size that we attempt neither to rank nor to com-pare one algorithm to another in any sense, butinstead seek to rank and to compare the prob-lem instances themselves in terms of the diffi-culty that their solutions presents to a set of al-gorithms.
The most successful strategies to solve thisproblem employ knowledge of the search space1.Several efforts have been taken to characterizethe search space to extract information in orderto design more efficient algorithms, to choosethe best algorithms or heuristics, and to under-stand the behavior of the algorithms. These stud-ies indicate that there exists a relation betweenthe topology of the search space and the graphstructure [8, 13], and consequently an important
1The search space is the set of all possible solutions givena formulation of the objective functions and a set of con-straints.
47
Proceedings of International Conference on Complexity, Cybernetics, and Informing Science and Engineering
impact in the algorithm performance [15]. Muchwork remains to be done to understand how thealgorithm performance depends on the character-istics and the structure of the graph instance; ex-isting literature points out that there is in fact animportant influence, but with little experimentalresults to validate it.
The remainder of this paper is organized as fol-lows. Section 2 describes the proposed frame-work to study the effects of the instance struc-ture in algorithm performance, as well as, theproposed measure of performance. In Section 3,the proposed framework is applied to graph col-oring. Section 4 presents an analysis of the re-sults obtained. Finally, future research directionsand conclusions are drawn in Section 5.
2. FRAMEWORK TO STUDY THEEFFECTS OF INSTANCE STRUCTURE IN
ALGORITHM PERFORMANCE
We propose a framework for identifying thestructural properties of instances that affect thealgorithmic performance. We attempt to definethe necessary steps, summarized in the follow-ing subsections important considerations in howit should be carried out.
Problem selection
The selection of the computational problem fixesthe information required in each instance andalso the set of algorithms available. It is rec-ommended to choose a thoroughly-studied prob-lem for which theoretical and practical results areabundant and benchmark instances exist. Also,studying a problem to which many other prob-lems are reducible will be informative as the re-sults extends, at least to some degree, to the otherproblems that reduce to the selected object ofstudy.
Instance recollection
Importantly, we must be able to control or at leastmeasure the size of the instances as well as thestructural properties present in them in order tobe able to distinguish between the effect of in-stance size (the traditional complexity measure)and the structure of the instance (the object ofour proposed study). We implemented populargraph-generation methods include the followingfive: Erdos-Renyi (ER), Watts-Strogatz (WS),
Barabasi-Albert (BA), Kleinberg (KL), geomet-ric random graph (RGG). An important consider-ation to apply the framework is that the resultinggraph needs to beconnected.
Instance characterization
For each instance to be used in the study, a se-ries of measurements needs to be made in or-der to identify the structural properties presentin the instance. The minimal information usu-ally gathered of graphs include the degree mea-sures but using only degree-based information isinsufficient in characterizing the graph structure,we need to employ is a rich family of “structuralmetrics”; see the work of da F. Costa et al. [4] fora survey and our previous work [14, 9] for moredetails.
Algorithm selection
As our goal is to detect the properties of theinstances that make them difficult or easy, weshould not limit ourselves to one single algo-rithm, as the particularities of the algorithm couldout-shadow the effects of the instance structure inany subsequent experiment. Hence we need a setof algorithms, preferably the state of the art andwith different approaches into solving the prob-lem at hand.
It is also important to remember that the algo-rithms themselves are not in any way the objectof study, but rather the means. We do not aim torank the algorithms from better to worse, nor dowe wish to punish or reward the algorithms fortheir performance on a particular instance.
Measuring algorithm performance
Our goal is to be able to run two instances on aset of algorithms and then say for which instance,the algorithms had a harder time reaching a goodsolution. This can not be only in terms of the so-lution time nor only in terms of the resulting so-lution quality, as letting more iterations executewould usually improve the solution in any case.
We wish to measure how does the algorithmconverge towards its final solution, iteration byiteration. Does it stall, is there a constant im-provement, are there sudden jumps in the solu-tion quality, and so forth.
In Figure 1 a single algorithm with a singleparameter setup was used on several instancesof the same size but different structure; even for
48
Proceedings of International Conference on Complexity, Cybernetics, and Informing Science and Engineering
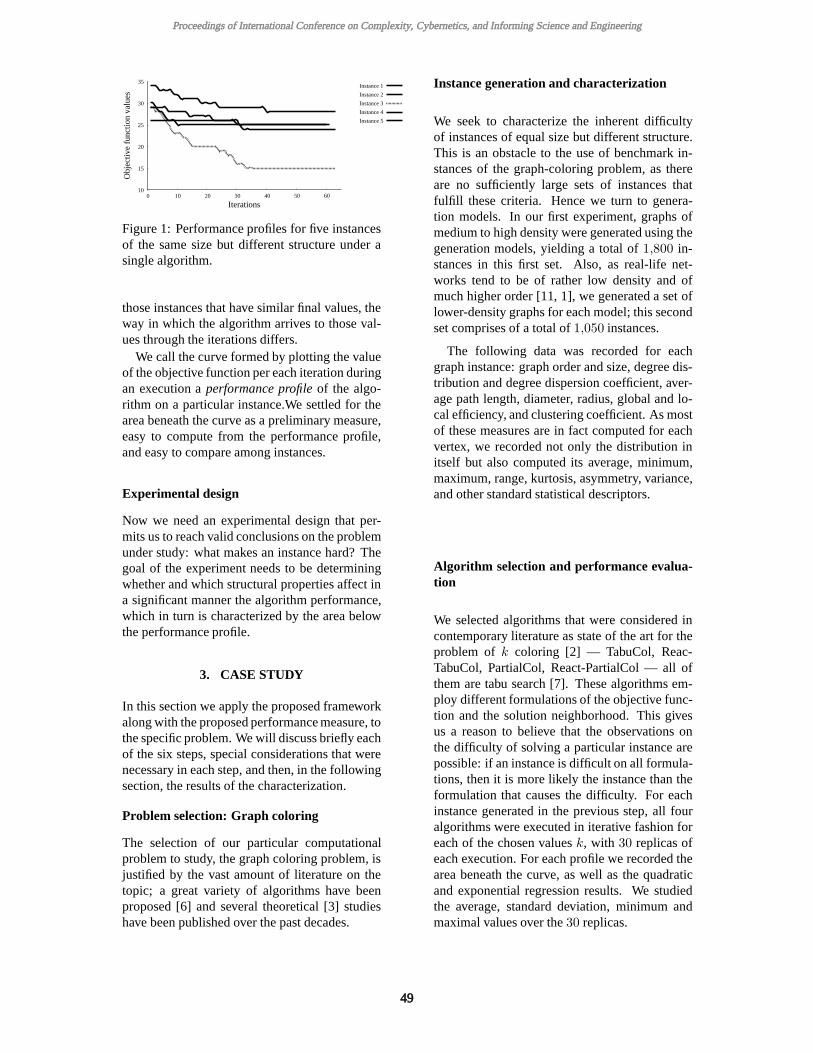
10
15
20
25
30
35
0 10 20 30 40 50 60
Obj
ectiv
e fu
nctio
n va
lues
Iterations
Instance 1
Instance 2
Instance 3
Instance 4
Instance 5
Figure 1: Performance profiles for five instancesof the same size but different structure under asingle algorithm.
those instances that have similar final values, theway in which the algorithm arrives to those val-ues through the iterations differs.
We call the curve formed by plotting the valueof the objective function per each iteration duringan execution aperformance profileof the algo-rithm on a particular instance.We settled for thearea beneath the curve as a preliminary measure,easy to compute from the performance profile,and easy to compare among instances.
Experimental design
Now we need an experimental design that per-mits us to reach valid conclusions on the problemunder study: what makes an instance hard? Thegoal of the experiment needs to be determiningwhether and which structural properties affect ina significant manner the algorithm performance,which in turn is characterized by the area belowthe performance profile.
3. CASE STUDY
In this section we apply the proposed frameworkalong with the proposed performance measure, tothe specific problem. We will discuss briefly eachof the six steps, special considerations that werenecessary in each step, and then, in the followingsection, the results of the characterization.
Problem selection: Graph coloring
The selection of our particular computationalproblem to study, the graph coloring problem, isjustified by the vast amount of literature on thetopic; a great variety of algorithms have beenproposed [6] and several theoretical [3] studieshave been published over the past decades.
Instance generation and characterization
We seek to characterize the inherent difficultyof instances of equal size but different structure.This is an obstacle to the use of benchmark in-stances of the graph-coloring problem, as thereare no sufficiently large sets of instances thatfulfill these criteria. Hence we turn to genera-tion models. In our first experiment, graphs ofmedium to high density were generated using thegeneration models, yielding a total of1,800 in-stances in this first set. Also, as real-life net-works tend to be of rather low density and ofmuch higher order [11, 1], we generated a set oflower-density graphs for each model; this secondset comprises of a total of1,050 instances.
The following data was recorded for eachgraph instance: graph order and size, degree dis-tribution and degree dispersion coefficient, aver-age path length, diameter, radius, global and lo-cal efficiency, and clustering coefficient. As mostof these measures are in fact computed for eachvertex, we recorded not only the distribution initself but also computed its average, minimum,maximum, range, kurtosis, asymmetry, variance,and other standard statistical descriptors.
Algorithm selection and performance evalua-tion
We selected algorithms that were considered incontemporary literature as state of the art for theproblem of k coloring [2] — TabuCol, Reac-TabuCol, PartialCol, React-PartialCol — all ofthem are tabu search [7]. These algorithms em-ploy different formulations of the objective func-tion and the solution neighborhood. This givesus a reason to believe that the observations onthe difficulty of solving a particular instance arepossible: if an instance is difficult on all formula-tions, then it is more likely the instance than theformulation that causes the difficulty. For eachinstance generated in the previous step, all fouralgorithms were executed in iterative fashion foreach of the chosen valuesk, with 30 replicas ofeach execution. For each profile we recorded thearea beneath the curve, as well as the quadraticand exponential regression results. We studiedthe average, standard deviation, minimum andmaximal values over the30 replicas.
49
Proceedings of International Conference on Complexity, Cybernetics, and Informing Science and Engineering
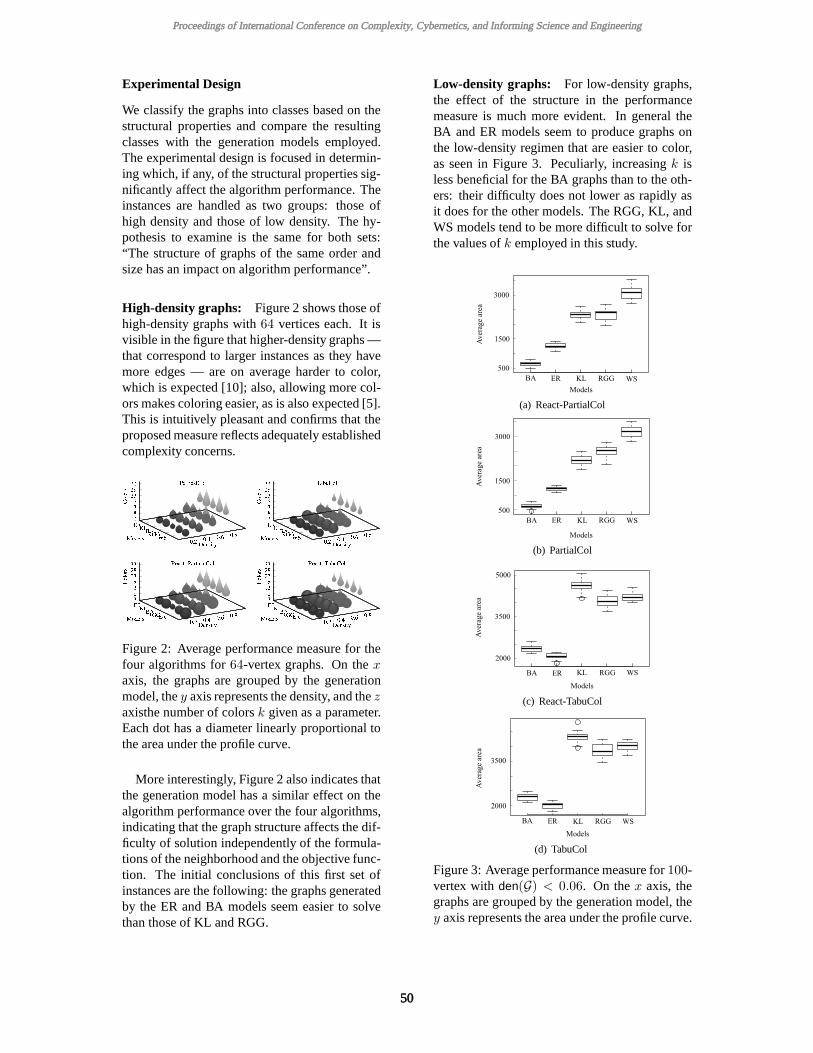
Experimental Design
We classify the graphs into classes based on thestructural properties and compare the resultingclasses with the generation models employed.The experimental design is focused in determin-ing which, if any, of the structural properties sig-nificantly affect the algorithm performance. Theinstances are handled as two groups: those ofhigh density and those of low density. The hy-pothesis to examine is the same for both sets:“The structure of graphs of the same order andsize has an impact on algorithm performance”.
High-density graphs: Figure 2 shows those ofhigh-density graphs with64 vertices each. It isvisible in the figure that higher-density graphs —that correspond to larger instances as they havemore edges — are on average harder to color,which is expected [10]; also, allowing more col-ors makes coloring easier, as is also expected [5].This is intuitively pleasant and confirms that theproposed measure reflects adequately establishedcomplexity concerns.
Figure 2: Average performance measure for thefour algorithms for64-vertex graphs. On thexaxis, the graphs are grouped by the generationmodel, they axis represents the density, and thez
axisthe number of colorsk given as a parameter.Each dot has a diameter linearly proportional tothe area under the profile curve.
More interestingly, Figure 2 also indicates thatthe generation model has a similar effect on thealgorithm performance over the four algorithms,indicating that the graph structure affects the dif-ficulty of solution independently of the formula-tions of the neighborhood and the objective func-tion. The initial conclusions of this first set ofinstances are the following: the graphs generatedby the ER and BA models seem easier to solvethan those of KL and RGG.
Low-density graphs: For low-density graphs,the effect of the structure in the performancemeasure is much more evident. In general theBA and ER models seem to produce graphs onthe low-density regimen that are easier to color,as seen in Figure 3. Peculiarly, increasingk isless beneficial for the BA graphs than to the oth-ers: their difficulty does not lower as rapidly asit does for the other models. The RGG, KL, andWS models tend to be more difficult to solve forthe values ofk employed in this study.
(a) React-PartialCol
(b) PartialCol
(c) React-TabuCol
(d) TabuCol
Figure 3: Average performance measure for100-vertex withden(G) < 0.06. On thex axis, thegraphs are grouped by the generation model, they axis represents the area under the profile curve.
50
Proceedings of International Conference on Complexity, Cybernetics, and Informing Science and Engineering
Table 1: Results of the ANOVA test.
Algorithm F0
PartialCol 1,340.99
React-PartialCol 1,146.09
TabuCol 1,307.60
React-TabuCol 1,647.60
Statistical results: As mere graphical observa-tion is not a sufficient tool when the differencesare slight, we also apply statistical tests. We usethe model
yij = µ+ τi + ǫij , (1)
wherei andj identify the instance and its genera-tion model,yij is the area under the profile curve,µ a global average,τi the effect of the graphstructure (identified by the generation model),andǫij a random error. There areN = 30 repli-cas per observation. We study the hypothesisthat the effect of the graph structure is nil, mean-ing that the algorithm performance is statisticallyequal for all generation models. We use ANOVAfor each algorithm. The rejection criterion is setasF0 > Fα, a−1, N−a, with a significance levelα = 0.05 and a power of0.916.
The analysis of variance for100-vertex graphswith den(G) < 0.06 andk = 3 is shown in Ta-ble 1. For each algorithm we haveF0.05, 4, 25 =2.76. This allows us to conclude that thereis a significant effect in algorithm performancecaused by the instance structure, regardless of thealgorithm used in the experiment2.
This type of analysis was carried out for allgroups of instances, when density is increased,the values of theF0 statistics decrease, indicat-ing that the differences in algorithm behaviourare less and less evident. For all4 algorithms, itwas found that the instances generated with KL,WS, and RGG were more difficult to solve thanthose generated with the BA and ER models.
Classification of instances We are aiming toidentify structural properties that differentiateamong the easy and difficult instances, we exe-cuted a clustering algorithm the goal is explorewhat characteristics differ for the easy and thehard instances, see Figure 4.
The most difficult instances were those with ahigh value of the clustering coefficient, whereas
2We examined the assumptions of normality as requiredfor the analysis of variance to be valid.
the easiest were those with much lower values ofthe clustering coefficient, also standard deviationof degree are, for the graph coloring problem, arelevant structural properties.
0
0.1
0.2
0.3
0.4
0.5
0.6
0.7
0 1 2 3 4 5 6
Clu
ster
ing
coef
ficen
t
Standard deviation of the degree distribution
ER
BA
WS
KL
RGG
Figure 4: A projection to the structural metrics ofthe standard deviation of the degree distributionand the clustering coefficient.
4. CONCLUSIONS AND FUTURE WORK
The experimental results from the case study in-dicate that the proposed measure adequately re-flects the effect of the instance structure in the al-gorithm performance in the graph-coloring prob-lem, which we believe to be representative ofmany interesting classes of graph problems andcombinatorial optimization in general.
In our case study, graphs that turned out to bedifficult were those of RGG, KL, and WS, whichhave higher values of the clustering coefficient.It is of future interest to statistically verify the re-lationship of the clustering coefficient and stan-dard deviation of degree and the algorithm per-formance.
A line of future work is structural optimiza-tion: given a graph and a computational problem,as well as indicating whether one desires for theproblem to be easy or hard, gradually modifyingthe structure of the graph until it falls into the de-sired regimen of the values of the (approximated)structural properties. One can also impose a bud-get that limits the amount and extent of modifica-tion imposed on the structure.
5. ACKNOWLEDGMENTS
This work has been supported by the UANL un-der grants PAICYT IT553-10, and the CONA-CyT (2010–2011) under grant 49130.
51
Proceedings of International Conference on Complexity, Cybernetics, and Informing Science and Engineering

6. REFERENCES
[1] Reka Zsuzsanna Albert.Statistical mechan-ics of complex networks. PhD thesis, Uni-versity of Notre Dame, Notre Dame, IN,USA, 2001.
[2] Ivo Blochliger and Nicolas Zufferey. Agraph coloring heuristic using partial solu-tions and a reactive tabu scheme.Comput-ers & Operation Research, 35(3):960–975,2008.
[3] G. Chartrand and P. Zhang.ChromaticGraph Theory. Chapman & Hall/CRC,Boca Raton, FL, USA, 2008.
[4] L. da F. Costa, Francisco A. Rodrigues,G. Travieso, and V.P Villas Boas. Char-acterization of complex networks: A sur-vey of measurements.Advances in Physics,56(1):167 – 242, January 2007.
[5] J. Flum and M. Grohe.Parameterized com-plexity theory. Springer-Verlag, Secaucus,NJ, USA, 2006.
[6] Phillipe Gallinier and Alan Hertz. A surveyof local methods for graph coloring.Com-puters & Operations Research, 3:2547–2562, 2006.
[7] Fred Glover and Manuel Laguna.TabuSearch. Kluwer Academic Publishers, Nor-well, MA, USA, 1997.
[8] J.P. Hamiez and J.K. Hao. An analysisof solution properties of the graph coloringproblem. Applied Optimization, 86:325–346, 2003.
[9] Tania Turrubiates Lopez. Clasificacion deredes complejas usando funciones de car-acterizacion que permitan discriminar en-tre redes aleatorias, power-law y expo-nenciales. Master’s thesis, Instituto Tec-nologico de Ciudad Madero, November2007.
[10] R. Mulet, A. Pagnani, M. Weigt, andR. Zecchina. Coloring random graphs.Physical Review Letters, 89(26):268701,2002.
[11] M. E. J. Newman. The structure and func-tion of complex networks.SIAM Review,45:167–256, 2003.
[12] P. Orponen, K. Ko, U. Schoning, andO. Watanabe. Instance complexity.Jour-nal of the ACM, 41(1):121, 1994.
[13] Daniel Cosmin Porumbel, Jin-Kao Hao,and Pascale Kuntz. A search space “cartog-raphy” for guiding graph coloring heuris-tics. Computers & Operations Research,37(4):769–778, 2010.
[14] Satu Elisa Schaeffer. Algorithms fornonuniform networks. Research ReportA102, Helsinki University of Technology,Laboratory for Theoretical Computer Sci-ence, Espoo, Finland, April 2006. Doctoraldissertation.
[15] K.A. Smith-Miles, R.J.W. James, J.W. Gif-fin, and Tu Y. Understanding the relation-ship between scheduling problem structureand heuristic performance using knowledgediscovery.Lecture Notes in Computer Sci-ence, 5851:89–103, 2009.
52
Proceedings of International Conference on Complexity, Cybernetics, and Informing Science and Engineering

ABSTRACT
This paper explores the notion of scholarly inquiry from a variety of science education perspectives. Such a perspective allows the individual to view scientific phenomenon from a variety of epistemologies when solving socio-ecological problems in the field. Concept models are used to simplify relationships towards understanding social-ecological systems as communication tools. Models quantitatively deliver empirical data, define questions and concepts, generate hypothesis, make predictions and determine the relationship between the whole and parts. Models explore ways to create new paths and determine what we know and what don’t. Proper translation by using conceptual modeling can improve implications when making social and interdisciplinary connections. Common language for interdisciplinary research includes a place for human and ecology, and questions about processes and functions using scales. Scientist or social scientist when communicating dynamically about their topics in field studies or in their discipline should be able to shift gears when relating to papradigms such as from pragmatism, to interpretism or constructivism, or postmodernism to bracketing such as in case study. Paradigm shifting is necessary when collaborating & solving complex worldwide interdisciplinary field problems regarding natural resource management. It can also advance the design of new courses and interdisciplinary programs at universities.
Keywords: Interdisciplinary concept models, paradigm shifting, socio-ecological inquiry, methodologies, epistemologies, natural resource management, Global field study research.
INTRODUCTION
How do epistemologies and methodologies from other disciplines connect to make sense and how does such a lens zoom in on the research as it is applied to multiple contexts, and disciplines?
In the vast arena of contextual interpretation and the uni –dialect that currently exists one need to be able communicate across variable economic, social, historical, physical and natural systems. The interpretations lack concrete evidence and cause and effect strategies which often get disguised and transposed to look at an entirely different set of meaning and constructs. For me this takes time and life experiences that teach to understand and translate. Reflexivity can get one there faster.
When addressing knowledge based research the problem arises when focusing on context and meaning. The proper translation and conceptual modeling can have implications for social and interdisciplinary connections. The structure of scholarly inquiry from a science education perspective allows the individual to view scientific phenomenon from a variety of epistemologies to solve problems.
Educational philosopher John Dewey, suggest that we solve problems by using our past experiences and connecting them to things we currently know about. Modern philosopher, Thomas Kuhn discusses the structure of scientific revolutions by experiencing a paradigm shift. If we look at the disciplines in nature, culture and religion we may reveal a deeper understanding of social issues and science. Thinking possible….when thinking of the ability to frame shift within and among paradigms in science and history the book the Structure of Scientific Revolutions by Thomas Kuhn comes to mind.
THOMAS KUHN’S SUGGESTIONS Thomas Kuhn is well known for his attempts to
vindicate the nature and existence of scientific and social paradigm revolutions. He talks of using illustrations and examples to visualize the revolutions which appear as scientific knowledge. The reason for this view is that scientists use their image from an authoritan source (such as text book, philosophical work and popular representation). The text usually disguises the existence of the scientific revolution. The text uses popular representation and philosophical work to address problems of data, and theory, committed to a set of paradigms when they were written. Textbooks try to keep up with the scientific terminology of the day. Popular models attempt to explain applications in a language closer to everyday life. The philosophy of science analyzes the structure of the body of knowledge. All three (text book, philosophy, popular models) display the outcome of past revolutions and thus display the bases of normal scientific tradition.
DEVELOPMENTAL PATTERNS
A dominant mature text will differentiate its
developmental patterns from other fields. Textbooks, the pedagogical vehicle for normal science have to be rewritten after each scientific revolution. Once rewritten they hide the role or existence of the revolution that produced them. Unless the author has lived through the revolution they only write about the most recent revolution that they have experienced. Textbooks then replace the discipline’s history and supply a substitute for what was eliminated or estimated to be true. Scientific textbooks refer only to the work that contributes to statements and solutions of paradigm shifts.
ORIENTATION
Scientists skew the history because the results of
scientific research show no dependence on historical context of the inquiry and except during crisis or revolution the scientist’s position is accepted. More scientific detail could highlight the things that were meant to be deleted. Scientists traditionally look deeply into science facts and misrepresent historical facts. Whitehead quotes “a science that hesitates to forget its founders is lost”. (p.138) Kuhn says that science does need its heroes. What results are consistent tendencies to make the history of science seem linear which affects scientists when even looking back at their own work. For example, Dalton was interested in chemical problems of combining proportions early on that he was famous latter for solving. All of Dalton’s work omits the
Paradigm Shifting through Socio-ecological Inquiry: Interdisciplinary Topics & Global Field Study Research
Christine M. YUKECH
Secondary Science Education, Curriculum & Instruction The University of Akron Akron, Ohio 44325, U.S.
53
Proceedings of International Conference on Complexity, Cybernetics, and Informing Science and Engineering

revolutionary effects of applying to chemistry questions restricted to physics and meteorology. This new orientation taught chemists how to solve new problems and new conclusions from old data. It is this sort of change that accounts for empirical discoveries and transition from Aristelian to Galilean to Newton dynamics.
MISCONCEPTIONS RELATED TO PARADIGM SHIFTING
Misconstructions render revolutions invisible. The
arrangement of material in a science text implies a process that if existed would deny the revolution a function. The aim tends to be to quickly orient the science student to what the scientific community thinks it knows, so various textbooks, concepts, laws, theories of current normal science present the science separate from the true natural connecting the events. Information becomes presented linear instead of dynamic.
Science has taken place by a series of individual
discoveries and inventions, that when gathered together present a body of modern technical information. Scientists add information to the paradigms like bricks in a wall one after the other. Kuhn says this is not the way science develops. Many of the puzzles of contemporary normal science did not exist until after the most recent scientific revolution. It is hard to trace back their scientific origins. The problems haven’t changed but rather the whole nature of fact and theory has shifted. Dalton fitted associations with theory and fact to earlier chemical experience as a whole changing that experience in the process. Theories do not evolve to fit the facts. Fact and theory merge together to form a revolutionary reformation with preceding tradition. CONCEPT DEVELOPMENT NOTIONS THROUGH THE
IMAGE OF SCIENTIFIC EXPERTS Another example of the impact of textbook on the
image of scientific development was with elementary chemists where text must discuss concepts of chemical elements. This concept is almost always represented by the seventeenth-century chemist Robert Boyle who Skeptical Chemist has provided the reader the ability to find a definition closer to that in science today.
Like time ‘energy’, ‘force’, or ‘particle’ the concept of element is often not invented or discovered at all. Boyle’s definition can be traced back to Aristotle and forward through Lavoisier into modern texts. Both Lavoisier and Aristotle changed the chemical significance of ‘element’ but they did not change the verbal formula that serves the definition. Einstein did not have to redefine ‘space’ and ‘time’ in order to give them meaning within his work. Robert Boyle then was a leader in a revolution that changed the relation of ‘element’ to chemical manipulation and chemical theory. He transformed the notion into a tool different from before and this in turn changed the chemist and world of chemistry. Other revolutions like this one centered on Lavoisier gave form and function to the concept. Boyle gives examples of stages of development of what happens to the process when existing knowledge is in text. That pedagogic form has determined our image of the nature of science and the role of discovery and invention in its advance.
My Opinion: If we did fit the facts to fit the context of subject matter (of the time) than the concepts that arise would create a deeper understanding of the material being studied. It
seems as though Kuhn was trying to pinpoint addressing pedagogical issues of science literacy. He found good examples with Boyle, Dalton, and Aristotle.
HOW DO WE FIT EXISTING KNOWLEDGE WITH PAST KNOWLEDGE AND STILL HAVE IT MAKE
SENSE? That is the puzzle when dealing with text. If you take
a term out of context then how to you reconnect it or fit it in with its process or function or meaning for that matter. Revolutions become invisible when we don’t recognize that this takes place.
Thomas Kuhn’s explains that historical and scientific paradigms need to synergize in order for meaning making across them. He tries to use a formula to help the reader shift gears when understanding the meaning of the new normal or accepted constructs. He seems to be explaining how the scientific community interprets the new.
CONSTRUCTIVE INTERPRETIVE PARADIGM AND
INTERDISCIPLINARY CONCEPT MODELS
To branch from Thomas Kuhn’s ideas of scientific social revolutions to one of scientific social constructive interpretive paradigm shift further I decided to discuss the article entitled, ‘Insight Conceptual Models as Tools for Communication Across Disciplines,’ by Heemskerk, M., K. Wilson, and M. Pavao-Zucherman. The article explores systems and determines the parts and processes. To understand the complex interdisciplinary science concepts models were used as communication tools. In this article models are used to construct meaning across disciplines. Constructivism tries to construct and deconstruct meaning. I believe the concept models tried to get at the root of what the scientists knew about. The interpretive part came through processing the knowledge and communicating ideas across disciplines. The conceptual models were interpreted among interdiscipnary scholars at various field research sites. Concept models were used to simplify relationships towards understanding social-ecological systems.
The conceptual models more or less quantitatively
delivered by abstract or empirical data define questions and concepts which generate hypothesis and predictions and determine the relationships between whole parts. Models explore the behavior which helps to explore new paths and to determine what we know and what don’t know.
MODEL BUILDING PROFESSIONAL DEVELOPMENT
Professional development groups were established and
taught in 2.5 hour designed courses. The groups consisted of interdisciplinary teams of young scientists of social-ecological systems using meta data from long term ecological research sites across the United States. This type of collaboration helps to understand human intentions and behaviors and ties the ecology and social science together. The model building professional development workshops helped the participants develop questions, determine system boundaries, gaps in current data, and provide thoughts and predictions from the group. The workshop organizers were on board with INGERT or Integrative Graduate Education
54
Proceedings of International Conference on Complexity, Cybernetics, and Informing Science and Engineering

RESEARCH AND TRAINING UNIVERSITY PROJECT SITES
Research and training took a long term project made
up of 26 participants from 11 Universities throughout the United States. Most of the participants were graduate students, but few were professionals and Post doctorate researchers. The research took place over 6 L.T.E.R. sites in Michigan, Oregon, Puerto Rico, and Israel and the Everglades. The goals were to share the pros and cons learned about model building and processing models as a tool for interdisciplinary work.
SCIENTIST PARTICIPANTS
Scientists from different fields are more likely to be able to communicate and interpret information about diverse social systems, including forests, desert, northern lakes, agricultural systems, and urban landscapes. Workshop participants were divided into their skilled backgrounds whether quantitative or qualitative, human or natural systems. They were also sorted into applied or theoretical, social scientist or natural scientist. The lessons learned were common language for interdisciplinary research, the place for human and ecology, and questions about processes and functions using scales.
COMMON LANGUAGE
Common language became a process so that
restoration was not just lip service or a patch to an ecological problem but a real solution to a real world problem in the field. The ideas of community and scale at each L.T.E.R. site needed differentiation. The processing also allowed for values, ideas, opinions, and beliefs into one box representing human mental ideas which were discrepant to the social scientist way of thinking. The social scientists discuss how human behavior is caused by human values and behaviors acted out. For example, a hydrologist needs to know the requirements of the people that live at different vantage points of a mountain in order to design the right systems to collect and utilize a water shed.
PARTICIPANT CONCEPT MODELS AND MAPS
Concept maps include the following types of symbols, energy pathways and flow, consumer transformation of energy, dialectic field, and propaganda to promote something.
The products of the workshop reveal and suggestions for solving interdisciplinary problems distinguished between types of people, (fishers or farmers), types of behaviors, (political or economic), mental processes, (values and attitudes). Ecological systems problems are easier to reveal as daphnia and fish do not complain when their behavior is under represented. Each field representation explains the socio-ecological suggestions for solving the management of natural resources.
CONCEPTUAL MODELS & SCALES DETERMINE NATURAL RESOURCE MANAGEMENT
The groups discussed how scales can determine the
management decisions that the social and interdisciplinary research problem solving reveals. The models main internal drivers are economic, ethical, political, social, and ecological sustained. The model conveys that by collecting and publishing data scientists can influence regional development and ecosystem management.
The models were good for producing interpretive
discussion which helped determine the things that the research
scientists agreed or disagreed about. They also were constructed by the interdisciplinary research teams so that they could interpret data and rationalize results. There is hope that this type of communication will try sort anthropogenic and biological factors that push for ecological change. The communication needs to be synergetic in that they need to cross many boundaries. It can however clarify research questions and designs. For a true interpretive shift to take place the policy makers, concept models, anthropologists, ecologists, biologists and social scientists need to look beyond just details and agendas and listen to the problems at the site communicated from multiple entities.
THE RESEARCH FIELD STUDIES
The Florida coast Everglades’ field site analyzes for
regional forces that control population diversity. The study researches how human use of water affects the aquatic biological communities. The Israel Ecological research site shows how human decision making affects the social and ecological factors that affect grazing conditions in semi-arid shrub lands in South Israel. The Kellogg Biological Station problem was to show how land use has changed over time, and how these changes feed back into linked social ecological systems. The model suggests that population growth will create extra demands on water resources. The Luquillo Experimental Forest Long Term Ecological research site, discusses the cause and effect of increased tourism in the Luquillo Porto Rico site. Future development might cause problems for the coastal forests and wetlands, which include habitat for endangered species, nesting beaches for leather back sea turtles and coral reef communities. The Andrews Experimental Ecological research site shows how public perceptions of research influences local resource use and management. The Central Arizona Phoenix Long-term ecological research site documents the long-term change in use and role in shaping the urban recreational, agricultural, and desert landscapes of today.
My Opinion: I think the article needed to discuss how the concept models helped to explain and interpret the ways to communicate and define and diagnose the problems in the field. There was more talk about the resource management then the way the concept tools were used to diagnose communication problems then ways to engage the new knowledge and employ it in the field.
BRACKETING THROUGH CASE STUDIES/STORIES THAT REVEAL SOLUTIONS USING A
PHENOMENOLOGICAL PARADIGM- GETTING THE TRUTH THROUGH CONTEXTUAL STORIES
The article Barriers and Facilitators to Integration
among Scientists in Transdisciplinary Landscape Analyses: A Cross-Country Comparison, by Christine Jakobsen, Tove Hels, & William McLaughlin falls within the phenomenological paradigm. This paradigm I chose to write about talks of bracketing the paradigm to hold constant and remove the influence of possible distractions. These ideas transmute through a cascading effect where the bracketing causes a phenomenological shift to reveal underlying reasons of the problems presented and ways to solve them. The study consisted of two groups, one group of scientists and the other made up of scientists, government agencies and policy makers. In order to get to the roots of the interdisciplinary communication case studies, bracketing was used to help differentiate what kinds of things became themes or strands that the groups agreed with or came to a consensus about.
55
Proceedings of International Conference on Complexity, Cybernetics, and Informing Science and Engineering

My Opinion: The case studies became a good way to diagnose how the groups began to understand each other’s interdisciplinarity. However, I didn’t feel the meaning of the research problems were clearly defined. Instead of solutions related to the field sites and regulating policies, it became a meaning making of the communication among the groups and their various disciplines.
PRAGMATISM TO SOLVING PROBLEMS SOLVING
THROUGH A POST MODERN PARADIGM The final article chosen for analysis is called Bridges
and Barriers to Developing and Conducting Interdisciplinary Graduate-Student Team Research by Pincus, M., Force, J., and Wulfhorst. This article chooses a frame of research questions addressing the impact of land-use change or payments for environmental services. Problem definition and pragmatism helped to determine what type of integration or ways to understand the research questions and dilemmas. As the integration ranged from disciplinary to trans disciplinary a shift in gears from a pragmatic definition or frame of the research questions to moving to a wider disciplinary/interdisciplinary postmodern lens. A transdisciplinary case study was then used to diagnose solutions created by the teams about the field sites. This brought the research to life giving it new meaning in a phenomenological frame. To truly be a change agent one needs to be able to shift gears and follow through with a critical awareness of putting the solutions into action. This takes time, money, collaboration cooperation and the ability to understand the soci-ecological issues that needed of remediation and repair.
The article spells out how the interdisciplinary research teams began to expand beyond traditional research barriers. The research group or what is called I.G.E.R.T. or Integrated Graduate Research of Higher Education, sometimes referred to as CATIE is a NSF interdisciplinary and International funded grant initiative through the University of Idaho Tropical Agricultural Research and Higher Education center in Idaho and Costa Rica with the theme of biodiversity conservation and sustainable production of anthropogenic fragmented landscape. I.G.E.R.T. consisted of 18 doctoral students in 4 cohorts over 2 years. Their backgrounds included; botany, economics, entomology, forest ecology, wildlife and plant genetics, hydrology, remote sensing, rural sociology, soil science and wildlife biology. Student’s coursework took place in the College of Natural Resources, College of Agriculture and Life Science and Environmental Science. Five research teams operated in agricultural and forested landscapes in Costa Rica and Idaho, and the USA. (3 in Costa Rica and 2 in Northern Idaho). I.G.E.R.T. fellows were involved in an interdisciplinary effort to study conservation biology and sustainability issues. Four cohorts of students are working closely with their UI and CATIE advisors, as well as other UI and CATIE graduate students. Students from different disciplinary backgrounds, including biological, physical and social sciences, work together in the cohorts and conduct comparative and cooperative research projects across ecological settings and disciplines.
BARRIERS
Barriers include the ability to address complex scientific dilemmas with disciplinary specialization which does not guarantee the ability to solve complex problems.
Crossing the barriers requires; A. Funding/Time – joint proposal writing/doctoral preliminary exams B. Cross disciplinary cooperation/ integrated technical training
D. Getting around turfism E. Getting around egos F. Getting past differences in methodologies
DESIGN OF THE RESEARCH
The design of research questions integrates theoretical knowledge with practical problem solving. The research outcomes need to impact the knowledge structures of each represented disciplinary product constructing ways to create a critical awareness towards understanding the needs for interdisciplinary research. The project wanted to produce graduate students with interdisciplinary backgrounds who had accurate knowledge in chosen disciplines with technical, professional and personal skills to help them become their own career leaders and creative agents for change. Issues with the methods such as individual, disciplinary, and programmatic themes become a bridge or barrier. The spectrum of integration of the project required coordination, collaboration, combined inquiry, sharing, creation, synthesis of the knowledge among the research from various disciplines.
TRAINING AND RESOURCES ISSUES
Training and resource provided bridges and barriers
for technical training which was provided through integrated networks. Funding took place through a three year graduate stipend that provided funding for professional travel. The groups were given time for joint proposal writing, doctoral exams and coordinated proposal writing.
Recommendations for accountability and communication strategies
• Developing formal and informal
communication strategies • Select team members thoughtfully and
strategically to address temporal and spatial scale issues
• Recognize and respect timing issues • Define focal themes and research questions
jointly and clearly • Emphasize problem definition and team
proposal writing • Target interdisciplinary training identify
mentors on team integration
My Opinion: I really like the dynamic approach when trying to solve such a large scope of social biodiverse ecological problems. I think starting with a spelled pragmatic approach connecting theory to practice and then shifting gears to a post modern way of applying the ideas and putting things into action in the field helps make the study more meaningful. Considering I would love to work with such a program and have experienced many similar field research projects I think this approach works when narrowing in on the socio- cultural issues at each field site. When working with the integrated bioscience program at Akron the missing link is experiencing the project in the field.
Integrated Bioscience and Field Study Experiences:
This semester 11 doctoral students of various disciplinary specialty backgrounds at the University of Akron were asked to communicate across boundaries to form research topics that
56
Proceedings of International Conference on Complexity, Cybernetics, and Informing Science and Engineering

have been addressed before. There were natural tendencies for groups to sort into comfort zones pertaining to research specialties. Our group ended up with three main topics, Atrazine in bioremediation zones, slugs with chloroplast processing abilities and a new science puzzle logic teaching method that helps to show the pathways students use when determine how students reason and solve real world problems in an Anatomy & Physiology course. I thought this article did a good job of crossing and shifting paradigms by switching from pragmatism to solving postmodern problems with a phenomenological case study approach. It was hard to narrow this article down because as the research grew it gained steam in its potential impact to help cross bridges and barriers when related to interdisciplinary research topics.
CONCLUSION
The articles included in this paper presents a dynamic
way of defining, describing, interpreting and constructing ways of putting the theory into practice to solving problems by being able to see them through different paradigms. For a true interpretive shift to take place the policy makers, anthropologists, ecologists, biologists and social scientists need to look beyond just details and agendas and listen to the problems at the field sites communicated from multiple entities. I felt it necessary to include the article about forest policy as it gets to the roots of transferring meaning across many social issues and disciplines by using bracketing as in case study to look closely at the details and values behind the need for bioremediation and policy making. In order for socio-ecological change to take place there needs to be a platform for creating the space to dialogue and use conceptual models that find a way to put the ideas into motion.
REFERENCES
[1] Morse, W.C., Nielson-Pincus, Force, J., & Wulfhorts,
J, D. 2007. Bridges and Barriers to [2] Developing and Conducting Interdisciplinary
Graduate Student Team Research. Ecology & Society 12(2):8
[3] Heemskerk, M., K. Wilson, and Pavao-Zuckerman. 2003. Conceptual models as tools for communication across disciplines. Conservation Ecology 7(3): 8.
[4] Jackobsen, C., Hels, T., McLaughlin, W. 2004. Forest Policy and Economics. 6 15-31.
[5] Kuhn, T. 1962. The Structure of Scientific Revolutions. The Chicago Press.
57
Proceedings of International Conference on Complexity, Cybernetics, and Informing Science and Engineering

The Optimization of Formative and Summative Assessment by Adaptive Testing
and Zones of Students Development
Victor Zvonnikov
The Ministry of Education and Science, State University of Management
Moscow, Russia
and
Marina Chelyshkova
The Ministry of Education and Science, State University of Management
Moscow, Russia
ABSTRACT
In article the approach to optimization of formative and
summative assessment by optimum scores item
difficulties during carrying out of adaptive test is
described. This optimisation is based on connection of
the concept about zones of
development and mathematical models of the modern
theory of tests Item Response Theory. By this
connection some inequalities are resulted, which are
allowing to allocate items for maintenance of
development during formative assessment and to
minimise the measurement error at carrying out
summative assessment.
This inequalities are supplemented with the personal
characteristic curves illustrating zones of
developmen. The steepness of personal characteristic
curve constructed by means of two-parametrical model, is
interpreted as parametre of structure
knowledged.
Keywords: zone of development,
Item Response Theory, ability parameter, difficulty
parameter, formative assessment, summative assessment,
one-parametrical model, two-parametrical model,
structure of knowledge, likelihood function,
adaptive test.
THEORETICAL PRECONDITIONS
The differences among individuals have strong effect on
learning results. Issuing the important relation between
individual differences and learning results has a very long
history in Russia. In 30 and 40th years known Russian
psychologist L.Vygotsky was engaged in research of this
relation. He suggested the concept about three zones of
learner development: zone of actual development, zone
of nearest development and zone of learner s perspective
development. At Soviet schools in 40 - 60th
it was
considered to be that cognitive abilities of all pupils can
be developed to the same degree. If it does not occur for
particular learner, the teacher is guilty - he was not giving
sufficient attention to development such learner. In 70
and the next years certain progress was outlined. It was
recognized that the challenge of improving learning and
performance largely depends on correctly identifying
characteristics of a particular learner. So theorists and
teachers began to analyze the reasons of result
distinctions in achievements and to interpret them not
only in the context of training methods and teacher work
quality, but also in connection with individual differences
in abilities [6].
The concept of Vygotsky has had the further
development in Zankov researches. . He has entered the
training principle at high level of difficulty when training
and control for each learner will be organized by means
of the most difficult items. In 60-80th
some Russian
schools began to create experimental didactic systems
where the training principle at high level of difficulty
items had the central place in activity. However these
theoretical postulates could not be effectively realized in
training practice as lacks of a traditional training and
quality monitoring systems did not allow realizing the
principle. The items selection on high difficulty
level for each learner was carried out intuitively that quite
often led to excess of item difficulties when they did not
provide [7].
The researches in sphere of Item Response Theory (IRT)
and development in this theory some mathematical
models have allowed comparing the learner level of
ability and level of item difficulty. The idea of
comparison has been realized in adaptive testing on the
basis of item selection by the equation the
scores of ability parameter and the scores of difficulty
[3]. These scores are associated
with zone of actual development. The equation
helps to optimize item selection for summative
assessment because it provides high estimations
reliability score. But it does not
provide the organization of formative assessment when
the development of learners is realizes on the basis of
more difficult items performance [4] .
58
Proceedings of International Conference on Complexity, Cybernetics, and Informing Science and Engineering
Such scores are associated with zone of learner s nearest
development.
THE RULES FOR OPTIMIZATION ITEM
SELECTION IN FORMATIVE AND SUMMATIVE
ASSESSMENT BY ADAPTIVE TESTING AND IRT.
We tried to solve the problem of optimum items selection
for current scores in formative and summative assessment
together with idea of L.Vygotsky and to formalize this
individualization zones by mathematical models of IRT.
So we suggested some inequalities which are offered
correspond to various zones of on
the base of Rasch model of IRT for summative and
formative assessment. In adaptive testing the value of
probability of correct item performances for summative
assessment is set by the inequality | i ( i - ) - 0,5 | <0,1,
where i- level of i th
learner ability, - difficulty of items
and all item are locally independent.
Within the one-parametrical model G. Rash [1] Eq.(1) it
is possible to write probabilities as ij in the form of
)(7,1
)(7,1
1 ji
ji
e
ePij
jieQij
1
1 and ij = 1 - Qij and
j - difficulty of j th
item. (1)
After some transformations of inequality for probability
of correct item concerning parameter difficulty we have
values in the range - 0,20 < i - or i
) - 0,24 < i - ) + 0,20, taking into
account borders of a confidential interval for parameter
estimations at a significance value = 0,05. Such items
correspond zone of actual development and they
are optimum for summative assessment on the base of
adaptive testing.
The probability of correct item performance
corresponding on difficulty to zone of the nearest
development is defined by an inequality 0,2 < i i -
<0,4. From here, as well as earlier, it is easy to receive
the range for the i - - 0,80
i - -0,20. After some transformations, taking into
account borders of a confidential interval, we have the
range of estimations for corresponding to zone of the
nearest development i i + 0,80 or i +1,96Se
i - Such items
correspond zone of nearest development and
they are optimum for formative assessment on the base of
adaptive testing.
Last received inequality helps to rethink the connection
between training principle at high level of
difficulty and a principle of availability in training and to
enter the formalized characteristic. If any learner carries
out the items from the interval i i + 0,80, it
is possible to realize the principles of availability and
optimum high difficulty items simultaneously in adaptive
testing during formative assessment. For instruction to be
maximally effective, it should use by formative
assessments such items.
The subsequent possible values of probability of correct
item performance is set by inequality 0,6 < i i -
and corresponds to situations when items are too difficult
for the organisation of adaptive training during formative
assessment. From this inequality the range of item
difficulty parameter values i can be correlate
to zone of the further perspective development.
Such assessments can provide the basis for planning of
subsequent instruction. These conclusions are shown on
figure 1.
Figure 1. Geometrical interpretation of intervals for item
difficulties withp Personal curves of examinee
The first interval corresponds too easy items at which
activity proceeds on the basis of already come to
the end cycles of development. The second interval
corresponds zone of actual development. The
third interval - difficult items which correspond to zone
of the nearest development. The fourth interval -
too difficult items concerning zone of the further
perspective development.
It is more interesting to delimitate the inequalities for
zones of development by two-parametrical
model of IRT [2], where the probability of correct
performance for different learners with ability can be
given by formula Eq.(2)
dzePjja z
i
)(
2
2
2
1)(
, and
2)(1
)(
jbis
jbisj
r
ra and rbis - biserial correlation
coefficient (2)
As well as earlier the probability of correct item
performance corresponding on difficulty to level of actual
development is defined by inequality | i [ai i - - 0,5
| <0,1 and product ai i - interval
(0,20; 0,24). Unlike the situation considered above within
one-parametrical model, now the range of estimations of
item difficulty parameter values corresponding to zone of
59
Proceedings of International Conference on Complexity, Cybernetics, and Informing Science and Engineering

i th
learner actual development will be defined not only
by i, but also by value ai. So for i th learner in the
assumption of positive values ai the inequality looks
i - 1/ai i + 1/ai
KNOWLEDGE STRUCTURES
For two-parametrical model of IRT
the structure of knowledge can be estimated by
[5]. As the value of ai
depends on number of errors in pattern it
is quite reasonably to correlate it with quality of
knowledge structure. By results of similar correlation
simply enough to draw the general conclusion: the higher
steepness of personal curve corresponds the
better structure of knowledge. It is shown by
figure 2.
Figure 2. Personal curves of examinees with equal levels
of ability, but various values of parameter i
Inequality i - 1/ai i + 1/ai allows to
draw an interesting conclusion about length of interval on
an axis of item difficulties. In case of i th
learner structure
of knowledge high quality, corresponding to great values
ai, borders of interval i - 1/ai i + 1/ai
for the organisation effective adaptive summative
assessment decreases / If values of parameter ai begin to
decrease, the width of interval defined by i -
1/ai i + 1/ai increases. Noted effect
shows influence the value of structure parameter on
borders of a zone of actual development which is quite
clear and co-ordinated with training experience
accumulated by each teacher.
ALGORITHMS FOR FORMATIVE AND
SUMMATIVE ASSESSMENT BY ADAPTIVE
TESTING
Algorithms of assessment demand rescoring
ability after performance every item of the adaptive test.
If we use new symbol j instead of accepted earlier
probability of the right answer Pj and designate
observable dichotomizing results of examinee answers of
the adaptive test by symbols {x1, x2 j k} (j = 1,
we can enter likelihood function for Rasch
model scores on k step of adaptive testing Eq.(3)
k
j
x
j
x
jkjj TTL
1
1)](1[)]([)( (3)
where Lk ( ) - likelihood function.
The a posterior estimations of parametre
after performance k looks like Eq.(4) Q
q
Q
q
kkk tqWtqLtqWtqLtq1 1
),()(/)()( (4)
where tq quadrature points dividing the interval of
possible distribution of measured variable from - 4 to
+4 logits For the
chosen number of quadrature points tq+1 - tq = 0,1 and q =
w (tq) - weights in quadrature points,
recalculated after performance of each next item of the
adaptive test and and Eq.(5) Q
q
tqW1
)1)(( (5)
Lk (tq) - values of likelihood function in quadrature points.
The a posterior estimation of standard deviation for
looks like Eq.(6)
Q
qk
Q
vkk
S
tqWtqL
tqWtqLtq
1
2
)(
)()(
)()()(
2
1
(6)
Where Sap - a posterior estimation of standard deviation.
THE ANALYSIS OF RESULTS
It is possible to formulate some conclusions creating the
necessary preconditions for optimization of formative and
summative assessment by adaptive testing and zones of
students development:
- item selection for adaptive testing with difficulty i +
i + 0,80 corresponding to zone of
actual development allows to optimise summative
assessment;
- - item selection for adaptive testing with difficulty i -
0,24 < i + 0,20 corresponding to zone of
nearest development allows to optimise formative
assessment;
- it is exists mutual influence between possible values of
parameter and width of zones of nearest
development. At small values of parameter (ai <1)
and small values the width of a zones depend, basically,
from fraction value 1/a.
REFERENCES
1. Applying the Rasch Model: Fundamental
Measurement in the Human Sciences / Bond T.G.,
Fox CM. Lawrence Erlbaum Associates, 2007.
2. Baker F.B. Item Response Theory: Parameter
Estimation Techniques. ASC. Univ. Ave, 2004.
60
Proceedings of International Conference on Complexity, Cybernetics, and Informing Science and Engineering

3. Computerized Adaptive Testing : Theory and Practice
/ Ed. by Wim J. van der Linden and Cees A.W. Glas.
London: luwer academic publishers, 2003.
4. . Measurement and Assessment in Schools / Ed. by
B.R. Wormen, K.R. White, Xitao Fan. R.R. -
Sudweeks, 2004.
5. Weiss D.J. (Ed.) New Horizons in testing. N.-Y. :
Academic Press, 1983.
6. .
7.
61
Proceedings of International Conference on Complexity, Cybernetics, and Informing Science and Engineering

Pattern-Based Enterprise Systems: Models, Tools and Practices
Dr. Sergey V. Zykov, Ph.D.
National Research University Higher School of Economics, Moscow, Russia
szykov@ hse.ru
Abstract
Building enterprise software is a dramatic challenge
due to data size, complexity and rapid growth of the both
in time. The issue becomes even more dramatic when it
gets to integrating heterogeneous applications.
Therewith, a uniform approach is required, which
combines formal models and CASE tools. The suggested
methodology is based on extracting common ERP module
level patterns and applying them to series of
heterogeneous implementations. The approach includes
an innovative lifecycle model, which extends conventional
models by: formal data representation/management
models and DSL-based CASE tools supporting the
formalisms. The approach has been implemented as a
series of portal-based ERP systems in ITERA
International Oil and Gas Corporation, and in a number
of trading/banking enterprise applications elsewhere. The
works in progress include semantic network-based airline
dispatch system, and a 6D-model-driven nuclear power
plant construction methodology.
1. Introduction
The paper outlines the new technology for large-scale
integrated heterogeneous applications. Currently,
multinational enterprises possess large, geographically
distributed infrastructures. Each of the enterprises
accumulates a huge and rapidly increasing data burden. In
certain cases, the data bulk exceeds petabyte size; it tends
to double every five years. Managing such data is an
issue. The problem is even more complex due to
heterogeneous data, which varies from well-structured
relational databases to non-normalized trees and lists, and
weak-structured multimedia data. The technology
presented is focused at more efficient heterogeneous
enterprise and uniform data management procedures. It
involves a set of novel mathematical models, methods,
and the supporting CASE tools for object-based
representation and manipulation of heterogeneous
enterprise systems data. The architecture is portal-based.
2. Managing the enterprise systems
Unfortunately, a brute force application of the so-
called “industrial” enterprise software development
methodologies (such as IBM RUP, Microsoft MSF,
Oracle CDM etc.) to heterogeneous enterprise data
management, without an object-based model-level
theoretical basis, results either in unreasonably narrow
“single-vendor” solutions, or in inadequate time-and-cost
expenses. On the other hand, the existing generalized
approaches to information systems modeling and
integration (such as category and ontology-based
approaches, Cyc and SYNTHESIS projects
[2,7,8,10,12,13]) do not result in practically applicable
(scalable, robust, ergonomic) implementations since they
are separated from state-of-the-art industrial technologies.
A number of international and federal research programs
proves that the technological problems of heterogeneous
enterprise data management are critical [11].
Thus, the suggested technology of integrated
development and maintenance of heterogeneous internet-
based enterprise software systems has been created. The
approach is based on rigorous mathematical models and it
is supported by software engineering tools, which provide
integration to standard enterprise-scale CASE tools,
commonly used with software development
methodologies. The approach eliminates data duplication
and contradiction within the integrated modules, thus
increasing the robustness of the enterprise software
systems (ESS). The technology takes into consideration a
set of interrelated ESS development levels, such as data
models, software applications, “industrial”
methodologies, CASE, architecture, and database
management.
The technology elements include: conceptual
framework of ESS development; a set of object models
for ESS data representation and management; engineering
tools, which support semantic-oriented ESS development
and intelligent content management, i.e., the
ConceptModeller tool and the intelligent content
management system (ICMS) [18,19]; portal architecture,
ESS prototypes and full-scale implementations [16,19].
3. Modeling the enterprise lifecycle
For adequate modeling of heterogeneous ESS, a
systematic approach has been developed, which includes
object models for both data representation and data
management [18-20]. The general technological
framework of ESS development provides closed-loop,
62
Proceedings of International Conference on Complexity, Cybernetics, and Informing Science and Engineering
two-way construction with re-engineering. The latter
feature is really critical for ESS verification, which
critically increases system robustness and reliability.
The general technological framework of ESS
development contains stages, which correspond to data
representation forms for heterogeneous software system
components, communicating in the global environment.
Such data representation forms include natural language,
mathematical models, engineering tools integration, and
content management. The data representation forms are
further detailed by the representation levels.
Content-oriented approach to ESS data management
allows data/metadata generalization on the common
model basis, uniform managing heterogeneous objects,
and adequate modeling of the internet environment,
which is critical for ESS robustness and reliability.
The object nature of the “class-object-value” model
framework provides compatibility with traditional
OOAD, as well as with other certain promising
approaches ([15], [17]) and helps to extend the mentioned
approaches to model the ESS internet-based
environments. The following technological
transformation sequence, according to the models
developed, is suggested: (i) a finite sequence object, such
as a !-calculus term [1]; (ii) a logical predicate - higher
order logics is used; (iii) a frame as a graphical
representation [14]; (iv) an XML object, with the class
declaration generated by the ConceptModeller
engineering tool [18]; (v) a UML diagram, where the data
scheme is as a part of the ESS (meta)data warehouse.
Therewith, the warehouse content representation is
based on semantic network situation model, which
provides intuitive transparency for problem domain
analysts when they construct the problem domain
description. The model can be ergonomically visualized
through a frame-based notation. W arehouse content
management is modeled as a state-based abstract machine
and role assignments, which naturally generalizes the
processes of similar engineering tools, such as (portal
page template generation, portal page publication cycle,
role/access management etc. Therewith, the major content
management operations are modeled by the abstract
machine language. The language has a formal syntax and
denotation semantics in terms of variable domains.
4. Managing SSDL: sequential elaboration
The ConceptModeller engineering tool [18] assists in
semantically-oriented visualized development of
heterogeneous ESS data warehouse scheme. Therewith, a
semantic network-based model is suggested, which works
in nearly natural-language terms, intuitively transparent to
problem domain analysts. Model visualization is based on
frame representation of the warehouse data scheme.
Thus, due to deep integration with mathematical
models and state-of-the-art CASE toolkits, the
ConceptModeller tool provides a closed-loop, continuous
ESS development cycle (from formal model to data
warehouse scheme) with a re-engineering feature.
Therewith, frames are mapped into specific ordered lists.
The ICMS tool is based on an abstract machine
model, and it is used for problem-oriented visualized
heterogeneous ESS content management and portal
publication cycle. The ICMS tool features a flexible
content management cycle and role-based mechanisms,
which allow personalized content management based on
dynamically adaptive access profiles and portal page
templates. Due to scenario-oriented content management,
the ICMS provides a unified portal representation of
heterogeneous data and metadata objects, flexible content
processing by various user groups, high data security, a
higher ergonomics level and intuitively transparent
complex data object management. Therewith, the data
object classes of the ESS warehouse are represented by
order lists of <attribute, type> format, and templates – by
ordered lists of <attribute, type, value> format.
5. Pattern-based development for enterprise
systems
The general ESS development framework [19,20]
potentially allows application of a “spiral-like” lifecycle
to the general ESS development framework, which
includes sequential elaboration of ESS warehouse scheme
after each iteration of the development cycle. Another
benefit is ESS “tuning”, specifically, ESS software and
data warehouse component-wise improvement, by
applying a “spiral-like” lifecycle and subsequent
verification. Also, requirement “tracing” implemented is
possible through reverse engineering and/or verification,
and followed by correction and/or optimization. As for
building a repository of ESS “meta-snapshots”, the
system could be “reincarnated” to virtually any previous
state using component-wise strategy. Also, building a
“pattern catalogue” [6] for heterogeneous ESS, based on
the integrated repository of various ESS state “meta-
snapshots”. Further, developing a repository of
“branches” makes possible “cloning” slight ESS
variations for the “basis”. As for the DSLs, it is possible
to develop a formal language specification [3] for ESS
requirement specification; let us call it Requirement
Specification Language or RSL. Finally, the existing ESS
“meta-snapshot” repository components can be adjusted
to match the new requirements, and the desired
components can be reused.
Thus, the ESS development framework implies
software lifecycle variations according to waterfall, spiral,
evolution, and incremental approach. Though ESS
63
Proceedings of International Conference on Complexity, Cybernetics, and Informing Science and Engineering

development framework tends to be iterative, in certain
cases, the waterfall model is possible and reasonable.
An essential feature of the general ESS development
framework is its two-way organization. The approach
provides reverse engineering possibility both for ESS in
general, and their components in particular. The practical
value of the approach is provided by the verifiability of
heterogeneous ESS components at the uniform level of
the problem domain model, which is practically
independent upon the hardware and software environment
of the particular component. Therewith, a major
theoretical generalization is a possibility of
mathematically rigorous verification of the heterogeneous
ESS components by a function-based model. A critical
issue for engineering practice of huge and complex ESS,
is that the models suggested are oriented at a very
promising “pure” objects approach, which is a strategy of
the state-of-the-art enterprise-level component
technologies of Microsoft .NET and Oracle Java, where
any program entity is an object.
An essential benefit of the approach suggested is a
possibility of adaptive, sequential “fine tuning” of ESS
heterogeneous component management schemes in order
to match the rapidly changing business requirements.
Such benefit is possible due to the reverse engineering
feature of the integrated general iterative framework of
ESS development. The reverse engineering is possible
down to model level, which allows rigorous component-
wise ESS verification. Thus, conventional reengineering
and verification can be enhanced by flexible correction
and “optimization” of the target ESS in strict accordance
with the specified business requirements. This is possible
due to the suggested model-level generalization of the
iterative, evolutionary ESS development framework.
Another benefit of the suggested ESS development
framework is a possibility of building a “catalogue of
templates for heterogeneous ESS”, which is based on an
integrated metadata warehouse, i.e., a “meta-snapshot”
repository. Thus, the software development companies
get a solution for storing relatively stable or frequently
used configurations of heterogeneous ESS. The solution
allows avoiding the integration problems of “standard”
ESS components and/or combinations. The approach
allows serious project savings for clients due to ESS
developer’s “meta-snapshot” repository with a number of
similar integrated solutions to the system required.
The above consideration gives way for “meta-
snapshot” repository development, which stores the
chronological sequence of ESS solutions as a tree with
the “baseline” version and slightly different “branches”
for ESS variations. This is analogous to software
engineering tools for version control. The approach
allows a reasonable selection of most valuable
deliverables of the ESS lifecycle phases, and organization
of similar solution “cloning”. Therewith, the “clones”
may be created both for different client enterprises, and
for different companies of a single enterprise.
Further discussion could cover the prospective areas of
“meta-snapshot” repository development. First of all, to
describe the metadata warehouses and the related
enterprise-level business requirements it seems
reasonable to develop new DSL-type problem-oriented
meta-languages. Let us call them the MetaW arehouse
Description Language (MW DL) and the Requirement
Specification Language (RSL) respectively. Further, the
formal models, outlined in the paper and given a more
detailed coverage [19,20], allow interrelating the RSL and
MW DL entities. Semantic-oriented search mechanisms
based on semantic networks with frame visualization will
assist in revealing the components of ESS “meta-
snapshot” repository, which provide the closest matching
to the new requirements. The approach potentially allows
terms-and-cost-effective and adequate transforming of the
existing ESS components in order to match the new
requirements with minimum corrections effort and,
consequently, with minimum labor expenses. Therewith,
the global perspective it becomes possible to reuse certain
ESS components for current or new clients. Selection
criteria for such “basic” components may be percentage
of reuse, ease of maintenance, client satisfaction, degree
of matching business requirements etc.
6. Portal-Based Implementation: ITERA Oil-
And-Gas Group
The methodology has been approved by internet and
intranet portals in ITERA International Group of
Companies. In terms of system architecture, the portals
provide assignments with certain content management
rights, e.g. view, modify, analyze, and generate reports.
Problem-oriented form designer, report writer, online
documentation and administration tools make an
interactive interface toolkit. The enterprise warehouse
supports integrated storage of data and metadata.
During the design stage, problem domain model
specifications are transformed by the ConceptModeller
SDK to UML diagrams, then by Oracle Developer/2000
integrated CASE tool – to ER diagrams and, finally, into
target IS and enterprise content warehouse storage
schemes. Portal implementation process included fast
prototyping and full-scale integrated Oracle-based
implementation. The fast portal prototype has been
designed to prove adequacy of the content-based data
models, methods and algorithms. Upon prototype testing,
a full-scale ESS portal-based toolkit has been
implemented. W eb pages automatically generated by the
enterprise content management system are published at
ITERA Group intranet portal and official internet site.
64
Proceedings of International Conference on Complexity, Cybernetics, and Informing Science and Engineering

Portal architecture has been designed, implemented
and customized according to technical specifications
outlined by the author and tested for several years in a
heterogeneous enterprise environment. Implementation
terms and costs have been reduced about 40% compared
to commercial software available, while features range
has been essentially improved. Advanced personalization
and content access level differentiation substantially
reduces risks of the enterprise data damage or loss.
Upon customizing theoretical methods of finite
sequences, categories, semantic networks, computations
and abstract machines, a set of models have been
constructed including problem domain conceptual model
for enterprise content dynamics and statics as well as a
model for development tools and computational
environment in terms of state-based abstract machines,
which provide integrated object-based content
management in heterogeneous enterprise portals. For the
model collection, a generalized development toolkit
choice criteria set has been suggested for information
system prototyping, design and implementation.
A set of SDKs has been implemented including
ConceptModeller visual problem oriented CASE-tool and
the content management system. According to the
conceptual approach, a generalized interface solution has
been designed for Internet-portal, which is based on
content-oriented architecture with explicit division into
front-end and back-end sides. To solve the task of
building the architecture for enterprise content
management, a fast event-driven prototype has been
developed using ConceptModeller toolkit and
PowerScript and Perl languages. After prototype testing, a
full-scale object-oriented enterprise content management
portal-based architecture has been implemented. The full-
scale enterprise portal has been customized for content
management and implemented in a 10,000 staff
enterprise. The obtained results proved reducing
implementation terms and costs as compared to
commercial software available, and demonstrated high
scalability, mobility, expandability and ergonomics.
Portal design scheme is based on a set of data models
integrating object-oriented management of (meta)data.
The data models used integrate methods of finite
sequences, category theory, computation theory and
semantic networks and they provide enterprise content
management in heterogeneous interoperable globally
distributed environments. Due to the approach, costs of
enterprise content management, maintenance and
integrity support have been essentially reduced, while
portal modernization, customization and performance
optimization procedures have been simplified. The results
obtained have been used for development of a number of
portals in ITERA Group: CMS, intranet/internet portals.
The models, methods and SDKs make a foundation for
portal-based enterprise content management in ITERA
International Group of Companies. According to ITERA
experts, the portal implementation has resulted in a
substantial annual cost reduction, while content
management efficiency has increased essentially.
7. Domain-Driven Messaging System for a
Distributed Trading Company
A trading corporation used to commercially operate a
proprietary Microsoft .NET-based message delivery
system for information exchange between the
headquarters and the local shops. The system was client-
server based. The client included a local database and a
W indows-based messaging service, while the server side
consisted of a W eb service and central database. The
operation/maintenance challenges were: complicated
client-side code refactoring; difficult error
localization/reduction; inadequate documentation; and
decentralized configuration monitoring/management for
remote shops. To solve the problems mentioned, an
approach based on domain-driven development [5] and
Domain Specific Languages (DSL) has been suggested.
The approach included problem domain modeling and
DSL development for managing problem domain objects.
The DSL-based model helped to conquer problem
domain complexity, to filter and to structure the problem-
specific information. It also provided a uniform approach
to data representation and manipulation. W e used an
external XML-based DSL, which extended the scope of
the enterprise application programming language [9]. The
methodology instance included the following steps: DSL
scope detection, problem domain modeling, DSL notation
development, DSL restrictions development, and DSL
testing. The approach was client-side focused, since this
is the most changeable and challenging task. Lifecycle
model is iterative, the solution is based on a redesigned
architecture pattern. The W indows service is a constant
part of the application, which contains a DSL parser. The
DSL parser input is a current message transfer map.
The DSL scope included rules/parameters of message
transfer, and new types of messages. Different shops may
have different configuration instances, which made the
client-side message processing/transfer structure.
The next methodology stage was building DSL-based
semantic object model [9]. W e got three object types:
messages, message transfer channels and message
transfer templates. DSL describes object metadata, i.e.,
configurations and manipulation rules. Templates were
core model elements, and channels were links between
template instances. Templates and channels together
made message maps. DSL described the maps, i.e. the
static part of the model, while messages referred to
system dynamics and states.
65
Proceedings of International Conference on Complexity, Cybernetics, and Informing Science and Engineering

Templates define actions with messages, i.e. transform
or route them. Templates were grouped into the
IMessageProcessingPattern interface. Standard routing
templates were: content-based router, filter, receiver list,
aggregator, splitter, and sorter. W e also produced a
number of domain-specific templates for system
reconfiguration, server interaction, etc. Channels were
used for message management. In the graph of map
messaging, templates are represented as nodes, while
channels are arcs between certain templates. In our case,
two types of channels were implemented: “peer-to-peer”
channel and error messages channel. Based on DSL
classes, messaging maps were built, which were later
used by parser to generate system configuration. At this
stage, DSL syntax and semantics were built. Each
messaging map, generally, a script, was instantiated by a
file. Messaging map was built as an XML document,
which defined system configuration and contained
templates for routing, message processing, transfer
channels and their relationships.
W hile parsing messaging map, the parser creates
channel objects based on DSL channel descriptions. Then
it configures the messaging system by creating message
processing objects in a similar way. Finally, the parser
instantiates the I/O channels, and creates the required
relationships between channels and message processor.
The resulting DSL-based system configuration was
functionally identical to the initial, !#-based one.
DSL-based refactoring resulted in an enterprise trade
management system with transparent configuration and a
standard object-based model. The DSL developed solved
the problem of messaging management. Since changes
are chiefly localized within the transfer configuration, the
change management has been dramatically simplified.
The DSL-based methodology conquered complexity,
made the proprietary system an open, scalable, and
maintainable solution. The approach is easily customized
to fit a broad class of similar proprietary systems.
8. The Air Transportation Planning System
for Russian Central Transportation Agency
Air traffic planning system is an area of work-in-
progress. The problem is to develop remote access to the
planning data. An operating solution currently exists.
However, it is based on an outdated TAXXI-Baikonur
technology, which is no longer evolving after early
2000s. The technology involves component-based
visualized assembling of the server application. The
ready-made VCL library components from Borland had
been integrated with proprietary TAXXI components.
The client side is an XML browser, i.e. a "thin" client.
The TAXXI technology is limited Microsoft W indows
framework, which is the only possible basis for both
client and server-side applications. According to the State
Program of Planning System Updates, the Main Air
Traffic Management Centre is going to create the new
remote access solution. The internet-based architecture is
to be implemented in Java technology and to operate on
the Apache web server platform. The solution is to query
Oracle-based data centre, process the query output and
retrieve the results of the air traffic planned capacities to
an intuitive and user-friendly GUI.
The practical application of the solution is the global
enterprise-scale integrated system, which is providing a
uniform and equal information access to all of the
international air traffic participants. The similar
globalization processes are underway in Europe and the
U.S.A. The suggested pattern-based and component-wise
approach is going to unify the issues of the architecture-
level update and application migration in Russia. The
methodology will also simplify the integration challenges
of the global air traffic management software solution.
9. 6D-modeling for nuclear power plants
Another challenging aspect of the methodology
implementation is related to high-level template-based
software re-engineering for nuclear power plants (NPP).
To provide worldwide competitive level on the nuclear
power plant production, it is necessary to meet the quality
standards throughout the lifecycle, high security under
long-term operation, terms-and-costs reduction for new
generation facilities development. The above conditions
could be satisfied only under a systematic approach,
which combines state-of-the-art production potential,
advanced control methods, and software engineering
tools. Each stage of the NPP lifecycle is mapped into a set
of business processes, where people and ESSs interact.
Identifying operation sequences, the systems form
business process automation standards. For example,
workflow mechanisms can assist in building enterprise
standards on electronic documents validation and
approval. During a certain NPP lifecycle, the enterprise
systems acquire information on it. Finally, each of the
enterprise systems reveals certain NPP aspects: design,
technology, economics etc. Thus, various objects, the
systems together describe NPP as a huge object.
Heterogeneous nature of the data objects, and millions of
units, make NPP a high complexity information object.
A major competitiveness criterion in nuclear power
industry is a set of electronic manuals, which helps to
assemble, troubleshoot, repair NPP etc. Such manual set
provides transparent information models of NPP (units),
which allow getting information on the object without
directly contacting it. Such a versatile description,
combined in a single data model is often referred to as a
6D model, which includes 3D-geometry, time and
resources for operating the plant. Since mechanisms for
66
Proceedings of International Conference on Complexity, Cybernetics, and Informing Science and Engineering
information searching, scaling, filtering and linking,
should provide complete and non-contradictory results,
the information models should have well-defined
semantics. The uniqueness of data entry assumes
information model data acquisition by the enterprise
systems throughout the lifecycle. W hile a single
information model can be derived out of a single system,
the 6D model should combine information models of a
number of systems. The methodology for 6D model
suggests portal-based system integration, which can be
based on a “platform” capable of entire lifecycle support.
The further information model development assumes
monitoring system state changes and their influence to the
other parts of the system. This helps to immediately react
on critical issues in NPP construction, which can be used
for decision making. A wrong decision would be made
otherwise under incomplete or incorrect information.
Among major nuclear industry issues is a concept of
typical optimized nuclear reactor. The idea is to select
typical invariant units for rapid “template-based”
development of a slightly varying versions set. Applying
the suggested methodology to the 6D information model
of the reactor, is a promising approach to pattern-based
component-wise NPP series development.
11. Conclusion
Implementation of the suggested approach allowed to
developing a unified ESS, which integrates a number of
heterogeneous components: state-of-the-art Oracle-based
ERP modules for financial planning and management, a
legacy HR management system and a weak-structured
multimedia archive. The implementation of internet and
intranet portals, which manage the heterogeneous ESS
warehouse content, provided a number of successful
implementations in diversified ITERA International
Group of companies, which has around 10,000 employees
in nearly 150 companies of over 20 countries. The
systematic approach to ESS framework development
provides integration with a wide range of state-of-the-art
CASE tools and ESS development standards.
Other implementations and work-in-progress areas
include: air transportation planning system, messaging
system for a trading enterprise, a nuclear power plant and
banking solutions. Each of the implementations is a
domain-specific one, so the system cloning process is not
straightforward, and it requires certain analytical and
CASE re-engineering efforts. However, in most cases the
approach reveals patterns for building similar
implementation in series, which results in substantial
term-and-cost reduction of 30% and over. The series can
be applied both to subsidiaries, as it has been done in
ITERA and is being done in Renaissance, and to different
enterprises, as in case of the other clients.
References [1] Barendregt H.: The lambda calculus (rev. ed.), Studies in
Logic, 103, North Holland, Amsterdam, 1984 [2] Birnbaum L., Forbus K., W agner E. et al.: Combining
analogy, intelligent information retrieval, and knowledge
integration for analysis: A preliminary report. In: ICIA 2005,
McLean, Virginia, USA, 2005 [3] Cook S., Jones G., Kent S., W ills A.C.: Domain-Specific
Development with Visual Studio DSL Tools, Pearson
Education, Inc, 2008, 524 pp. [4] Curry H., Feys R.: Combinatory logic, Vol.1, North Holland,
Amsterdam, 1958
[5] Evans E.: Domain-Driven Design: Tackling Complexity in
the Heart of Software. Addison W esley, 2003, 560 pp. [6] Fowler M.: Analysis Patterns: Reusable Object Models,
Addison W esley, 1997, 223 pp. [7] Guha R., Lenat D.: Building Large Knowledge-Based
Systems: Representation and Inference in the Cyc Project.
Addison-W esley, 1990 [8] Güngördü Z., Masters J.: Structured Knowledge Source
Integration: A Progress Report. In: IKIMS 2003, Cambridge,
MA, USA, 2003 [9] Hohpe G., W oolf B.: Enterprise Integration Patterns:
Designing, Building, and Deploying Messaging Solutions.
Addison W esley, 2003, 736 pp.
[10] Kalinichenko L., Stupnikov S.: Heterogeneous information
model unification as a pre-requisite to resource schema
mapping. In: ITAIS 2009, Springer, 2009, pp.373-380
[11] Kanazawa S., Fujiwara M. et al.: R&D Trends for Future
Networks in the USA, the EU, and Japan. NTT Technical
Review, Vol. 7, No.5, May 2009, p.p.1-6 [12] Lenat D., Reed S. Mapping Ontologies into Cyc. In: AAAI
CWOSW 2002, Edmonton, Canada, 2002 [13] Panton K., Reed S., et al.: Automated OW L Annotation
Assisted by a Large Knowledge Base. In: ISWC 2004,
Hiroshima, Japan, 2004, pp. 71-80 [14] Roussopulos N.: A semantic network model of databases.
Toronto Univ., 1976 [15] Scott D.: Lectures on a mathematical theory of
computations. Oxford Computing Laboratory Technical
Monograph. PRG-19, 1981, 148 pp.
[16] Sushkov, N.; Zykov, S.: Message system refactoring using
DSL. In: CEE-SECR’09, Moscow, Russia, 2009, pp.153-158 [17] W olfengagen V.: Event Driven Objects. In: CSIT'99,
Moscow, Russia, 1999, pp.88-96 [18] Zykov S.: Concept Modeller: A Frame-Based Toolkit for
Modeling Complex Software Applications. In: IMCIC 2010,
Orlando, FL, USA, pp. 468-473
[19] Zykov S.: Pattern-Based Development of Enterprise
Systems – from Conceptual Framework to Series of
Implementations. In: ICEIS 2011, Beijing, China, 2011,
SciTePress, Vol.4, pp. 475-478
[20] Zykov S.: Pattern Development Technology for
Heterogeneous Enterprise Software Systems. Journal of
Communication and Computer, Vol.7, No4, David Publishing
Co., 2010, pp.56-61
67
Proceedings of International Conference on Complexity, Cybernetics, and Informing Science and Engineering

68
Proceedings of International Conference on Complexity, Cybernetics, and Informing Science and Engineering

AUTHORS INDEX
Allidina, Alnoor 7 Ammann, Eckhard 1 Błaszczyk, Jacek 7 Balvetti, R. 13 Bargellini, M. L. 13 Battaglia, M. 13 Befort, Marcel 31 Botticelli, A. 13 Bozanceff, G. 13 Braseth, Alf Ove 16 Brunetti, G. 13 Casadei, G. 13 Chelyshkova, Marina 58 Djuraev, Simha 22 Filippini, A. 13 Guidoni, A. 13 Koolma, Hendrik M. 25 Malinowski, Krzysztof 7 Monat, André S. 31 Normantas, Vilius 37 Øritsland, Trond Are 16 Pancotti, E. 13 Puccia, L. 13 Rubini, L. 13 Schaeffer, Satu Elisa 47 Schroeder, Marcin J. 41 Tripodo, A. 13 Turrubiates-López, Tania 47 Yitzhaki, Moshe 22 Yukech, Christine M. 53 Zampetti, C. 13 Zvonnikov, Victor 58 Zykov, Sergey V. 62
69
Proceedings of International Conference on Complexity, Cybernetics, and Informing Science and Engineering