childhood obesity the west midlands...
TRANSCRIPT

A partnership with
Department of Health West
Midlands demonstrating
significant health outcomes
21st
September 2010
Childhood Obesity
The West Midlands
Consortium

Today’s agenda
• Update on MEND’s national data
• West Midlands Consortium Outcomes
• Benchmarking Outcomes
• Updates and Developments

Research and Evaluation

Clinical trials
Feasibility Study 2002-
2003
Pilot 2004-2005
UK RCT 2005-2007
UK Rollout 2007-9
2nd UK RCT &
population level
analysis 2010+
Australia RCT
2010+
US RCT 2011+

Efficacy Trial:
UK RCT (2005-7)
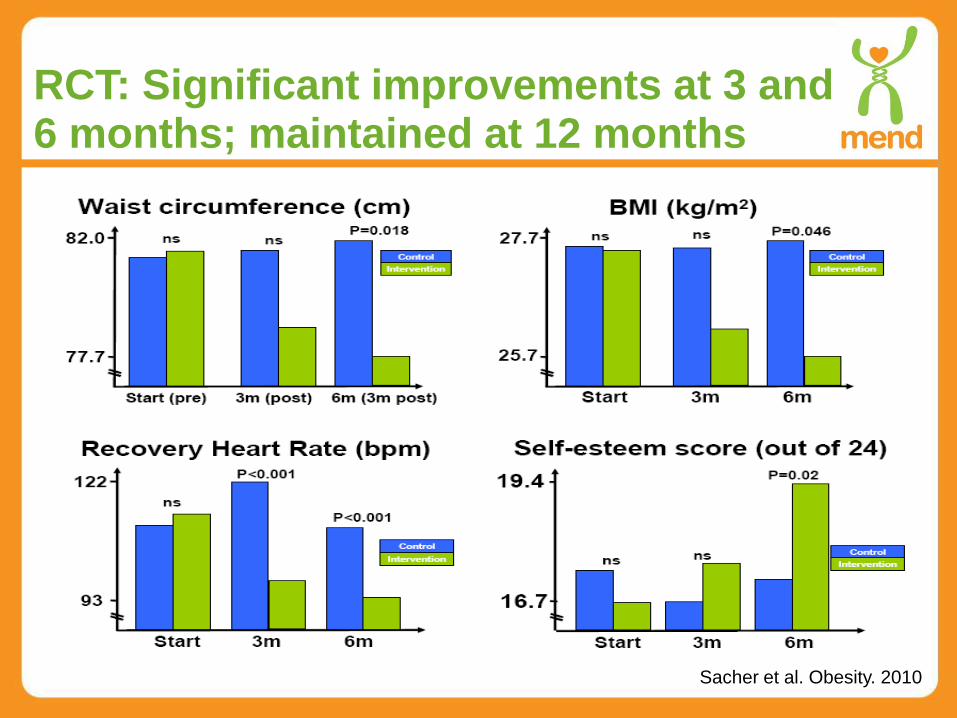
RCT: Significant improvements at 3 and 6 months; maintained at 12 months
Sacher et al. Obesity. 2010

From Efficacy to
Effectiveness Trials

UK rollout data (2007-9)
• Children: 9,754
• Girls: 55%
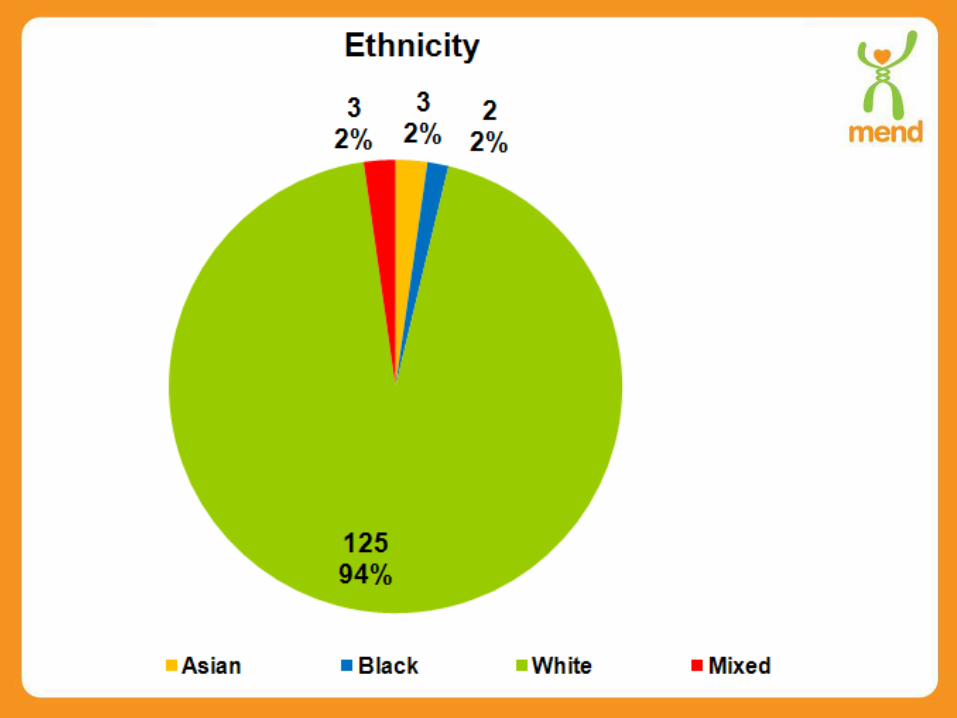
• Minorities: 23.4% (UK: 7.9%)
• Single parents: 33% (UK: 24%)
• SES: 48% don’t own home (UK: 31%)
• Mean age: 10.4 (±1.7) years
• Mean BMI z-score: 2.8 (±0.6)(UK %) = UK national average

UK locations

Data cleaning
Potential number eligible for inclusion:
9754 children
Data discarded on following criteria:
• Height and weight outliers
• Outliers for psychometric measures
• BMI outliers
• Age (out of range, no age, got younger!)
• Program dates (within a specified time)
Total with valid pre- and post data at 3 months:
6815 (70%)

BMI
Waist circumference
Changes in Primary Outcome Measures

BMI
27.5
26.7
20
21
22
23
24
25
26
27
28
Before MEND After MEND
BM
I (k
g/m
2)
Mean difference = -0.8 kg/m2
p<0.0001
27.4
26.6

Waist circumference
86.9
84.2
70
72
74
76
78
80
82
84
86
88
Before MEND After MEND
Wais
t cir
cu
mfe
ren
ce (
cm
)
Mean difference = -2.7cm
p<0.0001
86.8
84.1
Physical activity
Sedentary behavior
Cardiovascular fitness
Psychological symptoms
Changes in Secondary Outcome Measures

Time spent in physical activity
Mean difference = 3.8 hours/week
p<0.0001
10.9
14.7
0
2
4
6
8
10
12
14
16
18
Before MEND After MEND
Ph
ysic
al
acti
vit
y (
ho
urs
per
week)

Time spent in sedentary behaviours
Mean difference = -6.2 hours/week
p<0.000116.9
10.7
0
2
4
6
8
10
12
14
16
18
20
Before MEND After MEND
Sed
en
tary
acti
vit
y (
ho
urs
per
week)

Cardiovascular fitness
Mean difference = -9.1 beats/minute
p<0.0001110.2
101.1
60
70
80
90
100
110
120
Before MEND After MEND
Re
co
ve
ry h
eart
ra
te (
be
ats
pe
r m
inu
te)

Psychological Symptoms (SDQ)
13.4
10.2
0
2
4
6
8
10
12
14
16
Before MEND After MEND
To
tal
dif
ficu
ltie
s (
ran
ge 0
-40)
Mean difference = -3.2
p<0.0001

West Midlands Consortium
Results

• Timeframe: September 2008 – August 2010 (23 months)
• Number of programmes: 29
• Number of children confirmed: 212
• Mean age (yrs) for the group: 10.5 (± 1.8)
• Number of children with pre- and post data: 154 (73%)
Overview

DH West
Midlands
Programme
Locations


DHWMC results
* = p≤0.0001DHWMC
results*
MEND national data*
BMI (kg/m²) -1.0 -0.8
Waist circumference (cm) -2.2 -2.7
Days doing physical activity (per week)
1.2 1.3
Physical activity (hours/week) 3.2 3.8
Sedentary activities (days/week)
-4.7 -6.2
Recovery heart rate (beats per minute)
-6.0 -9.1
Total difficulties score (0-40) -3.5 -3.2
Nutrition score (0-28) 6.6 6.5

Programme attendance, retention
and BMI SDS change
Feasibility RCTUK
roll-outDHWMC
n 11 117 6566 154
Mean
attendance (%)78 86 78 80
Drop-outs (%) 9 3 13 12
90% of children reduce their BMI z-score after
MEND 7-13

External Evaluation:
DH West Midlands

Standard evaluation framework
(SEF) criteria
• Child obesity rates above national average
• Worcester University evaluated 7 local CWMPs

Evaluation summary
Carnegie Fun4Life
Fitter Families
GOALS MEND One Body One Life
Watch It! YW8?
Cost per participant
£300 £396-423 £500-600 £510 £236 £669 £203
BMI change
-0.1 (0.3%
decrease)
-0.1 (0.2%
decrease)
No change -0.9 (4.4%
decrease)
-0.4 (1.7%
decrease)
+0.3 (1.1%
increase)
-0.7 (2.5%
decrease)
Waist Circumference change (cm)
-0.8 (0.9%
decrease)
Not collected
-7.1 (7.1%
decrease)
-2.3 (2.6%
decrease)
+2.1 (2.7%
increase)
+0.5 (0.6%
increase)
Not collected
Self esteem change
NA NA NA +3.4 NA +0.2 +1.7

Evaluation conclusion
• MEND and Watch it were the only 2 programmes with
peer reviewed evidence
• They concluded “MEND appears to offer good value
for money in terms of benefits to weight status,
psychosocial functioning and behaviour change.”

Health economics and wellbeing
evaluation
Independent study found:
• The ICER of the programme is £1,671 per QALY
gained, considerably below the NICE threshold for
cost-effectiveness of £20k-£30k
• The programme creates health and social outcomes
with a combined total value of £3,831 - £5,331 per child
• The study concludes that MEND 7-13 is a cost
effective and cost saving intervention which provides
returns on public investment of 967% -1331%
Y O R K
Health Economics
C O N S O R T I U M

Benchmarking to improve performance
Average number of children per program = 11 (22 participants)
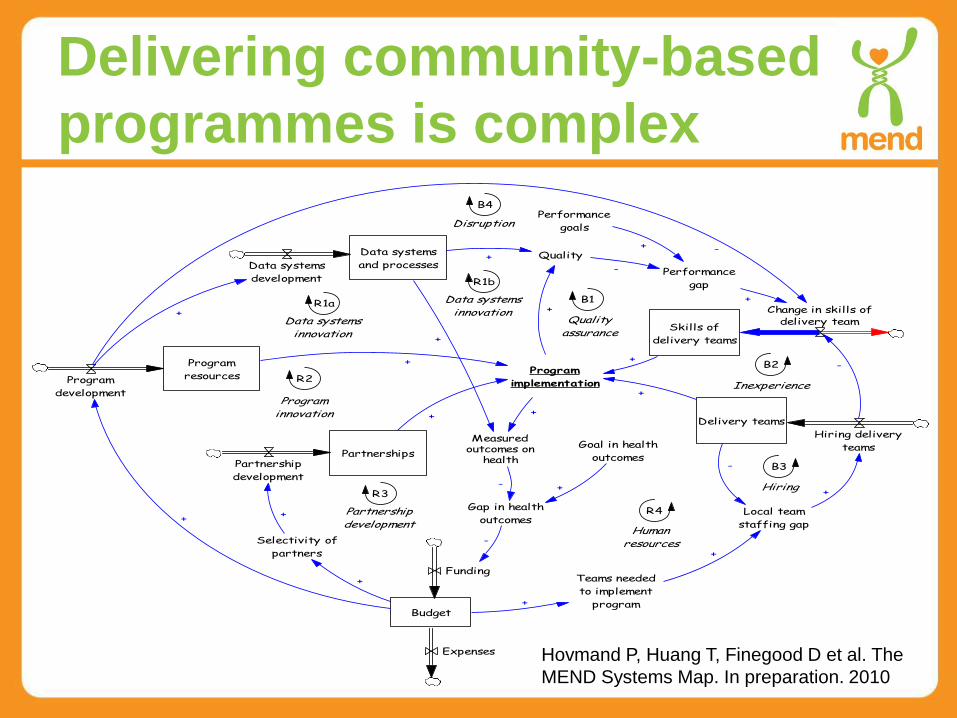
Delivering community-based
programmes is complex
Data systems
and processes
Program
resourcesProgram
development
Data systems
development
Skills of
delivery teams
Change in skills ofdelivery team
+
PartnershipsPartnership
development
Program
implementation
Delivery teams
Hiring delivery
teams
+
+
++
Quality
+
+
Measuredoutcomes on
health
+
Selectivity of
partners
+
Performance
goals
Performance
gap
-
+
+
Gap in health
outcomes
Goal in health
outcomes
+-
-
Teams needed
to implement
program
Local team
staffing gap
-
+
+
R2
Programinnovation
B1
Qualityassurance
R3
Partnershipdevelopment
R1a
Data systemsinnovation
B2
Inexperience
B3
Hiring
R4
Humanresources
-
B4
Disruption
Budget
Funding+
+
+
-
Expenses
+
R1b
Data systemsinnovation
Hovmand P, Huang T, Finegood D et al. The
MEND Systems Map. In preparation. 2010

Updates and Developments
• Programme updates: MEND World, MEND Mums
• Publication updates: 26 peer-reviewed papers and
abstracts
• Awards: (CMO awards)
• Training: e-learning

Range of prevention and
treatment programmes
open to all
children
targeted towards overweight and obese childrenin pilot
phase
facilitated
self-help
programme
MUMS

Celebrating success
• 1st DH rollout of a CWMP
• Directly improved the health of 212 participants
• Very positive and highly statistically significant health and
psychosocial outcomes
• Overcame early barriers to achieve good attendance and
retention
• Cross-sector partnerships led to improved delivery
• Trained over 185 frontline health and exercise
professionals to deliver, manage and refer to programmes
• Creation of a solid foundation will lead to even greater
success in the future

Thank you
Thank you!

www.mendcentral.org