children and the environment, third edition€¦ · epa is preparing the third edition of...
TRANSCRIPT

America’s Children and the Environment, Third Edition
DRAFT Indicators
Environments and Contaminants: Criteria Air Pollutants EPA is preparing the third edition of America’s Children and the Environment (ACE3), following the previous editions published in December 2000 and February 2003. ACE is EPA’s compilation of children’s environmental health indicators and related information, drawing on the best national data sources available for characterizing important aspects of the relationship between environmental contaminants and children’s health. ACE includes four sections: Environments and Contaminants, Biomonitoring, Health, and Special Features. EPA has prepared draft indicator documents for ACE3 representing 23 children's environmental health topics and presenting a total of 42 proposed children's environmental health indicators. This document presents the draft text, indicators, and documentation for the criteria air pollutants topic in the Environments and Contaminants section. THIS INFORMATION IS DISTRIBUTED SOLELY FOR THE PURPOSE OF PRE-DISSEMINATION PEER REVIEW UNDER APPLICABLE INFORMATION QUALITY GUIDELINES. IT HAS NOT BEEN FORMALLY DISSEMINATED BY EPA. IT DOES NOT REPRESENT AND SHOULD NOT BE CONSTRUED TO REPRESENT ANY AGENCY DETERMINATION OR POLICY. For more information on America’s Children and the Environment, please visit www.epa.gov/ace. For instructions on how to submit comments on the draft ACE3 indicators, please visit www.epa.gov/ace/ace3drafts/.
March 2011 DRAFT: DO NOT QUOTE OR CITE

Environments and Contaminants: Criteria Air Pollutants
DRAFT Indicator for Third Edition of America’s Children and the Environment Page 1
1
2 3 4 5 6 7 8 9
10
11 12 13 14 15
16 17 18 19 20 21
22 23 24 25 26 27
28 29 30 31 32 33
34 35 36 37 38
Criteria Air Pollutants
Air pollution contributes to a wide variety of adverse health effects. EPA uses health-based criteria to set primary national ambient air quality standards (NAAQS) for six of the most common air pollutants—carbon monoxide, lead, ground-level ozone, particulate matter, nitrogen dioxide, and sulfur dioxide—leading these six pollutants to become known as “criteria” air pollutants (or simply “criteria pollutants”). The presence of these pollutants in ambient air is generally due to numerous diverse and widespread sources of emissions. The primary NAAQS are set to protect public health. EPA also sets secondary NAAQS to protect public welfare from adverse effects of criteria pollutants, including protection against visibility impairment, or damage to animals, crops, vegetation, or buildings.
As required by the Clean Air Act,1 EPA periodically conducts comprehensive reviews of the scientific literature on health and welfare effects associated with exposure to the criteria air pollutants.2-7 The resulting assessments serve as the basis for making regulatory decisions about whether to retain or revise the NAAQS that specify the allowable concentrations of each of these pollutants in the ambient air.8
The primary standards are set at a level intended to protect public health, including the health of susceptible populations and lifestages, with an adequate margin of safety. In selecting a margin of safety, EPA considers such factors as the strengths and limitations of the evidence and related uncertainties, the nature and severity of the health effects, the size of the susceptible populations, and whether discernible thresholds have been identified below which health effects do not occur. In general for the criteria air pollutants, there is no evidence of discernible thresholds.2-7
The Clean Air Act does not require EPA to establish primary NAAQS at a zero-risk level, but rather at a level that reduces risk sufficiently so as to protect public health with an adequate margin of safety. This reflects consideration of providing protection for susceptible populations and lifestages rather than to the most susceptible single person in such groups. Even in areas that meet the current standards, members of susceptible populations or lifestages may at times experience health effects related to air pollution.9-13
Childhood is often identified as a susceptible lifestage in the NAAQS reviews, because children’s lungs and other organ systems are still developing, because they may have a preexisting disease (e.g., asthma), and because they may experience higher exposures due to their activities, including outdoor play.14-17 Evaluating the effects of criteria air pollutants in children has been a central focus in several recent NAAQS reviews, including revisions of the lead,18 ozone,19 and particulate matter20 standards to strengthen public health protection.
Some of the air quality standards are designed to protect the public from adverse health effects that can occur after being exposed for a short time, such as one hour or one day. Other standards are designed to protect people from adverse health effects that are associated with long-term exposures (months to years). For example, the standard for ozone is based on pollutant levels measured over a short-term period of eight hours. By contrast, the standard for lead considers
February 2011 DO NOT QUOTE OR CITE

Environments and Contaminants: Criteria Air Pollutants
DRAFT Indicator for Third Edition of America’s Children and the Environment Page 2
1 2 3
4 5 6
7 8 9
10 11 12 13 14 15 16 17 18 19
20 21 22 23 24 25 26 27 28 29 30 31 32 33 34 35 36 37 38 39
40 41
average levels measured over a rolling three-month period. For fine particulate matter (PM2.5), annual and 24-hour standards work together to provide protection against effects from long- and short-term exposures.
Health effects that have been associated with each of the criteria pollutants are summarized below. This information is drawn primarily from EPA’s assessments of the scientific literature for the criteria pollutants.
Ground-level Ozone Ground-level ozone forms through the reaction of pollutants emitted by industrial facilities, electric utilities, and motor vehicles.2 Short-term exposure to ground-level ozone can cause a variety of respiratory health effects, including inflammation of the lining of the lungs, reduced lung function, and respiratory symptoms such as cough, wheezing, chest pain, burning in the chest, and shortness of breath.2,13,21 Ozone exposure may also decrease the capacity to perform exercise.2 Exposure to ambient concentrations of ozone has been associated with the aggravation of respiratory illnesses such as asthma, emphysema, and bronchitis, leading to increased use of medication, absences from school, doctor and emergency department visits, and hospital admissions. Exposure to ozone can increase susceptibility to respiratory infection; long-term exposure can permanently damage lung tissue, and short-term exposure is associated with increased mortality.2
Particulate Matter Particulate matter (PM) is a generic term for a broad class of chemically and physically diverse substances that exist as discrete particles (liquid droplets or solids) over a wide range of sizes. Particles originate from a variety of anthropogenic stationary and mobile sources, as well as from natural sources. Particles may be emitted directly, or may be formed in the atmosphere by transformations of gaseous emissions such as sulfur oxides (SOx), nitrogen oxides (NOx), and volatile organic compounds (VOCs). The chemical and physical properties of PM vary greatly with time, region, meteorology, and the source of emissions. EPA distinguishes between two categories of particles based on differences in sources, properties, and atmospheric behavior. PM10 is an abbreviation for particles with a median aerodynamic diameter of 10 microns or less, and represents thoracic coarse particles (inhalable particles small enough to penetrate the thoracic region of the respiratory tract). For comparison, the diameter of PM10 particles is 1/7 the diameter of an average human hair or less. PM2.5 is an abbreviation for particles with an aerodynamic diameter of 2.5 microns or less, referred to as fine particles. Fine particles are produced chiefly by combustion processes (including power plants, gas and diesel engines, wood combustion, and many industrial processes) and by atmospheric reactions of various gaseous pollutants. PM10 particles are generally emitted directly as a result of mechanical processes that crush or grind larger particles, or by resuspension of dusts in the atmosphere.
Effects associated with PM exposures include mortality, aggravation of respiratory and cardiovascular disease (as indicated by increased hospital and emergency department
February 2011 DO NOT QUOTE OR CITE

Environments and Contaminants: Criteria Air Pollutants
DRAFT Indicator for Third Edition of America’s Children and the Environment Page 3
1 2 3 4 5 6 7 8 9
10 11 12 13 14 15 16 17 18
19 20 21 22 23 24 25 26 27 28 29
30 31 32 33 34 35 36 37
38 39 40 41
visits), exacerbation of allergic symptoms, reduced growth of lung function, increased respiratory symptoms, and evidence of more subtle indicators of cardiovascular health.6 Such health effects have been associated with both short-term and long-term exposure to PM. Children, older adults, and individuals with preexisting heart and lung disease, including asthma, and persons with lower socioeconomic status are considered to be among the groups most at risk for effects associated with PM exposures.6 Evidence is accumulating and currently provides suggestive evidence for associations between long-term PM2.5 exposure and developmental effects such as low birth weight and infant mortality due to respiratory causes.6
Lead Historically, the major source of lead emissions to the air was combustion of leaded gasoline in motor vehicles (such as cars and trucks). Following the elimination of leaded gasoline in the United States in the mid-1990s, the remaining major sources of lead air emissions have been industrial sources, including lead smelting and battery recycling operations, and piston-engine small aircraft that use leaded aviation gasoline.3 Lead accumulates in bones, blood, and soft tissues of the body. Exposure to lead can affect development of the central nervous system in young children, resulting in neurodevelopmental effects such as lowered IQ and behavioral problems.3
Sulfur Dioxide Fossil fuel combustion by electrical utilities and industry is the primary source of sulfur dioxide in the United States.5 Asthmatics are especially susceptible to the effects of sulfur dioxide.5 Short-term exposures of asthmatic individuals to elevated levels of sulfur dioxide while exercising at a moderate level may result in breathing difficulties, accompanied by symptoms such as wheezing, chest tightness, or shortness of breath. Studies also provide consistent evidence of an association between short-term sulfur dioxide exposure and increased respiratory symptoms in children, especially those with asthma or chronic respiratory symptoms. Short-term exposures to sulfur dioxide have also been associated with respiratory-related emergency department visits and hospital admissions, particularly for children and older adults.5
Carbon Monoxide Gasoline-fueled vehicles and other on-road and non-road mobile sources are the primary sources of carbon monoxide in the United States.7 Exposure to carbon monoxide reduces the capacity of the blood to carry oxygen, thereby decreasing the supply of oxygen to tissues and organs such as the heart. Short-term exposure can cause effects such as a reduction in exercise performance.7 Ambient levels of carbon monoxide have been associated with increased emergency department visits and hospital admissions related to cardiovascular disease.7
Nitrogen Dioxide Nitrogen dioxide is emitted by cars, trucks, buses, power plants, and non-road engines and equipment.4 Exposure to nitrogen dioxide has been associated with a variety of health effects.4 Effects include respiratory symptoms, especially among asthmatic children, and
February 2011 DO NOT QUOTE OR CITE
Environments and Contaminants: Criteria Air Pollutants
DRAFT Indicator for Third Edition of America’s Children and the Environment Page 4
1 2
3 4 5 6 7 8 9
10
respiratory-related emergency department visits and hospital admissions, particularly for children and older adults.4
The following three indicators provide different perspectives on children’s exposures to criteria air pollutants. Indicator E1 summarizes the percentages of children over time living in counties where measured pollutant levels exceeded short- and/or long-term standards for each of the criteria air pollutants. Indicator E2 provides additional detail on the frequency with which short-term standards for ozone and PM2.5 were exceeded in 2009. Indicator E3 focuses on the frequency with which children were exposed to good, moderate, or unhealthy daily air quality, based on EPA’s Air Quality Index.
February 2011 DO NOT QUOTE OR CITE

Environments and Contaminants: Criteria Air Pollutants
DRAFT Indicator for Third Edition of America’s Children and the Environment Page 5
1 2 3
4 5 6
7
8 9
10 11 12 13 14 15
16 17 18 19 20 21 22 23
Indicator E1: Percentage of children ages 0 to 17 years living in counties in which air quality standards were exceeded, 1999–2009
Indicator E2: Percentage of children ages 0 to 17 years living in counties with exceedances of shortterm air quality standards for ozone or PM2.5, 2009
Overview Indicators E1 and E2 present the percentage of children living in counties where measured ambient concentrations of criteria pollutants were greater than the levels of the Clean Air Act health-based standards at any time during a year. Indicator E1 presents results for each criteria pollutant for each year. Indicator E2 presents more detailed information on the frequency with which short-term standards for ozone and fine particulate matter (PM2.5) were exceeded in 2009. The data are from an EPA database that compiles measurements of pollutants in ambient air from around the country.
Air Quality System State and local environmental agencies that monitor air quality submit their data to EPA. EPA compiles the monitoring data in the national EPA Air Quality System (AQS) database.i AQS contains some monitoring data from the late 1950s and early 1960s, but there is not an appreciable amount of data for lead until 1970, sulfur dioxide until 1971, nitrogen dioxide until 1974, carbon monoxide and ozone until 1975, and PM10 until 1987. AQS also contains monitoring data for PM2.5 beginning with 1999; PM2.5 was measured only infrequently prior to 1999. Indicators E1 and E2 are derived from analysis of air pollution data in AQS.
Exceedances of Air Quality Standards Under the Clean Air Act, EPA has established National Ambient Air Quality Standards (NAAQS) for carbon monoxide, lead, ground-level ozone, particulate matter, nitrogen dioxide, and sulfur dioxide. There are four basic elements of NAAQS that together serve to define each standard: the definition of the pollutant,ii the averaging time (e.g., annual average or 24-hour average), the level, and the form of the standard (which defines the air quality statistic compared to the level of the standard in determining whether an area attains the standard—for example, the 24-hour PM2.5 standard uses the 98th percentile concentration).
i Information on the AQS database is available at http://www.epa.gov/air/data/aqsdb.html. ii In the development of NAAQS, the definition of the pollutant to be addressed by a standard is referred to as its “indicator.” To avoid confusion with the sense in which “indicator” is used throughout America’s Children and the Environment, the term is not used in the following paragraphs, except to refer to the ACE criteria pollutant indicators E1, E1 and E3.
February 2011 DO NOT QUOTE OR CITE

Environments and Contaminants: Criteria Air Pollutants
DRAFT Indicator for Third Edition of America’s Children and the Environment Page 6
1 2 3 4 5 6 7 8 9
10 11 12 13 14 15 16 17 18 19 20 21 22 23 24 25 26
27 28 29 30 31 32 33 34 35 36 37 38 39 40 41 42
For Indicators E1 and E2, an exceedance is defined using the first three elements of a NAAQS: the definition of the pollutant, the averaging time, and the level of the standard. Therefore, any time a criteria pollutant measurement, considered over the appropriate averaging time, is greater than the level of the NAAQS, it is considered to be an exceedance for purposes of Indicators E1 and E2. Thus, if a monitor within a county measured an ozone concentration, averaged over eight hours, that is greater than the level of the ozone NAAQS at any time during a year, then that county is considered to have an exceedance of the ozone NAAQS for purposes of calculating the indicator. Similarly, if a monitor within the county had an average PM2.5 concentration for a year greater than the level of the annual PM2.5 NAAQS, the county is considered to have an exceedance of the annual PM2.5 NAAQS for purposes of calculating the indicator. The indicators do not consider the form of the standard, which often includes considerations for multiple years of air quality data (e.g., 3 years), adjustments for missing data and less-than daily monitoring, and consideration for the frequency and magnitude with which a NAAQS is exceeded. The analyses for Indicators E1 and E2 therefore differs from the analyses used by EPA for the designation of “nonattainment areas” (locations that have not attained the standard) for regulatory compliance purposes.22 For each of the years 1999–2009, the indicator reflects comparisons of the monitoring data with the levels of the current NAAQS. The indicator for all years therefore incorporates the 2006 reduction of the 24-hour PM2.5 standard20 from 65 µg/m3 to 35 µg/m3; the 2008 reduction of the eight-hour ozone standard19 from 0.08 ppm to 0.075 ppm; the 2008 reduction of the three-month standard18 for lead from 1.5 µg/m3 to 0.15 µg/m3; a new one-hour standard23 for nitrogen dioxide (100 ppb), issued in 2010; and a new one-hour standard24 for sulfur dioxide (75 ppb) issued in 2010. Table 1 on page 27 shows the criteria pollutant levels used for the purpose of this indicator to determine whether an exceedance had occurred for each pollutant.
Data Presented in the Indicators Indicator E1 presents the percentage of children living in counties with exceedances of NAAQS for any of the criteria pollutants from 1999–2009. The indicator begins with data for 1999 because, as noted above, this was the first year of widespread monitoring for PM2.5. In addition to presenting data for each of the criteria pollutants separately, the indicator also presents the percentage of children living in counties in which the NAAQS for any criteria air pollutant was exceeded during the year (i.e., exceedance of standards for one or more criteria air pollutants). Indicator E1 does not differentiate between counties in which standards are exceeded frequently or by a large margin, and areas in which standards are exceeded only rarely or by a small margin. It also assumes that air pollutant concentrations are consistent throughout a county. Some pollutants, such as ozone and PM2.5, tend to be well dispersed and thus have limited spatial variation within a county, whereas other pollutants such as lead might have higher concentrations within relatively smaller areas. The indicator is based on exceedances of individual standards and does not reflect any combined effect of multiple pollutants. In addition, many counties do not have air pollution monitors. The percentages of children in unmonitored counties in 2009 range from about 30% for ozone and PM2.5 to about 50% for PM10, carbon monoxide, sulfur dioxide
February 2011 DO NOT QUOTE OR CITE
Environments and Contaminants: Criteria Air Pollutants
DRAFT Indicator for Third Edition of America’s Children and the Environment Page 7
1 2 3 4 5 6 7 8 9
10 11 12 13 14 15 16 17 18
19 20
and nitrogen dioxide, and about 80% for lead.iii Monitoring networks are typically designed to focus on areas that are expected to have higher concentrations or that have larger populations. If any of the unmonitored counties have pollutant levels exceeding the NAAQS, Indicator E1 will understate the percentage of children living in counties with exceedances. The supplemental data tables E1a and E1b show the percentage of children living in counties in which air quality standards were exceeded in 2009 by race/ethnicity (Table E1a) and family income (Table E1b). Indicator E2 provides additional detail on the comparison of monitoring data to two important short-term standards: the eight-hour ozone standard and the 24-hour PM2.5 standard. For each pollutant, counties are classified by the number of times during 2009 that the standard was exceeded. This indicator therefore shows the percentage of children living in counties in which these two short-term standards were exceeded a few times, as well as the percentage in counties with more frequent exceedances. The percentage of children in counties without monitors for these two pollutants in 2009 is also shown in Indicator E2. The data table for this indicator also provides the same information for each year 1999–2009, using the current level of the standards for each year’s calculation.
Statistical Testing Statistical analysis has been applied to the indicators to determine whether any changes over time are statistically significant. These analyses use a 5% significance level (p < 0.05), meaning that a conclusion of statistical significance is made only when there is no more than a 5% chance that the observed change over time occurred randomly. It should be noted that when statistical testing is conducted for multiple differences (e.g., for multiple air quality standards), the large number of comparisons involved increases the probability that some differences identified as statistically significant may actually have occurred randomly.
21 22 23 24 25 26
27 28 29 30 31 32
A finding of statistical significance for a change over time depends not only on the numerical differences in the annual values, but also on the number of annual values and the variability of the annual values. For example, the statistical test is more likely to detect a difference when data have been obtained over a longer period. A finding that there is or is not a statistically significant change over time is not the only information that should be considered when determining the public health implications of those differences.
iii EPA issued increased requirements for lead monitoring in December 2010.25
February 2011 DO NOT QUOTE OR CITE

Environments and Contaminants: Criteria Air Pollutants
DRAFT Indicator for Third Edition of America’s Children and the Environment Page 8
1
Indicator E1
Percentage of children ages 0 to 17 years living in countiesin which air quality standards were exceeded, 1999-2009
1999 2000 2002 2004 2006 2008 20090%
10%
20%
30%
40%
50%
60%
70%
80%
Any standard
Carbon monoxidePM10
DATA: U.S. Environmental Protection Agency, Office of Air and Radiation, Air Quality System
Lead
Ozone
PM2.5 (annual standard)
DRAFT Indicator for Third Edition of America's Children and the Environment
PM2.5
(24-hour standard)
SO2
NO2
2
3 4 5 6 7 8 9
10 11
• In 2009, 59% of children lived in counties in which the levels of one or more national ambient air quality standards were exceeded, compared with 75% in 1999. This includes both exceedance of any current short-term standard at least once during the year as well as exceedance of current long-term standards.
o Statistical note: The decline over the years 1999-2009 was statistically significant.
• In 1999, approximately 65% of children lived in counties in which the current eight-hour ozone standard was exceeded on at least one day per year. In 2009, approximately 49% of children lived in such counties.
February 2011 DO NOT QUOTE OR CITE

Environments and Contaminants: Criteria Air Pollutants
DRAFT Indicator for Third Edition of America’s Children and the Environment Page 9
1 2 3 4 5 6 7 8 9
10 11 12 13 14 15 16 17 18 19 20 21 22
o Statistical note: The decline for ozone over the years 1999-2009 was statistically significant.
• From 1999–2009, the percentage of children living in counties that exceeded the current 24-hour PM2.5 standard decreased from about 55% to about 32%. Over the same years, the percentage of children living in counties that exceeded the current annual standard for PM2.5 declined from about 24% to about 2%.
o Statistical note: The trends for PM2.5 were statistically significant.
• From 1999–2009, the percentage of children living in counties that exceeded the current one-hour standard for sulfur dioxide declined from about 31% to about 11%. Over the same years, the percentage of children living in counties that exceeded the current one-hour standard for nitrogen dioxide decreased from about 23% to about 9%.
o Statistical note: The trends for sulfur dioxide and nitrogen dioxide were statistically significant.
• Since 1999, 1–5% of children have lived in counties that exceeded the current three-month standard for lead. In 2009, 8 counties with about 4.2% of U.S. children exceeded the three-month standard for lead.
• In 2009, about 3% of children lived in counties that exceeded the current 24-hour standard
for PM10, and no children lived in counties with exceedances for carbon monoxide.
February 2011 DO NOT QUOTE OR CITE

Environments and Contaminants: Criteria Air Pollutants
DRAFT Indicator for Third Edition of America’s Children and the Environment Page 10
Percentage of children ages 0 to 17 years living in counties with exceedances of short-term air quality standards for ozone or PM2.5, 2009
0% 5% 10% 15% 20% 25% 30% 35% 40%
Indicator E2
DRAFT Indicator for Third Edition of America's Children and the Environment
PM2.5
(24-hour standard)
11-25 exceedances26 or more exceedances
8-10 exceedances
DATA: U.S. Environmental Protection Agency, Office of Air and Radiation, Air Quality System
11-25 exceedances
Ozone (eight-hour standard)
No monitoring dataNo exceedances1-3 exceedances4-10 exceedances
26 or more exceedances
No monitoring dataNo exceedances1-7 exceedances
1 2 3 4 5
6 7 8 9
10 11 12 13
• In 2009, about 6% of children lived in counties in which the 8-hour ozone standard was
exceeded on more than 25 days. An additional 3% of children lived in counties where the ozone standard was exceeded between 11 and 25 times.
• In 2009, about 1% of children lived in counties where the 24-hour standard for PM2.5 was exceeded on more than 25 days. An additional 2% of children lived in counties where the PM2.5 standard was exceeded between 11 and 25 times. About 28% of children lived in counties where the standard was exceeded between one and seven times.
• In 2009, 27% of children lived in counties with no monitoring data for ozone, and about 30% lived in counties without data for PM2.5. No assessment is made regarding the frequency with which the standards were exceeded for these children.
February 2011 DO NOT QUOTE OR CITE

Environments and Contaminants: Criteria Air Pollutants
DRAFT Indicator for Third Edition of America’s Children and the Environment Page 11
1 2 3
4
5 6 7 8 9
10 11 12 13 14 15 16 17 18 19 20 21 22 23 24 25 26 27 28 29 30 31
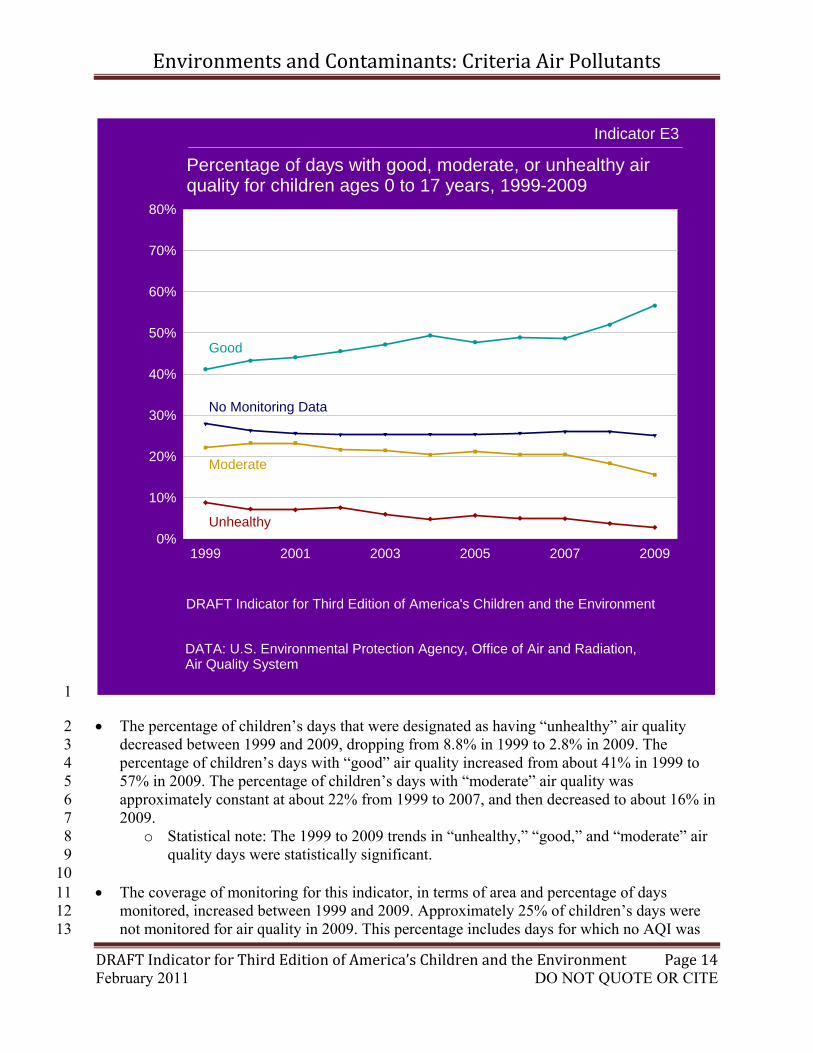
Indicator E3: Percentage of days with good, moderate, or unhealthy air quality for children ages 0 to 17 years, 1999–2009
Overview Indicator E3 presents data from EPA’s Air Quality Index (AQI). The AQI produces a rating of the air quality for each county on each day, considering all monitoring results available on that day for carbon monoxide, ozone, nitrogen dioxide, particulate matter, and sulfur dioxide. Air quality in each county is considered to be “good,” “moderate,” or “unhealthy” based on comparison of the monitored pollutant concentrations to the relevant air quality standard. The indicator is calculated by considering the number of children in counties with each rating for each day of the year, then summing the number of children for all days in the year.
Air Quality Index EPA’s Air Quality Index (AQI)iv represents air quality for each individual day and is widely reported in newspapers and other media outlets in metropolitan areas. The AQI is based on daily measurements of up to five of the six air quality criteria pollutants (carbon monoxide, ozone, nitrogen dioxide, particulate matter, and sulfur dioxide). The standard for lead is not included in the AQI because it requires averaging concentrations over a three-month period, and it can take several weeks to collect and analyze lead samples. The specific pollutants considered in the AQI for each metropolitan area depend on the pollutants monitored in that area each day. Each pollutant concentration is given a value on a scale relative to the air quality standard for that pollutant. The daily AQI is based on the single pollutant with the highest index value that day. An AQI value of 100 represents a concentration roughly equal to the short-term NAAQS for a criteria pollutant, and is the level EPA has set to protect public health from short-term exposures. EPA has divided the AQI scale into categories. Air quality is considered “good” (referred to as “code green”) if the AQI is between 0 and 50, posing little or no risk. Air quality is considered “moderate” (“code yellow”) if the AQI is between 51 and 100. Some pollutants at this level may present a moderate health concern for a small number of individuals. Air quality is considered “unhealthy for sensitive groups” if the AQI is between 101 and 150 (referred to as “code orange”). Members of sensitive groups such as children may experience health effects, but the rest of the general population is unlikely to be affected. Air quality is considered “unhealthy” if the AQI is between 151 and 200 (“code red”). The general population may begin to experience health effects, and members of sensitive groups may experience more serious health effects. Values of 201 to 300 are designated as “very unhealthy” (“code purple”), while values of 301 to 500 are considered “hazardous” (“code maroon”).
iv Available at http://www.airnow.gov/.
February 2011 DO NOT QUOTE OR CITE
Environments and Contaminants: Criteria Air Pollutants
DRAFT Indicator for Third Edition of America’s Children and the Environment Page 12
1 2 3 4
5 6 7 8 9
10 11 12 13 14 15 16 17 18 19 20 21 22 23 24 25 26
27 28 29 30 31
32 33
For PM2.5, Indicator E3 is calculated with a 24-hour of concentration of 40 µg/m3 used to define air quality as “unhealthy for sensitive groups” (i.e., an AQI value of 100), rather than the level of the 24-hour PM2.5 standard of 35 µg/m3. As a consequence, Indicator E3 likely overstates the days with good air quality and understates the days with moderate or unhealthy air quality.
Data Presented in the Indicator Indicator E3 is based on the reported AQI for counties in the United States. This indicator was developed by reviewing the AQI designation for each day for each county and weighting the daily designations by the number of children living in each county. The overall indicator reports the percentage of children’s days of exposure in each year considered to be of good (AQI 0–50), moderate (AQI 51–100), or unhealthy (AQI greater than 100; codes orange, red, purple, and maroon combined) air quality. Because not all counties have air quality monitoring stations, children living in counties with no monitoring data are also tracked in Indicator E3. Whereas Indicator E1 presents an annual analysis of counties in which the standard for a pollutant is exceeded at least once during a year, the AQI data used in Indicator E3 track the intensity of pollution in each county over the course of a year. The E3 method uses data on the air quality category for each day, rather than simply reporting whether a county ever exceeds the standard for each pollutant during the year. However, the AQI method has some limitations. The AQI is based on the single pollutant with the highest value for each day; it does not reflect any combined effect of multiple pollutants or the effects of pollutants that were not measured on a given day. Only short-term, daily pollution burdens are reflected. Indicator E3 starts in 1999 because this was the first year of widespread monitoring for PM2.5. The indicator uses a consistent set of air quality standards for all years shown, 1999–2009, but as noted above, the level of the current 24-hour standard for PM2.5 has not been incorporated into calculation of the indicator.
Tables E3a and E3b show the percentage of children’s days of exposure to good, moderate, or unhealthy air quality in 2009 by race/ethnicity (Table E3a) and family income (Table E3b). These calculations do not account for any possible variation in air quality within a county, and thus may not fully reflect the variability in air quality among children of different race/ethnicity and income.
Statistical Testing Statistical analysis has been applied to the indicators to determine whether any changes over time are statistically significant. These analyses use a 5% significance level (p < 0.05), meaning that a conclusion of statistical significance is made only when there is no more than a 5% chance that the observed change over time occurred randomly. It should be noted that when statistical testing is conducted for multiple differences(e.g., considering the good, moderate, and unhealthy categories), the large number of comparisons involved increases the probability that some differences identified as statistically significant may actually have occurred randomly.
34 35 36 37 38 39 40 41 42
A finding of statistical significance for a change over time depends not only on the numerical differences in the annual values, but also on the number of annual values and the variability of
February 2011 DO NOT QUOTE OR CITE

Environments and Contaminants: Criteria Air Pollutants
DRAFT Indicator for Third Edition of America’s Children and the Environment Page 13
1 2 3 4
5
6
7 8 9
10
the annual values. For example, the statistical test is more likely to detect a difference when data have been obtained over a longer period. A finding that there is or is not a statistically significant change over time is not the only information that should be considered when determining the public health implications of those differences.
February 2011 DO NOT QUOTE OR CITE
Environments and Contaminants: Criteria Air Pollutants
DRAFT Indicator for Third Edition of America’s Children and the Environment Page 14
Indicator E3
Percentage of days with good, moderate, or unhealthy air quality for children ages 0 to 17 years, 1999-2009
1999 2001 2003 2005 2007 20090%
10%
20%
30%
40%
50%
60%
70%
80%
Good
Moderate
No Monitoring Data
Unhealthy
DATA: U.S. Environmental Protection Agency, Office of Air and Radiation, Air Quality System
DRAFT Indicator for Third Edition of America's Children and the Environment
1
2 3 4 5 6 7 8 9
10 11 12 13
• The percentage of children’s days that were designated as having “unhealthy” air quality decreased between 1999 and 2009, dropping from 8.8% in 1999 to 2.8% in 2009. The percentage of children’s days with “good” air quality increased from about 41% in 1999 to 57% in 2009. The percentage of children’s days with “moderate” air quality was approximately constant at about 22% from 1999 to 2007, and then decreased to about 16% in 2009.
o Statistical note: The 1999 to 2009 trends in “unhealthy,” “good,” and “moderate” air quality days were statistically significant.
• The coverage of monitoring for this indicator, in terms of area and percentage of days monitored, increased between 1999 and 2009. Approximately 25% of children’s days were not monitored for air quality in 2009. This percentage includes days for which no AQI was
February 2011 DO NOT QUOTE OR CITE

Environments and Contaminants: Criteria Air Pollutants
DRAFT Indicator for Third Edition of America’s Children and the Environment Page 15
1 2 3
reported in counties where the AQI is sometimes reported, as well as counties in which the AQI is not reported at all. On days that were monitored, in many cases only one or a few pollutants were monitored.
February 2011 DO NOT QUOTE OR CITE
Environments and Contaminants: Criteria Air Pollutants
DRAFT Indicator for Third Edition of America’s Children and the Environment Page 16
1 2 3 4 5
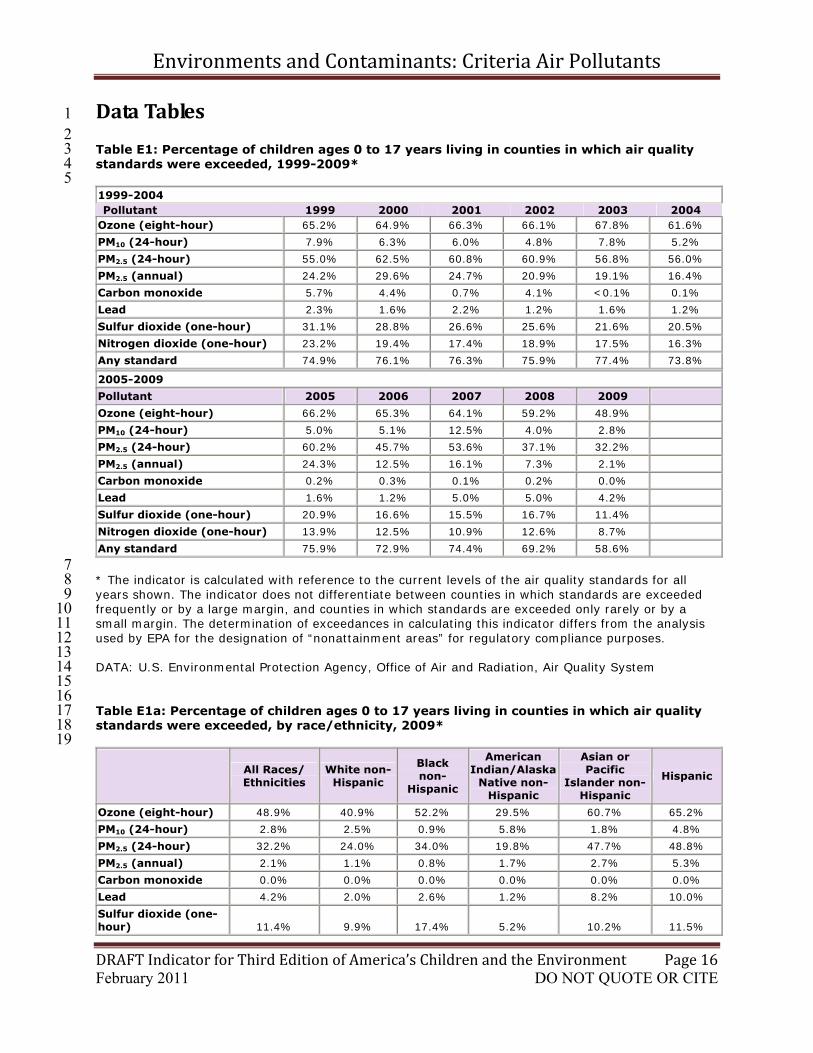
Data Tables Table E1: Percentage of children ages 0 to 17 years living in counties in which air quality standards were exceeded, 1999-2009* 1999-2004 Pollutant 1999 2000 2001 2002 2003 2004
Ozone (eight-hour) 65.2% 64.9% 66.3% 66.1% 67.8% 61.6%
PM10 (24-hour) 7.9% 6.3% 6.0% 4.8% 7.8% 5.2%
PM2.5 (24-hour) 55.0% 62.5% 60.8% 60.9% 56.8% 56.0%
PM2.5 (annual) 24.2% 29.6% 24.7% 20.9% 19.1% 16.4%
Carbon monoxide 5.7% 4.4% 0.7% 4.1% <0.1% 0.1%
Lead 2.3% 1.6% 2.2% 1.2% 1.6% 1.2%
Sulfur dioxide (one-hour) 31.1% 28.8% 26.6% 25.6% 21.6% 20.5%
Nitrogen dioxide (one-hour) 23.2% 19.4% 17.4% 18.9% 17.5% 16.3%
Any standard 74.9% 76.1% 76.3% 75.9% 77.4% 73.8%
2005-2009
Pollutant 2005 2006 2007 2008 2009
Ozone (eight-hour) 66.2% 65.3% 64.1% 59.2% 48.9%
PM10 (24-hour) 5.0% 5.1% 12.5% 4.0% 2.8%
PM2.5 (24-hour) 60.2% 45.7% 53.6% 37.1% 32.2%
PM2.5 (annual) 24.3% 12.5% 16.1% 7.3% 2.1%
Carbon monoxide 0.2% 0.3% 0.1% 0.2% 0.0%
Lead 1.6% 1.2% 5.0% 5.0% 4.2%
Sulfur dioxide (one-hour) 20.9% 16.6% 15.5% 16.7% 11.4%
Nitrogen dioxide (one-hour) 13.9% 12.5% 10.9% 12.6% 8.7%
Any standard 75.9% 72.9% 74.4% 69.2% 58.6%
7 8 9
10 11 12 13 14 15 16 17 18 19
* The indicator is calculated with reference to the current levels of the air quality standards for all years shown. The indicator does not differentiate between counties in which standards are exceeded frequently or by a large margin, and counties in which standards are exceeded only rarely or by a small margin. The determination of exceedances in calculating this indicator differs from the analysis used by EPA for the designation of “nonattainment areas” for regulatory compliance purposes. DATA: U.S. Environmental Protection Agency, Office of Air and Radiation, Air Quality System Table E1a: Percentage of children ages 0 to 17 years living in counties in which air quality standards were exceeded, by race/ethnicity, 2009*
All Races/ Ethnicities
White non-Hispanic
Black non-
Hispanic
American Indian/Alaska
Native non-Hispanic
Asian or Pacific
Islander non-Hispanic
Hispanic
Ozone (eight-hour) 48.9% 40.9% 52.2% 29.5% 60.7% 65.2%
PM10 (24-hour) 2.8% 2.5% 0.9% 5.8% 1.8% 4.8%
PM2.5 (24-hour) 32.2% 24.0% 34.0% 19.8% 47.7% 48.8%
PM2.5 (annual) 2.1% 1.1% 0.8% 1.7% 2.7% 5.3%
Carbon monoxide 0.0% 0.0% 0.0% 0.0% 0.0% 0.0%
Lead 4.2% 2.0% 2.6% 1.2% 8.2% 10.0%
Sulfur dioxide (one-hour) 11.4% 9.9% 17.4% 5.2% 10.2% 11.5%
February 2011 DO NOT QUOTE OR CITE

Environments and Contaminants: Criteria Air Pollutants
DRAFT Indicator for Third Edition of America’s Children and the Environment Page 17
All Races/ Ethnicities
White non-Hispanic
Black non-
Hispanic
American Indian/Alaska
Native non-Hispanic
Asian or Pacific
Islander non-Hispanic
Hispanic
Nitrogen dioxide (one-hour) 8.7% 4.0% 9.8% 2.8% 12.8% 19.4%
Any standard 58.6% 51.9% 62.7% 38.1% 70.0% 71.4%
1 2 3 4 5 6 7 8 9
10 11 12 13
* The indicator is calculated with reference to the current levels of the air quality standards for all years shown. The indicator does not differentiate between counties in which standards are exceeded frequently or by a large margin, and counties in which standards are exceeded only rarely or by a small margin. The determination of exceedances in calculating this indicator differs from the analysis used by EPA for the designation of “nonattainment areas” for regulatory compliance purposes. DATA: U.S. Environmental Protection Agency, Office of Air and Radiation, Air Quality System Table E1b: Percentage of children ages 0 to 17 years living in counties in which air quality standards were exceeded, by family income, 2009*
> Poverty Detail
All
Incomes < Poverty
Level ≥ Poverty
Level 100-200% of Poverty Level
≥ 200% of Poverty Level
Ozone (eight-hour) 48.9% 49.9% 48.7% 47.2% 49.3%
PM10 (24-hour) 2.8% 2.6% 2.8% 3.1% 2.7%
PM2.5 (24-hour) 32.2% 36.5% 31.3% 32.9% 30.8%
PM2.5 (annual) 2.1% 3.1% 1.9% 2.6% 1.6%
Carbon monoxide 0.0% 0.0% 0.0% 0.0% 0.0%
Lead 4.2% 5.7% 3.9% 4.9% 3.6%
Sulfur dioxide (one-hour) 11.4% 12.5% 11.1% 11.2% 11.1%
Nitrogen dioxide (one-hour) 8.7% 12.2% 8.1% 10.1% 7.4%
Any standard 58.6% 59.0% 58.6% 56.3% 59.3%
14 15 16 17 18 19 20 21 22 23 24 25 26
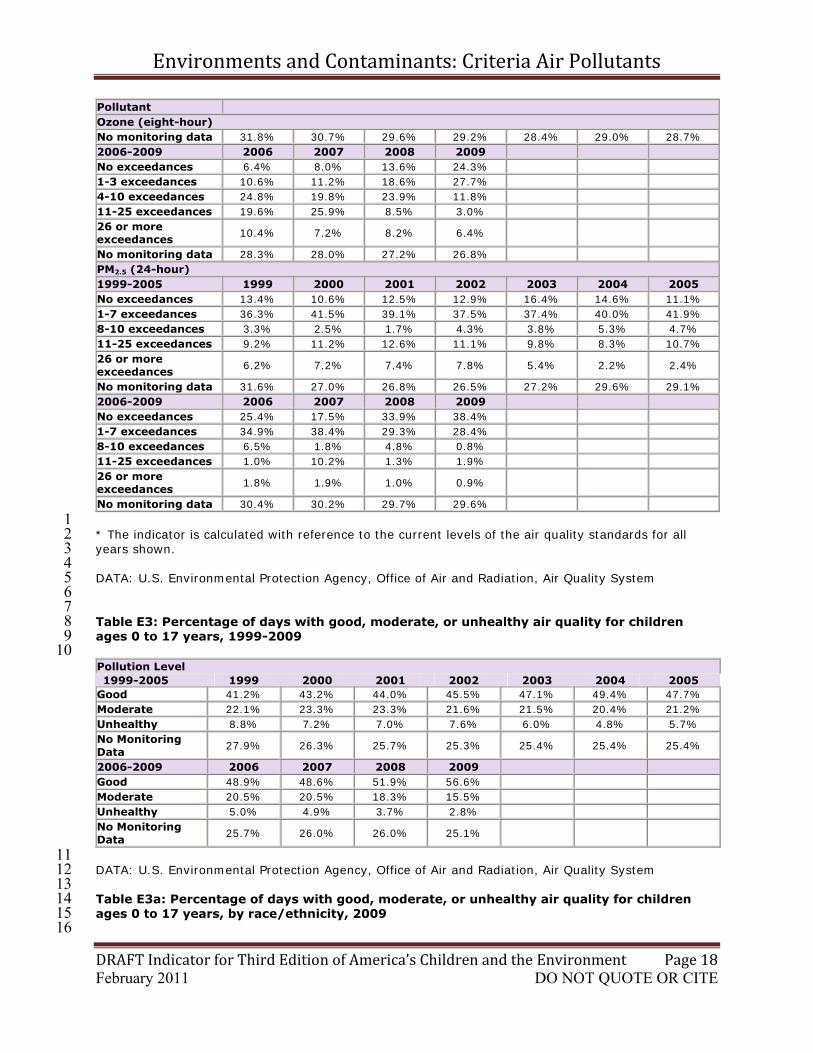
* The indicator is calculated with reference to the current levels of the air quality standards for all years shown. The indicator does not differentiate between counties in which standards are exceeded frequently or by a large margin, and counties in which standards are exceeded only rarely or by a small margin. The determination of exceedances in calculating this indicator differs from the analysis used by EPA for the designation of “nonattainment areas” for regulatory compliance purposes. DATA: U.S. Environmental Protection Agency, Office of Air and Radiation, Air Quality System Table E2: Percentage of children ages 0 to 17 years living in counties with exceedances of short-term air quality standards for ozone or PM2.5, 1999-2009* Pollutant Ozone (eight-hour) 1999-2005 1999 2000 2001 2002 2003 2004 2005 No exceedances 2.9% 4.4% 4.2% 4.6% 3.7% 9.4% 5.1% 1-3 exceedances 4.6% 9.6% 6.9% 6.7% 8.7% 22.8% 9.3% 4-10 exceedances 10.8% 22.9% 16.2% 9.6% 28.5% 21.0% 17.7% 11-25 exceedances 26.7% 16.2% 29.5% 21.5% 18.1% 10.0% 28.1% 26 or more exceedances
23.2% 16.2% 13.7% 28.4% 12.5% 7.8% 11.2%
February 2011 DO NOT QUOTE OR CITE
Environments and Contaminants: Criteria Air Pollutants
DRAFT Indicator for Third Edition of America’s Children and the Environment Page 18
Pollutant Ozone (eight-hour) No monitoring data 31.8% 30.7% 29.6% 29.2% 28.4% 29.0% 28.7% 2006-2009 2006 2007 2008 2009 No exceedances 6.4% 8.0% 13.6% 24.3% 1-3 exceedances 10.6% 11.2% 18.6% 27.7% 4-10 exceedances 24.8% 19.8% 23.9% 11.8% 11-25 exceedances 19.6% 25.9% 8.5% 3.0% 26 or more exceedances
10.4% 7.2% 8.2% 6.4%
No monitoring data 28.3% 28.0% 27.2% 26.8% PM2.5 (24-hour) 1999-2005 1999 2000 2001 2002 2003 2004 2005 No exceedances 13.4% 10.6% 12.5% 12.9% 16.4% 14.6% 11.1% 1-7 exceedances 36.3% 41.5% 39.1% 37.5% 37.4% 40.0% 41.9% 8-10 exceedances 3.3% 2.5% 1.7% 4.3% 3.8% 5.3% 4.7% 11-25 exceedances 9.2% 11.2% 12.6% 11.1% 9.8% 8.3% 10.7% 26 or more exceedances
6.2% 7.2% 7.4% 7.8% 5.4% 2.2% 2.4%
No monitoring data 31.6% 27.0% 26.8% 26.5% 27.2% 29.6% 29.1% 2006-2009 2006 2007 2008 2009 No exceedances 25.4% 17.5% 33.9% 38.4% 1-7 exceedances 34.9% 38.4% 29.3% 28.4% 8-10 exceedances 6.5% 1.8% 4.8% 0.8% 11-25 exceedances 1.0% 10.2% 1.3% 1.9% 26 or more exceedances
1.8% 1.9% 1.0% 0.9%
No monitoring data 30.4% 30.2% 29.7% 29.6%
1 2 3 4 5 6 7 8 9
10
* The indicator is calculated with reference to the current levels of the air quality standards for all years shown. DATA: U.S. Environmental Protection Agency, Office of Air and Radiation, Air Quality System Table E3: Percentage of days with good, moderate, or unhealthy air quality for children ages 0 to 17 years, 1999-2009 Pollution Level 1999-2005 1999 2000 2001 2002 2003 2004 2005
Good 41.2% 43.2% 44.0% 45.5% 47.1% 49.4% 47.7% Moderate 22.1% 23.3% 23.3% 21.6% 21.5% 20.4% 21.2% Unhealthy 8.8% 7.2% 7.0% 7.6% 6.0% 4.8% 5.7% No Monitoring Data
27.9% 26.3% 25.7% 25.3% 25.4% 25.4% 25.4%
2006-2009 2006 2007 2008 2009 Good 48.9% 48.6% 51.9% 56.6% Moderate 20.5% 20.5% 18.3% 15.5% Unhealthy 5.0% 4.9% 3.7% 2.8% No Monitoring Data
25.7% 26.0% 26.0% 25.1%
11 12 13 14 15 16
DATA: U.S. Environmental Protection Agency, Office of Air and Radiation, Air Quality System Table E3a: Percentage of days with good, moderate, or unhealthy air quality for children ages 0 to 17 years, by race/ethnicity, 2009
February 2011 DO NOT QUOTE OR CITE

Environments and Contaminants: Criteria Air Pollutants
DRAFT Indicator for Third Edition of America’s Children and the Environment Page 19
Pollution Level All Races/ Ethnicities
White non-Hispanic
Black non-Hispanic
American Indian/Alaska Native
Asian or Pacific Islander
Hispanic
Good 56.6% 54.5% 60.8% 50.3% 65.4% 57.3%
Moderate 15.5% 12.1% 16.0% 11.6% 20.1% 23.2%
Unhealthy 2.8% 1.6% 1.9% 1.7% 4.5% 6.0%
No Monitoring Data 25.1% 31.8% 21.3% 36.5% 10.0% 13.5%
1 2 3 4 5 6
DATA: U.S. Environmental Protection Agency, Office of Air and Radiation, Air Quality System Table E3b: Percentage of days with good, moderate, or unhealthy air quality for children ages 0 to 17 years, by family income, 2009
> Poverty Detail
Pollution Level All Incomes < Poverty
Level ≥ Poverty
Level 100-200% of Poverty Level
≥ 200% of Poverty Level
Good 56.6% 53.6% 57.2 52.8% 58.7%
Moderate 15.5% 16.9% 15.3 15.9% 15.1%
Unhealthy 2.8% 3.6% 2.6 3.2% 2.4%
No Monitoring Data 25.1% 26.0% 24.9 28.1% 23.8%
7 8 9
DATA: U.S. Environmental Protection Agency, Office of Air and Radiation, Air Quality System
February 2011 DO NOT QUOTE OR CITE

Environments and Contaminants: Criteria Air Pollutants
DRAFT Indicator for Third Edition of America’s Children and the Environment Page 20
1 2 3
References
1. U.S. Environmental Protection Agency. 2010. Clean Air Act. U.S. EPA, Office of Air and Radiation. Retrieved December 28, 2010 from http://www.epa.gov/air/caa/. 4
5 6 7
2. U.S. Environmental Protection Agency. 2006. Air Quality Criteria for Ozone and Related Photochemical Oxidants (Final Report). Washington, DC: U.S. EPA, National Center for Environmental Assessment. EPA. EPA/600/R-05/004aF-cF. http://cfpub.epa.gov/ncea/isa/recordisplay.cfm?deid=149923. 8
9 10 11
3. U.S. Environmental Protection Agency. 2006. Air Quality Criteria for Lead (Final Report). Washington, DC: U.S. EPA, National Center for Environmental Assessment. EPA/600/R-05/144aF-bF. http://cfpub.epa.gov/ncea/isa/recordisplay.cfm?deid=158823. 12
13 14 15
4. U.S. Environmental Protection Agency. 2008. Integrated Science Assessment for Oxides of Nitrogen — Health Criteria (Final Report). Washington, DC: National Center for Environmental Assessment. EPA/600/R-08/071. http://cfpub.epa.gov/ncea/isa/recordisplay.cfm?deid=194645. 16
17 18 19
5. U.S. Environmental Protection Agency. 2008. Integrated Science Assessment for Sulfur Oxides — Health Criteria (Final Report). Washington, DC: U.S. EPA, National Center for Environmental Assessment. EPA/600/R-08/047F. http://cfpub.epa.gov/ncea/isa/recordisplay.cfm?deid=198843. 20
21 22 23
6. U.S. Environmental Protection Agency. 2009. Integrated Science Assessment for Particulate Matter (Final Report). Washington, DC: U.S. EPA, National Center for Environmental Assessment. EPA/600/R-08/139F. http://cfpub.epa.gov/ncea/CFM/recordisplay.cfm?deid=216546. 24
25 26 27
7. U.S. Environmental Protection Agency. 2010. Integrated Science Assessment for Carbon Monoxide (Final Report). Washington, DC: U.S. EPA, National Center for Environmental Assessment. EPA/600/R-09/019F. http://cfpub.epa.gov/ncea/cfm/recordisplay.cfm?deid=218686. 28
29 30
8. U.S. Environmental Protection Agency. 2009. National Ambient Air Quality Standards (NAAQS). Retrieved May 21, 2009 from http://www.epa.gov/ttn/naaqs/. 31
32 33 34 35 36 37 38 39 40 41 42 43 44 45 46 47 48 49 50 51 52 53
9. Bateson, T.F., and J. Schwartz. 2008. Children's response to air pollutants. Journal of Toxicology and Environmental Health 71 (3):238-43. 10. Kampa, M., and E. Castanas. 2008. Human health effects of air pollution. Environmental Pollution 151 (2):362-7. 11. Latza, U., S. Gerdes, and X. Baur. 2008. Effects of nitrogen dioxide on human health: Systematic review of experimental and epidemiological studies conducted between 2002 and 2006. International Journal of Hygiene and Environmental Health. 12. Salvi, S. 2007. Health effects of ambient air pollution in children. Paediatric Respiratory Reviews 8 (4):275-80. 13. Wigle, D.T., T.E. Arbuckle, M. Walker, M.G. Wade, S. Liu, and D. Krewski. 2007. Environmental hazards: evidence for effects on child health. Toxicology and Environmental Health Part B: Critical Reviews 10 (1-2):3-39. 14. Ginsberg, G., B. Foos, R.B. Dzubow, and M. Firestone. 2010. Options for incorporating children's inhaled dose into human health risk assessment. Inhalation Toxicology 22 (8):627-47. 15. Ginsberg, G.L., B. Asgharian, J.S. Kimbell, J.S. Ultman, and A.M. Jarabek. 2008. Modeling approaches for estimating the dosimetry of inhaled toxicants in children. Journal of Toxicology and Environmental Health 71 (3):166-95.
February 2011 DO NOT QUOTE OR CITE

Environments and Contaminants: Criteria Air Pollutants
DRAFT Indicator for Third Edition of America’s Children and the Environment Page 21
1 2 3 4 5 6 7 8 9
10 11 12 13 14 15 16 17 18 19 20
16. Ginsberg, G.L., B.P. Foos, and M.P. Firestone. 2005. Review and analysis of inhalation dosimetry methods for application to children's risk assessment. Journal of Toxicology and Environmental Health 68 (8):573-615. 17. Makri, A., M. Goveia, J. Balbus, and R. Parkin. 2004. Children's susceptibility to chemicals: a review by developmental stage. Toxicology and Environmental Health Part B: Critical Reviews 7 (6):417-35. 18. U.S. Environmental Protection Agency. 2008. National Ambient Air Quality Standards for Lead: Final Rule. Federal Register 73 (219):66964-67062. 19. U.S. Environmental Protection Agency. 2008. National Ambient Air Quality Standards for Ozone: Final Rule. Federal Register 73 (60):16436-16514. 20. U.S. Environmental Protection Agency. 2006. National Ambient Air Quality Standards for Particulate Matter: Final Rule. Federal Register 71 (200):61143-61233. 21. Kajekar, R. 2007. Environmental factors and developmental outcomes in the lung. Pharmacology & Therapeutics 114 (2):129-45. 22. U.S. Environmental Protection Agency. 2010. The Green Book Nonattainment Areas for Criteria Pollutants. U.S. EPA. Retrieved December 28, 2010 from http://www.epa.gov/air/oaqps/greenbk/. 21
22 23 24 25 26 27 28 29 30
23. U.S. Environmental Protection Agency. 2010. Primary National Ambient Air Quality Standards for Nitrogen Dioxide: Final Rule. Federal Register 75 (26):6474-6537. 24. U.S. Environmental Protection Agency. 2010. Primary National Ambient Air Quality Standard for Sulfur Dioxide: Final Rule. Federal Register 75 (119):35520-35603. 25. U.S. Environmental Protection Agency. 2010. Revisions to Lead Ambient Air Monitoring Requirements: Final Rule (Prepublication Version). U.S. EPA. Retrieved February 8, 2011 from http://www.epa.gov/oaqps001/lead/pdfs/PbRevision-ForPublication.pdf. 31
32 33 34
February 2011 DO NOT QUOTE OR CITE

Environments and Contaminants: Criteria Air Pollutants
DRAFT Indicator for Third Edition of America’s Children and the Environment Page 22
1 2 3
Metadata Metadata for Air Quality System (AQS) Brief description of the data set
The U.S. Environmental Protection Agency compiles air quality monitoring data in the Air Quality System (AQS). Ambient air concentrations are measured at a national network of more than 4,000 monitoring stations and are reported by state, local, and tribal agencies to EPA AQS.
Who provides the data set? U.S. Environmental Protection Agency, Office of Air Quality Planning and Standards.
How are the data gathered?
Concentrations are measured at a national network of more than 4,000 monitoring stations and are reported by state, local, and tribal agencies to EPA AQS.
What documentation is available describing data collection procedures?
The Ambient Monitoring Technology Information Center (AMTIC) at http:/www.epa.gov/ttn/amtic/ contains information and files on ambient air quality monitoring programs, details on monitoring methods, relevant documents and articles, information on air quality trends and federal regulations related to ambient air quality monitoring. The Air Trends site at http:/www.epa.gov/airtrends contains information on air quality trends. The Green Book site at http:/www.epa.gov/air/oaqps/greenbk contains information on nonattainment areas.
What types of data relevant for children’s environmental health indicators are available from this database?
Measured ambient air pollutant concentrations (lead, carbon monoxide, ozone, PM10, PM2.5, sulfur dioxide, and nitrogen dioxide), Air Quality Index. Monitor information (location, monitoring objective).
What is the spatial representation of the database (national or other)?
National, however not all counties are represented since not all counties have air pollution monitors.
Are raw data (individual measurements or survey responses) available?
Individual hourly or daily measurements by monitor and pollutant are available.
How are database files obtained?
Raw data: http:/www.epa.gov/ttn/airs/aqsdatamart/basic_info.htm. http:/www.epa.gov/ttn/airs/airsaqs/detaildata/downloadaqsdata.htm.Annual summary data (includes annual means and maxima): http://www.epa.gov/ttn/airs/aqsdatamart/. For some indicators, additional annual summary data were compiled by EPA staff. This includes annual maximum rolling three-month average lead concentrations, county maximum PM2.5 annual means using OAQPS data completeness and weighted average calculations, PM2.5 exceedance count data, and air quality index data.
Are there any known data quality or data analysis concerns?
Individual measurements of questionable validity or attributed to exceptional events (e.g., forest fires) are flagged. Monitoring data are not collected in some counties for some pollutants.
What documentation is available describing QA procedures?
http:/www.epa.gov/ttn/amtic/quality.html. http:/www.epa.gov/airprogm/oar/oaqps/qa/index.html.
February 2011 DO NOT QUOTE OR CITE

Environments and Contaminants: Criteria Air Pollutants
DRAFT Indicator for Third Edition of America’s Children and the Environment Page 23
Metadata for Air Quality System (AQS)
For what years are data available?
1980–present.
What is the frequency of data collection?
Hourly or daily. Less frequent monitoring occurs at some monitors (e.g., every three or six days for PM or only in the ozone season for ozone).
What is the frequency of data release?
AIRNow releases ozone and PM2.5 data hourly. Raw data are updated by states approximately monthly. Annual summary data are updated quarterly.
Are the data comparable across time and space?
Counties without air quality monitors cannot be compared with counties with air quality monitors. Although monitor locations and monitoring frequencies change, the network is reasonably stable. An exception occurred for PM2.5 in 1999 as the new monitoring network was built up.
Can the data be stratified by race/ethnicity, income, and location (region, state, county or other geographic unit)?
Region, state, county, metropolitan area.
1 2
February 2011 DO NOT QUOTE OR CITE

Environments and Contaminants: Criteria Air Pollutants
DRAFT Indicator for Third Edition of America’s Children and the Environment Page 24
1 2 3 4 5 6 7 8 9
10 11 12 13 14 15 16 17 18 19 20 21 22 23 24 25 26 27 28 29 30 31 32 33 34 35 36 37 38 39 40 41
Methods Indicator E1. Percentage of children ages 0 to 17 years living in counties in which air quality standards were exceeded, 1999-2009. E2. Percentage of children ages 0 to 17 years living in counties with exceedances of short-term air quality standards for ozone or PM2.5, 1999-2009. Summary EPA’s Office of Air Quality Planning and Standards (OAQPS) has set primary (health-based) National Ambient Air Quality Standards (NAAQS) for six common air pollutants, often referred to as criteria air pollutants (or simply criteria pollutants). Each NAAQS has an averaging period (e.g., one-hour, eight-hour, 24-hour, three-month, annual) and a level.v For indicator E1 we analyzed the following NAAQS: carbon monoxide, eight-hour; ozone, eight-hour; PM10, 24-hour; PM2.5, annual; PM2.5, 24-hour; sulfur dioxide, one-hour; nitrogen dioxide, one-hour; lead, three-month. For indicator E2 we analyzed the NAAQS exceedances for the eight-hour ozone and 24-hour PM2.5 standards. Monitoring data are submitted by state and local environmental agencies to the national EPA Air Quality System database. For each NAAQS standard, the criteria pollutant concentrations are averaged over the associated averaging period. An exceedance of the NAAQS is an instance where the average value for the criteria pollutant is greater than the NAAQS level. For each NAAQS, monitor, and year, we used air quality summary statistics to determine whether there was an exceedance. For each NAAQS, county, and year, the county exceeds air quality standards if there was an exceedance at any of the county’s monitors. We also evaluated the counties exceeding any standard; i.e., counties that exceeded one or more of the NAAQS used for indicator E1. Indicator E1 is the total number of children ages 0 to 17 years living in a county exceeding air quality standards at any time during the year, divided by the total number of children ages 0 to 17 years in the United States. The supplementary tables for indicator E1 provide the percentages of children ages 0 to 17 years living in a county exceeding air quality standards, stratified by race/ethnicity (Table E1a) or family income (Table E1b), for the year 2009. Indicator E2 is the total number of children ages 0 to 17 years living in a county with a given number of exceedances of the ozone or PM2.5 air quality standards during the year, divided by the total number of children ages 0 to 17 years in the United States. Overview of Data Files The following files are needed to calculate these indicators:
v Each NAAQS also has a statistical form: for example the annual 4th highest daily maximum eight-hour average value for ozone, averaged over three years, and has various data completeness requirements. These aspects of the NAAQS are not used in these indicators.
February 2011 DO NOT QUOTE OR CITE
Environments and Contaminants: Criteria Air Pollutants
DRAFT Indicator for Third Edition of America’s Children and the Environment Page 25
1 2 3 4 5 6 7 8
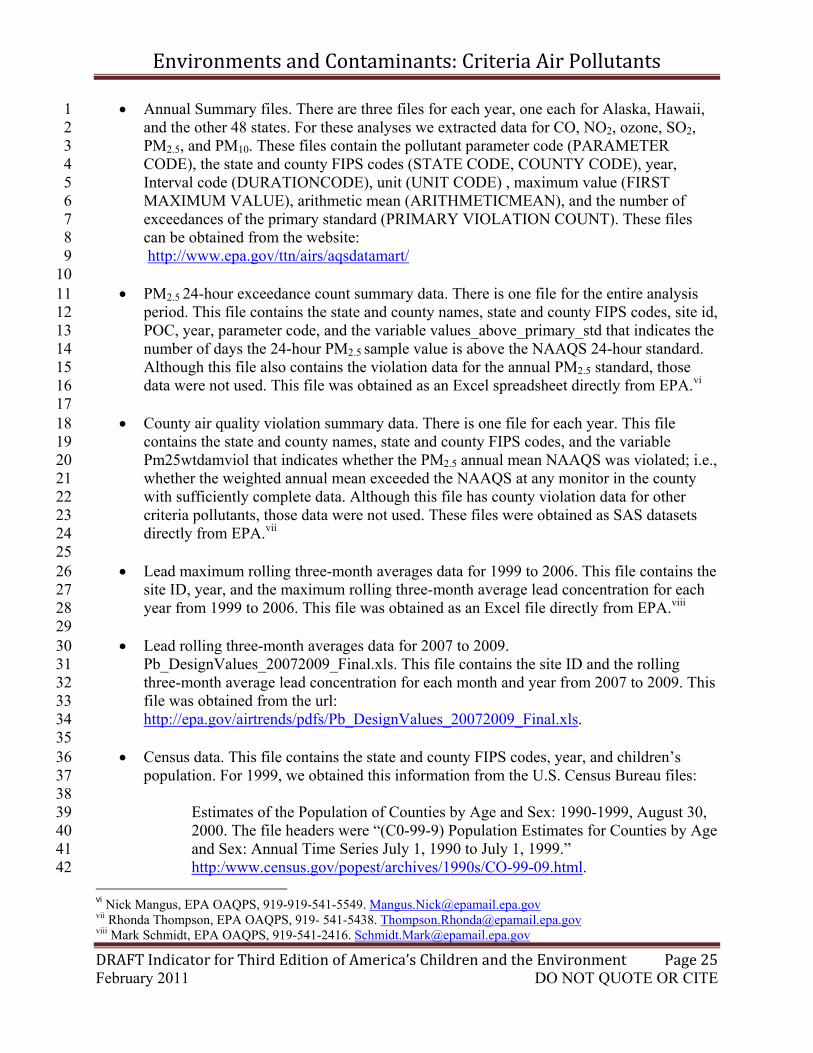
• Annual Summary files. There are three files for each year, one each for Alaska, Hawaii, and the other 48 states. For these analyses we extracted data for CO, NO2, ozone, SO2, PM2.5, and PM10. These files contain the pollutant parameter code (PARAMETER CODE), the state and county FIPS codes (STATE CODE, COUNTY CODE), year, Interval code (DURATIONCODE), unit (UNIT CODE) , maximum value (FIRST MAXIMUM VALUE), arithmetic mean (ARITHMETICMEAN), and the number of exceedances of the primary standard (PRIMARY VIOLATION COUNT). These files can be obtained from the website: http://www.epa.gov/ttn/airs/aqsdatamart/ 9
10 11 12 13 14 15 16 17 18 19 20 21 22 23 24 25 26 27 28 29 30 31 32 33
• PM2.5 24-hour exceedance count summary data. There is one file for the entire analysis
period. This file contains the state and county names, state and county FIPS codes, site id, POC, year, parameter code, and the variable values_above_primary_std that indicates the number of days the 24-hour PM2.5 sample value is above the NAAQS 24-hour standard. Although this file also contains the violation data for the annual PM2.5 standard, those data were not used. This file was obtained as an Excel spreadsheet directly from EPA.vi
• County air quality violation summary data. There is one file for each year. This file
contains the state and county names, state and county FIPS codes, and the variable Pm25wtdamviol that indicates whether the PM2.5 annual mean NAAQS was violated; i.e., whether the weighted annual mean exceeded the NAAQS at any monitor in the county with sufficiently complete data. Although this file has county violation data for other criteria pollutants, those data were not used. These files were obtained as SAS datasets directly from EPA.vii
• Lead maximum rolling three-month averages data for 1999 to 2006. This file contains the
site ID, year, and the maximum rolling three-month average lead concentration for each year from 1999 to 2006. This file was obtained as an Excel file directly from EPA.viii
• Lead rolling three-month averages data for 2007 to 2009.
Pb_DesignValues_20072009_Final.xls. This file contains the site ID and the rolling three-month average lead concentration for each month and year from 2007 to 2009. This file was obtained from the url: http://epa.gov/airtrends/pdfs/Pb_DesignValues_20072009_Final.xls. 34
35 36 37 38 39 40 41
• Census data. This file contains the state and county FIPS codes, year, and children’s
population. For 1999, we obtained this information from the U.S. Census Bureau files:
Estimates of the Population of Counties by Age and Sex: 1990-1999, August 30, 2000. The file headers were “(C0-99-9) Population Estimates for Counties by Age and Sex: Annual Time Series July 1, 1990 to July 1, 1999.” http:/www.census.gov/popest/archives/1990s/CO-99-09.html. 42
vi Nick Mangus, EPA OAQPS, 919-919-541-5549. [email protected] vii Rhonda Thompson, EPA OAQPS, 919- 541-5438. [email protected] Mark Schmidt, EPA OAQPS, 919-541-2416. [email protected]
February 2011 DO NOT QUOTE OR CITE

Environments and Contaminants: Criteria Air Pollutants
DRAFT Indicator for Third Edition of America’s Children and the Environment Page 26
1 2 3 4 5 6 7 8 9
10
These files give county populations by age and sex for 1990 to 1999. We summed these populations by year and county across all ages 0 to 17 years and both sexes.
For 2000-2009, we obtained this information from the bridged-race Vintage 2009 postcensal population file:
National Center for Health Statistics. Postcensal estimates of the resident population of the United States for July 1, 2000-July 1, 2009, by year, county, age, bridged race, Hispanic origin, and sex (Vintage 2009). Prepared under a collaborative arrangement with the U.S. Census Bureau; released June 20, 2010. Available from: http://www.cdc.gov/nchs/nvss/bridged_race.htm as of July 23, 2010. 11
12 13 14 15 16 17 18 19 20 21 22 23 24 25 26 27 28 29 30 31 32 33 34 35 36 37 38 39 40
The populations by year and county were obtained by summing across the ages 0 to 17 years inclusive.
National Ambient Air Quality Standards (NAAQS) Table 1 lists the NAAQS for the criteria pollutants used in indicator E1. The first two columns give the pollutant and the averaging time. The third column gives the corresponding level of the standard. The fourth column gives the value used in determining, for purposes of this indicator, whether an exceedance has occurred, and incorporates a rounding convention. For example, the eight-hour average CO standard of 9 ppm has a rounding convention of 1 ppm, so that the standard is exceeded if any eight-hour average CO concentration rounded to the nearest 1 ppm exceeds 9 ppm; i.e., the unrounded eight-hour average has to equal or exceed the target value of 9.5 ppm. A county exceeds the standard if one or more of the monitors in the county exceeds the standard. Except for PM2.5, co-located monitors are treated as separate monitors. For PM2.5, if there are several co-located monitors, then only the monitor with the lowest Monitor Number (also known as the Pollutant Occurrence Code, abbreviated as POC) is used. We use PM2.5 data from the lowest POC (typically POC 1, the primary sampler) to represent an area.ix For other pollutants, we use data from all monitor/POC combinations. It should be noted that counties that exceed the standards are not necessarily non-attainment counties for the NAAQS. A non-attainment designation is generally based on three years of data, certain data completeness criteria, and, for short-term standards, requires multiple daily exceedances of the NAAQS. For example, non-attainment of the carbon monoxide eight-hour standard only uses eight-hour averages with at least six hourly values, and occurs when there are two or more eight-hour averages above the NAAQS level. Non-attainment of the eight-hour ozone standard occurs if the three-year average of the fourth highest daily maximum eight-hour average exceeds the level of the standard and the data completeness criteria are met. For a detailed description of the NAAQS attainment and non-attainment calculations, see the NAAQS website at http://www.epa.gov/ttn/naaqs/. 41
42
ix A similar approach was used in the OAQPS report “Analyses of Particulate Matter (PM) Data for the PM NAAQS Review,” June 30, 2005, http://www.epa.gov/ttn/naaqs/standards/pm/data/schmidt_63005.pdf.
February 2011 DO NOT QUOTE OR CITE

Environments and Contaminants: Criteria Air Pollutants
DRAFT Indicator for Third Edition of America’s Children and the Environment Page 27
1 2 3
Table 1: Levels of the National Ambient Air Quality Standards (NAAQS) and the Values Used to Define Exceedances for Indicators E1 and E2*
Pollutant Standard Averaging Time Level of the Standard
Target value to define exceedance for indicator calculation**
Carbon monoxide 1-hour 8-houra
35 ppm 9 ppm
Not considered 9.5 ppm
Nitrogen dioxide Annual 1-hourb
0.053 ppm 100 ppb
Not considered 100.5 ppb
Ozone 8-hour c 0.075 ppm 0.076 ppm Lead Rolling 3-month averaged 0.15 µg/m3 0.155 µg/m3
PM10 24- houre 150 µg/m3 155 µg/m3
PM2.5 24- hourf Annualg
35 µg/m3 15 µg/m3
35.5 µg/m3 15.05 µg/m3
Sulfur dioxide 1-hourh 75 ppb 75.5 ppb 4 5 6 7 8 9
10 11 12 13 14 15 16 17 18 19 20 21 22 23 24
* Indicators E1 is calculated with reference to the current averaging time and level of the air quality standard for all years. * * Standards not used for indicator E1 are shown as “Not considered.” a The carbon monoxide 8-hour standard was established in 1971 (See 59 FR 38906, August 1, 1994). b The nitrogen dioxide 1-hour standard was established in January 2010 (75 FR 6474, February 9, 2010). c The ozone 8-hour standard was adopted in July 1997 (62 FR 38856, July 18, 1997). The ozone 8-hour standard was changed from 0.08 to 0.075 ppm in March 2008 (73 FR 16436, March 27, 2008). For the 2008 ozone standard calculations, all hourly values are 8-hour average values and are reported to three decimal places, truncating digits beyond the third decimal place. d The lead standard was changed from 1.5 to 0.15 µg/m3 in October 2008 (73 FR 66964, November 12, 2008) . The revised annual standard uses the maximum rolling three-month average lead concentration. eThe form, but not the level, of the 24-hour standard for PM10 was revised in July 1997 (62 FR 38652, July 18, 1997). f The 24- hour standard for PM2.5 was revised from 65 µg/m3 to 35 µg/m3 in 2006 (71 FR 61144, October 17, 2006). gThe annual standard for PM2.5 was adopted in July 1997 (62 FR 38652, July 18, 1997). hThe final rule for the sulfur dioxide 1-hour standard was issued in June 2010 (75 FR 35220, June 22, 2010). Air Quality Data Annual Summary monitoring data from the EPA Air Quality System (AQS) Data Mart for the years 1999 to 2009 were obtained from the EPA website http://www.epa.gov/ttn/airs/aqsdatamart/. In order to download data from the AQS Data Mart, one needs to first obtain electronic access to the system by contacting the EPA AQS Data Mart team at [email protected]. The AQS Data Mart provides air quality monitoring data for a selected geographic region and time period based on various user-provided options on the substance type (in this case select “Criteria Pollutants”) and monitoring data statistic needed. The AQS Data Mart outputs the data as XML files.
25 26 27 28 29 30 31 32 33 34 35 36 37
The AQS Data Mart’s retrieval interface consists of two main tabs. The first tab requires the type of query, definition of the geographic region of interest, and substance type. For the purpose of obtaining the summary values for the entire United States, monitoring data are retrieved separately using the Annual Summary Query for the states of Hawaii, Alaska, and the contiguous 48 states. The second tab of the interface requires the user to provide the time period and statistic of interest and any request for auxiliary data. In the second tab, the beginning time period is
February 2011 DO NOT QUOTE OR CITE

Environments and Contaminants: Criteria Air Pollutants
DRAFT Indicator for Third Edition of America’s Children and the Environment Page 28
1 2 3 4 5 6 7 8 9
10 11 12 13 14 15 16 17 18 19 20 21 22 23 24 25 26 27 28 29 30 31 32 33 34 35 36 37 38 39 40 41 42 43
chosen as January 1 and end time period as December 31st of each analysis year. Annual Maximum Sample Measurements is chosen as the statistic along with the request for duration and locational metadata. The three output files for each analysis year are aggregated into a single file for further analyses. Data were retrieved for the years 1999-2009 in January 2011. The Annual Summary files include the state and county FIPS codes, site code, parameter (pollutant) code (PARAM), and pollutant occurrence code (POC). The Annual Summary files also include the interval code (DURATION CODE), to identify the concentration measurement averaging period, and the unit code (UNIT CODE), to identify the measurement units. Also included are the annual maximum value (FIRST MAXIMUM VALUE) and/or the arithmetic mean value (ARITHMETIC MEAN), depending upon the NAAQS. The following combinations of the parameter code, interval code, unit code, maximum, and arithmetic mean were used to define exceedances of the standards used for indicator E1:
• CO 8-hour standard: PARAM = 42101, DURATION CODE = Z, UNIT CODE = 007, FIRST MAXIMUM VALUE ≥ 9.5
• NO2 1-hour standard: Either PARAM = 42602, DURATION CODE = 1, UNIT CODE = 008, FIRST MAXIMUM VALUE ≥ 100.5 Or PARAM = 42602, DURATION CODE = 1, UNIT CODE = 007, FIRST MAXIMUM VALUE ≥ 0.1005
• Ozone 8-hour standard: PARAM = 44201, DURATION CODE = W, UNIT CODE = 007, FIRST MAXIMUM VALUE ≥ 0.076
• PM10 24-hour standard: PARAM = 81102, DURATION CODE = 7, UNIT CODE = 001, FIRST MAXIMUM VALUE ≥ 155
• PM2.5 24-hour standard: PARAM = 88101, DURATION CODE = 7, UNIT CODE = 105, FIRST MAXIMUM VALUE ≥ 35.5
• SO2 1-hour standard: Either PARAM = 42401, DURATION CODE = 1, UNIT CODE = 008, FIRST MAXIMUM VALUE ≥ 75.5 Or PARAM = 42401, DURATION CODE = 1, UNIT CODE = 007, FIRST MAXIMUM VALUE ≥ 0.0755
The monitor exceeds the standard if the corresponding set of conditions holds for the given year. A county exceeds the standard in a given year if any of the monitors in that county exceed the standard. For the PM2.5 annual standard, summary data used for NAAQS attainment/non-attainment designations were obtained directly from EPA.x We extracted the state and county FIPS code together with the variable PM25wtdamviol, which has the value 1 if the county has an exceedance of the PM2.5 annual standard. In this case, a county exceeds the standard if, at any monitor in the county, the NAAQS data completeness requirements are met and the weighted annual mean exceeds the target value of 15.05 µg/m3. The weighted annual mean is the average of the four quarterly means. This approach often gives different results from the values for PM2.5 in the Annual Summary files, which do not apply data completeness rules and are based on the annual arithmetic mean of all the daily values.
x Rhonda Thompson, EPA OAQPS, 919- 541-5438. [email protected].
February 2011 DO NOT QUOTE OR CITE

Environments and Contaminants: Criteria Air Pollutants
DRAFT Indicator for Third Edition of America’s Children and the Environment Page 29
1 2 3 4 5 6 7
For the lead standard, summary data with the annual maximum rolling three-month average lead concentrations for each monitor from 1999 to 2006 were obtained directly from EPA on October 14, 2009.xi These values were calculated using the completeness criteria and averaging calculations detailed in the Federal Register, Vol. 73, No. 219. Thus, the maximum rolling three-month average is calculated by finding all 12 three-month average lead concentrations that begin in that calendar year, and finding the maximum of those 12 averages. For the years 2007 to 2009, rolling three-month average lead concentrations were obtained from an Excel file at the url: http://epa.gov/airtrends/pdfs/Pb_DesignValues_20072009_Final.xls. The annual maximum rolling three-month average lead concentrations for 2007 to 2009 were calculated from the monthly values. The monitor has an exceedance for the given year if the annual maximum rolling three-month average lead concentration is at least 0.155 µg/m
8 9
10 11 12 13 14 15 16 17 18 19 20 21 22 23 24 25 26 27 28 29 30 31 32 33 34 35 36 37 38 39
3. A county exceeds the standard in a given year if any of the monitors in that county exceed the standard. For indicator E1, we also evaluated the counties exceeding Any Standard; i.e., counties that exceeded one or more of the eight NAAQS standards used for indicator E1. The following combinations of the parameter code, interval code, unit code, and numbers of exceedances were used to define the numbers of exceedances of the standards used for indicator E2:
• Ozone 8-hour standard: PARAM = 44201, INTERVAL_CODE = W, UNIT = 007, PRIMARY VIOLATION COUNT = number of exceedances.
• PM2.5 24-hour standard: PARAM = 88101, INTERVAL_CODE = 7, UNIT = 001, values_above_primary_std = number of exceedances.
For the ozone standard, PRIMARY VIOLATION COUNT gives the number of days in the year where the maximum eight-hour average concentration exceeds the NAAQS level. For the PM2.5 standard, values_above_primary_std gives the number of days in the year where the 24-hour average concentration exceeds the NAAQS level. The number of exceedances for a county is calculated as the maximum number of exceedances across all monitors in that county. Census Data For the trend analyses we obtained children’s populations by county for each year from 1999-2009. For 1999, the source was U.S. Census Bureau files, Estimates of the Population of Counties by Age and Sex: 1990-1999, August 30, 2000. The file headers were “(C0-99-9) Population Estimates for Counties by Age and Sex: Annual Time Series July 1, 1990 to July 1, 1999.” http://www.census.gov/popest/archives/1990s/CO-99-09.html. These files give county populations by age and sex for 1990 to 1999. We summed these populations by year and county across all ages 0 to 17 and both sexes.
40 41 42 43
xi Mark Schmidt, EPA OAQPS, 919-541-2416. [email protected].
February 2011 DO NOT QUOTE OR CITE

Environments and Contaminants: Criteria Air Pollutants
DRAFT Indicator for Third Edition of America’s Children and the Environment Page 30
1 2 3 4 5 6 7
For 2000-2009, we used the bridged-race Vintage 2009 postcensal populations files obtained from the CDC website:
National Center for Health Statistics. Postcensal estimates of the resident population of the United States for July 1, 2000-July 1, 2009, by year, county, age, bridged race, Hispanic origin, and sex (Vintage 2009). Prepared under a collaborative arrangement with the U.S. Census Bureau; released June 20, 2010. Available from: http://www.cdc.gov/nchs/nvss/bridged_race.htm as of July 23, 2010. 8
9 10 11 12 13 14 15 16 17 18 19 20 21 22 23 24 25 26
The bridged Vintage 2009 postcensal population files contains estimates of the resident population of the United States as of July 1, 2000; July 1, 2001; July 1, 2002; July 1, 2003; July 1, 2004; July 1, 2005; July 1, 2006; July 1, 2007; July 1, 2008; and July 1, 2009 by county, single-year of age (0, 1, 2,..., 85 years and over), bridged-race category (White, Black or African American, American Indian or Alaska Native, Asian or Pacific Islander), Hispanic origin (not Hispanic or Latino, Hispanic or Latino), and sex. There is one file for each year. Files are available in SAS dataset and text formats; we used the SAS dataset format for these analyses. We extracted the following variables: state, county, age, racesex, hisp, and pop. The racesex variable is a single coded value for each combination of race and sex, e.g., racesex = 1 denotes White males. The value pop gives the population as of July 1 of the calendar year for a given state, county, age, racesex combination, and ethnicity. The county children’s populations for each year 2000-2009 were obtained by summing the variable pop over all ages <= 17, all values of “racesex,” and all values of “hisp.” Calculation of Indicator
27 28 29 30 31 32 33 34 35 36 37 38 39 40 41 42 43 44 45
Indicator E1 is calculated as follows. Define, for each NAAQS, Pop (county C, year Y) = population of children in county C, year Y Exceed (county C, year Y) = 1, if county C exceeds the NAAQS in year Y = 0, otherwise These values are calculated as described above. Note that Exceed = 0 if the county has no air quality monitors or no air quality monitoring data in the given year. Counties outside the 50 states or Washington, DC were excluded. The total number of children living in counties in which air quality standards were exceeded is the sum of Pop over all counties where Exceed equals 1; i.e., Children Affected (year Y) = Σ [Pop (county C, year Y) × Exceed (county C, year Y)] The total number of children living in the United States is the sum of Pop over all counties. Thus, Children (year Y) = Σ Pop (county C, year Y)
February 2011 DO NOT QUOTE OR CITE

Environments and Contaminants: Criteria Air Pollutants
DRAFT Indicator for Third Edition of America’s Children and the Environment Page 31
1 2 3 4 5 6 7
The percentage of children living in counties in which air quality standards were exceeded equals the total number of children living in counties in which air quality standards were exceeded divided by the total number of children living in the United States and multiplied by 100. Percentage Children Affected = [Children Affected (year Y) / Children (year Y)] × 100%
8 9
10 11 12 13 14 15 16 17 18 19 20 21 22 23 24 25 26 27 28 29 30 31 32 33 34 35 36
Indicator E2 is calculated as follows. Define, for each NAAQS and each exceedance range a to b (e.g., 11 to 25, or 26 to infinity), Pop (county C, year Y) = population of children in county C, year Y.
ExceedRange (county C, year Y) = 1, if county C has K exceedances of the NAAQS in year Y and a ≤ K ≤ b,
= 0, otherwise These values are calculated as described above. Note that ExceedRange = 0 if the county has no air quality monitors or no air quality monitoring data in the given year. Counties outside the 50 states or Washington, DC were excluded. The total number of children living in counties in which there were between a and b exceedances of air quality standards is the sum of Pop over all counties where ExceedRange equals 1; i.e., Children Affected (year Y) = Σ [Pop (county C, year Y) × ExceedRange (county C, year Y)] The total number of children living in the United States is the sum of Pop over all counties. Thus, Children (year Y) = Σ Pop (county C, year Y) The percentage of children living in counties in which there were between a and b exceedances of air quality standards equals the total number of children living in counties in which there were between a and b exceedances of air quality standards divided by the total number of children living in the United States and multiplied by 100. Percentage Children Affected = [Children Affected (year Y) / Children (year Y)] × 100% Race/Income37
38 39 40 41 42 43 44
The supplementary tables E1a and E1b give the percentages of children living in counties in which air quality standards were exceeded, stratified by race/ethnicity (Table E1a) or family income (Table E1b), for the year 2009 only. The calculation of Tables E1a and E1b is exactly the same as for the trend analysis, except that the county children’s populations are replaced by estimated county children’s populations for the given race/ethnicity or income groups in 2009.
February 2011 DO NOT QUOTE OR CITE

Environments and Contaminants: Criteria Air Pollutants
DRAFT Indicator for Third Edition of America’s Children and the Environment Page 32
1 2 3 4 5 6 7 8
For the supplementary tables, children’s populations stratified by race/ethnicity and income for 2009 were estimated for each county by using the bridged-race Vintage 2009 postcensal populations files to obtain race/ethnicity distributions and year 2000 census data to estimate income distributions. The method makes the approximation that, for each county, the income distribution of children was the same in 2000 and 2009. Children’s county-level populations by race/ethnicity in 2009 were obtained from the bridged-race Vintage 2009 postcensal populations files, at the url http://www.cdc.gov/nchs/nvss/bridged_race.htm. The race/ethnicity groups were summed as follows:
9 10 11 12 13 14 15 16 17 18 19
• White non-Hispanic: racesex = 1 and 2, hisp = 1, age <= 17 • Black non-Hispanic: racesex = 3 and 4, hisp = 1, age <= 17 • AIAN non-Hispanic: racesex = 5 and 6, hisp = 1, age <= 17 • API non-Hispanic: racesex = 7 and 8, hisp = 1, age <= 17 • Hispanic: racesex = 1, 2, … 8, hisp = 2, age <= 17 • All: racesex = 1, 2, … 8, hisp = 1 and 2, age <= 17
Year 2000 income distributions by county were obtained from the Census Bureau url http:/www.factfinder.census.gov. The SF4 Tables PCT141 “Ratio of Income in 1999 to Poverty Level” and PCT144 “Age by Ratio of Income in 1999 to Poverty Level” were obtained. The basic idea of the calculation is to estimate the number of children in a county and income group in the year 2009 as the number of children in the county in the year 2009 times the fraction of those children who were also in the income group. Since these fractions were not directly available for all counties in 2009, we used the corresponding fractions for the Census year 2000. For counties with large populations of children, these fractions for the year 2000 are easily calculated from the age-specific PCT144 tables. However, because of non-disclosure criteria limiting the reported populations to 100 or greater, these fractions were not always available for the age-specific PCT144 tables, and in such cases we instead used the fractions for all persons calculated from the non-age-specific PCT141 tables.
20 21 22 23 24 25 26 27 28 29 30 31 32 33 34 35 36 37 38 39 40 41 42 43 44
The PCT144 and PCT141 files were downloaded on November 3, 2005 and March 31, 2005, respectively, for the total population defined by the following race/ethnicity group:
• All: Code 001. Total population. The PCT141 tables give the distributions for all persons. Populations by income group in 2000 were summed over the poverty income ratio groups (by county) as follows:
• Below Poverty Level: Under 0.5, 0.5 to 0.74, 0.75 to 0.99 • 100 – 200% Poverty Level: 1 to 1.24, 1.25 to 1.49, 1.50 to 1.74, 1.75 to 1.84, 1.95 to 1.99 • > 200% Poverty Level: 2.00 and over • Total. Sum over all poverty income ratio groups
February 2011 DO NOT QUOTE OR CITE

Environments and Contaminants: Criteria Air Pollutants
DRAFT Indicator for Third Edition of America’s Children and the Environment Page 33
1 2 3 4 5 6 7 8 9
10 11 12 13 14 15 16 17 18 19 20 21 22 23 24 25 26 27 28 29 30 31 32 33 34 35 36 37 38 39 40 41 42 43 44
The PCT144 tables give the same income distributions by age group and county. Populations by income group in 2000 were summed over the same income groups (by county) as for PCT141 and for children ages 0 to 17 years (summing groups: Under 5 years, 5 years, 6 to 11 years, 12 to 14 years, 15 years, 16 and 17 years). Income distributions by county (for 2000) were calculated by dividing the population by income group in 2000 by the population summed over all income groups. For example, Ratio for children Below Poverty Level for County C = Population Below Poverty Level for County C, ages <= 17, from PCT144 / Population Total for County C, ages <= 17, from PCT144 If RATIO = Fraction of children in income group G for county C, then the estimated children’s population by county and income group in 2009 is given by: Population (county C, income group G) = RATIO (Census 2000, PCT141 or PCT144, county C, income group G)
× Population (2009 Bridged Race, children age ≤ 17, county C) For many county/age/income combinations the populations by age and income group were not reported in the SF4 files, usually for confidentiality reasons. If so, the RATIO for children in county C was replaced by an estimated RATIO from a larger demographic and/or geographical group. These ratios were calculated for children using PCT144 and for all persons using PCT141, either by county or summed over each state. The substituted ratios were calculated in the following order:
1. Children only. Same county. 2. All ages. Same county. 3. Children only. Same state. 4. All ages. Same state.
If the ratios could not be calculated using method 1, then we used the other three methods, in turn, until we had a non-missing ratio. Questions and Comments Questions regarding these methods, and suggestions to improve the description of the methods, are welcome. Please use the “Contact Us” link at the bottom of any page in the America’s Children and the Environment website. Statistical Comparisons
February 2011 DO NOT QUOTE OR CITE

Environments and Contaminants: Criteria Air Pollutants
DRAFT Indicator for Third Edition of America’s Children and the Environment Page 34
1 2 3 4 5 6 7 8 9
10 11 12 13 14 15 16 17 18 19
Statistical analyses of the percentages of children ages 0 to 17 years living in counties exceeding air quality standards were used to determine whether the trends in the percentages for different years were statistically significant. Using a logistic regression model, the logarithm of the odds that a child lives in a county exceeding air quality standards is regressed against the calendar year. To avoid potential statistical issues associated with very low or very high percentages, each percentage was first rescaled to be between 5% and 95% before computing the odds. The error terms for this logistic regression were assumed to be approximately independent and normally distributed. For each criteria air pollutant, the slope of the regression line for the logarithm of the odds was computed, together with a 95% confidence interval and its p-value. The slope estimates the annual change in the logarithm of the odds. A p-value at or below 0.05 implies that the trend is statistically significant at the 5% significance level. No adjustment is made for multiple comparisons. The results are presented in Table 2. For more details on these statistical analyses, see the memorandum by Cohen (2010).xii
Table 2. Logistic regression trend test for the proportion of children ages 0 to 17 years living in counties in which air quality standards were exceeded in years 1999 to 2009.
Pollutant N Trend (annual change in log
odds)
95% Confidence Interval for
Trend: Lower Bound
95% Confidence Interval for
Trend: Upper Bound
P-value for Trend
Ozone (eight-hour)
11 -0.0388 -0.0730 -0.0046 0.031
PM10 (24-hour) 11 -0.0209 -0.0710 0.0291 0.368 PM2.5 (24-hour) 11 -0.0884 -0.1412 -0.0355 0.004 PM2.5 (annual) 11 -0.1371 -0.2020 -0.0722 0.001 Carbon monoxide
11 -0.0683 -0.1115 -0.0251 0.006
Lead 11 0.0357 0.0009 0.0705 0.046 Sulfur dioxide (one-hour)
11 -0.0906 -0.1060 -0.0753 < 0.0005
Nitrogen dioxide (one-hour)
11 -0.0729 -0.0895 -0.0563 < 0.0005
Any standard 11 -0.0459 -0.0811 -0.0107 0.016 20
xii Statistical methods for testing for trends and year-to-year changes to air quality measures. Memorandum from Jonathan Cohen, ICF, to Dan Axelrad, EPA, November 2010.
February 2011 DO NOT QUOTE OR CITE

Environments and Contaminants: Criteria Air Pollutants
DRAFT Indicator for Third Edition of America’s Children and the Environment Page 35
1 2 3 4 5 6 7 8 9
10 11 12 13 14 15 16 17 18 19 20 21 22 23 24 25 26 27 28 29 30 31 32 33
Methods Indicator E3 E3. Percentage of days with good, moderate, or unhealthy air quality for children ages 0 to 17 years, 1999-2009. Summary EPA’s Air Quality Index (AQI) classifies air quality as good, moderate, or unhealthy on a daily basis, for each county in the United States. The AQI is based on monitoring data for six criteria air pollutants. For each county, year, and day, the air quality index category for that day was obtained from EPA OAQPS. For each county and year, the annual numbers of days categorized as good, moderate, or unhealthy were counted. Indicator E3 is the national weighted average of these annual numbers, where the weights are the numbers of children ages 0 to 17 years living in each county, obtained from the Census Bureau. This is mathematically equivalent to the percentage of children’s days in each category. The supplementary tables for indicator E3 provide the percentages of days for children ages 0 to 17 years with good, moderate, or unhealthy air quality, stratified by race/ethnicity (Table E3a) or income (Table E3b), for the year 2009. Overview of Data Files The following files are needed to calculate this indicator:
• AQI data. This file contains the state and county FIPS codes, site id, POC, date, parameter code and the corresponding AQI for each parameter code.
• Census data. This file contains the state and county FIPS codes, year, and children’s population. For 1999, we obtained this information from the U.S. Census Bureau files:
Estimates of the Population of Counties by Age and Sex: 1990-1999, August 30, 2000. The file headers were “(C0-99-9) Population Estimates for Counties by Age and Sex: Annual Time Series July 1, 1990 to July 1, 1999.” http:/www.census.gov/popest/archives/1990s/CO-99-09.html. 34
35 36 37 38 39 40 41 42 43 44
These files give county populations by age and sex for 1990 to 1999. We summed these populations by year and county across all ages 0 to 17 years and both sexes.
For 2000-2009, we obtained this information from the bridged-race Vintage 2009 postcensal population file:
National Center for Health Statistics. Postcensal estimates of the resident population of the United States for July 1, 2000-July 1, 2009, by year, county, age, bridged race, Hispanic origin, and sex (Vintage 2009). Prepared under a collaborative arrangement with the U.S. Census Bureau; released June 20, 2010.
February 2011 DO NOT QUOTE OR CITE

Environments and Contaminants: Criteria Air Pollutants
DRAFT Indicator for Third Edition of America’s Children and the Environment Page 36
Available from: http://www.cdc.gov/nchs/nvss/bridged_race.htm as of July 23, 2010.
1 2 3 4 5 6 7 8 9
10 11 12 13 14 15 16 17 18 19 20 21 22 23 24 25 26
The populations by year and county were obtained by summing across the ages 0 to 17 inclusive.
Air Quality Data Air Quality Index (AQI) monitoring data from the EPA Air Quality System (AQS) for the years 1999 to 2009 were obtained from OAQPS staff.xiii These annual files give the air quality index for each monitor, day, and pollutant for which the AQI is defined. The AQI for a given county on a given day is obtained by determining the maximum of all available AQI values for that day across all monitors in the county and across all criteria air pollutants in the index. The following air quality index categories are assigned based on the breakpoints shown in Table 3: Good, Moderate, and Unhealthy (includes Unhealthy for Sensitive Groups, Unhealthy, Very Unhealthy, and Hazardous). Table 3 shows the calculation of the air quality index for each day and criteria air pollutant, based on the measured concentrations on that day. Note that these current AQI definitions do not reflect the current NAAQS for 24-hour PM2.5. The overall AQI category for a given monitor and day is defined as the highest AQI category among all the pollutants measured on that day, if any. The overall AQI category for a given county and day is defined as the highest AQI category among all the monitors in the county with air quality measurements on that day, if any. Table 3. Breakpoints for the AQI
This Breakpoint... ...equals this AQI
…and this category
O3 (ppm) 8-hour
Code 44201
O3 (ppm)
1-hour(1)
Code 44201
PM10 (µg/m3) 24-hour
Code 81102
PM2.5(µg/m3) 24-hour
Code 88101
CO (ppm) 8-hour Code 42101
SO2 (ppb) 1-hour Code 42401
NO2 (ppb) 1-hour Code 42602
AQI
0.000 - 0.059 - 0 - 54 0.0 - 15.4 0.0 - 4.4
0 - 35 0 - 53 0 - 50 Good
0.060 - 0.075 - 55 - 154
15.5 -40.4 4.5 - 9.4
36 - 75 54 - 100 51 - 100
Moderate
0.076 - 0.095 0.125 - 0.164
155 - 254
40.5 - 65.4 9.5 - 12.4
76 - 185 101 - 360 101 - 150
Unhealthy for
Sensitive
xiii Nick Mangus, [email protected], 919-541-5549. Daily AQI values for criteria pollutants where AQI is defined are also available from the AQS Data Mart. In order to retrieve these data, choose “values query” as the type of query, specify a geographic region of interest, and then choose “pollutants that have a AQI defined” as substance type on the first tab of AQS Data Mart access page. On the second tab, specify the time period of interest and choose “Daily AQIs - Daily Air Quality Index values by monitor and day” as the statistic.
February 2011 DO NOT QUOTE OR CITE
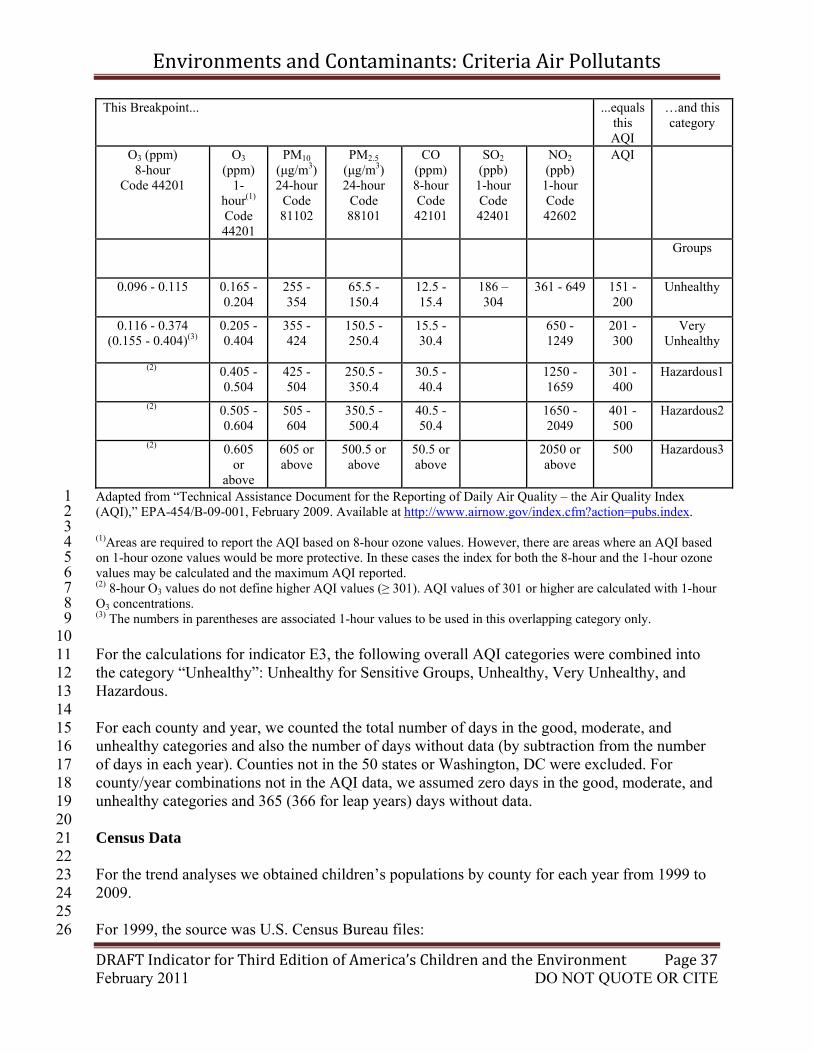
Environments and Contaminants: Criteria Air Pollutants
DRAFT Indicator for Third Edition of America’s Children and the Environment Page 37
This Breakpoint... ...equals this AQI
…and this category
O3 (ppm) 8-hour
Code 44201
O3 (ppm)
1-hour(1)
Code 44201
PM10 (µg/m3) 24-hour
Code 81102
PM2.5(µg/m3) 24-hour
Code 88101
CO (ppm) 8-hour Code 42101
SO2 (ppb) 1-hour Code 42401
NO2 (ppb) 1-hour Code 42602
AQI
Groups
0.096 - 0.115 0.165 - 0.204
255 - 354
65.5 - 150.4
12.5 - 15.4
186 – 304
361 - 649 151 - 200
Unhealthy
0.116 - 0.374 (0.155 - 0.404)(3)
0.205 - 0.404
355 - 424
150.5 - 250.4
15.5 - 30.4
650 - 1249
201 - 300
Very Unhealthy
(2) 0.405 - 0.504
425 - 504
250.5 - 350.4
30.5 - 40.4
1250 - 1659
301 - 400
Hazardous1
(2) 0.505 - 0.604
505 - 604
350.5 - 500.4
40.5 - 50.4
1650 - 2049
401 - 500
Hazardous2
(2) 0.605 or
above
605 or above
500.5 or above
50.5 or above
2050 or above
500 Hazardous3
Adapted from “Technical Assistance Document for the Reporting of Daily Air Quality – the Air Quality Index (AQI),” EPA-454/B-09-001, February 2009. Available at
1 http://www.airnow.gov/index.cfm?action=pubs.index. 2
3 4 5 6 7 8 9
10 11 12 13 14 15 16 17 18 19 20 21 22 23 24 25 26
(1)Areas are required to report the AQI based on 8-hour ozone values. However, there are areas where an AQI based on 1-hour ozone values would be more protective. In these cases the index for both the 8-hour and the 1-hour ozone values may be calculated and the maximum AQI reported. (2) 8-hour O3 values do not define higher AQI values (≥ 301). AQI values of 301 or higher are calculated with 1-hour O3 concentrations. (3) The numbers in parentheses are associated 1-hour values to be used in this overlapping category only. For the calculations for indicator E3, the following overall AQI categories were combined into the category “Unhealthy”: Unhealthy for Sensitive Groups, Unhealthy, Very Unhealthy, and Hazardous. For each county and year, we counted the total number of days in the good, moderate, and unhealthy categories and also the number of days without data (by subtraction from the number of days in each year). Counties not in the 50 states or Washington, DC were excluded. For county/year combinations not in the AQI data, we assumed zero days in the good, moderate, and unhealthy categories and 365 (366 for leap years) days without data. Census Data For the trend analyses we obtained children’s populations by county for each year from 1999 to 2009. For 1999, the source was U.S. Census Bureau files:
February 2011 DO NOT QUOTE OR CITE

Environments and Contaminants: Criteria Air Pollutants
DRAFT Indicator for Third Edition of America’s Children and the Environment Page 38
1 2 3 4
Estimates of the Population of Counties by Age and Sex: 1990-1999, August 30, 2000. The file headers are “(C0-99-9) Population Estimates for Counties by Age and Sex: Annual Time Series July 1, 1990 to July 1, 1999.” www.census.gov/popest/archives/1990s/CO-99-09.html. 5
6 7 8 9
10 11 12 13 14 15 16
These files give county populations by age and sex for 1990 to 1999. We summed these populations by year and county across all ages 0 to 17 years and both sexes. For 2000-2009, we used the bridged-race Vintage 2009 postcensal populations files obtained from the CDC website:
National Center for Health Statistics. Postcensal estimates of the resident population of the United States for July 1, 2000-July 1, 2009, by year, county, age, bridged race, Hispanic origin, and sex (Vintage 2009). Prepared under a collaborative arrangement with the U.S. Census Bureau; released June 20, 2010. Available from: http://www.cdc.gov/nchs/nvss/bridged_race.htm as of July 23, 2010. 17
18 19 20 21 22 23 24 25 26 27 28 29 30 31 32 33 34 35 36 37 38 39 40 41 42 43 44 45 46
The bridged Vintage 2009 postcensal population files contains estimates of the resident population of the United States as of July 1, 2000; July 1, 2001; July 1, 2002; July 1, 2003; July 1, 2004; July 1, 2005; July 1, 2006; July 1, 2007; July 1, 2008; and July 1, 2009 by county, single-year of age (0, 1, 2,..., 85 years and over), bridged-race category (White, Black or African American, American Indian or Alaska Native, Asian or Pacific Islander), Hispanic origin (not Hispanic or Latino, Hispanic or Latino), and sex. There is one file for each year. Files are available in SAS dataset and text formats; we used the SAS dataset format for these analyses. We extracted the following variables: state, county, age, racesex, hisp, and pop. The racesex variable is a single coded value for each combination of race and sex, e.g., racesex = 1 denotes White males. The value pop gives the population as of July 1 of the calendar year for a given state, county, age, racesex combination, and ethnicity. The county children’s populations for each year 2000-2009 were obtained by summing the variable pop over all ages <= 17, all values of “racesex” and all values of “hisp.” Calculation of Indicator Indicator E3 is calculated as follows. The percentage of days is calculated directly for three categories: Good, Moderate, or Unhealthy. The calculation is the same for each category; the following example is for the Good category. Define
Days (category G, county C, year Y) = number of days in AQI category G for county C, year Y
Pop (county C, year Y) = population of children in county C, year Y
These values are calculated as described above.
February 2011 DO NOT QUOTE OR CITE

Environments and Contaminants: Criteria Air Pollutants
DRAFT Indicator for Third Edition of America’s Children and the Environment Page 39
1 2 3 4 5 6 7 8 9
10 11 12 13 14 15 16 17 18 19 20 21 22 23 24 25 26 27 28 29 30 31 32 33 34 35 36 37 38
1. The county number of children’s days in category G is calculated as the number of G days in county C times the number of children in county C:
County children’s G days (G, C, Y) = Days (G, C, Y) × Pop (C, Y) 2. The national number of children’s days in category G is calculated by summing the county numbers over the counties:
National children’s G days (G, Y) = Σ County children’s G days in G (G, C, Y) where this sum is taken across all counties in all 50 states plus Washington, DC. 3. The county number of children’s days (in all categories) is calculated as the number of days in year Y (365, or 366 for leap years) times the county number of children:
County children’s days (C, Y) = 365 (or 366) × Pop (C, Y) 4. The national number of children’s days is calculated by summing the county numbers over the counties:
National children’s days (Y) = Σ County children’s days (C, Y) where this sum is taken across all counties in all 50 states plus Washington, DC. 5. The percentage of children’s days in category G is calculated by dividing the national children’s G days by the national children’s days and multiplying by 100 (to make it a percentage):
E3 = Percentage of children’s days in category G
= [National children’s G days (G, Y) / National children’s days (Y)] × 100% The numbers of unmonitored days are by definition the total number of good, moderate, and unhealthy days subtracted from the number of days in the year. To calculate the percentage of children’s days that are unmonitored you may either use the same method applied to the category of unmonitored days, or you may subtract the total of the percentages for good, moderate, and unhealthy children’s days from 100. Both approaches will give exactly the same answer. Race/Income39
40 41 42 43 44 45
The supplementary tables for Indicator E3 give the percentages of children’s days with good, moderate, or unhealthy air quality stratified by race/ethnicity (Table E3a) or family income (Table E3b), for the year 2009 only. The calculation of Tables E3a and E3b is exactly the same as for the trend analysis except that the county children’s populations are replaced by estimated county children’s populations for the given race/ethnicity or income groups in 2009.
February 2011 DO NOT QUOTE OR CITE

Environments and Contaminants: Criteria Air Pollutants
DRAFT Indicator for Third Edition of America’s Children and the Environment Page 40
1 2 3
Children’s county-level populations by race/ethnicity in 2009 were obtained from the bridged-race Vintage 2009 postcensal populations files, at the url http://www.cdc.gov/nchs/nvss/bridged_race.htm. The race/ethnicity groups were summed as follows:
4 5 6 7 8 9
10 11 12 13 14
• White non-Hispanic: racesex = 1 and 2, hisp = 1, age <= 17 • Black non-Hispanic: racesex = 3 and 4, hisp = 1, age <= 17 • AIAN non-Hispanic: racesex = 5 and 6, hisp = 1, age <= 17 • API non-Hispanic: racesex = 7 and 8, hisp = 1, age <= 17 • Hispanic: racesex = 1, 2, … 8, hisp = 2, age <= 17 • All: racesex = 1, 2, … 8, hisp = 1 and 2, age <= 17
Year 2000 income distributions by county were obtained from the Census Bureau url http:/www.factfinder.census.gov. The SF4 Tables PCT141 “Ratio of Income in 1999 to Poverty Level” and PCT144 “Age by Ratio of Income in 1999 to Poverty Level” were obtained. The basic idea of the calculation is to estimate the number of children in a county and income group in the year 2009 as the number of children in the county in the year 2009 times the fraction of those children that were also in the income group. Since these fractions were not directly available for all counties in 2009, we used the corresponding fractions for the Census year 2000. For counties with large populations of children, these fractions for the year 2000 are easily calculated from the age-specific PCT144 tables. However, because of non-disclosure criteria limiting the reported populations to 100 or greater, these fractions were not always available for the age-specific PCT144 tables, and in such cases we instead used the fractions for all persons calculated from the non-age-specific PCT141 tables.
15 16 17 18 19 20 21 22 23 24 25 26 27 28 29 30 31 32 33 34 35 36 37 38 39 40 41 42 43 44
The PCT144 and PCT141 files were downloaded on 11/3/2005 and 3/31/2005, respectively, for the total population defined by the following race/ethnicity group:
• All: Code 001. Total population. The PCT141 tables give the distributions for all persons. Populations by income group in 2000 were summed over the poverty income ratio groups (by county) as follows:
• Below Poverty Level: Under 0.5, 0.5 to 0.74, 0.75 to 0.99 • 100 – 200% Poverty Level: 1 to 1.24, 1.25 to 1.49, 1.50 to 1.74, 1.75 to 1.84, 1.95 to 1.99 • > 200% Poverty Level: 2.00 and over • Total. Sum over all poverty income ratio groups
The PCT144 tables give the same income distributions by age group and county. Populations by income group in 2000 were summed over the same income groups (by county) as for PCT141 and for children ages 0 to 17 (summing groups: Under 5 years, 5 years, 6 to 11 years, 12 to 14 years, 15 years, 16 and 17 years).
February 2011 DO NOT QUOTE OR CITE
Environments and Contaminants: Criteria Air Pollutants
DRAFT Indicator for Third Edition of America’s Children and the Environment Page 41
1 2 3 4 5 6 7 8 9
10 11 12 13 14 15 16 17 18 19 20 21 22 23 24 25 26 27 28 29 30 31 32
33 34 35 36 37 38 39 40 41 42 43 44
Income distributions by county (for 2000) were calculated by dividing the population by income group in 2000 by the population summed over all income groups. For example, Ratio for children Below Poverty Level for County C = Population Below Poverty Level for County C, ages <= 17, from PCT144 / Population Total for County C, ages <= 17, from PCT144 If RATIO = Fraction of children in income group G for county C, then the estimated children’s population by county and income group in 2009 is given by: Population (county C, income group G) = RATIO (Census 2000, PCT141 or PCT144, county C, income group G)
× Population (2009 Bridged Race, children age ≤ 17, county C) For many county/age/income combinations the populations by age and income group were not reported in the SF4 files, usually for confidentiality reasons. If so, the RATIO for children in county C was replaced by an estimated RATIO from a larger demographic and/or geographical group. These ratios were calculated for children using PCT144 and for all persons using PCT141, either by county or summed over each State. The substituted ratios were calculated in the following order:
1. Children only. Same county. 2. All ages. Same county. 3. Children only. Same state. 4. All ages. Same state.
If the ratios could not be calculated using method 1, then we used the other three methods, in turn, until we had a non-missing ratio. Questions and Comments
Questions regarding these methods, and suggestions to improve the description of the methods, are welcome. Please use the “Contact Us” link at the bottom of any page in the America’s Children and the Environment website. Statistical Comparisons Statistical analyses of the percentages of days for children ages 0 to 17 years with good, moderate, or unhealthy air quality were used to determine whether the trends in the percentages for different years were statistically significant. Using a logistic regression model, the logarithm of the odds that a children’s day has good, moderate, or unhealthy air quality is regressed against the calendar year. To avoid potential statistical issues associated with very low or very high percentages, each percentage was first rescaled to be between 5% and 95% before computing the
February 2011 DO NOT QUOTE OR CITE

Environments and Contaminants: Criteria Air Pollutants
DRAFT Indicator for Third Edition of America’s Children and the Environment Page 42
1 2 3 4 5 6 7 8 9
10 11 12 13
odds. The error terms for this logistic regression were assumed to be approximately independent and normally distributed. For each air quality index category, the slope of the regression line for the logarithm of the odds was computed, together with a 95% confidence interval and its p-value. The slope estimates the annual change in the logarithm of the odds. A p-value at or below 0.05 implies that the trend is statistically significant at the 5% significance level. No adjustment is made for multiple comparisons. The results are presented in Table 4. For more details on these statistical analyses, see the memorandum by Cohen (2010).xiv
Table 4. Logistic regression trend test for the proportion of days for children ages 0 to 17 years with good, moderate, or unhealthy air quality in years 1999 to 2009.
Pollution Level N Trend (annual change in log
odds)
95% Confidence Interval for
Trend: Lower Bound
95% Confidence Interval for
Trend: Upper Bound
P-value for Trend
Good 11 0.0438 0.0316 0.0560 < 0.0005 Moderate 11 -0.0297 -0.0432 -0.0161 0.001 Unhealthy 11 -0.0507 -0.0635 -0.0378 < 0.0005
No Monitoring Data 11 -0.0053 -0.0119 0.0013 0.101
14
xiv Statistical methods for testing for trends and year-to-year changes to air quality measures. Memorandum from Jonathan Cohen, ICF, to Dan Axelrad, EPA, November 2010.
February 2011 DO NOT QUOTE OR CITE