children of war: the long-run effects of large-scale ...ftp.iza.org/dp4407.pdf · children of war:...
TRANSCRIPT
DI
SC
US
SI
ON
P
AP
ER
S
ER
IE
S
Forschungsinstitut zur Zukunft der ArbeitInstitute for the Study of Labor
Children of War: The Long-Run Effects of Large-Scale Physical Destruction and Warfare on Children
IZA DP No. 4407
September 2009
Mevlude Akbulut-Yuksel
Children of War: The Long-Run Effects
of Large-Scale Physical Destruction and Warfare on Children
Mevlude Akbulut-Yuksel Dalhousie University,
HICN and IZA
Discussion Paper No. 4407 September 2009
IZA
P.O. Box 7240 53072 Bonn
Germany
Phone: +49-228-3894-0 Fax: +49-228-3894-180
E-mail: [email protected]
Any opinions expressed here are those of the author(s) and not those of IZA. Research published in this series may include views on policy, but the institute itself takes no institutional policy positions. The Institute for the Study of Labor (IZA) in Bonn is a local and virtual international research center and a place of communication between science, politics and business. IZA is an independent nonprofit organization supported by Deutsche Post Foundation. The center is associated with the University of Bonn and offers a stimulating research environment through its international network, workshops and conferences, data service, project support, research visits and doctoral program. IZA engages in (i) original and internationally competitive research in all fields of labor economics, (ii) development of policy concepts, and (iii) dissemination of research results and concepts to the interested public. IZA Discussion Papers often represent preliminary work and are circulated to encourage discussion. Citation of such a paper should account for its provisional character. A revised version may be available directly from the author.
IZA Discussion Paper No. 4407 September 2009
ABSTRACT
Children of War: The Long-Run Effects of Large-Scale
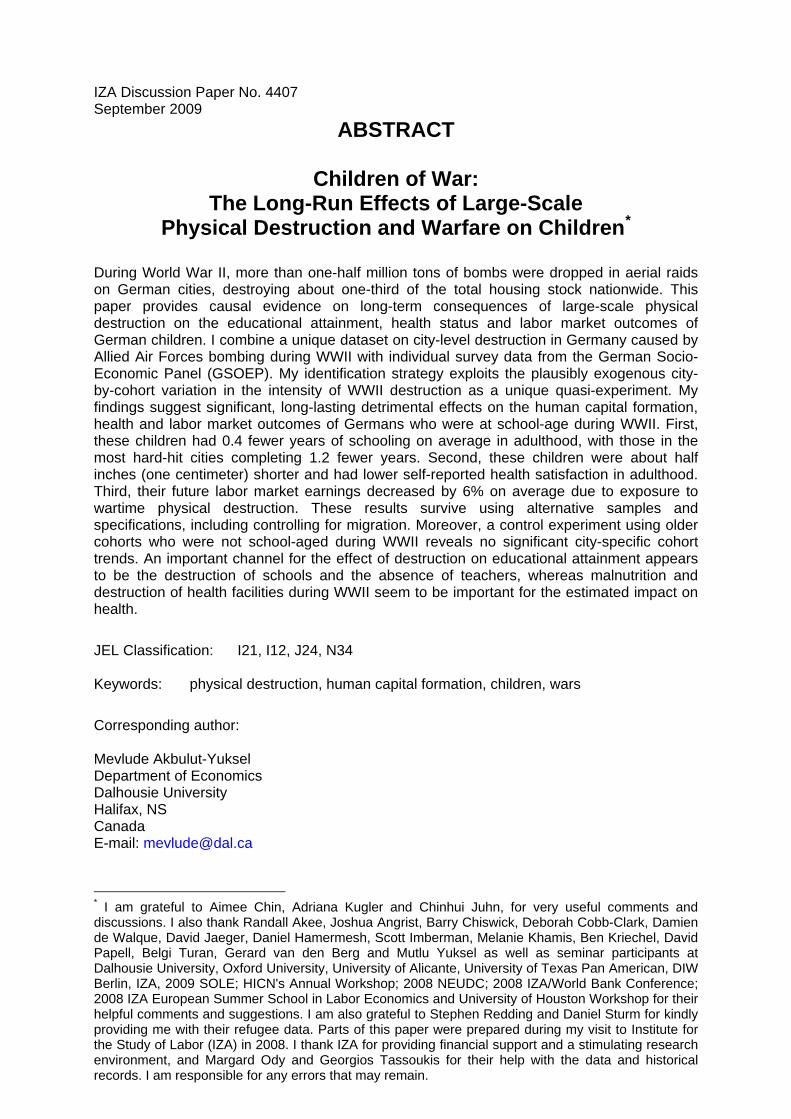
Physical Destruction and Warfare on Children* During World War II, more than one-half million tons of bombs were dropped in aerial raids on German cities, destroying about one-third of the total housing stock nationwide. This paper provides causal evidence on long-term consequences of large-scale physical destruction on the educational attainment, health status and labor market outcomes of German children. I combine a unique dataset on city-level destruction in Germany caused by Allied Air Forces bombing during WWII with individual survey data from the German Socio-Economic Panel (GSOEP). My identification strategy exploits the plausibly exogenous city-by-cohort variation in the intensity of WWII destruction as a unique quasi-experiment. My findings suggest significant, long-lasting detrimental effects on the human capital formation, health and labor market outcomes of Germans who were at school-age during WWII. First, these children had 0.4 fewer years of schooling on average in adulthood, with those in the most hard-hit cities completing 1.2 fewer years. Second, these children were about half inches (one centimeter) shorter and had lower self-reported health satisfaction in adulthood. Third, their future labor market earnings decreased by 6% on average due to exposure to wartime physical destruction. These results survive using alternative samples and specifications, including controlling for migration. Moreover, a control experiment using older cohorts who were not school-aged during WWII reveals no significant city-specific cohort trends. An important channel for the effect of destruction on educational attainment appears to be the destruction of schools and the absence of teachers, whereas malnutrition and destruction of health facilities during WWII seem to be important for the estimated impact on health.
JEL Classification: I21, I12, J24, N34 Keywords: physical destruction, human capital formation, children, wars
Corresponding author: Mevlude Akbulut-Yuksel Department of Economics Dalhousie University Halifax, NS Canada E-mail: [email protected]
* I am grateful to Aimee Chin, Adriana Kugler and Chinhui Juhn, for very useful comments and discussions. I also thank Randall Akee, Joshua Angrist, Barry Chiswick, Deborah Cobb-Clark, Damien de Walque, David Jaeger, Daniel Hamermesh, Scott Imberman, Melanie Khamis, Ben Kriechel, David Papell, Belgi Turan, Gerard van den Berg and Mutlu Yuksel as well as seminar participants at Dalhousie University, Oxford University, University of Alicante, University of Texas Pan American, DIW Berlin, IZA, 2009 SOLE; HICN's Annual Workshop; 2008 NEUDC; 2008 IZA/World Bank Conference; 2008 IZA European Summer School in Labor Economics and University of Houston Workshop for their helpful comments and suggestions. I am also grateful to Stephen Redding and Daniel Sturm for kindly providing me with their refugee data. Parts of this paper were prepared during my visit to Institute for the Study of Labor (IZA) in 2008. I thank IZA for providing financial support and a stimulating research environment, and Margard Ody and Georgios Tassoukis for their help with the data and historical records. I am responsible for any errors that may remain.
1. Introduction
Large and aggregate shocks caused by natural disasters and wars have devastating
consequences for a country, including loss of lives, displacement of people, destruction of
physical capital and public infrastructure, and reduction in economic growth. Evidence from
macro-level studies suggests rapid recovery such that within 20-25 years, physical capital
and other macroeconomic outcomes return to their steady state.1 However, the direct and
indirect legacies of these events along human dimensions could be longer lasting and as
serious as physical impacts. On the one hand, natural disasters and wars can have direct
consequences on households through loss of loved ones, change in family structure and
deprivation of resources. On the other hand, large-scale physical destruction arising from
these unfortunate events can inflict indirect long-term burdens on survivors.
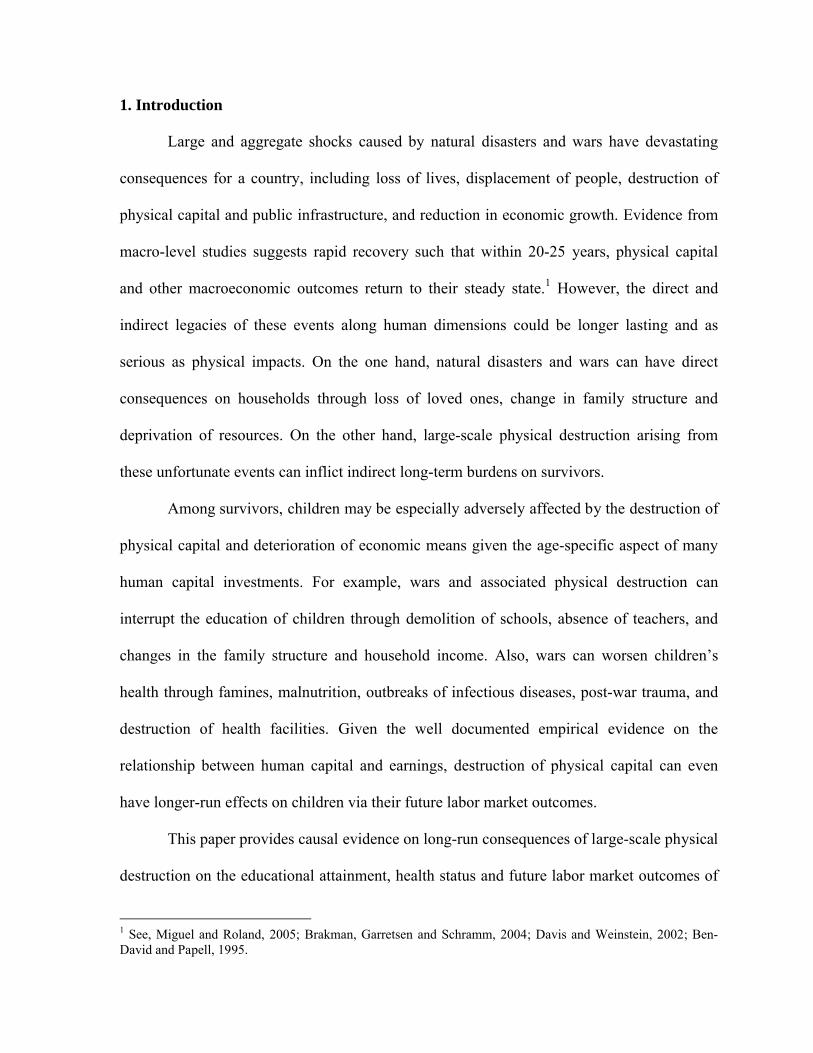
Among survivors, children may be especially adversely affected by the destruction of
physical capital and deterioration of economic means given the age-specific aspect of many
human capital investments. For example, wars and associated physical destruction can
interrupt the education of children through demolition of schools, absence of teachers, and
changes in the family structure and household income. Also, wars can worsen children’s
health through famines, malnutrition, outbreaks of infectious diseases, post-war trauma, and
destruction of health facilities. Given the well documented empirical evidence on the
relationship between human capital and earnings, destruction of physical capital can even
have longer-run effects on children via their future labor market outcomes.
This paper provides causal evidence on long-run consequences of large-scale physical
destruction on the educational attainment, health status and future labor market outcomes of
1 See, Miguel and Roland, 2005; Brakman, Garretsen and Schramm, 2004; Davis and Weinstein, 2002; Ben-David and Papell, 1995.

2
children. Specifically, I use city-by-cohort variation in destruction in Germany arising from
Allied Air Forces (hereafter, "AAF") bombing during World War II as a unique quasi-
experiment to estimate the effects of warfare and physical destruction on the human capital
and earnings of individuals who were school-aged during WWII. This should be of interest
for several reasons. First, WWII was a major, transformative event in modern history and it is
important to understand its long-term effects. Moreover, it informs on the general question of
how war and destruction of physical capital impact human capital formation and earnings in
the future. Armed conflicts seem to have gotten more common and more physically
destructive in recent years (Collier, Hoeffler and Rocher, 2008), making it policy-relevant to
understand the long-run effects of armed conflicts and the mechanisms through which they
impact children; to the extent that armed conflicts have long-run detrimental effects on
children's human capital and labor market outcomes, policymakers can devise policies and
programs to stem these effects.
My analysis combines a unique dataset on the extent of WWII destruction for each
German Regional Policy Region (Raumordnungsregionen, hereafter, "ROR", "region" or
"city")2 with individual-level data from a nationally-representative survey, the German
Socio-Economic Panel (GSOEP). WWII destruction in Germany was caused primarily by the
extensive bombing campaigns of the Allied Air Forces. AAF air raids destroyed or heavily
damaged approximately 30 percent of the total housing stock nationwide and 45 percent of
the housing stock in large cities (USSBS, 1945; Diefendorf, 1993).
On the one hand, some cities experienced greater destruction than others. I discuss the
determinants of destruction in detail section 3; the essential point is that the intensity of
2 The analysis is restricted to former West Germany. West Germany comprises of 75 RORs. RORs are analogous to metropolitan statistical areas (MSAs) in the U.S., though, in contrast to MSAs, RORs also encompass rural areas; that is, all of Germany, regardless of urbanicity, belongs to an ROR.
3
WWII destruction depended on fixed city characteristics (e.g., larger cities or cities with
more visible landmarks were more likely to be targets of air raids) and chance (due to the
technology and weather, only part of the time the intended exact target was hit and the
maximal damage caused). On the other hand, only individuals who were at school-going age
during WWII (hereafter, "the affected cohorts") would have had their human capital
investment affected by WWII destruction; the human capital of cohorts born after WWII
would not be affected by this destruction.3 This leads me to use a difference-in-differences-
type strategy where the "treatment" variable is an interaction between city-level intensity of
WWII destruction and dummy for being school-aged during WWII, and where I always
control for city fixed effects and cohort fixed effects. The identifying assumption is that had
the WWII destruction not occurred, the difference in schooling, health and labor market
outcomes between the affected cohorts and the cohorts born after WWII would have been the
same across cities of varying intensity of destruction.
This paper makes several contributions. First, there are very few micro-level studies
that rigorously quantify the long-term effects of physical destruction on children's human
capital and labor market outcomes and this paper adds to this growing literature. To the best
of my knowledge, none of these studies use as detailed data on war damage and look at the
longer-run outcomes as this paper. I have collected rubble per capita and bombing intensity
data from historical and military archives for each of Germany's 75 regions which enable me
to quantify the realized wartime physical destruction. In contrast, the other studies (Akresh
and de Walque, 2008; Shemyakina, 2006 and Ichino and Winter-Ebmer, 2004) use a measure
of exposure to war that has limited spatial variation (only across countries, or across a few
3 As explained in section 4, I will use individuals born between 1951 and 1960 as the control group. Individuals born 1940 and 1950 are dropped since their exposure to WWII destruction is not clear; though they would have started school after WWII ended, of course reconstruction did not occur overnight.
4
regions within a country), and they have no or limited information on the intensity of war
exposure. Measuring exposure to war at a lower level of aggregation enables me to match the
treatment to each individual more accurately and form more plausible control groups.4
Second, I look at longer-run outcomes including adult mortality, health satisfaction and
earnings than some of these other papers; the conflicts studied in other papers are more
recent, so very long-run outcomes are yet to be realized. Third, in contrast to recent micro-
level studies, availability of prewar and postwar city-level data and a wide range of war-
related questions in GSOEP enable me to rigorously investigate the potential mechanisms by
which war destruction affected the human capital, health status and labor market outcomes of
school-age children during WWII.
To preview my results, I find that large-scale physical destruction had detrimental
effects on education, health and labor market outcomes even after 40 years. First, children
who were school-aged during WWII had 0.4 fewer years of schooling on average in
adulthood, with those in the most hard-hit cities completing 1.2 fewer years. Second, these
children were about half inches (one centimeter) shorter and had lower self-reported health
satisfaction in adulthood. Third, exposure to war deteriorates future labor market earnings of
these children by 6 percent on average. An important channel for the effect of destruction on
educational attainment appears to be the destruction of schools and the absence of teachers,
whereas malnutrition and destruction of hospitals during WWII seems to be important for the
estimated effects on health. Finally, I find that wartime destruction impacted both educational
attainment and health status of children in the long-run and these are likely to have separate
4 It is worth noting that Miguel and Roland (2006) measure bombing intensity in Vietnam at the district level, which is even, lower a level of aggregation than I use here. However, their analysis is not at the individual level (it is at the district level) and they do not examine children's education and health outcomes (their only human-capital-related variable is fraction of the population that is literate).

5
direct effects on the future labor market earnings.5 Some papers use exposure to war, other
childhood shocks, natural disasters, macroeconomic crises, quarter of birth and distance to
school to generate an instrumental variable of education to estimate the causal effect of
education on earnings. However, my analysis shows that these instruments may also have a
direct impact on other forms of human capital such as health. Thus, this raises the question of
whether these instrumental-variables satisfy the exclusion restrictions.
The remainder of the paper is organized as follows. Section 2 reviews the related
literature. Section 3 provides a brief background of AAF bombing in Germany during WWII.
Section 4 discusses the identification strategy. Section 5 describes the city-level destruction
data and individual-level survey data used in the analysis. Section 6 presents the main results,
extensions and robustness checks. Section 7 concludes.
2. Literature Review
An extensive literature looks at the association between armed conflicts and
countries’ socioeconomic performance from a macro perspective. One set of studies has
focused on the impact of U.S. bombing on post-war macroeconomic outcomes at the city or
regional level. Studies that examine the long-run effects of U.S. bombing during WWII-
including in Japan (Davis and Weinstein, 2002) and in Germany (Brakman, Garretsen and
Schramm, 2004)-find no evidence for the persistent impacts of the bombing on local
population or economic performance. Using the extensive U.S. bombing campaigns in
5 This paper provides evidence on the consequences of WWII in the intensive margin, where I exploit city-by-cohort variation in war damage within Germany. To get better understanding on the nation-wide effects of WWII in Germany, I exploit only cohort variation in WWII exposure. This analysis reveals that the affected cohorts experience deterioration not only in their educational attainment and earnings, but also in several measures of health including adult height and health satisfaction (the results are available upon request from author). This finding suggests that such large and aggregate shocks can impact affected cohorts’ future earnings through reduction in education as well as deterioration of adult health.

6
Vietnam during the Vietnam War as a quasi experiment, Miguel and Roland (2005) revisit
the same question. They provide similar evidence suggesting that U.S. bombing did not have
any long-lasting effects neither on physical infrastructure and local population, nor on
literacy and poverty levels, 25 years after the Vietnam War. Thus, this strand of the literature
finds that war impacts are limited mainly to the temporary destruction of physical capital, in
line with the predictions of the neoclassical economic growth models that suggest rapid
recovery to pre-war equilibrium levels.
Due to data constraints however, only handful of studies have attempted to provide
micro-level evidence on the cost of armed conflicts on civilians’ outcomes, in particular
those of children.6 Using two cross-sectional household surveys collected before and after the
genocide in Rwanda, contemporaneous work by Akresh and de Walque (2008) find that
school-age children exposed to the genocide in 1994 attain 0.5 fewer years of schooling and
are less likely to complete third or fourth grade. Angrist and Kugler (2008) show that an
exogenous upsurge in conflict activities arising from increase in coca prices and cultivation
in Colombia has a negative effect on teenager boys’ school enrollment. Shemyakina (2006)
examines the effects of civil conflict in Tajikistan and finds that girls residing in conflict
areas are less likely to complete secondary school education; however, the civil conflict had
little, or no, effect on educational attainment of boys. Using WWII as an instrumental
variable to estimate the causal effect of education on earnings, Ichino and Winter-Ebmer
(2004) find that individuals who were 10 years old during or immediately after WWII
6 However, an extensive prior literature has focused on the impact of military service on the human capital accumulation and later labor market outcomes of combatants in US, Europe and Africa (Angrist, 1990, 1998; Angrist and Krueger, 1994; Imbens and van der Klaauw, 1995; Blattman and Annan, 2009). However, veterans are likely to be impacted by the war in different dimensions than the rest of the population who are not involved in the war; therefore studies on veterans provide limited information on the impact of wars on the civilian population and children.

7
acquire less education and earned significantly less in adulthood compared to other cohorts
within Germany and Austria as well as to individuals of the same cohort born in non-war
countries (namely, Switzerland and Sweden). They argue that WWII exposure affects these
individuals only through deteriorating their human capital.
This study also closely relates to literature looking at the causal association between
early childhood shocks, including exposure to war, crop failure, famine, diseases,
macroeconomic crises, and children's health status. The existing literature on Africa finds
that malnutrition caused by civil conflicts and crop failures in Africa hinders the physical
development of children.7 The empirical evidence from developed and other developing
countries further documents the importance of childhood environment on later life outcomes.
In accordance with the fetal origins hypothesis (Baker, 1992), these studies find that
malnutrition and poor living conditions in-utero and during early childhood deteriorate the
adulthood outcomes including health status and height (Banerjee, Duflo, Postel-Vinay and
Watts, 2009), educational level and labor market earnings (Almond, 2006; Case and Paxson,
2006; Qian and Meng, 2006) and life expectancy (Van den Berg, Lindeboom and Portrait,
2006).
To summarize, there have been very few papers on the effects of wartime physical
destruction on children's educational, health and labor market outcomes. This paper adds new
evidence to this growing literature. First, I use a source of variation in armed conflict that
others have not used before-the variation in physical destruction caused by bombing during
WWII across cities within Germany. Second, I am able to measure exposure to armed
conflict at a lower level of aggregation than other micro-level studies have done.
7 See, Alderman, Hoddinott and Kinsey, 2004; Akresh, Verwimp and Bundervoet, 2007; Bundervoet, Verwimp and Akresh, 2007.

8
Additionally, I look at longer-run outcomes than some of these other papers including labor
market earnings, adult mortality and self-rated health satisfaction; the conflicts in Africa and
former Soviet Union are more recent, so very long-run outcomes are yet to be realized.
3. Background on Allied Bombing of German Cities during WWII8
During World War II, German cities experienced the widespread bombardment of the
Allied Air Forces. Bomber Command's area offensive represented "true air warfare" and the
bombing campaign was the only offensive action in Germany between June 1940 and June
1944 (Werrell, 1986). As a result of AAF aerial attacks, 30 % of the total housing stock
nationwide and approximately 45 % of the housing stock in the large cities were destroyed or
heavily damaged. Though most of the destroyed buildings were apartment buildings; schools,
hospitals and other kinds of public buildings were also destroyed in every city.
An overwhelming majority of AAF’s aerial attacks consisted of "area bombing" at
night rather than "precision bombing". Sir Arthur Harris, the commander chief of RAF,
regarded area bombing as the most promising method of aerial attacks. The aim of area
bombing was to start a fire in the center of the each town, which-it was hoped-would
consume the whole town. At the same time, Sir Harris and his staff had a strong faith in the
morale effects of bombing and thought that Germany's will to fight could be destroyed by the
destruction of German cities (USSBS, 1945).
During area aerial attacks, AAF went on to bomb almost every major and minor
German city, though the number of bombs dropped and the intensity of destruction varied
8 Information presented in this section is mainly gathered from the following historical sources: (i) the United States Strategic Bombing Survey (USSBS) (1945); (ii) Diefendorf (1993) "In the Wake of War: The Reconstruction of German Cities after World War II; and (iii) Grayling (2006) "Among the Dead Cities: Was the Allied Bombing of Civilians in WWII a Necessity or a Crime?”

9
substantially across cities (the shaded area in Figure 1 shows the share of dwellings destroyed
in German cities by the end of WWII). The targeted cities were not necessarily selected
because they were particularly important for the war effort, but also for their visibility from
the air, depending for example on weather conditions or visibility of outstanding landmarks
such as cathedrals (Friedrich, 2002). On the other hand, cities in the northern and western
parts of Germany-those most easily reached from the air fields in England-suffered the most
destruction. As a result, Berlin was not hit as hard until the end of 1943 because of its great
distance from the bomber airfields of eastern England-it was nearly twice as far away as the
cities in Ruhr Area (Diefendorf, 1993; Grayling, 2006).
The foregoing discussion of the historical accounts of the attacks on German soil
suggest that the degree of destruction in German cities depended on fixed city characteristics
(e.g., larger cities and cities with more visible landmarks were more likely to be targets of air
raids) and chance (due to the technology and weather, only part of the time the intended
exact target was hit and the maximal damage caused). In my main analysis, I will take the
cross-regional variation in intensity of WWII destruction as exogenous once I control for
regional fixed effects.
4. Identification Strategy
In this section, I describe the quasi-experimental setting to identify the causal effect
of WWII destruction on education, health and labor market outcomes of German children.
This strategy exploits the plausibly exogenous city-by-cohort variation in destruction
intensity. This is a difference-in-differences-type strategy where the "treatment" variable is
an interaction between city-level intensity of WWII destruction and dummy for being school-
10
aged during WWII.9 In particular, the proposed estimate of the average treatment effect is
given by β in the following baseline city and birth cohort fixed effects equation:
Yirt = α + β (Intensityr×WWIIit) + δr + γt + π’Xirt + εirt (1)
where Yirt is the outcome of interest for individual i, in city r, born in year t. Intensityr is the
measure of destruction in city r. WWIIit is a dummy variable that takes a value of 1 if
individual i was born between 1924 and 1939 and zero otherwise. Individuals born between
1924 and 1939 were still at school-age during WWII and their schooling has the potential to
be affected by WWII destruction10. The human capital accumulation of individuals born after
WWII would not have been impacted by this destruction; hence these later birth cohorts are
in the control group.11 δr is city-specific fixed effects, controlling for the fact that cities may
be systematically different from each other. γt is the birth cohort-specific fixed effects,
controlling for the likely secular changes across cohorts. Since I will be using a single cross
section, γt accounts not only for cohort but also for age effects. Xirt is a vector of individual
characteristics including gender and rural dummies as well as family background
characteristics (e.g., parental education). εirt is a random, idiosyncratic error term. Following
9 This paper provides evidence on the impact of wartime physical destruction using city-by-cohort variation in wartime destruction within Germany; therefore this approach may yield lower bound estimates for the aggregate nation-wide effects of WWII on children’s human capital formation and labor market outcomes.10 When height is the outcome of interest, the affected cohorts are defined differently. Previous research has shown that adult height is largely determined by age 2 or 3 and is significantly influenced by the diet and health conditions in the early childhood years (Brainerd, 2008). Guided by this research, when I look at height, the treatment group is restricted to individuals who were born between 1937 and 1945. Therefore, for height regressions, dummy variable WWIIit takes a value of 1 if individual i was born between 1937 and 1945, and zero otherwise.11 As I explain below, I will use individuals born 1951-1960 as the control cohorts. Individuals born 1940-1950 are dropped since their exposure to WWII destruction is not clear; hence the reconstruction did not occur overnight. Figures 4 and Figure 6 provide further evidence suggesting that the schools and hospitals were indeed rebuilt in the early 1960s.
11
Bertrand, Duflo and Mullainathan (2004), the standard errors are clustered by city to account
for correlations in outcomes between individuals within the same cities.
In order to interpret β as the effect of war destruction, we must assume that had WWII
destruction not occurred, the difference in schooling, health and labor market outcomes
between the affected cohorts and cohorts born after WWII would have been the same across
cities of varying intensity of destruction. I assess the plausibility of this assumption below by
performing a falsification test/control experiment where I repeat the analysis using only
cohorts already beyond school age.
5. Data and Descriptive Statistics
The measure of WWII destruction intensity I use for my main analysis is from
Kaestner (1949), who reports the results of a survey undertaken by the German Association
of Cities ("Deutscher Staedtetag"). Kaestner (1949) provides city-level information on the
aggregate residential rubble in m3 per capita in German cities by the end of WWII, which is
what I use as a measure of city’s overall wartime destruction. Rubble arising from
destruction of industrial buildings, inventories, machines and traffic facilities was not
included into the calculations.12 In order to examine prewar conditions and assess the
mechanisms through which WWII destruction might have affected children's long-run
outcomes, I gathered data from various years of the German Statistical Yearbooks. First, I
assembled city-year data on the number of schools and number of teachers; of particular
interest is the change in the number of schools and teachers immediately before and after the
war because this would have been the change in school inputs available to the affected
12 This same source also provides information on the percentage of the residential dwellings destroyed in 1946 in the territory of former West Germany. The correlation between these two measures of WWII destruction is 0.9; thus I present the results with rubble per capita measure.
12
cohorts. Second, I collected city-year data on number of hospitals from various years of the
German Statistical Yearbook to analyze the availability of health facilities. Additionally, I
compiled data from 1939 German Statistical Yearbook on prewar city characteristics
including average income per capita, total area and population size.
The data on individual and household characteristics come from the confidential
version of German Socio-Economic Panel (GSOEP). GSOEP is a household panel survey
that is representative for the entire German population residing in private households. It
provides a wide range of information on individual and household characteristics as well as
parental background and the childhood environment in which one grows up. The GSOEP
also incorporates war-related questions including whether father was involved in WWII and
whether parents died during the war years. I restrict the empirical analysis to individuals born
between 1924 and 1960. I dropped individuals born between 1940 and 1950 from the
analysis since their exposure to WWII destruction is not as clear.13
I consider WWII destruction impacts at the Regional Policy Regions (RORs) level
which are spatial units defined by the Federal Office for Building and Regional Planning
(Bundesamt fuer Bauwesen und Raumordnung, BBR), to differentiate between areas in
Germany based on their economic interlinkages. Germany has 75 different regional policy
regions in Germany (see Figure 2 for detailed information on RORs). GSOEP is the only
German dataset that provides information on the location of German households at ROR
level along with other individual and household level information.14 The GSOEP reports
13 The empirical findings are qualitatively similar if I use the entire sample and different cutoffs. The results for entire sample, where these 1940-1950 cohorts are added to the control group, are presented in Appendix Table 1. Point estimates tend to be smaller; this is not surprising since the control group now includes some cohorts that may have received partial treatment; i.e., they were affected to some extent by the destruction since reconstruction did not occur overnight.14 It would have been appealing to use German Census data due to the much larger number of observations available compared to the GSOEP. Unfortunately it is not possible to identify the ROR in the census data, and
13
households’ ROR information starting from 1985; thus I conduct the empirical analysis with
the 1985 wave of GSOEP. For height estimations, however I utilize the 2002 wave since
GSOEP reports the individuals' height starting from 2002. I also restrict my analysis to West
Germany, for which I have the war destruction data.
The GSOEP provides information on cities where individuals are residing in 1985
onwards. Nevertheless, the GSOEP also asks respondents whether they still live in the city or
area where they grew up.15 This question helps me identify whether individuals still reside in
their childhood city or area. On the other hand, it is well documented that Germany has
historically low levels of geographic mobility in comparison to the U.S. and U.K. and that
mobility is particularly low during childhood and early adulthood (Rainer and Siedler, 2005;
Hochstadt, 1999). For example, mobility rates were very low during the period 1950-1970
among native Germans in former West Germany, with an annual migration rate between
states of around 0.02, defined as the ratio of number of migrants to or from a state within one
year by the population of that state (Hochstadt, 1999).16 At times of heavy aerial bombing,
the urban population may have fled into the countryside, seeking shelter, food, and
protection; nevertheless, historical accounts document that wartime displacement was
temporary. By June 1947, the urban population had reached 80 percent of prewar levels, then
nearly 90 percent in 1948 (Hochstadt, 1999).
in fact the least aggregate geographic identifier available in the census is the state. This would not provide adequate variation in intensity of WWII destruction.15 The GSOEP question based on which the movers are identified in this paper is "Do you still live in the city or area where you grew up until age 15?" with three possible responses "yes, still", "yes, again", and "no". I have coded individuals who answered this question as "yes, still" and "yes, again" as non-movers. The interpretation of city or area was left to the perception of the respondents; therefore it is likely that individuals are coded as movers even though they relocated within the same region rendering their exposure to WWII unchanged.16 In addition, individuals living in West Berlin in 1985 are excluded from the analysis as a robustness to avoid potential problems from East-West migration and the results are consistent with baseline specification.
14
To form the final dataset used in the analysis, I recoded the raw data on war
destruction using German regional boundaries (ROR) employed by GSOEP in 1985 and then
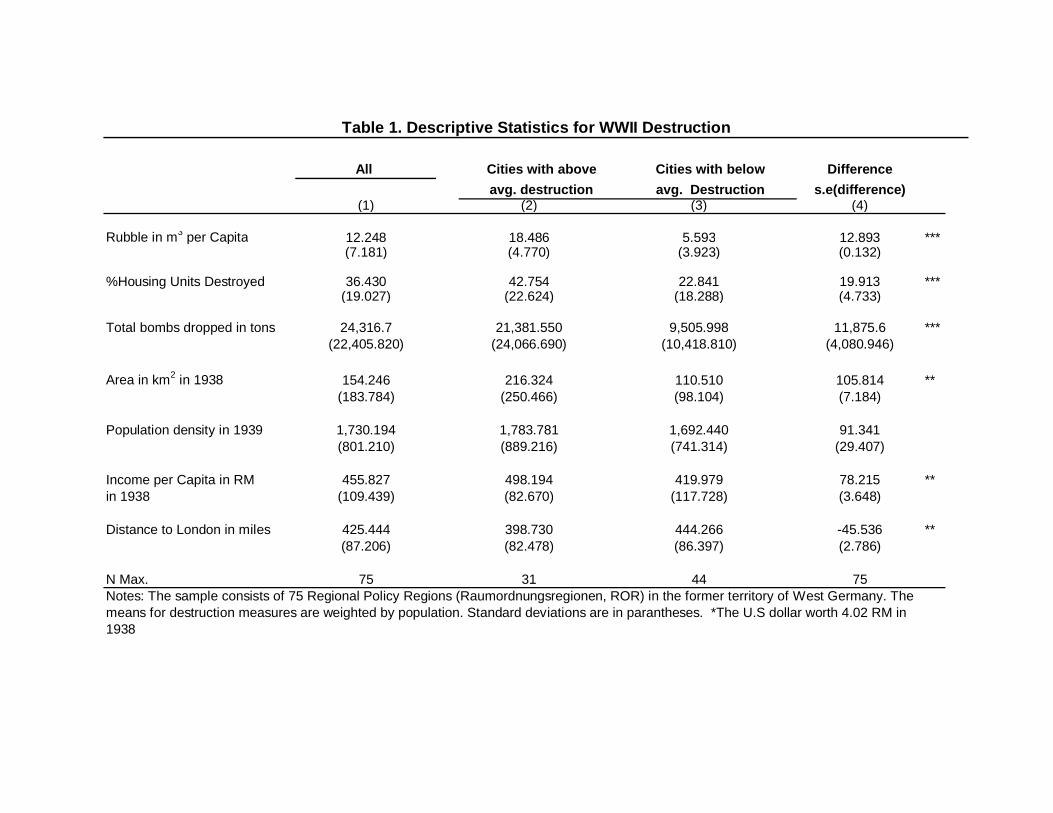
merged it by ROR with the individual-level data from the GSOEP.17 Table 1 presents the
descriptive statistics for population-weighted city-level war destruction measures and
variables measuring prewar conditions. Table 1 shows that the average West German lived in
a city that had a great deal of destruction-12.25 rubble in m3 per capita and 36% of total
housing units destroyed. There was variation across cities in destruction intensity; people in
cities with above-average destruction had over three times the rubble per capita as people in
cities with below-average destruction.18 Table 1 makes clear that highly destroyed cities are
different than less destroyed cities. For example, highly destroyed cities are larger in area and
have higher average income per capita in 1938. This highlights the fallacy of relying only on
cross-city variation in destruction to identify the effects of destruction; it is likely incorrect to
attribute all differences in children's education, health and labor market outcomes between
highly destroyed and less destroyed cities to war destruction because there are other
differences between these cities that are correlated with the outcomes too. The difference-in-
differences strategy I propose uses within-city cross-cohort variation to identify the effects of
destruction, and controls for fixed differences between cities and cohorts.19
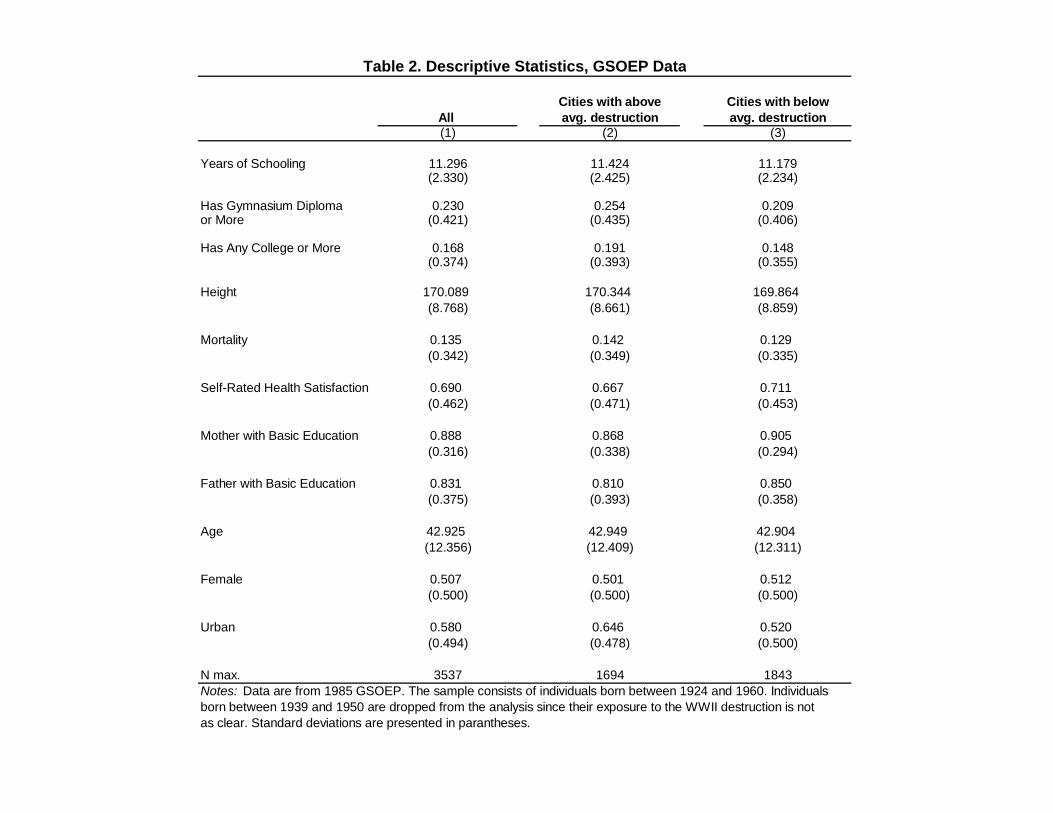
Table 2 shows the descriptive statistics of the outcomes and the main individual-level
control variables I will use in my estimation. One of the main outcomes of interest is years of
17 The data on rubble in m3 per capita is available for almost all municipalities with more than 12,000 inhabitants in 1939. Additional measures-schools, and teachers are only available for municipalities with more than 20,000 inhabitants in 1939. To obtain the regional averages of these variables, I merge municipalities using 1985 GSOEP regional borders.18 I divide the sample as above and below mean using rubble per capita as a measure of destruction.19 There is a concern that the observed differences in levels of city size and per capita income suggest possible differences in trends in children's outcomes. Below, I assess whether there are differential trends by doing a falsification test/control experiment using data on cohorts who would have completed their schooling before WWII.

15
schooling completed. The GSOEP asks respondents about educational attainment; then in the
data files maps these attainment categories into years of schooling. While most of my
regression analysis is with the years-of-schooling measure, I will also present results using
the attainment categories. I will also analyze health and labor market outcomes. I use three
measures of adult health including height, mortality and self-reported health satisfaction and,
for labor market outcomes, logarithm of hourly wage. These outcomes are measured four
decades after WWII, and reflect the outcomes of WWII survivors who lived to 1985 or later.
6. Estimation Results
6.1. Estimates of War Destruction on Children's Educational Attainment
Table 3 reports the results of estimating Equation 1 where the dependent variable is
completed years of schooling. Each column is from a separate regression that controls for
city and birth year fixed effects along with female and rural dummies. The difference-in-
differences estimate, β, is reported in the first row. It is negative and significant at 95% level
of confidence in every specification. Column (1) displays the difference-in-difference
estimates for the entire population. Column (1) has an estimated β of -0.028 which suggests
that WWII destruction caused school-age children to attain on average 0.4 fewer years of
schooling (this is the coefficient multiplied by the mean intensity of destruction). To gain a
better understanding on the magnitude of β, we can also compare the educational attainment
of school-going age children who were in Cologne (one of the heavily destroyed cities with
25.25 m3 rubble per capita) to that in Munich (one of the less destroyed cities with 6.50 m3
rubble per capita) during WWII.20 Using this comparison, column (1) suggests that children
20 These two cities were very similar in terms of their prewar characteristics, but Cologne was closer to bomber aerial fields in England and therefore was exposed to more destruction.

16
in Cologne had 0.6 fewer years of schooling compared to children in Munich as a result of
higher wartime destruction.21
Columns (2)-(4) of Table 3 present the results incorporating family background
characteristics, such as father's and mother's educational attainment which are likely to serve
as a proxy for parents' economic status.22 Columns (2)-(4) are from separate regressions
where the difference-in-difference coefficient varies by parental human capital. The first row
in columns (2)-(4) reports the estimation results for children whose parents had basic school
degree (Hauptschule) or less.23 Results summarized in columns (2)-(4) reveal that children
with less educated parents had a greater reduction in their educational attainment (first row).
On the other hand, interaction terms suggest that the negative effect of war damage is
mitigated for children whose parents have more than basic education (second and third rows).
This differential effect may work literally through parental education (e.g., more educated
parents value education more, and so ensure their children are educated too even if negative
shocks occur) or through other channels correlated with parental education such as family
income or wealth (e.g., rich families can afford to educate their children, and can hire private
tutors or send children to boarding schools when necessary).24
21 One may expect the effect of war destruction to be non-linear, e.g., when destruction surpasses a certain level then the detrimental effects become especially large, otherwise the effects are modest or negligible. To explore whether the negative effect of war devastation is more pronounced in most destroyed regions, I divide the destruction intensity measure into quartiles. This analysis show that children in most hard-hit regions attain 1.23 fewer years schooling relative to the control group; this effect is twice as large as for the second and bottom quartiles. 22 There is a concern that WWII destruction may also have impacted parental human capital. Regression of rubble per capita on parental educational attainment, controlling for city and cohort fixed characteristics reveals no statistically significant results suggesting that if anything, war damage has no impact on parental education. 23 The basic school diploma (Hauptschule) is granted after 9 years of schooling in Germany. As shown in Table 2 , the majority of children have parents with basic education or less (83% of fathers and 89% of mothers in my sample completed basic education or less).24 Additional specifications allow the difference-in-difference estimates to vary by gender and urban status. I find that there is no heterogeneity along gender or urban status (results available upon request).

17
Table 3 shows that war exposure decreases children's years of schooling by 0.4 years.
It is also useful to estimate the effect of destruction on educational attainment, i.e.,
probability of completing certain degrees. For example, does the effect in Table 3 come from
a reduction in middle school, secondary school or college completion? To assess at what
level of education the adverse effect of war shock is present, I estimate the following baseline
specification:
Yirtm = α + βm (Intensityr×WWIIit) + δr + γt + π’Xirmt + εirtm (2)
where the outcome of interest, Yirtm is a dummy variable that indicates whether the
individual i born in year t, in city r, completed m years of schooling or more. βm, for m=7 to
18, is the estimated effect of the WWII destruction for probability of completing each levels
of education. The estimation results for difference-in-difference estimates are plotted in
Figure 3 (the 95% confidence interval is also shown). Each point in Figure 3 is from a
separate regression where the outcome is a dummy variable that takes a value of 1 if
individual completed m years of schooling or more and zero otherwise. Figure 3 reports that
on average school-age children are 8 % less likely to finish Gymnasium, the highest high
school track in the German education system, and 6.5 % less likely to have some college
because of war devastation. Therefore, Figure 3 suggests that the adverse effects of war are
more severe for young adults who were about to complete 12-14 years of schooling which is
associated with Gymnasium completion.25 Had the WWII destruction not occurred, these
children might at least have finished high school but instead they dropped out of school. By
25 It is the academic track, required of those intending to attend college. The Gymnasium prepares students for the university entrance exam (Abitur) after grade 13 or gives them a chance to take a lower level qualification after grade 12, called Fachhochschulreife, which allows school leavers to attend a polytechnic.
18
the time the war ended, they would have been young adults of the age when it is customary
to work and therefore too old to return to school.
Threats to Validity
A potential confounding factor for results summarized in Table 3 is probability of the
nonrandom migration across regions. For example, people residing in heavily destroyed
regions are likely to be displaced to less destroyed regions during heavy aerial attacks.
Alternatively, highly destroyed regions might attract a large number of postwar economic
migrants seeking to take part in reconstruction efforts. Both types of migration might induce
selection bias in the analysis of WWII destruction effects on children's long-term outcomes.
To address whether individuals' migration decision is based on the destruction level of the
regions, I estimate Equation (1) using the probability of moving as the dependent variable;
results are reported in Table 4. Individuals are coded as movers if they report that they no
longer reside in their childhood city or area in 1985. Treatment and control groups for this
specification are the same as in the Table 3 education analysis. The difference-in-difference
estimates for probability of moving are close to zero and statistically insignificant in every
specification. This finding bolsters confidence that individuals did not choose their final
destination according to the destruction level of the regions.26
26 An additional concern related to mobility is refugees or people that fled from the former parts of Germany and Soviet Zone/GDR. The 1961 city-level refugee data provided by Redding and Sturm (2008) suggests that refugees constituted 2% of the German population in 1961. Nevertheless, it would be of interest to estimate the long-term effects of WWII devastation on children of this group; however it is not possible to identify refugees or people who fled from the former parts of Germany in GSOEP since they are German-ethnics. GSOEP asks respondents only their nationality, and once they replied as German, it is assumed that their birthplace is Germany. As an attempt to address this potential concern, I use 1961 city-level refugee data provided by Redding and Sturm (2008). I estimate the baseline specification separately for cities with refugees above or below median. I find similar effects for both samples.

19
Table 5 provides further evidence on nonrandom migration. The analysis in Table 5 is
restricted to individuals who still live in the city or area where they grew up (hereafter, "non-
movers"). The difference-in-difference estimates for non-movers are very similar to the
estimates for the entire population (D-D estimates for the entire population and non-movers
lie within each other’s 95% confidence intervals). The empirical evidence presented in Table
5 supports our aforesaid findings that non-movers are not differentially impacted by the war
shock and suggests that the non-random migration is less likely to be a concern.
Results summarized in Table 3 rest on the assumption that in the absence of the
WWII, the difference in educational attainment between the affected group and the younger
cohorts would have been similar across regions (this is known as the parallel trend
assumption). That is, the coefficient for interaction between dummy for being born 1924-
1939 and city-level rubble per capita would be zero in the absence of WWII destruction.
However, if there were differential cohort trends in educational attainment between more
destroyed and less destroyed cities, then it would not be possible to interpret the difference-
in-differences estimate as due to WWII destruction. To assess the validity of the identifying
assumption, I perform the following falsification test/control experiment. I restrict the
empirical analysis to older cohorts who would have completed their schooling at the outset of
WWII. I code the oldest cohorts (i.e. those born between 1904 and 1913) as the "Placebo"
affected cohort and cohorts born between 1914 and 1923 as the "Placebo" control cohort
though of course there is no true treatment here. If there are no differential trends, then the
difference-in-differences estimates should be zero, which is indeed what I find (see Table 6).
The results in Table 6 lend credence to the identification assumption in Equation (1) and
20
support the interpretation of the difference-in-difference estimates as due to WWII
destruction as opposed to some city-specific cohort trend.27,28
Another confounding factor may be change in the cohort size by regional destruction.
That is, it is possible that highly destroyed cities experienced greater WWII casualties and
labor shortages after WWII. Therefore, higher scarcity in labor supply might increase the
returns to education more for cohorts born after WWII in highly destroyed cities. In this case,
the coefficient for the interaction between dummy for being in "affected" cohorts and city's
war destruction could yield a negative coefficient resulting from differences in cohort size
across regions rather than from WWII destruction. As a check on this concern, I compared
cohort sizes between highly destroyed and less destroyed cities. I find no meaningful
variation in change in the cohort size across cities of varying destruction.
To summarize the estimation results so far, I find that WWII destruction reduced the
educational attainment of Germans who were at school-age during WWII. The reduction in
education is borne disproportionately by people living in the most hard-hit regions, and
whose parents were less educated. Analysis of the impact at each point in the education
27 Additional potential robustness check would be to perform falsification test\control experiment with younger cohorts who are not part of the control group to assess whether the parallel trend assumption holds for postwar cohorts, too. However, the children who fall into the potential “Placebo” treatment and “Placebo” control groups are still continuing their education rendering it impossible to carry out this exercise. It is worth mentioning, however that city-level data on postwar per capita education and health expenditure reveal no differential trends between more destroyed and less destroyed cities for younger cohorts (data from various years of German Statistical Yearbooks).28 Another relevant consideration for the parallel trend assumption is that regional WWII destruction might be endogenous to trends in children's long-run outcomes. To address this potential concern, I employ an instrumental-variable strategy. The instrumental variable that I use for a region's wartime physical destruction is the region's distance to London obtained using the Geographic Names Information System (GNIS). As stated in section 3, regions in the northern and western parts of Germany suffered the most from the AAF aerial bombing. First, to assess whether our proposed instrumental-variable satisfies the exclusion restrictions, I compared cities closer to and farther away from London in terms of their prewar city characteristics. It is worth noting that I find no evidence suggesting differences in prewar city characteristics by distance to London. Second, the first-stage estimates are statistically significant at 1% significance level in every specification suggesting that regions closer to London indeed experienced more destruction as a result of AAF aerial raids, consistent with the historical records. Finally, I find that 2SLS estimates are quantitatively similar to D-D estimates. This finding further bolsters our credence that regional war damage is exogenous once I control for regional fixed characteristics (instrumental-variable results available upon request).
21
distribution suggests that the destruction caused children who might otherwise have
completed the academic high school track to drop out, leading to a decrease in the probability
of completing 12 years of schooling and attending some college. These impacts on
educational attainment are both statistically and economically significant.
In contrast to recent micro-level studies, availability of prewar and postwar city-level
data and a wide range of war-related questions in GSOEP enable me to rigorously investigate
the potential mechanisms through which war destruction affected the educational attainment
of children. I find that results are basically unchanged if I control for parent fighting in WWII
or dying during WWII years, which suggests that it is not direct family experience in WWII
combat that is responsible for the effects on children's schooling.29 A likely mechanism
seems to be the destruction of schools and the disruption in schools left standing. Figures 4
and 5 show the change in number of schools and teachers over time by destruction intensity.
From these figures, it appears that regions with more rubble per capita also had a greater
decline in both the number of schools (because schools were also destroyed as part of the
AAF bombing) and the number of teachers (some teachers had to perform military service,
and a significant number were Jewish). A story in which children in more destroyed areas
receive less schooling because the schools are defunct due to bombing or departure of
teachers is consistent with these empirical observations. Of course it is not possible to
provide definitive proof of this story, and undoubtedly additional mechanisms are at work
too, but this seems to be a plausible and an important mechanism for the effects of
destruction on schooling.
29 These results are available upon request from the author.

22
6.2. Estimates of War Destruction on Health Outcomes
Now, I turn to estimating the impact of WWII destruction on individuals' adult health
outcomes. The health outcomes I will measure are height, mortality and health satisfaction.
The fetal origins hypothesis suggests that malnutrition and poor living conditions in-utero
and during early childhood may have effects on later life outcomes (Baker, 1992). Therefore,
it is of interest to explore whether war destruction affects the long-run health outcomes of
individuals who were children during WWII. A mediator for these long-run health effects,
especially height in adulthood, is childhood nutritional status. WWII created food shortages
and changes in the composition of food eaten which could have had especially detrimental
effects on young children.
Table 7 reports the difference-in-difference estimates for adult health outcomes. The
treatment and control groups described above for the education analysis apply for these
outcomes as well, with the exception of height. Previous research has established that adult
height is largely determined by age 2 or 3 and is significantly influenced by diet and health
conditions in early childhood years (Brainerd, 2008). Thus, for height regressions, the
treatment group is restricted to individuals who were born between 1937 and 1945, that is,
dummy variable WWIIit takes a value of 1 if individual i was born between 1937 and 1945,
and zero otherwise.
Panel A examines the effect of WWII destruction on individual's height (measured in
inches). All specifications show that wartime destruction had a long-lasting, detrimental
effect on height that is significant at the 5% significance level. In column 1 of Panel A, the
difference-in difference estimate is -0.036 indicating that individuals who experienced WWII
are on average about half inch shorter in adulthood than the others. Alternatively, in a

23
comparison of Cologne and Munich, WWII cohorts residing in Cologne had 0.8 inches lower
height in their adulthood relative to the same cohorts in Munich.30 This is a sizable effect
since average height grew by only 0.8 inches in the entire 19th century (Banerjee, Duflo,
Postel-Vinay and Watts, 2009). Similar to education analysis, columns (2)-(4) report
specifications incorporating parental human capital. D-D estimates summarized in these
columns suggest that negative effects of wartime destruction were suffered mostly among
children whose parents were less educated (basic education or less). This finding supports the
previous research suggesting that family income and wealth serve as a safety net in
unfavorable conditions (Currie, 2009).
Panel B presents the results for the mortality of WWII survivors using probit model
(marginal effects are reported).31 To the best of our knowledge, this is the first paper
assessing the impact of wartime physical destruction on individual's mortality. For this
analysis, I take advantage of the panel structure of GSOEP that enables me to analyze the
longer-run consequences of warfare. The mortality variable is a dummy variable that takes a
value of 1 if an individual has a recorded death year sometime between 1985 (the beginning
of my sample) and 2006, and zero otherwise.32 The first column of Panel B provides weak
evidence that WWII destruction caused Germans who were school aged during WWII to die
sooner; however, none of the effects are statistically significant in Panel B.
Finally, Panel C estimates the effect of war destruction on self-reported health
satisfaction using Probit model. Health satisfaction is often considered to have significant
explanatory power for predicting future mortality and is therefore a useful measure of
30
Additional analysis that allows war destruction to be non-linear suggests that children in most hard-hit regions are two inches shorter in their adulthood relative to the control group.31 Results are quantitatively similar when estimated with linear probability model.32 Information on individual’s death year in GSOEP comes from the official records.

24
morbidity.33 Health satisfaction in the GSOEP is measured on a scale from 0 to 10.
Individuals are coded as satisfied with their current health if their response is 6 and above.
The results in Panel C are negative and significant in every specification. Thus, war
destruction does worsen long-run health status (which is undoubtedly a reason for the higher
mortality shown in columns Panel B). On the other hand, similar to education and height
analysis, columns (2)-(4) suggest that children whose parents had basic education or less
suffered the most from the negative consequences of WWII destruction.
To summarize the health results, I find that war destruction led to worse health in
adulthood for Germans who were children during WWII-these children are shorter, report
lower satisfaction with their health and are more likely to die. Similar to education analysis,
the cost of WWII devastation in terms of adult health outcomes is borne disproportionably by
children from disadvantageous families, and by those residing in most destroyed cities. In
addition, the impact of destruction remain virtually unchanged when war-related variables
such as loss of parent or father’s involvement in war is incorporated into the analysis. While
there are many mechanisms through which exposure to war and destruction might impact
health status (e.g., trauma, mental illness), given the sizable impact on height, it is likely that
malnutrition is an important mechanism. On the other hand, Figure 6 suggests that
destruction of hospitals might be another underlying channel for the deterioration of
children’s health outcomes.
6.3. Estimates of War Destruction on Labor Market Outcomes
In this subsection, I analyze the effects of WWII devastation on individual's future
labor market outcomes. An extensive literature has well documented the causal relation 33 See, Idler and Benysmini, 1997; Frijters, Haisken-DeNew and Schields, 2005.

25
between individuals' human capital and labor market outcomes.34 Given this well-established
empirical evidence, wartime physical destruction can impact individuals’ future labor market
outcomes through reduction in educational attainment (summarized in Table 3) or through
other channels, including deterioration in adulthood health (reported in Table 7).
The outcome of interest in Table 8 is logarithm of hourly wage. This analysis is
restricted to individuals with positive labor market earnings. Hence, females have
substantially lower labor force participation rates in Germany (Bonin and Euwals, 2005;
Strøm and Wagenhals, 1991); I allow the treatment effect to differ by gender in Table 8.
Following this specification, the first row shows the difference-in-difference estimates for
males, the group on which I will focus on. Column 1 of Panel A shows that the difference-in-
difference estimate for logarithm of hourly wage is -0.0051. This suggests that children
exposed to large-scale physical destruction earn about 6 % less in adulthood on average (this
is the coefficient multiplied by the mean intensity of destruction). Consistent with aforesaid
educational attainment and health results, columns (2)-(4) in Panel A also point out that
WWII destruction caused substantially higher earnings loss for children from less favorable
backgrounds (the difference-in-difference estimate for this group is 14 percent- twice the size
of estimates for the entire population in column 1).
Having shown that school-age children have lower future labor market earnings due
to exposure to WWII destruction, it is of interest to explore the channels underlying this
causal association. Is the estimated effect of physical destruction on earnings working
through decline in education or are there other channels at work, including the deterioration
in adulthood health? To investigate whether WWII damage has effects on earnings besides
through education channel, I estimate the same specification as in Panel A but add years of 34 See survey in Card, 1999; Case and Paxson, 2006.

26
schooling as a regressor. Results are presented in Panel B of Table 8. This analysis suggests
that although education explains a considerable part of the earnings loss, the significant
effects of war devastation remains. This implies that decline in educational attainment is not
the only channel for earnings loss arising from WWII destruction, leaving room for other
channels such as deterioration in adult health, or change in family structure.
Previous papers have used exposure to war, other childhood shocks, natural disasters,
and macroeconomic crises, quarter of birth and distance to school to generate an instrumental
variable of education to estimate the causal effect of education on earnings. The analysis in
Panel B of Table 8 suggests that these instrumental-variables may have a direct effect on
individual’s earnings working through other forms of human capital such as health.
Therefore, the analysis presented in Panel B raises the question of whether these
instrumental-variables satisfy the exclusion restrictions.
7. Conclusion
This paper presents causal evidence on the long-run socioeconomic consequences of
large-scale physical destruction arising from world's most costly and widespread global
military conflict, WWII. The findings in this paper shed light on the potential long-term
legacies of large-scale physical destruction caused by hurricanes, earthquakes, floods and
contemporaneous armed conflicts. I combine a unique dataset on city-level WWII destruction
with individual-level data from the German Socio-Economic Panel (GSOEP) to study the
long-run effects of wartime physical destruction on children's education, health and labor
market outcomes. The identification strategy exploits plausibly exogenous city-by-cohort
variation in the intensity of WWII destruction. I find that WWII destruction caused Germans

27
who were school-aged during WWII to complete fewer years of schooling, be shorter in
height, report lower satisfaction with their health, die sooner and have lower labor market
earnings in the future. The detrimental, long lasting effects of WWII destruction is borne
disproportionately by people living in the most-hard hit regions, and whose parents were less
educated.
Taken together, these findings suggest that even though severely hit regions rapidly
return to their prewar patterns in terms of local population and macroeconomic outcomes,
consequences of wars along human dimensions are more substantial and persistent. Given
that the detrimental effect of WWII is still present 60 years after WWII, these results
underline the importance of policies targeting primarily school-age children.
On the other hand, the formal analysis of mechanisms suggests that the destruction of
schools and decline in number of teachers are important channels for the reduction in
education, whereas malnutrition and destruction of hospitals during WWII appears to be
responsible for the estimated impacts on health. These findings clearly propose that
amelioration of school inputs and health facilities and prevention of malnutrition should be
top priorities after large-scale physical destruction resulting from natural disasters and armed
conflicts.

28
References
Akresh, Richard, Philip Verwimp, and Tom Bundervoet, “Civil War, Crop Failure and Child Stunting in Rwanda,” World Bank Policy Research Working Paper No. 4208, 2007.
Akresh, Richard and Damien de Walque, “Armed Conflict and Schooling: Evidence from the 1994 Rwanda Genocide,” Households in Conflict Network Working Papers No. 47, 2008.
Alderman, Harold, John Hoddinott, and Bill Kinsey, “Long Term Consequences of Early Childhood Malnutrition,” Oxford Economic Papers, 58 (2004), 450-474.
Almond, Douglas, “Is the 1918 Influenza Pandemic Over? Long-Term Effects of in-utero Influenza Exposure in the Post-1940 U.S. Population,” Journal of Political Economy, 114 (2006), 612-712.
Angrist, Joshua, “Lifetime Earnings and the Vietnam Era Draft Lottery: Evidence from Social Security Administrative Records,” American Economic Review, 80 (1990), 313-336.
Angrist, Joshua and Alan Krueger, “Why do World War II Veterans Earn More than Nonveterans?” Journal of Labor Economics, 12 (1994), 74–97.
Angrist, Joshua and Adriana Kugler, “Rural Windfall or Resource Curse? Coca, Income and Civil Conflict in Colombia,” Review of Economics and Statistics, 90 (2008), 191-215.
Banerjee, Abhijit, Esther Duflo, Gilles Postel-Vinay, and Tim Watts, “Long Run Health Impacts of Income Shocks: Wine and Phylloxera in 19th Century France,” Review of Economics and Statistics, forthcoming, 2009.
Barker, D.J.P, Fetal and Infant Origins of Later Life Disease. (London: British Medical Journal, 1992).
Ben-David, Dan and David Papell, “The Great Wars, the Great Crash, and the Unit Root Hypothesis,” Journal of Monetary Economics, 36 (1995), 453-475.
Bertrand, Marrianne, Esther Duflo and Sendhil, Mullainathan, “How much should We TrustDifference-in-Difference Estimates?” Quarterly Journal of Economics, 119 (2004), 249-275.
Blattman, Christopher and Jeannie Annan, “The Consequences of Child Soldiering,” Review of Economics and Statistics, forthcoming, 2009.
Bonin, Holger and Rob Euwals, “Participation Behavior of East German Women after German Unification," IZA Discussion Paper No. 413, 2001.
Brainerd, Elizabeth, “Uncounted Costs of World War II: The Effect of Changing Sex Ratios on Marriage and Fertility of Russian Women,” Mimeo, Williams College, 2008.

29
Brakman, Steven, Harry Garretsen, and Marc Schramm, “The Strategic Bombing of Cities in Germany in World War II and its Impact on City Growth,” Journal of Economic Geography, 4 (2004), 1-18.
Bundervoet, Tom, Philip Verwimp, and Richard Akresh, “Health and Civil War in Rural Burundi,” Journal of Human Resources, forthcoming, 2007.
Case, Anne and Christina Paxson, “Height, Health and Cognitive Function at Older Ages,” American Economic Review Papers and Proceedings, 98 (2008), 463-467.
Case, Anne and Christina Paxson, “Stature and Status: Height, Ability, and Labor Market Outcomes,” Journal of Political Economy, 16 (2006), 499-532.
Card, David, "The Causal Effect of Education on Earnings" In Orley Ashenfelter and David Card, Eds., Handbook of Labor Economics Volume 3A. (Amsterdam: Elsevier, 1999).
Collier, Paul, Anke Hoeffler, and Dominic Rohner, “Beyond Greed and Grievance: Feasibility and CivilWar,” Oxford Economic Papers, forthcoming, 2008.
Currie, Janet, “Healthy, Wealthy and Wise? Socioeconomic Status, Poor Health in Childhood, and Human Capital Development," Journal of Economic Literature, 47 (2009), 87-122.
Davis, Donald and David Weinstein, “Bones, Bombs, and Break Points: The Geography of Economic Activity,” American Economic Review, 92 (2002), 1269-1289.
Diefendorf, Jeffry, In the Wake of the War: The Reconstruction of German Cities after World War II. (New York: Oxford University Press, 1993).
Friedrich, Joerg, Der Brand: Deutschland im Bombenkrieg, 1940-1945, (Munich: Propylaen Publishing, 2002).
Frijters, Paul, John Haisken-DeNew, and Michael Shields, “Socio-Economic Status, Health Shocks, Life Satisfaction and Mortality: Evidence from an Increasing Mixed Proportional Hazard Model,” IZA Discussion Paper No. 1488, 2005.
Grayling, Anthony, Among the Dead Cities: Was the Allied Bombing of Civilians in WWII a Necessity or a Crime?, (London: Bloomsbury, 2006).
Hochstadt, Steve, Mobility and Modernity: Migration in Germany 1820-1989, (Ann Arbor: University of Michigan Press, 1999).
Ichino, Andrea and Rudolf Winter-Ebmer, “The Long-Run Educational Cost of World War II,” Journal of Labor Economics, 22 (2004), 57-86.
30
Idler, Ellen and Yael Benyamini, “Self-Rated Health and Mortality: A Review of Twenty-Seven Community Studies,” Journal of Health and Social Behavior, 38 (1997), 21-37.
Imbens, Guido and Wilbert Van der Klaauw, “Evaluating the Cost of Conscription in the Netherlands,” Journal of Business and Economic Statistics, 13 (1995), 207-215.
Meng, Xin and Nancy Qian, “The Long Run Health and Economic Consequences of Famine on Survivors: Evidence from China’s Great Famine,” CEPR Discussion Paper No. 5989, 2006.
Miguel, Edward and Gerard Roland, “The Long Run Impact of Bombing Vietnam,” Mimeo, University of California Berkeley, 2006.
Rainer, Helmut and Thomas Siedler, “O Brother, Where Art Thou? The Effects of Having a Sibling on Geographic Mobility and Labor Market Outcomes,” ISER Working Paper No. 18, 2005.
Schildt, Axel, The Long Shadows of the Second World War: The Impact of Experiences and Memories of War on West German Society, (London: German Historical Institute London, 2007).
Shemyakina, Olga, “The Effect of Armed Conflict on Accumulation of Schooling: Results from Tajikistan,” Households in Conflict Network Working Paper No. 12, 2006.
Strøm, Steinar and Gerhard Wagenhals, “Female Labor Supply in the Federal Republic," Jahrbücher für Nationalökonomie und Statistik, 208 (1991), 575-595.
USSBS, The United States Strategic Bombing Survey: The Effects of Strategic Bombing on the German War Economy, (Washington, DC: Overall Economic Effects Division, 1945).
Van den Berg, Gerard, Maarten Lindeboom, and France Portrait, “Economic Conditions Early in Life and Individual Mortality,” American Economic Review, 96 (2006), 290-302.
Werrell, Kenneth, “The Strategic Bombing of Germany in World War II: Costs and Accomplishments,” The Journal of American History, 73 (1986), 702-713.

31
Figure 1: Share of Dwellings Destroyed in German Cities by 1945
Source: Knopp (2001). The size of the circle shows the city size in 1939, where the biggest circle refers to cities with more than 500,000 inhabitants; middle-size circle, cities with between 100,000 and 500,000 inhabitants and smallest circle, cities with less than 100,000 inhabitants. The shaded area in these circles is the share of the dwellings destroyed in the city by the end of WWII.

32
Figure 2: Map of Regional Policy Regions (Raumordnungsregionen, ROR) in Former West Germany
Source: Federal Office for Building and Regional Planning (Bundesamt für Bauwesen und Raumordnung, BBR). There are 75 regional policy regions (RORs) in former West Germany. The darker the regions, the more wartime destruction it experienced.

33
Figure 3: Estimated Effect of Destruction on Full Distribution of Education
-0.0120
-0.0100
-0.0080
-0.0060
-0.0040
-0.0020
0.0000
0.0020
0.0040
0.0060
6 7 8 9 10 11 12 13 14 15 16 17 18 19
Years of Education
D-D
Co
eff
icie
nt
D-D Coefficient 95% CI- 95% CI+
Notes: Each point in this figure is difference-in-difference estimate from a separate regression where the outcome is a dummy variable that takes a value of 1 if individual completed m years of schooling or more and zero otherwise. In my sample, individuals complete between 7 and 18 years of schooling.

34
Figure 4: Number of Schools by City-Level WWII Destruction
3040
5060
70N
umbe
r of
Sch
ools
1940 1945 1950 1955 1960Year
above_mean_destruction below_mean_destruction
Number of Schools by WWII Destruction
Source: Various years of German Statistical Yearbook.
Figure 5: Number of Teachers by City-Level WWII Destruction
300
400
500
600
700
800
Num
ber
of T
each
ers
1940 1945 1950 1955 1960Year
above_mean_destruction below_mean_destruction
Number of Teachers by WWII Destruction
Source: Various years of German Statistical Yearbook.

35
Figure 6: Number of Hospitals by City-Level WWII Destruction
510
1520
25N
umbe
r of
Hos
pita
ls
1935 1940 1945 1950 1955Year
Above_mean_destruction Below_mean_destruction
Number of Hospitals by WWII Destruction
Source: Various years of German Statistical Yearbook.
All Difference
s.e(difference)(1) (2) (3) (4)
Rubble in m3 per Capita 12.248 18.486 5.593 12.893 ***(7.181) (4.770) (3.923) (0.132)
%Housing Units Destroyed 36.430 42.754 22.841 19.913 ***(19.027) (22.624) (18.288) (4.733)
Total bombs dropped in tons 24,316.7 21,381.550 9,505.998 11,875.6 ***(22,405.820) (24,066.690) (10,418.810) (4,080.946)
Area in km2 in 1938 154.246 216.324 110.510 105.814 **(183.784) (250.466) (98.104) (7.184)
Population density in 1939 1,730.194 1,783.781 1,692.440 91.341(801.210) (889.216) (741.314) (29.407)
Income per Capita in RM 455.827 498.194 419.979 78.215 **in 1938 (109.439) (82.670) (117.728) (3.648)
Distance to London in miles 425.444 398.730 444.266 -45.536 **(87.206) (82.478) (86.397) (2.786)
N Max. 75 31 44 75
1938
Notes: The sample consists of 75 Regional Policy Regions (Raumordnungsregionen, ROR) in the former territory of West Germany. The means for destruction measures are weighted by population. Standard deviations are in parantheses. *The U.S dollar worth 4.02 RM in
Table 1. Descriptive Statistics for WWII Destruction
Cities with above Cities with below
avg. destruction avg. Destruction
Cities with above Cities with belowAll avg. destruction avg. destruction(1) (2) (3)
Years of Schooling 11.296 11.424 11.179(2.330) (2.425) (2.234)
Has Gymnasium Diploma 0.230 0.254 0.209or More (0.421) (0.435) (0.406)
Has Any College or More 0.168 0.191 0.148(0.374) (0.393) (0.355)
Height 170.089 170.344 169.864(8.768) (8.661) (8.859)
Mortality 0.135 0.142 0.129(0.342) (0.349) (0.335)
Self-Rated Health Satisfaction 0.690 0.667 0.711(0.462) (0.471) (0.453)
Mother with Basic Education 0.888 0.868 0.905(0.316) (0.338) (0.294)
Father with Basic Education 0.831 0.810 0.850(0.375) (0.393) (0.358)
Age 42.925 42.949 42.904(12.356) (12.409) (12.311)
Female 0.507 0.501 0.512(0.500) (0.500) (0.500)
Urban 0.580 0.646 0.520(0.494) (0.478) (0.500)
N max. 3537 1694 1843
as clear. Standard deviations are presented in parantheses.
Table 2. Descriptive Statistics, GSOEP Data
Notes: Data are from 1985 GSOEP. The sample consists of individuals born between 1924 and 1960. Individuals born between 1939 and 1950 are dropped from the analysis since their exposure to the WWII destruction is not
(1) (2) (3) (4)
Rubble per Cap.X Born btw.1924-1939 -0.0277 ** -0.0245 ** -0.0217 ** -0.0222 **(0.0137) (0.0112) (0.0111) (0.0110)
Rubble per Cap.X Born btw.1924-1939 0.0345 * 0.0235X Mother has more than Basic Education (0.0204) (0.0264)
Rubble per Cap.X Born btw.1924-1939 0.0277 0.0114X Father has more than Basic Education (0.0175) (0.0221)
R2 0.1589 0.2664 0.2954 0.3188N 3573 3138 3103 3056
a separate regression where main treatment effect varies by parental education in columns (2)-(4). Each column controls for city and year of birth fixed effects. Columns (2)-(4) also control for main effects of parental human capital. Other controls in each regression are gender and rural dummies.
Table 3. The Effect of WWII Destruction on Children's Years of Schooling
All
Notes: Standard errors clustered by cities are shown in parentheses. Asterisks denote significance levels (*=.10, **=.05, ***=.01). The control group is individuals born between 1951 and 1960. Each column is from

(1) (2) (3) (4)
Rubble per Cap.X Born btw.1924-1939 0.0016 0.0033 0.0036 0.0031(0.0028) (0.0029) (0.0029) (0.0028)
Rubble per Cap.X Born btw.1924-1939 -0.0021 -0.0019X Mother has more than Basic Education (0.0034) (0.0037)
Rubble per Cap.X Born btw.1924-1939 -0.0030 -0.0019X Father has more than Basic Education (0.0028) (0.0028)
R2 0.1021 0.1204 0.1272 0.1295N 3570 3138 3103 3056
controls for city and year of birth fixed effects. Columns (2)-(4) also control for main effects of parental education. Other controls in each regression are gender and rural dummies. Individuals are coded as movers if they report that they no longer reside in their childhood city or area.
Table 4. The Effect of WWII Destruction on Probability of Moving
Notes: Standard errors clustered by cities are shown in parentheses. Asterisks denote significance levels(*=.10, **=.05, ***=.01). The control group is individuals born between 1951 and 1960. Each column is from aseparate regression where main treatment effect varies by parental education in columns (2)-(4). Each column
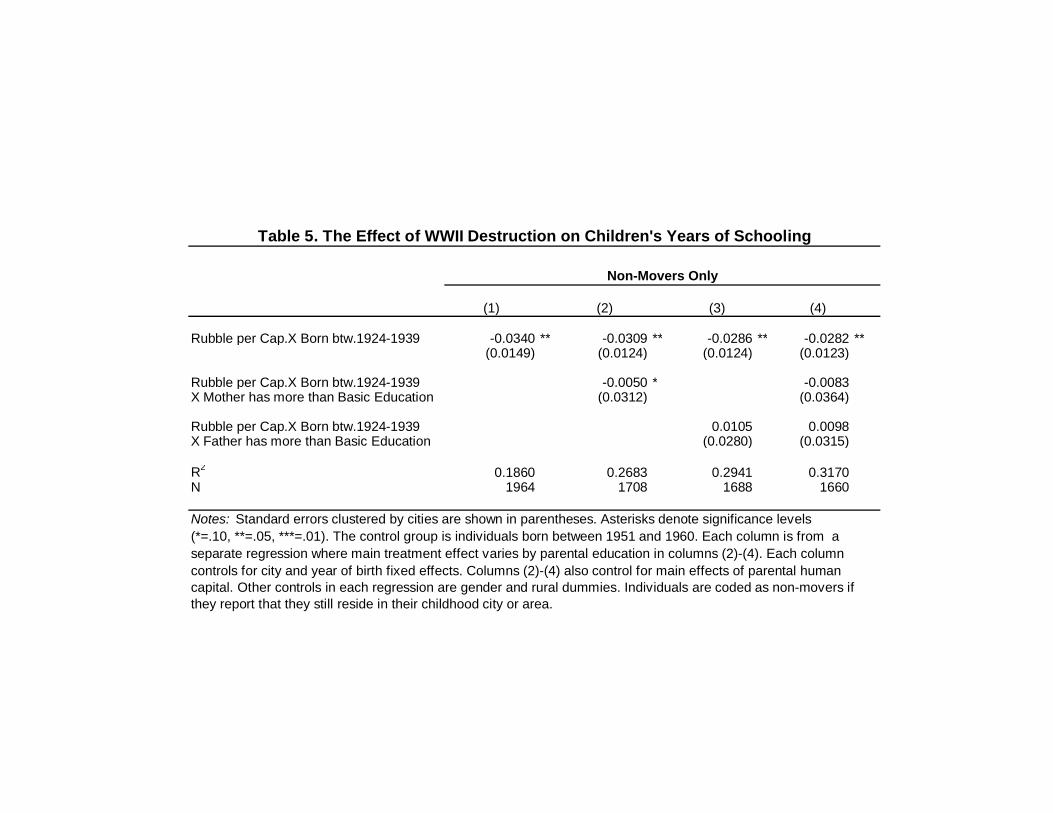
(1) (2) (3) (4)
Rubble per Cap.X Born btw.1924-1939 -0.0340 ** -0.0309 ** -0.0286 ** -0.0282 **(0.0149) (0.0124) (0.0124) (0.0123)
Rubble per Cap.X Born btw.1924-1939 -0.0050 * -0.0083X Mother has more than Basic Education (0.0312) (0.0364)
Rubble per Cap.X Born btw.1924-1939 0.0105 0.0098X Father has more than Basic Education (0.0280) (0.0315)
R2 0.1860 0.2683 0.2941 0.3170N 1964 1708 1688 1660
they report that they still reside in their childhood city or area.
separate regression where main treatment effect varies by parental education in columns (2)-(4). Each column controls for city and year of birth fixed effects. Columns (2)-(4) also control for main effects of parental human capital. Other controls in each regression are gender and rural dummies. Individuals are coded as non-movers if
Table 5. The Effect of WWII Destruction on Children's Years of Schooling
Non-Movers Only
Notes: Standard errors clustered by cities are shown in parentheses. Asterisks denote significance levels (*=.10, **=.05, ***=.01). The control group is individuals born between 1951 and 1960. Each column is from a

(1) (2) (3) (4)
Rubble per Cap.X Born btw.1904-1913 0.0063 0.0064 0.0112 0.0078(0.0158) (0.0138) (0.0152) (0.0151)
Rubble per Cap.X Born btw.1904-1913 -0.0209 -0.0225X Mother has more than Basic Ecucation (0.0491) (0.0626)
Rubble per Cap.X Born btw.1904-1913 0.0054 0.0232X Father has more than Basic Education (0.0261) (0.0400)
R2 0.2371 0.3381 0.3846 0.3941N 1315 1084 1080 1064
controls in each regression are gender and rural dummies.
have completed their schooling at the outset of WWII. "Placebo" affected group is individuals born between 1904 and 1913 and "Placebo" control group is individuals born between 1914 and 1923. Each column is from separateregression where main treatment effect varies by parental education in columns (2)-(4). Each column controls for city and year of birth fixed effects. Columns (2)-(4) also control for main effects of parental education. Other
Table 6. The Effect of WWII Destruction on Children's Years of SchoolingControl Experiment
Notes: Standard errors clustered by cities are shown in parentheses. Asterisks denote significance levels (*=.10, **=.05, ***=.01). Sample consists of older cohorts who were born between 1904 and 1913 who would
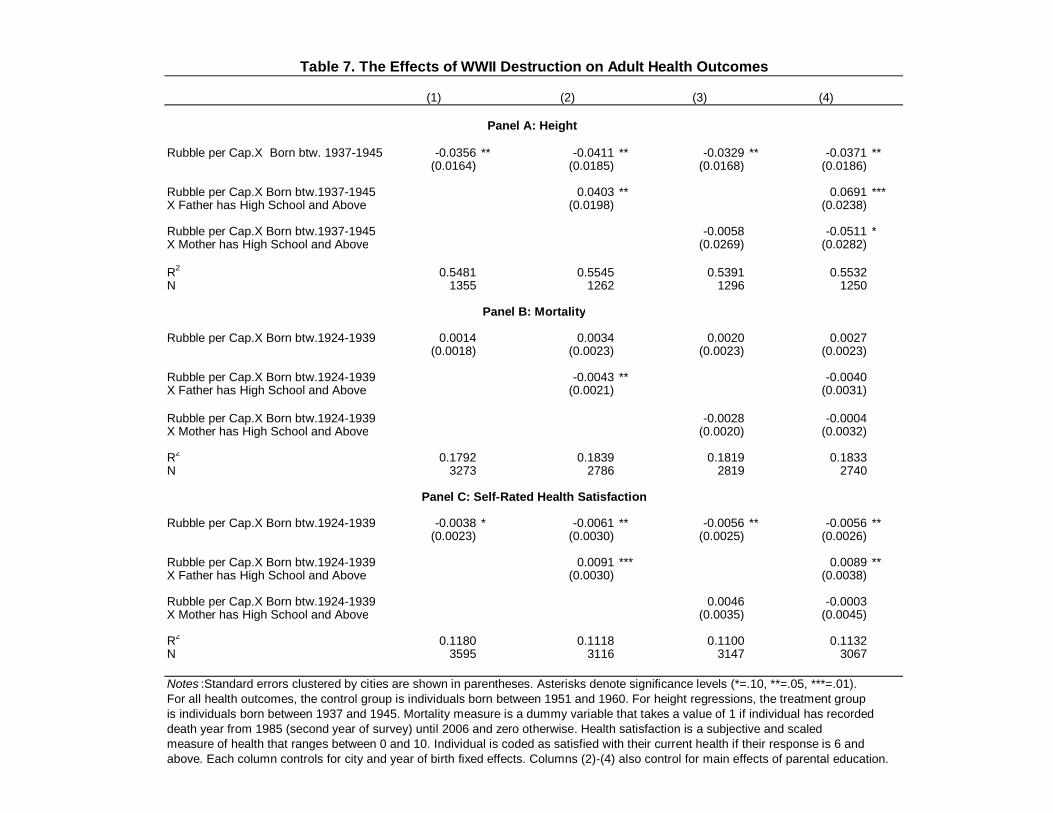
(1) (2) (3) (4)
Rubble per Cap.X Born btw. 1937-1945 -0.0356 ** -0.0411 ** -0.0329 ** -0.0371 **(0.0164) (0.0185) (0.0168) (0.0186)
Rubble per Cap.X Born btw.1937-1945 0.0403 ** 0.0691 ***X Father has High School and Above (0.0198) (0.0238)
Rubble per Cap.X Born btw.1937-1945 -0.0058 -0.0511 *X Mother has High School and Above (0.0269) (0.0282)
R2 0.5481 0.5545 0.5391 0.5532N 1355 1262 1296 1250
Rubble per Cap.X Born btw.1924-1939 0.0014 0.0034 0.0020 0.0027(0.0018) (0.0023) (0.0023) (0.0023)
Rubble per Cap.X Born btw.1924-1939 -0.0043 ** -0.0040X Father has High School and Above (0.0021) (0.0031)
Rubble per Cap.X Born btw.1924-1939 -0.0028 -0.0004X Mother has High School and Above (0.0020) (0.0032)
R2 0.1792 0.1839 0.1819 0.1833N 3273 2786 2819 2740
Rubble per Cap.X Born btw.1924-1939 -0.0038 * -0.0061 ** -0.0056 ** -0.0056 **(0.0023) (0.0030) (0.0025) (0.0026)
Rubble per Cap.X Born btw.1924-1939 0.0091 *** 0.0089 **X Father has High School and Above (0.0030) (0.0038)
Rubble per Cap.X Born btw.1924-1939 0.0046 -0.0003X Mother has High School and Above (0.0035) (0.0045)
R2 0.1180 0.1118 0.1100 0.1132N 3595 3116 3147 3067
death year from 1985 (second year of survey) until 2006 and zero otherwise. Health satisfaction is a subjective and scaled
Table 7. The Effects of WWII Destruction on Adult Health Outcomes
Panel A: Height
Panel B: Mortality
Panel C: Self-Rated Health Satisfaction
measure of health that ranges between 0 and 10. Individual is coded as satisfied with their current health if their response is 6 and above. Each column controls for city and year of birth fixed effects. Columns (2)-(4) also control for main effects of parental education.
Notes :Standard errors clustered by cities are shown in parentheses. Asterisks denote significance levels (*=.10, **=.05, ***=.01). For all health outcomes, the control group is individuals born between 1951 and 1960. For height regressions, the treatment group is individuals born between 1937 and 1945. Mortality measure is a dummy variable that takes a value of 1 if individual has recorded

(1) (2) (3) (4)
Rubble per Cap. X Born btw. 1937-1945 -0.0051 -0.0135 ** -0.0124 ** -0.0139 **(0.0053) (0.0056) (0.0054) (0.0059)
Rubble per Cap.X Born btw.1924-1939 0.0083 0.0108 0.0088 0.0097X Female (0.0077) (0.0081) (0.0081) (0.0089)
Rubble per Cap.X Born btw.1937-1945 0.0150 ** 0.0072X Father has High School and Above (0.0067) (0.0073)
Rubble per Cap.X Born btw.1937-1945 0.0214 ** 0.0150X Mother has High School and Above (0.0093) (0.0112)
R2 0.3303 0.3515 0.3495 0.3827N 2289 1999 2031 1973
Rubble per Cap.X Born btw.1924-1939 -0.0029 -0.0112 ** -0.0102 ** -0.0116 **(0.0056) (0.0054) (0.0052) (0.0055)
Rubble per Cap.X Born btw.1924-1939 0.0094 0.0117 0.0095 0.0106X Female (0.0087) (0.0079) (0.0078) (0.0085)
Rubble per Cap.X Born btw.1924-1939 0.0124 * 0.0059X Father has High School and Above (0.0066) (0.0072)
Rubble per Cap.X Born btw.1924-1939 0.0178 ** 0.0129X Mother has High School and Above (0.0091) (0.0104)
R2 0.3654 0.3806 0.3824 0.3827N 2281 1993 2025 1967
dummies.
The control group is individuals born between 1951 and 1960. The analysis is restricted to individuals with positive labor marketearnings in 1985. Each column is from separate regression where main treatment effect varies by parental education in columns (2)-(4). Each column controls for city and year of birth fixed effects. Columns (2)-(4) also control for main effects of parental education. Panel B also controls for years of schooling. Other controls in each regression are gender and rural
Table 8. The Effect of WWII Destruction on Labor Market Outcomes
Panel A: Logarithm of Hourly Wage
Panel B: Logarithm of Hourly Wage, Controlling for Education
Notes : Standard errors clustered by cities are shown in parentheses. Asterisks denote significance levels (*=.10, **=.05,***=.01).
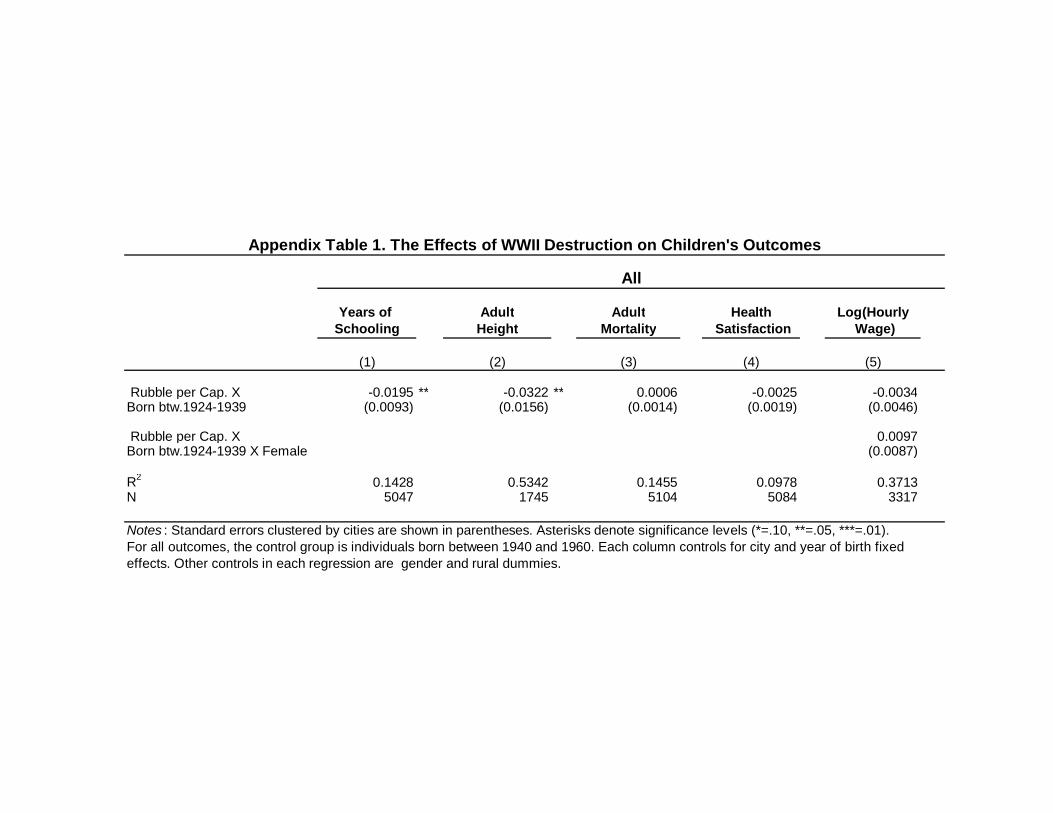
Years of Adult Adult Health Log(HourlySchooling Height Mortality Satisfaction Wage)
(1) (2) (3) (4) (5)
Rubble per Cap. X -0.0195 ** -0.0322 ** 0.0006 -0.0025 -0.0034Born btw.1924-1939 (0.0093) (0.0156) (0.0014) (0.0019) (0.0046)
Rubble per Cap. X 0.0097Born btw.1924-1939 X Female (0.0087)
R2 0.1428 0.5342 0.1455 0.0978 0.3713N 5047 1745 5104 5084 3317
effects. Other controls in each regression are gender and rural dummies.
Appendix Table 1. The Effects of WWII Destruction on Children's Outcomes
All
Notes : Standard errors clustered by cities are shown in parentheses. Asterisks denote significance levels (*=.10, **=.05, ***=.01). For all outcomes, the control group is individuals born between 1940 and 1960. Each column controls for city and year of birth fixed