children’s education and parents’ socio-economic status · pdf file2 1....
TRANSCRIPT

Children’s cognitive ability and parents’ education:
distinguishing the impact of mothers and fathers
John Jerrim ([email protected]) and John Micklewright ([email protected])
Institute of Education, University of London
January 2011
Revised bio for John Jerrim: John Jerrim is a research officer in the Department of
Quantitative Social Science at the Institute of Education, University of London. He gained his
PhD from the University of Southampton with a thesis examining whether students‟ wage
expectations are realistic.
Abstract
Discussion of transmission of socio-economic status from parents to children needs to
consider gender differences in both generations. We consider each parent and their different
links to outcomes for boys and girls using data for 30 countries. We relate children‟s
cognitive ability recorded in tests of maths, science and reading at age 15 to the years of
education of mothers and of fathers, concentrating on children with both natural parents
present. The data come from the 2003 round of the Programme for International Student
Assessment (PISA), co-ordinated by the Organisation for Economic Co-operation and
Development (OECD). The results (focusing on maths) show (i) it is more common for
father‟s education to have a greater association with children‟s achievement; (ii) this seems
particularly true of sons; (iii) there is more variation across countries in the differences
between fathers and mothers than between sons and daughters; (iv) there is some suggestion
that mothers‟ education has somewhat more association with daughters‟ ability than with
sons‟; (v) the interaction of mother‟s and father‟s education typically has a positive
association with the child‟s ability. However, there are substantial differences across countries
in these patterns.
2
1. Introduction
Discussion of transmission of socio-economic status from parents to children needs to
consider gender differences in both generations. Parents pass on a measure of their advantage
or disadvantage to their children and it is clearly of interest whether fathers pass on more than
mothers, and whether it is sons or daughters that gain or lose more from the transmission. A
number of authors have produced important insights into the different strengths of the gender-
specific parent-child links. These have been motivated in particular by the desire to
distinguish the role of mothers. Notable examples include Jere Berhman (1997) from
economics and Sylvia Korupp et al. (2002) from sociology. Our main value-added is to show
how these links differ across a large pool of rich industrialised nations, using a data source
that is specifically intended to allow cross-country comparison. We investigate whether there
are common patterns across countries and whether there are countries that appear to be
outliers to these patterns.
The child outcome that we consider is an educational one, reflecting the role accorded
to education in explaining intergenerational mobility in income by economists and in social
class by sociologists (Jo Blanden et al. 2007, Robert Erickson and John Goldthorpe 2002).
We analyse children‟s cognitive ability as recorded in standardised tests of maths, science and
reading at age 15. We relate this to years of education of mothers and of fathers. We use data
for 30 countries from the 2003 round of the Programme for International Student Assessment
(PISA), co-ordinated by the Organisation for Economic Co-operation and Development
(OECD).
Section 2 motivates our analysis along the lines just described. We discuss the impact
of parental education on children‟s learning, consider why the links might vary with gender in
either generation and review some existing empirical evidence. Section 3 describes our data,
focusing on the child test scores and the measures of mothers‟ and fathers‟ education. We
discuss the collection of the latter – parental education is reported by the children – and the
choice of a suitable sub-sample for analysis. Section 4 presents results from simple regression
models of child test scores on each parent‟s education. We test six hypotheses concerning the
associations across the generations, including one reflecting the possible complementarities
between maternal and paternal input. These are intended as „catch all‟ regressions, with the
parental variables reflecting all direct and indirect influences of their education. The
regressions do not show causal impacts because the education variables are correlated with
parental abilities and other characteristics that we cannot control for. Section 5 summarises

3
and concludes.
2. Motivation and Literature
It is well known that children‟s educational outcomes vary sharply with their parents‟ socio-
economic background. Differences in outcomes with parental background emerge early at the
pre-school level and are re-enforced in childhood and the teenage years through to tertiary
education. There is plenty of evidence for different countries and summaries can be found in
OECD (2008) and Stephen Machin (2009).
Child outcomes can be usefully conceptualized within the simple framework proposed
by Robert Haveman and Barbara Wolfe (1995), who drew on Arleen Leibowitz (1974). This
has three outcome variables – ability, final schooling level, and adult income. These are
linked in a recursive structure: ability helps determine final schooling level and both help
determine income in adulthood. In this chapter we are concerned just with ability, as
measured by test scores towards the end of compulsory schooling at age 15. Ability, within
the Haveman and Wolfe framework, has two proximate determinants: home investments
represented by the quantity and quality of time and goods inputs in the child, and heredity –
see figure 1, which also shows the determinants of final schooling level. Home investments
are in turn determined by parents‟ education and abilities, both directly and indirectly via
family income. Parents‟ abilities are passed on in part via genetic inheritance.
Within this framework, the correlation of children‟s ability and parents‟ education
reflects a number of factors. First, a direct effect through home investment, discussed later.
Second, an indirect effect via family income. Third, and assuming parental education and
ability are correlated, the impact of that ability coming through both home investments and
genetic inheritance.1
The framework also serves as a reminder that the total correlation of parental
education with the child‟s education will not be revealed in an analysis of children‟s ability
alone. The child‟s final schooling level is a function of home investments and family income
as well as his or her ability, and hence reflects additional impacts through those pathways
from parental education. We illustrate this using data for the US drawn from the National
Educational Longitudinal Survey (NELS) cohort. We regressed completed years of the child‟s
education on years of father‟s and mother‟s education. We then added to the equation
variables measuring child test scores for maths, science and reading at age 14. The estimated
coefficients for parental education were reduced by only one third, illustrating that a

4
substantial part of the association of final schooling with parental education does not come
through the child‟s ability in the early teenage years.2
How might the impact of mother‟s and father‟s education differ within this
framework? Much of the interest to date in distinguishing the separate contributions of each
parent to intergenerational transmission of socio-economic status has been motivated by a
desire to give due recognition to the role of women, for example Behrman (1997), Aaron
Johnston et al. (2005), Korupp et al. (2002), and Emily Beller (2009). More educated
mothers, it is argued, are more likely than fathers with the same level of education to make
higher investments into the production function of their children‟s cognitive achievement, in
terms of quantity and quality of both time and goods. The more educated the mother, the
more efficient her use of time spent with the child. Education may also increase women‟s
bargaining power within the household, giving them more control over family income, again
increasing home investments in the child. And the impact of each parent may differ for sons
and daughters, it is reasoned, due to differences in aspirations and expectations. A well
educated mother may act as a stronger role model for her daughters than for her sons, for
example. The importance of each parent may vary over childhood. If mother‟s schooling has
a greater association than father‟s schooling with the ability scores of high school children,
this could reflect the particular advantage (if that is the case) of a more educated mother in
early childhood, for example in time spent reading to the child, books in the home, and in use
made of pre-schooling or choice of elementary school.3
The relative importance of fathers and mothers could be similar across countries. To
continue with the example of early childhood, any special significance of educated mothers at
this age may hold across different cultures and institutions. Or there may be differences,
associated for example with variation across countries in the position of women in society.
Part of any differences in the importance of each parent will be played out in outcome
variables that are not the concern of this chapter – final schooling level and adult income in
the Haveman and Wolfe framework, including in the case of income through occupational
choice.
Most existing evidence relates to the child‟s final level of schooling, rather than ability
during high school. The child‟s years of education are regressed on years of education of the
mother and years of the father, and, typically, some variables chosen to control for other
factors. Ideally, evidence would exhibit the following features, although this ideal is rarely
found:
5
i. results shown without as well as with any control variables
ii. allowance for the impact of unobserved parental ability
iii. recognition of the distinction between natural, step, and single parents
iv. education entered flexibly as levels achieved rather than just as years
v. models estimated separately for boys and girls
vi. large sample size
Results with no controls (i) allow the full association of children‟s and parents‟ education to
be revealed, including indirect as well as direct channels, for example via family income. This
is the approach we take in Section 3. Moreover, comparing different studies there is often a
„distressingly small overlap in the explanatory variables included in the models‟ (Haveman
and Wolfe 1995: 1855), making difficult comparisons of results that include controls (which
also vary in definition). Results without controls will reflect the correlation of parental
education with unobserved ability unless the latter is controlled for in some way (ii), which
usually it is not. Many children do not live with both their natural parents (iii). The education
of a „parent figure‟ that is reported during high school may not correspond to the education of
a parent present during early childhood. Inherited ability will only be proxied by parental
education for natural parents. The specification of education, whether of parents or children,
as a continuous variable measured in years risks hiding non-linearities (iv). Interest in gender
differences sometimes only extends to the parents without allowing for differences in the
children‟s generation (v). Large sample sizes (vi) increase the chance of identifying gender
differences among both parents and children and differences between natural, step, and single
parents.
Haveman and Wolfe conclude from their survey of US evidence that „the human
capital of the mother is usually more closely related to the [educational] attainment of the
child than is that of the father‟ (1995: 1855). Behrman (1997) takes a more detailed look at
this question, focusing on studies from the US and a range of developing countries, where a
priori the importance of mother‟s education is expected to be greater. He also finds that
mother‟s education tends to be somewhat more important than father‟s education but
emphasises that (a) the margin is not as large as suggested by what he sees as conventional
wisdom, and (b) there is a considerable degree of variation across studies. Mother-daughter
associations in general appear to be stronger than those for mother-son. Likewise, the father-
son links appear stronger on average than the father-daughter links but Behrman concludes
that the pattern here is less clear. He also notes that the evidence is more widespread for

6
children‟s schooling level than for cognitive ability, the focus of our chapter.
Recent contributions to the literature provide some evidence for rich industrialised
countries other than the US, for example Jennifer Baxter (2002) for Australia, Guido Heineck
and Regina Riphan (2007) for Germany, John Ermich and Marco Francesconi (2001) for the
UK, and Anders Björkland et al. (2007) for Sweden.4 All of these authors focus on the child‟s
final schooling level, whether measured in years of education, categories, or proxied by
qualifications obtained. They all include results that either have no controls or which control
only for immigrant status (either by including indicators of this or by selecting natives only)
and number of siblings (although this may already reflect some of the impact of parental
education as more educated women tend to have fewer children). Data sets often combine
cohorts from a wide range of years. Heinrich and Riphan conclude that „maternal education
has weaker effects for sons‟ than for daughters' outcomes‟ (p17). Baxter‟s results defy easy
summary given the flexibility in the way both children‟s and parents‟ levels of education are
entered in her models, but they appear to show father‟s education having a greater association
with sons than does mother‟s education while the reverse is true for daughters. Ermisch and
Francesconi cannot reject the hypothesis of no differences by gender within either generation
in the UK (2001, Table A1), but, with a different UK dataset, Lorraine Dearden et al. (1997)
find the same pattern as Baxter does for Australia: „father‟s education is more important for
sons, mother‟s education is more important for daughters‟ (1997: 57) although the differences
are not strongly significant.
The analysis by Björkland et al. (2007) of Sweden is notable for satisfying most of the
features of an ideal study listed earlier. A large sample of some 65,000 individuals provides a
realistic opportunity to analyse separately different combinations of natural and step parent,
for example natural mother and step father, step mother and natural father. It even yields over
1,000 children with adoptive parents. This in turn permits conclusions about the impact of
unobserved parental ability transmitted through genetic inheritance as a striking feature of the
data is that a child can be linked to a natural parent even when he or she is not the rearing
parent. Among children raised by both natural parents, the results show father-son links to be
some 30 percent larger than father-daughter links (t=6.9) but reveal no statistical difference in
mother-son and mother-daughter links (t=0.84).5
The background for our own analysis is therefore one of rather mixed evidence, more
abundant for the US than for other countries and focused on schooling levels rather than
ability.

7
3. Data
The Programme for International Student Assessment (PISA) is a study of 15 year-olds‟
cognitive ability. Data are collected every three years. We use the 2003 data and analyse all
OECD countries except Mexico and Japan.6 In each country, a minimum of 150 schools were
included in the sample, selected with probability proportional to size. Students were then
randomly selected from within these schools. Average response rates of both schools and
pupils were high (90 percent in both cases), although this varies moderately between
countries.7 The achieved sample size in 2003 across the countries we consider was 189,404
observations.
In 2003 PISA tested children‟s ability in one major (maths) and two „minor‟ (reading
and science) domains.8 We focus in particular on the results for maths. However, mothers and
fathers may have different roles in developing their children‟s cognitive ability in each of the
three subjects. Recall the framework given in figure 2. For example, if mothers spend more
time reading to their children than fathers, maternal education might be more important for
the development of children‟s reading skills. Likewise, if fathers spend more time helping
children with maths, paternal education may be particularly associated with scores in this
subject. We therefore often provide results for all three domains.
Children‟s answers to the PISA test questions were summarized by the survey
organizers into a score for each of the three domains, using an „item-response model‟. The
intuition is that true ability in each subject is unobserved, and must be estimated from the
answers to the test. The item response model is used to generate five „plausible values‟ for
ability in each subject for each individual, each value estimating the individual‟s true
proficiency in the subject concerned and being equally plausible. These scores were scaled by
the survey organizers to have a mean (across all participating PISA countries) of 500 points
and standard deviation of 100. We follow the organisers‟ recommended use of the data by
running our regression models for each plausible value and then averaging the estimated
coefficients and standard errors. We also use the survey weights.
Children were asked two questions about their parents‟ education; what level they
completed at school and what type of tertiary qualifications they hold. Responses were
recorded into International Standard Classification of Education (ISCED) levels. Although
these are designed to be internationally comparable, variation in definitions across countries
may remain (Hilary Steedman and Steven McIntosh 2001). We convert ISCED levels into
years of education, using country specific conversion coefficients provided by the PISA

8
organisers (OECD 2004: 308). We have already noted that parental education may have a
non-linear influence on children‟s ability. However, we have chosen to use years of education
for its simplicity in interpretation and ease in presentation of results across a number of
countries.
We drop children who are first or second generation immigrants. Their parents‟
education cannot necessarily be interpreted in the same way as that of parents of native
children. This reduces the sample size by over a fifth. The reduction is particularly prominent
in New Zealand, Australia, Luxembourg and Switzerland, where over 40 percent of
observations are dropped. We also exclude children not living with both their natural mother
and natural father since in this case it is unclear to whom the information collected on
parental education refers.9 For children living with their natural parents we can be reasonably
certain that the association of parental education and children‟s ability reflects all the various
pathways described in figure 1 including genetic inheritance. Again, there is a large reduction
in the sample size, especially in the USA and, perhaps surprisingly, in Turkey and where a
further 40 percent of children are excluded from the analysis. A further 2 percent of
observations are excluded where information is missing for both mother‟s and father‟s
education. In 7 out of 30 countries, half the original sample has been excluded following these
selection criteria (Australia, New Zealand, England, Scotland, USA, Luxembourg, and
Switzerland). The overall sample size has been reduced by over 40 percent to 106,873
observations.
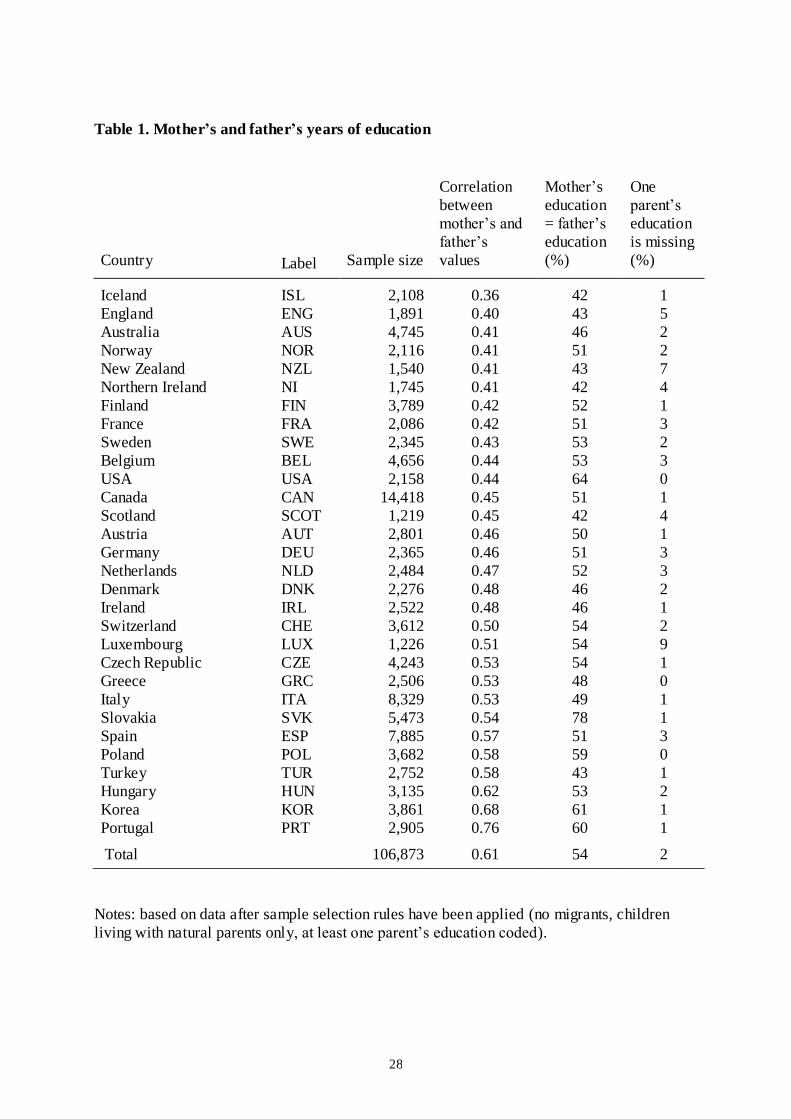
Table 1 shows a moderate association between mother‟s and father‟s years of
education. The correlation coefficient is between 0.4 and 0.6 for most countries. Mother‟s and
father‟s education is reported as the same for typically about half the sample in each country.
This association is not surprising given the degree of assortative mating, where individuals
select partners with similar characteristics. (The literature is surveyed by Hans-Peter
Blossfeld 2009.) Yet although the correlation between mother‟s and father‟s education is
strong, it is not so large as to prevent us from trying to identify their separate associations
with children‟s cognitive ability.
Measurement error in the education variables, from children acting as proxy
respondents, may be a concern. Wolfram Schulz (2006) investigates this problem using a
convenience sample collected as part of the PISA 2006 field trial. Parents and children were
asked separately to report the mother‟s and father‟s education level, with a choice of 5
categories. They gave the same category in 63 percent of cases for father‟s education and 66
percent for mother‟s. However, the figure varied substantially between education levels. For

9
example, when children reported „university‟ as their father‟s education level, 86 percent of
fathers also gave this answer. Yet when children reported „non-university tertiary education‟
only 39 percent of fathers agreed. Comparisons can also be made using data for 10 countries
in the actual 2006 PISA sweep.10 Our investigation of these data shows results not dissimilar
to those in the field trial, including much lower agreement between parental and child reports
for non-university tertiary education. We also found some substantial variation across
countries in these figures with, for example, notable differences in Italy in the numbers
reporting secondary education to be the highest qualification obtained by mothers (18 percent
of children but 44 percent of mothers).
One way to test the influence of measurement error in parents‟ education is to estimate
two sets of regressions with the 2006 data, one using the parents‟ responses, the other using
the children‟s, and then to compare the results.11 We exclude immigrants and cases with
incomplete information on mothers and fathers education in either the parental or child
questionnaire. We cannot exclude children not living with their natural parents since the 2006
data contain no information on family structure. We estimate the regressions separately for
the 10 countries and then take the unweighted average of the parameter estimates. Using
children‟s reports of education, a child whose father is university educated scores 41 points
higher on average in the PISA reading test than if the father had less than secondary
schooling. (The standard deviation of scores is about 100 points.) When using fathers‟ reports
of education, the same regression yields a 45 points difference. The corresponding estimates
for maternal university education are 38 points with the child‟s reports and 49 points with the
mother‟s reports. This indicates some notable attenuation in estimates when using the
children‟s reports. Attenuation, at least for university education, is the general pattern in
individual countries but there is some substantial variation from country to country. We do
not feel we have enough evidence on which to base any adjustment of our estimates using the
child reports for the full set of 30 countries. But the need for further research on the quality of
the parental education measures in PISA is clear.
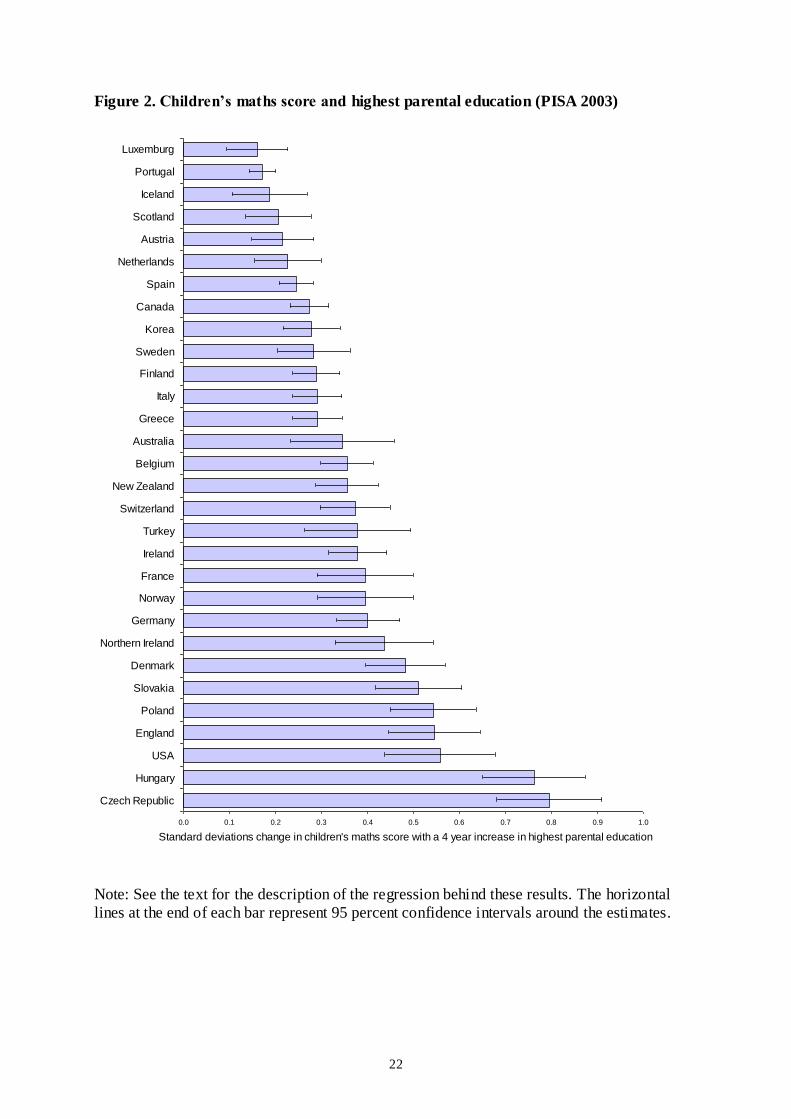
We can illustrate the variation across countries in the links between the generations
shown in our sub-sample of 2003 PISA data when we do not distinguish fathers from
mothers. We regress the child‟s maths score on years of parental schooling, taking whichever
is the higher, father‟s or mother‟s, although in about a half of cases there is no difference as
already seen in table 1. In presenting the results in figure 2, we multiply the estimated
regression coefficient by four, the number of years a university degree course takes in many
countries, and then divide by the standard deviation of children‟s test scores in the pooled (all
10
country, all children) sample, which is equal to 100. This produces a standardised
coefficient.12 One can interpret this coefficient as the number of „international‟ standard
deviations of test score associated on average with a 4 year increase in parental education. We
also adopt this practice in the next section.
The variation across countries is marked, the standardised estimate varying from less
than 0.2 of a test score standard deviation to about 0.8. Note the particularly strong
relationship between parental schooling and children‟s ability in the USA and England and in
the four Central European countries, where the Czech Republic and Hungary stand out.13 It is
also interesting to make pairwise comparisons between certain countries. The figure for the
USA is twice that for Canada (0.56 compared to 0.27). Likewise, parental education has
greater association with children‟s maths ability in England compared to Scotland, and in
Denmark compared to Sweden.14
4. Results
We now test the association between each parent‟s education and their child‟s cognitive skills
at age 15 using regression models in which each parent‟s years of education enters separately.
To be clear, although we will use the terms „effect‟ and „impact‟ at times for convenience, we
are not presuming a causal relationship in any of the models we estimate.
Fathers’ versus Mothers’ Education
In the first model, we allow for gender differences in the parents‟ generation only,
restricting the effect of each parent‟s education to be the same for boys and girls (individuals
are denoted by the subscript i). Missing value dummies for each parent‟s education are
included in this and all subsequent regressions.
Ai = α + γ.BOYi + λ1.PAi + λ 2.MAi + ξi, where
A = the child‟s test score
BOY = 1 if the child is a boy and 0 otherwise
PA = father‟s years of schooling
MA = mother‟s years of schooling
ξ = error term

11
We test the following hypothesis for each country:
H1: mothers and fathers have the same effect on children‟s ability (λ1= λ2)
(In the terminology of Korupp et al. (2002), λ2 = 0 implies what they refer to as the
„Conventional‟ model that only fathers „matter‟; our H1 reflects their „Joint‟ model, and
rejection of H1, together with non-zero λ2, is analogous to their „Individual‟ model. Note
however that our outcome variable differs )
Figure 3 plots the estimated values of the regression coefficients, λ1 and λ2, having
scaled them in the way described in the previous section – by multiplying by four and
dividing by 100. As before, we see the estimated impact of four additional years of a parent‟s
education, measured in „international‟ standard deviations of test scores. So a figure of 0.5
means that a rise in mother‟s or father‟s education of four years is associated on average with
a rise in test score equal to one half of an international standard deviation.
Countries that sit in the top right of the diagram have the greatest association between
parental education and child ability, that is the least educational mobility. The further the
country lies away from the 45 degree line, the greater the difference between the effect of
mother‟s and father‟s education. A circle around the country name shows that the difference
is significant, that is we reject H1, at the 5 percent level. A square shows that it is significant
at the 10 percent level.
Out of the 30 countries, 14 have circles or squares. These are somewhat more
frequently found above the line, implying a greater effect of fathers. In several, the
differences are big in percentage terms – in the Netherlands, Switzerland, Germany and
Australia, the father‟s effect is at least twice the mother‟s. In the USA it is some 50 percent
larger.15 Differences of a similar magnitude are found in the countries that are significantly
below the line. It is difficult to detect clear general patterns, whether in terms of groups of
countries or in terms of the overall level of parental effect. It does not appear to be the case
that where family background is especially important, this is associated with one parent in
particular. All the Nordic countries are below the line, but none significantly so. The same is
true of the poorer countries Greece, Portugal and Turkey, in line with the view of Behrman
(1997) that mother‟s education may be especially important lower down the development
scale. There is no common pattern for the Central European countries. In several Northern
European countries, such as Sweden, Belgium, England and Denmark, the difference between

12
the effect of mothers‟ and fathers‟ education is small.
This variation about the 45 degree line shows there are substantial cross-country
differences in the relative importance of mothers and fathers. But at the same time, half the
countries are without circles or square: we cannot reject the null hypothesis of no difference
in father‟s and mother‟s impact in half of the countries, even at the 10 percent level. Table 2
reports results from the regression model when we combine the data for all countries so as to
increase vastly sample size (we include country dummies). Of course, this has disadvantage
of restricting the impact for fathers and mothers to be the same in each country – in effect we
are averaging across both the vertical and horizontal dimensions in the graph. The p-values
reported in Table 2 show that we reject the null of no difference in this pooled sample at the 5
percent level (but never at the 1 percent level) for all three subjects, maths, science and
reading. And, in this pooled sample, fathers on average have more effect (not shown). For
example, for maths, the standardised coefficient estimates are 0.238 for fathers and 0.208 for
mothers.
Distinguishing between sons and daughters
Our review of the literature suggested that parents may be more effective at
transferring their human capital to children of the same gender. The next model takes this into
account by introducing interactions between each parent‟s education and the child‟s gender:
Ai = α + γ.BOYi + β1.PAi + β2.MAi + β3.BOYi.PAi + β4.BOYi.MAi + ξi
We begin by comparing the effect of mothers and fathers separately for sons and daughter,
hence testing two hypotheses.
H2: mothers and fathers have the same effect on daughters (β1 = β2)
H3: mothers and fathers have the same effect on sons (β1 + β3 = β2 + β4)
(Rejection of H2 and H3 is in line with the „sex-role‟ model of Korupp et al. (2002))
Figures 4 and 5 show the results of testing these hypotheses for each country for maths
and tables 2 and 3 give the results for each subject for the pooled sample of all countries. The
pooled sample results show a clear difference between sons and daughters. For daughters, we
always fail to reject the null hypothesis, while for sons we always reject it. Fathers‟ education
is more important than mothers‟ for sons. For example, Table 3 shows that four additional

13
years of mothers‟ education is estimated to increase their sons‟ maths score by 0.163 (= 0.202
– 0.039) of an international standard deviation. The same addition in fathers‟ education leads
to an increase of 0.232 (= 0.198 + 0.034), about 40 percent more.
The picture for individual countries in part reflects these results – there are 14
countries above the 45 degree line in figure 4 for daughters, signifying fathers more
important, but 20 in figure 5 for sons. (The Nordic countries are all below the line in figure 4
but not in figure 5.) But in most countries the null cannot be rejected, whether for sons or for
daughters. Germany and Australia are the only countries significantly above the line for both
sons and daughters.
We now test two further hypotheses based on the same model:
H4: fathers have the same effect on sons as on daughters (β3 = 0)
H5: mothers have the same effect on sons as on daughters (β4 = 0)
Note the difference between H2 and H3, and H4 and H5. The first pair of hypotheses focuses
on the differences in effects of mothers and fathers for children of a specified gender. Now we
consider one parent at a time but compare their effect on sons and daughters.
Figure 6 suggests little evidence against H4 and not much variation from country to
country. Countries sit quite tightly round the 45 degree line. The null hypothesis is rejected
nowhere, although it is just rejected for maths at the 5 percent level in the pooled sample
(Tables 2 and 3) with fathers having somewhat more effect for sons. Figure 7 for girls also
shows less scatter than the earlier graphs but the obvious change from figure 6 for boys is that
most countries are now to the right of the 45 degree line (23 out of 30). Mothers appear to
have more influence on girls‟ ability in maths than on boys‟ ability, although only in France
and Denmark is the effect statistically significant. The broad pattern in figure 7 is reflected in
the results for maths in Tables 2 and 3. An increase of mother‟s education of four years is
associated with an increase in a daughter‟s maths score of 0.202 of a standard deviation,
compared to a 0.163 increase for sons (= 0.202 – 0.039), a modest difference. However for
reading and science we cannot reject the null of no difference in effect.
Complementarities between parents
The preceding models have constrained mother‟s and father‟s education to have
independent effects on children‟s cognitive ability. However, the influence of one may
depend on the other. There could be substitution possibilities between mother‟s and father‟s

14
schooling, as described by Behrman (1997). This would mean the effect of having a highly
educated mother is smaller if the father is also highly educated. On the other hand, mother‟s
and father‟s education could be complementary. In this case better educated mothers are more
effective at passing on their human capital to children if the father is also better educated.
There seems only a scant existing literature on this issue.16
We test for these effects by including an interaction between mother‟s and father‟s
education in our first model (which restricts the parental effects to be the same for boys and
daughters). (As before, by „effect‟ we mean „association.) The model is now specified:
Ai = α + γ.BOYi + ψ1.PAi + ψ 2.MAi + ψ3.PAi .MAi + ξi
We test the hypothesis:
H6: Mothers‟ and fathers‟ influences do not interact with each other (ψ3 =0)
Results for the pooled sample show a positive coefficient on the interaction term for
all three subjects, implying complementarity, and one that is well determined (t = 5.9 for
maths, for example).17 When estimating the model for each individual country, we find the
interaction to be positive in 22 countries and significant at the 5 percent level in 9. The latter
group includes three of the four Central European countries, and all three countries from the
UK present in the data, England, Scotland and Northern Ireland. A statistically significant
negative impact at the 5 percent level is found in three countries: Italy, Portugal and
Switzerland.
The typical pattern of complementarity suggests that assortative mating may
strengthen the intergenerational transmission of human capital, at least as far as the outcome
we have considered in this chapter, children‟s cognitive ability in their early/mid-teens.
Educational „homogamy‟, that is marriage to a person of the same educational level, leads to
„advantageous (and disadvantageous) economic and sociocultural resources of two
individuals [being]... pooled and cumulated‟ (Blossfeld 2009). Complementarity implies that
the impact of this pooling and cumulation on children‟s learning is not additive. However, our
results here are best seen as suggestive, requiring further elaboration in the light of possible
measurement error and better theoretical underpinning.
5. Conclusions

15
To our knowledge, existing studies have not considered the separate associations of mothers‟
and fathers‟ education with their sons‟ and daughters‟ cognitive ability for a large number of
countries using data designed with cross-national comparison in mind. We therefore make a
contribution to the literature on how educational advantage and disadvantage are transferred
between generations by exploring these gender differences for 30 rich industrialised nations,
restricting attention to children living with both natural parents. This complements a small
body of work that has investigated the links usually for a single country, focusing in the main
on the children‟s final level of schooling rather than cognitive ability.
It is not easy to make broad generalisations from our results. The picture often differs
substantially across countries; mothers are more important in some, fathers in others. This
cross-national variation supports the mixed evidence in our review of the literature. It also
serves as a reminder that one should be cautious about making general statements on the basis
of evidence drawn from a single country, for example the US for which the earlier evidence
seems more abundant than elsewhere.
That said, we attempt a summary of the general picture, focusing on the results for
ability in maths. First, it is more common for father‟s education to have a greater effect tha n
mother‟s education. Remember we use „effect‟ without implying causality. Second, this
appears to be particularly true of sons, although there are plenty of countries that are counter
examples. Third, there seems to be more variation across countries in the gender differences
in the parents‟ generation than the children‟s. Fourth, there is some suggestion that mothers‟
education has more effect on their daughters‟ ability than their sons, yet the difference is often
small. Fifth, it seems we should not only consider the relative importance of each parent‟s
education, but also how they combine. Our results suggest that they may typically combine
positively; mother‟s and father‟s education appear complementary in their association with
the child‟s ability.
This last observation leads to the first avenue for further work. We have not
distinguished between couples where the father is more educated than the mother and those
where the opposite is the case. The type of combination of father‟s and mother‟s education
may matter for the child‟s learning, although selection bias can be expected – women who
„marry up‟ (hypergamy) may differ from those who „marry down‟ (hypogamy) in unobserved
ways that influence their child‟s learning.
A second avenue is to enrich the measurement of each parent‟s socio-economic status,
moving beyond education alone. An obvious possibility is occupation, following the lead of,

16
for example, Korupp et al. (2002). Each parent‟s occupation is recorded in PISA, although
again is reported by the child. Our preliminary exploration of these data, adding measures of
father‟s and mother‟s occupation to our regressions, tended to produce a clearer pattern that
mothers „matter‟ more for girls, while fathers are more important for boys. Inter alia, further
work in this direction would require a conceptual framework to complement that in figure 1
for parental education.
The third avenue is to try to relate the cross-national patterns we have found to
country-specific policies or institutions. This is a challenge. There seems no easy explanation
as to why fathers have more influence than mothers in countries like Australia and Germany,
for the opposite to be true in Hungary and Turkey, and for no significant differences in, for
example, England and Belgium. One possibility that we cannot yet entirely rule out is that the
differences we observe across countries in the PISA data are often due to variations in data
quality; our measure of family background is reliant upon 15 year old children knowing and
accurately reporting their mother‟s and father‟s levels of education and we have drawn
attention to evidence that questions whether this is the case.
Despite the limitations and the avenues still to explore, we have at least highlighted
the role that gender may play in the transfer of human capital between generations. In this
respect, the spirit of the chapter contrasts with a reasonable amount of existing work on
economic and social mobility. We advocate investigation of gender differences in other
aspects of intergenerational mobility, accompanying further work on the role that these
differences play in children‟s cognitive abilities.
Acknowledgements
Micklewright thanks the Institute for Research on Poverty at University of Wisconsin-
Madison for hospitality during a visit when this chapter was begun. We thank seminar and
conference participants at IRP, the Central European University, and the University of
Bamberg for comments. The work was partly financed by the Russell Sage Foundation.
Endnotes
1. There is no explicit role for schools in the model. One can think of parents‟ choice of

17
schools, subject to various constraints, also being determined by their education and abilities.
If schools have a positive impact, the simple correlation of parental education and child
ability will in part reflect this pathway.
2. The NELS cohort were first interviewed in 1988 at age 14. We imputed completed years of
education for both cohort members and parents from variables for highest qualification
achieved.
3. On the channels by which educated mothers influence early childhood learning and the
evidence for this, see for example Katja Coneus and Maresa Sprietsma (2009).
4. For further evidence on the US, see for example Behrman and Mark Rosenzweig (2002)
and Lídia Farré et al. (2009). Korupp et al. (2002) compare the US with (West) Germany and
the Netherlands, but they include parental occupation as well as education in their models.
5. The father-son link is stronger than the mother-son link (t=3.5) and the mother-daughter
link stronger than the father-daughter link although the difference in this case is not well
determined (t=2.05). T-statistics calculated by us from the reported standard errors for each
regression coefficient (Björkland et al. 2007, table 2, column 1); we have thus ignored
covariances when estimating the standard error of the difference in coefficients.
6. Japan is excluded because data are missing for all observations on some key variables,
including whether the child lives with their biological or step parents.
7. Questions marks over response patterns in England are analysed in John Micklewright et
al. (2010).
8. The PISA assessment focuses on children‟s functional skills; whether they can apply what
they have learned to real life situations. It is argued that this assists the cross-national validity
of the study, allowing measurement of achievement against a standard in a culture free way.
9. Children are told „Some of the following questions are about your mother and father or
those person(s) who are like a mother or father to you, for example, guardians, step-parents,
foster parents, etc. If you share your time with more than one set of parents or guardians,
please answer the following questions for those parents/guardians you spend the most time
with.‟
10. Among OECD countries, parents were questioned as well as children in Germany,
Denmark, Iceland, Italy, Korea, Luxemburg, New Zealand, Poland, Portugal and Turkey.
11. We assume that any measurement error lies only in the child‟s reports, although this may

18
not be the case. See also Nanna Lien et al. (2001).
12. Four years is also roughly the international standard deviation of both mother‟s and
father‟s years of education. The international standard deviations for both test scores and
years of education tend to be higher than most national standard deviations, as they reflect
both within- and between-country differences.
13. The position of the Central European countries is consistent with large differences in
education attainment by family background during the communist period as well as any
differences that have emerged subsequently (Yossi Shavit and Hans-Peter Blossfeld 1993,
UNICEF 1998).
14. Comparison with results in Gabriela Schütz et al. (2008, table 3), drawn on by Machin
(2009), is a reminder that the detailed cross-country picture of intergenerational mobility may
depend on the measure of socio-economic status that is selected and the data set that is used:
these authors use data from the Trends in Maths and Science Study and books in the home to
proxy family background. We find a correlation of only 0.43 for our family background
associations in figure 2 with theirs for the same countries. See Giorgina Brown et al. (2007)
on the comparability of surveys.
15. A similar pattern is found in the NELS data for the US when we regress age 14 scores on
parental education (see note 2).
16. For example, Behrman cites Ricardo Barros and David Lam (1996), who find evidence of
a positive interaction suggesting complementarity.
17. Not surprisingly, the inclusion of the interaction term reduces the precision of the
estimated main effects of each parent‟s education. They remain strongly significant
individually but for example in the maths equation the effect of mother‟s education is not
statistically different from the effect of father‟s education.

19
References
Barros, Ricardo, and David Lam. 1996. “Income and Educational Inequality in Children's
Schooling Attainment.” In Opportunity Foregone: Education in Brazil, edited by Nancy
Birdsall and Richard Sabot. Baltimore, MD: The Johns Hopkins University Press
Baxter, Jennifer. 2002. “How much does Parental Education Explain Educational Attainment
of Males and Females in Australia?” Negotiating the Life Course discussion paper DP-015.
Canberra: Australian National University.
Beller, Emily. 2009. “Bringing Intergenerational Social Mobility Research into the Twenty-
First Century: Why Mothers Matter.” American Sociological Review 74(4): 507-28.
Behrman, Jere. 1997. “Mother‟s Schooling and Child Education: A Survey.” PIER working
paper 97-025. Philadelphia: University of Pennsylvania.
Behrman, Jere, and Mark Rosenzweig. 2002. “Does Increasing Women's Schooling Raise the
Schooling of the Next Generation?” The American Economic Review 92(1): 323-34.
Blanden, Jo, Paul Gregg and Lindsey Macmillan. 2007. “Accounting for Intergenerational
Income Persistence: Noncognitive Skills, Ability and Education.” IZA discussion paper 2554.
Bonn: IZA.
Blossfeld, Hans-Peter. 2009. “Educational Assortative Marriage in Comparative Perspective.”
Annual Review of Sociology 35: 513-30.
Björklund, Anders, Markus Jäntti, and Gary Solon. 2007. “Nature and Nurture in the
Intergenerational Transmission of Socioeconomic Status: Evidence from Swedish Children
and Their Biological and Rearing Parents.” The B.E. Journal of Economic Analysis & Policy
7, Issue 2 (Advances), Article 4.
Brown, Giorgina, John Micklewright, Sylke Schnepf, and Robert Waldmann. 2007.
“International Surveys of Educational Achievement: How Robust are the Findings?” Journal
of the Royal Statistical Society Series A 170(3): 623-46.
Coneus, Katja, and Maresa Sprietsma. 2009. “Intergenerational Transmission of Human
Capital in Early Childhood.” ZEW discussion paper 09-038. Mannheim: ZEW.
Dearden, Lorraine, Stephen Machin, and Howard Reed. 1997. “Intergenerational Mobility in
Britain.” The Economic Journal 107(440): 47-66.
Erikson, Robert, and John Goldthorpe. 2002. “Intergenerational Inequality: A Sociological
Perspective.” Journal of Economic Perspectives 16(3): 31–44.
Ermisch, John, and Marco Francesconi. 2001. “Family Matters: Impacts of Family
Background on Educational Attainments.” Economica 68(270): 137-56.
Farré, Lídia, Roger Klein, and Francis Vella. 2009. “Does Increasing Parents‟ Schooling
Raise the Schooling of the Next Generation? Evidence Based on Conditional Second
Moments.” IZA discussion paper 3967, Bonn: IZA.

20
Haveman, Robert, and Barbara Wolfe. 1995. “The Determinants of Children's Attainments: A
Review of Methods and Findings.” Journal of Economic Literature 33(4): 1829-78.
Heineck, Guido, and Regina Riphahn. 2007. “Intergenerational Transmission of Educational
Attainment in Germany: The Last Five Decades.” IZA discussion paper 2985. Bonn: IZA.
Johnston, Aaron, Harry Ganzeboom, and Douglas Treiman . 2005. “Mothers‟ and Fathers‟
Influences on Educational Attainment.” RC28 conference. Oslo: Norway (May 6-8, 2005).
Korupp, Sylvia, Harry Ganzeboom, and Tanja Van Der Lippe. 2002. “Do Mothers Matter? A
Comparison of Models of the Influence of Mothers‟ and Fathers‟ Educational and
Occupational Status on Children‟s Educational Attainment.” Quality and Quantity, 36(1): 17-
42.
Leibowitz, Arleen. 1974. “Home Investments in Children.” Journal of Political Economy
82(2,II): S111-31.
Lien, Nanna, Christine Friestad, and Knut-Inge Klepp. 2001. “Adolescents' proxy reports of
parents socioeconomic status: How valid are they?” Journal of Epidemiological Community
Health 55(10): 731-7.
Machin, Stephen. 2009. “Inequality and Education.” In The Oxford Handbook of Economic
Inequality,edited by Wiemer Salverda, Brian Nolan, and Timothy Smeeding. Oxford: Oxford
University Press.
Micklewright John, Sylke Schnepf, and Chris Skinner. 2010. “Non-response Biases in
Surveys of School Children: the case of the English PISA Samples.” IZA discussion paper.
Bonn: IZA.
OECD. 2004. Learning for Tomorrow’s World – First Results from PISA 2003, Paris: OECD
OECD. 2008. Education at a Glance. Paris: OECD.
Schütz Gabriela, Heinrich Ursprung, and Ludger Wößmann. 2008. “Education Policy and
Equality of Opportunity.” Kyklos, 61(2): 279-308.
Schulz, Wolfram. 2006. “Measuring the socio-economic background of students and its effect
on achievement in PISA 2000 and PISA 2003.” Annual Meetings of the American
Educational Research Association. San Francisco (April 7-11, 2005).
Shavit, Yossi, and Hans-Peter Blossfeld. 1993. Persistent Inequality: Changing Educational
Attainment in Thirteen Countries. Boulder, Colorado: Westview Press
Steedman, Hilary, and Steven McIntosh. 2001. “Measuring low skills in Europe: how useful
is the ISCED framework?” Oxford Economic Papers 53(3): 564-81.
UNICEF. 1998. Education for All? MONEE project regional monitoring report 5. Florence,
Italy: UNICEF International Child Development Centre.

21
Figure 1. The determination of children’s ability and final schooling levels
Source: adapted from Haveman and Wolfe (1995, figure 1).
Parents’ abilities Parents’ education
Time inputs Goods inputs
Child’s ability
Family income
Heredity
Final schooling level
22
Figure 2. Children’s maths score and highest parental education (PISA 2003)
0.0 0.1 0.2 0.3 0.4 0.5 0.6 0.7 0.8 0.9 1.0
Czech Republic
Hungary
USA
England
Poland
Slovakia
Denmark
Northern Ireland
Germany
Norway
France
Ireland
Turkey
Switzerland
New Zealand
Belgium
Australia
Greece
Italy
Finland
Sweden
Korea
Canada
Spain
Netherlands
Austria
Scotland
Iceland
Portugal
Luxemburg
Standard deviations change in children's maths score with a 4 year increase in highest parental education
Note: See the text for the description of the regression behind these results. The horizontal
lines at the end of each bar represent 95 percent confidence intervals around the estimates.

23
Figure 3. Mother’s and father’s education and child’s maths score (H1)
NI
SCOT
USA
TUR
SWE
SVK
PRT
POL
NZL NOR
NLD
LUX
KOR
ITA
ISL
IRL
HUN
GRC
ENG
FRA
FINESP
DNK
DEU
CZE
CHE
CAN
BEL
AUT
AUS
0.2
.4.6
Sta
nd
ard
ised
effect of fa
the
r's y
ea
rs o
f ed
ucation
0 .2 .4 .6Standardised effect of mother's years of education
Notes: The 45 degree line represents where mother‟s and father‟s education have equal
influence on their children‟s maths score. Circles (squares) indicate countries where the effect
of mother‟s and father‟s education is statistically different at the 5% (10%) significance level.
The x and y axis show the standardised effect of mother‟s and father‟s education: by how
many (international) standard deviations does a child‟s test score change with a 4 year
increase in the parent‟s education.

24
Figure 4. Mother’s and father’s education and daughter’s maths score (H2)
NI
AUS
AUT
BELCAN
CHE
CZE
DEU
DNK
ESP
FINFRA
ENG
GRC
HUN
IRL
ISL
ITA
KOR
LUX
NLD
NORNZL
POL
PRT
SVK
SWE
TUR
USA
SCOT
0.2
.4.6
Sta
nd
ard
ised
effect of fa
the
r's y
ea
rs o
f ed
ucation
0 .2 .4 .6Standardised effect of mother's years of education
Notes: see figure 3.

25
Figure 5. Mother’s and father’s education and son’s maths score (H3)
NI
AUS
AUT
BEL
CAN
CHE
CZE
DEU
DNK
ESPFIN
FRA
ENG
GRC
HUN
IRL
ISLITA
KOR
LUX
NLDNOR
NZL
POL
PRT
SVK
SWE
TUR
USA
SCOT
0.2
.4.6
Sta
nd
ard
ised
effect of fa
the
r's y
ea
rs o
f ed
ucation
0 .2 .4 .6Standardised effect of mother's years of education
Notes: see figure 3.

26
Figure 6. Father’s education and son’s and daughter’s maths score (H4)
NI
AUS
AUT
BEL
CAN
CHE
CZE
DEU
DNK
ESPFIN
FRA
ENG
GRC
HUN
IRL
ISLITA
KOR
LUX
NLDNOR
NZL
POL
PRT
SVK
SWE
TUR
USA
SCOT
0.2
.4.6
Sta
nd
ard
ised
effect of fa
the
r's y
ea
rs o
f ed
ucation
boys
0 .2 .4 .6Standardised effect of father's years of education on girls
Notes: The 45 degree line represents where father‟s education has equal influence on boy‟s
and girl‟s maths scores. See also figure 3.

27
Figure 7. Mother’s education and son’s and daughter’s maths score (H5)
NI
AUS
AUTBEL
CANCHE
CZE
DEU
DNK
ESPFIN
FRA
ENG
GRC
HUN
IRL
ISL
ITA
KOR
LUX
NLD
NOR
NZL
POL
PRT
SVK
SWE
TUR
USA
SCOT
0.2
.4.6
Sta
nd
ard
ised
effect of m
oth
er's y
ears
of e
du
ca
tio
n o
n b
oys
0 .2 .4 .6Standardised effect of mothers year's of education of girls
Notes: The 45 degree line represents where mother‟s education has equal influence on boy‟s
and girl‟s maths scores. See also figure 3. There is a statistically significant difference at the
10% level in Finland, though this is not clearly illustrated in the graph due to the overlapping
country labels.
28
Table 1. Mother’s and father’s years of education
Country
Label Sample size
Correlation
between
mother‟s and
father‟s
values
Mother‟s
education
= father‟s
education
(%)
One
parent‟s
education
is missing
(%)
Iceland ISL 2,108 0.36 42 1
England ENG 1,891 0.40 43 5
Australia AUS 4,745 0.41 46 2
Norway NOR 2,116 0.41 51 2
New Zealand NZL 1,540 0.41 43 7
Northern Ireland NI 1,745 0.41 42 4
Finland FIN 3,789 0.42 52 1
France FRA 2,086 0.42 51 3
Sweden SWE 2,345 0.43 53 2
Belgium BEL 4,656 0.44 53 3
USA USA 2,158 0.44 64 0
Canada CAN 14,418 0.45 51 1
Scotland SCOT 1,219 0.45 42 4
Austria AUT 2,801 0.46 50 1
Germany DEU 2,365 0.46 51 3
Netherlands NLD 2,484 0.47 52 3
Denmark DNK 2,276 0.48 46 2
Ireland IRL 2,522 0.48 46 1
Switzerland CHE 3,612 0.50 54 2
Luxembourg LUX 1,226 0.51 54 9
Czech Republic CZE 4,243 0.53 54 1
Greece GRC 2,506 0.53 48 0
Italy ITA 8,329 0.53 49 1
Slovakia SVK 5,473 0.54 78 1
Spain ESP 7,885 0.57 51 3
Poland POL 3,682 0.58 59 0
Turkey TUR 2,752 0.58 43 1
Hungary HUN 3,135 0.62 53 2
Korea KOR 3,861 0.68 61 1
Portugal PRT 2,905 0.76 60 1
Total 106,873 0.61 54 2
Notes: based on data after sample selection rules have been applied (no migrants, children
living with natural parents only, at least one parent‟s education coded).

29
Table 2. Tests of hypotheses for the three PISA domains, pooled sample of 30 countries
(p-values)
Hypothesis Maths Reading Science
H1 Mother → Child = Father → Child 0.04 0.03 0.02
H2 Mother → Daughter = Father → Daughter 0.24 0.42 0.31
H3 Mother → Son = Father → Son 0.00 0.02 0.02
H4 Father → Son = Father → Daughter 0.04 0.13 0.21
H5 Mother → Son = Mother → Daughter 0.03 0.31 0.25
H6 Mother ↔ Father interaction = 0 0.00 0.00 0.00
Notes: Figures in the table refer to p-values; estimation of standard errors allows for
clustering of children within schools.
Table 3. Standardised regression coefficients for the three PISA domains, pooled sample
of 30 countries
Maths Reading Science
Boy (γ) 0.114 (0.046) -0.372 (0.046) 0.039 (0.048)
Father's Years of Education (β1) 0.198 (0.011) 0.186 (0.011) 0.218 (0.012)
Boy × Father's Years of Education (β3) 0.034 (0.016) 0.025 (0.017) 0.022 (0.018)
Mother's Years of Education (β2) 0.202 (0.013) 0.173 (0.012) 0.198 (0.014)
Boy × Mother's Years of Education (β4) -0.039 (0.016) -0.015 (0.016) -0.018 (0.017)
Notes: Standard errors in parentheses. Their estimation allows for clustering of children
within schools. The models include a dummy variable for each country although the
coefficients are not reported. The β coefficients represent the standardised effect of that
variable; by how many (international) standard deviations does a child‟s test score change
with a four year increase in mother‟s or father‟s education. The γ coefficient shows the
difference between boys and girls using the same metric; for example, boys are estimated to
have reading scores that on average are 0.372 of an international standard deviation lower
than those of girls, holding other factors constant.