children’s patience and school-track choices several years
TRANSCRIPT
Children’s patience and school-track choicesseveral years later: Linking experimental andfield data
Silvia Angerer, Jana Bolvashenkova, Daniela Glätzle-Rützler,Philipp Lergetporer, Matthias Sutter
Working Papers in Economics and Statistics
2021-17
University of Innsbruckhttps://www.uibk.ac.at/eeecon/
University of InnsbruckWorking Papers in Economics and Statistics
The series is jointly edited and published by
- Department of Banking and Finance
- Department of Economics
- Department of Public Finance
- Department of Statistics
Contact address of the editor:research platform “Empirical and Experimental Economics”University of InnsbruckUniversitaetsstrasse 15A-6020 InnsbruckAustriaTel: + 43 512 507 71022Fax: + 43 512 507 2970E-mail: [email protected]
The most recent version of all working papers can be downloaded athttps://www.uibk.ac.at/eeecon/wopec/
For a list of recent papers see the backpages of this paper.
1
Children’s patience and school-track choices several years later:
Linking experimental and field data*
Silvia Angerer1, Jana Bolvashenkova2, Daniela Glätzle-Rützler3, Philipp Lergetporer2, and Matthias Sutter4,3
1 UMIT – Private University for Health Sciences, Medical Informatics and Technology 2 ifo Institute at the University of Munich
3 University of Innsbruck 4 Max Planck Institute for Research into Collective Goods Bonn and University of Cologne and IZA Bonn
Abstract
We present direct evidence on the link between children’s patience and educational-track choices years later. Combining an incentivized patience measure of 493 primary-school children with their high-school track choices taken at least three years later at the end of middle school, we find that patience significantly predicts choosing an academic track. This relationship remains robust after controlling for a rich set of covariates, such as family background, school-class fixed effects, risk preferences, and cognitive abilities, and is not driven by sample attrition. Accounting for middle-school GPA as a potential mediating factor suggests a direct link between patience and educational-track choice.
Keywords: patience, education, school track choice, children, lab-in-the-field experiment
JEL classification: C91, D90, I21, J2
21 May 2021
* We thank Marc Piopiunik, Larissa Zierow, and seminar participants at the ifo Center for the Economics of Education
for helpful comments. We thank Rudolf Meraner from the South Tyrolean State Board of Education (Deutsches Bildungsressort Bereich Innovation und Beratung), the schools’ headmasters (Gabriella Kustatscher, Maria Angela Madera, Eva Dora Oberleiter, Brigitte Öttl, Ursula Pulyer, Vally Valbonesi), and the parents of the involved children for making this study possible, and the children for participation. Financial support from the Government of the autonomous province South Tyrol through grant 315/40.3 is gratefully acknowledged.
2
1. Introduction
A key feature of many school systems around the world is tracking, which requires children to select
one of several school tracks that differ in terms of their academic content, length, and future labor-market
opportunities.1 According to human capital investment theory (e.g., Mincer, 1958; Becker, 1964;
Heckman et al., 2006), children’s patience should play a decisive role in their school-track choice, since
the additional investments in terms of time, effort, and foregone immediate earnings that are required
when choosing an academic school track have to be set against discounted future gains. Yet, direct
empirical evidence on the link between children’s patience and their school-track choices is largely
lacking. This is the research gap that we address in this paper.
To this end, we link incentivized intertemporal-choice data that we collected in a lab-in-the-field
experiment with 493 primary-school children (grades two to five) in Northern Italy with administrative
information about their school-track choices taken three to six years later (after middle-school, i.e., after
grade eight). The resulting dataset is characterized not only by low attrition, but also by its exceptional
richness: It contains detailed individual-level information on children’s family background, an
incentivized measure of their risk preferences, cognitive abilities, and middle-school grade point average
(GPA).2 This combination of experimental, survey-based, and administrative information equips us with
the rare opportunity to investigate how patience correlates with educational decisions years later, and
how robust the relationship is to controlling for important background characteristics.
We find a strong and positive relationship between patience and school-track choice: Children who
are one standard deviation more willing to invest into the future in the intertemporal-choice task
conducted in primary school are 4.6 percentage points more likely to choose the highest educational
track at the end of middle school. The fact that we measured children’s patience years before they took
school-track choices excludes the possibility that our finding suffers from reverse causation problems.
We expose our main result to a series of robustness tests. First, to account for sample attrition (which is
generally low in our data), we employ inverse-probability weighting and attrition bounding and show
that our findings are unaffected by attrition. Second, we control for a host of important background
1 Throughout the paper, “tracking” refers to between-school tracking where children are sorted into schools with a
vocational or an academic focus. This form of tracking is prevalent in many countries: Among the 37 OECD countries that participated in the 2018 PISA test, three track children into different school types at the age of 10 years, four at age 11, three at age 12, three at age 14, and 10 at age 15 (OECD, 2020). See Betts (2011) for a discussion of within-school ability tracking that is present, for instance, in the US.
2 In our setting, middle-school GPA refers to the middle-school final grade which is a measure of overall school performance at the end of middle school (see section 3.2 for details).
3
characteristics, namely children’s family background (migration background and proxied parental
earnings), school-class fixed effects, an incentivized measure of children’s risk-taking, and cognitive
ability measured with Raven’s test. The association between patience and the educational-track choice
remains robust to adding these variables as controls. Third, we investigate the extent to which the
relationship between patience and the educational-track choice is mediated by children’s middle-school
GPA. As expected, GPA is significantly correlated with children’s patience, and with the probability to
choose the academic track. Importantly, however, controlling for GPA leaves the significant association
between patience and academic track choice intact, which suggests a direct link between the two
variables.
We contribute to the literature that investigates the relationship between economic preferences and
field behavior. Among adults, patience has been shown to predict occupational choices, credit-card
borrowing, or unhealthy consumption behavior (e.g., Khwaja et al., 2007; Chabris et al., 2008; Burks et
al., 2009; Meier and Sprenger, 2010). Focusing on the field behavior of children and adolescents,
previous studies report that more patient children and adolescents are less likely to drink alcohol or
smoke, to receive disciplinary referrals, or to drop out from school (e.g., Castillo et al., 2011, 2018, 2020;
Sutter et al., 2013; Backes-Gellner et al., 2021). This literature has so far focused on school misconduct,
dropout, or achievement test scores (e.g., Bettinger and Slonim, 2007), but school-track choices have not
yet been linked to incentivized measures of patience. While we account for the relationships between
patience and educational performance (influencing also dropout decisions) in our analysis, we consider
our focus on school-track choice an important extension to the existing literature for at least two reasons.
First, many education systems entail between-school tracking (OECD, 2020), which implies that a large
part of all children around the globe faces the choice between attending a more or less academic school
track at some point of their educational career. Second, this choice has important repercussions for their
subsequent educational paths, skill development, and labor-market success (e.g., Hanushek et al., 2017).
Yet, the extent to which children’s economic preferences are a potential driver of these decisions has
hardly been studied before.
Our paper also relates to studies showing that hypothetical, non-incentivized measures of patience
predict educational outcomes. Closest to our study, Golsteyn et al. (2014) show that more patient
individuals are more likely to attend the science track in upper secondary school in Sweden, and have
more favorable lifetime outcomes. Interestingly, they show that the relationship between patience and
long-run outcomes operates through early human capital investments. Besides relying on an incentivized
4
patience measure as opposed to a hypothetical one, our study differs from Golsteyn et al. (2014) in terms
of the institutional context. The fact that high-school track choice is not restricted by past educational
performance in the setting that we study (see section 2 for details) makes it likely that children’s patience
has a direct effect on school-track choice. In line with human-capital investment theory, we in fact find
that patience has explanatory power for academic track choice that is independent from children’s GPA.
Relatedly, Cadena and Keys (2015) use data from the National Longitudinal Survey of Youth (NLSY)
and show that respondents aged between 15 and 27 years who are perceived as restless by the interviewer
(which is their proxy for impatience) exhibit worse educational and labor-market outcomes as young
adults. Furthermore, Figlio et al. (2019) and Hanushek et al. (2020) show that a society’s level of patience
measured in international surveys (Hofstede et al., 2010; Falk et al., 2018) is closely linked to student
performance in the PISA test. We also relate to the famous psychological studies on the “marshmallow
test”, which have shown that the decision of four-year olds not to eat one marshmallow now, but to wait
to receive a second one later, predicts educational success and other favorable life outcomes years later
(e.g., Mischel et al., 1972, 1989; Shoda et al., 1990). Importantly, Castillo et al. (2020) show that
economic time preferences (measured in incentivized decision problems) are a distinct contributing
factor to educational outcomes over and above children’s behavior in the marshmallow task, which
demonstrates that studying the relationship between experimental measures of time preferences and
educational outcomes is an important complement to these psychological studies.
Furthermore, our paper contributes to the education-economics literature on educational tracking.
Several studies investigate how (the timing of) between-school tracking affects students’ educational
outcomes or labor-market success (e.g., Hanushek and Woessmann, 2006; Pekkarinen et al., 2009;
Pekkala Kerr et al., 2013; Piopiunik, 2014; Dustmann et al., 2017). While the results are somewhat
mixed, they tend to find that earlier tracking increases inequality in these outcomes. A smaller strand
within this literature investigates individual determinants of children’s school-track choices, and finds
that relatively older children in a class, those from more advantaged family backgrounds, or those
receiving high-intensity mentoring are more likely to choose a more academic school track (e.g.,
Dustmann, 2004; Mühlenweg and Puhani, 2010; Falk et al., 2020). Yet, school-track choices turn out to
be largely unaffected by teachers’ gender, class size, or stated risk preferences of parents (Wölfel and
Heineck, 2012; Argaw and Puhani, 2018; Puhani, 2018). To the best of our knowledge, this literature
has not yet studied the relationship between incentivized measures of children’s patience and their
school-track choices.
5
The rest of the paper is structured as follows. Section 2 introduces the institutional background on
the education system in Northern Italy. Section 3 presents our data. Section 4 presents our results, and
section 5 concludes.
2. Institutional background
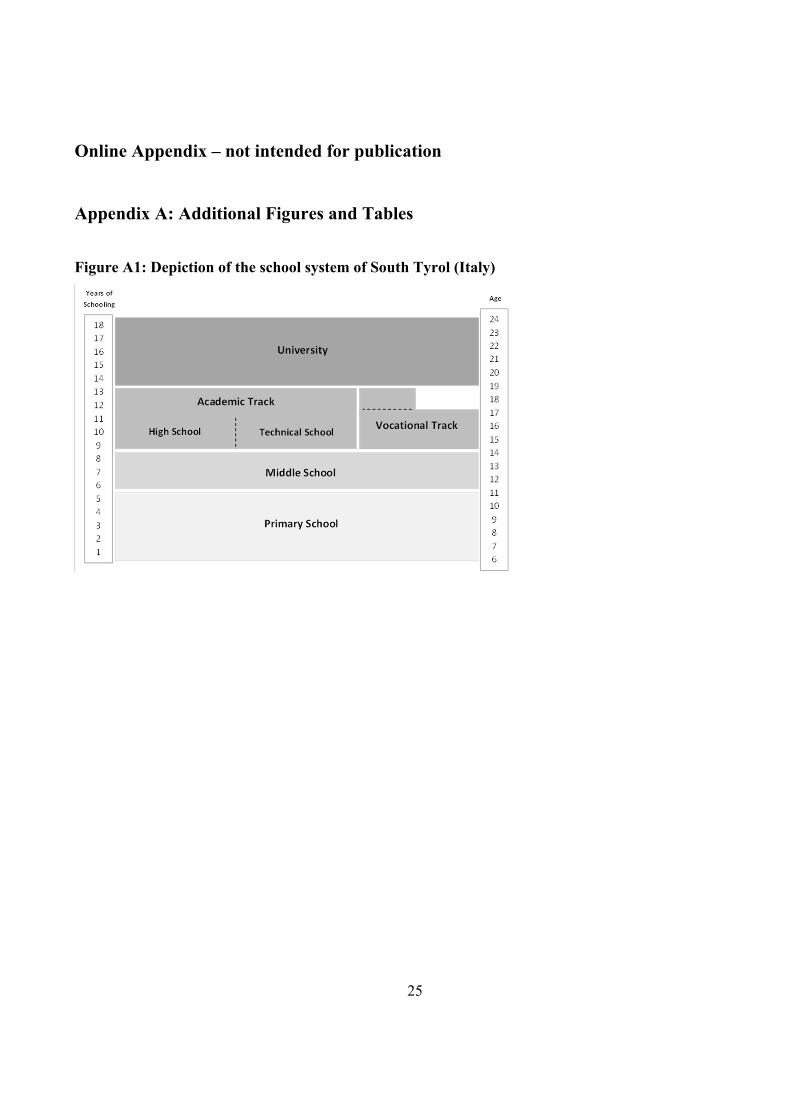
The Italian school system comprises ten years of compulsory school, starting at the age of six years
with primary school (see Appendix Figure A1 for a graphical illustration). After five years of primary
school, all children attend a comprehensive three-years middle school from which they graduate with an
exit exam. Assignment of children to primary- and middle schools is based on the children’s place of
residence in the schools’ catchment areas and thus, unless changing residence, children from one primary
school go to the same middle school. Only after graduating from middle school, children can choose
between different high-school tracks (of which the first two years are still mandatory, although high
schools last for longer).
There are three possible high-school tracks. Children may choose a vocational track or one of two
academic tracks: generic high schools with various focus areas (such as sciences, languages, or arts) or
technical schools specializing in specific fields of study (e.g., economy, technology). Both types of high
schools take five years and lead to the statutory exit exam that is required for university admission. The
vocational track is usually organized as a dual apprenticeship that combines formal schooling with in-
company training. Its duration is three or four years (depending on the program) and it is oriented towards
practical subjects enabling students to enter the labor market upon completion (Autonome Provinz
Bozen-Südtirol, 2020a). Children’s track choice at the end of middle school has important economic
long-term consequences: An academic degree is associated with an average increase in available net
income of 18.1% compared with a compulsory school degree (after 10 years of schooling), whereas a
professional qualification is associated with an average increase in available net income of 6.6% only
(Autonome Provinz Bozen-Südtirol, 2020c). Overall, about 65% of children choose an academic track
(35% a generic high school and 30% a technical school) and 35% the vocational track (Autonome
Provinz Bozen-Südtirol, 2020b).
Two distinctive features of the Italian school system are particularly noteworthy in the context of our
study: First, the school system is comprehensive until the end of middle school, which makes the high-
school track choice the first key educational decision that children take. Second, access to different high-
school tracks is unrestricted and independent from school grades. This implies that children’s educational
6
careers are not determined by past performance, but largely depend on their high-school track choices
that we study as the dependent variable in this paper. The middle-school GPA merely constitutes a
guideline for children and their parents as to whether they are suited for the academic track in terms of
their educational performance (which is similar to, e.g., non-binding secondary school-track
recommendations in several states in Germany; see Bach and Fischer, 2020).3
3. Data
3.1 Experimental data
Patience measure. We elicited children’s patience in an incentivized choice experiment using a
simple investment task (similar to the convex time budget method of Andreoni and Sprenger, 2012a).
Children were endowed with 5 tokens and had to decide how many tokens to consume immediately (by
exchanging them into small presents), and how many tokens to invest in the future. Each invested token
was doubled and the respective presents were delivered 4 weeks after the experiment. On average,
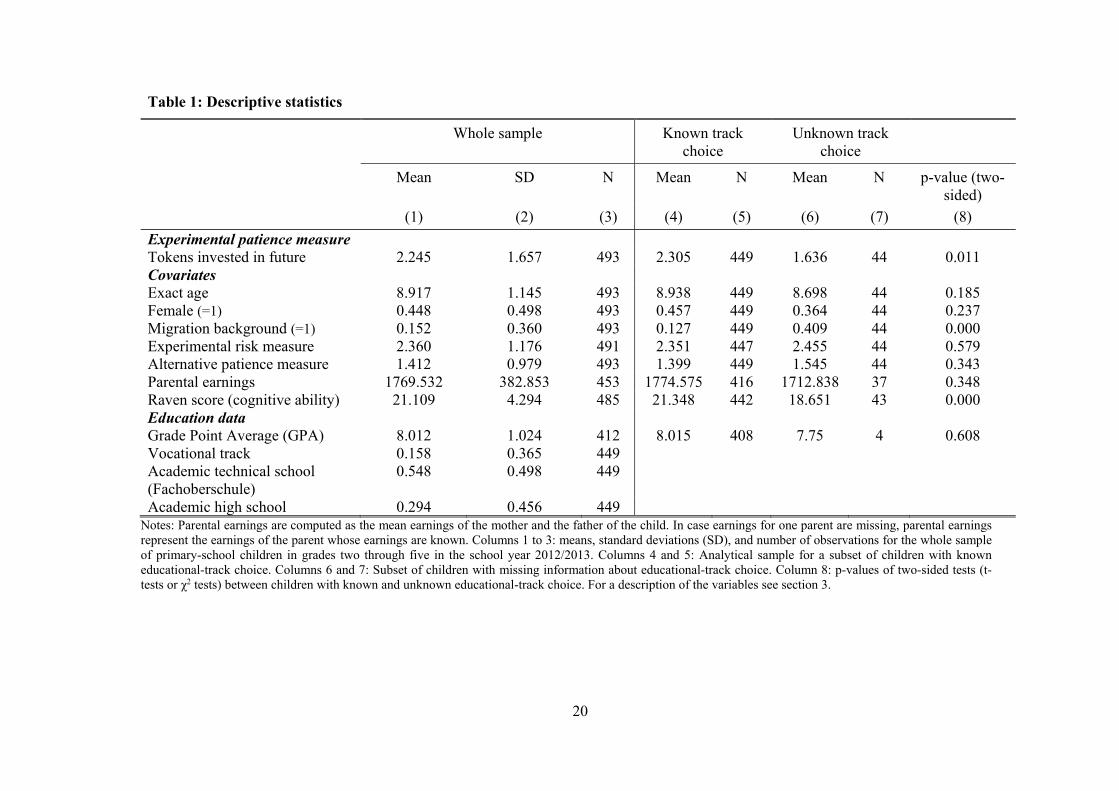
children invested 2.245 (SD: 1.657) tokens into the future (see Table 1 for descriptive statistics). We
take the number of invested tokens as our measure of patience. A major advantage of this procedure is
that it is very easy to understand, which is crucial to minimize measurement error when eliciting
preferences in young children, and at the same time strongly relates to more traditional measures of
patience, like choice list tasks.4
Experimental procedure and subject pool. Our experiment was part of a larger research project
investigating the development of economic decision making in primary-school children. The project was
conducted in all fourteen primary schools in Meran (South Tyrol, Italy) with 86% of children
participating between 2011 to 2013, and entailed six experimental sessions run during regular school
hours (see, e.g., Angerer et al., 2016, for details on the general setting and Sutter et al., 2019, for a
review). The time-investment task was part of the fourth experimental session and was conducted in the
school year 2012/13, the second year of the research project. Thus, we measured children’s patience in
grades two to five of primary school. For this paper, only data from children attending German-speaking
3 An interesting question in our context is to what extent parents influence children’s school-track choices. While we
are not aware of evidence for Italy, Lergetporer et al. (2021) document for Germany that children and parents tend to have equal weight in children’s educational decisions, highlighting the relevance of studying the relationship between children’s patience and school-track choices. We consider investigating the relative influence of children’s and their parents’ patience (which tends to be correlated across generations; Kosse and Pfeiffer, 2012) on children’s educational choices an interesting avenue for future research.
4 In fact, only 4 out of 493 children (0.81%) from our sample had comprehension problems. Excluding these subjects with comprehension problems from the analytical sample does not affect our results qualitatively.
7
primary schools are analyzed as we did not obtain educational data from Italian-speaking schools as
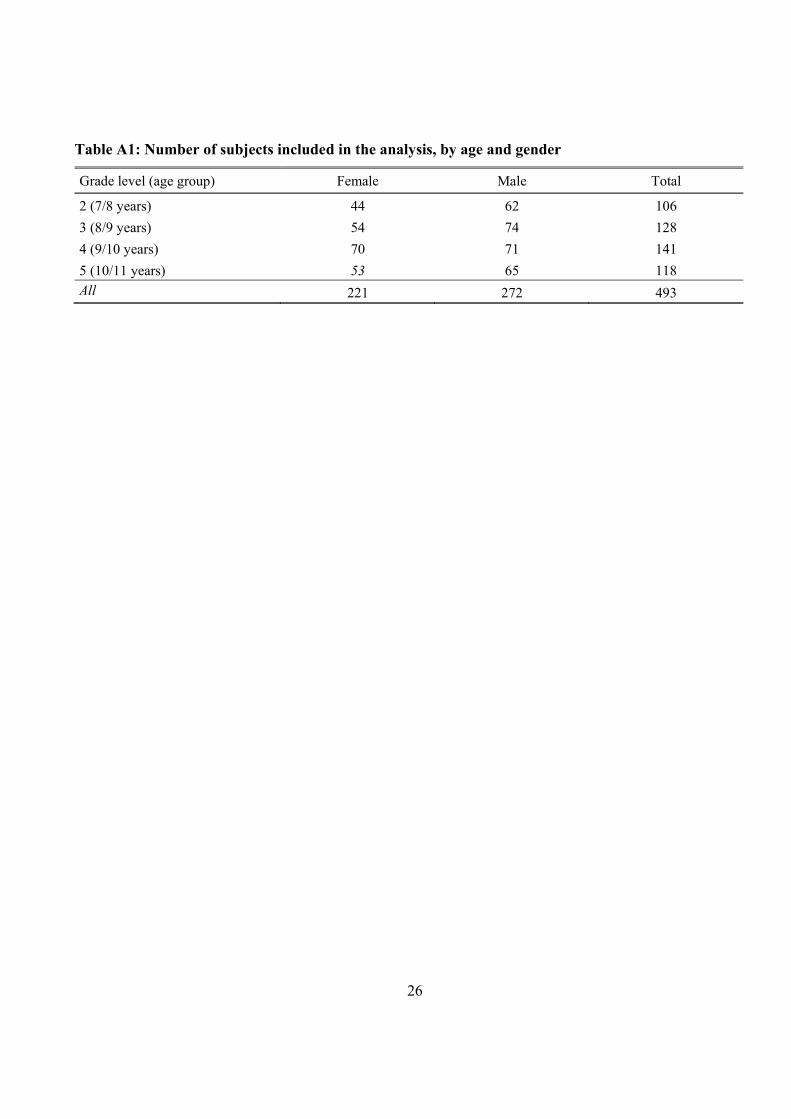
explained below. In total, we obtained time-investment data from 493 second- to fifth-graders (aged 7
to 11 years) in 47 classrooms of seven German-speaking schools. Appendix Table A1 presents the
number of subjects broken down by grade and gender.
At the beginning of the experimental session, children were fetched from the classroom and brought
to a separate room where the experiment took place. The room contained several individual workplaces
for a one-to-one explanation of the task by trained experimenters. All experimenters explained the game
orally (see Appendix B for the experimental instructions) to every single child. To check for
comprehension, the explanation involved control questions, and children had to repeat the rules of the
game in their own words before making their decisions. The decisions were incentivized with
experimental tokens that could be exchanged for little presents, like candies, peanuts, stickers, marbles,
balloons, wristbands, hair ties, and other non-monetary rewards in an experimental shop.5 Each present
was worth one token. Children exchanged the tokens chosen for immediate consumption into presents
right after the experimental session. Presents selected with the tokens invested into the future were
delivered in a sealed envelope with an anonymized child ID exactly 4 weeks after the experiment.
The fact that the time-investment task was embedded in a larger research project allows us to draw
on an unusually rich set of control variables. For instance, the dataset contains information on children’s
family background (migration background6 and proxies for parental earnings), an incentivized risk-
investment measure, and children’s cognitive abilities from a modified version of Raven’s test (see
Appendix B for details on parental earnings and risk elicitation).7
Table 1: Descriptive statistics
5 After children selected their presents, we asked them whether or not they liked the presents. Virtually all children
stated that they liked the presents. 6 In Meran (South Tyrol) about 50% of the population belong to the Italian language group and 50% to the German
language group. Migration background is thus a dummy variable indicating whether at least one parent speaks another language than German or Italian as the main language.
7 In the risk-investment task, children were endowed with 5 tokens and had to decide how many tokens to invest into a risky lottery (following Gneezy and Potters, 1997, and Charness and Gneezy, 2010). The lottery yielded 2 or 0 tokens with equal probability for each token invested, and non-invested tokens were save earnings for the child. To measure cognitive ability, we used 27 of Raven’s colored progressive matrices (Raven et al., 2004). Each matrix consisted of a geometric figure or pattern with a missing piece. The children had to find the missing piece among 6 possible items. The cognitive ability measure for each subject gives the number of correct answers and ranges from 0 to 27.
8
3.2 Administrative education data, attrition and sample characteristics
Educational data is provided by all German-speaking schools in Meran after the graduation of
children from middle school.8 Anonymized administrative data from school records contain the middle-
school GPA and the chosen high school (see the bottom part of Table 1 for descriptive statistics on the
education data).
Middle-school GPA. The middle-school GPA is a measure of school performance at the end of
middle school and is determined as a weighted average of the overall performance during the three
middle-school years, and the grades of the final exam and pre-exams The final exam includes four written
exams in the subjects German, Italian, English and Math/Science, and one oral exam. The exams are
prepared and evaluated by the teachers of the respective subjects and as such are not standardized, but
the contents are based on the overall guidelines provided by the department of education of the
government of South Tyrol. Students with a positive admission grade can take the final exam. The
admission grade is determined by the class council who evaluates a pre-exam of Math and German
together with the performance of the student throughout middle school. The GPA is determined as the
weighted average of the admission grade with a weight of 50% together with the four written exams, and
the oral exam each with a weight of 10% (Autonome Provinz Bozen-Südtirol, 2017). The lowest passing
grade is 6, and the highest possible grade is 10 (average grade in our sample: 8.012).
High-school track choice. The administrative school-record data contain the name of the high
school which the child attended in the subsequent year. In our analysis, we distinguish between a child
choosing an academic or a vocational high-school track. As explained in section 2, the academic track
consists of generic high schools and technical schools (“Fachoberschulen”) whereas the vocational track
comprises all vocational schools (“Berufsschule” and “Fachschule”).9
Attrition. Experimental and educational data were matched by using a unique and anonymous
identification code that was assigned to each child at the beginning of the project. In the administrative
data, 449 observations contain information on high-school track choice. Thus, attrition amounts to 44
observations (out of 493) and is exceptionally low at less than 9%.10 Based on school records, 19 subjects
either left or changed school (e.g., due to movings), or had to repeat a grade. From the remaining 25
8 Note that the school board for Italian primary schools did not consent to provide equivalent data for the seven Italian
schools. 9 Throughout the paper, we use the binary measure “academic track” for our analysis, but using a three-point scale for
track choices yields qualitatively identical results. Appendix Tables A4 and A5 replicate our main results with three-point measure as dependent variable.
10 As a comparison, attrition in Castillo et al. (2018) is 32%.
9
subjects, 4 children graduated from middle school (i.e., obtained a grade 6 or higher), however no high-
school track choice data is available. For another 21 children both, GPA and high-school track choice
information are missing without further record, which is less than 4% of the whole sample.
Sample characteristics. Table 1 reports descriptive statistics of all variables for our whole sample
(columns 1 to 3), as well as broken down for our sample with known/unknown educational-track choice
(columns 4 and 5, respectively 6 and 7). The final column 8 reports p-values of two-sided tests between
the two samples. The table reveals that for most variables the two samples are not significantly different
from each other. Yet, it appears that children with missing high-school choice information are
significantly less patient, have a lower score on Raven’s test, and are significantly more likely to have a
migration background. These differences across samples are consistent with the interpretation that
children with missing high-school information had to repeat a grade or dropped out from school, which
would be in line with Castillo et al. (2018) who show more impatient children being less likely to
graduate from high school. Importantly, in the next section we employ inverse-probability weighting
and attrition bounding to show that selective attrition does not affect our results .
4. Results
4.1 Main Results
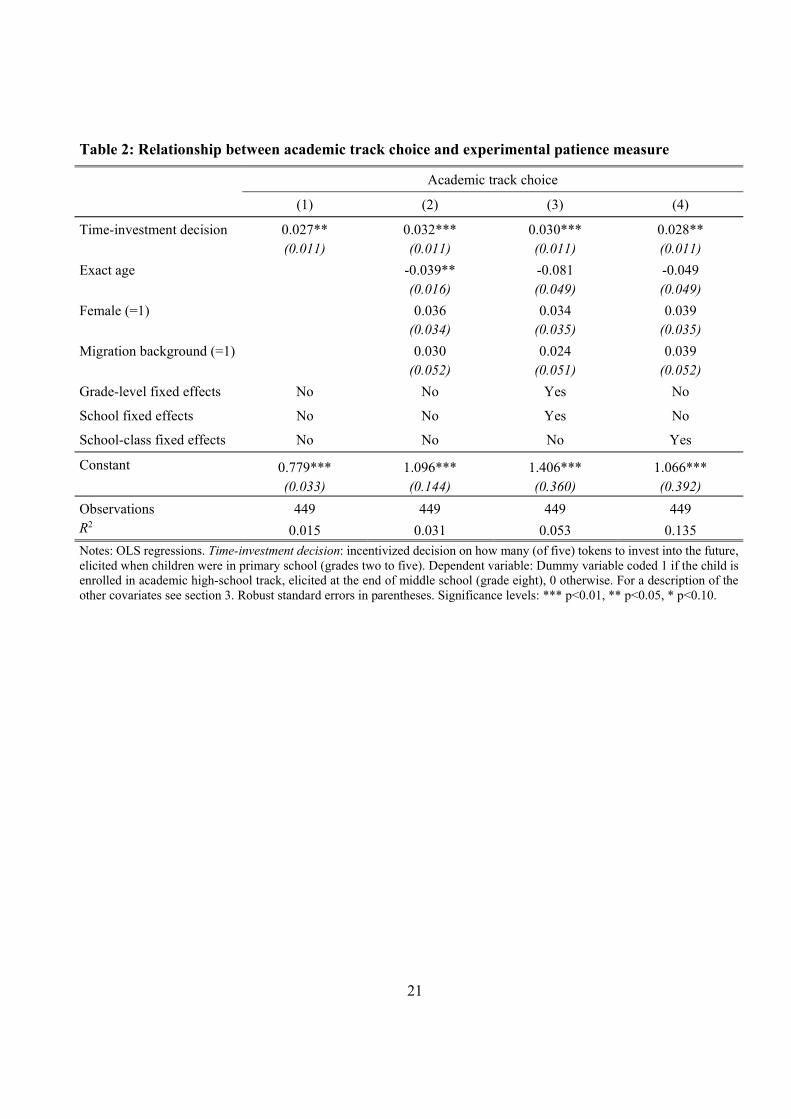
Table 2 presents our main result that children’s experimental measure of patience is robustly related
to later academic-track choice. Column 1 starts with a bivariate OLS regression of a dummy variable for
academic high-school track choice at the end of middle school on the number of tokens invested into the
future in the experimental task that children completed in primary school.11 The significant coefficient
estimate reveals that increasing the number of tokens saved for the future by one is associated with a 2.7
percentage points increase in the probability to attend an academic track. Controlling for age, gender,
and migration background of children in column 2 does not affect this result. One concern with the
results so far might be that they simply pick up between-school differences in academic-track choice and
the student populations’ patience, but that they might not be robust when only considering within-school
variations. In column 3, we therefore include school fixed effects as well as fixed effects for primary-
school grade levels and find this does not affect our coefficient estimate of interest. In column 4 we even
go a step further and include school-class fixed effects, and find that our results remain robust after
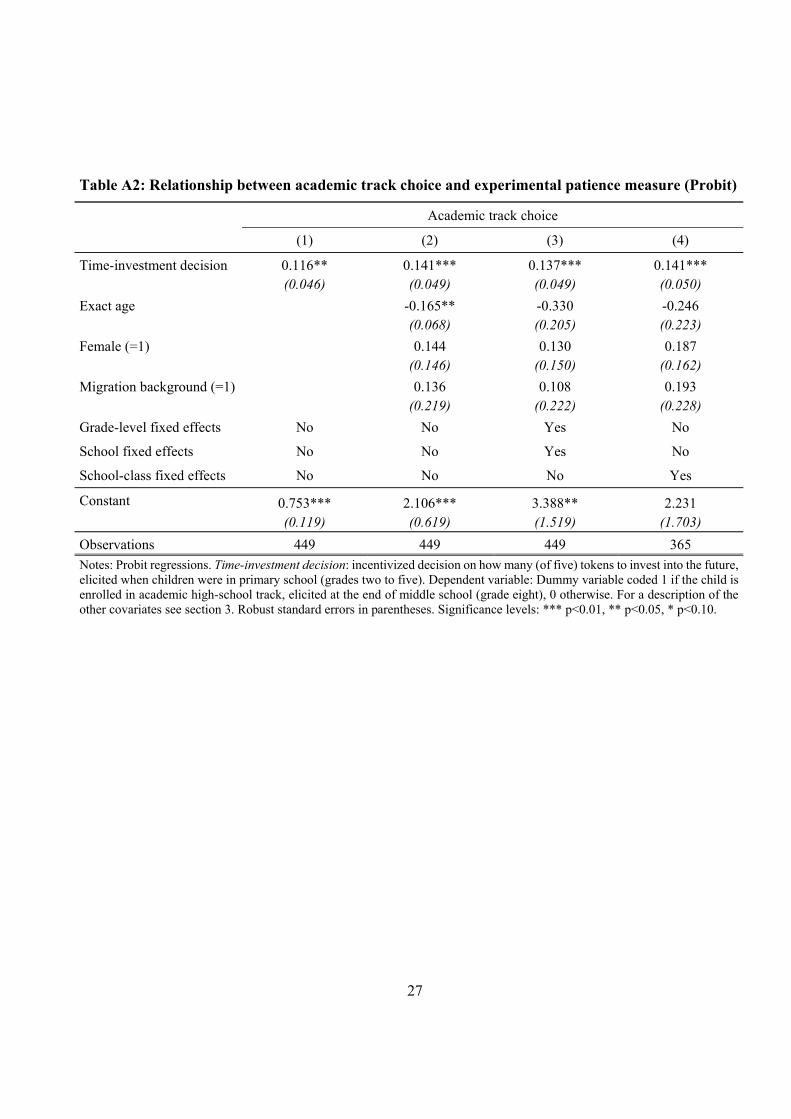
11 Throughout the paper, we employ OLS estimations with robust standard errors, but non-linear Probit models yield
qualitatively identical results (see Appendix Tables A2 and A3).
10
eliminating any (potentially confounding) between-class variation. In what follows, we use this
regression model that effectively only compares children within the same class as our starting point for
further robustness analyses.
Table 2: Relationship between academic track choice and experimental patience measure
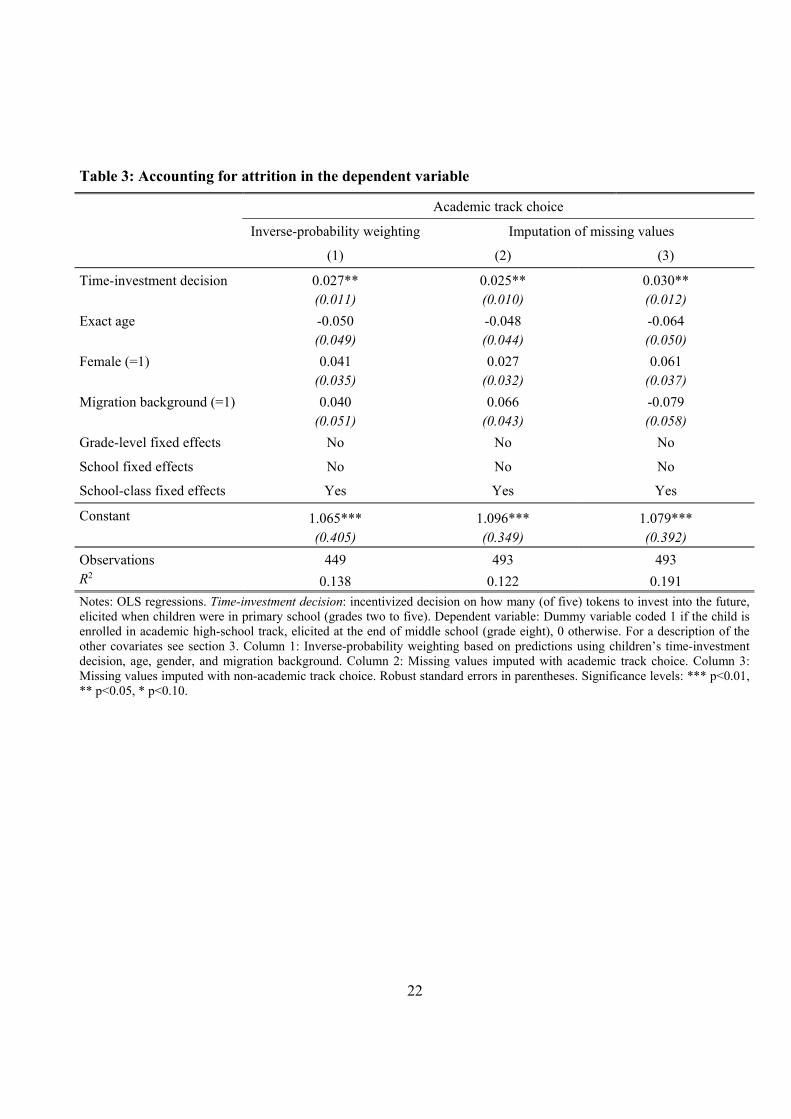
The regressions in Table 3 show that our results remain robust after accounting for sample attrition.
Given that the probability that we observe a child’s high-school track choice is positively related to a
child’s patience (see section 3.2), one obvious concern is that our estimated relationship between
patience and school-track choice is biased due to systematic sample attrition. We employ two types of
attrition analysis to investigate this issue. First, in column 1, we re-weight the observed data using the
inverse probabilities of observing children’s educational-track choice and find that our results do not
budge when employing inverse-probability weighting.12 Second, columns 2 and 3 present bounding
analyses where we assign children with missing information on school-track choice different
counterfactual values. In column 2 (column 3), we assume that all children with missing information
attend (do not attend) an academic track, and find that the estimated relationship of interest remains
significant and very similar in magnitude in both scenarios. In sum, our analysis shows that attrition
(which is comparably low in our data anyway) does not bias our main results.
Table 3: Accounting for attrition in the dependent variable
4.2 Robustness Analysis
In this section, we draw on the exceptional richness of our data to show that our results are robust
to controlling for important background characteristics. Since the purpose of this paper is inherently
descriptive, the goal of the subsequent analysis is not to claim that the coefficients reported above reflect
the causal effect of patience on school-track choice. Rather, we account for a set of factors that may
mediate the relationship between patience and school-track choice, which informs us about the extent to
which the association between patience and school-track choice is independent of these other factors.
12 The predicted probabilities stem from a Probit regression of a dummy variable coded 1 if a child’s school-track choice
is known (0 else) on the time-investment decision, age, gender, and migration background.
11
Table 4: Robustness analysis
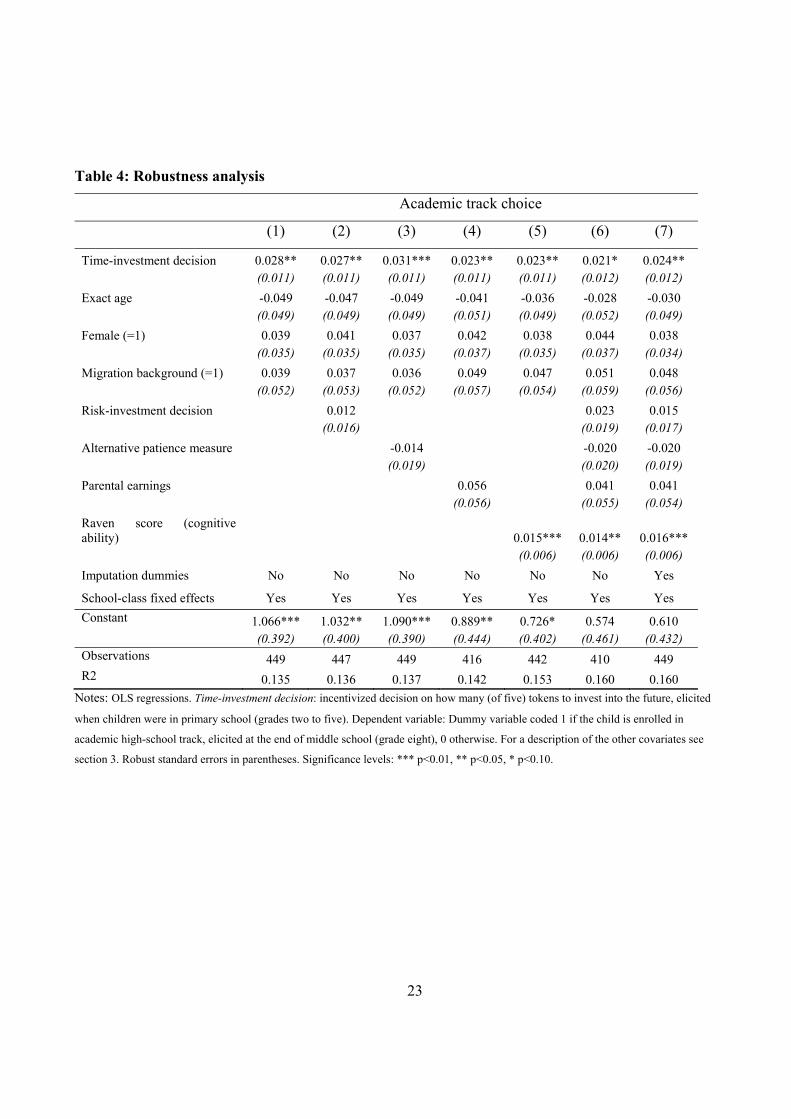
The first column of Table 4 depicts our preferred specification (from column 4 of Table 2) as a
benchmark, and additional control variables are added in the subsequent columns. In column 2, we add
our incentivized measure of children’s risk-taking as an additional control variable. Given the
intertemporal nature of educational-investment decisions and the fact that only the present is certain
whereas the future always contains an element of uncertainty, one might expect that risk preferences
may affect children’s educational choices. Furthermore, previous studies have shown that time and risk
preferences are intertwined (e.g., Andreoni and Sprenger, 2012b; Epper and Fehr-Duda, 2019), which
highlights the need to control for risk preferences to isolate the independent relationship between
patience and educational choices. Adding risk preferences as an additional control variable leaves our
coefficient of interest on children’s time-investment decision intact. Furthermore, the coefficient on the
risk-investment decision is small and statistically insignificant, reflecting the theoretically ambiguous
relationship between risk preferences and human-capital investment.13
Next, we add an alternative measure of children’s patience, namely the number of patient choices
from a time-preference choice list task, as an additional control variable in column 3,14 which leaves our
coefficient of interest statistically and economically significant. In contrast, the coefficient of the
alternative patience measure is small and insignificant, suggesting that the time-investment task is better
suited to depict the relationship between patience in children and their school-track choice.
In column 4, we show that our results are also robust to controlling for our measure of parental
earnings. Given the previously documented positive relationships between parental socioeconomic status
and children’s school-track choice, and between income and patience (e.g., Dohmen et al., 2010),
parental earnings may mediate the relationship between children’s patience and school-track choice.
While parental earnings are significantly correlated with children’s school-track choice (Spearman’s ρ
= 0.1417, p<0.01), adding them as an additional control variable to the regression leaves the coefficient
on the time-investment decision largely unchanged and significant.
13 A priori, the expected relationship between children’s risk preferences and educational choices is undetermined, since
an academic track choice entails a range of risky elements that may be negatively correlated (e.g., lower unemployment risk for occupations with higher human-capital requirements, versus higher earnings variance in these jobs). The undetermined direction of the relationship between risk preferences and human-capital investment is highlighted, for instance, in the review by Benzoni and Chyruk (2015).
14 Children had to take three binary decisions between receiving two experimental tokens today, and receiving 3, 4, respectively 5 experimental tokens in four weeks. We take the number of patient choices in these three tasks as our alternative measure of time preferences.
12
Turning to cognitive abilities, column 5 reveals that our results are also robust to accounting for
children’s performance on Raven’s test. From the outset, one might suspect that the positive correlation
between children’s patience and academic school-track choice is due to the fact that both patience and
the propensity to choose an academic school track are positively correlated with children’s cognitive
abilities. While adding cognitive ability as a control variable yields a highly significant and positive
coefficient, the relationship between children’s patience and academic track choice remains positive and
significant, suggesting that this relationship is independent of the influence of cognitive abilities on
school-track choice.
In sum, this analysis reveals that the relationship between children’s patience and academic-track
choice remains robust after controlling for various potential mediating factors. While including all these
control variables at the same time in column 6 slightly decreases the statistical significance of the
coefficient of interest (p = 0.09), it turns significant at the 5-% level again when we impute missing
covariates and include imputation-dummies in column 7. Thus, our results suggest an independent and
direct relationship between children’s patience and their later school-track choice.
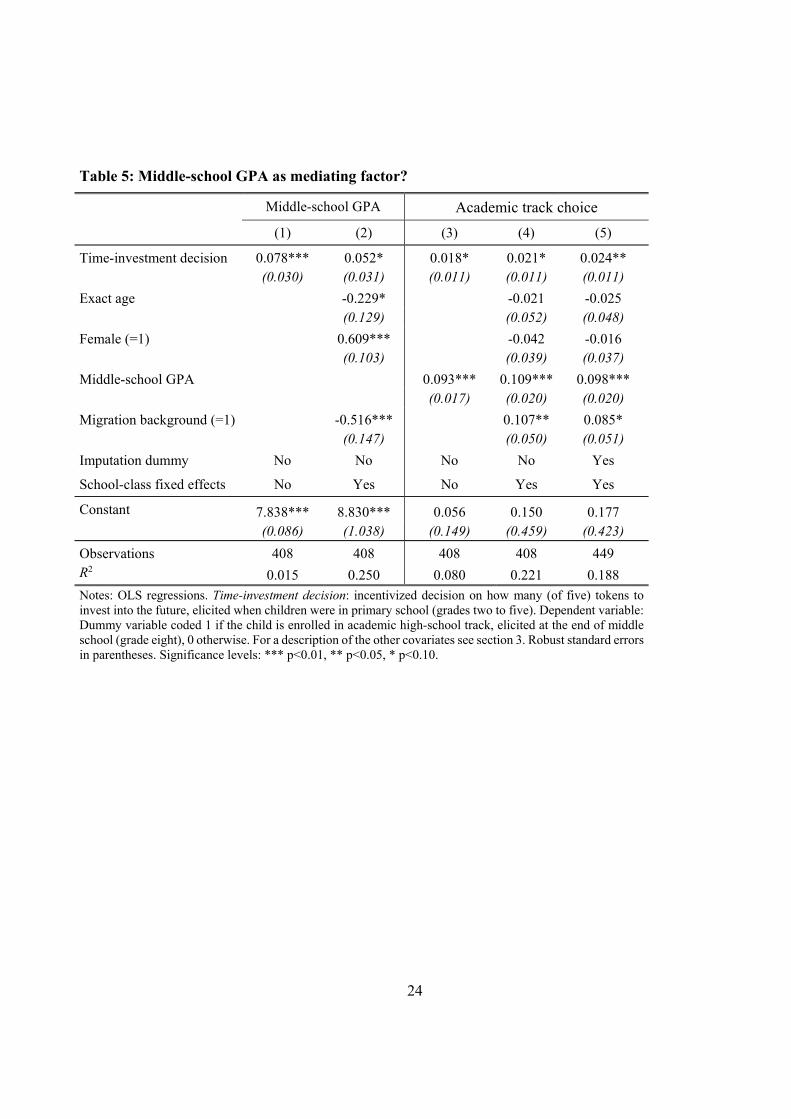
Table 5: Middle-school GPA as mediating factor?
Finally, we scrutinize the role that children’s middle-school GPA plays in mediating the relationship
between patience and academic-track choice. As we described in section 2, in the Italian school system,
children’s middle-school GPA does not determine access to an academic high school, because it is not
an admission criterium for these schools. Yet, the GPA may serve as an important signal indicating
whether a child is fit for the requirements of an academic high school. As we show in columns 1 and 2
of Table 5, patient children have in fact a higher GPA (probably reflecting more time and effort invested
in studying), which may indicate that the relationship between patience and school-track choice operates
through children’s GPA. However, adding the GPA as a control variable to our preferred specification
in columns 3 and 4 shows that the coefficient on the time-investment decision remains (marginally)
significant. The statistical significance of the coefficient of interest turns significant at the 5-% level
again when we impute the missing covariate (i.e., middle-school GPA) and include an imputation
dummy in column 5. Thus, while the large and highly significant coefficient on the GPA clearly shows
its importance for explaining school-track choices, these results again show that patience has
independent explanatory power.
13
5. Conclusion
Experimental measures of patience predict economically important field behavior among adults as
well as among children and adolescents (e.g., Khwaja et al., 2007; Chabris et al., 2008; Burks et al.,
2009; Meier and Sprenger, 2010; Castillo et al., 2011, 2018, 2020; Sutter et al., 2013). One particularly
important economic decision that young children face is the one of choosing an educational track, a key
feature of many school systems around the globe (see Betts, 2011, and OECD, 2020). We study the
direct link between experimental measures of children’s patience and educational track choices three to
six years later. We find a strong and significant positive association between patience and choosing an
academic high-school track (instead of a vocational school track), which is robust to accounting for
attrition and controlling for a rich set of background characteristics. Controlling for middle-school GPA
as a potential mediator, our results suggest a direct link between patience and academic-track choice.
From a policy perspective, our findings suggest that behavioral interventions that increase children’s
non-cognitive skills including forward-looking behavior (e.g., Heckman et al., 2010; Alan and Ertac,
2018) may affect children’s school-track choice positively, and may thus have positive long-term
consequences (e.g., on labor-market success or skill acquisition). The finding that children’s patience is
directly related to children’s academic-track choice – over and above its indirect influence through
increased school performance – furthermore suggests that even short-term interventions targeting the
specific point in time when school-track decisions are made (e.g., Resnjanskij et al., 2021) can have
lasting effects.15 Such interventions may particularly help children from more disadvantaged
backgrounds, who tend to be particularly impatient and tend to engage in more present-oriented
behaviors (e.g., Heckman et al., 2011; Andreoni et al., 2019), thereby promoting equality of educational
opportunity.
15 This is particularly true in education systems where children’s previous GPAs are no binding determinant of their
educational-choice set as in Italy or several German states.
14
References
Alan, S., Ertac, S. (2018). Fostering patience in the classroom: Results from randomized educational
intervention. Journal of Political Economy 126(5): 1865-1911.
Andreoni, J., Kuhn, M.A., List, J.A., Samek, A., Sokal, K., Sprenger, C. (2019). Toward an
understanding of the development of time preferences: Evidence from field experiments. Journal of
Public Economics 177: 104039.
Andreoni, J., Sprenger, C. (2012a). Estimating time preferences from convex budgets. American
Economic Review 102(7): 3333–56.
Andreoni, J., Sprenger, C. (2012b). Risk preferences are not time preferences. American Economic
Review 102(7): 3357-3376.
Angerer, S., Lergetporer, P., Glätzle-Rützler, D., Sutter, M. (2016). Cooperation and discrimination
within and across language borders: Evidence from children in a bilingual city. European Economic
Review 90: 254-264.
Argaw, B.A., Puhani, P.A. (2018). Does class size matter for school tracking outcomes after elementary
school? Quasi-experimental evidence using administrative panel data from Germany. Economics of
Education Review 65: 48-57.
Autonome Provinz Bozen-Südtirol (2017). Staatliche Abschlussprüfung der Unterstufe – Schuljahr
2017/2018. Retrieved March 20, 2020, from http://provinz.bz.it/bildung-sprache/deutschsprachige-
schule/mitteilungen.asp?publ_page=2
Autonome Provinz Bozen-Südtirol (2020a). Oberschule. Retrieved March 20, 2020, from
http://www.provinz.bz.it/bildung-sprache/deutschsprachige-schule/schueler-eltern/oberschule.asp.
Autonome Provinz Bozen-Südtirol (2020b). Bildung in Zahlen 2018-2019. Bozen, Landesinstitut für
Statistik.
Autonome Provinz Bozen-Südtirol (2020c). Nettomonatslöhne der unselbständig Erwerbstätigen 2019.
Bozen, Landesinstitut für Statistik.
Bach, M., Fischer, M. (2020). Understanding the Response to High-Stakes Incentives in Primary
Education. ZEW - Centre for European Economic Research Discussion Paper No. 20-066, Available
at SSRN: https://ssrn.com/abstract=3736769 or http://dx.doi.org/10.2139/ssrn.3736769
Backes-Gellner, U., Herz, H., Kosfeld, M., Oswald, Y. (2021). Do preferences and biases predict life
outcomes? Evidence from education and labor market entry decisions. European Economic Review
134: 103709.
15
Becker, G. (1964). Human Capital, A Theoretical and Empirical Analysis with Special Reference to
Education. New York: Columbia University Press.
Benzoni, L., Chyruk, O. (2015). The value and risk of human capital. Annual Review of Financial
Economics 7(1): 179-200.
Bettinger, E., Slonim, R. (2007). Patience among children. Journal of Public Economics 91(1-2), 343–
63.
Betts, J.R. (2011). The economics of tracking in education. In Handbook of the Economics of Education,
Vol. 3, eds. E.A. Hanushek, S. Machin, L. Woessmann: 341-381. Amsterdam: North-Holland.
Burks, S.V., Carpenter, J.P., Goette, L., Rustichini, A. (2009). Cognitive skills affect economic
preferences, strategic behavior, and job attachment. Proceedings of the National Academy of
Sciences 106(19):7745-7750.
Cadena, B.C., Keys, B.J. (2015). Human capital and the lifetime costs of impatience. American
Economic Journal: Economic Policy 7(3): 126-153.
Castillo, M., Ferraro, P., Jordan, J., Petrie, R. (2011). The today and tomorrow of kids: Time preferences
and educational outcomes of children. Journal of Public Economics 95: 1377-1385.
Castillo, M., Jordan, J.L., Petrie, R. (2018). Discount rates of children and high school graduation.
Economic Journal 129(619): 1153-1181.
Castillo, M., List, J.A., Petrie, R., Samek, A. (2020). Detecting drivers of behavior at an early age:
Evidence from a longitudinal field experiment. NBER Working Paper 28288.
Chabris, C., Laibson, D., Morris, C., Schuldt, J., Taubinsky, D. (2008). Individual laboratory-measured
discount rates predict field behavior. Journal of Risk and Uncertainty 37: 237-269.
Charness, G., Gneezy, U. (2010). Portfolio choice and risk attitudes: an experiment. Economic Enquiry
48: 133-146.
Dohmen, T., Falk, A., Huffman, D., Sunde, U. (2010). Are risk aversion and impatience related to
cognitive ability? American Economic Review 100(3): 1238-1260.
Dustmann, C. (2004). Parental background, secondary school track choice, and wages. Oxford Economic
Papers 56(2): 209–230.
Dustmann, C., Puhani, P.A., Schönberg, U. (2017). The long-term effects of early track choice.
Economic Journal 127(603): 1348-1380
Epper, T., Fehr-Duda, H. (2019). Risk in time: The intertwined nature of risk taking in time discounting.
Working Paper at the University of St. Gallen.
16
Falk, A., Becker, A., Dohmen, T., Enke, B., Huffman, D., & Sunde, U. (2018). Global evidence on
economic preferences. Quarterly Journal of Economics 133(4): 1645-1692.
Falk, A., Kosse, F., Pinger, P. (2020). Mentoring and schooling decisions: Causal evidence. IZA
Discussion Paper 13387.
Figlio, D., Giuliano, P., Özek, U., Sapienza, P. (2019). Long-term orientation and educational
performance. American Economic Journal: Economic Policy 11(4): 272-309.
Gneezy, U., Potters, J. (1997). An experiment on risk taking and evaluation periods. Quarterly Journal
of Economics 112(2): 631–645.
Golsteyn, B.H.H., Grönqvist, H., Lindahl, L. (2014). Adolescent time preferences predict lifetime
outcomes. Economic Journal 124(580): 739-761.
Hanushek, E.A., Kinne, L., Lergetporer, P., Woessmann, L. (2020). Culture and Student achievement:
The intertwined roles of patience and risk-taking. NBER Working Paper 27484.
Hanushek, E.A., Schwerdt, G., Woessmann, L., Zhang, L. (2017). General education, vocational
education, and labor-market outcomes over the life-cycle. Journal of Human Resources 52(1): 48-
87.
Hanushek, E.A., Woessmann, L. (2006). Does early tracking affect educational inequality and
performance? Differences-in-differences evidence across countries. Economic Journal 116(510):
C63-C76.
Heckman, J., Lochner, L.J., Todd, P.E. (2006). Earnings functions, rates of return and treatment effects:
The Mincer equation and beyond. In Handbook of the Economics of Education, eds. E.A. Hanushek,
F. Welch: 307–458. Amsterdam: North-Holland.
Heckman, J., Humphries, J.E., Mader, N.S. (2011). The GED. In Handbook of the Economics of
Education, Vol. 3, eds. E.A. Hanushek, S. Machin, L. Woessmann: 423-484. Amsterdam: North-
Holland.
Heckman, J., Moon, S.H., Pinto, R., Savelyev, P.A., Yavitz, A. (2010). The rate of return to the high
scope Perry Preschool Program. Journal of Public Economics 94(1–2): 114–128.
Hofstede, G., Hofstede, G.J., Minkov, M. (2010). Cultures and Organizations: Software of the Mind:
Intercultural Cooperation and its Importance for Survival, 3rd ed., McGraw-Hill, New York.
Khwaja, A., Silverman, D., Sloan, F. (2007). Time preference, time discounting, and smoking decisions.
Journal of Health Economics 26(5): 927-949.
17
Kosse, F., Pfeiffer, F. (2012) Impatience among preschool children and their mothers. Economics Letters
115(3): 493-495.
Lergetporer, P., Werner, K., Woessmann, L. (2021). Does ignorance of economic returns and costs
explain the educational aspiration gap? Representative evidence from adults and adolescents.
Economica, forthcoming.
Meier, S., Sprenger, C. (2010). Present-biased preferences and credit card borrowing. American
Economic Journal: Applied Economics 2: 193–210.
Mincer, J. (1958). Investment in human capital and personal income distribution. Journal of Political
Economy 66(4): 281-302.
Mischel, W., Ebbesen, E.B., Raskoff Zeiss, A. (1972). Cognitive and attentional mechanisms in delay
of gratification. Journal of Personality and Social Psychology 21(2): 204-218.
Mischel, W., Shoda, Y., Rodriguez, M.I. (1989). Delay of gratification in children. Science 244(4907):
933-938.
Mühlenweg, A., Puhani, P.A. (2010). The evolution of the school entry age effect in a school tracking
system. Journal of Human Resources 45(2): 407-438.
OECD (2020), PISA 2018 Results (Volume V): Effective policies, successful schools, PISA, OECD
Publishing, Paris.
Pekkala Kerr, S., Pekkarinen, T., Uusitalo, R. (2013). School tracking and development of cognitive
skills. Journal of Labor Economics 31(3): 577–602.
Pekkarinen, T., Uusitalo, R., Kerr, S. (2009). School tracking and intergenerational income mobility:
Evidence from the Finnish comprehensive school reform. Journal of Public Economics 93(7-8): 965-
973.
Piopiunik, M. (2014). The effects of early tracking on student performance: Evidence from a school
reform in Bavaria. Economics of Education Review 42: 12-33.
Puhani, P.A. (2018). Do boys benefit from male teachers in elementary school? Evidence from
administrative panel data. Labour Economics 51, 340-354.
Raven, J., Raven, J., Court, J.H. (2004). Manual for Raven’s Progressive Matrices and Vocabulary
Scales. San Antonio, TX: Harcourt Assessment.
Resnjanskij, S., Ruhose, J., Wiederhold, S., Woessmann, L. (2021). Can mentoring alleviate family
disadvantage in adolescence? A field experiment to improve labor-market prospects. CESifo
Working Paper 8870.
18
Shoda, Y., Mischel, W., and Peake, P. K. (1990). Predicting adolescent cognitive
and self-regulatory competencies from preschool delay of gratification: Identifying
diagnostic conditions. Developmental Psychology 26(6):978.
Sutter, M., Kocher, M., Glätzle-Rützler, D., Trautmann, S. (2013). Impatience and uncertainty:
Experimental decisions predict adolescents’ field behavior. American Economic Review 103: 510-
531.
Sutter, M., C. Zoller and D. Glätzle-Rützler (2019). Economic behavior of children and adolescents – a
first survey of experimental economics results. European Economic Review 111: 98-121.
Wölfel, O., Heineck, G. (2012). Parental risk attitudes and children’s secondary school track choice.
Economics of Education Review 31(5): 727-743.

19
Main Tables
20
Table 1: Descriptive statistics
Whole sample Known track choice
Unknown track choice
Mean SD N Mean N Mean N p-value (two-sided)
(1) (2) (3) (4) (5) (6) (7) (8)
Experimental patience measure Tokens invested in future 2.245 1.657 493 2.305 449 1.636 44 0.011 Covariates Exact age 8.917 1.145 493 8.938 449 8.698 44 0.185 Female (=1) 0.448 0.498 493 0.457 449 0.364 44 0.237 Migration background (=1) 0.152 0.360 493 0.127 449 0.409 44 0.000 Experimental risk measure 2.360 1.176 491 2.351 447 2.455 44 0.579 Alternative patience measure 1.412 0.979 493 1.399 449 1.545 44 0.343 Parental earnings 1769.532 382.853 453 1774.575 416 1712.838 37 0.348 Raven score (cognitive ability) 21.109 4.294 485 21.348 442 18.651 43 0.000 Education data Grade Point Average (GPA) 8.012 1.024 412 8.015 408 7.75 4 0.608 Vocational track 0.158 0.365 449 Academic technical school (Fachoberschule)
0.548 0.498 449
Academic high school 0.294 0.456 449 Notes: Parental earnings are computed as the mean earnings of the mother and the father of the child. In case earnings for one parent are missing, parental earnings represent the earnings of the parent whose earnings are known. Columns 1 to 3: means, standard deviations (SD), and number of observations for the whole sample of primary-school children in grades two through five in the school year 2012/2013. Columns 4 and 5: Analytical sample for a subset of children with known educational-track choice. Columns 6 and 7: Subset of children with missing information about educational-track choice. Column 8: p-values of two-sided tests (t-tests or χ2 tests) between children with known and unknown educational-track choice. For a description of the variables see section 3.
21
Table 2: Relationship between academic track choice and experimental patience measure
Academic track choice
(1) (2) (3) (4)
Time-investment decision 0.027** 0.032*** 0.030*** 0.028** (0.011) (0.011) (0.011) (0.011)
Exact age -0.039** -0.081 -0.049 (0.016) (0.049) (0.049)
Female (=1) 0.036 0.034 0.039 (0.034) (0.035) (0.035)
Migration background (=1) 0.030 0.024 0.039 (0.052) (0.051) (0.052)
Grade-level fixed effects No No Yes No
School fixed effects No No Yes No
School-class fixed effects No No No Yes
Constant 0.779*** 1.096*** 1.406*** 1.066*** (0.033) (0.144) (0.360) (0.392)
Observations 449 449 449 449 R2 0.015 0.031 0.053 0.135
Notes: OLS regressions. Time-investment decision: incentivized decision on how many (of five) tokens to invest into the future, elicited when children were in primary school (grades two to five). Dependent variable: Dummy variable coded 1 if the child is enrolled in academic high-school track, elicited at the end of middle school (grade eight), 0 otherwise. For a description of the other covariates see section 3. Robust standard errors in parentheses. Significance levels: *** p<0.01, ** p<0.05, * p<0.10.
22
Table 3: Accounting for attrition in the dependent variable
Academic track choice
Inverse-probability weighting Imputation of missing values
(1) (2) (3)
Time-investment decision 0.027** 0.025** 0.030** (0.011) (0.010) (0.012)
Exact age -0.050 -0.048 -0.064 (0.049) (0.044) (0.050)
Female (=1) 0.041 0.027 0.061 (0.035) (0.032) (0.037)
Migration background (=1) 0.040 0.066 -0.079 (0.051) (0.043) (0.058)
Grade-level fixed effects No No No
School fixed effects No No No
School-class fixed effects Yes Yes Yes
Constant 1.065*** 1.096*** 1.079*** (0.405) (0.349) (0.392)
Observations 449 493 493 R2 0.138 0.122 0.191
Notes: OLS regressions. Time-investment decision: incentivized decision on how many (of five) tokens to invest into the future, elicited when children were in primary school (grades two to five). Dependent variable: Dummy variable coded 1 if the child is enrolled in academic high-school track, elicited at the end of middle school (grade eight), 0 otherwise. For a description of the other covariates see section 3. Column 1: Inverse-probability weighting based on predictions using children’s time-investment decision, age, gender, and migration background. Column 2: Missing values imputed with academic track choice. Column 3: Missing values imputed with non-academic track choice. Robust standard errors in parentheses. Significance levels: *** p<0.01, ** p<0.05, * p<0.10.
23
Table 4: Robustness analysis
Academic track choice
(1) (2) (3) (4) (5) (6) (7)
Time-investment decision 0.028** 0.027** 0.031*** 0.023** 0.023** 0.021* 0.024** (0.011) (0.011) (0.011) (0.011) (0.011) (0.012) (0.012)
Exact age -0.049 -0.047 -0.049 -0.041 -0.036 -0.028 -0.030 (0.049) (0.049) (0.049) (0.051) (0.049) (0.052) (0.049)
Female (=1) 0.039 0.041 0.037 0.042 0.038 0.044 0.038 (0.035) (0.035) (0.035) (0.037) (0.035) (0.037) (0.034)
Migration background (=1) 0.039 0.037 0.036 0.049 0.047 0.051 0.048 (0.052) (0.053) (0.052) (0.057) (0.054) (0.059) (0.056)
Risk-investment decision 0.012 0.023 0.015 (0.016) (0.019) (0.017)
Alternative patience measure -0.014 -0.020 -0.020 (0.019) (0.020) (0.019)
Parental earnings 0.056 0.041 0.041 (0.056) (0.055) (0.054)
Raven score (cognitive ability) 0.015*** 0.014** 0.016*** (0.006) (0.006) (0.006)
Imputation dummies No No No No No No Yes
School-class fixed effects Yes Yes Yes Yes Yes Yes Yes
Constant 1.066*** 1.032** 1.090*** 0.889** 0.726* 0.574 0.610 (0.392) (0.400) (0.390) (0.444) (0.402) (0.461) (0.432) Observations 449 447 449 416 442 410 449 R2 0.135 0.136 0.137 0.142 0.153 0.160 0.160
Notes: OLS regressions. Time-investment decision: incentivized decision on how many (of five) tokens to invest into the future, elicited
when children were in primary school (grades two to five). Dependent variable: Dummy variable coded 1 if the child is enrolled in
academic high-school track, elicited at the end of middle school (grade eight), 0 otherwise. For a description of the other covariates see
section 3. Robust standard errors in parentheses. Significance levels: *** p<0.01, ** p<0.05, * p<0.10.
24
Table 5: Middle-school GPA as mediating factor?
Middle-school GPA Academic track choice
(1) (2) (3) (4) (5)
Time-investment decision 0.078*** 0.052* 0.018* 0.021* 0.024** (0.030) (0.031) (0.011) (0.011) (0.011)
Exact age -0.229* -0.021 -0.025 (0.129) (0.052) (0.048)
Female (=1) 0.609*** -0.042 -0.016 (0.103) (0.039) (0.037)
Middle-school GPA 0.093*** 0.109*** 0.098*** (0.017) (0.020) (0.020)
Migration background (=1) -0.516*** 0.107** 0.085* (0.147) (0.050) (0.051)
Imputation dummy No No No No Yes
School-class fixed effects No Yes No Yes Yes
Constant 7.838*** 8.830*** 0.056 0.150 0.177 (0.086) (1.038) (0.149) (0.459) (0.423)
Observations 408 408 408 408 449 R2 0.015 0.250 0.080 0.221 0.188
Notes: OLS regressions. Time-investment decision: incentivized decision on how many (of five) tokens to invest into the future, elicited when children were in primary school (grades two to five). Dependent variable: Dummy variable coded 1 if the child is enrolled in academic high-school track, elicited at the end of middle school (grade eight), 0 otherwise. For a description of the other covariates see section 3. Robust standard errors in parentheses. Significance levels: *** p<0.01, ** p<0.05, * p<0.10.
25
Online Appendix – not intended for publication Appendix A: Additional Figures and Tables
Figure A1: Depiction of the school system of South Tyrol (Italy)
26
Table A1: Number of subjects included in the analysis, by age and gender
Grade level (age group) Female Male Total
2 (7/8 years) 44 62 106
3 (8/9 years) 54 74 128
4 (9/10 years) 70 71 141
5 (10/11 years) 53 65 118 All 221 272 493
27
Table A2: Relationship between academic track choice and experimental patience measure (Probit)
Academic track choice
(1) (2) (3) (4)
Time-investment decision 0.116** 0.141*** 0.137*** 0.141*** (0.046) (0.049) (0.049) (0.050)
Exact age -0.165** -0.330 -0.246 (0.068) (0.205) (0.223)
Female (=1) 0.144 0.130 0.187 (0.146) (0.150) (0.162)
Migration background (=1) 0.136 0.108 0.193 (0.219) (0.222) (0.228)
Grade-level fixed effects No No Yes No
School fixed effects No No Yes No
School-class fixed effects No No No Yes
Constant 0.753*** 2.106*** 3.388** 2.231 (0.119) (0.619) (1.519) (1.703)
Observations 449 449 449 365
Notes: Probit regressions. Time-investment decision: incentivized decision on how many (of five) tokens to invest into the future, elicited when children were in primary school (grades two to five). Dependent variable: Dummy variable coded 1 if the child is enrolled in academic high-school track, elicited at the end of middle school (grade eight), 0 otherwise. For a description of the other covariates see section 3. Robust standard errors in parentheses. Significance levels: *** p<0.01, ** p<0.05, * p<0.10.
28
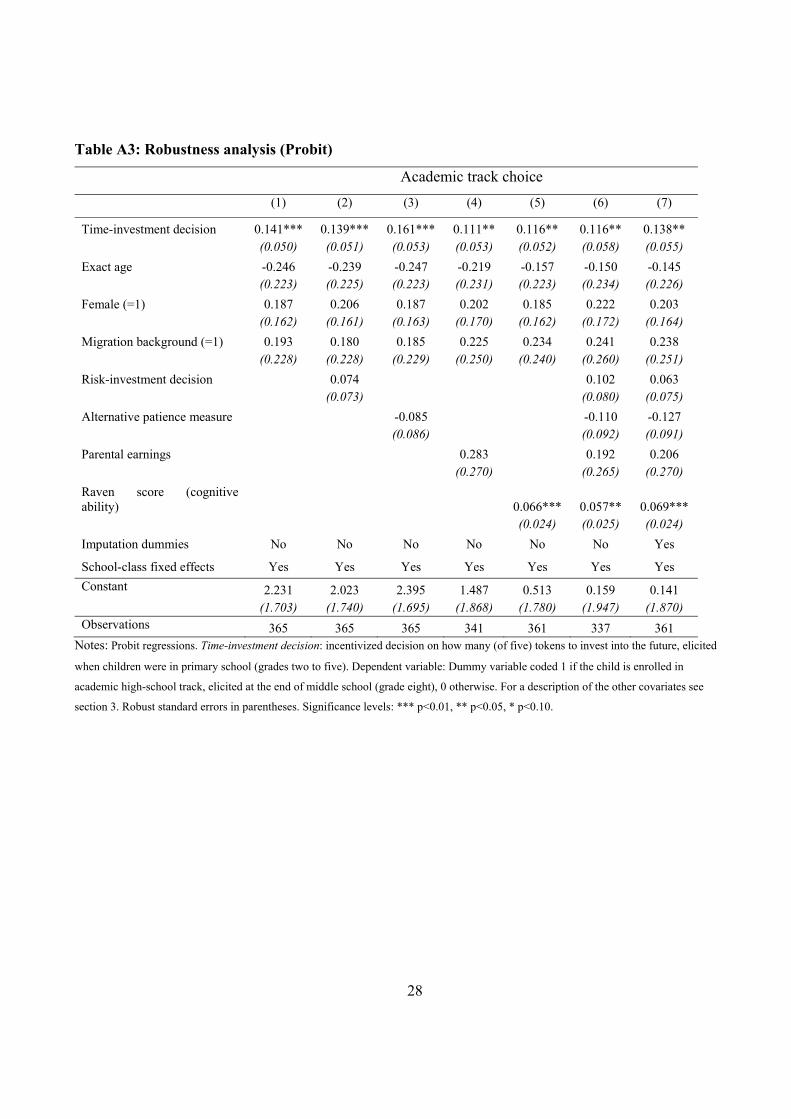
Table A3: Robustness analysis (Probit)
Academic track choice
(1) (2) (3) (4) (5) (6) (7)
Time-investment decision 0.141*** 0.139*** 0.161*** 0.111** 0.116** 0.116** 0.138** (0.050) (0.051) (0.053) (0.053) (0.052) (0.058) (0.055)
Exact age -0.246 -0.239 -0.247 -0.219 -0.157 -0.150 -0.145 (0.223) (0.225) (0.223) (0.231) (0.223) (0.234) (0.226)
Female (=1) 0.187 0.206 0.187 0.202 0.185 0.222 0.203 (0.162) (0.161) (0.163) (0.170) (0.162) (0.172) (0.164)
Migration background (=1) 0.193 0.180 0.185 0.225 0.234 0.241 0.238 (0.228) (0.228) (0.229) (0.250) (0.240) (0.260) (0.251)
Risk-investment decision 0.074 0.102 0.063 (0.073) (0.080) (0.075)
Alternative patience measure -0.085 -0.110 -0.127 (0.086) (0.092) (0.091)
Parental earnings 0.283 0.192 0.206 (0.270) (0.265) (0.270)
Raven score (cognitive ability) 0.066*** 0.057** 0.069*** (0.024) (0.025) (0.024)
Imputation dummies No No No No No No Yes
School-class fixed effects Yes Yes Yes Yes Yes Yes Yes
Constant 2.231 2.023 2.395 1.487 0.513 0.159 0.141 (1.703) (1.740) (1.695) (1.868) (1.780) (1.947) (1.870) Observations 365 365 365 341 361 337 361
Notes: Probit regressions. Time-investment decision: incentivized decision on how many (of five) tokens to invest into the future, elicited
when children were in primary school (grades two to five). Dependent variable: Dummy variable coded 1 if the child is enrolled in
academic high-school track, elicited at the end of middle school (grade eight), 0 otherwise. For a description of the other covariates see
section 3. Robust standard errors in parentheses. Significance levels: *** p<0.01, ** p<0.05, * p<0.10.
29
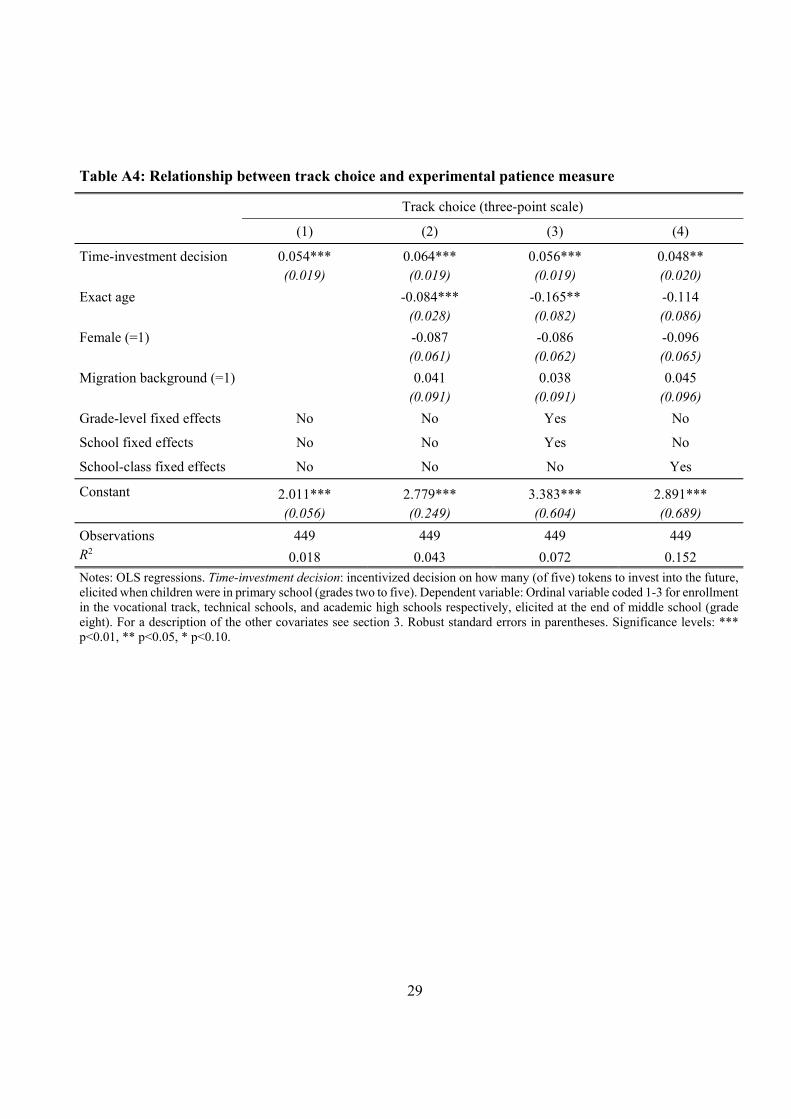
Table A4: Relationship between track choice and experimental patience measure
Track choice (three-point scale)
(1) (2) (3) (4)
Time-investment decision 0.054*** 0.064*** 0.056*** 0.048** (0.019) (0.019) (0.019) (0.020)
Exact age -0.084*** -0.165** -0.114 (0.028) (0.082) (0.086)
Female (=1) -0.087 -0.086 -0.096 (0.061) (0.062) (0.065)
Migration background (=1) 0.041 0.038 0.045 (0.091) (0.091) (0.096)
Grade-level fixed effects No No Yes No
School fixed effects No No Yes No
School-class fixed effects No No No Yes
Constant 2.011*** 2.779*** 3.383*** 2.891*** (0.056) (0.249) (0.604) (0.689)
Observations 449 449 449 449 R2 0.018 0.043 0.072 0.152
Notes: OLS regressions. Time-investment decision: incentivized decision on how many (of five) tokens to invest into the future, elicited when children were in primary school (grades two to five). Dependent variable: Ordinal variable coded 1-3 for enrollment in the vocational track, technical schools, and academic high schools respectively, elicited at the end of middle school (grade eight). For a description of the other covariates see section 3. Robust standard errors in parentheses. Significance levels: *** p<0.01, ** p<0.05, * p<0.10.
30
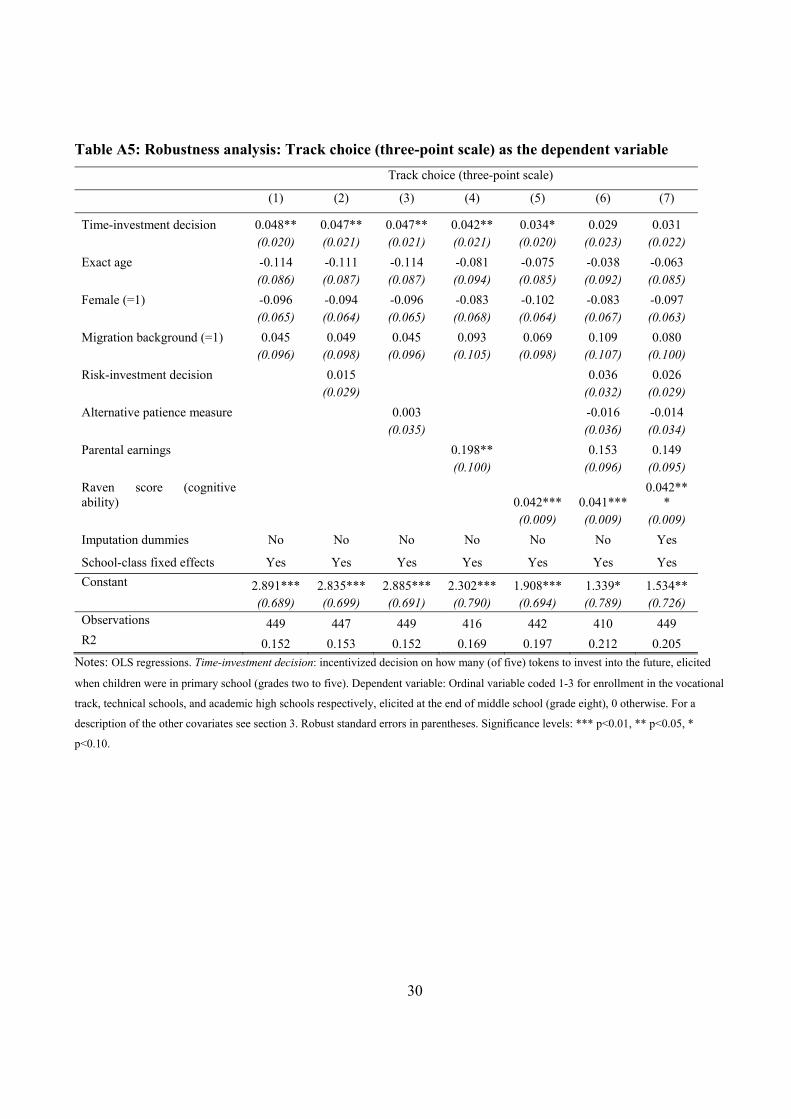
Table A5: Robustness analysis: Track choice (three-point scale) as the dependent variable
Track choice (three-point scale)
(1) (2) (3) (4) (5) (6) (7)
Time-investment decision 0.048** 0.047** 0.047** 0.042** 0.034* 0.029 0.031 (0.020) (0.021) (0.021) (0.021) (0.020) (0.023) (0.022)
Exact age -0.114 -0.111 -0.114 -0.081 -0.075 -0.038 -0.063 (0.086) (0.087) (0.087) (0.094) (0.085) (0.092) (0.085)
Female (=1) -0.096 -0.094 -0.096 -0.083 -0.102 -0.083 -0.097 (0.065) (0.064) (0.065) (0.068) (0.064) (0.067) (0.063)
Migration background (=1) 0.045 0.049 0.045 0.093 0.069 0.109 0.080 (0.096) (0.098) (0.096) (0.105) (0.098) (0.107) (0.100)
Risk-investment decision 0.015 0.036 0.026 (0.029) (0.032) (0.029)
Alternative patience measure 0.003 -0.016 -0.014 (0.035) (0.036) (0.034)
Parental earnings 0.198** 0.153 0.149 (0.100) (0.096) (0.095)
Raven score (cognitive ability) 0.042*** 0.041***
0.042***
(0.009) (0.009) (0.009)
Imputation dummies No No No No No No Yes
School-class fixed effects Yes Yes Yes Yes Yes Yes Yes
Constant 2.891*** 2.835*** 2.885*** 2.302*** 1.908*** 1.339* 1.534** (0.689) (0.699) (0.691) (0.790) (0.694) (0.789) (0.726) Observations 449 447 449 416 442 410 449 R2 0.152 0.153 0.152 0.169 0.197 0.212 0.205
Notes: OLS regressions. Time-investment decision: incentivized decision on how many (of five) tokens to invest into the future, elicited
when children were in primary school (grades two to five). Dependent variable: Ordinal variable coded 1-3 for enrollment in the vocational
track, technical schools, and academic high schools respectively, elicited at the end of middle school (grade eight), 0 otherwise. For a
description of the other covariates see section 3. Robust standard errors in parentheses. Significance levels: *** p<0.01, ** p<0.05, *
p<0.10.

31
Appendix B: Supplementary Material
Experimental instructions (translated from German)
Note: Italic font is used for the instructions to the experimenter.
Time-investment task
Good morning. My name is … Today’s game works as follows:
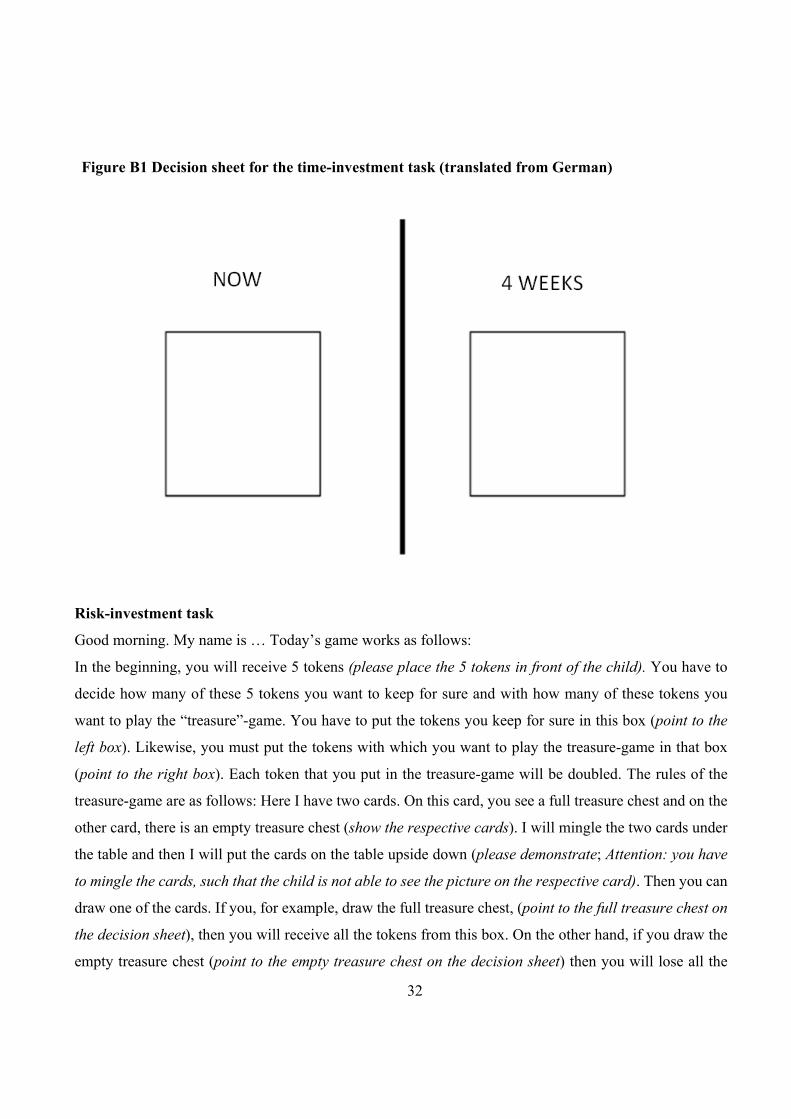
In the beginning, you will receive 5 tokens (please place the 5 tokens in front of the child). You have to
decide how many of these 5 tokens you want to put in the box labeled NOW (point to the left box) and
how many tokens you want to put in the box labeled “4 WEEKS” (point to the right box). You will receive
the tokens that you put in the box “NOW” immediately after the game and you can use these tokens for
buying presents in our present shop. You can take these presents home today. Each token that you put in
the box “4 WEEKS” will be doubled and you will receive the presents that you choose with these tokens
in 4 weeks only.
Let’s consider an example: If you, for instance, want to receive two tokens today, what do you have to do?
(Answer of the child: “I have to put 2 tokens in the left box) And what happens with the other 3 tokens?
(Answer: I have to put these tokens in the right box”; please let the child demonstrate this) How many
tokens will be added to this box? (point to the right box; the answer of the child: “3”; please demonstrate!)
How many tokens are in the box in total? (Answer: 6). When will you receive the presents which you can
choose with these 6 tokens? (Answer: in 4 weeks). And what happens if you put 5 tokens in that box?
(point to the left box; Answer: then I will receive 5 tokens immediately after the game and I can choose
presents with these 5 tokens which I can take home today). And what happens if you put all 5 tokens in
that box? (point to the right box; Answer: then these tokens will be doubled and I can choose presents with
the 10 tokens which I will receive only in 4 weeks.) Could you please repeat the rules of the game?
Please take your decision now. You have to put the tokens which you want to receive today in this box
(point to the left box) and the tokens with which you can buy presents which you will receive in 4 weeks
in that box (point to the right box). Take as much time as you need for your decision. In the meantime, I
will turn around so I don’t disturb you. Just call me when you are done.
32
Figure B1 Decision sheet for the time-investment task (translated from German)
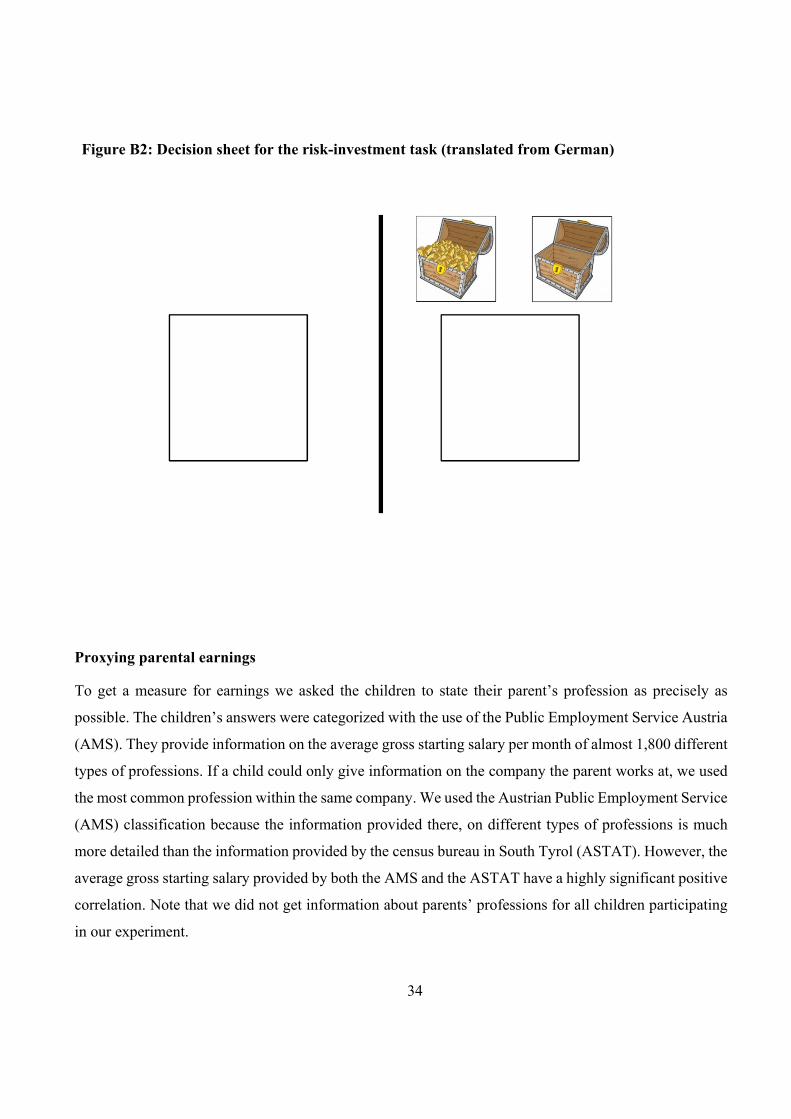
Risk-investment task
Good morning. My name is … Today’s game works as follows:
In the beginning, you will receive 5 tokens (please place the 5 tokens in front of the child). You have to
decide how many of these 5 tokens you want to keep for sure and with how many of these tokens you
want to play the “treasure”-game. You have to put the tokens you keep for sure in this box (point to the
left box). Likewise, you must put the tokens with which you want to play the treasure-game in that box
(point to the right box). Each token that you put in the treasure-game will be doubled. The rules of the
treasure-game are as follows: Here I have two cards. On this card, you see a full treasure chest and on the
other card, there is an empty treasure chest (show the respective cards). I will mingle the two cards under
the table and then I will put the cards on the table upside down (please demonstrate; Attention: you have
to mingle the cards, such that the child is not able to see the picture on the respective card). Then you can
draw one of the cards. If you, for example, draw the full treasure chest, (point to the full treasure chest on
the decision sheet), then you will receive all the tokens from this box. On the other hand, if you draw the
empty treasure chest (point to the empty treasure chest on the decision sheet) then you will lose all the

33
tokens from this box. In the end, you will receive the tokens that you keep for sure (point to the left box)
and the tokens that you win in the treasure game (point to the right box).
Let’s consider an example: If you, for instance, want to keep one token for sure and play the treasure-
game with the other 4 tokens, what do you have to do? (Answer of the child: “I have to put 1 token in the
left box and 4 tokens in the right box”; please let the child demonstrate this) How many tokens will be
added to this box? (point to the right box; the answer of the child: “4”; please demonstrate!) What happens
next? How does the treasure-game work? (Child has to repeat the rules of the game). How many tokens
will you win if you draw the full treasure chest? (Answer of the child: “8 tokens”). And how many tokens
will you receive in total? (Answer of the child: “9”). Exactly. You will receive 8 tokens from the treasure-
game plus 1 additional token which you kept for sure. What happens if you draw the empty treasure chest?
(Answer of the child: “I lose all the tokens of the treasure-game”) Exactly. How many tokens will you
receive in total? (Answer of the child: “1”) Exactly. This was only an example. Let’s consider another
example: Could you please explain the rules of the game if you want to keep 4 tokens for sure and play
the treasure-game with 1 token? (The child has to recapitulate the game with the new example). What
happens if you, for instance, put all your 5 tokens in this box? (point to the right box; let the child
recapitulate the game) What happens if you, for instance, put all your 5 tokens in this box? (point to the
left box; let the child recapitulate the game). Could you please repeat the rules of the game?
Please take your decision now. You have to put the tokens which you want to keep for sure in this
box (point to the left box) and the tokens with which you want to play the treasure-game have to be put in
that box (point to the right box). Take as much time as you need for your decision. In the meantime, I will
turn around so I don’t disturb you. Just call me when you are done.
34
Figure B2: Decision sheet for the risk-investment task (translated from German)
Proxying parental earnings
To get a measure for earnings we asked the children to state their parent’s profession as precisely as
possible. The children’s answers were categorized with the use of the Public Employment Service Austria
(AMS). They provide information on the average gross starting salary per month of almost 1,800 different
types of professions. If a child could only give information on the company the parent works at, we used
the most common profession within the same company. We used the Austrian Public Employment Service
(AMS) classification because the information provided there, on different types of professions is much
more detailed than the information provided by the census bureau in South Tyrol (ASTAT). However, the
average gross starting salary provided by both the AMS and the ASTAT have a highly significant positive
correlation. Note that we did not get information about parents’ professions for all children participating
in our experiment.
University of Innsbruck - Working Papers in Economics and StatisticsRecent Papers can be accessed on the following webpage:
https://www.uibk.ac.at/eeecon/wopec/
2021-17 Silvia Angerer, Jana Bolvashenkova, Daniela Glätzle-Rützler, Philipp Lergetporer,Matthias Sutter: Children’s patience and school-track choices several years later:Linking experimental and field data
2021-16 Daniel Gründler, Eric Mayer, Johann Scharler: Monetary Policy Announcements,Information Schocks, and Exchange Rate Dynamics
2021-15 Sebastian Bachler, Felix Holzmeister, Michael Razen, Matthias Stefan: The Impactof Presentation Format and Choice Architecture on Portfolio Allocations: Experi-mental Evidence
2021-14 Jeppe Christoffersen, Felix Holzmeister, Thomas Plenborg:What is Risk to Mana-gers?
2021-13 Silvia Angerer, Daniela Glätzle-Rützler, Christian Waibel: Trust in health care cre-dence goods: Experimental evidence on framing andsubject pool effects
2021-12 Rene Schwaiger, Laura Hueber: Do MTurkers Exhibit Myopic Loss Aversion?
2021-11 Felix Holzmeister, ChristophHuber, Stefan Palan:ACritical Perspective on the Con-ceptualization of Risk in Behavioral and Experimental Finance
2021-10 Michael Razen, Alexander Kupfer: Can increased tax transparency curb corporatetax avoidance?
2021-09 Changxia Ke, FlorianMorath, Anthony Newell, Lionel Page: Too big to prevail: Theparadox of power in coalition formation
2021-08 Marco Haan, Pim Heijnen, Martin Obradovits: Competition with List Prices
2021-07 Martin Dufwenberg, Olof Johansson-Stenman, Michael Kirchler, Florian Lindner,Rene Schwaiger:Mean Markets or Kind Commerce?
2021-06 Christoph Huber, Jürgen Huber, andMichael Kirchler: Volatility Shocks and Invest-ment Behavior
2021-05 Max Breitenlechner, Georgios Georgiadis, Ben Schumann:What goes around co-mes around: How large are spillbacks from US monetary policy?
2021-04 Utz Weitzel, Michael Kirchler: The Banker’s Oath And Financial Advice
2021-03 Martin Holmen, Felix Holzmeister, Michael Kirchler, Matthias Stefan, ErikWengs-tröm: Economic Preferences and Personality Traits Among Finance Professionalsand the General Population
2021-02 Christian König-Kersting: On the Robustness of Social Norm Elicitation
2021-01 Laura Hueber, Rene Schwaiger: Debiasing Through Experience Sampling: The Caseof Myopic Loss Aversion.
2020-34 Kai A. Konrad, Florian Morath: The Volunteer’s Dilemma in Finite Populations
2020-33 KatharinaMomsen, Markus Ohndorf: Expressive Voting vs. Self-Serving Ignorance
2020-32 Silvia Angerer, Daniela Glätzle-Rützler, Christian Waibel: Monitoring institutionsin health care markets: Experimental evidence
2020-31 Jana Friedrichsen, Katharina Momsen, Stefano Piasenti: Ignorance, Intention andStochastic Outcomes
2020-30 Esther Blanco, Alexandra Baier, Felix Holzmeister, Tarek Jaber-Lopez, Natalie Stru-we: Substitution of social concerns under the Covid-19 pandemic
2020-29 Andreas Hackethal,Michael Kirchler, Christine Laudenbach,Michael Razen, Anni-kaWeber:On the (ir)relevance of monetary incentives in risk preference elicitationexperiments
2020-28 Andrej Gill,Matthias Heinz, Heiner Schumacher,Matthias Sutter: Trustworthinessin the Financial Industry
2020-27 Matthias Sutter,MichaelWeyland, AnnaUntertrifaller,Manuel Froitzheim: Finan-cial literacy, risk and time preferences - Results from a randomized educational in-tervention
2020-26 Rene Schwaiger, Jürgen Huber, Michael Kirchler, Daniel Kleinlercher, Utz Weitzel:Unequal Opportunities, Social Groups, and Redistribution
2020-25 Roman Inderst, Martin Obradovits: Competitive Strategies when Consumers areRelative Thinkers: Implications for Pricing, Promotions, and Product Choice
2020-24 Martin Obradovits, Philipp Plaickner: Price-Directed Search and Collusion
2020-23 Helena Fornwagner, Oliver P. Hauser: Climate action for (my) children
2020-22 Esther Blanco, Natalie Struwe, James M. Walker: Incentivizing public good provi-sion through outsider transfers: experimental evidence on sharing rules and addi-tionality requirements
2020-21 LoukasBalafoutas, Helena Fornwagner, Rudolf Kerschbamer,Matthias Sutter,Mary-na Tverdostup: Diagnostic Uncertainty and Insurance Coverage in Credence GoodsMarkets
2020-20 AnnaUlrichshofer,MarkusWalzl: Customer Disputes,Misconduct, and ReputationBuilding in the Market for Financial Advice
2020-19 Anna Ulrichshofer, MarkusWalzl: Social Comparison and Optimal Contracts in theCompetition for Managerial Talent
2020-18 Martin Obradovits, Philipp Plaickner: Searching for Treatment
2020-17 Jun Honda: The Gender-Punishment Gap revisited
2020-16 Jun Honda: The Relation between Rankings and Risk-Taking in the LaborMarket forFinancial Advice
2020-15 Christina Bannier, Eberhard Feess,Natalie Packham,MarkusWalzl:Differentiationand Risk-Aversion in Imperfectly Competitive Labor Markets
2020-14 Felix Holzmeister, Rudolf Kerschbamer: oTree: The Equality Equivalence Test
2020-13 Parampreet Christopher Bindra, Graeme Pearce: The effect of priming on fraud:Evidence from a natural field experiment
2020-12 Alessandro De Chiara,Marco A. Schwarz:ADynamic Theory of Regulatory Capture
2020-11 ChristophHuber, JürgenHuber,Michael Kirchler:Market shocks andprofessionals’investment behavior - Evidence from the COVID-19 crash
2020-10 Elisabeth Gsottbauer, Daniel Müller, Samuel Müller, Stefan T. Trautmann, GalinaZudenkova: Social class and (un)ethical behavior: Causal versus correlational evi-dence
2020-09 Parampreet Christopher Bindra, Rudolf Kerschbamer, Daniel Neururer, MatthiasSutter: Reveal it or conceal it: On the value of second opinions in a low-entry-barriers credence goods market
2020-08 Robert Steiger, Eva Posch, Gottfried Tappeiner, Janette Walde: Effects of climatechange on tourism demand considering individual seasonal preferences
2020-07 Fang Liu, Alexander Rasch, Marco A. Schwarz, Christian Waibel: The role of diag-nostic ability in markets for expert services
2020-06 Matthias Stefan, Jürgen Huber, Michael Kirchler, Matthias Sutter, Markus Walzl:Monetary and Social Incentives in Multi-Tasking: The Ranking Substitution Effect
2020-05 Michael Razen, Jürgen Huber, Laura Hueber, Michael Kirchler, Matthias Stefan:Financial Literacy, Economic Preferences, and Adolescents’ Field Behavior
2020-04 Christian König-Kersting, Johannes Lohse, Anna LouisaMerkel: Active and PassiveRisk-Taking
2020-03 ChristophHuber, JürgenHuber:Badbankers nomore? Truth-telling and (dis)honestyin the finance industry
2020-02 Dietmar Fehr, DanielMüller,Marcel Preuss: SocialMobility Perceptions and Inequa-lity Acceptance
2020-01 Loukas Balafoutas, Rudolf Kerschbamer: Credence goods in the literature: Whatthe past fifteen years have taught us about fraud, incentives, and the role of insti-tutions
University of Innsbruck
Working Papers in Economics and Statistics
2021-17
Silvia Angerer, Jana Bolvashenkova, Daniela Glätzle-Rützler, Philipp Lergetporer, MatthiasSutter
Children’s patience and school-track choices several years later: Linking experimental andfield data
AbstractWepresent direct evidence on the link between children’s patience and educational-trackchoices years later. Combining an incentivized patience measure of 493 primary-schoolchildren with their high-school track choices taken at least three years later at the end ofmiddle school, we find that patience significantly predicts choosing an academic track.This relationship remains robust after controlling for a rich set of covariates, such as fa-mily background, school-class fixed effects, risk preferences, and cognitive abilities, andis not driven by sample attrition. Accounting for middle-school GPA as a potential media-ting factor suggests a direct link between patience and educational-track choice.
ISSN 1993-4378 (Print)ISSN 1993-6885 (Online)