china development financial holding corporation and ... · the amount and timing of future cash...
TRANSCRIPT

China Development Financial Holding Corporation and Subsidiaries Consolidated Financial Statements for the Six Months Ended June 30, 2019 and 2018 and Independent Auditors’ Report


- 2 -
Impairment of Discount, Loans, Receivables, Loan Commitments and Provisions
As stated in Note 5, to determine the impairment loss of discount, loans, receivables, loan
commitments and provisions, the management should (1) judge whether there is any objective
evidence of impairment, (2) estimate the expected future cash flow based on past event, present
status and future economic circumstances of the assets with similar credit risk, and (3) review
periodically the methodology and assumptions adopted for both expected future cash flow and its
timing to decrease the difference between estimated and actual amount of impairment. The
methodology and assumptions adopted for the assessment of objective evidence of impairment and
the amount and timing of future cash flows (e.g. impairment occurrence rate, and recovery rate)
require the exercise of critical judgments and estimates; therefore, the impairment of discounts,
loans and receivables is deemed to be a key audit matter for the six months ended June 30, 2019.
Refer to Notes 4, 5 and 56 for the critical accounting policy, judgment, estimation uncertainty and
related disclosure of the impairment for discounts, loans and receivables, loan commitments and
provisions.
We understood and assessed the internal controls related to the discount, loans, receivables, loan
commitments and provisions. We verified whether the methodology used in impairment model and
parameters of the assumptions reflected past event, present status and future economic
circumstances. We assessed the consistency of the impairment occurrence rate and recovery rate,
etc. used in estimating expected future cash flows and evaluating values of collateral. Finally, we
performed sampling on discount, loans, receivables, loan commitments and provisions cases to
verify whether the allowance thereof complies with the law and related regulations issued by the
authorities.
Assessment of Insurance Liabilities and Liability Adequacy Reserve
As stated in Note 5, management uses actuarial models and several material assumptions when
assessing the insurance liabilities and liability adequacy reserve. The assumptions were based on
the principles embodied in the relevant laws and regulations, which cover the unique risk exposure,
product characteristics and experiences from target markets of China Life Insurance Co., Ltd
(China Life Insurance). The assessment of liability adequacy reserve is in compliance with the
relevant norms promulgated by The Actuarial Institute of ROC. When China Life Insurance
assesses the liability adequacy reserve, the estimated present value of future cash flows of
insurance contracts is based on reasonable estimate of future insurance payments, premium income
and related expenses. Since any change in the actuarial model and material assumptions will have a
significant influence on insurance liabilities and liability adequacy reserve, we consider them as
key audit matters for the six months ended June 30, 2019.
Refer to Notes 4, 5 and 55 for the relevant accounting policy, critical accounting judgments, and
estimation uncertainty, and disclosures of assessment of insurance liabilities and liability adequacy
reserve.
We understood and assessed China Life Insurance’s internal controls related to insurance liabilities
and liability adequacy reserve. We requested and our internal actuarial specialists assisted us in
performing our audit procedures regarding insurance liability including the evaluation of the
rationale of relevant assumptions and actuarial models adopted by management. As for the liability
adequacy reserve, we assessed the reasonableness of the underlying assumptions and outcomes.

- 3 -
Fair Value Measurement of Financial Products with No Quoted Market Prices in an Active Market
As stated in Note 54, the Group held financial instruments measured in fair value with no quoted
markets prices in active markets, which are material to the Group’s consolidated financial
statements. The financial instruments belong to Level II and Level III classification of financial
instruments. Management uses valuation model or refer to the available quotations from other
financial institutions in determining the fair value of financial products with no quoted market
prices in an active market. Parameters used in valuation model include adjusted observable inputs
and unobservable inputs. For the fact that the inputs involve material managerial estimation and
judgement, we identified the valuation as a key audit matter for the six months ended June 30,
2019.
Refer to Notes 4and 5 and Note 54 for the relevant accounting policy, critical accounting
judgments and estimation uncertainty, and disclosures of fair value measurement of financial
products with no quoted market prices in an active market.
We understood and assessed the Group’s internal controls related to the recognition and
measurement of financial products. For financial products classified under Level II, we evaluated
the reasonableness of the stated value by performing independent verification using public
information on a sample basis. For financial products classified under Level III, we requested our
internal specialists to assess the reasonableness of the valuation methods and key assumptions used.
Further, we calculated independently and compared the results with the evaluations made by the
management to see whether the evaluation is within the reasonable range assessed by our internal
specialists.
Responsibilities of Management and Those Charged with Governance for the Consolidated
Financial Statements
Management is responsible for the preparation and fair presentation of the consolidated financial
statements in accordance with the Regulations Governing the Preparation of Financial Reports by
Financial Holding Companies, Regulations Governing the Preparation of Financial Reports by
Public Banks, Regulations Governing the Preparation of Financial Reports by Securities Firms,
Regulations Governing the Preparation of Financial Reports by Futures Commission Merchants,
Regulations Governing the Preparation of Financial Reports by Securities Issuers, Regulations
Governing the Preparation of Financial Reports by Insurance Enterprises and International
Accounting Standard 34 “Interim Financial Reporting” endorsed and issued into effect by the
Financial Supervisory Commission of ROC, and for such internal control as management
determines is necessary to enable the preparation of consolidated financial statements that are free
from material misstatement, whether due to fraud or error.
In preparing the consolidated financial statements, management is responsible for assessing the
Group’s ability to continue as a going concern, disclosing, as applicable, matters related to going
concern and using the going concern basis of accounting unless management either intends to
liquidate the Group or to cease operations, or has no realistic alternative but to do so.
Those charged with governance, including the audit committee, are responsible for overseeing the
Group’s financial reporting process.

- 4 -
Auditors’ Responsibilities for the Audit of the Consolidated Financial Statements
Our objectives are to obtain reasonable assurance about whether the consolidated financial
statements as a whole are free from material misstatement, whether due to fraud or error, and to
issue an auditors’ report that includes our opinion. Reasonable assurance is a high level of
assurance, but is not a guarantee that an audit conducted in accordance with the auditing standards
generally accepted in ROC will always detect a material misstatement when it exists.
Misstatements can arise from fraud or error and are considered material if, individually or in the
aggregate, they could reasonably be expected to influence the economic decisions of users taken on
the basis of these consolidated financial statements.
As part of an audit in accordance with the auditing standards generally accepted in ROC, we
exercise professional judgment and maintain professional skepticism throughout the audit. We also:
1. Identify and assess the risks of material misstatement of the consolidated financial statements,
whether due to fraud or error, design and perform audit procedures responsive to those risks,
and obtain audit evidence that is sufficient and appropriate to provide a basis for our opinion.
The risk of not detecting a material misstatement resulting from fraud is higher than for one
resulting from error, as fraud may involve collusion, forgery, intentional omissions,
misrepresentations, or the override of internal control.
2. Obtain an understanding of internal control relevant to the audit in order to design audit
procedures that are appropriate in the circumstances, but not for the purpose of expressing an
opinion on the effectiveness of the Group’s internal control.
3. Evaluate the appropriateness of accounting policies used and the reasonableness of accounting
estimates and related disclosures made by management.
4. Conclude on the appropriateness of management’s use of the going concern basis of
accounting and, based on the audit evidence obtained, whether a material uncertainty exists
related to events or conditions that may cast significant doubt on the Group’s ability to
continue as a going concern. If we conclude that a material uncertainty exists, we are required
to draw attention in our auditors’ report to the related disclosures in the consolidated financial
statements or, if such disclosures are inadequate, to modify our opinion. Our conclusions are
based on the audit evidence obtained up to the date of our auditors’ report. However, future
events or conditions may cause the Group to cease to continue as a going concern.
5. Evaluate the overall presentation, structure and content of the consolidated financial statements,
including the disclosures, and whether the consolidated financial statements represent the
underlying transactions and events in a manner that achieves fair presentation.
6. Obtain sufficient and appropriate audit evidence regarding the financial information of entities
or business activities within the Group to express an opinion on the consolidated financial
statements. We are responsible for the direction, supervision, and performance of the audit of
the Group. We remain solely responsible for our audit opinion.
We communicate with those charged with governance regarding, among other matters, the planned
scope and timing of the audit and significant audit findings, including any significant deficiencies
in internal control that we identify during our audit.


- 6 -
CHINA DEVELOPMENT FINANCIAL HOLDING CORPORATION AND SUBSIDIARIES
CONSOLIDATED BALANCE SHEETS
(In Thousands of New Taiwan Dollars)
June 30, 2019 December 31, 2018 June 30, 2018
ASSETS Amount % Amount % Amount %
CASH AND CASH EQUIVALENTS (Notes 6 and 48) $ 58,345,344 2 $ 59,607,423 2 $ 72,988,044 3
DUE FROM THE CENTRAL BANK AND CALL LOANS TO FINANCIAL INSTITUTIONS (Notes 7 and 49) 35,083,261 1 26,431,383 1 31,087,128 1
FINANCIAL ASSETS AT FAIR VALUE THROUGH PROFIT OR LOSS (Notes 4, 8, 9, 17, 48
and 49) 473,929,758 16 374,931,034 14 402,915,728 15
FINANCIAL ASSETS AT FAIR VALUE THROUGH OTHER COMPREHENSIVE INCOME
(Notes 4, 10, 49 and 56) 520,172,686 17 485,335,934 18 447,197,374 17
DEBT INVESTMENTS MEASURED AT AMORTIZED COST (Notes 4, 11, 17, 48 and 56) 1,031,120,710 35 970,536,279 36 905,571,036 34
SECURITIES PURCHASED UNDER RESELL AGREEMENTS (Note 12) 47,482,396 2 39,770,534 1 57,444,637 2
RECEIVABLES, NET (Notes 4, 13, 48, 49 and 56) 118,620,269 4 99,099,379 4 118,147,374 4
CURRENT TAX ASSETS 704,103 - 1,168,303 - 821,578 -
DISCOUNT AND LOANS, NET (Notes 4, 14, 48 and 56) 388,759,451 13 369,131,396 13 363,591,273 13
REINSURANCE ASSET, NET (Note 15) 658,590 - 534,353 - 567,242 -
INVESTMENTS ACCOUNTED FOR USING THE EQUITY METHOD, NET (Notes 16
and 17) 17,959,761 1 16,102,926 1 16,477,145 1
RESTRICTED ASSETS (Notes 18 and 49) 43,875,630 1 43,927,569 2 44,740,227 2
OTHER FINANCIAL ASSETS (Notes 19 and 49) 103,757,131 3 91,362,530 3 92,608,497 3
INVESTMENT PROPERTY, NET (Notes 20 and 49) 25,329,771 1 25,432,420 1 25,293,174 1
PROPERTY AND EQUIPMENT, NET (Notes 21 and 49) 33,192,390 1 31,717,297 1 31,199,805 1
RIGHT-OF-USE ASSETS, NET (Notes 4 and 22) 18,991,539 1 - - - -
INTANGIBLE ASSETS, NET (Note 23) 20,751,444 1 21,171,147 1 21,620,213 1
DEFERRED TAX ASSETS 8,313,670 - 12,652,560 - 12,317,349 -
OTHER ASSETS, NET (Notes 24 and 49) 36,258,773 1 48,902,361 2 55,835,245 2
TOTAL $ 2,983,306,677 100 $ 2,717,814,828 100 $ 2,700,423,069 100
LIABILITIES AND EQUITY
LIABILITIES
Deposits from the Central Bank and financial institutions (Notes 25 and 48) $ 22,626,550 1 $ 22,434,914 1 $ 34,237,060 1
Financial liabilities at fair value through profit or loss (Notes 4, 8 and 48) 103,305,883 3 87,786,725 3 123,527,547 5 Notes and bonds issued under repurchase agreements (Notes 8, 10, 11 and 26) 121,319,108 4 125,478,900 5 138,257,733 5
Commercial paper payable, net (Notes 27 and 49) 17,576,808 1 14,985,902 1 23,360,687 1
Payables (Notes 28 and 48) 112,659,253 4 89,641,244 3 104,070,264 4 Current tax liabilities 604,714 - 967,872 - 1,484,257 -
Deposits and remittances (Notes 29 and 48) 437,439,646 15 398,286,010 15 407,176,069 15 Bonds payable (Note 30) 33,250,000 1 31,150,000 1 24,800,000 1
Other borrowings (Notes 31, 48 and 49) 17,809,353 1 18,818,061 1 30,323,783 1
Provisions (Notes 4 and 32) 1,662,841,427 56 1,557,304,939 57 1,440,860,134 53 Other financial liabilities (Notes 34 and 49) 123,654,195 4 111,539,399 4 109,195,535 4
Lease liabilities (Notes 4 and 22) 5,921,944 - - - - -
Deferred tax liabilities 10,357,315 - 7,275,275 - 7,427,295 - Other liabilities 31,367,697 1 28,582,681 1 25,600,480 1
Total liabilities 2,700,733,893 91 2,494,251,922 92 2,470,320,844 91
EQUITY ATTRIBUTABLE TO OWNERS OF THE PARENT (Notes 35, 36 and 37)
Capital Common stock 149,659,821 5 149,622,812 5 149,572,949 5
Advance receipts for capital stock - - 10,748 - - -
Capital surplus 883,080 - 1,630,992 - 1,240,569 - Retained earnings
Legal reserve 7,561,404 - 6,776,135 - 6,776,135 -
Special reserve 10,797,899 1 565,041 - 565,041 - Unappropriated earnings 8,004,636 - 14,754,530 1 12,923,727 1
Other
Exchange differences on translation of foreign financial statements (385,461 ) - (930,286 ) - (1,196,570 ) - Unrealized gain (loss) on equity instruments at fair value through other comprehensive
income 1,439,137 - (66,615 ) - 792,905 -
Unrealized gain (loss) on debt instruments at fair value through other comprehensive income 5,438,585 - (5,071,947 ) - (4,709,541 ) -
Other comprehensive income (loss) reclassified using the overlay approach 1,383,393 - (4,451,944 ) - (1,387,854 ) -
Others (527 ) - (1,339 ) - (4,361 ) - Treasury shares (3,379,234 ) - (3,605,444 ) - (3,861,394 ) -
Total equity attributable to owners of the parent 181,402,733 6 159,232,683 6 160,711,606 6
NON-CONTROLLING INTERESTS (Notes 36 and 37) 101,170,051 3 64,330,223 2 69,390,619 3
Total equity 282,572,784 9 223,562,906 8 230,102,225 9
TOTAL $ 2,983,306,677 100 $ 2,717,814,828 100 $ 2,700,423,069 100
The accompanying notes are an integral part of the consolidated financial statements.

- 7 -
CHINA DEVELOPMENT FINANCIAL HOLDING CORPORATION AND SUBSIDIARIES
CONSOLIDATED STATEMENTS OF COMPREHENSIVE INCOME
(In Thousands of New Taiwan Dollars, Except Earnings Per Share)
For the Three Months Ended June 30 For the Six Months Ended June 30
2019 2018 2019 2018
Amount % Amount % Amount % Amount %
INTEREST REVENUE (Notes 38
and 48) $ 18,193,856 31 $ 15,844,840 26 $ 35,695,628 28 $ 30,444,590 25
INTEREST EXPENSE (Notes 38
and 48) (2,427,687 ) (4 ) (1,909,319 ) (3 ) (4,862,297 ) (4 ) (3,564,191 ) (3 )
INTEREST PROFIT, NET 15,766,169 27 13,935,521 23 30,833,331 24 26,880,399 22
NONINTEREST PROFITS AND
GAINS, NET
Service fee and commission, net (Notes 19 and 39) (253,116 ) (1 ) (216,695 ) - (1,620,074 ) (1 ) 129,493 -
Net income from insurance
operations (Notes 40 and 48) 34,495,163 59 42,535,718 69 83,207,182 66 84,054,028 70 Gain (loss) on financial assets
or liabilities measured at fair
value through profit or loss, net (Notes 8, 41 and 48) 4,437,123 8 (31,606,832 ) (51 ) 16,570,615 13 (15,762,495 ) (13 )
Realized gain (loss) on
financial assets measured at fair value through other
comprehensive income
(Note 42) 1,513,835 3 289,234 - 3,515,493 3 1,996,073 2 Gain (loss) on disposal of
financial assets measured at
amortized cost 129,695 - (218,987 ) (1 ) 127,085 - (437,973 ) - Foreign exchange gain (loss),
net 5,655,606 10 31,570,100 51 9,319,749 7 14,199,858 12 Impairment loss on assets, net
(Note 4) (5,799 ) - (4,453 ) - (11,921 ) - (11,749 ) -
Share of the profit (loss) of associates and joint ventures 124,701 - (124,536 ) - 981,622 1 226,189 -
Gain (loss) on reclassification
using the overlay approach (Note 8) (3,848,870 ) (7 ) 4,476,455 7 (17,808,971 ) (14 ) 6,671,612 6
Others (Note 48) 571,296 1 1,047,624 2 1,146,718 1 1,693,847 1
Total noninterest profits
and gains, net 42,819,634 73 47,747,628 77 95,427,498 76 92,758,883 78
TOTAL NET REVENUES 58,585,803 100 61,683,149 100 126,260,829 100 119,639,282 100
REVERSAL OF ALLOWANCE (ALLOWANCE) FOR BAD
DEBTS AND LOSSES ON
GUARANTEES, NET (Note 4) (83,325 ) - 85,686 - (77,582 ) - (174,536 ) -
NET CHANGE IN RESERVE
FOR INSURANCE LIABILITIES (44,596,173 ) (76 ) (50,629,487 ) (82 ) (100,495,491 ) (80 ) (97,233,107 ) (81 )
OPERATING EXPENSES
(Notes 22, 33, 43 and 48)
Employee benefits (4,292,574 ) (7 ) (3,764,722 ) (6 ) (8,413,496 ) (7 ) (8,014,629 ) (7 )
Depreciation and amortization (816,030 ) (1 ) (605,232 ) (1 ) (1,619,445 ) (1 ) (1,206,585 ) (1 ) Other general and
administrative expenses (1,620,167 ) (3 ) (1,805,888 ) (3 ) (3,008,297 ) (2 ) (3,629,871 ) (3 )
Total operating expenses (6,728,771 ) (11 ) (6,175,842 ) (10 ) (13,041,238 ) (10 ) (12,851,085 ) (11 )
(Continued)

- 8 -
CHINA DEVELOPMENT FINANCIAL HOLDING CORPORATION AND SUBSIDIARIES
CONSOLIDATED STATEMENTS OF COMPREHENSIVE INCOME
(In Thousands of New Taiwan Dollars, Except Earnings Per Share)
For the Three Months Ended June 30 For the Six Months Ended June 30
2019 2018 2019 2018
Amount % Amount % Amount % Amount %
NET PROFIT BEFORE
INCOME TAX $ 7,177,534 13 $ 4,963,506 8 $ 12,646,518 10 $ 9,380,554 8
INCOME TAX EXPENSE (Note
44) (517,259 ) (1 ) (1,033,968 ) (1 ) (1,050,182 ) (1 ) (173,024 ) -
NET PROFIT FOR THE
PERIOD 6,660,275 12 3,929,538 7 11,596,336 9 9,207,530 8
OTHER COMPREHENSIVE
INCOME (LOSS) Items that will not be
reclassified subsequently to
profit or loss, net of income tax
Remeasurement of defined
benefit plans (851 ) - 104 - (851 ) - 104 - Share of the other
comprehensive income
(loss) of associates and joint ventures 227,396 - (250,885 ) (1 ) 527,226 - (144,844 ) -
Gain (loss) on equity
instruments measured at fair value through other
comprehensive income (196,902 ) - (1,757,916 ) (3 ) 3,311,793 3 (3,094,306 ) (3 )
Income tax relating to the items that will not be
reclassified subsequently to profit or loss (Note 44) 42,410 - 389,390 1 (489,617 ) - 581,332 1
Items that will be reclassified
subsequently to profit or loss, net of income tax
Exchange differences on
translation of foreign financial statements 304,671 - 1,340,760 2 501,845 - 733,667 1
Share of the other
comprehensive income (loss) of associates and
joint ventures 38,269 - 248,371 - 51,097 - 114,280 -
Income tax relating to items that may be reclassified
subsequently to profit or
loss (Note 44) (2,531,669 ) (4 ) 1,884,343 3 (6,402,994 ) (5 ) 4,018,770 3 Gain (loss) on debt
instruments measured at
fair value through other comprehensive income 14,800,285 25 (6,424,210 ) (10 ) 30,026,858 24 (19,535,325 ) (16 )
Other comprehensive income
(loss) reclassified using the overlay approach
(Note 8) 3,848,870 7 (4,476,455 ) (7 ) 17,808,971 14 (6,671,612 ) (6 )
Other comprehensive
income for the period,
net of income tax 16,532,479 28 (9,046,498 ) (15 ) 45,334,328 36 (23,997,934 ) (20 )
TOTAL COMPREHENSIVE
INCOME FOR THE PERIOD $ 23,192,754 40 $ (5,116,960 ) (8 ) $ 56,930,664 45 $ (14,790,404 ) (12 )
NET PROFIT ATTRIBUTABLE
TO: Owners of parent $ 4,191,750 7 $ 2,773,776 4 $ 7,801,443 6 $ 6,050,400 5
Non-controlling interests 2,468,525 4 1,155,762 2 3,794,893 3 3,157,130 3
$ 6,660,275 11 $ 3,929,538 6 $ 11,596,336 9 $ 9,207,530 8
(Continued)

- 9 -
CHINA DEVELOPMENT FINANCIAL HOLDING CORPORATION AND SUBSIDIARIES
CONSOLIDATED STATEMENTS OF COMPREHENSIVE INCOME
(In Thousands of New Taiwan Dollars, Except Earnings Per Share)
For the Three Months Ended June 30 For the Six Months Ended June 30
2019 2018 2019 2018
Amount % Amount % Amount % Amount %
TOTAL COMPREHENSIVE
INCOME ATTRIBUTABLE TO:
Owners of parent $ 10,834,539 19 $ 245,409 1 $ 26,359,684 21 $ (2,813,787 ) (2 )
Non-controlling interests 12,358,215 21 (5,362,369 ) (9 ) 30,570,980 24 (11,976,617 ) (10 )
$ 23,192,754 40 $ (5,116,960 ) (8 ) $ 56,930,664 45 $ (14,790,404 ) (12 )
EARNINGS PER SHARE
(Note 45)
Basic $ 0.29 $ 0.19 $ 0.54 $ 0.42 Diluted $ 0.29 $ 0.19 $ 0.54 $ 0.42
The accompanying notes are an integral part of the consolidated financial statements. (Concluded)

- 10 -
CHINA DEVELOPMENT FINANCIAL HOLDING CORPORATION AND SUBSIDIARIES
CONSOLIDATED STATEMENTS OF CHANGES IN EQUITY
(In Thousands of New Taiwan Dollars, Except Per Share Amount)
Equity Attributable to Owners of the Parent
Other Equity
Exchange
Differences on
Unrealized Gains
(Losses) on
Financial Assets at
Fair Value
Unrealized Gains
(Losses) on
Other
Comprehensive
Income Reclassified Total Equity
Capital Retained Earnings Translation of through Other Available-for- Using the Attributable to
Advance Receipts Unappropriated Foreign Financial Comprehensive sale Financial Overlay Owners of the Non-controlling
Common Stock for Capital Stock Capital Surplus Legal Reserve Special Reserve Earnings Statements Income Assets Approach Others Treasury Shares Parent Interests Total Equity
BALANCE AT JANUARY 1, 2018 $ 149,763,034 $ 5,162 $ 1,173,719 $ 5,606,606 $ 2,078,602 $ 13,184,948 $ (2,031,949 ) $ - $ 2,113,838 $ - $ (8,322 ) $ (4,205,566 ) $ 167,680,072 $ 81,544,066 $ 249,224,138
Effect of retrospective application and retrospective restatement - - - - - 2,179,121 - 3,949,970 (2,113,838 ) 545,309 - - 4,560,562 1,743,732 6,304,294
BALANCE AT JANUARY 1, 2018 AS RESTATED 149,763,034 5,162 1,173,719 5,606,606 2,078,602 15,364,069 (2,031,949 ) 3,949,970 - 545,309 (8,322 ) (4,205,566 ) 172,240,634 83,287,798 255,528,432
Appropriation of the 2017 earnings
Legal reserve - - - 1,169,529 - (1,169,529 ) - - - - - - - - -
Cash dividends - NT$0.6 per share - - - - - (8,974,377 ) - - - - - - (8,974,377 ) - (8,974,377 )
Special reserve reserved - - - - (1,513,561 ) 1,513,561 - - - - - - - - -
- - - 1,169,529 (1,513,561 ) (8,630,345 ) - - - - - - (8,974,377 ) - (8,974,377 )
Net profit for the six months ended June 30, 2018 - - - - - 6,050,400 - - - - - - 6,050,400 3,157,130 9,207,530
Other comprehensive income (loss) for the six months ended
June 30, 2018, net of income tax - - - - - 59 835,379 (7,766,462 ) - (1,933,163 ) - - (8,864,187 ) (15,133,747 ) (23,997,934 )
Total comprehensive income (loss) for the six months ended
June 30, 2018 - - - - - 6,050,459 835,379 (7,766,462 ) - (1,933,163 ) - - (2,813,787 ) (11,976,617 ) (14,790,404 )
Cancellation of treasury shares (206,461 ) - - - - - - - - - - 206,461 - - -
Disposal of the Corporation shares, as treasury shares - - 65,318 - - - - - - - - 137,711 203,029 - 203,029
Share-based payments 16,376 (5,162 ) 1,532 - - - - - - - 3,961 - 16,707 - 16,707
Changes in non-controlling interest - - - - - - - - - - - - - (1,993,869 ) (1,993,869 )
Disposal of equity instruments at fair value through other
comprehensive income - - - - - 100,144 - (100,144 ) - - - - - - -
Changes in special reserve of subsidiaries - - - - - 39,400 - - - - - - 39,400 73,307 112,707
BALANCE AT JUNE 30, 2018 $ 149,572,949 $ - $ 1,240,569 $ 6,776,135 $ 565,041 $ 12,923,727 $ (1,196,570 ) $ (3,916,636 ) $ - $ (1,387,854 ) $ (4,361 ) $ (3,861,394 ) $ 160,711,606 $ 69,390,619 $ 230,102,225
BALANCE AT JANUARY 1, 2019 $ 149,622,812 $ 10,748 $ 1,630,992 $ 6,776,135 $ 565,041 $ 14,754,530 $ (930,286 ) $ (5,138,562 ) $ - $ (4,451,944 ) $ (1,339 ) $ (3,605,444 ) $ 159,232,683 $ 64,330,223 $ 223,562,906
Appropriation of the 2018 earnings
Legal reserve - - - 785,269 - (785,269 ) - - - - - - - - -
Special reserve - - - - 10,232,858 (10,232,858 ) - - - - - - - - -
Cash dividends - NT$0.245 per share - - - - - (3,666,666 ) - - - - - - (3,666,666 ) - (3,666,666 )
- - - 785,269 10,232,858 (14,684,793 ) - - - - - - (3,666,666 ) - (3,666,666 )
Changes in capital surplus from investments in associates and
joint ventures accounted for using the equity method - - (391 ) - - - - - - - - - (391 ) - (391 )
Issuance of cash dividends from capital surplus - - (823,129 ) - - - - - - - - - (823,129 ) - (823,129 )
Other changes in capital surplus - - 54,273 - - - - - - - - - 54,273 - 54,273
Net profit for the six months ended June 30, 2019 - - - - - 7,801,443 - - - - - - 7,801,443 3,794,893 11,596,336
Other comprehensive income (loss) for the six months ended
June 30, 2019, net of income tax - - - - - (851 ) 544,848 12,173,585 - 5,840,659 - - 18,558,241 26,776,087 45,334,328
Total comprehensive income (loss) for the six months ended
June 30, 2019 - - - - - 7,800,592 544,848 12,173,585 - 5,840,659 - - 26,359,684 30,570,980 56,930,664
Disposal of the Corporation shares, as treasury shares - - 87,765 - - - - - - - - 218,911 306,676 - 306,676
Share-based payments 37,009 (10,748 ) 1,180 - - (6,793 ) - - - - 812 - 21,460 - 21,460
Changes in percentage of ownership interests in subsidiaries - - (67,610 ) - - (972 ) (23 ) (11,727 ) - (5,322 ) - 7,299 (78,355 ) 6,235,645 6,157,290
Changes in non-controlling interest - - - - - - - - - - - - - 39,720 39,720
Disposal of equity instruments at fair value through other
comprehensive income - - - - - 145,574 - (145,574 ) - - - - - - -
Changes in special reserve of subsidiaries - - - - - (3,502 ) - - - - - - (3,502 ) (6,517 ) (10,019 )
BALANCE AT JUNE 30, 2019 $ 149,659,821 $ - $ 883,080 $ 7,561,404 $ 10,797,899 $ 8,004,636 $ (385,461 ) $ 6,877,722 $ - $ 1,383,393 $ (527 ) $ (3,379,234 ) $ 181,402,733 $ 101,170,051 $ 282,572,784
The accompanying notes are an integral part of the consolidated financial statements.

- 11 -
CHINA DEVELOPMENT FINANCIAL HOLDING CORPORATION AND
SUBSIDIARIES
CONSOLIDATED STATEMENTS OF CASH FLOWS
(In Thousands of New Taiwan Dollars)
For the Six Months Ended
June 30
2019 2018
CASH FLOWS FROM OPERATING ACTIVITIES
Net profit before income tax $ 12,646,518 $ 9,380,554
Adjustments to reconcile net profit
Depreciation expenses 961,614 532,242
Amortization expenses 657,831 674,343
Allowance for bad debts and losses on guarantees, net 77,582 174,536
Loss (gain) on financial assets and liabilities measured at fair value
through profit or loss, net (14,099,200) 17,191,610
Interest expense 4,862,297 3,564,191
Interest income (35,695,628) (30,444,590)
Dividend income (2,591,127) (1,583,558)
Net changes in insurance liabilities 103,500,223 101,881,941
Net changes in reserve for changes in foreign exchange valuation 2,022,549 (366,584)
Share of profit of associates and joint ventures (972,001) (225,505)
Gain (loss) on reclassification using the overlay approach 17,808,971 (6,671,612)
Gain on disposal of investments (3,021,455) (3,160,743)
Gain (loss) on unrealized foreign currency exchange (11,639,285) (15,829,270)
Others 125,455 244,084
Changes in operating assets and liabilities
Due from the Central Bank and call loans to financial institutions (682,196) 3,191,343
Financial assets at fair value through profit or loss (39,598,832) (70,911,244)
Financial assets at fair value through other comprehensive income 8,229,997 (31,416,011)
Debt investments measured at amortized cost (134,354) (6,360,712)
Securities purchased under resell agreements (333,925) 75,601
Receivables (18,244,448) (14,333,469)
Discount and loans (19,723,458) (37,819,039)
Other financial assets (7,255,233) (9,288,116)
Other assets (2,267,027) (21,882,058)
Deposits from the Central Bank and financial institutions 191,636 5,369,104
Financial liabilities at fair value through profit or loss (30,693,920) 46,551,515
Notes and bonds issued under repurchase agreements (4,159,792) 38,080,106
Payables 25,584,170 7,232,444
Deposits and remittances 39,153,636 44,447,000
Other financial liabilities 4,230,357 (68,100)
Other liabilities (1,683,030) 225,443
Cash generated from operations 27,257,925 28,455,446
Interest received 30,805,218 22,995,399
Dividend received 1,293,086 504,686
Interest paid (4,016,236) (2,736,500)
Income tax paid (393,090) (5,499,136)
Net cash generated from operating activities 54,946,903 43,719,895
(Continued)

- 12 -
CHINA DEVELOPMENT FINANCIAL HOLDING CORPORATION AND
SUBSIDIARIES
CONSOLIDATED STATEMENTS OF CASH FLOWS
(In Thousands of New Taiwan Dollars)
For the Six Months Ended
June 30
2019 2018
CASH FLOWS FROM INVESTING ACTIVITIES
Acquisition of financial assets at fair value through other
comprehensive income $ (95,724,526) $ (77,817,789)
Proceeds from sale of financial assets at fair value through other
comprehensive income 90,984,903 57,723,337
Acquisition of financial assets measured at amortized cost (78,623,125) (79,926,810)
Proceeds from sale of financial assets measured at amortized cost 24,143,210 5,115,057
Maturity principal from financial assets measured at amortized cost 10,737,909 10,858,121
Acquisition of equity-method investments (436,570) (43,547)
Acquisition of property and equipment (1,820,574) (650,053)
Cash received through mergers - 49,856,478
Others 87,547 425,985
Net cash used in investing activities (50,651,226) (34,459,221)
CASH FLOWS FROM FINANCING ACTIVITIES
Increase (decrease) in short-term borrowings (515,213) 4,726,450
Increase in commercial paper payable 2,590,906 2,811,295
Repayments of corporate bonds (1,000,000) (5,200,000)
Proceeds from bank debentures 3,100,000 -
Repayments of long-term borrowings (493,494) (106,929)
Repayments of the principal portion of lease liabilities (471,089) -
Sale of treasury shares 306,676 203,029
Changes in non-controlling interests 6,144,406 -
Others 19,899 9,760
Net cash generated from financing activities 9,682,091 2,443,605
EFFECTS OF EXCHANGE RATE CHANGES ON CASH AND CASH
EQUIVALENTS 107,771 294,800
NET INCREASE IN CASH AND CASH EQUIVALENTS 14,085,539 11,999,079
CASH AND CASH EQUIVALENTS AT THE BEGINNING OF THE
PERIOD 114,495,133 132,256,162
CASH AND CASH EQUIVALENTS AT THE END OF THE PERIOD $ 128,580,672 $ 144,255,241
(Continued)

- 13 -
CHINA DEVELOPMENT FINANCIAL HOLDING CORPORATION AND
SUBSIDIARIES
CONSOLIDATED STATEMENTS OF CASH FLOWS
(In Thousands of New Taiwan Dollars)
Reconciliation of the amounts in the consolidated statements of cash flows with the equivalent items reported in
the consolidated balance sheets as of June 30, 2019 and 2018:
June 30
2019 2018
Cash and cash equivalents in consolidated balance sheets $ 58,345,344 $ 72,988,044
Due from the Central Bank and call loans to banks which qualify as cash
and cash equivalents as defined of in IAS 7 23,086,858 14,894,405
Securities purchased under agreements to resell which qualify as cash and
cash equivalents as defined of in IAS 7 47,148,470 56,372,792
Cash and cash equivalents in consolidated statements of cash flows $ 128,580,672 $ 144,255,241
The accompanying notes are an integral part of the consolidated financial statements. (Concluded)

- 14 -
CHINA DEVELOPMENT FINANCIAL HOLDING CORPORATION AND
SUBSIDIARIES
NOTES TO CONSOLIDATED FINANCIAL STATEMENTS
FOR THE SIX MONTHS ENDED JUNE 30, 2019 AND 2018
(In Thousands of New Taiwan Dollars, Unless Stated Otherwise)
1. GENERAL INFORMATION
China Development Financial Holding Corporation (the Corporation) was established by CDIB Capital
Group (formerly China Development Industrial Bank) through a share swap on December 28, 2001 made
under the Financial Holding Company Act and related regulations. CDIB Capital Group became a wholly
owned subsidiary of the Corporation after the share swap.
The Corporation acquired First Taiwan Securities Corporation (First Taiwan) and Grand Cathay Securities
Corporation (Grand Cathay) through a share swap on November 8, 2002. The effective date of the merger
between Grand Cathay and First Taiwan was December 31, 2003. Grand Cathay was the survivor company
after the merger.
On April 30, 2012, the Corporation’s board of the directors approved the acquisition of 100% shares of KGI
Securities through a tender offer. The Corporation acquired 81.73% of KGI Securities’ shares during the
public tender offer period. The Corporation acquired KGI Securities’ remaining shares through a share
swap and completed on January 18, 2013. Thus, KGI Securities is a 100% subsidiary of the Corporation.
The effective date of the merger between KGI Securities and Grand Cathay was June 22, 2013. KGI
Securities was the survivor company after the merger.
On September 15, 2014, the Corporation acquired KGI Bank through a share swap. Thus, KGI Bank
became the Corporation’s wholly owned subsidiary.
On March 13, 2017, the Corporation hold 100% shares of China Development Asset Management
Corporation which was previously held by CDIB Capital Group.
On August 15, 2017, the Corporation’s board of directors approved the acquisition of 25.33% shares of
China Life Insurance through public tender offer from August 17, 2017 to September 6, 2017. After the
Corporation acquired ordinary shares through public tender offer, China Life Insurance became a subsidiary
of the Corporation as defined by the Financial Holding Company Act. On March 25, 2019, the
Corporation’s board of directors approved to apply for the participation of capital increase by cash of China
Life. After the Corporation acquired ordinary shares, The Corporation holds 26.16% of the ordinary shares
of China Life Insurance. The acquired shares plus 8.66% shares of China Life Insurance held by a
subsidiary, KGI Securities (excluding KGI Securities’ hedging accounts of derivative products) are
equivalent to 34.82% shares of China Life Insurance.
The Corporation invests in and manages the businesses of finance-related institutions and investees.
The Corporation’s shares have been listed on the Taiwan Stock Exchange (TSE).
CDIB Capital Group was incorporated under the Company Act and relevant regulations and started
operations on May 14, 1959. Effective January 1999, CDIB Capital Group was converted from a trust
corporation into an industrial bank under government approval.

- 15 -
On May 1, 2015, CDIB Capital Group’s board of the directors approved the transfer to KGI Bank of (a) all
assets and liabilities associated with the commercial banking business of CDIB Capital Group and (b)
CDIB Capital Group’s holdings of shares in the CDIB Capital Group’s leasing subsidiaries and in the
Taiwan Financial Asset Service Corporation.
On January 19, 2017, under the approval of the board of directors who had been authorized to exercise the
rights on behalf of the shareholders’ meeting, China Development Industrial Bank was converted and the
name became CDIB Capital Group. The date of conversion was March 15, 2017, and CDIB Capital Group
will continue to expand its assets management business. The Financial Supervisory Commission (FSC)
approved the conversion on March 10, 2017 with Official Letter No. 10600025880.
CDIB Capital Group’s main operations included securities investment, investment financial related
business, venture capital and other activities approved by the authorities.
KGI Securities was established on September 14, 1988. It merged with Jen-Hsin Securities Co., Ltd., Ta Ya
Securities Co., Ltd., and Feng Yuan Securities Co., Ltd. in 2002; with Tai-Yu Securities Co., Ltd. in 2003,
with Taishin Securities Co., Ltd. in 2009 and with Grand Cathay in 2013. The survivor entity in all these
mergers was KGI Securities. As of June 30, 2019, KGI Securities had a head office and 77 branches which
included head office.
KGI Securities operates as a securities underwriter, dealer, broker, future trading, future dealer, trust,
wealth management, offshore securities and other related business as approved by authorities.
KGI Bank was established on January 14, 1992. As of June 30, 2019, KGI Bank had a main office,
international banking department, a trust department, various business departments, an offshore banking
unit (OBU), and 53 domestic branches.
KGI Bank engages in banking operations are regulated under the banking Act.
China Development Asset Management Corporation was established on September 11, 2001, and its
operation includes acquiring, valuation, auction and management of debts from financial institution,
acquiring of accounts receivable, management of overdue accounts receivable, and leasing and investment
of real estate.
China Life Insurance was incorporated in Taiwan on April 25, 1963. In 2009, China Life Insurance
completed the acquisition of major assets and liabilities of Prudential Corporation Asia Life Taiwan. As of
June 30, 2019, China Life Insurance had a head office, an offshore insurance unit, and 8 domestic branches.
On October 19, 2017, China Life Insurance’s board of directors approved the acquisition of the following
from Allianz Taiwan Life Insurance Co., Ltd.: A portion of the traditional insurance policies and additional
attachments valued at NT$1 dollar. This acquisition has been approved by the FSC on February 27, 2018,
and then the delivery was completed on May 18, 2018.
China Life Insurance is mainly engaged in the business of life insurance, offshore life insurance paid and
received for foreign currency and other insurance-related businesses approved by competent authorities.
For more information on the organization and business of the consolidated entities, please refer to Table 8
(attached).
2. APPROVAL OF FINANCIAL STATEMENTS
The consolidated financial statements were approved by the board of directors and authorized for issue on
August 26, 2019.

- 16 -
3. APPLICATION OF NEW, AMENDED AND REVISED STANDARDS AND INTERPRETATIONS
a. Initial application of the Amendments to the Regulations Governing the Preparation of Financial
Reports by Financial Holding Companies and the International Financial Reporting Standards (IFRS),
International Accounting Standards (IAS), Interpretations of IFRS (IFRIC), and Interpretations of IAS
(SIC) endorsed by the FSC for application starting
The related amendments to the Regulations Governing the Preparation of Financial Reports by
Financial Holding Companies and the International Financial Reporting Standards (IFRSs) would not
have any material impact on the Group’s accounting policies, except for the following:
IFRS 16 “Leases”
IFRS 16 provides a comprehensive model for the identification of lease arrangements and their
treatment in the financial statements of both lessee and lessor. It supersedes IAS 17 “Leases”,
IFRIC 4 “Determining whether an Arrangement contains a Lease”, and a number of related
interpretations. Refer to Note 4 for information relating to the relevant accounting policies.
Definition of a lease
The Group elects to apply the guidance of IFRS 16 in determining whether contracts are, or contain,
a lease only to contracts entered into (or changed) on or after January 1, 2019. Contracts identified
as containing a lease under IAS 17 and IFRIC 4 are not reassessed and are accounted for in
accordance with the transitional provisions under IFRS 16.
The Group as lessee
The Group recognizes right-of-use assets and lease liabilities for all leases on the consolidated
balance sheets except for those whose payments under low-value asset and short-term leases are
recognized as expenses on a straight-line basis. On the consolidated statements of comprehensive
income, the Group presents the depreciation expense charged on right-of-use assets separately from
the interest expense accrued on lease liabilities; interest is computed using the effective interest
method. On the consolidated statements of cash flows, cash payments for the principal portion of
lease liabilities are classified within financing activities; cash payments for the interest portion are
classified within operating activities. Prior to the application of IFRS 16, payments under operating
lease contracts were recognized as expenses on a straight-line basis. Cash flows for operating leases
were classified within operating activities on the consolidated statements of cash flows. Leased
assets and finance lease payables were recognized on the consolidated balance sheets for contracts
classified as finance leases.
The Group elects to apply IFRS 16 retrospectively with the cumulative effect of the initial
application of this standard recognized in retained earnings on January 1, 2019. Comparative
information is not restated.
Lease liabilities were recognized on January 1, 2019 for leases previously classified as operating
leases under IAS 17. Lease liabilities were measured at the present value of the remaining lease
payments, discounted using the lessee’s incremental borrowing rate on January 1, 2019.
Right-of-use assets are measured at an amount equal to the lease liabilities, adjusted by the amount
of any prepaid lease payment. The Group applies IAS 36 to all right-of-use assets.
The Group also applies the following practical expedients:
a) The Group applies a single discount rate to a portfolio of leases with reasonably similar
characteristics to measure lease liabilities.

- 17 -
b) The Group accounts for those leases for which the lease term ends on or before December 31,
2019 as short-term leases.
c) The Group excludes initial direct costs from the measurement of right-of-use assets on January
1, 2019.
d) The Group uses hindsight, such as in determining lease terms, to measure lease liabilities.
For leases previously classified as finance leases under IAS 17, the carrying amounts of right-of-use
assets and lease liabilities on January 1, 2019 are determined as at the carrying amounts of the
respective leased assets and finance lease payables on December 31, 2018.
The range of lessee’s incremental borrowing rate applied to lease liabilities recognized on January
1, 2019 is 0.73%-9.79%. The difference between the (i) lease liabilities recognized and (ii)
operating lease commitments disclosed under IAS 17 on December 31, 2018 is explained as
follows:
The future minimum lease payments of non-cancellable operating lease
commitments on December 31, 2018 $ 7,780,478
Less: Recognition exemption for short-term leases (60,173)
Less: Recognition exemption for leases of low-value assets (9,371)
Undiscounted amounts on January 1, 2019 $ 7,710,934
Discounted amounts using the incremental borrowing rate on January 1, 2019 $ 4,384,963
Add (less): Adjustments as a result of a different treatment of extension and
termination options 1,481,786
Lease liabilities recognized on January 1, 2019 $ 5,866,749
The Group as lessor
The Group does not make any adjustments for leases in which it is a lessor, and it accounts for those
leases with the application of IFRS 16 starting from January 1, 2019.
The impact on assets, liabilities and equity as of January 1, 2019
With the application of IFRS 16, right-of-use assets and lease liabilities will increase by
$19,046,650 thousand and $5,866,749 thousand, and prepayments will decrease by $13,179,901
thousand on January 1, 2019.
b. The IFRS endorsed by the FSC for application starting from 2019
New IFRSs
Effective Date
Announced by IASB
Amendments to IFRS 3 “Definition of a Business” January 1, 2020 (Note 1)
Amendments to IAS 1 and IAS 8 “Definition of Material” January 1, 2020 (Note 2)
Note 1: The Group shall apply these amendments to business combinations for which the acquisition
date is on or after the beginning of the first annual reporting period beginning on or after
January 1, 2020 and to asset acquisitions that occur on or after the beginning of that period.
Note 2: The Group shall apply these amendments prospectively for annual reporting periods
beginning on or after January 1, 2020.

- 18 -
As of the date the consolidated financial statements were authorized for issue, the Group is
continuously assessing the possible impact that the application of the standards mentioned above and
interpretations will have on the Group’s financial position and financial performance, and will disclose
the relevant impact when the assessment is completed.
c. New IFRSs in issue but not yet endorsed and issued into effect by the FSC
New IFRSs
Effective Date
Announced by IASB (Note)
Amendments to IFRS 10 and IAS 28 “Sale or Contribution of Assets
between An Investor and Its Associate or Joint Venture”
To be determined by IASB
IFRS 17 “Insurance Contracts” January 1, 2021
Note: Unless stated otherwise, the above New IFRSs are effective for annual periods beginning on or
after their respective effective dates.
1) Amendments to IFRS 10 and IAS 28 “Sale or Contribution of Assets between an Investor and its
Associate or Joint Venture”
The amendments stipulated that, when the Group sells or contributes assets that constitute a
business (as defined in IFRS 3) to an associate, the gain or loss resulting from the transaction is
recognized in full. Also, when the Group loses control of a subsidiary that contains a business but
retains significant influence or joint control, the gain or loss resulting from the transaction is
recognized in full.
Conversely, when the Group sells or contributes assets that do not constitute a business to an
associate, the gain or loss resulting from the transaction is recognized only to the extent of the
Group’s interest as an unrelated investor in the associate, i.e. the Group’s share of the gain or loss is
eliminated. Also, when the Group loses control of a subsidiary that does not contain a business but
retains significant influence control in an associate, the gain or loss resulting from the transaction is
recognized only to the extent of the Group’s interest as an unrelated investor in the associate, i.e. the
Group’s share of the gain or loss is eliminated.
2) IFRS 17 “Insurance Contract”
IFRS 17 establishes the principle for the accounting treatment of insurance contracts and supersedes
IFRS 4 “Insurance Contract”. The principle is as follows:
Level of aggregation
An entity shall identify portfolios of insurance contracts. A portfolio comprises contracts that are
subject to similar risks and managed together. Contracts within a particular product line, such as
motor policies, are expected to have similar risks, and if they are managed together would be in the
same portfolio. For all issued insurance contracts in a portfolio, any entity shall divide it into:
a) A group of contracts that are onerous at initial recognition, if any;
b) A group of contracts that at initial recognition have no significant risk of becoming onerous, if
any, and
c) A group of the remaining contracts in the portfolio, if any.
An entity is permitted to divide portfolios into more groups than required above. However, groups
cannot include contracts issued more than one year apart.

- 19 -
Recognition
An entity shall recognize a group of insurance contracts it issues from the earliest of:
a) The beginning of the coverage period;
b) The date when the first payment from a policyholder becomes due; and
c) When the Group becomes onerous.
Measurement
On initial recognition, an entity shall measure a group of contracts at the total of the amount of
fulfilment cash flows (“FCF”) and the contractual service margin (“CSM”). FCF comprises the
estimate of future cash flow, an adjustment to reflect the time value of money and the financial risks
associated with the future cash flows and risk adjustment for non-financial risk. The CSM
represents the unearned profit the entity will recognize as it provides services in the future. This is
measured on initial recognition of a group of insurance contracts at an amount that, unless the
Group of contracts is onerous, results in no income or expenses arising from:
a) The initial recognition of an amount for the FCF;
b) The derecognition at that date of any asset or liability recognized for acquisition cash flows; and
c) The cash inflows and outflows arising from the contracts in the Group at that date.
Subsequent measurement
At the end of each subsequent reporting period, the carrying amount of a group of insurance
contracts is remeasured to be the sum of the liability for remaining coverage and the liability for
incurred claims, both determined as at that date.
Onerous contracts
An insurance contract is onerous at initial recognition if the total of the FCF, any preciously
recognized acquisition cash flows and any cash flows arising from the contract at that date is a net
outflow. An entity shall recognize a loss in profit or loss for the net outflow, resulting in the
carrying amount of the liability for the Group being equal to the FCF and the CSM of the Group
being zero. The CSM cannot increase and no revenue can be recognized, until the onerous amount
previously recognized has been reversed in profit or loss as part of a service expense.
Premium allocation approach
An entity may simplify the measurement of the liability for remaining coverage of a group of
insurance contracts using the premium allocation approach (PAA) on the condition that:
a) The entity reasonably expects the that this will be an approximation of General Model; or
b) Contracts with a coverage period of one year or less are eligible for PAA.
If at the inception of the Group, an entity expects significant variance in the FCF during the period
before a claim is incurred, such contracts are not eligible to condition (a).

- 20 -
Using the RAA, the liability for remaining coverage shall be initially recognized at the premiums, if
any, received at initial recognition, minus any insurance acquisition cash flows. This is
subsequently adjusted for change in the composition of the Group and amortization of acquisition
cash flows and reduced over the coverage period with the reduction recorded as revenue, excluding
any investment component paid or transferred to the liability for incurred claims.
Investment contracts with a discretionary participation feature
An investment contract with a discretionary participation feature (DPF) is a financial instrument and
it does not include a transfer of significant insurance risk. It is in the scope of IFRS 17 only if the
issuer also issues insurance contracts.
Modification and derecognition
If the terms of an insurance contract are modified, an entity shall derecognize the original contract
and recognize the modified contract as a new contract if there is a substantive modification, based
on meeting any of the specified criteria.
An entity shall de-recognize an insurance contract when it is extinguished or substantially modified.
Transition
An entity shall apply IFRS 17 retrospectively unless impracticable, in which case entities have the
option of using either the modified retrospective approach or the fair value approach.
Under the modified retrospective approach, an entity shall utilize reasonable and supportable
information and maximize the use of information that would have been used to apply a full
retrospective approach, but need only use information available without undue cost or effort. Fair
value approach shall be used if the information is not reasonable and supportable information.
Under the fair value approach, an entity determines the CSM at the transition date as the difference
between the fair value of a group of insurance contracts at that date and the FCF measured at that
date.
Except for the above impact, as of the date the consolidated financial statements were authorized for
issue, the Group is continuously assessing the possible impact that the application of other standards
and interpretations will have on the Group’s financial position and financial performance, and will
disclose the relevant impact when the assessment is completed.
4. SUMMARY OF SIGNIFICANT ACCOUNTING POLICIES
Statement of Compliance
The accompanying consolidated financial statements have been prepared in conformity with Regulations
Governing the Preparation of Financial Reports by Financial Holding Companies, Regulations Governing
the Preparation of Financial Reports by Public Banks, Regulations Governing the Preparation of Financial
Reports by Securities Firms, Regulations Governing the Preparation of Financial Reporting by Futures
Commission Merchants, Regulations Governing the Preparation of Financial Reports by Securities Issuers,
Regulations Governing the Preparation of Financial Reports by Insurance Enterprises and IAS 34 “Interim
Financial Reporting” endorsed by the FSC. Disclosure information included in the interim financial report
is less than disclosures required in a full set of annual financial reports.

- 21 -
Basis of Preparation
The consolidated financial statements have been prepared on the historical cost basis except for financial
instruments that are measured at fair value and net defined benefit liabilities which are measured at the
present value of the defined benefit obligation less the fair value of plan assets. Historical cost is generally
based on the fair value of the consideration given in exchange for assets.
All the consolidated accounts in the financial statements were categorized according to the nature of each
account and sequenced by their liquidity rather than classified as current or noncurrent assets/liabilities.
Principles for Preparing Consolidated Financial Statements
The compiling entity of the consolidated financial report includes the Group. All significant intra-group
transactions, balances, and unrealized income and expenses are eliminated in full upon consolidation.
The accounting policies of the subsidiary are applied consistently with the Corporation.
The functional currency of the Corporation is the New Taiwan dollar, and the consolidated financial
statements are presented in New Taiwan dollars.
As of June 30, 2019, December 31, 2018 and June 30, 2018, the consolidated entities included in the
consolidated financial statements included 63, 63 and 65 companies, respectively (please refer to the
attached Table 8).
Financial Instruments
Financial assets and financial liabilities are recognized when the Group becomes a party to the contractual
provisions of the instruments. Investment in associates measured by fair value through profit or loss are
recognized as financial assets at fair value through profit or loss and the change in fair value is recognized
in profit or loss.
Financial assets and financial liabilities are initially measured at fair value. Transaction costs that are
directly attributable to the acquisition or issue of financial assets and financial liabilities (other than
financial assets and financial liabilities at fair value through profit or loss) are added to or deducted from
the fair value of the financial assets or financial liabilities, as appropriate, on initial recognition. Transaction
costs directly attributable to the acquisition of financial assets or financial liabilities at fair value through
profit or loss are recognized immediately in profit or loss.
Financial assets and liabilities
All regular way purchases or sales of financial assets and liabilities are recognized and derecognized on a
trade date basis. Regular way purchases or sales are purchases or sales of financial assets that require
delivery of assets within the time frame established by regulation or convention in the marketplace.
a. Measurement category
Financial assets are classified into the following categories: Financial assets at FVTPL, financial assets
at amortized cost, investments in debt instruments at FVTOCI and investments in equity instruments at
FVTOCI.

- 22 -
1) Financial assets or liabilities at FVTPL
Financial assets or liabilities are classified as at FVTPL when such financial assets or liabilities are
mandatorily classified or designated as at FVTPL. Financial assets or liabilities mandatorily
classified as at FVTPL include investments in equity instruments which are not designated as at
FVTOCI and debt instruments that do not meet the amortized cost criteria or the FVTOCI criteria.
A financial asset or liability may be designated as at FVTPL upon initial recognition if such
designation eliminates or significantly reduces a measurement or recognition inconsistency that
would otherwise arise.
Financial assets at FVTPL are subsequently measured at fair value, with any gains or losses arising
on remeasurement recognized in profit or loss. The net gain or loss recognized in profit or loss
incorporates any dividends or interest earned on such a financial asset. Fair value is determined in
the manner described in Note 54.
2) Financial assets at amortized cost
Financial assets that meet the following conditions are subsequently measured at amortized cost:
a) The financial asset is held within a business model whose objective is to hold financial assets in
order to collect contractual cash flows; and
b) The contractual terms of the financial asset give rise on specified dates to cash flows that are
solely payments of principal and interest on the principal amount outstanding.
Subsequent to initial recognition, financial assets at amortized cost are measured at amortized cost,
which equals the gross carrying amount determined using the effective interest method less any
impairment loss. Exchange differences are recognized in profit or loss.
Interest income is calculated by applying the effective interest rate to the gross carrying amount of
such a financial asset, except for:
a) Purchased or originated credit-impaired financial assets, for which interest income is calculated
by applying the credit-adjusted effective interest rate to the amortized cost of such financial
assets; and
b) Financial assets that are not credit-impaired on purchase or origination but have subsequently
become credit-impaired, for which interest income is calculated by applying the effective
interest rate to the amortized cost of such financial assets in subsequent reporting periods.
Cash equivalents include time deposits that can be terminated on demand without reducing principal
and short term investments which are highly liquid, readily convertible to a known amount of cash
and are subject to an insignificant risk of changes in value.
3) Investments in debt instruments at FVTOCI
Debt instruments that meet the following conditions are subsequently measured at FVTOCI:
a) The debt instrument is held within a business model whose objective is achieved by both the
collecting of contractual cash flows and the selling of such financial assets; and
b) The contractual terms of the debt instrument give rise on specified dates to cash flows that are
solely payments of principal and interest on the principal amount outstanding.

- 23 -
Investments in debt instruments at FVTOCI are subsequently measured at fair value. Changes in the
carrying amounts of these debt instruments relating to changes in foreign currency exchange rates,
interest income calculated using the effective interest method and impairment losses or reversals are
recognized in profit or loss. Other changes in the carrying amount of these debt instruments are
recognized in other comprehensive income and will be reclassified to
profit or loss when the investment is disposed of.
4) Investments in equity instruments at FVTOCI
On initial recognition, the Group may make an irrevocable election to designate investments in
equity instruments as at FVTOCI. Designation as at FVTOCI is not permitted if the equity
investment is held for trading or if it is contingent consideration recognized by an acquirer in a
business combination.
Investments in equity instruments at FVTOCI are subsequently measured at fair value with gains
and losses arising from changes in fair value recognized in other comprehensive income and
accumulated in other equity. The cumulative gain or loss will not be reclassified to profit or loss on
disposal of the equity investments; instead, it will be transferred to retained earnings.
Dividends on these investments in equity instruments are recognized in profit or loss when the
Group’s right to receive the dividends is established, unless the dividends clearly represent a
recovery of part of the cost of the investment.
b. Impairment of financial assets
The Group recognizes a loss allowance for expected credit losses on financial assets at amortized cost
and investments in debt instruments that are measured at FVTOCI.
For financial instruments, the Group recognizes lifetime ECLs when there has been a significant
increase in credit risk since initial recognition. If, on the other hand, the credit risk on a financial
instrument has not increased significantly since initial recognition, the Group measures the loss
allowance for that financial instrument at an amount equal to 12-month ECLs.
Expected credit losses reflect the weighted average of credit losses with the respective risks of default
occurring as the weights. Lifetime ECLs represent the expected credit losses that will result from all
possible default events over the expected life of a financial instrument. In contrast, 12-month ECLs
represent the portion of lifetime ECLs that is expected to result from default events on a financial
instrument that are possible within 12 months after the reporting date.
The Group recognizes an impairment gain or loss in profit or loss for all financial instruments with a
corresponding adjustment to their carrying amount through a loss allowance account, except for
investments in debt instruments that are measured at FVTOCI, for which the loss allowance is
recognized in other comprehensive income and does not reduce the carrying amount of such a financial
asset.
Based on the Regulations Governing the Procedures for Banking Institutions to Evaluate Assets and
Deal with Non-performing/Non-accrual loans, credit assets classified as normal (this balance should be
net of the balance of borrowings by ROC government agencies from the Bank), special mention,
substandard, with doubtful collectability and uncollectable or loss incurring are evaluated on the basis
of the borrowers’/clients’ financial condition and delinquency record on interest payments.
These assets have allowances at 1%, 2%, 10%, 50% and 100%, respectively, of outstanding credit. The
doubtful accounts of credit cards receivables are evaluated on the basis of Regulations Governing
Institutions Engaging In Credit Card Business. The minimum allowance for credit assets on or off
balance sheet is equal to the book value of the above listed.

- 24 -
Based on the Order No. 10300329440 issued by the FSC, for the Bank to have an enhanced risk
coverage toward collateral and exposures in Mainland China, the minimum provision for the loan loss
reserve is 1.5% of the mortgage and construction loans that have been classified as normal assets before
2016. Based on the Order No. 10410001840 issued by the FSC, for the Bank to have an enhanced
control of the exposure to the risk in Mainland China, the minimum provision for the credit loss reserve
is 1.5% of the credit include short-term trade finance that were granted to companies based in Mainland
China before 2015 and classified as normal assets.
Credit deemed uncollectable may be written off under the approval of the board of directors.
In accordance with the regulation of “Guidelines for Handling Assessment of Assets, Loans Overdue,
Receivable on Demand and Bad Debts by Insurance Enterprises”, China Life is required to record the
minimum amounts based upon each of the following category for allowance of uncollectible accounts:
1) Total amount of 0.5% of the ending balance for the first category of loan assets excluding life
insurance loans, automatic premium loans and holding government debts, 2% of the ending balance
for the second category of loan assets that should be paid attention, 10% of the ending balance for
the third category of loan assets that are expected to recover, 50% of the ending balance for the
fourth category of loan assets that are difficult to recover and 100% of the ending balance for the
fifth category of loan assets that are not expected to recover are aggregated.
2) 1% of the ending balance for all the five categories of loan assets excluding life insurance loans,
automatic premium loans and holding government debts.
3) Total unsecured portion of loans overdue and receivable on demand.
4) If total amount of minimum allowance of uncollectible accounts measured from the categories
above are less than the amount in accordance with GAAP, it should refer to the amount in
accordance with GAAP as minimum allowance of uncollectible accounts. If the authorities in order
to increase the ability to bear the loss of specific loan asset and demand the Group to increase the
allowance for bad debts of specific loan assets according to the criteria and time limit specified by
them, the Group shall cooperate with it.
To strengthen the ability to bear the loss of specific loan assets, the authority may, if necessary, require
the Company to raise loan loss provision for specific loan assets in specified criteria and deadlines.
Insurance Liabilities and Reserve for Insurance Contracts with Feature of Financial Instruments
China Life Insurance’s reserved funds for insurance contracts and financial instruments whether with or
without discretionary participation feature are made in accordance with “Regulations Governing the Setting
Aside of Various Reserves by Insurance Enterprises.” Furthermore, they have been validated by the
certified actuarial professionals approved by Financial Supervisory Commission. The required amount to be
reserved for short-term group insurance is based upon the greater of premium received or calculated
premium following the Order No. Financial Supervisory-Insurance-Corporate-852367814. Reserved
amount for the rest of other provisions is addressed below:
Moreover, China Life Insurance’s insurance contract with discretionary participation feature is classified as
liability.
a. Unearned premium reserve
For the insurance policy whose term is within one year and has not met the due date or for the injury
insurance policy whose term is over one year, the amount of reserve required is based upon the
unexpired risk calculation.

- 25 -
b. Reserve for claims
It is a reserve mainly for the reported but not paid claims and unreported claims. The reported but not
paid claims reserve is assessed based on relevant information of each case and the amount deposited is
further classified by the type of insurance. Unreported claims reserve is calculated and deposited based
on the past experiences and expenses occurred and in accordance with the actuarial principles.
c. Reserve for life insurance liabilities
Based on the life table and projected interest rates in the manual provided by the authority for each type
of insurance, the dollar amount of life insurance reserve is calculated and deposited according to the
calculation method listing on Article 12 of “Regulations Governing the Setting Aside of Various
Reserves by Insurance Enterprises” and the manual published by each authority of insurance products.
Starting from policy year of 2003, for valid insurance contract whose dividend calculation is stipulated
by the Order No. Financial Supervisory-Insurance-Corporate-800484251, the downward adjustments of
dividend due to the offset between mortality saving (loss) and loss (gain) from difference of interest
rates should be recognized and recorded as the increase of reserve for long-term valid contract.
d. Special reserve
1) For the retained businesses with policy period within 1 year, the special reserve is classified into 2
categories, “Special Capital Reserve - Special Reserve for Major Incidents” and “Special Capital
Reserve - Special Reserve for Fluctuation of Risks.” The dollar amount of reserve required is
addressed as follows:
a) Special capital reserve - Special reserve for major incidents
All types of insurance should follow the special catastrophe reserve rates set by authorities.
Upon occurrence of the catastrophic events, actual claims on retained business in excess of
NT$30,000 thousand can be withdrawn from the reserve. If the reserve has been set aside for
over 15 years, China Life Insurance could have its plan of the recovering process of the reserve
assessed by certified actuaries and submit the plan to the authority for reference.
b) Special capital reserve - Special reserve for fluctuation of risks
When the actual amount paid for indemnity minus the offsetting amount from special reserve
for major incidents is less than the anticipated dollar amount need to be paid, the 15% of this
difference should be reserved in special reserve for fluctuation of risks. When the actual amount
paid for indemnity minus the offsetting amount from special reserve for major incidents is
greater than the anticipated dollar amount need to be paid, the exceeded amount can be used to
write down the special reserve for fluctuation of risks. If the special reserve for fluctuation of
risks for specified type of insurance is not enough to be written down, special reserve for
fluctuation of risks for other types of insurance can be used. Also, the type of insurance and
total dollar amount written-down should be reported to the authority for inspection purpose.
When accumulative dollar amount of special reserve for fluctuation of risks exceeds 30% of
self-retention earned premium within one year, the exceeded amount will be recovered.
For special reserves for major incidents and special reserve for fluctuation of risks addressed
previously, the balance of the annual reserve net of tax, the post-tax amount of appropriated and
written-down or recovery would be recorded in the special capital reserve under equity.

- 26 -
2) China Life Insurance sells participating life insurance policy. According to the “Rule Governing
application of revenue and expenses related to participating/non-participating policy”, the Company
is required to set aside special reserve for dividend participation based on income before tax and
dividend. On the date of declaration, dividend should be withdrawn from this account. The excess
dividend should be accounted as special reserve for dividend risks. Additionally, the effects of the
gain or loss from disposal of participating life insurance policy approved as equity instrument
investments at fair value through other comprehensive income shall transfer directly into special
reserve based on income before tax and dividend. If the special reserve is a negative amount, the
Company shall set aside the same amount of special reserve.
e. Premium deficiency reserve
For the contracts over one year of life, health, or annuities insurance commencing on January 1, 2001,
the following rules apply: When the gross premium is less than the valuation net premium, a deficiency
reserve is required to be set aside with the value of an annuity, the amount of which shall equal the
difference between such premiums and the term of which in years shall equal the number of future
annual payments due on such insurance at the date of the valuation.
In addition, for the insurance policy which period is within one year and has not met the due date or
accidental insurance policy over one year, the following rules apply: If the probable indemnities and
expenses are greater than the aggregate of unearned premium reserves and collectable premiums in the
future, the premium deficiency reserve is set aside based on the difference thereof.
f. Other reserve
Pursuant to IFRS 3 “Business Combination”, the Company shall set aside other reserve for identifiable
assets required and liabilities assumed recorded at fair value in order to reflect the fair value of the
insurance contract assumed.
g. Liability adequacy reserve
This is the reserve that is set aside based on the adequacy test of liability required by IFRS 4 Insurance
Contracts.
h. Reserves for insurance contracts with feature of financial instruments
Financial products without discretionary participation features follows “Regulations Governing the
Setting Aside of Various Reserves by Insurance Enterprises” and Depository Accounting.
Except for the following description, the accounting policies of the consolidated financial statements are
applied consistently with the consolidated statement for the year ended December 31, 2018.
Retirement Benefit Costs
Pension cost for an interim period is calculated on a year-to-date basis by using the actuarially determined
pension cost rate at the end of the prior financial year, adjusted for significant market fluctuations since that
time and for significant plan amendments, settlements, or other significant one-off events.
Taxation
Income tax expense represents the sum of the tax currently payable and deferred tax. Interim period income
taxes are assessed on an annual basis and calculated by applying to an interim period’s pre-tax income the
tax rate that would be applicable to expected total annual earnings. The effect of a change in tax rate
resulting from a change in tax law is recognized consistent with the accounting for the transaction itself
which gives rise to the tax consequence, and is recognized in profit or loss, other comprehensive income or
directly in equity in full in the period in which the change in tax rate occurs.

- 27 -
Leases
2019
At the inception of a contract, the Group assesses whether the contract is (or contains) a lease.
For a contract that contains a lease component and non-lease components, the Group allocates the
consideration in the contract to each component on the basis of the relative stand-alone price and accounts
for each component separately.
a. The Group as lessor
Leases are classified as finance leases whenever the terms of a lease transfer substantially all the risks
and rewards of ownership to the lessee. All other leases are classified as operating leases.
Under finance leases, the net investment in a lease is measured at (a) the present value of the sum of the
lease payments receivable by a lessor and any unguaranteed residual value accrued to the lessor plus (b)
initial direct costs and is presented as a finance lease receivable. Finance lease income is allocated to
the relevant accounting periods so as to reflect a constant, periodic rate of return on the Group’s net
investment outstanding in respect of leases.
Lease payments less any lease incentives payable from operating leases are recognized as income on a
straight-line basis over the terms of the relevant leases.
b. The Group as lessee
The Group recognizes right-of-use assets and lease liabilities for all leases at the commencement date of
a lease, except for short-term leases and low-value asset leases accounted for applying a recognition
exemption where lease payments are recognized as expenses on a straight-line basis over the lease
terms.
Right-of-use assets are initially measured at cost, which comprises the initial measurement of lease
liabilities adjusted for lease payments made at or before the commencement date, plus any initial direct
costs incurred and an estimate of costs needed to restore the underlying assets, and less any lease
incentives received. Right-of-use assets are subsequently measured at cost less accumulated
depreciation and impairment losses and adjusted for any remeasurement of the lease liabilities.
Right-of-use assets are presented on a separate line in the consolidated balance sheets.
Right-of-use assets are depreciated using the straight-line method from the commencement dates to the
earlier of the end of the useful lives of the right-of-use assets or the end of the lease terms. However, if
leases transfer ownership of the underlying assets to the Group by the end of the lease terms or if the
costs of right-of-use assets reflect that the Group will exercise a purchase option, the Group depreciates
the right-of-use assets from the commencement dates to the end of the useful lives of the underlying
assets.
Lease liabilities are initially measured at the present value of the lease payments. If that rate cannot be
readily determined, the Group uses the lessee’s incremental borrowing rate.
Subsequently, lease liabilities are measured at amortized cost using the effective interest method, with
interest expense recognized over the lease terms. When there is a change in a lease term, a change in the
assessment of an option to purchase an underlying asset, or a change in future lease payments resulting
from a change in an index or a rate used to determine those payments, the Group remeasures the lease
liabilities with a corresponding adjustment to the right-of-use-assets. However, if the carrying amount
of the right-of-use assets is reduced to zero, any remaining amount of the remeasurement is recognized
in profit or loss. Lease liabilities are presented on a separate line in the consolidated balance sheets.

- 28 -
5. CRITICAL ACCOUNTING JUDGMENTS AND KEY SOURCES OF ESTIMATION
UNCERTAINTY
In the application of the Group’s accounting policies, which are described in Note 4, management is
required to make judgments, estimates and assumptions about the carrying amounts of assets and liabilities
that are not readily apparent from other sources. The estimates and associated assumptions are based on
historical experience and other factors that are considered relevant. Actual results may differ from these
estimates.
The estimates and underlying assumptions are reviewed on an ongoing basis. Revisions to accounting
estimates are recognized in the period in which the estimate is revised if the revision affects only that period
or in the period of the revision and future periods if the revision affects both current and future periods.
a. Impairment of discounts, loans, receivables, loan commitments and provisions
The management regularly reviews portfolios of loans and receivables, loan commitments and
provisions to assess impairment. To determine whether an impairment loss should be recognized, the
management assesses whether there has been a significant increase in credit risk or credit impairment
has already occurred. When analyzing expected future cash flows, the management takes into account
past events, present condition and future economic circumstances of the assets with similar credit risks.
The management also regularly reviews the methodology and assumptions adopted for both expected
future cash flows and their timing to decrease the difference between estimated and actual amount of
impairment loss.
b. Assessment of insurance liabilities and liability adequacy reserve
Management uses actuarial model and several material assumptions when assessing the insurance
liabilities and liability adequacy reserve. The assumptions were based on the principles embodied in the
relevant laws and regulations, which cover the unique risk exposure, product characteristics and
experiences from target markets of China Life Insurance. The assessment of liability adequacy reserve
is in compliance with the relevant norms promulgated by The Actuarial Institute of the Republic of
China. When China Life Insurance assesses the liability adequacy reserve, the estimated present value
of future cash flows of insurance contracts is based on reasonable estimate of future insurance
payments, premium income and related expenses.
c. Fair value measurement of financial products with no quoted market prices in an active market
Management uses valuation model or refers to the available quotations from other financial institutions
in determining the fair value of financial products with no quoted market prices in an active market.
Parameters used in valuation model include adjusted observable inputs and unobservable inputs, which
involve material managerial estimation and judgement.

- 29 -
6. CASH AND CASH EQUIVALENTS
June 30,
2019
December 31,
2018
June 30,
2018
Cash in banks $ 46,127,097 $ 48,315,132 $ 60,792,939
Due from banks 6,864,551 3,922,906 5,697,967
Short-term notes 2,309,233 3,366,859 2,929,347
Cash on hand 1,623,725 1,734,504 1,520,355
Future excess margin 864,548 1,516,523 1,406,694
Check for clearing 556,190 751,499 640,742
$ 58,345,344 $ 59,607,423 $ 72,988,044
Cash and cash equivalents as of December 31, 2018 as shown in the consolidated statement of cash flows
can be reconciled to the related items in the balance sheets as follows; please refer to the consolidated
statement of cash flows for the reconciliation information as of June 30, 2019 and 2018:
December 31,
2018
Cash and cash equivalents in consolidated balance sheet $ 59,607,423
Due from the Central Bank and call loans to banks which qualify as cash and cash
equivalents as defined of in IAS 7 15,117,176
Securities purchased under agreements to resell which qualify as cash and cash
equivalents as defined of in IAS 7 39,770,534
Cash and cash equivalents in consolidated statement of cash flow $ 114,495,133
7. DUE FROM THE CENTRAL BANK AND CALL LOANS TO FINANCIAL INSTITUTIONS
June 30,
2019
December 31,
2018
June 30,
2018
Call loans to financial institutions $ 19,080,359 $ 6,643,433 $ 12,613,859
Deposit reserve - demand accounts 9,388,256 8,854,579 8,448,043
Deposit reserve - checking accounts 5,146,666 9,467,197 5,659,144
Due from the Central Bank - interbank settlement
funds 1,300,191 1,300,216 701,382
Deposit reserve - foreign currencies 167,789 165,958 164,700
Due from the Central Bank - - 3,500,000
$ 35,083,261 $ 26,431,383 $ 31,087,128
Under a directive issued by the Central Bank of the ROC, New Taiwan dollar (NTD) - denominated deposit
reserve is determined monthly at prescribed rates based on average balance of the Bank’s deposits. Deposit
reserve - demand account should not be used, except for adjusting the deposit reserve account monthly.
In addition, separate foreign-currency deposit reserves are determined at prescribed rates based on balances
of foreign-currency deposits. These reserves may be withdrawn anytime at no interest.
For the certificates of deposit issued by the Central Bank of the ROC and pledged as collateral for day-term
overdraft, please refer to Note 49.

- 30 -
8. FINANCIAL ASSETS AT FAIR VALUE THROUGH PROFIT OR LOSS
June 30,
2019
December 31,
2018
June 30,
2018
Financial assets mandatorily classified as at
FVTPL
Derivative financial instrument
Interest rate swap contracts $ 29,491,251 $ 14,276,585 $ 16,043,266
Currency swap and forward exchange contracts 11,321,517 9,911,136 26,986,048
Option and futures contracts 4,817,832 4,143,945 5,377,707
Others 2,160,981 1,423,617 932,878
Non-derivative financial assets
Shares 141,449,772 108,988,496 147,921,348
Mutual funds 94,527,733 44,986,204 21,595,605
Operating securities (Note 9) 54,958,739 51,128,316 63,806,006
Bank debentures 41,860,468 53,166,795 38,598,965
Corporate bonds 17,095,211 13,439,633 13,435,584
Commercial papers 9,905,624 7,020,871 16,816,178
Others 18,983,010 17,188,833 18,672,550
426,572,138 325,674,431 370,186,135
Financial assets designated as at FVTPL
Government bonds 18,657,942 20,515,907 7,088,858
Others 28,699,678 28,740,696 25,640,735
47,357,620 49,256,603 32,729,593
Financial assets at FVTPL $ 473,929,758 $ 374,931,034 $ 402,915,728
Financial liabilities held for trading
Derivative financial instrument
Interest rate swap contracts $ 29,143,743 $ 16,967,047 $ 17,482,101
Option and futures contracts 16,531,387 22,123,276 22,718,490
Currency swap and forward exchange contracts 13,059,433 8,882,350 38,456,314
Others 4,246,046 2,870,703 9,614,514
Non-derivative financial liabilities
Borrowed securities payable 3,689,590 4,339,043 4,681,662
Others 1,306,995 402,286 397,305
67,977,194 55,584,705 93,350,386
Financial liabilities designated as at FVTPL
Bank debentures payable 30,420,898 27,131,475 26,936,416
Structured products 3,890,684 3,155,241 893,486
Others 1,017,107 1,915,304 2,347,259
35,328,689 32,202,020 30,177,161
Financial liabilities at FVTPL $ 103,305,883 $ 87,786,725 $ 123,527,547

- 31 -
As of June 30, 2019, December 31, 2018 and June 30, 2018, bank debentures issued by the Group
designated as at FVTPL were as follows:
Bank Debenture
Number
June 30,
2019
December 31,
2018
June 30,
2018 Issuance Period
Method of Paying
Principles and Interests
Interest
Rate
15KGIB1 $ 3,293,632 $ 3,257,698 $ 3,233,000 March 24, 2015 - March 24, 2045
(Note 1)
Principal due on maturity 0%
P16KGIB1 3,417,920 3,380,630 3,355,000 May 3, 2016 - May 3, 2046
(Note 2)
Principal due on maturity 0%
P16KGIB2 3,417,920 3,380,630 3,355,000 May 27, 2016 - May 27, 2046
(Note 2)
Principal due on maturity 0%
P16KGIB3 2,485,760 2,458,640 2,440,000 November 8, 2016 - November 8,
2046 (Note 1)
Principal due on maturity 0%
P17KGIB1 6,214,400 6,146,600 6,100,000 January 23, 2017 - January 23, 2047
(Note 1)
Principal due on maturity 0%
P18KGIB1 6,214,400 6,146,600 6,100,000 January 30, 2018 - January 30, 2048
(Note 3)
Principal due on maturity 0%
P18KGIB2 4,971,520 4,917,280 4,880,000 February 27, 2018 - February 27,
2048 (Note 3)
Principal due on maturity 0%
30,015,552 29,688,078 29,463,000 Valuation adjustments 405,346 (2,556,603 ) (2,526,584 )
$ 30,420,898 $ 27,131,475 $ 26,936,416
Note 1: Based on 100% of the carrying value of each bond principal plus the interest; the Bank may
redeem all the debentures after two years from the issue date (inclusive).
Note 2: Based on 100% of the carrying value of each bond principal plus the interest; the Bank may
redeem all the debentures after one year from the issue date (inclusive).
Note 3: Based on 100% of the carrying value of each bond principal plus the interest; the Bank may
redeem all the debentures after five years from the issue date (inclusive).
China Life Insurance elected to adopt the overlay approach in expressing financial assets designated as at
FVTPL under IFRS 4 “Insurance Contracts” starting from application of IFRS 9 in 2018. Investment of
financial assets relating insurance contracts issued by China Life Insurance designated as at adoption of the
overlay approach financial assets were as follows:
Financial assets mandatorily classified as at FVTPL
June 30,
2019
December 31,
2018
June 30,
2018
Share $ 132,931,522 $ 101,694,025 $ 133,829,937
Mutual funds 93,718,555 43,632,536 20,207,752
Bank debentures 41,053,764 52,914,479 37,607,651
Corporate bonds 16,122,478 12,961,579 12,840,324
$ 283,826,319 $ 211,202,619 $ 204,485,664

- 32 -
For the three and six months ended June 30, 2019 and 2018, reclassification amount under profit or loss and
other comprehensive income of designated as at adoption of the overlay approach financial assets is
described as follows:
For the Three Months Ended
June 30 For the Six Months Ended
June 30
2019 2018 2019 2018
Gain (loss) on application of
IFRS 9 $ 9,905,715 $ (838,173) $ 26,195,791 $ 788,833
Loss (gain) on application of
IAS 39 (6,056,845) (3,638,282) (8,386,820) (7,460,445)
Gain (loss) on reclassification using
the overlay approach $ 3,848,870 $ (4,476,455) $ 17,808,971 $ (6,671,612)
Due to the adjustment of the overlay approach, gain on financial assets measured at FVTPL decreased from
$4,437,123 thousand to $588,253 thousand for the three months ended June 30, 2019; loss on financial
assets measured at FVTPL decrease from $31,606,832 thousand to $27,130,377 thousand for the three
months ended June 30, 2018. Gain on financial assets measured at FVTPL decreased from $16,570,615
thousand to loss on $1,238,356 thousand for the six months ended June 30, 2019; loss on financial assets
measured at FVTPL decreased from $15,762,495 thousand to $9,090,883 thousand for the six months
ended June 30, 2018.
The contract (nominal) amounts of the Group’s outstanding derivative financial instruments as of June 30,
2019, December 31, 2018 and June 30, 2018 are summarized as follows:
June 30,
2019
December 31,
2018
June 30,
2018
Currency swap and forward exchange
contracts $ 1,943,127,693 $ 2,083,698,557 $ 2,152,287,071
Interest rate swap contracts 1,672,968,190 1,302,045,596 1,207,164,801
Options and futures contracts 646,619,522 744,617,319 791,789,498
Non-deliverable forward contracts 341,206,308 240,344,692 225,016,701
Cross-currency swap contracts 27,150,640 32,681,055 30,953,994
Assets swap contracts 11,843,716 27,162,701 11,834,800
Structured note contracts 8,350,004 7,205,434 14,031,164
Credit default swap contracts 2,358,394 2,959,775 6,477,346
Commodity swap contracts 791,860 964,180 728,450
Equity derivative financial contracts 67,843 123,291 174,123
As of June 30, 2019, December 31, 2018 and June 30, 2018, financial assets at fair value through profit or
loss with aggregate carrying values of $47,402,099 thousand, $47,273,587 thousand and $44,225,885
thousand, respectively, had been sold under repurchase agreements (recognized as notes and bonds issued
under repurchase agreements).
The Group signed a trust contract with China Trust Commercial Bank (CTBC) in August 2015, entrusting
shares of Capital Securities Corporation to them. The trustee deals with the shares in accordance with the
contract during the contract period. The shares of Capital Securities Corporation held by CDIB Capital
Group have been fully disposed in August 2017.
For the information on financial instruments at fair value through profit or loss pledged as collateral for the
Group, please refer to Note 49.

- 33 -
9. OPERATING SECURITIES
June 30,
2019
December 31,
2018
June 30,
2018
Dealing
Overseas securities $ 28,819,429 $ 25,976,409 $ 29,171,042
Corporate bonds 8,822,956 8,433,846 8,460,891
Government bonds 5,616,318 8,038,635 11,572,248
Listed, OTC and emerging market stock 3,380,269 2,376,519 3,973,307
Others 2,381,180 1,337,879 4,240,251
49,020,152 46,163,288 57,417,739
Underwriting
Listed and OTC stock 554,939 46,981 147,815
Corporate bonds 429,185 486,298 514,587
Others - - 84,070
984,124 533,279 746,472
Hedge positions
Mutual funds 2,444,546 2,085,719 979,563
Listed and OTC stock 2,355,300 2,129,947 4,502,144
Others 154,617 216,083 160,088
4,954,463 4,431,749 5,641,795
$ 54,958,739 $ 51,128,316 $ 63,806,006
10. FINANCIAL ASSETS AT FAIR VALUE THROUGH OTHER COMPREHENSIVE INCOME
June 30,
2019
December 31,
2018
June 30,
2018
Investments in debt instruments at FVTOCI
Government bonds $ 168,091,177 $ 185,779,230 $ 176,455,765
Bank debentures 132,606,422 103,734,454 110,318,415
Corporate bonds 125,112,499 118,547,705 91,901,991
Negotiable certificates of deposit 54,060,962 48,698,585 40,365,608
Less: Security deposit (9,865) (9,861) (12,023)
479,861,195 456,750,113 419,029,756
Investments in equity instruments at FVTOCI
Common stocks 28,594,365 17,050,968 20,027,898
Preferred stocks 11,717,126 11,534,853 8,139,720
40,311,491 28,585,821 28,167,618
$ 520,172,686 $ 485,335,934 $ 447,197,374
a. Investments in debt instruments at FVTOCI
As of June 30, 2019, December 31, 2018 and June 30, 2018, investments in debt instruments at
FVTOCI, with aggregate carrying values of $50,303,738 thousand, $62,699,207 thousand and
$61,695,775 thousand had been sold under repurchase agreements (recognized as notes and bonds
issued under repurchase agreements).
For the information on investments in debt instruments at FVTOCI pledged as collateral for the Group,
please refer to Note 49.

- 34 -
For the information regarding credit risk analysis and assessment of impairment on investments in debt
instruments at FVTOCI, please refer to Note 56.
b. Investments in equity instruments at FVTOCI
For the six months ended June 30, 2019 and 2018, the Group sold its shares in order to manage its
investment portfolio. The sold shares had a fair value of $1,938,782 thousand and $2,611,053 thousand,
respectively. The Group transferred a gain of $145,574 thousand, $100,144 thousand from other equity
related-unrealized gain on financial assets at fair value through other comprehensive income to retained
earnings.
For the three and six months ended June 30, 2019 and 2018, dividend income for $113,826 thousand,
$147,335 thousand, $124,178 thousand and $157,345 thousand, respectively, which were both related
to investments held at the end of the reporting period.
There are no any investments in equity instruments at FVTOCI pledged as collateral for the Group.
11. FINANCIAL ASSETS AT AMORTIZED COST
June 30,
2019
December 31,
2018
June 30,
2018
Bank debentures $ 588,358,891 $ 554,605,427 $ 533,045,320
Corporate bonds 287,177,433 265,513,453 238,995,803
Government bonds 96,209,421 91,516,528 74,242,300
Others 59,374,965 58,900,871 59,287,613
$ 1,031,120,710 $ 970,536,279 $ 905,571,036
As of June 30, 2019, December 31, 2018 and June 30, 2018, investments in debt instruments at amortized
cost, with aggregate carrying values of $279,648 thousand, $291,964 thousand and $268,400 thousand had
been sold under repurchase agreements (recognized as notes and bonds issued under repurchase
agreements).
There are no any investments in debt instruments at amortized cost that are pledged as collateral for the
Group.
For the information regarding credit risk analysis and assessment of impairment on investments in debt
instruments at amortized cost, please refer to Note 56.

- 35 -
12. SECURITIES PURCHASED UNDER RESELL AGREEMENTS
June 30,
2019
December 31,
2018
June 30,
2018
Corporate bonds $ 17,735,962 $ 15,196,326 $ 16,079,923
Commercial papers 11,144,213 10,244,264 10,497,894
Government bonds 10,371,101 6,589,991 24,454,098
Bank debentures 8,231,120 6,689,953 6,062,633
Negotiable certificates of deposit - 1,050,000 350,089
$ 47,482,396 $ 39,770,534 $ 57,444,637
Resold amounts $ 47,516,721 $ 39,819,654 $ 57,455,579
Last maturity date August 2019 January 2019 October 2018
13. RECEIVABLES, NET
June 30,
2019
December 31,
2018
June 30,
2018
Receivable accounts for settlement $ 40,343,869 $ 18,167,610 $ 22,531,590
Receivables on margin loans, refinancing margin
and refinancing deposits receivable 20,743,822 21,181,502 36,630,360
Interest receivable 17,013,970 16,287,188 14,519,370
Trading securities receivable 7,542,882 8,031,155 7,249,810
Accounts receivable factoring without recourse 6,561,896 8,180,472 9,749,139
Accounts receivable - forfeiting 6,068,832 8,122,872 8,119,096
Settlement price 5,478,404 6,308,741 4,642,002
Installment accounts and lease receivables 3,853,949 3,703,463 3,743,509
Others 12,859,512 11,021,392 12,907,745
120,467,136 101,004,395 120,092,621
Less: Allowance for bad debts (1,638,241) (1,706,909) (1,744,969)
Unrealized interest revenue (208,626) (198,107) (200,278)
$ 118,620,269 $ 99,099,379 $ 118,147,374
For the information on credit risk management and impairment loss analysis of receivables, please refer to
Note 49.
For the amount of receivables pledged as collateral for the Group, please refer to Note 56.

- 36 -
14. DISCOUNTS AND LOANS, NET
June 30,
2019
December 31,
2018
June 30,
2018
Short-term loans $ 81,221,266 $ 82,152,934 $ 90,641,628
Medium-term loans 207,143,351 191,493,381 183,961,211
Long-term loans 72,193,377 67,260,197 61,333,579
Loans reclassified to nonperforming loans 350,832 423,086 487,456
Export negotiations 42,776 56,079 80,694
Policy loans 26,687,054 26,403,907 25,575,110
Automatic premium loans 5,828,497 5,822,457 5,912,435
393,467,153 373,612,041 367,992,113
Less: Allowance for bad debts (4,584,979) (4,352,345) (4,289,329)
Discounts on loans (122,723) (128,300) (111,511)
$ 388,759,451 $ 369,131,396 $ 363,591,273
For the information on credit risk management and impairment loss analysis of discounts and loans, please
refer to Note 56.
15. REINSURANCE ASSETS, NET
June 30,
2019
December 31,
2018
June 30,
2018
Claims recoverable from reinsurers $ 459,763 $ 456,849 $ 455,053
Due from reinsurers and ceding companies 121,284 175 27,043
Reinsurance reserve assets
Ceded unearned premium reserve 54,376 50,125 50,654
Ceded reserve for claims 23,167 27,204 34,492
77,543 77,329 85,146
$ 658,590 $ 534,353 $ 567,242
No impairment loss was recognized for reinsurance assets.
16. INVESTMENTS ACCOUNTED FOR USING THE EQUITY METHOD, NET
Associates that are not individually material:
June 30, 2019 December 31, 2018 June 30, 2018
Carrying
Amount %
Carrying
Amount %
Carrying
Amount %
CDIB & Partners Investment Holding Corporation $ 6,434,436 34 $ 5,364,742 34 $ 5,785,336 34
CDIB Capital Asia Partners L.P. 4,274,723 - 3,587,002 - 3,809,184 -
KGI Securities (Thailand) Public Company Limited 2,461,869 35 2,416,178 35 2,164,561 35
CDIB Private Equity (Fujian) Enterprise (Limited
Partnership) 1,655,525 - 1,648,309 - 1,723,119 - CDIB Yida Private Equity (Kunshan) Enterprise
(Limited Partnership) 1,398,587 - 1,421,496 - 1,441,414 -
CDIB Capital Health Ventures Limited 776,049 43 749,682 43 727,045 43 CDIB Capital Creative Industries Limited 623,956 46 696,239 46 674,660 46
Others 334,616 219,278 151,826
$ 17,959,761 $ 16,102,926 $ 16,477,145

- 37 -
Investments accounted for using the equity method and the Group’s share of earnings and other
comprehensive income of CDIB & Partners Investment Holding Corporation and KGI Securities (Thailand)
Public Company Limited are calculated based on audited financial statements; those of other affiliates are
calculated based on unaudited financial statements. Management believes that the financial statements of
these investees had not been audited, there would have been no significant effect on the consolidated
financial statements.
There are no any investments under equity method was pledged as collateral for the Group.
17. INVOLVEMENT WITH UNCONSOLIDATED STRUCTURED ENTITIES
a. Investment in structured entities
The Corporation’s subsidiaries have equities of structured entities which the Corporation’s subsidiaries
do not have significant influence but rights and obligations in accordance with the contract.
June 30, 2019
Partnership
Fund
Asset
Securitization Total
Financial assets at fair value through profit or
loss $ 8,093,306 $ 3,090,996 $ 11,184,302
Debt instruments measured at amortized cost - 60,787,530 60,787,530
Maximum exposure 8,093,306 63,878,526 71,971,832
December 31, 2018
Partnership
Fund
Asset
Securitization Total
Financial assets at fair value through profit or
loss $ 6,824,619 $ 1,751,160 $ 8,575,779
Debt instruments measured at amortized cost - 60,397,100 60,397,100
Maximum exposure 6,824,619 62,148,260 68,972,879
June 30, 2018
Partnership
Fund
Asset
Securitization Total
Financial assets at fair value through profit or
loss $ 7,387,695 $ 2,249,843 $ 9,637,538
Debt instruments measured at amortized cost - 60,872,020 60,872,020
Maximum exposure 7,387,695 63,121,863 70,509,558
b. Management on structured entities
The Corporation’s subsidiaries have the equities of structured entities as well as the obligations to their
investment and management. The Corporation’s subsidiaries have significant influence over the above
investments.

- 38 -
The funds of unconsolidated structured entities are from the Corporation’s subsidiaries and external
third parties.
June 30,
2019
December 31,
2018
June 30,
2018
Management on partnership equity fund
Total assets $ 26,470,382 $ 22,431,078 $ 23,070,000
Total liabilities 206,431 102,172 269,396
Investments accounted for using the equity
method 7,618,645 6,831,114 7,061,033
Financial assets at fair value through profit or
loss 700,504 476,289 294,118
Maximum exposure 8,319,149 7,307,403 7,355,151
18. RESTRICTED ASSETS
June 30,
2019
December 31,
2018
June 30,
2018
Restricted demand deposits $ 43,677,484 $ 43,724,691 $ 44,475,293
Accounts receivables 110,821 106,867 163,928
Others 87,325 96,011 101,006
$ 43,875,630 $ 43,927,569 $ 44,740,227
The above restricted demand deposits refer to amounts received from clients for business.
After the filing of certain civil action against Morgan Stanley & Co. International PLC (Morgan Stanley)
(Note 50), CDIB Capital Group could not access the following funds in connection with transactions made
with Morgan Stanley because of its unauthorized disposition: Accounts receivable, deposits, cash security
on CDS contracts, stock investments and the related accrued revenue. Because of the inaccessibility of
these funds, these financial assets reclassified as “restricted assets”.
For the information on restricted assets pledged as collateral for the Group, please refer to Note 49.
19. OTHER FINANCIAL ASSETS
June 30,
2019
December 31,
2018
June 30,
2018
Separate-account insurance products $ 71,491,586 $ 63,501,665 $ 62,878,397
Guarantee deposits received on futures contracts 27,143,496 20,496,181 21,559,979
Others 5,122,049 7,364,684 8,170,121
$ 103,757,131 $ 91,362,530 $ 92,608,497

- 39 -
Separate-account Insurance Products
a. Separate-account insurance products - assets and liabilities
Assets
June 30,
2019
December 31,
2018
June 30,
2018
Cash in banks $ 404,685 $ 387,402 $ 785,877
Financial assets at fair value through profit or
loss 71,021,826 63,050,586 62,011,731
Other receivables 65,075 63,677 80,789
$ 71,491,586 $ 63,501,665 $ 62,878,397
Liabilities
June 30,
2019
December 31,
2018
June 30,
2018
Reserve for separate-account $ 71,401,257 $ 63,353,697 $ 62,611,096
Other payables 90,329 147,968 267,301
$ 71,491,586 $ 63,501,665 $ 62,878,397
b. Separate-account insurance products - revenues and expenses
Revenues
For the Three Months Ended
June 30 For the Six Months Ended
June 30
2019 2018 2019 2018
Premium income $ 1,371,903 $ 1,507,781 $ 2,623,409 $ 3,312,432
Gains (losses) from financial
assets and liabilities at fair
value through profit or loss 517,654 262,708 3,330,519 (214,572)
Interest income 177 71 202 143
Other revenues 44,206 45,784 88,977 93,055
Gains (losses) on foreign
exchange 155,256 636,198 251,652 269,252
$ 2,089,196 $ 2,452,542 $ 6,294,759 $ 3,460,310
Expenses
For the Three Months Ended
June 30 For the Six Months Ended
June 30
2019 2018 2019 2018
Insurance claim payments $ 1,298,445 $ 1,567,157 $ 2,433,305 $ 3,226,314
Net change in separate-account
reserve 218,232 493,478 2,961,795 (711,390)
Custodian fee 572,519 391,907 899,659 945,386
$ 2,089,196 $ 2,452,542 $ 6,294,759 $ 3,460,310

- 40 -
c. The rebate from counterparties in the investment-linked insurance business for the three and six months
ended June 30, 2019 and 2018 was $109,296 thousand, $92,460 thousand, $217,327 thousand and
$176,127 thousand, respectively.
For the information on other financial assets pledged as collateral for the Group, please refer to Note 49.
20. INVESTMENT PROPERTY, NET
June 30,
2019
December 31,
2018
June 30,
2018
Land $ 20,130,147 $ 20,024,687 $ 19,978,297
Buildings and facilities 5,199,624 5,407,733 5,314,877
$ 25,329,771 $ 25,432,420 $ 25,293,174
Except for depreciation recognized, the Group had no significant addition, disposal and impairment of
investment properties during the three and six months ended June 30, 2019 and 2018.
The above items of investment property were depreciated on a straight-line basis at estimated economic
lives as follows:
Buildings and facilities
Main building and parking spaces 20-60 years
Lifting equipment 15 years
Air-conditioning and electrical equipment 5-10 years
Fire and monitoring equipment 5 years
The fair values of the Group’s investment property as of June 30, 2019, December 31, 2018 and June 30,
2018 were $25,086,436 thousand, $25,033,305 thousand and $24,894,170 thousand, respectively.
Investment property was categorized into Level 3.
The Corporation’s subsidiaries had development of the vacant land and prepayments for buildings without
construction license, and the carrying amount was $2,520,610 thousand, $2,520,610 thousand and
$2,520,574 thousand, respectively, at June 30, 2019, December 31, 2018 and June 30, 2018. Because its
fair value cannot be reliably determined, it was excluded from the amount of fair value above mentioned.
The fair value of their investment property of the Group, besides the evaluation based on the external real
estate appraisers of China life insurance Co., Ltd. The Group examined the effectiveness of fair value of
2018 and 2017 by the Group, respectively. After evaluating, the group agree that the fair value on June 30,
2019 and 2018 are effective.
Valuation of fair values above mentioned, except the fair values of investment properties held by CDIB
Capital Group and KGI Securities for the year ended December 31, 2018, and the fair values of investment
properties held by subsidiaries of KGI Securities for the years ended December 31, 2018 and 2017 were
arrived at without appraisal from independent appraisers, but instead were arrived at by reference to
available external appraisal reports for the previous period and valuation models commonly used by market
participants. All the other subsidiaries of the Group engaged independent appraisers for the valuation of
their investment properties. The sales comparison approach and income approach were used in the
valuation, whereby the sales comparison approach compares a subject property’s characteristics with those
of comparable properties which have been recently sold in similar transaction, and income approach takes
the net operating income of the rent collected and divides it by the capitalization rate.

- 41 -
The Group’s investment property is mainly based on leased building with lease terms of 1 to 10 years and
some lessees have priority to rent the leased building. The lease contracts contain market review clauses in
the event that the lessees exercise their options to extend.
The maturity analysis of lease payments receivable under operating leases of investment properties as of
June 30, 2019 were as follows:
June 30,
2019
Year 1 $ 456,002
Year 2 403,492
Year 3 286,105
Year 4 169,396
Year 5 141,014
Year 5 onwards 249,952
$ 1,705,961
The investment property leased by the Group for operating leases is depreciated on a straight-line basis over
their estimated useful lives as follows:
Estimated
Useful Lives
Buildings 20-60 years
All of the Group’s investment property were held under freehold interests. The carrying amount of the
investment properties that had been pledged for the Group to secure borrowings were reflected in Note 49.
21. PROPERTY AND EQUIPMENT
June 30,
2019
December 31,
2018
June 30,
2018
Land $ 20,196,085 $ 20,222,381 $ 20,492,174
Buildings and facilities 6,018,988 6,144,281 6,400,332
Machinery and computer equipment 1,163,889 826,709 802,819
Other equipment 324,132 304,436 336,353
Transportation equipment 332,631 6,079 7,066
Leasehold improvements 302,426 315,272 345,684
Leased assets - 658,309 646,965
28,338,151 28,477,467 29,031,393
Prepayments for acquisition of properties 4,854,239 3,239,830 2,168,412
$ 33,192,390 $ 31,717,297 $ 31,199,805

- 42 -
June 30,
2019
Assets used by the Group $ 32,493,216
Assets leased under operating leases 699,174
$ 33,192,390
Except for depreciation recognized, the Group had no significant addition, disposal and impairment of
property and equipment during the three and six months ended June 30, 2019 and 2018.
The above items of self-use property and equipment are depreciated on a straight-line basis over the
estimated economic lives as follows:
Buildings and facilities
Main building and parking spaces 20-60 years
Lifting equipment 15 years
Air-conditioning and electrical equipment 5-10 years
Fire and monitoring equipment 4-5 years
Machinery and computer equipment 1-15 years
Transportation equipment 2-15 years
Other equipment
Office furniture and equipment 2-10 years
Others 5-10 years
Leasehold improvements 1-10 years
The operating lease of the group’s subsidiaries are mainly based on leased light passenger vehicle with
lease terms of 1 to 5 years without an option to extend for an additional years.
The maturity analysis of lease payments receivable was as follows:
June 30,
2019
Year 1 $ 116,152
Year 2 71,338
Year 3 32,048
Year 4 7,121
Year 5 1,084
$ 227,743
The investment property leased by the Group for operating leases is depreciated on a straight-line basis
based over their estimated useful lives as follows:
Estimated
Useful Lives
Machinery equipment 20 years Transportation equipment 5 years
For the information on property and equipment pledged as collateral for the Group, please refer to Note 49.

- 43 -
22. LEASE ARRANGEMENTS
a. Right-of-use assets
June 30,
2019
Carrying amounts
Premiums-surface right $ 13,078,321
Buildings and facilities 3,643,878
Land 2,082,395
Computer equipment 147,127
Transportation equipment 29,590
Other equipment 10,228
$ 18,991,539
For the Six
Months Ended
June 30, 2019
Additions to right-of-use assets $ 418,512
For the Three
Months Ended
June 30
For the Six
Months Ended
June 30
Depreciation of right-of-use assets
Premiums-surface right $ 50,651 $ 101,302
Buildings and facilities 201,604 395,512
Land 8,061 16,122
Computer equipment 17,077 33,293
Transportation equipment 4,760 9,283
Other equipment 2,365 4,703
$ 284,518 $ 560,215
The depreciation expense of the right-of-use asset recognized in profit or loss for the three and six
months ended June 30, 2019 were $225,806 thousand and $442,791 thousand.
b. Lease liabilities
June 30,
2019
Carrying amounts $ 5,921,944
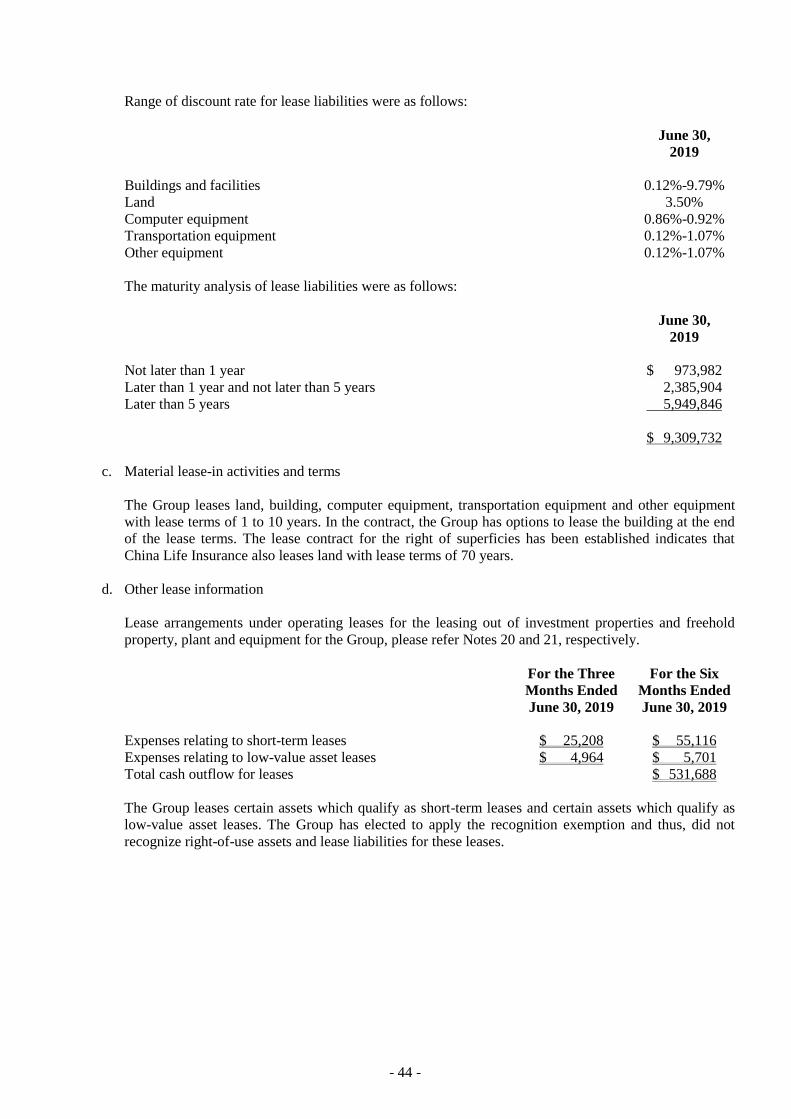
- 44 -
Range of discount rate for lease liabilities were as follows:
June 30,
2019
Buildings and facilities 0.12%-9.79%
Land 3.50%
Computer equipment 0.86%-0.92%
Transportation equipment 0.12%-1.07%
Other equipment 0.12%-1.07%
The maturity analysis of lease liabilities were as follows:
June 30,
2019
Not later than 1 year $ 973,982
Later than 1 year and not later than 5 years 2,385,904
Later than 5 years 5,949,846
$ 9,309,732
c. Material lease-in activities and terms
The Group leases land, building, computer equipment, transportation equipment and other equipment
with lease terms of 1 to 10 years. In the contract, the Group has options to lease the building at the end
of the lease terms. The lease contract for the right of superficies has been established indicates that
China Life Insurance also leases land with lease terms of 70 years.
d. Other lease information
Lease arrangements under operating leases for the leasing out of investment properties and freehold
property, plant and equipment for the Group, please refer Notes 20 and 21, respectively.
For the Three
Months Ended
June 30, 2019
For the Six
Months Ended
June 30, 2019
Expenses relating to short-term leases $ 25,208 $ 55,116
Expenses relating to low-value asset leases $ 4,964 $ 5,701
Total cash outflow for leases $ 531,688
The Group leases certain assets which qualify as short-term leases and certain assets which qualify as
low-value asset leases. The Group has elected to apply the recognition exemption and thus, did not
recognize right-of-use assets and lease liabilities for these leases.

- 45 -
23. INTANGIBLE ASSETS
June 30,
2019
December 31,
2018
June 30,
2018
Purchase policy value $ 12,584,791 $ 12,767,519 $ 12,961,548
Operation rights 3,873,155 4,191,909 4,525,733
Goodwill 3,391,407 3,369,090 3,358,876
Computer software 865,695 806,233 737,660
Others 36,396 36,396 36,396
$ 20,751,444 $ 21,171,147 $ 21,620,213
Except for amortization recognized, the Group’s had no significant addition, disposal, and impairment of
other intangible assets during the three and six months ended June 30, 2019 and 2018.
Apart from the purchase policy value is amortized on present value of annuity of expected remaining
policies over effective period of policies, the other items of intangible assets above are amortized on a
straight-line basis over the estimated economic lives as follows:
Operation rights 7-20 years
Computer software 3-6 years
24. OTHER ASSETS
June 30,
2019
December 31,
2018
June 30,
2018
Security borrowing margins $ 19,058,629 $ 10,778,769 $ 7,035,621
Guarantee deposits paid 6,966,497 13,733,989 24,902,360
Operating guarantee deposits 7,390,783 7,438,483 7,102,615
Prepaid expense 1,138,538 1,265,709 1,584,334
Prepayment - surface rights - 13,179,623 13,280,925
Others 1,704,326 2,505,788 1,929,390
$ 36,258,773 $ 48,902,361 $ 55,835,245
Prepayment - the surface rights are land of China Life Insurance use rights for 13 government properties,
including Taipei Academy and Zhong-Lun Housing that were acquired on November 28, 2013. The
execution date of the contract was January 20, 2014 for a term of 70 years. The expiration date is January
19, 2084. The Group adapted IFRS 16 from January 1, 2019, and did not restate the comparative
consolidated financial statement by the transaction of IFRS 16.
For the information on other assets pledged as collateral for the Group, please refer to Note 49.
25. DEPOSITS FROM THE CENTRAL BANK AND FINANCIAL INSTITUTIONS
June 30,
2019
December 31,
2018
June 30,
2018
Call loans from financial institutions $ 22,436,404 $ 22,242,268 $ 33,878,855
Deposits from Chunghwa Post Co., Ltd. 190,146 192,646 358,205
$ 22,626,550 $ 22,434,914 $ 34,237,060

- 46 -
26. NOTES AND BONDS ISSUED UNDER REPURCHASE AGREEMENTS
June 30,
2019
December 31,
2018
June 30,
2018
Government bonds $ 58,712,766 $ 58,385,910 $ 48,377,647
Corporate bonds 39,169,530 36,276,317 37,044,727
Bank debentures 21,923,023 30,237,248 52,587,392
Commercial paper 1,513,789 579,425 247,967
$ 121,319,108 $ 125,478,900 $ 138,257,733
Repurchased amounts $ 121,756,138 $ 125,952,224 $ 138,570,770
Last maturity date October 2019 May 2019 November 2018
27. COMMERCIAL PAPER PAYABLE, NET
June 30,
2019
December 31,
2018
June 30,
2018
Commercial paper payable $ 17,581,269 $ 14,989,859 $ 23,367,990
Less: Unamortized discount (4,461) (3,957) (7,303)
$ 17,576,808 $ 14,985,902 $ 23,360,687
Range of rate 0.44%-2.53% 0.60%-2.59% 0.38%-2.48%
As of June 30, 2019, Ta Ching Finance Corporation, China Bills Finance Corporation, Grand Bills Finance
Corporation, Mega Bills Finance Corporation, Taiwan Bills Finance Corporation, International Bills
Finance Corporation, Taiwan Cooperative Bills Finance Corporation, Taishin International Bank, Far
Eastern International Bank, Sunny Bank and Taiwan Business Bank guaranteed the above commercial
paper. However, some commercial paper which amounted to $14,398,136 thousand, had no guarantee.
As of December 31, 2018, Ta Ching Finance Corporation, China Bills Finance Corporation, Mega Bills
Finance Corporation, Taiwan Finance Corporation, International Bills Finance Corporation, Taiwan
Cooperative Bills Finance Corporation, Taishin International Bank, Shanghai Commercial Bank, Sunny
Bank, Taiwan Business Bank and Far Eastern International Bank guaranteed the above commercial paper.
However, some commercial paper which amounted to $11,668,008 thousand, had no guarantee.
As of June 30, 2018, Ta Ching Finance Corporation, China Bills Finance Corporation, Mega Bills Finance
Corporation, Taiwan Finance Corporation, International Bills Finance Corporation, Taiwan Cooperative
Bills Finance Corporation, Union Bank of Taiwan, Taishin International Bank, Shanghai Commercial
Bank, Sunny Bank and Taiwan Business Bank guaranteed the above commercial paper. However, some
commercial paper, which amounted to $16,379,584 thousand, had no guarantee.

- 47 -
28. PAYABLES
June 30,
2019
December 31,
2018
June 30,
2018
Accounts payable for settlement $ 63,114,598 $ 45,453,733 $ 49,660,611
Guaranteed price deposits received from
securities borrowers 11,661,427 14,465,995 13,998,203
Accrued expenses and payable on insurance
policies 11,038,730 11,126,598 10,122,543
Settlement proceeds 8,871,414 4,838,810 6,212,965
Cash dividends payable 4,538,168 - 10,946,324
Others 13,434,916 13,756,108 13,129,618
$ 112,659,253 $ 89,641,244 $ 104,070,264
29. DEPOSITS AND REMITTANCES
June 30,
2019
December 31,
2018
June 30,
2018
Time deposits $ 255,008,320 $ 229,617,422 $ 223,780,138
Saving deposits 111,821,286 93,330,058 96,321,286
Demand deposits 53,893,931 55,634,932 57,544,630
Negotiable CDs 14,344,000 17,211,000 26,945,800
Checking deposits 2,343,152 2,440,582 2,549,190
Inward remittance 28,957 52,016 35,025
$ 437,439,646 $ 398,286,010 $ 407,176,069
30. BONDS PAYABLE
June 30,
2019
December 31,
2018
June 30,
2018
Corporate bonds payable $ 22,800,000 $ 23,800,000 $ 23,800,000
Bank debentures payable 10,450,000 7,350,000 1,000,000
$ 33,250,000 $ 31,150,000 $ 24,800,000
Corporate Bonds Payable
Name June 30, 2019
December 31,
2018 June 30, 2018 Issuance Period Method of Paying Principle and Interests Interest Rate
1st corporate bonds in 2011 - the Corporation $ - $ 1,000,000 $ 1,000,000 Bond B 2012.03.07-2019.03.07 Interest payable annually; principal due on maturity Bond B 1.42%
1st corporate bonds in 2014 - the Corporation 6,000,000 6,000,000 6,000,000 2015.03.30-2020.03.30 Interest payable annually; principal due on maturity 1.42%
1st corporate bonds in 2015 - the Corporation 2,000,000 2,000,000 2,000,000 2015.09.15-2020.09.15 Interest payable annually; principal due on maturity 1.37%
1st corporate bonds in 2017 - the Corporation 10,000,000 10,000,000 10,000,000 Bond A 2017.09.08-2024.09.08
Bond B 2017.09.08-2027.09.08
Bond C 2017.09.08-2032.09.08
Interest payable annually; principal due on maturity Bond A 1.75%
Bond B 1.90%
Bond C 2.10%
1st corporate bonds in 2015 - KGI Securities 4,800,000
4,800,000
4,800,000
Bond A 2015.06.08-2018.06.08
Bond B 2015.06.08-2020.06.08
Interest payable annually; principal due on maturity Bond A 1.20%
Bond B 1.42%
Net amount $ 22,800,000 $ 23,800,000 $ 23,800,000
Fair value $ 23,167,614 $ 24,225,699 $ 24,347,038

- 48 -
Bank Debentures Payable
Name June 30, 2019
December 31,
2018 June 30, 2018 Issuance Period
Method of Paying
Principle and Interests
Interest
Rate
P06 KGIB 1 $ 1,000,000 $ 1,000,000 $ 1,000,000 2017.05.19-2020.05.19 Interest payable annually; principal
due on maturity
0.90%
P07 KGIB 1 3,000,000 3,000,000 - 2018.12.27, no maturity
date
Interest payable annually (Note) 2.35%
P07 KGIB 2 3,350,000 3,350,000 - 2018.12.27-2033.12.27 Interest payable annually; principal
due on maturity
1.68%
P08 KGIB 1 3,100,000
-
-
2019.06.26-2034.06.26 Interest payable annually; principal
due on maturity
1.40%
10,450,000 7,350,000 1,000,000
Unamortized discount - - -
Net amount $ 10,450,000 $ 7,350,000 $ 1,000,000
Fair Value $ 10,449,873 $ 7,360,509 $ 1,002,794
Note: KGI Bank has the right to redeem the bonds after 5 years and 1 month from the issue date if its
self-owned capital adequacy ratio is still in accordance with the requirements set by the competent
authority. KGI Bank is allowed to redeem the bonds based on the carrying value of each bond plus
interest after approved by the competent authority.
31. OTHER BORROWINGS
June 30,
2019
December 31,
2018
June 30,
2018
Short-term credit borrowings $ 10,155,247 $ 10,021,939 $ 15,779,601
Note issuance facility 3,909,825 4,339,771 4,899,289
Short-term secured borrowings 3,681,145 4,329,666 9,329,063
Long-term credit borrowings 63,136 126,685 315,830
$ 17,809,353 $ 18,818,061 $ 30,323,783
Range of rate 0.68%-8.30% 0.72%-8.55% 0.55%-8.25%
Last maturity date July 2021 July 2021 October 2020
32. PROVISIONS
June 30,
2019
December 31,
2018
June 30,
2018
Insurance liabilities $ 1,656,037,283 $ 1,552,528,196 $ 1,436,255,645
Foreign exchange valuation reserve 5,191,880 3,169,331 3,070,346
Provisions for employee benefits 949,985 1,040,517 987,489
Others 662,279 566,895 546,654
$ 1,662,841,427 $ 1,557,304,939 $ 1,440,860,134

- 49 -
Insurance Contracts and Provision for Financial Instruments with Discretionary Participation
Feature
As at June 30, 2019, December 31, 2018 and June 30, 2018, China Life Insurance’s movement in reserves
of insurance contracts and financial instruments with discretionary participation feature is as follows:
June 30,
2019
December 31,
2018
June 30,
2018
Reserve for life insurance liabilities $ 1,616,752,239 $ 1,513,115,547 $ 1,395,190,864
Unearned premium reserve 4,094,931 3,854,791 3,842,666
Reserve for claims 1,898,397 1,686,742 1,538,666
Special reserve 6,005,632 6,364,597 5,660,863
Premium deficiency reserve 7,551,251 7,504,145 8,491,638
Other reserve 19,734,833 20,002,374 21,530,948
$ 1,656,037,283 $ 1,552,528,196 $ 1,436,255,645
a. Reserve for life insurance liabilities:
June 30, 2019
Insurance
Contract
Financial
Instruments with
Discretionary
Participation
Feature Total
Life insurance $ 1,265,930,466 $ 56,238,944 $ 1,322,169,410
Health insurance 127,321,035 - 127,321,035
Annuity insurance 671,974 164,633,325 165,305,299
Investment-linked insurance 1,800,699 - 1,800,699
$ 1,395,724,174 $ 220,872,269 $ 1,616,596,443
Note: The total amount of liability reserve is $1,616,752,239 thousand on June 30, 2019 after reserve
for life insurance-accrued paid is added.
December 31, 2018
Insurance
Contract
Financial
Instruments with
Discretionary
Participation
Feature Total
Life insurance $ 1,173,394,667 $ 56,735,343 $ 1,230,130,010
Health insurance 122,642,721 - 122,642,721
Annuity insurance 647,909 157,700,581 158,348,490
Investment-linked insurance 1,834,656 - 1,834,656
$ 1,298,519,953 $ 214,435,924 $ 1,512,955,877
Note: The total amount of liability reserve is $1,513,115,547 thousand on December 31, 2018 after
reserve for life insurance-accrued paid is added.

- 50 -
June 30, 2018
Insurance
Contract
Financial
Instruments with
Discretionary
Participation
Feature Total
Life insurance $ 1,060,653,766 $ 57,985,898 $ 1,118,639,664
Health insurance 116,790,853 - 116,790,853
Annuity insurance 649,009 157,129,301 157,778,310
Investment-linked insurance 1,875,886 - 1,875,886
$ 1,179,969,514 $ 215,115,199 $ 1,395,084,713
Note: The total amount of liability reserve is $1,395,190,864 thousand on June 30, 2018 after reserve
for life insurance-accrued paid is added.
Movement in reserve for life insurance liabilities is summarized below:
For the Six Months Ended June 30, 2019
Insurance
Contract
Financial
Instruments with
Discretionary
Participation
Feature Total
Beginning balance $ 1,298,519,952 $ 214,435,925 $ 1,512,955,877
Reserve 129,638,980 15,547,317 145,186,297
Recover (34,900,715) (9,392,679) (44,293,394)
Gains (losses) on foreign exchange 2,464,713 281,706 2,746,419
Other(Note 1) 1,244 - 1,244
Ending balance (Note 2) $ 1,395,724,174 $ 220,872,269 $ 1,616,596,443
Note 1: The amount of the acquisition of a partial traditional insurance policies of Allianz Life
Insurance is based on the contract to cover the deficiency during the replenishment period.
Note 2: The total amount of liability reserve is $1,616,752,239 thousand on June 30, 2019 after
reserve for life insurance-accrued paid is added.
For the Six Months Ended June 30, 2018
Insurance
Contract
Financial
Instruments with
Discretionary
Participation
Feature Total
Beginning balance $ 1,048,113,729 $ 215,730,420 $ 1,263,844,149
Reserve 123,829,473 8,997,532 132,827,005
Recover (24,128,505) (10,178,215) (34,306,720)
Gains (losses) on foreign exchange 3,636,865 565,460 4,202,325
Other (Note 1) 28,517,954 - 28,517,954
Ending balance (Note 2) $ 1,179,969,516 $ 215,115,197 $ 1,395,084,713

- 51 -
Note 1: The amount is transferred from the acquisition of a partial traditional insurance policies of
Allianz Life Insurance on May 18, 2018.
Note 2: The total amount of liability reserve is $1,395,190,864 thousand on June 30, 2018 after
reserve for life insurance-accrued paid is added.
b. Unearned premium reserve
June 30, 2019
Insurance
Contract
Financial
Instruments
with
Discretionary
Participation
Feature Total
Individual life insurance $ 1,059 $ - $ 1,059
Individual injury insurance 1,201,824 - 1,201,824
Individual health insurance 1,847,847 - 1,847,847
Group insurance 985,592 - 985,592
Investment-linked insurance 58,502 - 58,502
Annuity insurance - 107 107
4,094,824 107 4,094,931
Less ceded unearned premium reserve
Individual life insurance 15,414 - 15,414
Individual injury insurance 1,182 - 1,182
Individual health insurance 29,531 - 29,531
Group insurance 3,134 - 3,134
Investment-linked insurance 5,115 - 5,115
54,376 - 54,376
Net amount $ 4,040,448 $ 107 $ 4,040,555
December 31, 2018
Insurance
Contract
Financial
Instruments
with
Discretionary
Participation
Feature Total
Individual life insurance $ 1,160 $ - $ 1,160
Individual injury insurance 1,237,170 - 1,237,170
Individual health insurance 2,011,560 - 2,011,560
Group insurance 555,939 - 555,939
Investment-linked insurance 48,909 - 48,909
Annuity insurance - 53 53
3,854,738 53 3,854,791
Less ceded unearned premium reserve
Individual life insurance 10,712 - 10,712
Individual injury insurance 1,513 - 1,513
Individual health insurance 27,559 - 27,559
Group insurance 5,267 - 5,267
Investment-linked insurance 5,074 - 5,074
50,125 - 50,125
Net amount $ 3,804,613 $ 53 $ 3,804,666

- 52 -
June 30, 2018
Insurance
Contract
Financial
Instruments
with
Discretionary
Participation
Feature Total
Individual life insurance $ 1,147 $ - $ 1,147
Individual injury insurance 1,071,429 - 1,071,429
Individual health insurance 1,750,413 - 1,750,413
Group insurance 963,267 - 963,267
Investment-linked insurance 56,352 - 56,352
Annuity insurance - 58 58
3,842,608 58 3,842,666
Less ceded unearned premium reserve
Individual life insurance 14,916 - 14,916
Individual injury insurance 1,055 - 1,055
Individual health insurance 27,061 - 27,061
Group insurance 2,606 - 2,606
Investment-linked insurance 5,016 - 5,016
50,654 - 50,654
Net amount $ 3,791,954 $ 58 $ 3,792,012
Movement in unearned premium reserve is summarized below:
For the Six Months Ended June 30, 2019
Insurance
Contract
Financial
Instruments
with
Discretionary
Participation
Feature Total
Beginning balance $ 3,854,738 $ 53 $ 3,854,791
Reserve 2,167,454 107 2,167,561
Recover (1,927,368) (53) (1,927,421)
Ending balance 4,094,824 107 4,094,931
Less ceded unearned premium reserve
Beginning balance 50,125 - 50,125
Increase 30,268 - 30,268
Decrease (26,017) - (26,017)
Ending balance 54,376 - 54,376
Net amount $ 4,040,448 $ 107 $ 4,040,555

- 53 -
For the Six Months Ended June 30, 2018
Insurance
Contract
Financial
Instruments
with
Discretionary
Participation
Feature Total
Beginning balance $ 3,384,833 $ 57 $ 3,384,890
Reserve 2,121,230 58 2,121,288
Recover (1,699,657) (57) (1,699,714)
Gains (losses) on foreign exchanges 1 - 1
Others (Note) 36,201 - 36,201
Ending balance 3,842,608 58 3,842,666
Less ceded unearned premium reserve
Beginning balance 49,879 - 49,879
Increase 25,738 - 25,738
Decrease (24,963) - (24,963)
Ending balance 50,654 - 50,654
Net amount $ 3,791,954 $ 58 $ 3,792,012
Note: The amount is transferred from the acquisition of a partial traditional insurance policies of
Allianz Life Insurance on May 18, 2018.
c. Reserve for claims
June 30, 2019
Insurance
Contract
Financial
Instruments
with
Discretionary
Participation
Feature Total
Individual life insurance
Reported but not paid claim $ 255,948 $ 114,903 $ 370,851
Unreported claim 1,440 - 1,440
Individual injury insurance
Reported but not paid claim 63,126 - 63,126
Unreported claim 239,279 - 239,279
Individual health insurance
Reported but not paid claim 84,064 - 84,064
Unreported claim 579,641 - 579,641
Group insurance
Reported but not paid claim 79,224 - 79,224
Unreported claim 412,647 - 412,647
Investment-linked insurance
Reported but not paid claim 16,819 - 16,819
Unreported claim - - -
Annuity insurance
Reported but not paid claim - 51,219 51,219
Unreported claim - 87 87
1,732,188 166,209 1,898,397
(Continued)

- 54 -
June 30, 2019
Insurance
Contract
Financial
Instruments
with
Discretionary
Participation
Feature Total
Less ceded reserve for claims
Individual life insurance $ 1,021 $ - $ 1,021
Individual injury insurance 16,946 - 16,946
Individual health insurance 3,539 - 3,539
Group insurance 1,661 - 1,661
23,167 - 23,167
Net amount $ 1,709,021 $ 166,209 $ 1,875,230
(Concluded)
December 31, 2018
Insurance
Contract
Financial
Instruments
with
Discretionary
Participation
Feature Total
Individual life insurance
Reported but not paid claim $ 260,846 $ 81,393 $ 342,239
Unreported claim 1,497 - 1,497
Individual injury insurance
Reported but not paid claim 52,370 - 52,370
Unreported claim 207,078 - 207,078
Individual health insurance
Reported but not paid claim 93,733 - 93,733
Unreported claim 508,774 - 508,774
Group insurance
Reported but not paid claim 56,073 - 56,073
Unreported claim 397,937 - 397,937
Investment-linked insurance
Reported but not paid claim 11,657 - 11,657
Unreported claim - - -
Annuity insurance
Reported but not paid claim - 15,299 15,299
Unreported claim - 85 85
1,589,965 96,777 1,686,742
Less ceded reserve for claims
Individual life insurance 5,654 - 5,654
Individual injury insurance 4,687 - 4,687
Individual health insurance 13,863 - 13,863
Group insurance 3,000 - 3,000
27,204 - 27,204
Net amount $ 1,562,761 $ 96,777 $ 1,659,538

- 55 -
June 30, 2018
Insurance
Contract
Financial
Instruments
with
Discretionary
Participation
Feature Total
Individual life insurance
Reported but not paid claim $ 216,688 $ 88,004 $ 304,692
Unreported claim 545 - 545
Individual injury insurance
Reported but not paid claim 56,423 - 56,423
Unreported claim 170,648 - 170,648
Individual health insurance
Reported but not paid claim 102,899 - 102,899
Unreported claim 479,759 - 479,759
Group insurance
Reported but not paid claim 100,884 - 100,884
Unreported claim 298,882 - 298,882
Investment-linked insurance
Reported but not paid claim 11,293 - 11,293
Unreported claim - - -
Annuity insurance
Reported but not paid claim 189 12,399 12,588
Unreported claim - 53 53
1,438,210 100,456 1,538,666
Less ceded reserve for claims
Individual life insurance 8,127 - 8,127
Individual injury insurance 6,000 - 6,000
Individual health insurance 7,605 - 7,605
Group insurance 12,760 - 12,760
34,492 - 34,492
$ 1,403,718 $ 100,456 $ 1,504,174

- 56 -
Movement in reserve for claims is summarized below:
For the Six Months Ended June 30, 2019
Insurance
Contract
Financial
Instruments
with
Discretionary
Participation
Feature Total
Beginning balance $ 1,589,965 $ 96,777 $ 1,686,742
Reserve 1,732,007 165,947 1,897,954
Recover (1,589,965) (96,777) (1,686,742)
Gains (losses) on foreign exchange 181 262 443
Ending balance 1,732,188 166,209 1,898,397
Less ceded unearned premium reserve
Beginning balance 27,204 - 27,204
Increase 23,167 - 23,167
Decrease (27,204) - (27,204)
Ending balance 23,167 - 23,167
Net amount $ 1,709,021 $ 166,209 $ 1,875,230
For the Six Months Ended June 30, 2018
Insurance
Contract
Financial
Instruments
with
Discretionary
Participation
Feature Total
Beginning balance $ 1,437,951 $ 106,826 $ 1,544,777
Reserve 1,438,468 100,647 1,539,115
Recover (1,446,997) (106,826) (1,553,823)
Gains (losses) on foreign exchange (258) (191) (449)
Other (Note) 9,046 - 9,046
Ending balance 1,438,210 100,456 1,538,666
Less ceded unearned premium reserve
Beginning balance 12,484 - 12,484
Increase 34,492 - 34,492
Decrease (12,484) - (12,484)
Ending balance 34,492 - 34,492
Net amount $ 1,403,718 $ 100,456 $ 1,504,174
Note: The amount is transferred from the acquisition of a partial traditional insurance policies of
Allianz Life Insurance on May 18, 2018.

- 57 -
China Life Insurance’s reported but not paid claims are reserved according to insurance type and claims
department’s estimates based on each individual case’s related information without exceeding promised
insurance amount for covered accidents. Those reported but not paid reserve is reasonably assessed,
sufficient to reflect actual claims paid. In addition, some types of claims are not expected to close
shortly because these claims usually depend on court judgments before the closure. The legal
department tracks the development of these claims and reasonably estimates claims reserve. The
actuarial department assesses final unreported claims based on past claims experience with
consideration of claims development trends for past closed cases, and then develop the final claims
based on homogeneous features of each insurance through Bornhuetter-Ferguson Method. Reserve for
unreported and unclosed claims changes according to external environment, such as, actual loss rate
will lead to fluctuations of claims. The actuarial department will evaluate periodically to make
reasonable estimate of claims reserve.
d. Special reserve
June 30, 2019
Insurance
Contract
Financial
Instruments
with
Discretionary
Participation
Feature Total
Participating policies dividend reserve $ 6,005,632 $ - $ 6,005,632
Dividend risk reserve - - -
$ 6,005,632 $ - $ 6,005,632
December 31, 2018
Insurance
Contract
Financial
Instruments
with
Discretionary
Participation
Feature Total
Participating policies dividend reserve $ 6,364,597 $ - $ 6,364,597
Dividend risk reserve - - -
$ 6,364,597 $ - $ 6,364,597
June 30, 2018
Insurance
Contract
Financial
Instruments
with
Discretionary
Participation
Feature Total
Participating policies dividend reserve $ 5,660,863 $ - $ 5,660,863
Dividend risk reserve - - -
$ 5,660,863 $ - $ 5,660,863

- 58 -
Movement in special reserve is summarized below:
For the Six Months Ended
June 30
2019 2018
Insurance
Contract Insurance
Contract
Beginning balance $ 6,364,597 $ 6,259,742
Adjustment to IFRS 9 - (6,676)
Adjusted beginning balance 6,364,597 6,253,066
Reserve for participating policy dividend revenue 1,361,897 1,269,088
Recover for participating policy dividend revenue (1,733,386) (1,720,408)
Gains (losses) on equity instruments from participating dividend
policy measured at FVTOCI 12,524 (140,883)
Ending balance $ 6,005,632 $ 5,660,863
e. Special capital reserve for major incidents and fluctuation of risks
June 30, 2019
Insurance
Contract
Financial
Instruments
with
Discretionary
Participation
Feature Total
Individual life insurance $ 1,578 $ - $ 1,578
Individual injury insurance 871,147 - 871,147
Individual health insurance 2,435,161 - 2,435,161
Group insurance 3,090,678 - 3,090,678
Annuity insurance - 539 539
$ 6,398,564 $ 539 $ 6,399,103
December 31, 2018
Insurance
Contract
Financial
Instruments
with
Discretionary
Participation
Feature Total
Individual life insurance $ 1,578 $ - $ 1,578
Individual injury insurance 871,147 - 871,147
Individual health insurance 2,435,161 - 2,435,161
Group insurance 3,090,678 - 3,090,678
Annuity insurance - 539 539
$ 6,398,564 $ 539 $ 6,399,103

- 59 -
June 30, 2018
Insurance
Contract
Financial
Instruments
with
Discretionary
Participation
Feature Total
Individual life insurance $ 1,893 $ - $ 1,893
Individual injury insurance 846,176 - 846,176
Individual health insurance 2,286,647 - 2,286,647
Group insurance 2,857,669 - 2,857,669
Annuity insurance - 593 593
$ 5,992,385 $ 593 $ 5,992,978
f. Premium deficiency reserve
June 30, 2019
Insurance
Contract
Financial
Instruments
with
Discretionary
Participation
Feature Total
Individual life insurance $ 7,424,979 $ - $ 7,424,979
Individual health insurance 126,272 - 126,272
$ 7,551,251 $ - $ 7,551,251
December 31, 2018
Insurance
Contract
Financial
Instruments
with
Discretionary
Participation
Feature Total
Individual life insurance $ 7,376,763 $ - $ 7,376,763
Individual health insurance 127,382 - 127,382
$ 7,504,145 $ - $ 7,504,145

- 60 -
June 30, 2018
Insurance
Contract
Financial
Instruments
with
Discretionary
Participation
Feature Total
Individual life insurance $ 8,364,839 $ - $ 8,364,839
Individual injury insurance 126,799 - 126,799
$ 8,491,638 $ - $ 8,491,638
Note: Premium deficiency reserve was not ceded in the above insurance contracts.
Movement in premium deficiency reserve is summarized as below:
For the Six Months Ended June 30, 2019
Insurance
Contract
Financial
Instruments
with
Discretionary
Participation
Feature Total
Beginning balance $ 7,504,145 $ - $ 7,504,145
Reserve 1,359,259 - 1,359,259
Recover (1,332,889) - (1,332,889)
Gains (losses) on foreign exchange 20,736 - 20,736
Ending balance $ 7,551,251 $ - $ 7,551,251
For the Six Months Ended June 30, 2018
Insurance
Contract
Financial
Instruments
with
Discretionary
Participation
Feature Total
Beginning balance $ 9,164,460 $ - $ 9,164,460
Reserve 490,685 - 490,685
Recover (1,189,666) - (1,189,666)
Gains (losses) on foreign exchange 26,158 - 26,158
Others (Note) 1 - 1
Ending balance $ 8,491,638 $ - $ 8,491,638
Note: The amount is transferred from the acquisition of a partial traditional insurance policies of
Allianz Life Insurance on May 18, 2018.

- 61 -
g. Other reserve
June 30, 2019
Insurance
Contract
Financial
Instruments
with
Discretionary
Participation
Feature Total
Others $ 19,734,833 $ - $ 19,734,833
December 31, 2018
Insurance
Contract
Financial
Instruments
with
Discretionary
Participation
Feature Total
Others $ 20,002,374 $ - $ 20,002,374
June 30, 2018
Insurance
Contract
Financial
Instruments
with
Discretionary
Participation
Feature Total
Others $ 21,530,948 $ - $ 21,530,948
Movement in other reserve is summarized as below:
For the Six Months Ended June 30, 2019
Insurance
Contract
Financial
Instruments
with
Discretionary
Participation
Feature Total
Beginning balance $ 20,002,374 $ - $ 20,002,374
Recover (267,541) - (267,541)
Ending balance $ 19,734,833 $ - $ 19,734,833

- 62 -
For the Six Months Ended June 30, 2018
Insurance
Contract
Financial
Instruments
with
Discretionary
Participation
Feature Total
Beginning balance $ - $ - $ -
Recover (100,161) - (100,161)
Others (Note) 21,631,109 - 21,631,109
Ending balance $ 21,530,948 $ - $ 21,530,948
Note: The amount is transferred from the acquisition of a partial traditional insurance policies of
Allianz Life Insurance on May 18, 2018.
h. Liability adequacy reserve
Insurance Contract and Financial Instruments with
Discretionary Participation Feature
June 30,
2019
December 31,
2018
June 30,
2018
Reserve for life insurance liabilities $ 1,616,596,443 $ 1,512,955,877 $ 1,395,084,713
Unearned premium reserve 4,094,931 3,854,791 3,842,666
Premium deficiency reserve 7,551,251 7,504,145 8,491,638
Special reserve 6,005,632 6,364,597 5,660,863
Other reserve 19,734,833 20,002,374 21,530,948
Book value of insurance liabilities $ 1,653,983,090 $ 1,550,681,784 $ 1,434,610,828
Estimated present value of cash flows $ 1,241,797,486 $ 1,256,360,366 $ 1,094,347,615
Balance of liability adequacy reserve $ - $ - $ -
China Life Insurance’s liability adequacy testing methodology is listed as follows:
June 30, 2019
Test method Gross Premium Valuation Method (GPV)
Groups Integrated testing
Assumptions Adopt the best-estimated scenario investment return on the most recent actuary
report (the actuary report of 2018), and discount rates were evaluated with
consideration of current information.

- 63 -
December 31, 2018 and June 30, 2018
Test method Gross Premium Valuation Method (GPV)
Groups Integrated testing
Assumptions Adopt the best-estimated scenario investment return on the most recent actuary
report (the actuary report of 2017), and discount rates were evaluated with
consideration of current information.
i. Foreign exchange valuation reserve
1) The hedge strategy and risk exposure
China Life Insurance Co., Ltd. consistently adjusts the hedge ratios to establish an adequate risk
exposure planning based on the new foreign exchange valuation exposure principle by integrating
the exchange rate and interest rate trends of domestic and foreign financial markets. However,
changes in the hedge and risk exposure ratios should follow the internal risk control to alert and
adjust hedge strategy in advance to meet the optimal hedge considerations.
2) Adjustment in foreign exchange valuation reserve
For the Six Months Ended
June 30
2019 2018
Beginning balance $ 3,169,331 $ 2,703,763
Reserve
Compulsory reserve 824,327 510,511
Extra reserve 2,323,063 1,273,875
3,147,390 1,784,386
Recover (1,124,841) (1,417,803)
Ending balance $ 5,191,880 $ 3,070,346
3) Effects due to foreign exchange valuation reserve
For the Six Months Ended June 30, 2019
Item Inapplicable
Amount Applicable
Amount Effects
Net income $ 9,067,666 $ 7,449,627 $ (1,618,039)
Earnings per share (dollar) 2.25 1.85 (0.40)
Foreign exchange valuation reserve - 5,191,880 5,191,880
Equity 132,745,311 129,934,869 (2,810,442)
For the Six Months Ended June 30, 2018
Item Inapplicable
Amount Applicable
Amount Effects
Net income $ 6,551,894 $ 6,258,627 $ (293,267)
Earnings per share (dollar) 1.63 1.56 (0.07)
Foreign exchange valuation reserve - 3,070,346 3,070,346
Equity 82,162,738 81,049,523 (1,113,215)

- 64 -
33. RETIREMENT BENEFIT PLANS
The Group’s retirement benefit plans include defined contribution and defined benefit plans. For defined
benefit plans, employee benefit expenses were calculated using the actuarially determined pension cost
discount rate as of December 31, 2018 and 2017, and recognized respectively period.
The Group recognized its contributions under defined benefit plans as pension expenses (recognized as
employee benefits) amounting to $6,307 thousand $9,501 thousand, $14,018 thousand and $18,536
thousand, respectively and recognized pension expenses (recognized as employee benefits) under defined
contribution plans amounting to $153,149 thousand $151,501 thousand, $305,561 thousand and $305,251
thousand, respectively for the three and six months ended June 30, 2019 and 2018.
34. OTHER FINANCIAL LIABILITIES
June 30,
2019
December 31,
2018
June 30,
2018
Separate-account product liabilities $ 71,491,586 $ 63,501,665 $ 62,878,397
Customers’ equity accounts - futures 28,038,277 21,398,531 21,811,760
Principal received on structured notes 23,737,840 26,253,350 24,122,110
Others 386,492 385,853 383,268
$ 123,654,195 $ 111,539,399 $ 109,195,535
35. EQUITY
a. Capital
Common stock
June 30,
2019
December 31,
2018
June 30,
2018
Numbers of shares authorized (in thousands) 20,000,000 20,000,000 20,000,000
Shares authorized $ 200,000,000 $ 200,000,000 $ 200,000,000
Number of shares issued and fully paid
(in thousands) 14,965,982 14,963,356 14,957,295
Shares issued $ 149,659,821 $ 149,633,560 $ 149,572,949
b. Capital surplus
June 30,
2019
December 31,
2018
June 30,
2018
Arising from treasury stock transactions $ 714,108 $ 1,449,472 $ 1,050,529
Share-based payments awards 87,978 86,798 92,930
Difference between consideration and
carrying amounts adjusted arising from
changes in percentage of ownership in
subsidiaries 80,994 80,994 80,994
Others - 13,728 16,116
$ 883,080 $ 1,630,992 $ 1,240,569

- 65 -
The premium from shares issued in excess of par (share premium from issuance of common shares,
treasury share transactions and excess of consideration received over the carrying amount of the
subsidiaries’ net assets during disposal or acquisition) and donations may be used to offset a deficit; in
addition, when the Corporation has no deficit, such capital surplus may be distributed as cash dividends
or transferred to capital limited to a certain percentage of the Corporation’s capital surplus and once a
year.
The capital surplus from long-term investments may not be used for any purpose.
Under Order No. 10200017220 issued by the Financial Supervisory Commission (FSC), if the capital
surplus obtained by a financial holding company through a stock conversion comes from its
subsidiaries’ unappropriated earnings net of legal reserve and special reserve, the surplus may be
distributed as cash dividends or transferred to capital in the period of conversion, and the distribution is
exempted from the appropriation restrictions of Article 41 of the Securities and Exchange Act and
Article 8 of the Securities and Exchange Act Enforcement Rules.
c. Special revenue
According to Rule No. 09900738571 issued by FSC and Rule No. 10000002891 issued under
Regulations Governing Securities Firms, Grand Cathay and GCFC reclassified the default reserve and
the trading loss reserve that had been set up until December 31, 2010 to special reserve. The Group also
recognizes special revenue according to the percentage of holdings by the Group to subsidiaries directly
and indirectly.
This special reserve should be used only to offset a deficit or when the legal reserve has reached 50% of
the Corporation’s paid-in capital, up to 50% thereof may be transferred to paid-in capital or according
to Rule No. 09900738571 issued by FSC, the Corporation reclassified the legal reserve which exceed
paid-in capital, then reversed the surpass part to retained earnings in line with the approval of FSC.
Under a directive issued by the SFB, whenever the components of shareholders’ equity which includes
unrealized gains or losses on financial instruments and cumulative translation adjustment but not
treasury stock have debit balances, a special reserve equal to the total debit balance should be
appropriated from the current year’s earnings and unappropriated earnings generated in the prior years.
Any special reserve appropriated may be reversed to the extent of the decrease in the net debit balance.
When transitioning to IFRSs, the Group recognizes or reserves special revenue, under Rule No.
1010012865 issued by the FSC on April 6, 2012 and the directive titled “Questions and Answers for
Special Reserves Appropriated Following Adoption of IFRSs”.
d. Appropriation of earnings
To continually expand the Corporation’s operations and increase its profitability as well as comply with
the Corporation Act and relevant regulations, the Corporation adopts the residual dividend policy. The
Corporation decides the conditions for time and amount of dividend allocation based on regulations and
the Company’s Articles of Incorporation. Taking the Corporation’s business plan into account, the
Corporation would pay dividends in the form of stock. In any case the cash dividends should not be less
than 10% of total dividends distributed.
The board of director revised the proposal of the remaining net income and unappropriated accumulated
earnings can cover previous years’ accumulated losses and related taxes, if any, are sequenced as
follows legal reserve on the current year’s net income, followed by a special reserve or reversal defined
by laws and plus the earnings as dividends to shareholders. After the distribution of priority preferred
share dividends in accordance with the regulations, the final remainder of distribution for bonus with
30% to 100% of distribution given the unappropriated earnings at the beginning of the period, as
proposed by the board of directors and approved in the shareholders’ meeting.

- 66 -
The appropriation of earnings should be resolved by the shareholders in the following year and given
effect to in the financial statements of that year.
On June 14, 2019, the board of the directors approved the earnings appropriation and capital surplus
cash payment of 2018. On June 22, 2018, shareholders’ meeting approved the resolution on the
appropriations from the earnings of 2017, including bonus to employees and remuneration to directors
and supervisors, as follows:
Earnings Appropriation
Dividends Per Share
(NT$)
2018 2017 2018 2017
Earnings appropriation
Legal reserve $ 785,269 $ 1,169,529
Appropriation (reversal) of special
reserve 10,232,858 (1,713,561)
Cash dividends 3,666,666 8,974,377 $ 0.245 $ 0.600
Capital surplus cash payment
Capital surplus 823,129 - 0.055 -
Related information can be accessed at the Market Observation Post System on website of the Taiwan
Stock Exchange (http://emops.tse.com.tw).
e. Non-controlling interests
For the Six Months Ended
June 30
2019 2018
Beginning balance $ 64,330,223 $ 81,544,066
Effect of retrospective application and retrospective restatement - 1,743,732
Attributable to non-controlling interests
Share of profit for the period 3,794,893 3,157,130
Exchange differences on translation of foreign financial
statements 8,094 12,568
Actual losses arising from defined benefit plans - (82)
Gain (loss) on equity instruments measured at FVTOCI 1,701,065 (1,649,385)
Gain (loss) on debt instrument measured at FVTOCI 14,201,830 (9,900,115)
Other comprehensive income (loss) reclassified using the
overlay approach 10,865,098 (3,596,733)
Payment of cash dividends by subsidiaries (61,257) (1,993,801)
Non-controlling interests arising from issuance of ordinary
shares for cash of subsidiaries 6,235,645 -
Others 94,460 73,239
Ending balance $ 101,170,051 $ 69,390,619

- 67 -
36. SUBSIDIARY INFORMATION OF NON-CONTROLLING INTERESTS
Non-controlling Interests Held by the
Proportion of Equity
Subsidiaries
The Main Place of
Business
June 30,
2019
December 31,
2018
June 30,
2018
China Life Insurance Company
Limited
Taipei 65.18% 65.04% 65.04%
Net Income Attributed to Non-controlling Interests
For the Three Months Ended
June 30 For the Six Months Ended
June 30
2019 2018 2019 2018
China Life Insurance Company
Limited $ 2,456,353 $ 1,126,529 $ 3,764,162 $ 3,093,368
Non-controlling Interests
June 30,
2019 December 31,
2018
June 30,
2018
China Life Insurance Company Limited $ 97,530,619 $ 60,661,102 $ 65,753,016
The following aggregated financial information was prepared based on the amount before the intercompany
transaction sales, and it has reflected the impact of the purchase method when the company acquired China
Life Insurance Company Limited.
China Life Insurance Company Limited
June 30,
2019
December 31,
2018
June 30,
2018
Total assets $ 1,919,374,092 $ 1,734,540,477 $ 1,644,175,773
Total liabilities 1,770,747,170 1,642,279,604 1,544,086,196
Equity $ 148,626,922 $ 92,260,873 $ 100,089,577
Equity attributable to:
Owners of parent $ 51,096,303 $ 31,599,771 $ 34,336,561
Non-controlling interest 97,530,619 60,661,102 65,753,016
$ 148,626,922 $ 92,260,873 $ 100,089,577

- 68 -
For the Three Months Ended
June 30 For the Six Months Ended
June 30
2019 2018 2019 2018
Revenue $ 83,823,952 $ 82,097,714 $ 175,415,457 $ 154,843,816
Net profit for the period $ 3,776,130 $ 1,732,012 $ 5,786,856 $ 4,755,983
Other comprehensive income 15,204,353 (10,019,610) 41,163,961 (23,267,892)
Total comprehensive income $ 18,980,483 $ (8,287,598) $ 46,950,817 $ (18,511,909)
Net profit attributable to:
Owners of parent $ 1,319,777 $ 605,483 $ 2,022,694 $ 1,662,615
Non-controlling interest 2,456,353 1,126,529 3,764,162 3,093,368
$ 3,776,130 $ 1,732,012 $ 5,786,856 $ 4,755,983
Comprehensive income attributable to:
Owners of parent $ 6,633,425 $ (2,897,213) $ 16,411,406 $ (6,471,468)
Non-controlling interest 12,347,058 (5,390,385) 30,539,411 (12,040,441)
$ 18,980,483 $ (8,287,598) $ 46,950,817 $ (18,511,909)
For the Six Months Ended
June 30
2019 2018 Cash flows
From operating activities $ 33,037,927 $ 39,279,187
From investing activities (50,128,739) (35,144,562)
From financing activities 9,201,718 -
Net increase (decrease) in cash $ (7,889,094) $ 4,134,625
37. TREASURY SHARES
Reason for Repurchase
Shares at
Beginning of
the Period (In
Thousands)
Share Increase
During the
Period (In
Thousands)
Share
Decrease
During the
Period (In
Thousands)
Shares at End
of the Period
(In
Thousands)
For the six months ended
June 30, 2019
Reclassification of the
Corporation’s stock held by
subsidiaries and recognized as
long-term investment 443,531 - 31,304 412,227
For the six months ended
June 30, 2018
Reclassification of the
Corporation’s stock held by
subsidiaries and recognized as
long-term investment 519,062 - 39,846 479,216

- 69 -
The Corporation’s shares held by subsidiaries are regarded as treasury stock. The Corporation’s shares held
by KGI Securities, calculated at the Corporation’s stockholding percentage of book value on the completion
day of acquisition were treated as treasury stock. The market prices of the shares were $2,049,116
thousand, $2,399,876 thousand and $3,150,832 on June 30, 2019, December 31, 2018 and June 30, 2018,
respectively. KGI Securities entered into a trust contract with China Trust Commercial Bank (CTBC) in
September 2018, and entrusted shares of Capital Securities Corporation to them. During the contract period,
the trustee, CTBC, would deal with the shares in accordance with the contract. The Corporation’s shares
held by China Life Insurance are also treated as treasury stock and recognized book value by the proportion
of shares acquired on the purchase date of acquisition. The market prices of the shares were $1,854,676
thousand, $1,911,243 thousand and $2,192,423 thousand on June 30, 2019, December 31, 2018 and June
30, 2018, respectively.
Under the Securities and Exchange Act, the Corporation should not acquire treasury stock in excess of 10%
of its total shares outstanding. In addition, the Corporation should not spend more than the aggregate
amount of the retained earnings, paid-in capital in excess of par value, and realized capital surplus arising
from gains on disposal of properties and donated capital. The Corporation should not use treasury shares to
secure any of its obligations and should not exercise any shareholders’ rights on those shares.
38. INTEREST PROFIT, NET
For the Three Months Ended
June 30 For the Six Months Ended
June 30
2019 2018 2019 2018
Interest revenues
Securities $ 13,941,041 $ 11,838,902 $ 27,303,238 $ 22,747,354
Discounts and loans 3,002,019 2,724,561 5,942,941 5,259,595
Margin loans and refinancing
margin 361,764 536,800 697,237 1,052,251
Due from and call loans to banks 105,723 119,000 212,922 235,169
Others 783,309 625,577 1,539,290 1,150,221
18,193,856 15,844,840 35,695,628 30,444,590
Interest expenses
Deposits 1,342,439 1,032,768 2,705,630 1,926,969
Notes and bonds issued under
repurchase agreements 618,610 409,987 1,194,850 756,596
Deposit from banks 116,830 118,818 226,793 224,829
Borrowing interest expense 61,055 112,675 159,073 190,935
Corporate bonds 93,953 107,872 188,545 220,547
Others 194,800 127,199 387,406 244,315
2,427,687 1,909,319 4,862,297 3,564,191
Interest profit, net $ 15,766,169 $ 13,935,521 $ 30,833,331 $ 26,880,399

- 70 -
39. SERVICE FEE AND COMMISSION, NET
For the Three Months Ended
June 30 For the Six Months Ended
June 30
2019 2018 2019 2018 Service fee revenue and
commission income
Brokerage $ 2,050,798 $ 2,378,608 $ 3,834,519 $ 4,839,189
Commission income - insurance 276,107 210,689 489,267 474,199
Security lending 193,888 169,569 365,335 301,036
Trust 135,055 140,972 242,163 323,777
Others 577,592 510,009 1,141,943 1,003,531
3,233,440 3,409,847 6,073,227 6,941,732
Service fee expense and
commission expense
Commission expense - insurance 2,725,976 2,957,767 6,183,894 5,461,541
Brokerage 353,068 308,621 650,527 611,642
Others 407,512 360,154 858,880 739,056
3,486,556 3,626,542 7,693,301 6,812,239
Service fee and commission, net $ (253,116) $ (216,695) $ (1,620,074) $ 129,493
40. INSURANCE BUSINESS, NET
For the Three Months Ended
June 30 For the Six Months Ended
June 30
2019 2018 2019 2018
Insurance business income
Premium income $ 64,568,931 $ 67,547,708 $ 138,402,113 $ 127,485,757
Reinsurance premium expense (323,917) (301,801) (661,030) (606,278)
Changes in unearned premium reserve (556,330) (416,226) (235,889) (420,799)
Retained earned premium 63,688,684 66,829,681 137,505,194 126,458,680
Separate-account insurance products
revenues 2,089,196 2,452,542 6,294,759 3,460,310
65,777,880 69,282,223 143,799,953 129,918,990
Insurance business expense
Insurance claim payments (28,310,063) (23,326,471) (52,417,143) (42,184,540)
Claims recovered from reinsures 198,494 218,647 354,111 392,178
Retained claim payments (28,111,569) (23,107,824) (52,063,032) (41,792,362)
Brokerage expense (3,344) (2,104) (4,799) (3,456)
Disbursements toward industry
stability fund (96,869) (128,355) (207,632) (242,250)
Changes in foreign exchange valuation
reserve (981,739) (1,055,680) (2,022,549) (366,584)
Separate-account insurance products
expenses (2,089,196) (2,452,542) (6,294,759) (3,460,310)
(31,282,717) (26,746,505) (60,592,771) (45,864,962)
Insurance business, net $ 34,495,163 $ 42,535,718 $ 83,207,182 $ 84,054,028

- 71 -
41. GAIN (LOSS) ON FINANCIAL ASSETS OR LIABILITIES MEASURED AT FVTPL
For the Three Months Ended
June 30 For the Six Months Ended
June 30
2019 2018 2019 2018
Stocks $ 5,381,334 $ 529,175 $ 15,388,763 $ 3,431,305
Derivatives (8,228,273) (32,633,247) (15,126,156) (18,120,221)
Mutual funds 4,444,689 560,680 8,804,952 1,329,532
Bonds 939,151 (481,065) 1,920,116 226,776
Operating securities (223,171) 247,863 1,691,855 326,960
Others 2,123,393 169,762 3,891,085 (2,956,847)
$ 4,437,123 $ (31,606,832) $ 16,570,615 $ (15,762,495)
For the three and six months ended June 30, 2019 and 2018, the Group’s financial assets and liabilities at
fair value through profit or loss included interest revenue of $1,550,032 thousand $875,464 thousand,
$2,979,161 thousand and $1,544,283 thousand, respectively, dividend income of $2,126,907 thousand
$1,350,384 thousand, $2,466,950 thousand and $1,426,213 thousand, respectively and interest expense of
$354,032 thousand $330,313 thousand, $699,039 thousand and $590,801 thousand, respectively.
42. REALIZED GAIN (LOSS) ON FINANCIAL ASSETS AT FAIR VALUE THROUGH OTHER
COMPREHENSIVE INCOME
For the Three Months Ended
June 30 For the Six Months Ended
June 30
2019 2018 2019 2018
Gain on bond disposal $ 1,400,010 $ 141,899 $ 3,391,316 $ 1,838,728
Dividend income 113,825 147,335 124,177 157,345
$ 1,513,835 $ 289,234 $ 3,515,493 $ 1,996,073
43. EMPLOYEE BENEFITS, DEPRECIATION AND AMORTIZATION EXPENSES
For the Three Months Ended
June 30 For the Six Months Ended
June 30
2019 2018 2019 2018
Employee benefit expense
Salaries and wages $ 3,595,494 $ 3,121,626 $ 6,965,973 $ 6,640,643
Employee insurance 261,445 249,363 563,382 551,123
Pension 159,456 161,002 319,579 323,787
Others 276,179 232,731 564,562 499,076
$ 4,292,574 $ 3,764,722 $ 8,413,496 $ 8,014,629
Depreciation and amortization
expenses $ 816,030 $ 605,232 $ 1,619,445 $ 1,206,585

- 72 -
The Company’s Articles of Incorporation stipulate to distribute employees’ compensation and remuneration
to directors and supervisors at the rates no less than 1% and no higher than 1%, respectively, of net profit
before income tax, employees’ compensation, and remuneration to directors and supervisors. For the six
months ended June 30, 2019 and 2018, the employees’ compensation and the remuneration to directors and
supervisors both were $79,612 thousand and $64,695 thousand, respectively.
The employees’ compensation bonus of employees and remuneration to directors and supervisors for 2018
and 2017 which have been approved by the board of directors on March 25, 2019 and March 26, 2018,
respectively, were as follows. The employees’ compensation bonus and remuneration of directors and
supervisors for 2018 and 2017 were reported on the shareholders meeting on June 14, 2019 and June 22,
2018.
For the Year Ended December 31
2018 2017
Employees’ compensation to employees $ 80,000 $ 116,000
Remuneration of directors and supervisors 79,000 110,000
If there is a change in the proposed amounts after the annual consolidated financial statements were
authorized for issue, the differences are recorded as a change in accounting estimate.
There was no difference between the amounts recognized in the financial statements for the years ended
December 31, 2018 and 2017.
The information on the proposed and approved compensation to employees and directors and supervisor is
available on the Market Observation Post System (M.O.P.S.) website of the Taiwan Stock Exchange
(http://emops.tse.com.tw).
44. INCOME TAX
Under Rule No. 910458039 issued by the Ministry of Finance on February 12, 2003, a financial holding
company and its domestic subsidiaries holding over 90% of shares issued by the financial holding company
for 12 months within the same tax year may choose to adopt the linked-tax system for income tax filings in
accordance with Article 49 of Financial Holding Company Act and Article 40 of Business Mergers and
Acquisitions Act. Thus, the Corporation adopted the linked-tax system for income tax filing with its eligible
subsidiaries, income tax and unappropriated earnings tax filings.
The accounting treatment applied to linked-tax system for income tax filings is to adjust the difference
between the consolidated current/deferred taxes and the individual current/deferred taxes of the Group, and
allocate income tax expense/benefit to the Corporation and each subsidiary’s pro rata; related amounts are
recognized as current tax assets or current tax liabilities.

- 73 -
a. Income tax expense recognized in profit or loss
The major components of tax expense (benefit) were as follows:
For the Three Months Ended
June 30 For the Six Months Ended
June 30
2019 2018 2019 2018
Current income tax
Current period $ 272,258 $ (965,402) $ 564,018 $ 1,033,191
Prior years (234,811) (62,081) (233,558) (148,088)
37,447 (1,027,483) 330,460 885,103
Deferred income tax
Current period 479,812 2,061,374 719,722 (15,670)
Adjustment in tax rate - 77 - (696,409)
479,812 2,061,451 719,722 (712,079)
Income tax expense recognized
in profit or loss $ 517,259 $ 1,033,968 $ 1,050,182 $ 173,024
In February 2018, the Income Tax Act in the ROC was amended and, starting from 2018, the corporate
income tax rate will be adjusted from 17% to 20%. In addition, the rate of the corporate surtax
applicable to 2018 unappropriated earnings will be reduced from 10% to 5%.
b. Income tax expense (benefit) recognized in other comprehensive income were as follows:
For the Three Months Ended
June 30 For the Six Months Ended
June 30
2019 2018 2019 2018
Current income tax
Current period $ (1,011) $ - $ - $ -
(Gain) loss on equity
instruments at fair value
through other
comprehensive income - - - (960)
Deferred income tax
Adjustment in tax rate - - - 409,086
(Gain) loss on equity
instruments at fair value
through other
comprehensive income (41,399) (389,389) 489,617 (752,228)
(Gain) loss on debt
instruments at fair value
through other
comprehensive income 2,544,138 (1,289,168) 5,295,211 (3,145,950)
(Gain) loss on
reclassification using the
overlay approach (12,469) (595,176) 1,107,783 (1,110,050)
Income tax expense (benefit) $ 2,489,259 $ (2,273,733) $ 6,892,611 $ (4,600,102)

- 74 -
c. Income tax expense (benefit) recognized in equity were as follows:
For the Three Months Ended
June 30 For the Six Months Ended
June 30
2019 2018 2019 2018
Current income tax (benefit)
Disposal of equity
instruments at fair value
through other
comprehensive income $ 1,756 $ (6,307) $ 1,756 $ (28,795)
Deferred income tax (benefit)
Gain (loss) on equity
instruments at fair value
through other
comprehensive income (1,756) 6,307 (1,756) 28,795
Deferred income tax related
to tax losses and reversals 968 - (2,505) -
$ 968 $ - $ (2,505) $ -
d. Income tax assessments
The Corporation’s income tax returns through 2014 had been examined by the tax authorities. The
Corporation disagreed with the tax authorities’ assessments of its 2011 tax returns and thus filed tax
appeals.
The income tax returns of CDIB Management Consulting Corporation and CDC Finance & Leasing
Corp. through 2017 had been examined by the tax authorities. Income tax returns of KGI Bank and
formerly Wanyin Insurance Broker through 2014 had been examined by the tax authorities.
The income tax returns of formerly Grand Cathay through 2013 had been examined by the tax
authorities. Formerly Grand Cathay disagreed with the tax authorities’ assessments of its 2011 tax
returns and thus filed tax appeals.
The income tax returns of KGI Securities for the years through 2014 had been examined by the tax
authorities.
The income tax returns of KGI Securities Investment Advisory Co., Ltd., KGI Insurance Brokers Co.,
Ltd., KGI Venture Capital Co., Ltd., KGI Securities Investment Trust Co., Ltd., KGI Futures Co., Ltd.
and KGI Information Technology Co., Ltd. for the year through 2017 had been examined by the tax
authorities. Income tax returns of GSFC through 2016 had been examined by the tax authorities
CDIB Capital Group’s income tax returns through 2014 had been examined by the tax authorities.
Income tax returns of CDIB Capital Management Inc., through 2017 had been examined by the tax
authorities. Income tax returns of CDIB Venture Capital Corp. through 2016 and as of 2014 had been
examined by the tax authorities.
Income tax returns of China Development Asset Management Corp., CHG3, CHG4, Development
Industrial Bank Asset Management Corp., through 2017 had been examined by the tax authorities.
Capital Life Insurance’s income tax returns through 2016 had been examined by the tax authorities.

- 75 -
45. EARNINGS PER SHARE
(New Taiwan Dollars)
For the Three Months Ended
June 30 For the Six Months Ended
June 30
2019 2018 2019 2018
Basic EPS $ 0.29 $ 0.19 $ 0.54 $ 0.42
Diluted EPS $ 0.29 $ 0.19 $ 0.54 $ 0.42
The earnings and weighted average number of common shares outstanding in the computation of EPS were
as follows:
Net Profit for the Period
For the Three Months Ended
June 30 For the Six Months Ended
June 30
2019 2018 2019 2018
Earnings used in the computation
of EPS $ 4,191,750 $ 2,773,776 $ 7,801,443 $ 6,050,400
Weighted Average Number of Common Shares Outstanding (In Thousand Shares)
For the Three Months Ended
June 30 For the Six Months Ended
June 30
2019 2018 2019 2018
Weighted average number of
common shares outstanding in
computation of basic EPS 14,550,635 14,475,868 14,536,948 14,469,389
Effect of dilutive potentially
common shares:
Employee share options 13,039 16,468 13,254 16,573
Restricted shares 380 1,948 735 2,738
Weighted average number of
common shares outstanding in
computation of diluted EPS 14,564,054 14,494,284 14,550,937 14,488,700
46. SHARE-BASED PAYMENT ARRANGEMENTS
a. Employee share option plan of the Corporation
The Corporation acquired 100% of KGI Bank share through a share swap. In accordance with this
contract, the Corporation granted options to replace KGI Bank’s options granted in May and August
2011. Qualified employees of KGI Bank were granted 30,862 and 11,088 thousand options on
conversion date. Each option entitles the holder to subscribe for one common share of the Company.
The options granted are valid for 6.64 and 6.96 years and exercisable at certain percentages from now.
Besides, the Corporation granted 44,850 thousand employee stock options in October 2014. Each
option entitles the holder to subscribe for one common share of the Company. The options granted are
valid for 7 years and exercisable 2 years after the issuance date.

- 76 -
For any subsequent changes in the Corporation’s capital surplus, the exercise price is adjusted
accordingly.
Information on employee share options was as follows:
For the Six Months Ended June 30
2019 2018
Number of
Options
(In Thousands)
Weighted-
average
Exercise
Price (NT$)
Number of
Options
(In Thousands)
Weighted-
average
Exercise
Price (NT$)
Balance at January 1 56,166 $ 7.54 64,118 $ 7.93
Options exercised (2,626) 7.48 (1,121) 8.00
Options invalid (270) 7.53 (440) 7.96
Balance at June 30 53,270 7.55 62,557 7.93
Options exercisable, end of period 45,492 7.55 40,177 7.92
Weighted-average remaining
contractual life (years) 2.10 3.12
The weighted-average share price at the date of exercise of share options from January 1 to June 30,
2019 and 2018 were $9.99 and $10.41, respectively.
Options granted on conversion date were priced using the trinomial trees model and the inputs to the
model were as follows:
Grant-date share price $9.54-$10
Exercise price $7.68-$9.99
Expected volatility 14.94%-15.45%
Expected life 6.64-7 years
Expected dividend yield 1.50%
Risk-free interest rate 1.5647%-1.6283%
Early exercise of the multiplier 1.63
Expected volatility was based on the historical share price volatility over the past 1 year.
Compensation costs for the three and six months ended June 30, 2019 and 2018 were $544 thousand,
$1,962 thousand, $999 thousand and $3,777 thousand.
b. Issue restricted share plan
The board of directors of the Corporation has decided to issue restricted shares plan which is $56,997
thousand in total, and $10 per face value totaled 5,700 thousand shares with issue price of $0 (free
issuance) at February 9, 2015. Further, the board of directors made February 13, 2015 as the base-date
for capital increase. Fair value on the payment day of the stock was $10.80.
The board of directors of the Corporation has decided to issue restricted shares plan which is $44,780
thousand in total, and $10 per face value totaled 4,478 thousand shares with issue price of $0 (free
issuance) at February 1, 2016. Further, the board of directors made February 4, 2016 as the base-date
for capital increase. Fair value on the payment day of the stock was $7.61.

- 77 -
The board of directors of the Corporation has decided to issue restricted shares plan which is $13,216
thousand in total, and $10 per face value totaled 1,322 thousand shares with issue price of $0 (free
issuance) at January 19, 2017. Further, the board of directors made January 25, 2017 as the base-date
for capital increase. Fair value on the payment day of the stock was $7.98.
The vesting portion of shares is summarized and managed year by year, and the vesting rate of the
shares is 40%, 30% and 30% for 1-year, 2-year and 3-year respectively. Employees who have not met
the vesting conditions cannot sell, pledge, transfer, donate, asking the Corporation to buy them back or
in any other way dispose of these shares except inheritance. Besides, employees don’t have preemptive
rights when capital increase but do share the same rights of issued common stock (which includes but
not confined to cash dividend, stock dividend, capital decrease, capital surplus cash (stock) or any rights
that was originated from legal subject such as consolidation, split or stock-exchange which we called
“allocated rights” thereafter). Allocated rights have to be in the trust before meeting the vesting
conditions.
After the restricted shares are allocated to employees, the Corporation will retrieve and cancel the
stocks with no reimbursement if the vesting conditions are not met. The Corporation will also retrieve
the allocated rights at the rate of shares of vesting conditions not met divided by shares allocated, with
no reimbursement. If it is stocks that are retrieved, they shall be cancelled in each year of the vesting
period.
For the three and six months ended June 30, 2019 and 2018, the Corporation recognized $264 thousand,
$1,511 thousand, $812 thousand and $3,961 thousand as compensation cost.
47. EQUITY TRANSACTIONS WITH NON-CONTROLLING INTERESTS
On June 25, 2019, the Group subscribed for the additional new shares issued by of China Life Insurance at
a percentage different from its existing ownership percentage, resulting in a reduction of its equity interests
in China Life Insurance from 34.96% to 34.82%.
The above transactions were accounted for as equity transactions, since there is no change of the Group’s
control over China Life Insurance.
China Life
Insurance
Cash consideration received $ 6,157,290
Changes in non-controlling interests (6,235,645)
Reattribution of other equity to (from) non-controlling interests
- exchange differences on translating the financial statements of foreign operations 23
- unrealized gain (loss) on financial assets at FVTOCI 11,727
- other comprehensive income reclassified using the overlay approach 5,322
Treasury shares (7,299)
Capital surplus 216
Differences recognized from equity transactions $ (68,366)
Line items adjusted for equity transactions
Capital surplus - changes in percentage of ownership interests in subsidiaries $ (67,394)
Retained earnings (972)
$ (68,366)

- 78 -
48. RELATED-PARTY TRANSACTIONS
The significant transactions and relationship with related parties (in addition to those disclosed in other
notes) are summarized below:
a. Related parties
Related Party Relationship with the Group
Others Other related parties
b. Significant transactions with related-parties
1) Cash in banks (recognized as cash and cash equivalents)
Amount %
December 31, 2018 $ 291,210 -
June 30, 2018 29,212 -
For the three and six months ended June 30, 2019 and 2018, the interest revenues from cash in bank
were $21 thousand, $139 thousand, $34 thousand and $149 thousand, respectively.
2) Due from banks (recognized as cash and cash equivalents)
Amount %
December 31, 2018 $ 200,611 -
June 30, 2018 235,943 -
For the three and six months ended June 30, 2019 and 2018, the interest revenues from due from
banks were all $0 thousand.
3) Purchase funds managed by related parties (recognized as financial assets at fair value through
profit or loss)
Amount %
June 30, 2019 $ 9,413,550 2
December 31, 2018 6,032,510 2
June 30, 2018 370,002 -
4) Bank debentures (recognized as debt instruments measured at amortized cost)
Amount %
December 31, 2018 $ 2,571,674 -
June 30, 2018 2,518,850 -
For the three and six months ended June 30, 2019 and 2018, the interest revenues from bank
debentures were $22,437 thousand, $25,619 thousand, $49,257 thousand and $44,682 thousand,
respectively.

- 79 -
5) Purchase and sale of bonds
Purchase of
Bonds Sale of Bonds
For the six months ended June 30, 2019
Other related parties $ 49,636 $ 739,213
For the six months ended June 30, 2018
Other related parties 1,076,993 731,839
6) Revenue receivable (recognized as receivables, net)
Amount %
June 30, 2019 $ 719,932 1
December 31, 2018 123,303 -
June 30, 2018 377,962 -
7) Receivable on margin loans (recognized as receivables, net)
Amount %
June 30, 2019 $ 21,352 -
December 31, 2018 15,935 -
June 30, 2018 16,091 -
8) Credit card receivable (recognized as receivables, net)
Amount %
June 30, 2019 $ 38,741 -
December 31, 2018 22,433 -
June 30, 2018 39,120 -
9) Receivables from securities sale (recognized as receivables, net)
Amount %
December 31, 2018 $ 459,512 -
10) Other receivables (recognized as receivables, net)
Amount %
June 30, 2019 $ 54,583 -
December 31, 2018 40,374 -
June 30, 2018 8,509 -

- 80 -
11) Discounts and loans, net
KGI Bank
Amount %
Interest Rate
(%)
June 30, 2019 $ 1,123,113 - 1.54-5.99
December 31, 2018 1,150,686 - 1.54-15.00
June 30, 2018 1,015,459 - 1.54-15.00
For the three and six months ended June 30, 2019 and 2018, the interest revenues from discounts
and loans were $4,282 thousand, $3,964 thousand, $8,719 thousand and $8,227 thousand,
respectively.
For the Six Months Ended June 30, 2019
(In Thousands of New Taiwan Dollars)
Category
Account
Volume or
Name of
Related
Party
Highest
Balance
Ending
Balance Normal Overdue
Type of
Collateral
Is the
Transaction
at Arm’s
Length
Commercial
Term
Consumer loans 34 $ 31,039 $ 19,312 $ 19,312 $ - None Yes
Residential mortgage loans 82 1,274,425 1,096,100 1,096,100 - Real estate Yes
Others 6 9,050 7,701 7,701 - Real estate Yes
For the Year Ended December 31, 2018
(In Thousands of New Taiwan Dollars)
Category
Account
Volume or
Name of
Related
Party
Highest
Balance
Ending
Balance Normal Overdue
Type of
Collateral
Is the
Transaction
at Arm’s
Length
Commercial
Term
Consumer loans 40 $ 34,371 $ 21,486 $ 21,486 $ - None Yes
Residential mortgage loans 85 1,399,026 1,123,527 1,123,527 - Real estate Yes
Others 12 19,712 5,673 5,673 - Real estate Yes
For the Six Months Ended June 30, 2018
(In Thousands of New Taiwan Dollars)
Category
Account
Volume or
Name of
Related
Party
Highest
Balance
Ending
Balance Normal Overdue
Type of
Collateral
Is the
Transaction
at Arm’s
Length
Commercial
Term
Consumer loans 37 $ 27,755 $ 21,250 $ 21,250 $ - None Yes
Residential mortgage loans 74 1,216,764 985,525 985,525 - Real estate Yes
Others 10 14,964 8,684 8,684 - Real estate Yes
China Life Insurance
Amount %
June 30, 2019 $ 10,748 -
December 31, 2018 4,134 -
June 30, 2018 602 -

- 81 -
12) Issuance of common stock for cash of China Life Insurance
For the Six
Months Ended
June 30
Amount
Other related parties $ 138,787
13) Call loans from banks (recognized as deposits from the Central Bank and financial institutions)
December 31, 2018 June 30, 2018
Amount % Amount %
Other related parties $ 908,555 4 $ 4,457,500 13
For the three and six months ended June 30, 2019 and 2018, the interest expenses from call loans
from banks were $4,907 thousand, $2,981 thousand, $14,477 thousand and $6,450 thousand,
respectively.
14) Other payables (recognized as payables)
Amount %
June 30, 2019 $ 26,118 -
December 31, 2018 21,006 -
June 30, 2018 77,089 -
15) Deposits and remittances
Amount %
Interest Rate
(%)
June 30, 2019 $ 1,527,643 - 0-5.58
December 31, 2018 1,117,220 - 0-5.58
June 30, 2018 1,014,325 - 0-5.58
For the three and six months ended June 30, 2019 and 2018, the interest expenses from deposits and
remittances were $3,194 thousand, $2,165 thousand, $6,158 thousand and $4,279 thousand,
respectively.
16) Short-term borrowings (recognized as other borrowings)
Amount %
June 30, 2018 $ 451,400 1
For the three and six months ended June 30, 2019 and 2018, the interest expenses from short-term
borrowings were $1,343 thousand, $1,739 thousand, $3,696 thousand and $3,779 thousand,
respectively.

- 82 -
17) Premium income (recognized as net income from insurance operations)
For the Three Months
Ended June 30
For the Six Months
Ended June 30
Amount % Amount %
2019
Other related parties $ 82,792 - $ 133,972 -
2018
Other related parties 69,881 - 119,000 -
18) Consulting service revenue (recognized as other noninterest profits and gains, net)
For the Three Months
Ended June 30
For the Six Months
Ended June 30
Amount % Amount %
2019
Other related parties $ 144,804 25 $ 300,471 26
2018
Other related parties 136,917 13 284,398 17
19) Donation (recognized as other general and administrative expense)
For the Three Months
Ended June 30
For the Six Months
Ended June 30
Amount % Amount %
2019
Other related parties $ 30,000 2 $ 30,000 1
20) Gain (loss) on financial assets or liabilities measured at FVTPL-dividend income
For the Three Months
Ended June 30
For the Six Months
Ended June 30
Amount % Amount %
2019
Other related parties $ 39,306 1 $ 54,156 -

- 83 -
21) Outstanding derivative financial instruments
KGI Bank
December 31, 2018
(In Thousands of New Taiwan Dollars)
Related Party Contract Type Contract Period Contract
Amount
Valuation
Gain (Loss)
Balance Sheet
Account Balance
Other related parties
Interest rate swap contracts
March 17, 2017 - April 07, 2047
$ 12,320,368 $ 642,233 Financial assets at FVTPL
$ 150,929
Financial liabilities at
FVTPL
2,366
June 30, 2018
(In Thousands of New Taiwan Dollars)
Related Party Contract Type Contract Period Contract
Amount
Valuation
Gain (Loss)
Balance Sheet
Account Balance
Other related parties
Interest rate swap contracts
March 17, 2017 - April 07, 2047
$ 12,165,962 $ 867,930 Financial assets at FVTPL
$ 377,791
Financial liabilities at
FVTPL
3,531
China Life Insurance
December 31, 2018
(In Thousands of New Taiwan Dollars/US Dollars)
Related Party Contract Type Contract Period Contract
Amount
Balance Sheet
Account Balance
Other related parties Currency swap contracts November 16, 2018 -
February 27, 2019
US$ 299,000 Financial assets at
FVTPL
$ 14,352
October 08, 2018 - February 14, 2019
US$ 295,000 Financial liabilities at FVTPL
17,414
June 30, 2018
(In Thousands of New Taiwan Dollars/US Dollars)
Related Party Contract Type Contract Period Contract
Amount
Balance Sheet
Account Balance
Other related parties Currency swap contracts December 20, 2017 -
September 25, 2018
US$ 494,000 Financial liabilities at
FVTPL
$ 515,416
22) Issuance of letters of guarantee by related parties due to business needs
December 31,
2018
Other related parties $ 540,000

- 84 -
23) Compensation of key management personnel
For the Three Months Ended
June 30 For the Six Months Ended
June 30
2019 2018 2019 2018
Salary and short-term
benefits $ 154,406 $ 127,441 $ 302,778 $ 274,312
Share-based payment 996 1,223 1,444 3,438
Post-employment benefits 695 716 1,415 1,446
$ 156,097 $ 129,380 $ 305,637 $ 279,196
The terms of the transactions with related parties were similar to those for third parties, except for
certain preferential interest rates for employees’ savings in and borrowings from KGI Bank.
Based on the Banking Act 32 and 33, except for consumer loans and government loans, credits
extended by KGI Bank to any related party were fully secured, and the other terms of these credits
were similar to those for third parties.
c. Related-party transactions were at costs or prices of at least NT$100 million
The significant transactions and relationship of the Corporation’s subsidiaries with related parties were
summarized below:
KGI Bank and subsidiaries
Related Party
Relationship with the KGI Bank and
Subsidiaries
China Development Financial Holding Corporation Parent company
CDIB Capital Group and subsidiaries Subsidiary of the parent company
KGI Securities and subsidiaries Subsidiary of the parent company
China Development Asset Management Corp. Group
and subsidiaries
Subsidiary of the parent company
China Life Insurance Subsidiary of the parent company
Others Other related parties
1) Due from banks (recognized as cash and cash equivalents)
December 31, 2018 June 30, 2018
Amount % Amount %
Other related parties $ 200,611 3 $ 235,943 3
2) Futures contract (recognized as cash and cash equivalents and Financial assets at FVTPL)
December 31, 2018 June 30, 2018
Amount % Amount %
Subsidiary of the parent company $ 464,124 1 $ 720,376 1

- 85 -
3) Bank debentures (recognized as debt instruments measured at amortized cost)
December 31, 2018 June 30, 2018
Amount % Amount %
Other related parties $ 921,744 8 $ 914,756 8
4) Purchase and sale of bonds
Purchase of
Bonds
Sale of
Bonds
For the six months ended June 30, 2019
Subsidiary of the parent company $ 386,477 $ 702,331
For the six months ended June 30, 2018
Subsidiary of the parent company 3,431,410 431,412
Other related parties 877,050 -
5) Lease arrangements
June 30, 2019
Lease Liabilities Subsidiary of the parent company $ 154,061
Determination of rental price above is similar with market price, and payment of rental fee is on a
monthly/quarterly basis.
6) Call loans from other banks (recognized as deposits from the Central Bank and banks)
December 31, 2018 June 30, 2018
Amount % Amount %
Other related parties $ 908,555 4 $ 4,457,500 13
7) Payable on parent (recognized as current tax liabilities)
June 30, 2019 December 31, 2018 June 30, 2018
Amount % Amount % Amount %
Parent company $ 541,361 100 $ 530,563 100 $ 435,483 100
The payables resulted from CDFH and its eligible subsidiaries’ adopting the linked-tax system in
the filing of tax returns.

- 86 -
8) Deposits and remittances
Amount %
Interest Rate
(%)
June 30, 2019
Parent company $ 7,512,535 2 0-0.73
Subsidiary of the parent company 2,935,825 1 0-1.03
December 31, 2018
Parent company 5,019,205 1 0-0.73
Subsidiary of the parent company 18,239,625 4 0-1.03
June 30, 2018
Parent company 7,743,316 2 0-0.28
Subsidiary of the parent company 10,244,651 2 0-1.03
9) Service fee revenue
For the Three Months
Ended June 30
For the Six Months
Ended June 30
Amount % Amount %
2019
Subsidiary of the parent company $ 95,652 16 $ 178,556 15
2018
Subsidiary of the parent company 60,076 11 117,447 11
10) Outstanding derivative financial instrument
June 30, 2019
(In Thousands of New Taiwan Dollars)
Related Party Contract Type Contract Period Contract
Amount
Valuation
Gain (Loss)
Balance Sheet
Account Balance
Subsidiaries of the parent
company
Asset swap - interest rate swap
contracts
March 12, 2019 - February 26, 2022
$ 180,000 $ 7,163 Financial assets at FVTPL
$ 7,163
Asset swap - option March 12, 2019 - February 11, 2022
180,000 (13,169 ) Financial liabilities at FVTPL
13,169
Interest rate swap
contracts
November 04, 2016 -
January 24, 2020
372,864 3,150 Financial liabilities at
FVTPL
1,394
Currency swap
contracts
March 27, 2019 -
November 15, 2019
15,846,720 12,807 Financial assets at
FVTPL
81,025
Financial liabilities at
FVTPL
68,218

- 87 -
December 31, 2018
(In Thousands of New Taiwan Dollars)
Related Party Contract Type Contract Period Contract Amount
Valuation Gain (Loss)
Balance Sheet
Account Balance
Other related
parties
Interest rate swap
contracts
March 17, 2017 -
April 07, 2047
$ 12,320,368 $ 642,233 Financial assets at
FVTPL
$ 150,929
Financial liabilities at FVTPL
2,366
Subsidiaries of
the parent
company
Asset swap - interest
rate swap
contracts
January 18, 2017 -
February 01, 2020
602,120 (13,226 ) Financial assets at
FVTPL
2,740
Financial liabilities at FVTPL
7,058
Asset swap - option January 18, 2017 -
December 31, 2019
602,120 52,985 Financial liabilities at
FVTPL
14,231
Interest rate swap contracts
November 04, 2016 - November 06, 2020
636,173
(101 ) Financial assets at FVTPL
544
Financial liabilities at
FVTPL
4,544
Currency swap contracts
July 19, 2018 - February 27, 2019
15,520,165 36,905 Financial assets at FVTPL
49,613
Financial liabilities at
FVTPL
12,709
June 30, 2018
(In Thousands of New Taiwan Dollars)
Related Party Contract Type Contract Period Contract
Amount
Valuation
Gain (Loss)
Balance Sheet
Account Balance
Other related parties
Interest rate swap contracts
March 17, 2017 - April 07, 2047
$ 12,165,962 $ 867,930 Financial assets at FVTPL
$ 377,791
Financial liabilities at
FVTPL
3,531
Subsidiaries of the parent
company
Asset swap - interest rate swap contracts
April 06, 2016 - February 05, 2021
675,200 (2,072 ) Financial assets at FVTPL
8,516
Financial liabilities at
FVTPL
176
Asset swap - option April 06, 2016 - January 22, 2021
675,200 (19,465 ) Financial liabilities at FVTPL
97,210
Interest rate swap
contracts
November 04, 2016 -
November 06, 2020
1,088,850 (2,169 ) Financial assets at
FVTPL
204
Financial liabilities at FVTPL
7,256
Currency swap
contracts
December 19, 2017 -
September 21, 2018
13,877,500 487,002 Financial assets at
FVTPL
426,635
KGI Securities and subsidiaries
Related Party
Relationship with the KGI Securities and
Subsidiaries
China Development Financial Holding Corporation Parent company
CDIB Capital Group and subsidiaries Subsidiary of the parent company
KGI Bank and subsidiaries Subsidiary of the parent company
China Development Asset Management Corp. Group
and subsidiaries
Subsidiary of the parent company
China Life Insurance Subsidiary of the parent company
Others Other related parties
1) Cash in banks (recognized as cash and cash equivalents)
June 30, 2019 December 31, 2018 June 30, 2018
Amount % Amount % Amount %
Subsidiary of the
parent company $ 108,511 1 $ 2,738,863 20 $ 1,611,890 13

- 88 -
2) Financial assets at fair value through profit and loss - current
June 30, 2019 December 31, 2018 June 30, 2018
Amount % Amount % Amount %
Open ended fund
and money market
instruments
Other related parties $ 477,184 1 $ 465,958 1 $ 370,002 1
3) Financial assets at fair value through other comprehensive income - current
June 30, 2019 December 31, 2018 June 30, 2018
Amount % Amount % Amount %
Stocks
Parent company $ 2,049,116 11 $ 2,399,876 17 $ 3,150,832 28
4) Purchase and sale of bonds
Purchase of
Bonds
Sale of
Bonds
For the six months ended June 30, 2019
Subsidiary of the parent company $ 1,092,309 $ 13,237,468
Other related parties - 739,213
For the six months ended June 30, 2018
Subsidiary of the parent company 2,134,496 7,973,692
Other related parties 199,943 731,839
5) Guarantee deposits received in futures contracts
June 30, 2019 December 31, 2018 June 30, 2018
Amount % Amount % Amount %
Subsidiary of the
parent company $ 918,057 3 $ 919,916 4 $ 445,671 2
6) Accounts receivables
June 30, 2019
Amount %
Other related parties $ 380,542 1

- 89 -
7) Amounts held for settlement (recognized as other current assets)
June 30, 2018
Amount %
Subsidiary of the parent company $ 129,696 -
8) Restricted assets (recognized as other current assets)
June 30, 2019 December 31, 2018 June 30, 2018
Amount % Amount % Amount %
Subsidiary of the
parent company $ 1,202,053 3 $ 1,202,572 3 $ 993,763 2
9) Other receivables (recognized as other current assets)
June 30, 2018
Amount %
Subsidiary of the parent company $ 291,571 1
10) Short-term borrowings
June 30, 2018
Amount %
Other related parties $ 451,400 2
11) Customers’ equity accounts - futures
December 31, 2018 June 30, 2018
Amount % Amount %
Subsidiary of the parent company $ 394,377 2 $ 717,257 3
12) Current tax liabilities
June 30, 2019 December 31, 2018 June 30, 2018
Amount % Amount % Amount %
Parent company $ 668,212 76 $ 740,985 81 $ 481,314 68
13) Other operating revenue
For the Three Months
Ended June 30
For the Six Months
Ended June 30
Amount % Amount %
2019
Subsidiary of the parent company $ 138,539 48 $ 239,027 32
2018
Subsidiary of the parent company 63,808 29 154,256 50

- 90 -
14) Outstanding derivative financial instruments
a) Asset swap IRS contracts value
June 30,
2019
December 31,
2018
June 30,
2018
Contract
Amount
(Principal)
Contract
Amount
(Principal)
Contract
Amount
(Principal)
Subsidiary of the parent company $ 180,000 $ 602,120 $ 675,200
b) Asset swap option contracts - call
June 30,
2019
December 31,
2018
June 30,
2018
Contract
Amount
(Principal)
Contract
Amount
(Principal)
Contract
Amount
(Principal)
Subsidiary of the parent company $ 180,000 $ 602,120 $ 675,200
c) Interest rate swap contracts
June 30,
2019
December 31,
2018
June 30,
2018
Contract
Amount
(Principal)
Contract
Amount
(Principal)
Contract
Amount
(Principal)
Subsidiary of the parent company $ 372,864 $ 636,173 $ 1,088,850
15) Due to business needs, the related-arties issued a letter of guarantee
December 31,
2018
Other related parties $ 540,000
CDIB Capital Group and subsidiaries
Related Party
Relationship with CDIB Capital Group
and Subsidiaries
China Development Financial Holding Corporation Parent company
KGI Securities and subsidiaries Subsidiary of the parent company
KGI Bank and subsidiaries Subsidiary of the parent company
China Development Asset Management Corp. Group
and subsidiaries
Subsidiary of the parent company
China Life Insurance Subsidiary of the parent company
Others Other related parties

- 91 -
1) Cash in banks (recognized as cash and cash equivalents)
June 30, 2019 December 31, 2018 June 30, 2018
Amount % Amount % Amount %
Subsidiary of the
parent company $ 386,171 4 $ 6,566,990 39 $ 6,943,338 45
2) Purchase funds managed by related parties (recognized as financial assets at fair value through
profit or loss-current)
June 30, 2019 December 31, 2018
Amount % Amount %
Other related parties $ 200,639 71 $ 150,215 65
3) Revenue receivable (recognized as other receivables)
June 30, 2019 June 30, 2018
Amount % Amount %
Other related parties $ 299,728 15 $ 368,060 32
4) Sale of securities receivable (recognized as other receivables)
December 31, 2018
Amount %
Other related parties $ 459,512 41
5) Receivables from parent (recognized as current tax assets)
June 30, 2019 December 31, 2018 June 30, 2018
Amount % Amount % Amount %
Parent company $ 317,267 98 $ 317,267 98 $ 339,279 98
The receivables resulted from CDFH and its eligible subsidiaries’ adopting the linked-tax system in
the filing of tax returns since 2003.
6) Payables to parent (recognized as current tax liabilities)
June 30, 2019 December 31, 2018 June 30, 2018
Amount % Amount % Amount %
Parent company $ 525,542 75 $ 523,096 96 $ 374,545 95
The payables resulted from CDFH and its eligible subsidiaries’ adopting the linked-tax system in
the filing of tax returns since 2003.

- 92 -
7) Consulting service revenue
For the Three Months
Ended June 30
For the Six Months
Ended June 30
Amount % Amount %
2019
Other related parties $ 50,666 31 $ 112,183 34
2018
Other related parties 59,453 39 117,949 37
China Development Asset Management Corp. Group and subsidiaries
Related Party
Relationship with the China Development
Asset Management Corp. Group and
Subsidiaries
China Development Financial Holding Corporation Parent company
KGI Securities and subsidiaries Subsidiary of the parent company
KGI Bank and subsidiaries Subsidiary of the parent company
CDIB Capital Group and subsidiaries Subsidiary of the parent company
China Life Insurance Subsidiary of the parent company
Others Other related parties
1) Purchase funds managed by related parties (recognized as financial assets at fair value through
profit or loss - current)
Amount %
June 30, 2019 $ 200,605 100
December 31, 2018 150,187 100
China Life Insurance
Related Party Relationship with the China Life Insurance
China Development Financial Holding Corporation Parent company
KGI Securities and subsidiaries Subsidiary of the parent company
KGI Bank and subsidiaries Subsidiary of the parent company
CDIB Capital Group Subsidiary of the parent company
China Development Asset Management Corp. Group
and subsidiaries
Subsidiary of the parent company
Others Other related parties
1) Cash in banks (recognized as cash and cash equivalents)
June 30, 2019 December 31, 2018 June 30, 2018
Amount % Amount % Amount %
Subsidiary of the
parent company $ 203,098 1 $ 6,719,483 16 $ 120,293 -
Other related parties - - 223,286 1 - -

- 93 -
2) Receivables
June 30, 2019 June 30, 2018
Amount % Amount %
Subsidiary of the parent company $ 1,710,500 7 $ 323,173 2
3) Purchase funds managed by related parties (recognized as financial assets at fair value through
profit or loss)
June 30, 2019 December 31, 2018
Amount % Amount %
Other related parties $ 8,430,200 3 $ 5,159,700 2
4) Financial assets at fair value through other comprehensive income
June 30, 2019 December 31, 2018 June 30, 2018
Amount % Amount % Amount %
Stocks
Parent company $ 5,326,574 1 $ 5,467,191 2 $ 6,271,521 2
5) Financial assets measured at amortized cost
December 31, 2018 June 30, 2018
Amount % Amount %
Other related parties $ 1,649,930 - $ 1,604,094 -
6) Purchase and sale of bonds
Purchase of
Bonds
Sale of
Bonds
For the six months ended June 30, 2019
Subsidiary of the parent company $ 12,850,481 $ 389,977
For the six months ended June 30, 2018
Subsidiary of the parent company 4,542,222 1,703,084
7) Payables
June 30, 2019 June 30, 2018
Amount % Amount %
Subsidiary of the parent company $ 1,710,500 9 $ 343,663 3

- 94 -
8) Commission fee
For the Three Months
Ended June 30
For the Six Months
Ended June 30
Amount % Amount %
2019
Subsidiary of the parent company $ 239,737 8 $ 400,977 6
2018
Subsidiary of the parent company 125,461 4 269,121 5
9) Outstanding derivative financial instrument
June 30, 2019
(In Thousands of New Taiwan Dollars/US Dollars)
Related Party Contract Type Contract Period Contract
Amount
Balance Sheet
Account Balance
Subsidiaries of the parent company
Currency swap contracts May 24, 2019 - August 26, 2019
US$ 255,000 Financial assets at FVTPL
$ 68,430
March 27, 2019 -
November 15, 2019
US$ 255,000 Financial liabilities at
FVTPL
80,840
December 31, 2018
(In Thousands of New Taiwan Dollars/US Dollars)
Related Party Contract Type Contract Period Contract
Amount
Balance Sheet
Account Balance
Subsidiaries of the parent company
Currency swap contracts October 25, 2018 - February 27, 2019
US$ 250,000 Financial assets at FVTPL
$ 12,884
July 05, 2018 -
February 15, 2019
US$ 250,000 Financial liabilities at
FVTPL
49,387
Other related parties Currency swap contracts November 16, 2018 - February 27, 2019
US$ 299,000 Financial assets at FVTPL
14,352
October 08, 2018 -
February 14, 2019
US$ 295,000 Financial liabilities at
FVTPL
17,414
June 30, 2018
(In Thousands of New Taiwan Dollars/US Dollars)
Related Party Contract Type Contract Period Contract
Amount
Balance Sheet
Account Balance
Subsidiaries of the parent company
Currency swap contracts June 28, 2018 - July 20, 2018
US$ 50,000 Financial assets at FVTPL
$ 1,492
December 19, 2017 -
September 21, 2018
US$ 405,000 Financial liabilities at
FVTPL
392,513
Other related parties Currency swap contracts December 20, 2017 - September 25, 2018
US$ 494,000 Financial liabilities at FVTPL
515,416

- 95 -
49. PLEDGED ASSETS
The following assets have been (a) pledged to various financial institutions as guarantees and collaterals for
short-term loans, commercial papers payable, long-term loans, and overdraft, (b) pledged with Taipei
Exchange Securities Market for settlement reserve, (c) required by the Central Bank for day-term overdraft,
(d) required by government for bidding of government bonds, (e) pledged as part of the requirements for
filing a petition for tax reassessment, (f) pledged as operating guarantee, compensation reserve and wealth
management compensation, (g) pledged as guarantee deposit for oversees bonds sold with repurchase
agreement, and (h) derivative transactions security deposit.
June 30,
2019
December 31,
2018
June 30,
2018
Financial assets at fair value through other
comprehensive income - negotiable certificate
of deposit $ 17,097,368 $ 16,198,186 $ 15,529,159
Other assets - operating guarantee deposits 7,390,783 7,438,483 7,102,615
Property and equipment, net 4,588,904 4,792,233 4,810,458
Other financial assets - pledged time deposits 2,516,588 2,367,110 1,263,434
Accounts receivable - installment accounts
receivables and lease receivables 2,439,765 2,380,148 2,305,826
Other assets - guarantee deposit paid 2,125,151 1,502,485 12,221
Financial assets at fair value through profit or loss
- bonds and stocks 507,762 203,177 327,678
Other assets - competitive bid transactions
guarantee 249,723 369,445 299,351
Investment property, net 224,212 344,109 345,706
Financial assets at fair value through other
comprehensive income - bonds and stocks 181,214 181,348 182,351
Checking accounts - restricted for agent’s stock
transfer purposes 44,411 51,074 51,691
Restricted assets - impound account 42,914 44,936 49,315
Due from the Central Bank and call loans to
financial institutions - - 3,500,000
Note: 88,500 thousand of China Life Insurance shares held by KGI Securities on June 30, 2019,
December 31, 2018 and June 30, 2018 have been pledged.
50. SIGNIFICANT CONTINGENT LIABILITIES AND UNRECOGNIZED CONTRACTUAL
COMMITMENTS
Commitments and contingencies of the Group, except for those disclosed in Notes 54 and 56 were
summarized as follows:
a. In April 2007, CDIB Capital Group and Morgan Stanley entered into a CDS contract that was tied to a
synthetic collateralized debt obligation on residential mortgage-backed securities. The representations
made to CDIB Capital Group by Morgan Stanley during the solicitation process were materially false
and misleading and therefore caused significant losses to CDIB Capital Group. On July 15, 2010, CDIB
Capital Group initiated action against Morgan Stanley & Co. International PLC (“Morgan Stanley”) et
al. to recover losses CDIB Capital Group suffered as a result of its investment in a Morgan Stanley’s
credit default swap (CDS) product that had been tied to a synthetic collateralized debt obligation on
residential mortgage-backed securities; the representations made to CDIB Capital Group by Morgan
Stanley during the solicitation process were materially false and misleading and therefore caused
significant financial losses to CDIB Capital Group. As of December 31, 2010, the underlying asset
pools on the CDS had been liquidated, and CDIB Capital Group had recognized all gains and losses

- 96 -
from the transaction. The balance of US$11,978 thousand (NT$385,676 thousand based on the
exchange rate of June 30, 2019) was reclassified to “other financial liabilities”. The litigation had not
yet been concluded as of June 30, 2019. In addition, Morgan Stanley overlooked CDIB Capital Group’s
efforts and terminated interest rate swap (IRS) contracts (nominal principal amount: KRW24,000,000
thousand) and CDS contracts (nominal principal amount: JPY586,510 thousand), CDIB Capital Group
reserves the right of legal proceedings in August 2010.
b. Securities and Futures Investors Protection Center sued Grand Cathay (KGI Securities as the survivor
company after merging on June 22, 2013) and claimed that due to the fact that KGI Securities was the
lead underwriter of Taiwan Kolin Co., Ltd. 2nd convertible bonds which issued on November 7, 2007,
KGI Securities must have but not performed sufficient audits on the contents disclosed in the prospectus
of Taiwan Kolin Co., Ltd. 2nd convertible corporate bonds, which against the Article 20 and 32 of
Securities and Exchange Act and the Article 184 and 185 of Civil Code. On June 14, 2010, the plaintiffs
sued KGI Securities, Taiwan Kolin Co., Ltd., the principal of formerly management team, Moore
Stephens and the auditor with jointly liability amounted to $133,308 thousand plus 5% interest. The
lawsuit is currently proceeded by the Taipei District Court.
c. Plaintiffs, Digital Imaging Solution Global Ltd. (“Digital”) and Minda Consulting Ltd. (“Minda”),
advocated that GT based on stock pledge generated from loans of HK$10,000 thousand with Minda and
Minda transferred its pledge right on Digital to GT, GT transferred a pledge right of 35,000 thousand
shares of eCyberChina to Minda in exchange. However, GT and its fund managers, including KGI
Limited, disposed the 2,000 thousand shares of eCyberChina without Minda’s approval and thus
violated the pledge agreement. Therefore, Digital and Minda filed a lawsuit to the GT in November
2007 and requested for compensation of HK$119,130 thousand and related expenses and interest. In
February 2008, Digital and Minda added KGI Limited as a defendant. On July 21, 2008, the appeal was
dismissed by courts of Hong Kong and the plaintiffs appealed to a higher court. In December 2008, the
courts of appeals dismissed the appeal by Digital while the appeal by Minda is still pending in the
courts of appeals.
d. Securities and Futures Investors Protection Center sued CDIB Capital Management Corporation and
claimed that due to the fact that CDIB Capital Management Corporation is the corporate director of
Powercom Ltd., CDIB Capital Management Corporation have but not performed sufficient audits on the
contents disclosed in the financial statements which failed to comply the obligation of being a good
administrator. Therefore, the plaintiff demanded compensation of $592,648 thousand and related
interests from CDIB Capital Management Corporation and Powercom Ltd. CDIB Capital Management
Corporation and Powercom Ltd. could not estimate the related possible loss because the case was
currently pending with the Taipei District Court and the final outcome of the court is uncertain.
e. The case KGI Bank acted vigorously in regards to Prince Motors’ overdue debt. In December 2012, a
third party regards filed a lawsuit claiming that KGI Bank fraudulently infringed upon the property
rights of creditors (credit litigation amounted to $481,157 thousand) on Dun Nan building. On February
14, 2014, the Taipei District Court judged that KGI Bank lost the lawsuit and has to return the amount
of $1,786,318 thousand for re-allocation. KGI Bank has appealed on March 10, 2014, and the original
adjudication in favor of the third party was revoked by the court, which indicated KGI Bank on the
second trial. The third party filed an appeal but the court rejected the third party’s appeal on July 26,
2017. Third party then filed appeal for third trial and the case was currently pending with the Supreme
Court. On November 9, 2018, the lawsuit is currently proceeded by The Supreme Court as of the day
the Corporation’s board of the directors approve the consolidated financial statements.

- 97 -
f. In response to the rapid business development and IT demands for innovative products, KGI Bank plans
to outsource its IT operations to improve IT service levels and to rapidly respond to the business
development and changes in external regulations. The board of directors’ meeting held on October 30,
2012 approved the plan for outsourcing the IT operations to International Business Machines Corp.,
Taiwan (IBM Taiwan) for the next 10 years, starting from October 31, 2012. Except for extra services
will be charged by professional rates, the basic framework, support service, IT application service,
integration and transformation of server and so on are charged by the contract. In response to
information age and to improve quality of service, KGI Bank keeps replacing its core system and other
related systems. After that, KGI Bank will reduce its demand on the basic framework and IT application
services mentioned before. The contract about related service scope, which was approved by the board
of directors on August 21, 2018, came into effect on January 1, 2019. As of June 30, 2019, KGI Bank
has to pay a total of $260,141 thousand in the future contract periods.
g. On December 16, 2016, the Company signed the contract with CHUNG-LU Construction Co., Ltd. for
the construction of Taipei Academy, and on March 1, 2017 signed the first contract change protocol,
modify the total amount of the contract is $5,623,913 thousand. As of June 30, 2019, the actual total
amount of construction expenditure (after deduction of 5% construction retainage) is $2,717,755
thousand and unpaid amount is $2,906,158 thousand.
51. SUBSEQUENT EVENTS
On May 29, 2019, Global Securities Finance Corporation approved to assigned their main business to
Yuanto Securities Co., Ltd. (GSFC) in shareholders’ meeting. The transaction price were $15,000 thousand
go with the price adjustment mechanism decided by both transaction parties, and the amount of related
claims, collateral and rights as of the date of business assignment. The transaction was authorized by Fair
Trade Commission on August 14, 2019 and be subject to approval of the FSC.
52. BUSINESS COMBINATIONS
Traditional Insurance Policies of Allianz Taiwan Life Insurance
China Life Insurance acquired a part of the asset and liability business of the traditional insurance policies
of Allianz Taiwan Life Insurance at a consideration price of NT$1. The settlement date was May 18, 2018.
Assets acquired and liabilities assumed on the settlement date were as follows:
Fair Value on
Settlement Date
Financial assets (including cash and cash equivalents of $49,856,478) $ 50,766,127
Financial liabilities (2,569)
Insurance liabilities (50,194,310)
Other liabilities (357)
$ 568,891
The bargain purchase gain due to the partial acquisition of the traditional insurance business of Allianz
Taiwan Life Insurance was $568,891 thousand, which was generated by the acquisition consideration of $1
minus the fair value of the net identifiable assets of $568,891 thousand.
Had the acquisition happened on January 1, 2018, the pro forma net revenue and net income before tax of
the Group for the six months ended June 30, 2018 would have been $119,899,911 thousand and $9,714,777
thousand, respectively.

- 98 -
53. INDIVIDUAL PROFITABILITY AND CONSOLIDATED PROFIT ABILITIES OF CDFH, KGI
BANK, KGI SECURITIES AND CHINA LIFE INSURANCE
Consolidated Profitability
(%)
Items June 30, 2019 June 30, 2018
Return on total assets Before income tax 0.89 0.74
After income tax 0.81 0.72
Return on net worth Before income tax 9.99 7.73
After income tax 9.16 7.58
Profit margin 9.18 7.70
Profitability of CDFH
(%)
Items June 30, 2019 June 30, 2018
Return on total assets Before income tax 7.73 6.31
After income tax 7.75 6.04
Return on net worth Before income tax 9.09 7.55
After income tax 9.16 7.27
Profit margin 93.31 88.96
Profitability of KGI Bank
(%)
Items June 30, 2019 June 30, 2018
Return on total assets Before income tax 0.65 0.52
After income tax 0.54 0.48
Return on net worth Before income tax 7.44 5.57
After income tax 6.14 5.19
Profit margin 35.03 33.74
Profitability of KGI Securities
(%)
Items June 30, 2019 June 30, 2018
Return on total assets Before income tax 2.92 2.42
After income tax 3.08 2.13
Return on net worth Before income tax 9.24 7.86
After income tax 9.72 6.92
Profit margin 60.34 38.71

- 99 -
Profitability of China Life Insurance
(%)
Items June 30, 2019 June 30, 2018
Return on total assets Before income tax 0.92 0.74
After income tax 0.83 0.81
Return on net worth Before income tax 16.44 12.51
After income tax 14.68 13.73
Profit margin 4.21 4.01
54. FINANCIAL INSTRUMENTS
a. The definitions of each hierarchy are as follows:
1) Level 1 fair values are quoted prices in active markets for financial instruments.
2) Level 2 fair values refer to directly or indirectly observable inputs other than Level 1 quoted prices,
such as the quoted prices of similar financial instruments in active markets; in less active markets,
fair values are quoted prices of the same or similar financial instruments or financial instruments
that can be generated by using pricing models that use inputs such as interest rates and volatility
rates, which are derived from or can be corroborated with observable market data.
3) Level 3 refers to inputs that are not based on observable market data.
b. Fair value
1) The fair value hierarchy of financial instruments were as follows:
June 30, 2019 (In Thousands of New Taiwan Dollars)
Level 1 Level 2 Level 3 Total
Nonderivative financial instruments
Financial assets Financial assets at FVTPL
Financial assets mandatorily classified
as at FVTPL Stock investments $ 144,175,115 $ 496,126 $ 5,607,698 $ 150,278,939
Bond investments 46,373,401 51,974,855 - 98,348,256
Others 97,368,235 20,112,545 12,672,582 130,153,362 Financial assets designated as at FVTPL 12,384,082 34,068,518 905,020 47,357,620
Financial assets at FVTOCI
Stock investments 21,075,896 10,824 19,224,771 40,311,491 Bond investments 257,249,265 168,550,968 - 425,800,233
Others - 54,060,962 - 54,060,962
Financial liabilities Financial liabilities at FVTPL
Financial liabilities held for trading 3,654,462 1,342,123 - 4,996,585
Financial liabilities designated as at FVTPL - 31,433,488 - 31,433,488
Derivative financial instruments
Financial assets Financial assets at FVTPL
Financial assets mandatorily classified
as at FVTPL 1,081,898 46,602,893 106,790 47,791,581 Financial liabilities
Financial liabilities at FVTPL
Financial liabilities held for trading 543,073 61,534,699 902,837 62,980,609 Financial liabilities designated as at
FVTPL - 3,895,201 - 3,895,201

- 100 -
December 31, 2018
(In Thousands of New Taiwan Dollars)
Level 1 Level 2 Level 3 Total
Nonderivative financial instruments
Financial assets
Financial assets at FVTPL Financial assets mandatorily classified
as at FVTPL
Stock investments $ 111,453,828 $ 81,132 $ 6,918,536 $ 118,453,496 Bond investments 41,989,438 61,457,028 191,943 103,638,409
Others 47,323,015 15,470,248 11,033,980 73,827,243
Financial assets designated as at FVTPL 6,169,907 42,512,632 574,064 49,256,603 Financial assets at FVTOCI
Stock investments 17,462,411 12,316 11,111,094 28,585,821
Bond investments 235,021,765 173,029,763 - 408,051,528 Others - 48,698,585 - 48,698,585
Financial liabilities
Financial liabilities at FVTPL
Financial liabilities held for trading 3,091,924 1,649,405 - 4,741,329
Financial liabilities designated as at FVTPL - 29,046,779 - 29,046,779
Derivative financial instruments
Financial assets
Financial assets at FVTPL Financial assets mandatorily classified
as at FVTPL 927,604 28,660,132 167,547 29,755,283
Financial liabilities Financial liabilities at FVTPL
Financial liabilities held for trading 746,457 49,325,395 771,524 50,843,376
Financial liabilities designated as at FVTPL - 3,155,241 - 3,155,241
June 30, 2018
(In Thousands of New Taiwan Dollars)
Level 1 Level 2 Level 3 Total
Nonderivative financial instruments
Financial assets Financial assets at FVTPL
Financial assets mandatorily classified as at FVTPL
Stock investments $ 149,772,647 $ 419,176 $ 10,021,332 $ 160,213,155
Bond investments 42,261,694 51,074,039 195,714 93,531,447 Others 25,071,277 29,803,741 12,226,616 67,101,634
Financial assets designated as at FVTPL 3,550,919 28,739,554 439,120 32,729,593
Financial assets at FVTOCI Stock investments 14,842,515 20,028 13,305,075 28,167,618
Bond investments 217,762,278 160,901,870 - 378,664,148
Others - 40,365,608 - 40,365,608 Financial liabilities
Financial liabilities at FVTPL
Financial liabilities held for trading 1,900,829 3,178,138 - 5,078,967 Financial liabilities designated as at
FVTPL - 29,283,675 - 29,283,675
Derivative financial instruments
Financial assets Financial assets at FVTPL
Financial assets mandatorily classified
as at FVTPL 1,201,236 47,908,421 230,242 49,339,899 Financial liabilities
Financial liabilities at FVTPL
Financial liabilities held for trading 954,352 86,749,962 567,105 88,271,419 Financial liabilities designated as at
FVTPL - 893,486 - 893,486

- 101 -
2) Evaluation technology at fair value
For financial assets and liabilities at fair value through profit or loss and financial assets at fair value
through other comprehensive income, fair value is determined at quoted market prices. When
market prices of the Group’s various financial instruments are not readily available, fair values are
estimated by using appropriate valuation models or other banks’ transaction prices. The information
the Group uses for fair value estimation is consistent with that generally used in the market; the
basis of the theory are commonly recognized by the industry. The type of relevant methodology can
roughly divided into analytical solution model (for example: Black-school model) and numerical
method model (for example Monet Carlo simulation).
3) Reconciliation of fair value
a) The limitation of valuation techniques and uncertain inputs
Valuation techniques incorporate assumptions are dependent on the instrument type and
available market data. However, certain model inputs may be less readily determinable from
valuation techniques. In these circumstances, valuation model would adopt additional
parameters and/or model assumptions such as model risk or Liquidity Risk and so on, to make
fair value adjustment. According to our policies of Valuation management and relevant control
procedure, the Corporation’s management considers that Valuation adjustments are necessary
and appropriate. To accept approaches and principles for the making the appropriate
adjustments, all parameters and price information should be evaluated thoroughly and make
reference from market situation.
b) Credit risk valuation adjustments
Credit risk valuation adjustments are classified into Credit value adjustments and Debit value
adjustments, and definitions are the following:
The credit valuation adjustment is an adjustment to the valuation of OTC derivative
contracts to reflect within fair value the possibility that the counterparty may default and
that the Corporation may not receive the full market value of the transactions.
The debit valuation adjustment is an adjustment to the valuation of OTC derivative contracts
to reflect within fair value the possibility that the Corporation may default, and that the
Corporation may not pay full market value of the transactions.
The Group calculates their debit valuation adjustment on the basis of their international credit
assessment and model and international accounting standard of a counterparty’s probability of
default (PD), which is subject to standard supervisory parameters, take loss given default (LGD)
into consideration and multiplied by their estimates of the counterparty’s exposure at default
(EAD).
The Group calculates the counterparty’s EAD with OTC derivative’s market to market value
and the counterparty’s LGD, which is 60 percent of EAD based on Taiwan Stock Exchange
(TWSE) guidance.
The Group takes Credit risk valuation adjustments for determining the fair value of financial
instruments and reflect counterparty’s credit risk and the Corporation’s credit quality.

- 102 -
4) Transfer between the Level 1 and Level 2
For the Six Months Ended
June 30, 2019
For the Six Months Ended
June 30, 2018
Level One
Converted
Into Level
Two
Level Two
Converted
Into Level One
Level One
Converted
Into Level
Two
Level Two
Converted
Into Level One
Financial assets at FVOCI - bond
investments $ 9,144,721 $ 2,952,224 $ 5,186,315 $ 12,940,676
Because of changes in market liquidity, evaluation sources applied by some NTD treasury bill will
change. It makes the applicable level of bond’s fair value change from level one into level two or
level two into level one.
5) Reconciliation of Level 3 items of financial instruments
The movements of financial assets with Level 3 fair value were as follows:
For the Six Months Ended June 30, 2019
(In Thousands of New Taiwan Dollars)
Items Beginning
Balance
Valuation
Gains (Losses)
Recognized as
Current
Income (Loss)
or Other
Comprehensive
Income
Amount of Increase Amount of Decrease
Ending
Balance Purchase or
Issue
Transfer to
Level 3
Sale, Disposal
or Settlement
Transfer from
Level 3
Financial assets at FVTPL
Financial assets
mandatorily classified as
at FVTPL $ 18,312,006 $ 1,509,803 $ 2,924,948 $ - $ (3,464,816 ) $ (894,871 ) $ 18,387,070
Financial assets designated
as at FVTPL 574,064 55,422 275,534 - - - 905,020
Financial assets at FVTOCI 11,111,094 2,593,470 5,575,046 - (54,839 ) - 19,224,771
For the Six Months Ended June 30, 2018
(In Thousands of New Taiwan Dollars)
Items Beginning
Balance
Valuation
Gains (Losses)
Recognized as
Current
Income (Loss)
or Other
Comprehensive
Income
Amount of Increase Amount of Decrease
Ending
Balance Purchase or
Issue
Transfer to
Level 3
Sale, Disposal
or Settlement
Transfer from
Level 3
Financial assets at FVTPL
Financial assets
mandatorily classified as
at FVTPL $ 20,569,493 $ 2,207,759 $ 1,488,067 $ - $ (1,591,415 ) $ - $ 22,673,904
Financial assets designated
as at FVTPL 457,036 37,544 6,828 - (62,288 ) - 439,120
Financial assets at FVTOCI 16,855,341 (3,560,699 ) 42,000 - (31,567 ) - 13,305,075

- 103 -
The movements of financial liabilities with Level 3 fair value were as follows:
For the Six Months Ended June 30, 2019
(In Thousands of New Taiwan Dollars)
Items Beginning
Balance
Valuation
Gains (Losses)
Recognized as
Current
Income (Loss)
or Other
Comprehensive
Income
Amount of Increase Amount of Decrease
Ending
Balance Purchase or
Issue
Transfer to
Level 3
Sale, Disposal
or Settlement
Transfer from
Level 3
Financial liabilities at FVTPL
Financial liabilities held for
trading $ 771,524 $ 58,769 $ 197,680 $ - $ (125,136 ) $ - $ 902,837
For the Six Months Ended June 30, 2018
(In Thousands of New Taiwan Dollars)
Items Beginning
Balance
Valuation
Gains (Losses)
Recognized as
Current
Income (Loss)
or Other
Comprehensive
Income
Amount of Increase Amount of Decrease
Ending
Balance Purchase or
Issue
Transfer to
Level 3
Sale, Disposal
or Settlement
Transfer from
Level 3
Financial liabilities at FVTPL
Financial liabilities held for
trading $ 449,041 $ 23,516 $ 367,144 $ - $ (272,596 ) $ - $ 567,105
The total gains or losses for the six months ended June 30, 2019 and 2018 included a gain of
$311,370 thousand and a gain of $845,976 thousand relating to assets and liabilities measured at fair
value on Level 3 fair value measurement and held at the end of reporting date.

- 104 -
6) Quantitative information about significant unobservable inputs (Level 3)
KGI Bank and subsidiaries
The table below lists quantitative unobservable inputs of Level 3 financial instruments:
Fair Value at
June 30, 2019
Valuation
Technique(s)
Significant
Unobservable
Inputs
Range The Relationship Between
Inputs and Fair Value
Repetitive basis to fair value
measurement items
Nonderivative financial
instruments
Financial assets at FVTOCI $ 372,558 Market approach,
net asset
method
P/B, P/E, Discount
for lack of
liquidity and control
1.23-5.67,
11%-27.2%
Multiplier is proportional to fair
value; fair value is inversely
proportional to discount for lack of liquidity and control.
Derivative financial instruments
Financial assets at FVTPL 106,753 HullWhite, Libor
Market Model,
discounted cash flow
Quality/Factor/
FREQ/Simulate
Method
Inapplicable Inputs of parameters do not
contain linear relation, which
analyzed by comparing correctness, stability,
rationality, efficiency of
performance and other different aspects of the
outcome. Then KGI Bank and
subsidiaries select the applicable one according to
the analysis.
Financial liabilities at FVTPL 106,118 HullWhite, Libor Market Model,
discounted
cash flow
Quality/Factor/ FREQ/Simulate
Method
Inapplicable Inputs of parameters do not contain linear relation, which
analyzed by comparing
correctness, stability, rationality, efficiency of
performance and other
different aspects of the outcome. Then KGI Bank and
subsidiaries select the
applicable one according to the analysis.

- 105 -
Fair Value at
December 31,
2018
Valuation
Technique(s)
Significant
Unobservable
Inputs
Range The Relationship Between
Inputs and Fair Value
Repetitive basis to fair value
measurement items
Nonderivative financial
instruments
Financial assets at FVTOCI $ 381,396 Market approach,
net asset method
P/B, P/E, Discount
for lack of liquidity and
control
1.15-9.94,
11%-27.2%
Multiplier is proportional to fair
value; fair value is inversely proportional to discount for
lack of liquidity and control.
Derivative financial
instruments
Financial assets at FVTPL 147,234 HullWhite, Libor
Market Model,
discounted cash flow
Quality/Factor/
FREQ/Simulate
Method
Inapplicable Inputs of parameters do not
contain linear relation, which
analyzed by comparing correctness, stability,
rationality, efficiency of
performance and other different aspects of the
outcome. Then KGI Bank and
subsidiaries select the applicable one according to
the analysis.
Financial liabilities at FVTPL 146,087 HullWhite, Libor Market Model,
discounted
cash flow
Quality/Factor/ FREQ/Simulate
Method
Inapplicable Inputs of parameters do not contain linear relation, which
analyzed by comparing
correctness, stability, rationality, efficiency of
performance and other
different aspects of the outcome. Then KGI Bank and
subsidiaries select the
applicable one according to the analysis.

- 106 -
Fair Value at
June 30, 2018
Valuation
Technique(s)
Significant
Unobservable
Inputs
Range The Relationship Between
Inputs and Fair Value
Repetitive basis to fair value
measurement items
Nonderivative financial
instruments
Financial assets at FVTOCI $ 417,068 Market approach,
net asset method
P/B, P/E, Discount
for lack of liquidity and
control
1.24-14.10
11%-27.2%
Multiplier is proportional to fair
value; fair value is inversely proportional to discount for
lack of liquidity and control.
Derivative financial
instruments
Financial assets at FVTPL 221,080 HullWhite, Libor
Market Model,
discounted cash flow
Quality/Factor/
FREQ/Simulate
Method
Inapplicable Inputs of parameters do not
contain linear relation, which
analyzed by comparing correctness, stability,
rationality, efficiency of
performance and other different aspects of the
outcome. Then KGI Bank and
subsidiaries select the applicable one according to
the analysis.
Financial liabilities at FVTPL 223,468 HullWhite, Libor Market Model,
discounted
cash flow
Quality/Factor/ FREQ/Simulate
Method
Inapplicable Inputs of parameters do not contain linear relation, which
analyzed by comparing
correctness, stability, rationality, efficiency of
performance and other
different aspects of the outcome. Then KGI Bank and
subsidiaries select the
applicable one according to the analysis.
KGI Securities and subsidiaries
The explanation of quantitative information about significant unobservable inputs in fair value
measurement and sensitivity analysis significant unobservable inputs used by repetitive basis to fair
value Level 3 financial asset of KGI Securities and subsidiaries were as follows:
June 30, 2019
Valuation Techniques
Significant
Unobservable
Inputs
Quantification
Information
The Relationship Between Inputs
and Fair Value
Financial assets
Non-derivative financial assets Financial assets at FVTPL -
equity instruments
Fair value from
counter-party,
recently strike price
or measured by
using asset-based
approach.
Not applicable Not applicable Not applicable
Financial assets at FVTPL -
equity instruments
Market approach Discount for lack
of liquidity
23%-26% Assets at fair value is inversely
proportional to discount for lack
of liquidity.
(Continued)

- 107 -
Valuation Techniques
Significant
Unobservable
Inputs
Quantification
Information
The Relationship Between Inputs
and Fair Value
Financial assets at FVTOCI - equity instruments
Fair value from counter-party,
recently strike price
or measured by using asset-based
approach.
Not applicable Not applicable Not applicable
Derivative instruments Structured products - option Martingale pricing
technique
History volatility 19.13%-23.22% According to condition of contract,
fair value of asset may be higher or lower.
Financial liabilities
Derivative instruments
Structured products - option Martingale pricing technique
History volatility 1.96%-14.00% According to condition of contract, fair value of liabilities may be
higher or lower.
Equity derivatives - premium - equity option (put option)
Martingale pricing technique
History volatility 16.32%-60.71% According to condition of contract, fair value of liabilities may be
higher or lower.
Credit derivatives instruments - CDS
ISDA Standard Upfront Model
Recovery rate 0.4 According to ISDA Standard Upfront Model, recovery rate is
set from the category of targets’
debts.
(Concluded)
December 31, 2018
Valuation Techniques
Significant
Unobservable
Inputs
Quantification
Information
The Relationship Between Inputs
and Fair Value
Financial assets
Non-derivative financial assets Financial assets at FVTPL -
equity instruments
Fair value from
counter-party,
recently strike price or measured by
using asset-based
approach.
Not applicable Not applicable Not applicable
Financial assets at FVTPL -
equity instruments
Market approach Discount for lack
of liquidity
23%-26% Assets at fair value is inversely
proportional to discount for lack
of liquidity. Financial assets at FVTOCI -
equity instruments
Fair value from
counter-party, recently strike price
or measured by
using asset-based approach.
Not applicable Not applicable Not applicable
Derivative instruments
Structured products - option Martingale pricing technique
History volatility 24.93%-62.14% According to condition of contract, fair value of asset may be higher
or lower.
Credit derivatives instruments - CDS
ISDA Standard Upfront Model
Recovery rate 0.4 According to ISDA Standard Upfront Model, recovery rate is
set from the category of targets’
debts.
Financial liabilities
Derivative instruments
Structured products - option Martingale pricing
technique
History volatility 2.18%-14.04% According to condition of contract,
fair value of liabilities may be higher or lower.
Equity derivatives - premium -
equity option (put option)
Martingale pricing
technique
History volatility 21.32%-47.70% According to condition of contract,
fair value of liabilities may be higher or lower.
Credit derivatives instruments -
CDS
ISDA Standard Upfront
Model
Recovery rate 0.4 According to ISDA Standard
Upfront Model, recovery rate is set from the category of targets’
debts.

- 108 -
June 30, 2018
Valuation
Techniques
Significant
Unobservable
Inputs
Quantification
Information
The Relationship Between
Inputs and Fair Value
Financial assets
Non-derivative financial assets Financial assets at FVTPL -
equity instruments
Fair value from
counter-party,
recently strike price or measured by
using asset-based
approach.
Not applicable Not applicable Not applicable
Financial assets at FVTPL -
equity instruments
Market approach Discount for lack
of liquidity
23%-26% Assets at fair value is inversely
proportional to discount for lack
of liquidity. Financial assets at FVTOCI -
equity instruments
Fair value from
counter-party,
recently strike price or measured by
using asset-based
approach.
Not applicable Not applicable Not applicable
Derivative instruments
Structured products - option Martingale pricing
technique
History volatility 14.60%-64.16% According to condition of contract,
fair value of asset may be higher or lower.
Credit derivatives
instruments - CDS
ISDA Standard
Upfront Model
Recovery rate 0.4 According to ISDA Standard
Upfront Model, recovery rate is set from the category of targets’
debts.
Financial liabilities
Derivative instruments Structured products - option Martingale pricing
technique
History volatility 1.97%-47.83% According to condition of contract,
fair value of liabilities may be higher or lower.
Equity derivatives - premium
- equity option (put option)
Martingale pricing
technique
History volatility 8.83%-60.57% According to condition of contract,
fair value of liabilities may be higher or lower.
History volatility used by martingale pricing technique in KGI Securities depends on moving
weighted average method, and sampling period refer to maturity in initial contract; if maturity is
less than 6 months, sampling period is between 20 to 180 days; if maturity is between 6 months to
12 months, sampling period is between 20 to 360 days; if maturity is more than 12 months,
sampling period is between 20 to initial maturity days.
The recovery rate adopted by KGI Securities in the ISDA CDS Standard Model is set based on the
ISDA Standard CDS Converter Specification. If the underlying debt is senior unsecured debt, the
recovery rate is set to be 0.4. If the underlying debt is subordinated debt, the recovery rate is set to
be 0.2. If the debt is from emerging markets (including senior and subordinated debt), the recovery
rate is set to be 0.25. KGI Securities set the recovery rate base on the types of the debts. Therefore,
the recovery rate is not changed.

- 109 -
KGI Securities and subsidiaries adopts pricing model and pricing parameters cautiously, producing
reasonable fair value measurement, however, different pricing model or parameters may lead to
different outcome. To those financial assets and liabilities categorized into Level 3, effects of
current period net income or loss affected by changes in pricing parameters were as follows:
June 30, 2019
Sensitivity Analysis of Relationship
Between Inputs and Fair Value
Positive/Negative Recognized to Profit or Loss
Inputs Change Positive Impact Negative Impact
Financial assets
Non-derivative instruments
Financial assets at FVTPL
Equity instruments (counter-party/ recent strike price/assets
approach)
Not applicable Not applicable Not applicable Not applicable
Equity instruments (market
approach)
Reduction proportion -1%/+1% $ 499 $ 499
Financial assets at FVTOCI
Equity instruments (assets approach)
Not applicable Not applicable Not applicable Not applicable
Derivative instruments
Structured notes - options Historical volatility + 25%/-25% 47 22
Financial liabilities
Derivative instruments
Structured notes - options Historical volatility - 25%/+25% - -
Equity derivative instruments - premium - options (put options)
Historical volatility - 25%/+25% 69 70
December 31, 2018
Sensitivity Analysis of Relationship
Between Inputs and Fair Value
Positive/Negative Recognized to Profit or Loss
Inputs Change Positive Impact Negative Impact
Financial assets
Non-derivative instruments
Financial assets at FVTPL Equity instruments (counter-party/
recent strike price/assets
approach)
Not applicable Not applicable Not applicable Not applicable
Equity instruments (market
approach)
Reduction proportion -1%/+1% $ 359 $ 368
Financial assets at FVTOCI Equity instruments (assets
approach)
Not applicable Not applicable Not applicable Not applicable
Derivative instruments Structured notes - options Historical volatility +25%/-25% 2,173 1,997
Financial liabilities
Derivative instruments
Structured notes - options Historical volatility -25%/+25% - - Equity derivative instruments -
premium - options (put options)
Historical volatility -25%/+25% (12 ) (12 )

- 110 -
June 30, 2018
Sensitivity Analysis of Relationship
Between Inputs and Fair Value
Positive/Negative Recognized to Profit or Loss
Inputs Change Positive Impact Negative Impact
Financial assets
Non-derivative instruments
Financial assets at FVTPL
Equity instruments (counter-party/ recent strike price/assets
approach)
Not applicable Not applicable Not applicable Not applicable
Equity instruments (market approach)
Reduction proportion -1%/+1% $ 281 $ 289
Financial assets at FVTOCI
Equity instruments (assets approach)
Not applicable Not applicable Not applicable Not applicable
Derivative instruments
Structured notes - options Historical volatility +25%/-25% 1,055 1,010
Financial liabilities
Derivative instruments
Structured notes - options Historical volatility -25%/+25% - 1 Equity derivative instruments -
premium - options (put options)
Historical volatility -25%/+25% 174 230
CDIB Capital Group and subsidiaries
Equity securities are classified fair value Level 3 financial asset by CDIB Capital Group and
subsidiaries. Quantitative information about the significant unobservable inputs is set out below:
Fair Value at
June 30, 2019
Valuation
Techniques
Significant Unobservable
Inputs
Range
(Average
Weighted)
The Relationship Between
Inputs and Fair Value
Repetitive basic to fair value
measurement items
Non-derivative financial assets
Financial assets at FVTPL $ 15,157,753 Market approach P/B
P/S
Discount for lack of
liquidity
0.68-2.51
0.46-5.19
23%-29%
When the higher income
multiplier, the higher of fair
value; when the higher the
discount for lack of liquidity,
the lower of fair value.
Discounted cash-flow
method
Discount for lack of
liquidity
WACC
Growth rate
23%-29%
10.53%-17.50%
3.25%-7.00%
When the higher the discount for
lack of liquidity, the lower of
fair value; when the higher
WACC, the lower of fair
value; when the higher growth
rate, the higher of fair value.
Net asset adjustment
method
Discount for lack of
liquidity
Non-controlling interest
discount
23%-29%
11%
When the higher the discount for
lack of liquidity, the lower of
fair value.
Binomial tree model Returns on stock value
volatility
31.84%-35.10% When the higher returns on stock
value volatility, the higher of
fair value.
Recent strike price - - -

- 111 -
Fair Value at
December 31,
2018
Valuation
Techniques
Significant Unobservable
Inputs
Range
(Average
Weighted)
The Relationship Between
Inputs and Fair Value
Repetitive basic to fair value
measurement items
Non-derivative financial assets
Financial assets at FVTPL $ 15,426,051 Market approach P/B
P/S
Discount for lack of
liquidity
0.66-2.06
0.31-9.44
23%-29%
When the higher income
multiplier, the higher of fair
value; when the higher the
discount for lack of liquidity,
the lower of fair value.
Discounted cash-flow
method
Discount for lack of
liquidity
WACC
Growth rate
23%-29%
10.33%-14.14%
3.00%-7.00%
When the higher the discount for
lack of liquidity, the lower of
fair value; when the higher
WACC, the lower of fair
value; when the higher growth
rate, the higher of fair value.
Net asset adjustment
method
Discount for lack of
liquidity
Non-controlling interest
discount
23%-29%
11%
When the higher the discount for
lack of liquidity, the lower of
fair value.
Binomial tree model Returns on stock value
volatility
39.05%-39.20%
When the higher returns on stock
value volatility, the higher of
fair value.
Recent strike price - - -
Fair Value at
June 30, 2018
Valuation
Techniques
Significant Unobservable
Inputs
Range
(Average
Weighted)
The Relationship Between
Inputs and Fair Value
Repetitive basic to fair value
measurement items
Non-derivative financial assets
Financial assets at FVTPL $ 19,711,735 Market approach P/B
P/S
Discount for lack of
liquidity
0.74-3.3
0.49-11.87
23%-29%
When the higher income
multiplier, the higher of fair
value; when the higher the
discount for lack of liquidity,
the lower of fair value.
Discounted cash-flow
method
Discount for lack of
liquidity
WACC
Growth rate
23%-29%
10.87%-12.63%
3.00%-7.00%
When the higher the discount for
lack of liquidity, the lower of
fair value; when the higher
WACC, the lower of fair
value; when the higher growth
rate, the higher of fair value.
Net asset adjustment
method
Discount for lack of
liquidity
Non-controlling interest
discount
23.00%
29.00%
11.00%
When the higher the discount for
lack of liquidity, the lower of
fair value.
Binomial tree model Returns on stock value
volatility
32.00%-40.00%
When the higher returns on stock
value volatility, the higher of
fair value.
Recent strike price - - -

- 112 -
China Life Insurance
Equity securities are classified into fair value Level 3 financial asset by China Life Insurance.
Quantitative information about the significant unobservable input was set out below:
June 30, 2019
Valuation
Techniques Significant
Unobservable Inputs Quantification
Information Relationship Between Inputs and
Fair Value Financial assets
Financial assets at fair value through profit or loss
Asset approach Discount for liquidity and minor interests
0%-10% The higher the discount for liquidity and minor interests, the lower the
estimated fair value.
Financial assets at fair value through other
comprehensive income
Market approach Discount for liquidity 10%-30% The higher the discount for liquidity, the lower the estimated fair value.
Control premium 0%-10% The higher the control premium, the higher the estimated fair value.
Income approach Cost of capital rate 6.09% The higher the cost of capital rate, the
lower the estimated fair value. Discount for liquidity 0%-10% The higher the discount for liquidity,
the lower the estimated fair value.
Asset approach Discount for liquidity and minor interests
0%-10% The higher the discount for liquidity and minor interests, the lower the
estimated fair value.
December 31, 2018
Valuation
Techniques Significant
Unobservable Inputs Quantification
Information Relationship Between Inputs and
Fair Value
Financial assets
Financial assets at fair value
through profit or loss
Option Volatility in stock price
for the 90-day period
35.139% The higher the volatility in stock price
for the 90-day period, the higher the estimated fair value.
Asset approach Discount for liquidity
and minor interests
0%-10% The higher the discount for liquidity
and minor interests, the lower the estimated fair value.
Financial assets at fair value
through other comprehensive income
Market approach Discount for liquidity 10%-30% The higher the discount for liquidity,
the lower the estimated fair value.
Control premium 0%-10% The higher the control premium, the
higher the estimated fair value. Income approach Cost of capital rate 6.18% The higher the cost of capital rate, the
lower the estimated fair value.
Discount for liquidity 0%-10% The higher the discount for liquidity, the lower the estimated fair value.
Asset approach Discount for liquidity
and minor interests
0%-10% The higher the discount for liquidity
and minor interests, the lower the estimated fair value.

- 113 -
June 30, 2018
Valuation
Techniques
Significant
Unobservable Inputs
Quantification
Information
Relationship Between Inputs and
Fair Value
Financial assets
Financial assets at fair value
through profit or loss
Option Volatility in stock price
for the 90-day period
28.730% The higher the volatility in stock price
for the 90-day period, the higher the fair value of convertible bonds.
Asset approach Discount for liquidity
and minor interests
0%-10% The higher the discount for liquidity
and minor interests, the lower the estimated fair value.
Financial assets at fair value
through other comprehensive income
Market approach Discount for liquidity 10%-30% The higher the discount for liquidity,
the lower the estimated fair value.
Control premium 0%-10% The higher the control premium, the
higher the estimated fair value. Income approach Cost of capital rate 6.46% The higher the cost of capital rate, the
lower the estimated fair value.
Discount for liquidity 0%-10% The higher the discount for liquidity, the lower the estimated fair value.
Asset approach Discount for liquidity
and minor interests
0%-10% The higher the discount for lack of
liquidity and minority interests discount, the lower the estimated
fair value.
7) Pricing process of Level 3 fair value
KGI Bank and subsidiaries
KGI Bank’s risk management department is responsible for the pricing process of Level 3 fair
value. The pricing models and conditions assumed are conform to market practice; the basis of the
theory are commonly recognized by the industry as a basis of valuation in conducting measurement
of fair value. Further, the department confirms whether the sources of the information are
independent or not, reasonably reflecting the prices in normal circumstances, and examines and
adjusts fair value periodically to insure results of the valuation is reasonable.
KGI Securities and subsidiaries
When KGI Securities has those derivatives that their fair value are hard to reach or they are
categorized as financial assets with no active market, reasonability of fair value of those financial
assets are assessed by related department according to the Guidelines of Asset Valuation Operation
set by KGI Securities, and the outcomes of the valuation will be recorded in the book by treasury
department.
CDIB Capital Group and subsidiaries
The valuation method and parameters adopted by CDIB Capital Group and subsidiaries conform to
the general market practice which the theoretical basis is generally identified by the industry.
Besides, the department exams and adjusts inputs that pricing model needed periodically to insure
outcomes are reasonable.
China Life Insurance
China Life Insurance is responsible for validating the fair value measurements and ensuring that the
results of the valuation are in line with market conditions and the sources are independent, reliable,
based on independent and reliable inputs which are consistent with other information, and represent
exercisable prices. China Life Insurance analyses the movements in the values of assets and
liabilities which are required to be re-measured or re-assessed according to China Life Insurance’s
accounting policies at each reporting date.

- 114 -
c. Fair value of financial instruments not carried at fair value
Assets and liabilities measured at cost, excluding debt investments measured at amortized cost,
guarantee deposits paid, bank debentures payable, have carrying amounts that are reasonably close to
their fair value; thus, their fair values are not disclosed.
Fair value of bonds payable with quoted price in an active market are evaluated using the market price;
bonds payable with no quoted prices in an active market are estimated by valuation methods or the
opponent’s price.
55. INFORMATION OF INSURANCE CONTRACTS
a. Objectives, policies, procedures and methods of insurance contracts risk management
1) Framework of risk management, organization structure and responsibilities:
The board of directors should ensure the effectiveness of risk management and bear the ultimate
responsibility for risk management, responsible for formulating China Life Insurance’s overall risk
appetite and risk tolerance, review and approve China Life Insurance’s risk management objectives
and strategies. “Risk Management Committee” is set under the board of directors. Various risk
management report and related issues are first report to risk management committee and made the
final approval by the board of directors. Besides the risk management committee, China Life
Insurance set up an assets and liabilities risk management team to strengthen the risk management
organization and structure.
In addition, China Life Insurance establishes the risk management department independent to the
business units, which is responsible for the implementation of various risk management measures
and the fulfillment of each risk management system, including monitoring the daily risks,
measuring and evaluating related issues, assisting the board to develop Company’s risk appetite,
executing the risk management policies approved by the board of directors. Moreover, the business
units should be responsible for the risks identification, report the risk exposure, measure the impact
of risks, review the various risks and limits regularly, and make sure that the internal control
procedures of each unit are implemented effectively in accordance with related regulations and
China Life Insurance’s risk management policy.
2) Risk management policies, procedures and methods:
According to risk management policies, China Life Insurance sets an effective mechanism to
proceed identification, measurement, monitoring, reporting and response to risk, establishes clear
objectives for risk management, controls approaches and attribution of responsibility to make sure
that each operational risk is controlled under the tolerable range, making the largest surplus and
profits for shareholders.
Pursuant to “China Life Insurance Risk Management Policy”, approved by the board of directors,
China Life Insurance follows the principle of centralized management and specialization, and
assigns responsible risk management department to manage various risks, including market, credit,
operation, liquidity, underwriting, claim resew, insurance product development and pricing,
asset-liability management, reinsurance and catastrophe risk based on the sources of risk. In
addition, China Life Insurance develops management guidelines for various types of risk,
standardizes measurement and evaluation methods, and regularly issues risk reports to monitor the
various risks.

- 115 -
3) Risk management policies, procedures and methods related to reserves:
Reserve-related risks refer to risks that various reserves are unable to deal with future obligations
due to understatement of liability for premium business. China Life Insurance sets and implements
the appropriate risk management system for the insurance business reserves and related risks.
4) Risk management policies, procedures and methods related to matching assets and liabilities:
Risks related to matching assets and liabilities indicate risks arising from inconsistent movement of
assets and liabilities. China Life Insurance sets appropriate asset-liability management system based
on the attributes and complexity of insurance liability risks. The system allows China Life Insurance
to form, implement, monitor and correct related strategies within the tolerable range and achieves
China Life Insurance’s predetermined financial goals. The contents include the following items:
a) Risk identification related to matching of assets and liabilities.
b) Risk measurement related to matching of assets and liabilities.
c) Risk responses related to matching of assets and liabilities.
b. Information of insurance risks
1) Sensitivity of insurance risks - insurance contracts and financial instruments with discretionary
participation features:
Insurance companies set aside various reserves according to the legal requirements and regularly
conduct adequacy test of liability to assess the adequacy of insurance liabilities of China Life
Insurance as a whole.
For the insurance contracts and financial instruments with discretionary participation features
underwritten by China Life Insurance, the main risks include mortality, morbidity, surrender,
expense and investment returns rate. When doing the liability adequacy test, various actuarial
assumptions are made based on available information at assessment point for all insurance contracts
and financial instruments with discretionary participation feature, to assess whether the insurance
liability of China Life Insurance is adequate. If the test result indicates the insurance liability is not
adequate, then set aside the insufficient amount as liability adequacy reserve according to the
provision. The reserve will affect current profit and loss.
As at June 30, 2019, assuming a 5% change in mortality, morbidity, surrender and expenses, and a
decrease in investment return of 0.1%, all insurance contracts and financial instruments with
discretionary participation feature will not cause China Life Insurance’s insurance liability
inadequate.
2) Interpretation for concentration of insurance risks
a) China Life Insurance’s insurance business is mainly in Taiwan, Republic of China and there is
no significant difference in insurance risk between each region. China Life Insurance had set
tolerable cumulative risk limits for each risk unit and incident. Insurance risks that exceed the
limits will be transferred through reinsurance. Please refer to Note 32 for concentration of risk
before and after the reinsurance for China Life Insurance.
b) Furthermore, according to “Regulations Governing the Setting Aside of Various Reserves by
Insurance Enterprises”, the annual increased special capital reserve, excluding taxes, for major
incidents and fluctuation of risks for abnormal changes in loss ratio and claims of each type of
insurance needs to be recognized in special capital reserve under equity in accordance with IAS
12.

- 116 -
3) Claim development trend
a) Direct business loss development trend
Accident
Year
Development Year Reserve for
Claims 1 2 3 4 5 6 7 8 9 10 11 12
2008 $ 2,170,100 $ 2,736,556 $ 2,776,542 $ 2,781,989 $ 2,786,399 $ 2,792,187 $ 2,798,032 $ 2,798,807 $ 2,799,546 $ 2,800,435 $ 2,802,449 $ 2,802,774
2009 2,243,111 2,870,648 2,924,110 2,934,461 2,936,046 2,939,451 2,940,095 2,940,209 2,940,748 2,941,322 2,941,815
2010 2,574,879 3,071,401 3,132,443 3,137,874 3,143,299 3,143,963 3,144,299 3,144,902 3,145,167 3,145,242 2011 2,610,108 3,276,928 3,328,279 3,342,075 3,346,106 3,350,438 3,351,824 3,354,243 3,354,373
2012 2,345,575 2,953,776 3,029,335 3,045,381 3,048,828 3,051,256 3,054,748 3,055,231
2013 2,267,213 2,964,954 3,028,400 3,040,442 3,045,355 3,053,040 3,053,845
2014 3,448,229 4,203,186 4,284,682 4,298,217 4,303,753 4,306,272
2015 3,530,448 4,420,482 4,498,438 4,510,113 4,514,154
2016 3,721,820 4,648,280 4,743,133 4,751,740
2017 4,320,234 5,400,952 5,483,753
2018 4,775,948 5,765,410
2019 2,034,886 $ 1,299,305
Note: This table does not include long-term life insurance. Add: Long-term insurance claims 486,686
Claim reserve for discount on no claim 112,406
Reserve for claims balance $ 1,898,397
b) Retained business loss development trend
Accident
Year
Development Year Reserve for
Claims 1 2 3 4 5 6 7 8 9 10 11 12
2008 $ 2,128,556 $ 2,682,784 $ 2,721,905 $ 2,719,002 $ 2,723,312 $ 2,728,970 $ 2,734,682 $ 2,735,440 $ 2,736,162 $ 2,737,031 $ 2,739,000 $ 2,739,317
2009 2,204,858 2,820,114 2,862,350 2,868,022 2,869,572 2,872,900 2,873,529 2,873,640 2,874,167 2,874,728 2,875,210
2010 2,535,358 3,010,157 3,068,543 3,066,830 3,072,133 3,072,782 3,073,109 3,073,699 3,073,958 3,074,032
2011 2,561,841 3,214,455 3,260,383 3,266,408 3,270,348 3,274,581 3,275,936 3,278,301 3,278,427
2012 2,304,504 2,897,464 2,967,538 2,976,431 2,979,800 2,982,173 2,985,586 2,986,058
2013 2,227,515 2,908,429 2,966,622 2,971,604 2,976,405 2,983,916 2,984,703 2014 3,387,852 4,123,055 4,197,276 4,200,902 4,206,313 4,208,775
2015 3,468,881 4,336,525 4,407,051 4,408,435 4,411,950
2016 3,657,093 4,560,257 4,647,033 4,644,214
2017 4,244,930 5,298,470 5,372,023
2018 4,692,869 5,655,663
2019 1,999,325 $ 1,280,698
Note: This table does not include long-term life insurance. Add: Long-term insurance claims 482,126
Claim reserve for discount on no claim 112,406
Reserve for claims balance $ 1,875,230
China Life Insurance recognizes claim reserve for reported claims (reported but not paid) and
unreported claims (incurred but not reported). Due to uncertainty, estimation, and judgment
involved in recognition, there is a high degree of complexity in claim reserves. Any changes of the
estimation or judgment are treated as the changes of the accounting estimates and can be recognized
as profit and loss in current year. China Life Insurance was not notified of some claims in time.
Also, the expected payment for unreported claims involves major subjective judgment and
estimation on the past experience. Thus, it is uncertain that the estimated claim reserve on the
balance sheet date will be equal to the final settled amount of claim payments. The claim reserve
recorded on the book is estimated based on the current available information. However, the final
amount probably will differ from the original estimates because of the follow-up development of
the claim events.
The charts above show the development trend of claim payments (not including cases whose
payment and time will be confirmed within a year). The accident year is the actual year for the
occurrence of the insurance claim events; the x-axis is the year of the development for the
settlement cases. Each slash represents the cumulative amount of compensation for each accident
event at the end of the year. The occurred claims include decided and undecided claims which
represent the accumulated estimated dollar amounts need to be paid for each accident year as time
passes. It is possible that the circumstances and trends affecting dollar amount of recognition for
claim reserve in the current year will be different from those in the future. Thus, the expected future
payment amount for the settlement cases cannot be determined by the charts above.
4) Credit risk:
For insurance contracts undertaken by China Life Insurance, the credit risk comes from reinsurers
who fail to fulfill their obligation of reinsurance contracts, causing China Life Insurance to be
exposed to the risk of financial loss. If China Life Insurance disputes with the reinsurers, then it
may lead to impairment of reinsurance assets. In addition, the account receivables of insurance
brokers and agents also have credit risk.

- 117 -
China Life Insurance’s highest risk exposure for the reinsurance contracts are the carrying amount
of reinsurance assets. In order to manage that risk and avoid credit losses, China Life Insurance
decides to deal with reinsurance companies that have good credits. China Life Insurance sets related
selection standard, makes regular assessment and monitors the reinsurers’ financial business
condition, credit status and rating. Also, it will adjust the business scope and scale based on the
circumstances to prevent from over concentration of credit risk.
5) Liquidity risk:
As at June 30, 2019, December 31, 2018 and June 30, 2018, the maturity analysis of liquidity risk
for insurance contract liabilities are as follow:
Within 1 Year 1 to 3 Years 3 to 5 Years 5 to 15 Years Over 15 Years
June 30, 2019
Insurance liabilities of
investment contracts
with discretionary participation features $ (53,083,054 ) $ 55,422,694 $ 146,921,096 $ 611,641,785 $ 3,500,259,491
Reserve for insurance
contracts with feature of financial instruments - - - - -
December 31, 2018
Insurance liabilities of
investment contracts with discretionary
participation features (33,630,030 ) 39,944,163 129,971,782 558,939,147 3,349,786,380
Reserve for insurance contracts with feature of
financial instruments - - - - -
June 30, 2018
Insurance liabilities of
investment contracts
with discretionary
participation features (23,372,387 ) 21,755,431 114,565,941 516,295,654 3,204,172,738 Reserve for insurance
contracts with feature of
financial instruments - - - - -
Note 1: This table estimates net cash flow of all related insurance liabilities at it starting point.
Note 2: The actual maturity date will change according to the exercise of termination right by the
policyholders.
Note 3: The table cannot match with the liabilities of balance sheet because the above contracts
use the undiscounted contractual cash flow analysis. In addition, it includes the cash
inflows of future renewal premiums.
6) Market risk:
Pursuant to the “Regulations Governing the Setting Aside of Various Reserves by Insurance
Enterprises”, when China Life Insurance measures insurance liabilities, it sets aside the reserve by
using the discount rate required by the authorities. Since the discount rate assumption does not
move in the same direction with the interest rate, changes in market risks have no significant
influence on China Life Insurance’s profit or loss and equity for insurance contracts. However,
changes in market risks may have influence on liability adequacy test evaluated based on available
information. But, it has little influence on the adequacy of current recognized insurance liabilities.

- 118 -
56. FINANCIAL RISK MANAGEMENT
a. Risk management policies and framework
The Corporation
The Corporation has established its risk management policies, which combine business management
and risk management to form a corporate culture and business strategies that place a fundamental
importance on risk management. The results of quantified and qualified risk management measures
serve as a reference for formulating business strategies. The board of directors has approved the
documentation of both overall and specific risk management policies, including business, operational
and liquidity risks.
The Corporation has established a risk management committee supervising the implementation of risk
management policies, inspecting risk control reports and dealing with related issues. The Corporation
also has a risk management department to plan and manage the risk management system, supervise the
implementation of risk management of subsidiaries and provide related information to the management
and the board of directors.
KGI Bank and subsidiaries
KGI Bank has planned a proper risk management system regarding market risk, credit risk, and
operating risk related to the operation of company as a basis of following risk management procedures.
KGI Bank also planned the mechanism of analysis, monitoring, and report related to overall risk
management. Further, it reports to senior management, and committee or board of directors with risk
management function; KGI bank keeps related information updated in response to the actual risks
encountering significant changes in macroeconomics or financial market to monitor and response
effectively.
KGI Bank’s risk management not only focuses on individual department but consider the
comprehensive effects from an overall corporation perspective.
KGI Bank undertakes risk identification with consistent asset portfolio classification as well as
correlation between each other, and establishes a consistent measure according to the different types of
exposure.
KGI Bank’s risk management divisions are as follows:
1) Board of directors
The KGI Bank’s board of director supervise the establishment of risk management structure and
culture, ensures efficiency of operation in risk management, reviews important risk control report
and bear the ultimate responsibility of risk management.
2) Risk management committee
KGI Bank has established a risk management committee supervising the implementation of risk
management policies, inspecting risk control reports and dealing with related issues.
3) Business and management departments
The department is responsible for ensuring compliance of risk management regulations while
conducting the operations to practice the control of daily risk.

- 119 -
4) Risk management department
KGI Bank establishes a risk management department which is independent from operating
departments to take charge of planning and managing of risk management system and to provide
overall risk management information to senior management and the board of directors.
5) Internal audit department
The department takes charge of establishment of all risk mechanisms and audit the compliance and
implementation of mechanism.
Risk management is a joint duty to all KGI Bank’s department including business, legal, compliance of
law, finance, accounting, administration, operating, audit departments and so on, should all practice it
actively, and through coordination of intra-departments to carry out the overall risk management.
KGI Securities and subsidiaries
1) Financial risk management objectives
The KGI Securities’ Board of Director and senior management attach great importance to risk
management, and continuously to raise risk management mechanism and aimed to strengthen the
competitiveness of KGI Securities and subsidiaries. To reach the goal of risk management,
controlling the expected or unexpected loss in operating is a passive way and in a positive way is to
raise Risk Adjusted Return on Capital. In order to use the capital more efficiently, KGI Securities
uses risk appetite as a base according to venture capital allocation. While setting risk appetite, KGI
Securities takes the amount of liquid capital and financial and operational goal into consideration.
2) Risk management organization
KGI Securities’ risk management organization framework, which monitors, plans, and executes
related risk management affairs, includes board of directors, risk management department, business
department and other related departments. KGI Securities’ business departments and back offices
should comply with risk management regulations and reports all anomalies and their effects to Risk
Management Committee (RMC) and Investment Review Committee (IRC) in time. Risk
management organizations’ functions and responsibilities are as follows:
The board of directors is the highest decisive department in KGI Securities, and it also bears
ultimate responsibility while monitoring the execution of overall risk management system.
Functions and responsibilities of committees: RMS executes risk management decisions made by
board of directors, which include reviewing KGI Securities’ every department’s risk-based, capital
allocation, risk-based limit and their management system, reviewing guidelines regarding risk
management, and inspecting related countermeasures according to risk reports submitted by
departments; IRC examines underwriting of securities, assisting of business projects and
non-subsidiary investments; and Merchandise Review Committee (MRC) sets up the reviewing
system of KGI Securities’ for sale of commodities, trusted investment and management of new
business and financial instruments.
Business department is responsible for setting risk management systems, managing and reporting
daily risks which belong to its department and executing internal controls effectively which
correspond to the government regulations and risk management policies.

- 120 -
Risk management department’s functions and responsibilities are ensuring the execution of policies
approved by board of directors, making risk management rules and guidelines, controlling the
measuring, monitoring and evaluating of daily risk, producing periodic (daily, weekly or monthly)
risk management reports and submitting them to management, and developing or assisting the
exploitation and maintenance of risk management information system.
Legal affair department’s functions and responsibilities are providing legal consultations, drafting,
reviewing and taking custody of major contracts and monitoring litigation and non-litigation cases.
Legal compliance department’s functions and responsibilities are conveying laws, providing legal
consultation, negotiating and facilitating communications. It is also responsible to make sure that all
operations and management guidelines are updated accordingly as related regulations are amended.
It also supervises as all units conduct an overview of the feasibility of legal compliance.
Fund dispatching department is responsible for KGI Securities’ dispatching and usage of capital,
setting up and maintaining finance credits with financial institution, lowering capital costs and
managing liquidity risks.
Internal audit department’s function and responsibilities are auditing execution of regulations and
business operations, proposing amendments in time, and tracing improving progresses after
reporting defects and anomalies to the board of directors.
Finance department, settlement department, information department and other related department
should understand the risk facing in its industry thoroughly on the basis of risk management related
regulations, take necessary risk control measures into consideration while setting up operating
management guidelines to assist in completing the whole cooperation’s various risk management
tasks, and monitor transaction processes regarding valuation, confirmation of price information,
preparation of income statement, processing and confirming of transaction, settling, verifying of
accounts, asset control, information safety and maintenance of information.
3) Risk management system
KGI Securities has planned proper risk management system regarding market risk, credit risk,
operating risk, liquidity risk, legal risk and other risks related to the operation of company as a basis
of following risk management procedures.
The risk management policies, various risk management standards and operation of merchandise
guidelines are established by competent unit. The competent unit makes a draft and asks the related
department for advices and opinions, and it will be conducted following the Corporation’s
established guidelines and related standards.
4) Risk management mechanism
The process of various risk managements include risk identification, risk measurement, risk
monitoring and control and risk reports. The evaluation and strategies of important risk are
explained as follows:
a) Market risk
KGI Securities restricts the risk level to which it is exposed to an acceptable level through
structuring risk management system, enacting market risk management policies, and
formulating merchandise operation guidelines. It also restraint risk through allocating venture
capital, subject to management strategies and risk appetite, setting various risk-based limits, and
conducting risk monitoring on a daily basis.

- 121 -
KGI Securities implemented the MSCI Risk Manager, a market risk management system, as a
quantitative management instrument. The system integrates all holding positions and provides
in a daily basis various analyzing metrics and comprehensive computation results, including
equity risk, interest rate risk, exchange rate risk, etc., as well as adjustment and application of
diverse derivatives models. Also, the risk management department controls risk-based limits by
business units on a daily basis to enforce venture capital allocation.
To establish reliability of value at risk (VaR) model, risk management department conducts
back testing periodically. Additionally, it builds various scenarios for stress testing and scenario
analysis, to help the management understand the risk tolerance level of KGI Securities.
b) Credit risk
The risk management department applies for credit risk capital toward Board of Directors
annually. Establish proper credit risk expected loss limitation amount relating to the firms,
single credit valuation level. Also, set different risk limitation amount including countries,
industries, groups, high-risk industries/groups, etc. Routinely examine KGI Securities’ credit
risk exposure and the use of various credit risk limitation amount.
KGI Securities sets proper credit limits by considering capital risk, KGI Securities’ net value,
risk measurement and concentration of risk, and by taking into account the credit rating of
issuers or counterparties, the traits of transactions, and the characters of instruments, etc. KGI
Securities would periodically inspect the credit records of counterparties, holding positions, and
collaterals, then report the use of various credit risk limits to key management as well as related
departments.
c) Liquidity risk
The liquidity risk could be divided into two categories: Market liquidity risk and fund liquidity
risk. The measurement of market liquidity risk is the trading volume of holding position of KGI
Securities and serves as the basis of information disclosure. The fund liquidity risk management
has established independent fund transfer unit, considering the timing and net cash flow of need
by various departments, to effectively control the fund liquidity risk.
The fund transfer unit routinely examines relative financial ratio to ensure the liquidity of assets
and liabilities. Also, KGI Securities established fund-flow simulation analysis mechanism
according to the anticipation of the future cash need and the fund transferring ability of KGI
Securities made by fund transfer unit. The unit would also set proper fund safety inventory and
emergency response measure to fulfill the future probable fund need.
d) Operating risk and other risks
All units conduct operation risk management respectively by their own business. This
management contains authorization related to operation risk, process, operation content, plan
following the division of front and back desk operation and principle of segregation of duties.
Operation risk controls include information security and maintenance, clearing, trade
confirmation, statements preparation, segregation of duties, relating party trade control as well
as the internal control, etc.
The operation risk of each unit’s business is examined and controlled by relative back desk unit
such as clearing unit and the information department. In addition to the compliance of law and
regulation, the internal audit department would implement examination by the regulation and
procedure of internal control system to ensure the effectiveness of risk management.

- 122 -
5) Risk hedge and mitigation strategy
KGI Securities had decided regulations to manage to engage in hedging and risk mitigation
measures in all operations based on KGI Securities’ capital scale and risk tolerance. Such measures
include: Risk acceptance, risk adverse, risk transfer and risk control. Reasonable risk avoidance
mechanisms can effectively limit a company’s risk within a pre-approved range. The actual
execution of hedge, depending on the market dynamics, business strategies, product characteristics
and risk management regulations, utilizes previously approved financial instruments to adjust the
risk structure and risk level of the total exposure to an acceptable level.
CDIB Capital Group and subsidiaries
CDIB Capital Group has established its risk management policies, which combine business
management and risk management to form a corporate culture and business strategies that place a
fundamental importance on risk management. The results of quantified and qualified risk management
measures serve as a reference for formulating business strategies. The board of directors has approved
the documentation of both overall and specific risk management policies.
CDIB Capital Group has established a risk management committee supervising the implementation of
risk management policies, inspecting risk control reports and dealing with related issues. CDIB Capital
Group also has a risk management department to plan and manage the risk management system and
provide related information to the management and the board of directors.
China Life Insurance
China Life Insurance’s financial risk management objectives are primarily managing risks arising from
holding financial assets. According to China Life Insurance’s risk management policies, the main
financial risks is market risk, credit risk and liquidity risk. China Life Insurance has established
guidelines related to the management of the financial risk. The following is the definition, source,
management procedures of the risk and methods used to measure the risk.
b. Credit risk
KGI Bank and subsidiaries
1) Definition and source of credit risk
Credit risk is the risk of financial loss to KGI Bank if a creditor or counterparty fails to meet its
contractual obligations or has negative changes in its credit quality. Credit risk management covers
all operating activities that involve credit risk, including loans, call loans to banks, banking book
securities investment, financial derivatives, repurchase agreement transactions and other operating
activities.
2) Credit risk management policy
KGI Bank has standard control procedures for credit risk identification, measurement, and
generation of disclosures and reports to be used for a rational identification, measurement,
disclosure, and effective control of credit risk. These procedures include applying standard
screening criteria for target clients, credit investigations for credit approval or rejection, careful
deliberation of applications for certain exceptions, credit review, management of non-performing
loans and requests, and control over all related documents and information. KGI Bank also adjusts
the credit risk structure accordingly so that credit portfolios are within KGI Bank’s risk appetite.
Further, KGI Bank assesses the changes in the economy to adjust risk structure and develops
strategies in response to these changes to alleviate shareholders’ value and ensure the risk is
bearable.

- 123 -
Based on the risk management policies, the management process is carried out as follows:
a) Credit investigation
In screening target clients, KGI Bank asks for all the necessary documents from the clients in
order to get an accurate understanding of their backgrounds accurately and control credit
portfolios within the acceptable range.
b) Credit approval
Cases that have passed the credit investigation are reviewed by the credit authority of each level.
The credit authorities approve credits in accordance with KGI Bank’s credit limit structure and
authorization policies. KGI Bank’s credit approval structure and policies are based not only on
the Banking Act and other government rules for credit extended to the same person or affiliated
enterprises/groups, industry and country, but also on the professionalism of KGI Bank’s credit
authorities and the quality of asset control. The amounts of credit authorized are reviewed by the
credit authorities occasionally.
c) Post-lending loan review
The corporate banking segment of KGI Bank tracks the borrowers’ financial and business
conditions, generates risk assessment reports on credit asset portfolios regularly, operates a risk
warning system and adjusts business development strategies as needed to cope with economic
conditions and changes in asset quality through the use of an account management scheme and a
regular-reassessment system. For delinquent loans, KGI Bank uses the concentration
management method, together with information systems and analysis models, to conduct regular
loan reviews for the enhanced management of overdue loans and expedite the collection of
nonperforming loans.
d) Risk report and information disclosures
The risk management department is responsible for measuring risk, preparing quarterly risk
report, including all risk management index and risk capital requirement assessment and
reporting to risk management committee and board of directors.
3) Mitigation of risks or hedging of credit risk
Considering the asset hedge market and liquidity, KGI Bank takes the necessary risk reduction
strategies, mainly on loan objects and hedge transactions involving assets with doubtful
collectability or a long period of duration, including methods for increasing appropriate collaterals
with good liquidity, or transferring to credit guarantee institutions such as the Small and Medium
Credit Guarantee Fund to maximize the collateral. For determining the value of foreclosed
collaterals, liquid securities will be evaluated at their market value; other collaterals will be subject
to field surveys by appraisal firms for their fair value assessment, which will be used as a basis for
demanding additional collaterals or adjusting the credit amount to ensure that risks are within KGI
Bank’s tolerance range.
If clients are found to have bad credit features, KGI Bank will strengthen the monitoring of the
credit of borrower and guarantor and take measures, such as demanding an early repayment or
additional collateral in mitigating KGI Bank’s credit risk. In addition, KGI Bank sets different
credit limits for counterparties involved in derivative transactions and enters into collateral support
agreements with counterparties to ensure that risks are under control.

- 124 -
4) Maximum exposure to credit risk
Without taking into account irrevocable collateral or other credit enhancements and maximum
exposure of unused amount for unused revolving credit without credit card and cash card, the
maximum exposure to credit risk from on-balance sheet financial assets was equal to their carrying
values; the maximum exposure of credit risk from off-balance sheet financial instruments was as
follows:
June 30,
2019
December 31,
2018
June 30,
2018
Irrevocable loan commitments, guarantees
and letters of credit $ 46,269,614 $ 37,251,576 $ 34,810,201
KGI Bank believes that stringent selection processes and conducting regular review afterwards are
the reasons why they can continuously control and minimize the credit risk exposure from their
off-balance sheet items.
KGI Bank and subsidiaries’ book values of maximum exposure credit risk for major credit assets
were as follows:
Discounts and Loans
June 30, 2019
Stage 3
Stage 1 Stage 2 Purchased or
12-month
Expected Credit
Lifetime Expected
Credit
Lifetime Expected
Credit
Originated
Credit-impaired
Recognition of
Impairment/
Losses Losses Losses Financial Asset Adjustment Total
Short-term loans $ 58,087,454 $ 939,830 $ 726,968 $ - $ 59,754,252
Short-term secured loans 21,466,859 155 - - 21,467,014
Medium-term loans 141,468,956 173,660 331,017 - 141,973,633
Medium-term secured loans 65,091,659 44,540 31,095 - 65,167,294
Long-term loans 1,328,316 239,846 450,440 - 2,018,602
Long-term secured loans 68,123,366 115,288 946,541 - 69,185,195
Loans reclassified to nonperforming loans - - 348,258 - 348,258
Export negotiations 42,776 - - - 42,776
Total book values 355,609,386 1,513,319 2,834,319 - 359,957,024
Impairment allowance (1,536,491 ) (161,763 ) (438,994 ) - (2,137,248 )
Impairment recognized in accordance
with Regulation Governing the
Procedures for Banking Institutions to
Evaluate Assets and Deal with
Non-performing/Non-accrual Loans $ (2,429,730 ) (2,429,730 )
Adjusting for discounts and loans
premium (122,723 ) (122,723 )
$ 354,072,895 $ 1,351,556 $ 2,395,325 $ - $ (2,552,453 ) $ 355,267,323
Receivables
June 30, 2019
Stage 3
Stage 1 Stage 2 Purchased or
12-month
Expected Credit
Lifetime Expected
Credit
Lifetime Expected
Credit
Originated
Credit-impaired Recognition of
Losses Losses Losses Financial Asset Impairment Total
Credit card business $ 2,864,085 $ 190,738 $ 99,310 $ - $ 3,154,133
Accounts receivable - forfaiting 6,068,832 - - - 6,068,832
Accounts receivable factoring without
recourse 6,561,544 133 254 - 6,561,931
Acceptances 101,164 - - - 101,164
Installment accounts and lease receivables 3,519,029 43,613 82,681 - 3,645,323
Total book value 19,114,654 234,484 182,245 - 19,531,383
Impairment allowance (56,006 ) (31,187 ) (58,144 ) - (145,337 )
Impairment recognized in accordance
with Regulation Governing the
Procedures for Banking Institutions to
Evaluate Assets and Deal with
Non-performing/Non-accrual Loans $ (145,327 ) (145,327 )
$ 19,058,648 $ 203,297 $ 124,101 $ - $ (145,327 ) $ 19,240,719

- 125 -
Discounts and Loans
December 31, 2018
Stage 3
Stage 1 Stage 2 Purchased or
12-month
Expected Credit
Lifetime Expected
Credit
Lifetime Expected
Credit
Originated
Credit-impaired
Recognition of
Impairment/
Losses Losses Losses Financial Asset Adjustment Total
Short-term loans $ 59,431,415 $ 1,121,576 $ 614,463 $ - $ 61,167,454
Short-term secured loans 20,978,083 2,600 4,797 - 20,985,480
Medium-term loans 135,657,957 192,409 361,245 - 136,211,611
Medium-term secured loans 55,203,609 62,808 11,912 - 55,278,329
Long-term loans 929,979 277,446 402,542 - 1,609,967
Long-term secured loans 63,377,413 96,527 1,010,702 - 64,484,642
Loans reclassified to nonperforming loans - - 420,512 - 420,512
Export negotiations 56,079 - - - 56,079
Total book values 335,634,535 1,753,366 2,826,173 - 340,214,074
Impairment allowance (1,415,427 ) (102,703 ) (495,451 ) - (2,013,581 )
Impairment recognized in accordance
with Regulation Governing the
Procedures for Banking Institutions to
Evaluate Assets and Deal with
Non-performing/Non-accrual Loans $ (2,320,761 ) (2,320,761 )
Adjusting for discounts and loans
premium (128,300 ) (128,300 )
$ 334,219,108 $ 1,650,663 $ 2,330,722 $ - $ (2,449,061 ) $ 335,751,432
Receivables
December 31, 2018
Stage 3
Stage 1 Stage 2 Purchased or
12-month
Expected Credit
Lifetime Expected
Credit
Lifetime Expected
Credit
Originated
Credit-impaired Recognition of
Losses Losses Losses Financial Asset Impairment Total
Credit card business $ 2,449,428 $ 196,501 $ 91,043 $ - $ 2,736,972
Accounts receivable - forfaiting 8,122,872 - - - 8,122,872
Accounts receivable factoring without
recourse 8,180,068 280 160 - 8,180,508
Acceptances 140,770 - - - 140,770
Installment accounts and lease receivables 3,365,564 47,465 92,327 - 3,505,356
Total book value 22,258,702 244,246 183,530 - 22,686,478
Impairment allowance (65,519 ) (27,975 ) (66,189 ) - (159,683 )
Impairment recognized in accordance
with Regulation Governing the
Procedures for Banking Institutions to
Evaluate Assets and Deal with
Non-performing/Non-accrual Loans $ (186,096 ) (186,096 )
$ 22,193,183 $ 216,271 $ 117,341 $ - $ (186,096 ) $ 22,340,699
Discounts and Loans
June 30, 2018
Stage 3
Stage 1 Stage 2 Purchased or
12-month
Expected Credit
Lifetime Expected
Credit
Lifetime Expected
Credit
Originated
Credit-impaired
Recognition of
Impairment/
Losses Losses Losses Financial Asset Adjustment Total
Short-term loans $ 70,572,268 $ 1,203,311 $ 737,988 $ - $ 72,513,567
Short-term secured loans 17,968,663 4,750 154,648 - 18,128,061
Medium-term loans 131,521,646 223,262 349,906 - 132,094,814
Medium-term secured loans 51,779,052 71,980 10,271 - 51,861,303
Long-term loans 1,150,251 258,231 381,199 - 1,789,681
Long-term secured loans 57,010,794 135,118 1,006,484 - 58,152,396
Loans reclassified to nonperforming loans - - 486,955 - 486,955
Export negotiations 80,694 - - - 80,694
Total book values 330,083,368 1,896,652 3,127,451 - 335,107,471
Impairment allowance (1,334,475 ) (104,186 ) (541,647 ) - (1,980,308 )
Impairment recognized in accordance
with Regulation Governing the
Procedures for Banking Institutions to
Evaluate Assets and Deal with
Non-performing/Non-accrual Loans $ (2,263,284 ) (2,263,284 )
Adjusting for discounts and loans
premium (111,511 ) (111,511 )
$ 328,748,893 $ 1,792,466 $ 2,585,804 $ - $ (2,374,795 ) $ 330,752,368

- 126 -
Receivables
June 30, 2018
Stage 3
Stage 1 Stage 2 Purchased or
12-month
Expected Credit
Lifetime Expected
Credit
Lifetime Expected
Credit
Originated
Credit-impaired Recognition of
Losses Losses Losses Financial Asset Impairment Total
Credit card business $ 2,909,705 $ 203,812 $ 90,829 $ - $ 3,204,346
Accounts receivable - forfaiting 8,119,096 - - - 8,119,096
Accounts receivable factoring without
recourse 9,748,678 276 223 - 9,749,177
Acceptances 150,268 - - - 150,268
Installment accounts and lease receivables 3,387,736 8,243 147,252 - 3,543,231
Total book value 24,315,483 212,331 238,304 - 24,766,118
Impairment allowance (80,395 ) (18,326 ) (86,953 ) - (185,674 )
Impairment recognized in accordance
with Regulation Governing the
Procedures for Banking Institutions to
Evaluate Assets and Deal with
Non-performing/Non-accrual Loans $ (200,236 ) (200,236 )
$ 24,235,088 $ 194,005 $ 151,351 $ - $ (200,236 ) $ 24,380,208
Maximum exposures to credit risk of financial instrument not applicable to impairment were as
follows:
June 30,
2019
December 31,
2018
June 30,
2018
Financial assets at FVTPL
Debt instrument $ 42,898,385 $ 35,640,472 $ 31,299,133
Derivatives instruments 40,483,065 23,860,387 44,122,953
5) Collaterals and credit enhancement
KGI Bank and its subsidiaries’ pledged collaterals associated with credit include discounts, loans
and receivables which contain real estate, properties (e.g.: Machinery), rights certificates and
securities (e.g.: Certificates of deposit, stocks), notes receivable arose from borrowing of business
transactions, deposits guaranteed by authorities of treasury department of government, banks or
guarantee institutions authorized by government (e.g.: SME credit guarantee fund and letter of
credit guaranteed) and mortgages set in accordance with the laws including registration of land
rights. Financial assets held by KGI Bank are part of corporate bonds guaranteed by financial
institutions as credit enhancement.

- 127 -
KGI Bank and its subsidiaries observe collateral’s value of financial instrument closely, and
consider recognizing impairment for financial assets with credit impairment. KGI Bank and its
subsidiaries’ financial assets with impairment, and collateral’s values for mitigation of potential
losses were as follows:
June 30, 2019
Total Book
Value
Credit
Impairment
Amount of
Risk Exposure
(Amortized
Cost)
Collaterals
Value
Impaired asset:
Accounts receivable
Credit card business $ 99,310 $ 24,194 $ 75,116 $ -
Accounts receivable
factoring 254 15 239 -
Installment receivables
and lease
receivables 82,681 33,935 48,746 -
Discounts and loans 2,834,319 438,994 2,395,325 2,459,731
Total amount of impaired
asset $ 3,016,564 $ 497,138 $ 2,519,426 $ 2,459,731
December 31, 2018
Total Book
Value
Credit
Impairment
Amount of
Risk Exposure
(Amortized
Cost)
Collaterals
Value
Impaired asset:
Accounts receivable
Credit card business $ 91,043 $ 28,013 $ 63,030 $ -
Accounts receivable
factoring 160 10 150 -
Installment receivables
and lease
receivables 92,327 38,166 54,161 96,449
Discounts and loans 2,826,173 495,451 2,330,722 8,450,071
Total amount of impaired
asset $ 3,009,703 $ 561,640 $ 2,448,063 $ 8,546,520

- 128 -
June 30, 2018
Total Book
Value
Credit
Impairment
Amount of
Risk Exposure
(Amortized
Cost)
Collaterals
Value
Impaired asset:
Accounts receivable
Credit card business $ 90,829 $ 33,796 $ 57,033 $ -
Accounts receivable
factoring 223 53 170 -
Installment receivables
and lease
receivables 147,252 53,104 94,148 99,139
Discounts and loans 3,127,451 541,647 2,585,804 2,607,125
Total amount of impaired
asset $ 3,365,755 $ 628,600 $ 2,737,155 $ 2,706,264
The amount the of KGI Bank and its subsidiaries’ financial assets which has been written off and
still has recourse activities of outstanding contract amount is $268,574 thousand and $272,064 for
the six months ended June 30, 2019 and 2018.
6) Concentrations of credit risk
Concentrations of credit risk arise when there is only one counterparty, or when there is a number of
more than one counterparties or exposure but they have comparable economic characteristics, or
when such counterparties are engaged in similar activities, or operate in the same geographical areas
or industry sectors, so that their collective ability to meet contractual obligations is uniformly
affected by changes in economic or other conditions.
Credit risk concentration can arise in a bank’s assets, liabilities, or off-balance sheet items through
the execution or processing of transactions (either product or service), or through a combination of
exposures across these broad categories. It includes credits, due from and call loans to banks,
investments, receivables and derivatives. To manage credit risk concentration, KGI Bank maintains
a diversified portfolio and monitors its exposure continually. KGI Bank’s most significant
concentrations of credit risk are summarized as follows:
a) By object
Object June 30, 2019 December 31, 2018 June 30, 2018
Amount % Amount % Amount %
Public and private
enterprise $ 237,796,692 66.06 $ 223,928,501 65.82 $ 226,380,146 67.56
Natural person 121,801,750 33.84 115,908,259 34.07 108,419,285 32.35
Non-profit
organization 358,582 0.10 377,314 0.11 308,040 0.09
Total $ 359,957,024 100.00 $ 340,214,074 100.00 $ 335,107,471 100.00
b) By region
Region June 30, 2019 December 31, 2018 June 30, 2018
Amount % Amount % Amount %
Domestic $ 261,629,853 72.68 $ 249,109,901 73.22 $ 248,785,645 74.24
Overseas 98,327,171 27.32 91,104,173 26.78 86,321,826 25.76
Total $ 359,957,024 100.00 $ 340,214,074 100.00 $ 335,107,471 100.00

- 129 -
c) By collateral
Collateral June 30, 2019 December 31, 2018 June 30, 2018
Amount % Amount % Amount %
Non-collateral $ 204,026,130 56.68 $ 199,322,970 58.59 $ 207,808,096 62.01
Collateral
Financial collateral 8,754,169 2.43 7,522,386 2.21 8,140,229 2.43
Property 122,948,824 34.16 112,842,633 33.17 101,189,177 30.20
Guarantee 16,806,944 4.67 14,661,938 4.31 12,433,091 3.71
Other 7,420,957 2.06 5,864,147 1.72 5,536,878 1.65
Total $ 359,957,024 100.00 $ 340,214,074 100.00 $ 335,107,471 100.00
7) Management of foreclosed collateral
Foreclosed collaterals are recorded at cost, using lower-at-cost or market approach as of the balance
sheet date. If collaterals were not disposed of within the statutory period, KGI Bank should apply
for an extension of the disposal period and increase its provision for possible losses, if necessary.
Foreclosed collateral will be sold when it is actually available for sale. The foreclosed collateral is
classified as other assets in balance sheet. The difference amount between the disposition price and
the book value is recognized as net other noninterest profit and gain.
KGI Bank’s foreclosed collaterals were mainly securities, land and buildings. As of June 30, 2019,
December 31, 2018 and June 30, 2018, the carrying amounts of the collaterals were $0 thousand.
Foreclosed collaterals assumed are classified as other assets in the balance sheets.
8) Disclosures required in the Regulations Governing the Preparation of Financial Reports by Public
Banks
a) Asset quality of nonperforming loan and overdue credits
Item
June 30, 2019
Nonperforming
Loan (NPL)
(Note 1)
Total Loans NPL Ratio
(Note 2)
Loan Loss
Reserves
(LLR)
Coverage Ratio
(Note 3)
Corporate loan Secured $ 88,125 $ 77,487,189 0.11% $ 956,926 1,085.88%
Unsecured 80,419 166,326,512 0.05% 1,887,891 2,347.56%
Consumer loan
Mortgage (Note 4) 21,462 53,097,129 0.04% 657,500 3,063.53%
Cash card 126,057 13,344,862 0.94% 306,083 242.81%
Micro credit (Note 5) 158,696 24,331,714 0.65% 343,582 216.50%
Other (Note 6) Secured 21,741 25,346,576 0.09% 411,112 1,890.98%
Unsecured 619 23,042 2.69% 3,884 626.88%
Total 497,119 359,957,024 0.14% 4,566,978 918.69%
Overdue
Receivable
Account
Receivable
Delinquency
Ratio
Allowance for
Credit Losses Coverage Ratio
Credit card 20,656 3,154,133 0.65% 59,062 285.93%
Account receivable - factored without recourse
(Note 7) 35 6,561,931 0.00% 90,308 258,421.22%
Item
June 30, 2018
Nonperforming
Loan (NPL)
(Note 1)
Total Loans NPL Ratio
(Note 2)
Loan Loss
Reserves
(LLR)
Coverage Ratio
(Note 3)
Corporate loan Secured $ 138,038 $ 59,539,652 0.23% $ 753,801 546.08%
Unsecured 156,918 170,137,202 0.09% 1,950,026 1,242.71%
Consumer loan
Mortgage (Note 4) 33,727 46,179,692 0.07% 697,313 2,067.50%
Cash card 147,738 14,117,658 1.05% 286,430 193.88%
Micro credit (Note 5) 158,908 22,527,211 0.71% 319,886 201.30%
Other (Note 6) Secured
23,642 22,572,011 0.10%
232,343 982.77%
Unsecured 254 34,045 0.75% 3,793 1,490.66%
Total 659,225 335,107,471 0.20% 4,243,592 643.72%
Overdue
Receivable
Account
Receivable
Delinquency
Ratio
Allowance for
Credit Losses Coverage Ratio
Credit card 19,498 3,204,346 0.61% 59,724 306.31%
Account receivable - factored without recourse
(Note 7) 10 9,749,177 0.00% 133,076 1,386,932.12%

- 130 -
Note 1: Non-performing loans are reported in accordance with the “Regulations Governing the
Procedures for Banking Institutions to Evaluate Assets and Deal with
Non-performing/Non-accrual Loans” issued by Ministry of Finance. Overdue credit
card receivables are regulated by Order No. 0944000378 announced by the FSC on
July 6, 2005.
Note 2: NPL ratio = NPL/Total loans. For credit card business: Delinquency ratio = Overdue
credit card receivables/Credit card receivables balance.
Note 3: Coverage ratio = LLR/NPL. Coverage ratio of credit receivables: Allowance for credit
losses/Overdue credit card receivables.
Note 4: Household mortgage refers to financing obtained to buy, build, or fix houses owned
by the borrower or the borrower’s spouse or children, with the house used as loan
collateral.
Note 5: Micro credit is covered by a Banking Bureau pronouncement dated December 19,
2005 (Order No. 09440010950) and is excluded from credit card and cash card loans.
Note 6: “Others” under consumer loans refers to secured or unsecured loans other than
mortgage loans, cash cards, micro credit, and it does not include credit cards.
Note 7: As required by the Banking Bureau in its letter dated July 19, 2005 (Order No.
0945000494), allowance for bad debt is recognized once no compensation is made by
a factor or insurance company within three months for accounts receivable - factoring
without recourse.
b) Exemption of KGI Bank’s nonperforming loans and overdue receivables
Items
June 30, 2019 June 30, 2018
Discounts and
Loans
Accounts
Receivable
Discounts and
Loans
Accounts
Receivable
Amounts of executed
contracts on negotiated
debts not reported (Note 1) $ 9,556 $ 121 $ 12,063 $ 124
Amounts of executed debt
settlement program and
rehabilitation program not
reported (Note 2) 48,919 5,857 46,602 4,813
Total $ 58,475 $ 5,978 $ 58,665 $ 4,937
Note 1: The disclosure of excluded NPLs and excluded overdue receivables resulting from
debt negotiations and loan agreements is based on the Banking Bureau letter dated
April 25, 2006 (Order No. 09510001270).
Note 2: The disclosure of excluded NPLs and excluded overdue receivables resulting from
consumer debt clearance is based on the Banking Bureau letters dated September 15,
2008 (Order No. 09700318940) and dated September 20, 2016 (Order No.
10500134790).

- 131 -
c) Concentration of KGI Bank’s credit extensions
June 30, 2019
(In Thousands of New Taiwan Dollars, %)
Top 10
Ranking Group (Industry Category) Total Credit
Percentage
of Net
Worth
1 A Group - 012331 Manufacture of cement $ 8,009,288 12.76
2 B Group - 016811 Real estate activities for sale and
rental
7,680,700 12.24
3 C Group - 012699 Manufacture of other electronic
parts and components not elsewhere classified
6,876,198 10.95
4 D Group - 012613 Packaging and testing of
semi-conductors
5,430,698 8.65
5 E Group - 016811 Real estate activities for sale and
rental
4,978,477 7.93
6 F Group - 012711 Computer manufacturing 4,638,863 7.39
7 G Group - 016429 Activities of other holding
companies
4,526,000 7.21
8 H Group - 015100 Civil aviation transportation 4,065,514 6.48
9 I Group - 012411 Iron and steel smelting 3,848,880 6.13
10 J Group - 016700 Real estate development activities 3,720,000 5.93
June 30, 2018
(In Thousands of New Taiwan Dollars, %)
Top 10
Ranking Group (Industry Category) Total Credit
Percentage
of Net
Worth
1 C Group - 012711 Computer manufacturing $ 7,210,016 12.38
2 A Group - 011850 Manmade fiber manufacturing 6,935,855 11.91
3 D Group - 012613 Packaging and testing of
semi-conductors
5,318,459 9.14
4 I Group - 012411 Iron and steel smelting 4,562,167 7.84
5 K Group - 016700 Real estate development activities 4,447,305 7.64
6 J Group - 016700 Real estate development activities 4,240,000 7.28
7 F Group - 012729 Manufacture of other
communication equipment
3,516,911 6.04
8 L Group - 016700 Real estate development activities 3,485,947 5.99
9 M Group - 012711 Computer manufacturing 3,472,616 5.96
10 H Group - 015100 Civil aviation transportation 3,059,429 5.26

- 132 -
9) Judgements of a significant increase in credit risk since initial recognition
Credit business
KGI Bank assesses changes in credit quality during the expected lifetime of various types of credit
assets on each reporting date to determine if there has been a significant increase in credit risk since
the initial recognition, primarily consideration of indicators and supporting information (including
prospective information) were as the follows:
a) Quantitative index
When the contractual payments are overdue for more than 30 days, the credit risk of the credit
assets are considered to be significantly increased since the initial recognition.
b) Qualitative index
i. Changes in the current or predicted operating, financial, or economic conditions that are
expected to cause a significant change in the ability of the borrower to perform its
obligations.
ii. Actual or expected significant changes in borrower’s operating results.
iii. The credit risk of other credit contracts of the same borrower has increased significantly.
iv. Individual credit assets, if the client did not suffer from financial difficulties at the time of
the agreement can be included after assessment.
For the various types of credit assets of KGI Bank which are not be regarded as low credit risk,
its can be assumed that the credit risk of such assets has not increased significantly since the
initial recognition.
10) Definition of default and impaired credit of financial assets
The definition of default of the financial assets of the KGI Bank is the same as that of the impaired
credit assets. If one or more of the following conditions are met, KGI Bank determines that the
credit asset has defaulted and the credit is impaired:
a) Quantitative index
i. When the borrower’s overdue payment of the contract is more than 90 days.
ii. Changes in external rating of guarantor or issuer of the notes or bonds.
b) Qualitative index
If there is evidence that the borrower will be unable to settle the loan, or has significant financial
difficulties, such as:
i. Borrower has been bankrupt or may file a petition for bankruptcy or financial restructuring.
ii. Borrower’s loan contract has been reclassified to nonperforming loans or has been written
off as bad debts by the KGI Bank.
iii. Due to financial or contractual reasons related to the financial difficulties of the borrower,
the creditor of the borrower gives the borrower concessions that would not have been
considered or agreed (agreements).

- 133 -
iv. For cases involving the sale of non-performing loans and suits.
v. Payment by the bank to fulfill off-balance sheet financial contracts (e.g., guarantee
advances).
The aforementioned definition of default and credit impairment applied to the credit assets held
by KGI Bank is consistent with the definition of credit assets used for internal credit risk
management purposes, and the relevant impairment assessment model is used.
The credit asset will be restore to the state of compliance and is not considered a credit impaired
credit assets in default if it no longer meets the definition of default and credit impairment.
A debt instrument investor may also be deemed to have a credit impairment on the financial
asset if the rating of the bond guarantor or issuer's rating deteriorates significantly, for example,
from an investment grade to a junk bond rating, or if one or more of the following conditions
are met:
i. The guarantor or issuer cannot repay the principal or interest on the maturity date of the
bond.
ii. Before the maturity of the note or bond, it can be objectively determined that the bond
guarantor or issuer may not be able to repay the principal and interest of the bond on time.
iii. Before the maturity of the note or bond, the bond guarantor or issuer is in bankruptcy or in
reorganization or taken over due to financial difficulties.
iv. Before the maturity of the note or bond, the bond guarantor or issuer closes down or is in the
process of perform other financial restructuring.
11) Write-off policy
The KGI Bank shall write off bad debts for non-performing loans and overdue receivables that meet
one of the following requirements:
a) When reaching the criteria of write-off of the regulation.
b) There is a need to expedite the reduction of non-performing loans or for certain businesses that
needs to comply with the requirements of the governing authorities.
c) Written off by the governing authorities or the financial inspection authorities.
d) If it is difficult to dispose of the collateral or it may take a long time to recover the loan, the
creditor’s balance shall be written of within the period which specified in a).
e) Obtaining the documentary evidence or supporting documents with the assessments that it is not
possible to recover the loan.
12) Amendment of contract cash flows of financial assets
KGI Bank may amend the contract cash flows of financial assets as a result of financial difficulties
of borrowers, improvement of problematic debtors’ recovery rate or maintenance customer
relationships. The contract amendments to cash flows amendment include the extension of the
contract period, interest payment time modification, contract interest modification, or exemption of
part of the debts.

- 134 -
13) Measurement of expected credit losses
For the purpose of measuring expected credit losses, KGI Bank divides credit assets into the
following groups; for corporate banking, they are grouped according to scale, while for consumer
banking, they are grouped according to product characteristics.
Business Combination Definition
Corporate banking
Large enterprises + Stage 1 Credit risk has not increased
significantly. Small and medium enterprises + Stage 1
Large enterprises + Stage 2 Credit risk has increased
significantly. Small and medium enterprises + Stage 2
Large enterprises + Stage 3 Credit impaired.
Small and medium enterprises + Stage 3
Consumer banking
Product + Stage 1 Credit risk has not increased
significantly.
Product + Stage 2 Credit risk has increased
significantly.
Product + Stage 3 Credit impaired.
KGI Bank measures the allowance loss for financial instruments that did not have a significant
increase in credit risk since initial recognition based on the 12-month expected credit loss model l
For financial instruments that had a significant increase in credit risk or are credit impaired since
initial recognition, lifetime expected credit losses are applied.
To measure the expected credit losses, KGI Bank takes into account the borrower’s probability of
default (“PD”) for the next 12 months and the period of existence, and include the loss given default
(“LGD”). Multiply by the Exposure at default (“EAD”) and taking into account the impact of the
time value of money, the expected credit losses for 12 months and duration are calculated.
Probability of default is the probability of default of a borrower or counterparty over a period of
time; the loss given default refers to the probability of loss of the borrower or counterparty due to
inability to recover the debt at the end of the reminder procedures. The probability of default and
loss given default are used in the impairment assessment of KGI Bank credit business are based on
internal historical information (such as credit loss experience, etc.) of each group, and adjust the
history data based on the current observable data and forward-looking general economic
information (such as GDP and employment rate, etc.) which are used to calculate the probability of
default on expected losses.
The exposure at default mean that KGI Bank can claim compensation for the book value held by
borrowers (or the counterparty) after borrowers have defaulted. KGI Bank’s exposure at default has
taken into account the amount of credits that have been used and the amounts that may be used in
the future for the exposure at default amount. The amount of credits is used as an assessment of
exposure at default of on balance sheet credits or part of credits that were already used; off-balance
sheet or committed credits that are not yet used are based on the corresponding credit conversion
factor (CCF) which considered the credits that are expected to be used within 12 months after the
reporting date or expected lifetime to calculate exposure at default of expected credit loss.
The initial adoption of IFRS 9 used to assess expected credit losses was in 2018. The estimation
techniques or major assumptions used to assess the expected credit losses were all reasonably
evaluated.

- 135 -
14) Considerations of forward-looking information
KGI Bank incorporates forward-looking information when measuring expected credit losses on
loans and receivables. Based on the business characteristics, KGI Bank selected the overall
indicators that are highly relevant to lending as an adjustment parameter for default probability of
lending. Based on the type of business, KGI Bank used different overall indicator. The Corporate
banking business takes the economic growth rate (GDP) as an adjustment parameter; the consumer
banking business takes employment rate variation as adjustment parameter. KGI Bank will make
reference to external information (predicted value of internationally renowned economic forecasting
institutions) or group expert assessments to provide forecasting information on economic factors
(basic economic conditions) quarterly; it contains the best estimate of the economic situation in the
next five years, and for more than five years until the duration of the relevant financial instruments,
it assumes a forecast that is equal to the fifth year.
The measurement of expected credit loss of the Bank’s debt instruments is based an external credit
migration matrix method to calculate the Probability of default (PD), which is incorporated in the
information of forward-looking factors.
15) Changes of provisions for off-balance-sheet guarantees and commitments
The off-balance-sheet guarantees and commitments provisions for the six months ended June 30,
2019 and 2018 are adjusted as follows:
Stage 1 Stage 2 Stage 3
Impairment in
Accordance
With IFRS 9
The
Adjustments
Under
Regulations
Governing the
Procedures for
Banking
Institutions to
Evaluate Assets
and Deal with
Nonperforming/
Nonaccrual
Loans
Total 12 Months ECL
Lifetime ECL Lifetime ECL
Lifetime ECL
(Collectively
Assessed)
Lifetime ECL
(Individually
Assessed)
Non-purchased
or Originated
Credit-impaired
Financial Assets
Purchased or
Originated
Credit-impaired
Financial Assets
Balance at January 1 $ 150,970 $ 896 $ - $ 1,670 $ - $ 153,536 $ 62,440 $ 215,976
Changes due to financial
instruments that have been
identified at the beginning of
the period:
To lifetime ECL (292 ) 292 - - - - -
From conversion to
credit-impaired financial
assets (379 ) (6 ) - 385 - - -
To 12-month ECL 538 (310 ) - (228 ) - - -
Derecognizing financial assets
during the current period (46,657 ) (458 ) - - - (47,115 ) (47,115 )
Purchased or originated new
financial assets 31,091 - - - - 31,091 31,091
The adjustments under
regulations governing the
procedures for banking
institutions to evaluate assets
and deal with
nonperforming/nonaccrual
loans 92,030 92,030
Write-off - - - - - - -
Recovery of written-off - - - - - - -
Effect of exchange rate changes
and others 12,088 (369 ) - (222 ) - 11,497 11,497
Balance at June 30, 2019 $ 147,359 $ 45 $ - $ 1,605 $ - $ 149,009 $ 154,470 $ 303,479
KGI Bank and its subsidiaries had no significant increase in off-balance-sheet guarantees, and
expected credit loss during the duration of the financing commitment unused amount for the six
months ended June 30, 2019. Net increase of $32,103,788 thousand change in total book value
resulted in abovementioned provisions increased by $87,503 thousand in comparison to the prior
period.

- 136 -
Stage 1 Stage 2 Stage 3
Impairment in
Accordance
With IFRS 9
The
Adjustments
Under
Regulations
Governing the
Procedures for
Banking
Institutions to
Evaluate Assets
and Deal with
Nonperforming/
Nonaccrual
Loans
Total 12 Months ECL
Lifetime ECL Lifetime ECL
Lifetime ECL
(Collectively
Assessed)
Lifetime ECL
(Individually
Assessed)
Non-purchased
or Originated
Credit-impaired
Financial Assets
Purchased or
Originated
Credit-impaired
Financial Assets
Balance at January 1 $ 161,030 $ 633 $ - $ 1,726 $ - $ 163,389 $ 27,441 $ 190,830
Changes due to financial
instruments that have been
identified at the beginning of
the period:
To lifetime ECL (52 ) 42 - 10 - - -
From conversion to
credit-impaired financial
assets - - - - - - -
To 12-month ECL - - - - - - -
Derecognizing financial assets
during the current period (12,916 ) (15 ) - - - (12,931 ) (12,931 )
Purchased or originated new
financial assets 22,891 - - - - 22,891 22,891
The adjustments under
regulations governing the
procedures for banking
institutions to evaluate assets
and deal with
nonperforming/nonaccrual
loans 23,674 23,674
Write-off - - - - - - -
Recovery of written-off - - - - - - -
Effect of exchange rate changes
and others (20,025 ) (52 ) - 213 - (19,864 ) (19,864 )
Balance at June 30, 2018 $ 150,928 $ 608 $ - $ 1,949 $ - $ 153,485 $ 51,115 $ 204,600
KGI Bank and its subsidiaries had no significant increase in off-balance-sheet guarantees, and
expected credit loss during the duration of the financing commitment unused amount for the six
months ended June 30, 2018. Net increase of $27,190,827 thousand change in total book value
resulted in abovementioned provisions increased by $13,770 thousand in comparison to the prior
period.
16) A loss allowance for financial assets measured at amortized cost
There was no significant increase in the credit risk of debt instruments measured at amortized cost
of KGI Bank and subsidiaries; therefore, the 12-month expected credit losses were used to assess
allowance for loss. As of June 30, 2019, December 31, 2018 and June 30, 2018, loss allowance for
debt instruments measured at amortized cost were $3,442 thousand, $3,581 thousand and $3,954
thousand, respectively.

- 137 -
17) Loss allowance for receivables
The reconciliation statement of loss allowance for receivables for the six months ended June 30,
2019 and 2018 of the KGI Bank and subsidiaries were as follows:
Stage 1 Stage 2 Stage 3
Impairment in
Accordance
With IFRS 9
The
Adjustments
Under
Regulations
Governing the
Procedures for
Banking
Institutions to
Evaluate Assets
and Deal with
Nonperforming/
Nonaccrual
Loans
Total 12 Months ECL
Lifetime ECL Lifetime ECL
Lifetime ECL
(Collectively
Assessed)
Lifetime E ECL
(Individually
Assessed)
Non-purchased
or Originated
Credit-impaired
Financial Assets
Purchased or
Originated
Credit-impaired
Financial Assets
Balance at January 1 $ 69,740 $ 28,458 $ 5 $ 1,183,155 $ - $ 1,281,358 $ 237,888 $ 1,519,246
Changes due to financial
instruments that have been
identified at the beginning of
the period:
To lifetime ECL (127 ) 3,073 - (2,946 ) - - -
From conversion to
credit-impaired financial
assets (71 ) (968 ) - 1,039 - - -
To 12-month ECL 278 (188 ) - (90 ) - - -
Derecognizing financial assets
during the current period (15,369 ) (2,700 ) (5 ) (6,937 ) - (25,011 ) (25,011 )
Purchased or originated new
financial assets 16,711 - - 1,826 - 18,537 18,537
The adjustments under
regulations governing the
procedures for banking
institutions to evaluate assets
and deal with
nonperforming/nonaccrual
loans (51,185 ) (51,185 )
Write-off - - - (1,513 ) - (1,513 ) (1,513 )
Recovery of written-off - - 80 9,206 - 9,286 9,286
Effect of exchange rate changes
and others (10,986 ) 4,055 (80 ) 4,591 - (2,420 ) (2,420 )
Balance at June 30, 2019 $ 60,176 $ 31,730 $ - $ 1,188,331 $ - $ 1,280,237 $ 186,703 $ 1,466,940
Stage 1 Stage 2 Stage 3
Impairment in
Accordance
With IFRS 9
The
Adjustments
Under
Regulations
Governing the
Procedures for
Banking
Institutions to
Evaluate Assets
and Deal with
Nonperforming/
Nonaccrual
Loans
Total 12 Months ECL
Lifetime ECL Lifetime ECL
Lifetime ECL
(Collectively
Assessed)
Lifetime E ECL
(Individually
Assessed)
Non-purchased
or Originated
Credit-impaired
Financial Assets
Purchased or
Originated
Credit-impaired
Financial Assets
Balance at January 1 $ 108,302 $ 32,442 $ - $ 1,232,581 $ - $ 1,373,325 $ 135,280 $ 1,508,605
Changes due to financial
instruments that have been
identified at the beginning of
the period:
To lifetime ECL (947 ) 2,925 - (1,978 ) - - -
From conversion to
credit-impaired financial
assets (793 ) (5,067 ) - 5,860 - - -
To 12-month ECL 1,546 (140 ) - (1,406 ) - - -
Derecognizing financial assets
during the current period (38,826 ) (5,435 ) - (6,907 ) - (51,168 ) (51,168 )
Purchased or originated new
financial assets 41,281 7 - - - 41,288 41,288
The adjustments under
regulations governing the
procedures for banking
institutions to evaluate assets
and deal with
nonperforming/nonaccrual
loans 81,545 81,545
Write-off - (6,351 ) - (29,923 ) - (36,274 ) (36,274 )
Recovery of written-off - - - 79,840 - 79,840 79,840
Effect of exchange rate changes
and others (25,903 ) 646 - (46,075 ) - (71,332 ) (71,332 )
Balance at June 30, 2018 $ 84,660 $ 19,027 $ - $ 1,231,992 $ - $ 1,335,679 $ 216,825 $ 1,552,504

- 138 -
Changes in total book values of receivables for the six months ended June 30, 2019 of KGI Bank
and subsidiaries:
Stage 1 Stage 2 Stage 3
Total 12 Months ECL
Lifetime ECL Lifetime ECL
Lifetime ECL
(Collectively
Assessed)
Lifetime E ECL
(Individually
Assessed)
Non-purchased
or Originated
Credit-impaired
Financial Assets
Purchased or
Originated
Credit-impaired
Financial Assets
Balance at January 1 $ 27,184,310 $ 251,010 $ 17 $ 1,891,476 $ - $ 29,326,813
Conversion from
individual financial instruments to lifetime
ECL - - 2 (2 ) - -
Conversion from individual financial
instruments to
credit-impaired financial assets - - (2 ) 2 - -
Roll-out individual
financial instruments
from credit-impaired
financial assets - - - - - -
Receivables based on collective assessment (39,342 ) 19,577 - 19,765 - -
Purchased or originated
new receivables 4,709,627 - - 2,888 - 4,712,515 Write-off - - - (2,364 ) - (2,364 )
Derecognition (6,294,016 ) (29,940 ) (15 ) (62,627 ) - (6,386,598 )
Effect of exchange rate changes and others 67,270 18 (2 ) 12,078 - 79,364
Balance at June 30, 2019 $ 25,627,849 $ 240,665 $ - $ 1,861,216 $ - $ 27,729,730
Stage 1 Stage 2 Stage 3
Total 12 Months ECL
Lifetime ECL Lifetime ECL
Lifetime ECL
(Collectively
Assessed)
Lifetime E ECL
(Individually
Assessed)
Non-purchased
or Originated
Credit-impaired
Financial Assets
Purchased or
Originated
Credit-impaired
Financial Assets
Balance at January 1 $ 21,697,882 $ 251,185 $ - $ 1,938,926 $ - $ 23,887,993
Conversion from
individual financial instruments to lifetime
ECL - - - - - -
Conversion from individual financial
instruments to
credit-impaired financial assets - - - - - -
Roll-out individual
financial instruments from credit-impaired
financial assets - - - - - -
Receivables based on collective assessment (58,986 ) 10,433 - 48,553 - -
Purchased or originated
new receivables 11,245,046 4,433 - 22,217 - 11,271,696 Write-off - (6,351 ) - (29,923 ) - (36,274 )
Derecognition (4,029,363 ) (40,357 ) - (100,586 ) - (4,170,306 )
Effect of exchange rate
changes and others (475 ) 71 - 29,977 - 29,573
Balance at June 30, 2018 $ 28,854,104 $ 219,414 $ - $ 1,909,164 $ - $ 30,982,682

- 139 -
18) Loss allowance for discounts and loans
The reconciliation statement of allowance for bad debts of discounts and loans for the six months
ended June 30, 2019 and 2018 of the KGI Bank and subsidiaries were as follows:
Stage 1 Stage 2 Stage 3
Impairment in
Accordance
With IFRS 9
The
Adjustments
Under
Regulations
Governing the
Procedures for
Banking
Institutions to
Evaluate Assets
and Deal with
Nonperforming/
Nonaccrual
Loans
Total 12 Months ECL
Lifetime ECL Lifetime ECL
Lifetime ECL
(Collectively
Assessed)
Lifetime E ECL
(Individually
Assessed)
Non-purchased
or Originated
Credit-impaired
Financial Assets
Purchased or
Originated
Credit-impaired
Financial Assets
Balance at January 1 $ 1,415,427 $ 95,618 $ 7,085 $ 495,451 $ - $ 2,013,581 $ 2,320,761 $ 4,334,342
Changes due to financial
instruments that have been
identified at the beginning of
the period:
To lifetime ECL (1,240 ) 10,838 4,050 (13,648 ) - - -
From conversion to
credit-impaired financial
assets (2,227 ) (19,150 ) (2,106 ) 23,483 - - -
To 12-month ECL 4,762 (3,441 ) - (1,321 ) - - -
Derecognizing financial assets
during the current period (206,091 ) (8,166 ) (136 ) (81,262 ) - (295,655 ) (295,655 )
Purchased or originated new
financial assets 517,071 - - - - 517,071 517,071
The adjustments under
regulations governing the
procedures for banking
institutions to evaluate assets
and deal with
nonperforming/nonaccrual
loans 108,969 108,969
Write-off - - - (239,287 ) - (239,287 ) (239,287 )
Recovery of written-off - - - 363,981 - 363,981 363,981
Effect of exchange rate changes
and others (191,211 ) 76,936 235 (108,403 ) - (222,443 ) (222,443 )
Balance at June 30, 2019 $ 1,536,491 $ 152,635 $ 9,128 $ 438,994 $ - $ 2,137,248 $ 2,429,730 $ 4,566,978
Stage 1 Stage 2 Stage 3
Impairment in
Accordance
With IFRS 9
The
Adjustments
Under
Regulations
Governing the
Procedures for
Banking
Institutions to
Evaluate Assets
and Deal with
Nonperforming/
Nonaccrual
Loans
Total 12 Months ECL
Lifetime ECL Lifetime ECL
Lifetime ECL
(Collectively
Assessed)
Lifetime E ECL
(Individually
Assessed)
Non-purchased
or Originated
Credit-impaired
Financial Assets
Purchased or
Originated
Credit-impaired
Financial Assets
Balance at January 1 $ 1,316,129 $ 129,626 $ - $ 530,904 $ - $ 1,976,659 $ 1,952,257 $ 3,928,916
Changes due to financial
instruments that have been
identified at the beginning of
the period:
To lifetime ECL (2,226 ) 9,432 - (7,206 ) - - -
From conversion to
credit-impaired financial
assets (2,246 ) (23,418 ) - 25,664 - - -
To 12-month ECL 2,049 (1,645 ) - (404 ) - - -
Derecognizing financial assets
during the current period (271,561 ) (2,474 ) - (6,702 ) - (280,737 ) (280,737 )
Purchased or originated new
financial assets 453,559 380 - 6,851 - 460,790 460,790
The adjustments under
regulations governing the
procedures for banking
institutions to evaluate assets
and deal with
nonperforming/nonaccrual
loans 311,027 311,027
Write-off - - - (204,371 ) - (204,371 ) (204,371 )
Recovery of written-off - - - 375,494 - 375,494 375,494
Effect of exchange rate changes
and others (161,229 ) (7,715 ) - (178,583 ) - (347,527 ) (347,527 )
Balance at June 30, 2018 $ 1,334,475 $ 104,186 $ - $ 541,647 $ - $ 1,980,308 $ 2,263,284 $ 4,243,592

- 140 -
Changes in total book values of discounts and loans for the six months ended June 30, 2019 and
2018 of the KGI Bank and subsidiaries were as follows:
Stage 1 Stage 2 Stage 3
Total 12 Months ECL
Lifetime ECL Lifetime ECL
Lifetime ECL
(Collectively
Assessed)
Lifetime E ECL
(Individually
Assessed)
Non-purchased
or Originated
Credit-impaired
Financial Assets
Purchased or
Originated
Credit-impaired
Financial Assets
Balance at January 1 $ 335,634,535 $ 1,729,750 $ 23,616 $ 2,826,173 $ - $ 340,214,074
Conversion from
individual financial instruments to lifetime
ECL - - 13,502 (13,502 ) - -
Conversion from individual financial
instruments to
credit-impaired financial assets - - (7,020 ) 7,020 - -
Roll-out individual
financial instruments
from credit-impaired
financial assets - - - - - -
Discounts and loans based on collective
assessment (426,092 ) (87,208 ) - 513,300 - -
Purchased or originated new discounts and
loans 199,733,617 - - - - 199,733,617
Write-off - - - (239,287 ) - (239,287 ) Derecognition (180,162,123 ) (160,755 ) (454 ) (260,066 ) - (180,583,398 )
Effect of exchange rate
changes and others 829,449 1,102 786 681 - 832,018
Balance at June 30, 2019 $ 355,609,386 $ 1,482,889 $ 30,430 $ 2,834,319 $ - $ 359,957,024
Stage 1 Stage 2 Stage 3
Total 12 Months ECL
Lifetime ECL Lifetime ECL
Lifetime ECL
(Collectively
Assessed)
Lifetime E ECL
(Individually
Assessed)
Non-purchased
or Originated
Credit-impaired
Financial Assets
Purchased or
Originated
Credit-impaired
Financial Assets
Balance at January 1 $ 292,239,778 $ 1,977,828 $ - $ 3,457,226 $ - $ 297,674,832 Conversion from
individual financial
instruments to lifetime ECL - - - - - -
Conversion from
individual financial instruments to
credit-impaired
financial assets - - - - - - Roll-out individual
financial instruments
from credit-impaired financial assets - - - - - -
Discounts and loans based
on collective assessment (466,342 ) 197,957 - 268,385 - -
Purchased or originated
new discounts and
loans 180,347,838 19,134 - 385,253 - 180,752,225
Write-off - - - (204,371 ) - (204,371 )
Derecognition (138,275,226 ) (126,164 ) - (304,304 ) - (138,705,694 ) Effect of exchange rate
changes and others (3,762,680 ) (172,103 ) - (474,738 ) - (4,409,521 )
Balance at June 30, 2018 $ 330,083,368 $ 1,896,652 $ - $ 3,127,451 $ - $ 335,107,471

- 141 -
KGI Securities and subsidiaries
Credit risk analysis
1) Source of credit risk
The credit risks that KGI Securities and subsidiaries are exposed to during financial transactions
include issuer’s credit risk, and counterparty credit risk and underlying assets credit risk.
a) Issuer’s credit risk refers to the risk of financial loss that KGI Securities and subsidiaries face
while possessing financial debt instruments when an issuer (or guarantor) or a bank defaults,
files for bankruptcy or liquidates assets and in turn cannot honor the stipulations and fulfill the
obligation of paying back (or fulfilling a guarantee).
b) Counterparty credit risk refers to the risk of financial loss that KGI Securities and subsidiaries
face when a counterparty in derivative financial instrument transactions or other counterparties
do not complete a transaction or fulfill a payment obligation on the appointed date.
2) Credit risk management
The investment, acquisition of fixed-income securities, other financial assets, and credit risk
management of current counterparties are handled in accordance with KGI Securities and
subsidiaries’ internal control procedures and related regulations, and most of them have reached an
external credit rating investment grade or above, so credit risk is very low.
3) Default and credit derogation definition of financial assets
a) The definition of the credit assets default of the KGI Securities and subsidiaries are the same as
that of the impaired credit assets. If there is evidence that the issuer or counterparty will be
unable to pay, or has significant financial difficulties, such as:
i. The issuer or counterparty has been bankrupt or may file a petition for bankruptcy or
financial restructuring.
ii. The contract of the other financial instrument of the issuer or counterparty has been
breached.
iii. The active market for the financial asset disappeared due to the financial difficulties of the
issuer or counterparty.
iv. Purchase or initiate financial assets at a substantial discount that reflects credit losses that
have occurred.
b) The aforementioned definition of default and credit impairment applies to the credit assets held
by KGI Securities is consistent with the definition of credit assets used for internal credit risk
management purposes, and is used in the relevant impairment assessment model.
c) If a credit asset is assessed to no longer meets the definition of default and credit impairment, it
should return to the state of compliance, and is no longer considered a credit asset for default
and credit impairment.
d) KGI securities and subsidiaries’ financial assets are written-off if they are unable to reasonably
expect that financial assets will be recovered (e.g., significant financial difficulties for the issuer
or the debtor, or bankrupt).

- 142 -
4) Credit risk statement for financial assets
a) Cash and cash equivalents, other financial assets
KGI Securities deposits in creditworthy financial institutions and deposits a certain amount of
securities in a specific accounts of the financial institution (Custodian Bank) designated by the
futures companies. KGI Securities regularly evaluates the financial, operating and credit risk
status of financial institutions and futures companies. The credit risk is under KGI Securities’
control.
b) Financial assets measured at fair value through profit or loss - current
KGI Securities holds the unsecured corporate bonds, convertible (exchangeable) corporate
bonds and part of the CB Asset Swap. Issuers of unsecured corporate bonds are listed/OTC
companies or financial institutions. Issuers of convertible (exchangeable) corporate bonds are
listed/OTC companies in Taiwan and partial of them are secured by bank. In most other
holdings, KGI Securities conducts CB asset swap and issues credit linked note to transfer risk
and lower the credit risk exposure of it. Therefore, the credit risk of the issuer has been effective
control.
c) Financial assets measured at fair value through other comprehensive income (excluding equity
instrument investments)
KGI Securities holds mainly the medium and long-term bond investment position. KGI
Securities pays attention to the credit rating of each investment and the financial status of the
issuer (or guarantee institution) in order to minimize credit risk.
d) Bonds purchased under resell agreements
The counterparties with bonds purchased under resell agreements are mainly creditworthy
financial institutions and companies. Because KGI Securities holds bonds purchased under
resell agreements as collateral, it can effectively reduce underlying exposure the counterparty's
credit risk.
e) Receivables
Receivables mainly include receivable on margin loans, trading securities receivable, accounts
receivable - futures guarantee deposits, accounts receivable, etc. The main credit risk is
receivable on margin loans and trading securities receivable of credit trading customers. KGI
Securities and subsidiaries closely monitor market fluctuations and counterparties credit history,
and enforce related control measures to minimize the credit risk.
f) Customers’ margin accounts
The exclusive account for depositing customers’ margin accounts is mainly opened in
creditworthy banks, financial institutions and companies with investment grades, so there is no
significant credit risk.
g) Stock borrowing collateral price and guarantee deposits - borrowed securities
When KGI Securities and subsidiaries borrow securities from outside, they must deposit the
guaranty fund into the financial institution designated by the other parties. Because KGI
Securities and subsidiaries holds the foregoing borrowed securities simultaneously, it can
effectively reduce the risk of the counterparty's credit risk.

- 143 -
h) Financial assets measured at amortized cost
Subsidiaries of KGI Securities held the principal of unsecured subordinated bonds and
discounted value of coupon interests issued by Sunny Bank, Hwatai Bank and Panhsin Bank.
Subsidiaries of KGI Securities Control the credit risk by evaluating the credit risk status of each
financial institution.
i) Others noncurrent assets
Others noncurrent assets are mainly operating guarantee deposits, clearing and settlement funds
and guarantee deposits-out. KGI Securities carefully evaluates the counterparty in accordance
with the amount of deposit. The counterparties are a large number and the amount of each
deposit is not high. The credit risk has been effectively dispersed, so the credit risk is very low.
5) Assessment of expected credit losses
a) Consideration of forward-looking information
KGI Securities and subsidiaries take forward-looking information into consideration when
assessing whether there has been a significant increase in financial assets’ credit risk after initial
recognition and when measuring of expected credit losses.
Probability of default of debt instrument investment (except for at fair value through profit or
loss) used by KGI Securities and subsidiaries is based on the probability of default contained
forward-looking general economic information and regularly announced by international credit
rating agencies.
Except for debt instrument investments, financial assets of KGI Securities and subsidiaries are
analyzed using historical data to determine the economic factors that affect the expected credit
losses of each asset portfolios, and supplemented by the best expectation announced by the
government-affiliated institutions and academic research units. The best estimate of expected
credit losses are reevaluate and revised on each financial reporting date.
b) Receivables and other financial assets
KGI Securities and domestic subsidiaries
KGI Securities and its domestic subsidiaries use simplified approach of IFRS 9 to measure the
allowance losses by lifetime expected credit losses. The lifetime expected credit losses are based
on historical records, current information, and forward-looking information calculated by a
regression model. For the fact that KGI Securities and domestic subsidiaries’ historical records
of credit losses indicate that there is no significant difference in the loss patterns of different
customer groups, it is not measured in groups.
Overseas subsidiaries
The financial assets of overseas subsidiaries whose credit risk do not increase significantly after
initial recognition are measured as 12-month expected credit losses. For financial assets whose
credit risk has increased significantly after initial recognition, they are measured as lifetime
expected credit losses. Customers’ past default records, counterparty credit ratings, current
information and relevant forward-looking information are take into consideration when
assessing expected credit losses. For the fact that there is no significant difference in the loss
patterns of different customer groups of overseas subsidiaries, it is not measured in groups.

- 144 -
c) Debt instrument investment (except at fair value through profit or loss)
The original purchase is based on the premise that the credit risk is low, it is assessed whether
the credit risk is significantly increased after the initial recognition on each balance sheet date to
determine the method of measuring the allowance loss and its loss rate.
In order to measure expected credit losses, KGI Securities and subsidiaries consider the
probability of default (PD) of financial assets or the issuer or counterparty for the next 12
months, which collectively consider the loss given default (LGD), and is multiplied by exposure
at default (EAD). KGI Securities and subsidiaries assess financial assets measured at amortized
cost with exposure at default and consider the impact of time value of money to calculate the
expected credit losses for 12 months and lifetime, respectively.
Probability of default is the probability that the issuer or the counterparty will default, and loss
given default is the rate of loss caused by default by the issuer or counterparty. The probability
of default and loss given default used by KGI Securities and subsidiaries in related assessment
of impairment are mainly relied on the probability of default and loss given default that are
regularly announced by international credit rating agencies.
The aforementioned impairment assessment method and related indicators of debt instrument
investment are described as follows:
Degree of Credit Risk
Indicators
Measurement of Expected
Credit Loss
Low credit risk Ratings above BBB-/counterparty
with good credit
12 months expected credit
loss
Credit risk significantly
increase
Ratings between BB+-C (Note) Lifetime expected credit loss
Impaired/default Ratings below D and impaired Lifetime expected credit loss
Note: KGI Securities and subsidiaries consider information which indicates significant and
evidential increase in credit risk (including forward-looking information) since the
initial recognition. The main considerations including:
i. External credit ratings, overdue status information, credit spreads, other market information
related to borrowers, issuers or counterparties, and the same borrowers’ credit risk of other
financial instruments increases significantly.
ii. Low credit risk: If it is determined that the credit risk of a financial instrument at the
reporting date is low, it can be assumed that the credit risk of the financial instrument has
not increased significantly since the date of initial recognition.
6) The estimation techniques or material assumptions used by KGI Securities and subsidiaries to
assess expected credit losses did not change significantly for the six months ended June 30, 2019.

- 145 -
Disclosure of total book value and allowance loss for financial assets’ expected credit loss
1) Summary of KGI Securities and subsidiaries’ total book value and allowance loss as of June 30,
2019, December 31, 2018 and June 30, 2018 are listed as follows:
Financial assets at fair value through other comprehensive income
Total book value and allowance loss for financial assets at debt instruments at fair value through
other comprehensive income were $24,757,412 thousand, $16,110,773 thousand and $8,145,690
thousand, respectively, and allowance loss for financial assets at fair value through other
comprehensive income were $9,631 thousand, $5,447 thousand and $1,750 thousand, respectively.
Accounts receivable and others
June 30, 2019
Total Book
Value
Less: Allowance
Loss Total
Cash and cash equivalents $ 10,442,675 $ (561) $ 10,442,114
Bonds purchased under resell agreement 22,848,839 - 22,848,839
Receivables on margin loans 20,743,822 (1,690) 20,742,132
Trading securities receivables 7,542,882 (1,013) 7,541,869
Customer’s margin accounts 28,141,023 (575) 28,140,448
Accounts receivable futures guarantee
deposits 170,212 (160,435) 9,777
Accounts receivable 36,973,346 (1,822) 36,971,524
Other current assets 47,069,640 (9,713) 47,059,927
Financial assets measured at amortized
cost - non-current 799,815 (3,404) 796,411
Other non-current assets 4,937,876 (1,794,309) 3,143,567
$ 179,670,130 $ (1,973,522) $ 177,696,608
December 31, 2018
Total Book
Value
Less: Allowance
Loss Total
Cash and cash equivalents $ 13,849,068 $ (532) $ 13,848,536
Bonds purchased under resell agreement 19,448,839 (17) 19,448,822
Receivables on margin loans 21,181,502 (1,871) 21,179,631
Trading securities receivables 8,031,155 (1,223) 8,029,932
Customer’s margin accounts 21,810,523 (48) 21,810,475
Accounts receivable futures guarantee
deposits 188,951 (176,333) 12,618
Accounts receivable 22,259,487 (1,113) 22,258,374
Other current assets 47,592,747 (12,958) 47,579,789
Financial assets measured at amortized
cost - non-current 500,000 (3,293) 496,707
Other non-current assets 5,069,492 (1,797,288) 3,272,204
$ 159,931,764 $ (1,994,676) $ 157,937,088

- 146 -
June 30, 2018
Total Book
Value
Less: Allowance
Loss Total
Cash and cash equivalents $ 12,081,481 $ (140) $ 12,081,341
Bonds purchased under resell agreement 31,650,373 (5) 31,650,368
Receivables on margin loans 36,630,361 (2,540) 36,627,821
Trading securities receivables 7,249,810 (1,245) 7,248,565
Customer’s margin accounts 22,557,369 (709) 22,556,660
Accounts receivable futures guarantee
deposits 196,942 (181,354) 15,588
Accounts receivable 28,167,092 (1,332) 28,165,760
Other current assets 47,996,511 (9,773) 47,986,738
Financial assets measured at amortized
cost - non-current 500,000 (3,293) 496,707
Other non-current assets 5,127,054 (1,783,557) 3,343,497
$ 192,156,993 $ (1,983,948) $ 190,173,045
2) Changes in allowance losses of KGI Securities and subsidiaries for the six months ended June 30,
2019 and 2018 are as follows:
a) Financial assets at fair value through other comprehensive income
12 Months
Expected
Credit Loss
January 1, 2019 $ 5,447
Increase 4,140
Change in exchange rate 44
June 30, 2019 $ 9,631
January 1, 2018 (IAS 39) $ -
Adjustment to IFRS 9 293
January 1, 2018 (IFRS 9) 293
Increase 1,448
Change in exchange rate 9
June 30, 2018 $ 1,750
Investments in debt instruments at FVTOCI increased, and the allowance loss increased
accordingly for the six months ended June 30, 2019 and 2018.

- 147 -
b) Receivables and other financial assets
12 Months
Expected
Credit Loss
Lifetime
Expected
Credit Loss
(Collective)
Credit
Impaired
Financial
Assets
(Lifetime
Expected
Credit Loss)
Lifetime
Expected
Credit Loss
(Simplify) Total
January 1, 2019 $ 15,875 $ 217 $ 1,975,004 $ 3,580 $ 1,994,676
Addition (reversal) (2,745) (88) (5,596) 436 (7,993)
Derecognizing financial assets
during the current period - - (18,859) - (18,859)
Written-off - - (6,808) - (6,808)
Change in exchange rate 132 3 12,371 - 12,506
June 30, 2019 $ 13,262 $ 132 $ 1,956,112 $ 4,016 $ 1,973,522
January 1, 2018 (IAS 39) $ - $ - $ 1,842,138 $ 806 $ 1,842,944
Adjustment to IFRS 9 13,036 2 13 3,003 16,054
January 1, 2018 (IFRS 9) 13,036 2 1,842,151 3,809 1,858,998
Addition 1,234 215 97,239 76 98,764
Derecognizing financial assets
during the current period - - (2,326) - (2,326)
Written-off - - (7,602) - (7,602)
Change in exchange rate 236 7 35,871 - 36,114
June 30, 2018 $ 14,506 $ 224 $ 1,965,333 $ 3,885 $ 1,983,948
c) The aforementioned change in allowance loss does not result from a significant change in the
total book value. In February 2018 the futures trader of the subsidiary company defaulted due to
deficiency of futures guarantee deposits. For the six months ended June 30, 2018, KGI
Securities and subsidiaries recognized an impairment loss of $97,372 thousand for the
outstanding accounts receivable - futures guarantee deposits.
CDIB Capital Group and subsidiaries
CDIB Capital Group is exposed to credit risk due to default on contracts by borrowers, debtors or
counter-parties and changes in credit quality. The maximum exposure to credit risk is equal to the book
value.
The maximum exposure to credit risk held by CDIB Capital Group and subsidiaries of the financial
instruments is equal to the book value.
China Life Insurance
Credit risk analysis
1) Credit risk refers to the counterparties fail to fulfill obligations, resulting in the risk of loss of
value. Credit risks of China Life Insurance result from operating and financing activities, which
mainly include lending, investing in financial instruments and receivables.
The departments of China Life Insurance follow credit risk policies, procedures and controls to
manage credit risks. The credit risk assessment of all issuers or counterparties is based on
comprehensive consideration of their financial status, credit ratings, historical transaction
records, current economic environment, China Life Insurance’s internal rating indicators, and
etc. Also, China Life Insurance uses certain credit enhancement tools in due course to reduce
the credit risk of a particular issuer or counterparty.

- 148 -
For investments of financial instruments, its original purchase is based on the premise that the
credit risk is low, and on each balance sheet date, it is assessed whether the conditions of low
credit risk are still met to determine the method of measuring the allowance. Also, China Life
Insurance dispose those investments to reduce credit losses in appropriate time, such as there is
a significant increase in credit risk. In addition, China Life Insurance has established credit VaR
model to assess the maximum loss of the credit positions due to changes of credit rating or
default. Besides, China Life Insurance also evaluates credit risk and concentration risk based on
issuer’s region, industry and credit rating within portfolios.
Lending of China Life Insurance is determined by the factors that affect the risk based on the 5P
principle which gives different weights according to the impact of the risk so as to calculate the
credit score of each borrower. The credit score comprehensively measures the rationality of the
purpose of the loan, the collateral area, value and number, the customer’s credit report,
historical interest payment record, financial status, debt repayment ability, and etc. According to
the scores, the decision will be stratified in order to control the loan risk. Once a delay occurs, it
is promptly collected in accordance with the procedures to avoid financial losses.
China Life Insurance assesses expected credit losses in accordance with IFRS 9, except for
some of receivables, which allowance are measured by lifetime expected credit losses. The
original purchase of the rest, which do not belong to debt instruments measured at fair value
through profit or loss, is based on the premise of low credit risk and uses credit risk as the basis
of the differentiation group. On each balance sheet date, assessing whether the credit risk is
significantly increased after the initial recognition to determine the method of measuring the
allowance loss and its loss rate. The main considerations for determining whether the credit risk
has increased significantly include objective evidence such as the external credit rating and its
degree of change, overdue status, occurrence of major financial difficulties or liquidation and
reorganization. Expected credit losses will be measured by the probability of default (PD) of the
issuer or the counterparty over the next 12 months and the lifetime, multiplied by the loss given
default (LGD) and the exposure at default (EAD), and is considered by the impact of the time
value of money. The expected credit losses for 12 months and duration is calculated,
respectively.
Probability of default is the probability that the issuer or the counterparty will default, and the
loss given default is the rate of loss caused by default by the issuer or counterparty. China Life
Insurance employs information on the default probability and default loss rate published by
external credit rating agencies and adjusts it based on forward-looking general economic
information.
China Life employs amortized cost of financial assets plus accrued interest and receivables as a
measure of exposure at default, while loans are calculated as the sum of the principal balance of
the debtor at the time of calculation, interest, and payable as a measure of exposure at default.
Some of the allowance losses of part of receivables are measured by its expected credit losses
for its lifetime. The expected credit losses during the existence period is considered by the past
default records and current information, and the expected credit loss rate is set based on the
overdue days of receivables.

- 149 -
2) Financial assets credit risk concentration analysis
a) The largest credit risk exposure of the financial debt instrument investments held by China
Life Insurance or deposit in the bank is listed in accordance with the regional distribution as
follows:
June 30, 2019
Financial Assets Taiwan Asia Europe America Global Total
Cash and cash
equivalents $ 19,932,398 $ 5,446,623 $ 9,677,466 $ - $ - $ 35,056,487
Financial assets at
fair value through
profit or loss 23,961,697 12,368,033 16,952,666 7,224,619 - 60,507,015
Financial assets at
fair value through
other
comprehensive
income 74,577,763 90,618,640 82,514,887 73,293,502 - 321,004,792
Financial assets at
amortized cost 140,298,806 230,323,985 238,561,018 383,377,557 18,509,080 1,011,070,446
Refundable deposits
- bonds 5,966,846 - - - - 5,966,846
$ 264,737,510 $ 338,757,281 $ 347,706,037 $ 463,895,678 $ 18,509,080 $ 1,433,605,586
Proportion 18.47% 23.63% 24.25% 32.36% 1.29% 100.00%
December 31, 2018
Financial Assets Taiwan Asia Europe America Global Total
Cash and cash
equivalents $ 38,287,834 $ 1,919,154 $ 2,738,184 $ - $ - $ 42,945,172
Financial assets at
fair value through
profit or loss 22,768,189 8,226,879 31,346,707 3,726,226 - 66,068,001
Financial assets at
fair value through
other
comprehensive
income 95,588,537 76,002,454 57,546,223 62,264,262 - 291,401,476
Financial assets at
amortized cost 134,174,771 218,562,631 212,259,896 367,500,420 17,984,522 950,482,240
Refundable deposits
- bonds 5,965,762 - - - - 5,965,762
$ 296,785,093 $ 304,711,118 $ 303,891,010 $ 433,490,908 $ 17,984,522 $ 1,356,862,651
Proportion 21.87% 22.46% 22.40% 31.95% 1.32% 100.00%
June 30, 2018
Financial Assets Taiwan Asia Europe America Global Total
Cash and cash
equivalents $ 41,462,189 $ 6,457,669 $ 930,496 $ - $ - $ 48,850,354
Financial assets at
fair value through
profit or loss 20,564,562 7,588,466 21,375,361 1,115,300 - 50,643,689
Financial assets at
fair value through
other
comprehensive
income 85,182,745 70,219,241 51,494,025 60,824,680 - 267,720,691
Financial assets at
amortized cost 120,263,677 210,817,217 192,996,056 343,551,333 17,536,401 885,164,684
Refundable deposits
- bonds 5,632,054 - - - - 5,632,054
$ 273,105,227 $ 295,082,593 $ 266,795,938 $ 405,491,313 $ 17,536,401 $ 1,258,011,472
Proportion 21.71% 23.46% 21.21% 32.23% 1.39% 100.00%

- 150 -
b) China Life Insurance’s regional distribution of credit risk exposure for secured loans and
overdue receivables (excluding policy loans and automatic premium loans) is as follows:
June 30, 2019
Location
Northern
Areas: Taipei
and Eastern
Counties
Central Area:
Taichung to
Changhua and
Nantou
Southern
Area:
Counties
Below Tainan Total
Secured loans $ 472,442 $ 248,805 $ 253,013 $ 974,260
Overdue receivables - 1,866 451 2,317
$ 472,442 $ 250,671 $ 253,464 $ 976,577
Proportion 48.38% 25.67% 25.95% 100.00%
December 31, 2018
Location
Northern
Areas: Taipei
and Eastern
Counties
Central Area:
Taichung to
Changhua and
Nantou
Southern
Area:
Counties
Below Tainan Total
Secured loans $ 553,282 $ 289,001 $ 308,836 $ 1,151,119
Overdue receivables - 2,032 450 2,482
$ 553,282 $ 291,033 $ 309,286 $ 1,153,601
Proportion 47.96% 25.23% 26.81% 100.00%
June 30, 2018
Location
Northern
Areas: Taipei
and Eastern
Counties
Central Area:
Taichung to
Changhua and
Nantou
Southern
Area:
Counties
Below Tainan Total
Secured loans $ 666,536 $ 349,973 $ 334,360 $ 1,350,869
Overdue receivables - - 491 491
$ 666,536 $ 349,973 $ 334,851 $ 1,351,360
Proportion 49.32% 25.90% 24.78% 100.00%
3) Grading of financial instrument credit risk quality
China Life Insurance’s internal credit risk is classified into investment grade and
non-investment grade mainly based on rating of the credit rating agencies:
a) Investment grade means credit rating reaches at least BBB- granted by a credit rating
agency.
b) Non-investment grade means no credit rating or credit rating lower than BBB-granted by a
credit rating agency.

- 151 -
Grading of credit risk quality is as follows:
June 30, 2019
Financial Assets
Investment
Grade
Non-investment
Grade
Cash and cash equivalents $ 35,056,487 $ -
Financial assets at fair value through profit or loss 60,507,015 -
Financial assets at fair value through other
comprehensive income 315,328,900 5,675,892
Financial assets at amortized cost 1,011,070,446 -
Refundable deposits 5,966,846 -
$ 1,427,929,694 $ 5,675,892
Proportion 99.60% 0.40%
December 31, 2018
Financial Assets
Investment
Grade
Non-investment
Grade
Cash and cash equivalents $ 42,945,172 $ -
Financial assets at fair value through profit or loss 66,068,001 -
Financial assets at fair value through other
comprehensive income 291,401,476 -
Financial assets at amortized cost 950,482,240 -
Refundable deposits 5,965,762 -
$ 1,356,862,651 $ -
Proportion 100.00% -
June 30, 2018
Financial Assets
Investment
Grade
Non-investment
Grade
Cash and cash equivalents $ 48,850,354 $ -
Financial assets at fair value through profit or loss 50,643,689 -
Financial assets at fair value through other
comprehensive income 267,720,691 -
Financial assets at amortized cost 885,164,684 -
Refundable deposits 5,632,054 -
$ 1,258,011,472 $ -
Proportion 100.00% -

- 152 -
4) Disclosure of total book value and allowance loss for financial assets’ expected credit loss
China Life Insurance assesses its debt investments at fair value through other comprehensive
income, debt investments measured at amortized cost and other receivables on June 30, 2019
and 2018. The assessment indicates those investments belongs to lower credit risk which is the
same as the assessment on January 1, 2019 and 2018. Therefore, the 12-month expected credit
loss (loss rate 0.00%-0.18% and 0.00%-0.16%, respectively) is used to measure the amount of
allowance loss.
The total book value of China Life Insurance debt investments measured at fair value through
other comprehensive income and amortized cost and related other receivables on June 30, 2019,
December 31, 2018 and June 30, 2018 are as follows:
Measured Fair
Value Through
Other
Comprehensive
Income
Measured at
Amortized Cost
Other
Receivables
Total book value on June 30, 2019
(Note) $ 298,509,729 $ 1,017,125,859 $ 10,219,667
Total book value on December 31,
2018 (Note) $ 294,783,102 $ 956,524,783 $ 11,073,170
Total book value on June 30, 2018
(Note) $ 268,640,430 $ 890,858,422 $ 8,573,274
Note: Including securities serving as collateral deposits.
Changes in allowance losses of financial asset at fair value through other comprehensive income,
and debt investment measured at cost and other related receivables for the six months ended
June 30, 2019 and 2018 are as follows:
Measured Fair
Value Through
Other
Comprehensive
Income
Measured at
Amortized Cost
Other
Receivables
January 1, 2019 $ 27,070 $ 86,642 $ 1,044
Disposal (5,714) (3,003) (285)
Addition 12,178 9,753 431
Change in model/risk factors 1,307 4,191 34
Change in exchange rate and others 215 849 8
June 30, 2019 $ 35,056 $ 98,432 $ 1,232
January 1, 2018 $ 18,150 $ 69,784 $ 757
Disposal (2,784) (1,110) (182)
Addition 7,942 8,237 206
Change in model/risk factors (2,487) (4,310) (72)
Change in exchange rate and others 212 1,106 9
June 30, 2018 $ 21,033 $ 73,707 $ 718

- 153 -
For the six months ended June 30, 2019 and 2018, the increase in debt investments measured at
amortized cost and at fair value through other comprehensive income correspond with the
increase in the allowance loss measured on the basis of 12 months.
The total book value of China Life Insurance guarantee loan and related other receivables is
listed as follows based on credit risk ratings:
June 30, 2019
Credit Risk Ratings
Measurement of Expected
Credit Loss
Guarantee
Loans
Other
Receivables
Low credit risk 12 months expected credit loss $ 976,273 $ 932
Credit risk significantly
increase
Lifetime expected credit loss 4,649 22
Impairment Lifetime expected credit loss 13,656 53
Total book value $ 994,578 $ 1,007
December 31, 2018
Credit Risk Ratings
Measurement of Expected
Credit Loss
Guarantee
Loans
Other
Receivables
Low credit risk 12 months expected credit loss $ 1,150,280 $ 1,146
Credit risk significantly
increase
Lifetime expected credit loss 5,074 26
Impairment Lifetime expected credit loss 16,250 66
Total book value $ 1,171,604 $ 1,238
June 30, 2018
Credit Risk Ratings
Measurement of Expected
Credit Loss
Guarantee
Loans
Other
Receivables
Low credit risk 12 months expected credit loss $ 1,373,757 $ 1,273
Credit risk significantly
increase
Lifetime expected credit loss 3,593 23
Impairment Lifetime expected credit loss 19,747 47
Total book value $ 1,397,097 $ 1,343

- 154 -
Changes in allowance losses for the six months ended June 30, 2019 and 2018 are as follows:
12 Months
Expected
Credit Loss
Lifetime
Expected
Credit Loss -
Collective
Lifetime
Expected
Credit Loss -
Individual
Impairment
Recognized In
Accordance
with IFRS 9
Impairment
Recognized In
Accordance
with Guidelines
for Handling
Assessment of
Assets, Loans
Overdue,
Receivable on
Demand and
Bad Debts By
Insurance
Enterprises Total
January 1, 2019 $ 73 $ 342 $ 1,256 $ 1,671 $ 16,332 $ 18,003
Change due to financial assets
recognized at the beginning
of the period
Change to duration
expected credit loss - - - - - -
Change to 12 months
expected credit loss - - - - - -
Disposal (5 ) - - (5 ) - (5 )
Impairment recognized in
accordance with Guidelines
for Handling Assessment
of Assets, Loans Overdue,
Receivable on Demand and
Bad Debts by Insurance
Enterprises - - - - (2,285 ) (2,285 )
Change in exchange rate and
others (6 ) 2,499 (205 ) 2,288 - 2,288
June 30, 2019 $ 62 $ 2,841 $ 1,051 $ 3,954 $ 14,047 $ 18,001
January 1, 2018 $ 1,012 $ 16,815 $ 351 $ 18,178 $ 23,772 $ 41,950
Change due to financial assets
recognized at the beginning
of the period
Change to duration
expected credit loss - - - - - -
Change to 12 months
expected credit loss 15 - (15 ) - - -
Disposal (925 ) - (1 ) (926 ) - (926 )
Impairment recognized in
accordance with Guidelines
for Handling Assessment
of Assets, Loans Overdue,
Receivable on Demand and
Bad Debts by Insurance
Enterprises - - - - (4,385 ) (4,385 )
Change in exchange rate and
others (15 ) 7,927 1,186 9,098 - 9,098
June 30, 2018 $ 87 $ 24,742 $ 1,521 $ 26,350 $ 19,387 $ 45,737
The allowance loss of China Life Insurance’s accounts receivables arising from other
transactions are measured by lifetime expected credit loss. Changes in allowance losses of
receivables for the six months ended June 30, 2019 and 2018 are as follows:
Receivables
January 1, 2019 $ 7,915
Reversal (70)
Written-off due to uncollectable -
June 30, 2019 $ 7,845
January 1, 2018 $ 724
Addition 3,302
Written-off due to uncollectable -
June 30, 2018 $ 4,026

- 155 -
c. Liquidity risk
KGI Bank and subsidiaries
1) The source and definition of liquidity risk
Liquidity risk of KGI Bank refers to the risks of bearing financial loss because of the inability to
liquidate assets or obtain financing to provide funds to meet the financial obligation, such as early
termination of deposits, deteriorating of the source and condition of financing from banks
influenced by specific market, abnormal recover of funds due to default from borrowers, inability to
liquidate financial instruments and early exertion of rights of rescission of interest sensitive product
by the assured. The aforementioned situation may reduce cash source of loan, transactions and
investment. In some extreme cases, the lack of liquidity may result in a decrease in the overall
position of the balance sheet, sale of assets and failure to perform loan commitments.
2) Management policy of liquidity risk
KGI Bank’s liquidity risk management gap limit management strategy, which is the cumulative
inflows and outflows (net cumulative mismatch), the KGI Bank calculates the maximum cumulative
cash outflow (MCO) to monitor the daily funding gap by each major currency. The KGI Bank also
actively deconcentrates funding sources, due dates of funding settlement, and the counterparties to
the due from other banks and call loans to other banks, as well as maintains an adequate amount of
corporate cash in banks to enhance its liquidity position.
3) Maturity gap analysis of financial assets and non-derivative financial liabilities held for liquidity
purposes
a) Financial assets held for liquidity management
The KGI Bank holds cash and highly liquid and high-grade assets to pay off obligations and
meet any potential emergency funding needs. The assets held for liquidity management include
cash and cash equivalents, due from the Central Bank and call loans to banks, financial assets at
fair value through profit or loss, financial assets at fair value through other comprehensive
income, and discounts and loans.
b) Non-derivative financial liabilities
The following tables show the cash outflows on the KGI Bank’s non-derivative financial
liabilities based on contract maturities. However, because the amounts disclosed were based on
contractual cash flows, some of them will not match the amounts shown in the balance sheets.
(In Thousands of New Taiwan Dollars)
June 30, 2019 0-30 Days 31-90 Days 91-180 Days 181 Days-1 Year Over 1 Year Total
Deposits from the Central Bank and
banks $ 2,500,000 $ 2,009,590 $ 157,260 $ 23,296 $ - $ 4,690,146
Notes and bonds issued under
repurchase agreement 7,148,788 - - - - 7,148,788
Deposits and
remittances 72,556,592 81,210,898 45,434,980 80,390,111 17,540,854 297,133,435 Bank debentures
payable - - - 1,000,000 9,450,000 10,450,000
Other capital outflow on
maturity 1,150,234 379,336 578,725 825,540 2,586,510 5,520,345
Total $ 83,355,614 $ 83,599,824 $ 46,170,965 $ 82,238,947 $ 29,577,364 $ 324,942,714
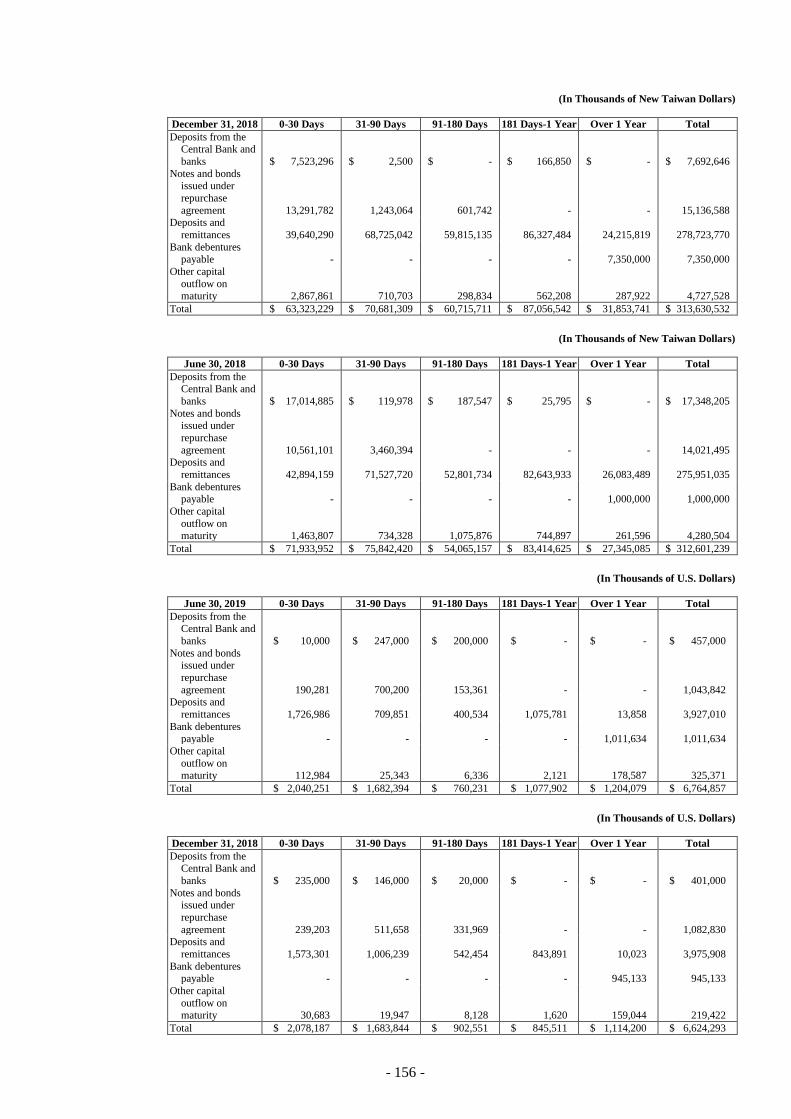
- 156 -
(In Thousands of New Taiwan Dollars)
December 31, 2018 0-30 Days 31-90 Days 91-180 Days 181 Days-1 Year Over 1 Year Total
Deposits from the Central Bank and
banks $ 7,523,296 $ 2,500 $ - $ 166,850 $ - $ 7,692,646
Notes and bonds issued under
repurchase
agreement 13,291,782 1,243,064 601,742 - - 15,136,588 Deposits and
remittances 39,640,290 68,725,042 59,815,135 86,327,484 24,215,819 278,723,770
Bank debentures payable - - - - 7,350,000 7,350,000
Other capital
outflow on maturity 2,867,861 710,703 298,834 562,208 287,922 4,727,528
Total $ 63,323,229 $ 70,681,309 $ 60,715,711 $ 87,056,542 $ 31,853,741 $ 313,630,532
(In Thousands of New Taiwan Dollars)
June 30, 2018 0-30 Days 31-90 Days 91-180 Days 181 Days-1 Year Over 1 Year Total
Deposits from the Central Bank and
banks $ 17,014,885 $ 119,978 $ 187,547 $ 25,795 $ - $ 17,348,205
Notes and bonds issued under
repurchase
agreement 10,561,101 3,460,394 - - - 14,021,495 Deposits and
remittances 42,894,159 71,527,720 52,801,734 82,643,933 26,083,489 275,951,035
Bank debentures payable - - - - 1,000,000 1,000,000
Other capital
outflow on maturity 1,463,807 734,328 1,075,876 744,897 261,596 4,280,504
Total $ 71,933,952 $ 75,842,420 $ 54,065,157 $ 83,414,625 $ 27,345,085 $ 312,601,239
(In Thousands of U.S. Dollars)
June 30, 2019 0-30 Days 31-90 Days 91-180 Days 181 Days-1 Year Over 1 Year Total
Deposits from the Central Bank and
banks $ 10,000 $ 247,000 $ 200,000 $ - $ - $ 457,000
Notes and bonds issued under
repurchase
agreement 190,281 700,200 153,361 - - 1,043,842 Deposits and
remittances 1,726,986 709,851 400,534 1,075,781 13,858 3,927,010
Bank debentures payable - - - - 1,011,634 1,011,634
Other capital
outflow on maturity 112,984 25,343 6,336 2,121 178,587 325,371
Total $ 2,040,251 $ 1,682,394 $ 760,231 $ 1,077,902 $ 1,204,079 $ 6,764,857
(In Thousands of U.S. Dollars)
December 31, 2018 0-30 Days 31-90 Days 91-180 Days 181 Days-1 Year Over 1 Year Total
Deposits from the
Central Bank and
banks $ 235,000 $ 146,000 $ 20,000 $ - $ - $ 401,000
Notes and bonds issued under
repurchase
agreement 239,203 511,658 331,969 - - 1,082,830 Deposits and
remittances 1,573,301 1,006,239 542,454 843,891 10,023 3,975,908
Bank debentures payable - - - - 945,133 945,133
Other capital
outflow on maturity 30,683 19,947 8,128 1,620 159,044 219,422
Total $ 2,078,187 $ 1,683,844 $ 902,551 $ 845,511 $ 1,114,200 $ 6,624,293

- 157 -
(In Thousands of U.S. Dollars)
June 30, 2018 0-30 Days 31-90 Days 91-180 Days 181 Days-1 Year Over 1 Year Total
Deposits from the
Central Bank and
banks $ 130,000 $ 285,000 $ 70,000 $ 20,000 $ - $ 505,000 Notes and bonds
issued under
repurchase agreement 240,690 608,257 258,939 - - 1,107,886
Deposits and remittances 1,808,418 885,453 503,661 896,518 55 4,094,105
Bank debentures
payable - - - - 960,120 960,120 Other capital
outflow on
maturity 37,732 27,402 9,604 1,882 191,705 268,325
Total $ 2,216,840 $ 1,806,112 $ 842,204 $ 918,400 $ 1,151,880 $ 6,935,436
4) Maturity analysis of derivative financial instruments
The valuation of the maturity of the contracts is essential for presenting the financial instruments on
the balance sheet. The amount disclosed in the balance sheet is prepared based on the cash flows of
the contract. Thus, a part of the amount disclosed deviates from the balance sheet. The maturity
analysis of financial instruments is as follows:
(In Thousands of New Taiwan Dollars)
June 30, 2019 0-30 Days 31-90 Days 91-180 Days 181 Days-1 Year Over 1 Year Total
Derivative financial
instruments at fair value through profit or
loss
Foreign exchange derivatives
instruments
Cash outflow $ (215,023,098 ) $ (254,182,804 ) $ (127,721,398 ) $ (58,102,983 ) $ (8,665,500 ) $ (663,695,783 ) Cash inflow 200,156,348 221,168,818 123,910,681 54,216,579 7,065,180 606,517,606
Interest rate derivatives
instruments Cash outflow (155,544 ) (430,582 ) (353,311 ) (401 ) (13,102,796 ) (14,042,634 )
Cash inflow 138,990 415,328 53,758 - - 608,076
Cash outflow subtotal (215,178,642 ) (254,613,386 ) (128,074,709 ) (58,103,384 ) (21,768,296 ) (677,738,417 ) Cash inflow subtotal 200,295,338 221,584,146 123,964,439 54,216,579 7,065,180 607,125,682
Net cash flow $ (14,883,304 ) $ (33,029,240 ) $ (4,110,270 ) $ (3,886,805 ) $ (14,703,116 ) $ (70,612,735 )
(In Thousands of New Taiwan Dollars)
December 31, 2018 0-30 Days 31-90 Days 91-180 Days 181 Days-1 Year Over 1 Year Total
Derivative financial instruments at fair
value through profit or
loss Foreign exchange
derivatives
instruments Cash outflow $ (233,453,223 ) $ (278,785,154 ) $ (170,854,332 ) $ (43,935,861 ) $ (7,938,490 ) $ (734,967,060 )
Cash inflow 212,355,080 261,260,926 164,566,007 38,897,232 6,501,546 683,580,791
Interest rate derivatives instruments
Cash outflow (148,479 ) (340,477 ) (11,507 ) (300,000 ) (16,900,584 ) (17,701,047 )
Cash inflow 125,186 337,310 - - 15,006 477,502
Cash outflow subtotal (233,601,702 ) (279,125,631 ) (170,865,839 ) (44,235,861 ) (24,839,074 ) (752,668,107 ) Cash inflow subtotal 212,480,266 261,598,236 164,566,007 38,897,232 6,516,552 684,058,293
Net cash flow $ (21,121,436 ) $ (17,527,395 ) $ (6,299,832 ) $ (5,338,629 ) $ (18,322,522 ) $ (68,609,814 )

- 158 -
(In Thousands of New Taiwan Dollars)
June 30, 2018 0-30 Days 31-90 Days 91-180 Days 181 Days-1 Year Over 1 Year Total
Derivative financial instruments at fair
value through profit or
loss Foreign exchange
derivatives
instruments Cash outflow $(259,164,818) $(288,757,543) $(157,187,649) $ (71,768,060 ) $ (2,390,280 ) $(779,268,350)
Cash inflow 244,684,325 267,409,155 157,018,044 73,252,673 929,302 743,293,499
Interest rate derivatives instruments
Cash outflow (184,077 ) (342,879 ) (17,953 ) - (14,201,108 ) (14,746,017 )
Cash inflow 167,520 356,187 18,384 - - 542,091
Cash outflow subtotal (259,348,895 ) (289,100,422 ) (157,205,602 ) (71,768,060 ) (16,591,388 ) (794,014,367 ) Cash inflow subtotal 244,851,845 267,765,342 157,036,428 73,252,673 929,302 743,835,590
Net cash flow $ (14,497,050 ) $ (21,335,080 ) $ (169,174 ) $ 1,484,613 $ (15,662,086 ) $ (50,178,777 )
(In Thousands of U.S. Dollars)
June 30, 2019 0-30 Days 31-90 Days 91-180 Days 181 Days-1 Year Over 1 Year Total
Derivative financial instruments at fair
value through profit or
loss Foreign exchange
derivatives
instruments Cash outflow $ (7,395,764 ) $ (7,785,297 ) $ (4,334,490 ) $ (2,450,473 ) $ (472,832 ) $ (22,438,856 )
Cash inflow 8,148,400 8,952,660 4,346,739 2,254,422 524,832 24,227,053
Interest rate derivatives instruments
Cash outflow (51,471 ) (146,373 ) (98,772 ) (60,601 ) (71,103 ) (428,320 )
Cash inflow 61,977 144,988 100,253 3,160 71 310,449 Others
Cash outflow (6,696 ) - - - - (6,696 ) Cash inflow 4,575 - - - - 4,575
Cash outflow subtotal (7,453,931 ) (7,931,670 ) (4,433,262 ) (2,511,074 ) (543,935 ) (22,873,872 )
Cash inflow subtotal 8,214,952 9,097,648 4,446,992 2,257,582 524,903 24,542,077
Net cash flow $ 761,021 $ 1,165,978 $ 13,730 $ (253,492 ) $ (19,032 ) $ 1,668,205
(In Thousands of U.S. Dollars)
December 31, 2018 0-30 Days 31-90 Days 91-180 Days 181 Days-1 Year Over 1 Year Total
Derivative financial
instruments at fair
value through profit or loss
Foreign exchange
derivatives instruments
Cash outflow $ (8,079,022 ) $ (9,161,839 ) $ (5,717,494 ) $ (1,603,252 ) $ (492,810 ) $ (25,054,417 )
Cash inflow 8,838,537 9,949,100 5,887,192 1,598,368 540,811 26,814,008 Interest rate derivatives
instruments
Cash outflow (89,987 ) (133,284 ) (85,583 ) (6,773 ) (68,545 ) (384,172 ) Cash inflow 59,794 125,658 74,119 2,843 128 262,542
Others
Cash outflow (365 ) - - - - (365 )
Cash inflow 725 - - - - 725
Cash outflow subtotal (8,169,374 ) (9,295,123 ) (5,803,077 ) (1,610,025 ) (561,355 ) (25,438,954 )
Cash inflow subtotal 8,899,056 10,074,758 5,961,311 1,601,211 540,939 27,077,275
Net cash flow $ 729,682 $ 779,635 $ 158,234 $ (8,814 ) $ (20,416 ) $ 1,638,321

- 159 -
(In Thousands of U.S. Dollars)
June 30, 2018 0-30 Days 31-90 Days 91-180 Days 181 Days-1 Year Over 1 Year Total
Derivative financial instruments at fair
value through profit or
loss Foreign exchange
derivatives
instruments Cash outflow $ (9,413,531 ) $ (9,717,821 ) $ (5,643,969 ) $ (2,684,781 ) $ (80,860 ) $ (27,540,962 )
Cash inflow 9,847,698 10,491,360 5,551,793 2,667,508 129,660 28,688,019
Interest rate derivatives instruments
Cash outflow (51,781 ) (97,383 ) (62,445 ) (63,467 ) (41,576 ) (316,652 )
Cash inflow 59,817 101,177 55,364 584 71 217,013 Others
Cash outflow (44 ) - - - - (44 )
Cash inflow 27 - - - - 27
Cash outflow subtotal (9,465,356 ) (9,815,204 ) (5,706,414 ) (2,748,248 ) (122,436 ) (27,857,658 ) Cash inflow subtotal 9,907,542 10,592,537 5,607,157 2,668,092 129,731 28,905,059
Net cash flow $ 442,186 $ 777,333 $ (99,257 ) $ (80,156 ) $ 7,295 $ 1,047,401
5) Maturity analysis of off-balance sheet items
The table below shows KGI Bank’s maturity analysis of the off-balance sheet items based on the
remaining time between the reporting date and the contractual period. For the issued financial
guarantee contracts, the maximum guaranteed amount included in the guarantee may be required to
be fulfilled in the earliest period.
June 30, 2019 0-30 Days 31-90 Days 91-180 Days 181 Days-1 Year Over 1 Year Total
Irrevocable loan
commitments, guarantees and letters
of credit $ 13,517,032 $ 4,397,934 $ 3,945,402 $ 9,695,705 $ 14,713,541 $ 46,269,614
December 31, 2018 0-30 Days 31-90 Days 91-180 Days 181 Days-1 Year Over 1 Year Total
Irrevocable loan
commitments,
guarantees and letters of credit $ 7,809,005 $ 3,477,324 $ 3,972,951 $ 10,004,484 $ 11,987,812 $ 37,251,576
June 30, 2018 0-30 Days 31-90 Days 91-180 Days 181 Days-1 Year Over 1 Year Total
Irrevocable loan commitments,
guarantees and letters
of credit $ 7,025,116 $ 3,853,714 $ 3,658,712 $ 8,057,449 $ 12,215,210 $ 34,810,201
6) The maturity analysis of lease agreement
The lease contracts of KGI Bank are operating lease and financial lease. Operating lease
commitment is the future minimum rental payment under irrevocable operating lease condition.
Financial lease means net future lease payments under finance lease condition.

- 160 -
The maturity analysis of lease commitments were as follows:
December 31, 2018 Less Than
1 Year 1-5 Years Over 5 Years Total
Lease agreement
Financial lease gross income
(lessor) $ 1,727,233 $ 1,976,230 $ - $ 3,703,463
Financial lease present value
income (lessor) 1,615,018 1,890,338 - 3,505,356
Operating lease payment
(lessee) 322,537 325,106 85,297 732,940
Operating lease income
(lessor) 22,177 76,527 10,185 108,889
Present value of financial
lease payment (lessee) - 3,716 - 3,716
June 30, 2018 Less Than
1 Year 1-5 Years Over 5 Years Total
Lease agreement
Financial lease gross income
(lessor) $ 1,759,196 $ 1,984,313 $ - $ 3,743,509
Financial lease present value
income (lessor) 1,641,273 1,901,958 - 3,543,231
Operating lease payment
(lessee) 329,454 455,822 96,090 881,366
Operating lease income
(lessor) 15,638 57,047 12,222 84,907
Present value of financial
lease payment (lessee) - 4,078 - 4,078
7) Disclosures required by the Regulations Governing the Preparation of Financial Reports by Public
Banks
a) Maturity analysis of KGI Bank’s assets and liabilities in New Taiwan dollars
(In Thousands of New Taiwan Dollars)
June 30, 2019 0-10 Days 11-30 Days 31-90 Days 91-180 Days 181 Days-1 Year Over 1 Year Total
Main capital inflow on
maturity $ 163,377,004 $ 224,831,101 $ 263,434,658 $ 163,132,285 $ 98,196,717 $ 148,658,699 $ 1,061,630,464
Main capital outflow on
maturity 117,362,855 200,400,851 367,232,557 199,052,990 192,812,622 203,519,178 1,280,381,053
Gap 46,014,149 24,430,250 (103,797,899 ) (35,920,705 ) (94,615,905 ) (54,860,479 ) (218,750,589 )
(In Thousands of New Taiwan Dollars)
June 30, 2018 0-10 Days 11-30 Days 31-90 Days 91-180 Days 181 Days-1 Year Over 1 Year Total
Main capital inflow on
maturity $ 148,385,453 $ 268,909,633 $ 314,786,939 $ 193,315,808 $ 120,213,979 $ 114,775,078 $ 1,160,386,890
Main capital outflow on
maturity 115,333,933 228,095,177 388,652,005 240,631,160 225,877,663 203,920,048 1,402,509,986
Gap 33,051,520 40,814,456 (73,865,066 ) (47,315,352 ) (105,663,684 ) (89,144,970 ) (242,123,096 )
b) Maturity analysis of KGI Bank’s assets and liabilities in U.S. dollars
(In Thousands of U.S. Dollars)
June 30, 2019 0-30 Days 31-90 Days 91-180 Days 181 Days-1 Year Over 1 Year Total
Main capital inflow on
maturity $ 9,522,320 $ 10,047,020 $ 4,758,180 $ 2,723,082 $ 3,198,110 $ 30,248,712
Main capital outflow on
maturity 9,704,362 10,034,149 5,554,289 4,269,947 3,210,077 32,772,824
Gap (182,042 ) 12,871 (796,109 ) (1,546,865 ) (11,967 ) (2,524,112 )

- 161 -
(In Thousands of U.S. Dollars)
June 30, 2018 0-30 Days 31-90 Days 91-180 Days 181 Days-1 Year Over 1 Year Total
Main capital inflow on
maturity $ 11,382,381 $ 11,733,096 $ 6,055,393 $ 3,099,234 $ 3,356,197 $ 35,626,301
Main capital outflow on
maturity 11,898,742 12,054,407 7,089,803 4,628,468 2,844,074 38,515,494
Gap (516,361 ) (321,311 ) (1,034,410 ) (1,529,234 ) 512,123 (2,889,193 )
KGI Securities and subsidiaries
1) Cash flow analysis
Statement of Cash Flow Analysis for Financial Assets
(In Thousands of New Taiwan Dollars)
June 30, 2019
Collection Period
Total Spot In 3 Months
3 Months-
12 Months
Over 1 Year-
5 Years Over 5 Years
Cash and cash equivalents $ 7,274,590 $ 3,167,524 $ - $ - $ - $ 10,442,114
Financial assets measured at FVTPL -
current 47,205,400 1,604,702 1,272,976 11,740,868 45,111 61,869,057
Financial assets measured at FVTOCI -
current 15,803,295 3,311,771 11,503 - - 19,126,569
Securities purchased under resell
agreement - 22,877,466 - - - 22,877,466
Receivable 44,347,722 3,514,530 16,493,240 911,288 - 65,266,780
Customers’ margin accounts 28,140,448 - - - - 28,140,448
Stock borrowing collateral price and
guarantee deposits - borrowed
securities 1,174,816 2,100,311 16,289,709 - - 19,564,836
Other financial assets - current - - 1,958,997 - - 1,958,997
Current tax assets - 3,734 12,948 2,371 208 19,261
Other current assets 45,473,459 462,272 1,124,196 - - 47,059,927
Financial assets measured at FVTPL -
noncurrent - - - 628,570 2,350,807 2,979,377
Financial assets measured at FVTOCI -
noncurrent - - - - 8,386,153 8,386,153
Financial assets at amortized cost -
noncurrent - - - 448,484 347,927 796,411
Investments accounted for using the
equity method - - - - 15,198,657 15,198,657
Others noncurrent assets 200,000 - - 250,033 2,657,199 3,107,232
Total $ 189,619,730 $ 37,042,310 $ 37,163,569 $ 13,981,614 $ 28,986,062 $ 306,793,285
Percentage 61.81% 12.07% 12.11% 4.56% 9.45% 100.00%
Statement of Cash Flow Analysis for Financial Liabilities
(In Thousands of New Taiwan Dollars)
June 30, 2019
Payment Period
Total Spot In 3 Months
3 Months-
12 Months
Over 1 Year-
5 Years Over 5 Years
Short-term borrowings $ - $ 15,085,373 $ - $ - $ - $ 15,085,373
Commercial papers payable, net - 5,078,460 - - - 5,078,460
Financial liabilities measured at FVTPL -
current 3,856,553 2,328,342 1,103,497 6,320,720 44,718 13,653,830
Bonds issued under repurchase
agreements - 75,875,018 - - - 75,875,018
Payables 73,663,553 1,331,995 2,653,432 65,961 - 77,714,941
Guarantee deposits - borrowed securities - 3,947,243 18,907,209 - - 22,854,452
Futures customers’ equity 28,117,171 - - - - 28,117,171
Collections/other payables/other current
liabilities 376,061 1,060,263 2,308,606 35 - 3,744,965
Other financial liabilities - current - 3,629,090 - 829 - 3,629,919
Lease liabilities-current - 133,846 376,141 - - 509,987
Current tax liabilities - 24,974 107,400 - 742,203 874,577
Noncurrent liabilities due in one year or
an operating cycle - - 4,800,000 - - 4,800,000
Provisions - noncurrent - - - 24,475 198,020 222,495
Lease liabilities - noncurrent - - - 926,877 - 926,877
Others noncurrent liabilities - - - 641,332 87,701 729,033
Total $ 106,013,338 $ 108,494,604 $ 30,256,285 $ 7,980,229 $ 1,072,642 $ 253,817,098
Percentage 41.77% 42.75% 11.92% 3.14% 0.42% 100.00%

- 162 -
Statement of Capital Liquidation Gap
(In Thousands of New Taiwan Dollars)
June 30, 2019
Collection and Payment Period
Total Spot In 3 Months
3 Months-
12 Months
Over 1 Year-
5 Years Over 5 Years
Cash inflow $ 189,619,730 $ 37,042,310 $ 37,163,569 $ 13,981,614 $ 28,986,062 $ 306,793,285
Cash outflow 106,013,338 108,494,604 30,256,285 7,980,229 1,072,642 253,817,098
Amount of cash flow gap $ 83,606,392 $ (71,452,294 ) $ 6,907,284 $ 6,001,385 $ 27,913,420 $ 52,976,187
Statement of Cash Flow Analysis for Financial Assets
(In Thousands of New Taiwan Dollars)
December 31, 2018
Collection Period
Total Spot In 3 Months
3 Months-
12 Months
Over 1 Year-
5 Years Over 5 Years
Cash and cash equivalents $ 5,114,643 $ 8,733,893 $ - $ - $ - $ 13,848,536
Financial assets measured at FVTPL -
current 45,048,279 1,944,214 9,160,574 387,366 69,401 56,609,834
Financial assets measured at FVTOCI -
current 8,151,851 5,575,724 643,797 - - 14,371,372
Securities purchased under resell
agreement - 19,494,037 - - - 19,494,037
Receivable 29,269,275 4,088,892 15,752,425 2,371,131 - 51,481,723
Customers’ margin accounts 21,810,475 - - - - 21,810,475
Stock borrowing collateral price and
guarantee deposits - borrowed
securities 2,925,678 2,093,783 6,916,890 - - 11,936,351
Other financial assets - current - - 3,387,927 - - 3,387,927
Current tax assets - - 48 2,255 569,624 571,927
Other current assets 45,521,742 986,209 1,071,838 - - 47,579,789
Financial assets measured at FVTPL -
noncurrent - - - 549,334 2,233,090 2,782,424
Financial assets measured at FVTOCI -
noncurrent - - - - 4,218,151 4,218,151
Financial assets at amortized cost -
noncurrent - - - 298,653 198,054 496,707
Investments accounted for using the
equity method - - - - 11,170,844 11,170,844
Others noncurrent assets 70,000 - 100,000 259,621 2,814,781 3,244,402
Total $ 157,911,943 $ 42,916,752 $ 37,033,499 $ 3,868,360 $ 21,273,945 $ 263,004,499
Percentage 60.04% 16.32% 14.08% 1.47% 8.09% 100.00%
Statement of Cash Flow Analysis for Financial Liabilities
(In Thousands of New Taiwan Dollars)
December 31, 2018
Payment Period
Total Spot In 3 Months
3 Months-
12 Months
Over 1 Year-
5 Years Over 5 Years
Short-term borrowings $ - $ 14,782,223 $ - $ - $ - $ 14,782,223
Commercial papers payable, net - 2,457,752 - - - 2,457,752
Financial liabilities measured at FVTPL -
current 3,723,021 1,236,609 5,532,983 1,124,791 69,401 11,686,805
Bonds issued under repurchase
agreements - 65,299,256 - - - 65,299,256
Payables 60,856,910 1,603,369 5,143,243 96,648 - 67,700,170
Guarantee deposits - borrowed securities - 5,908,005 11,910,455 - - 17,818,460
Futures customers’ equity 21,792,908 - - - - 21,792,908
Collections/other payables/other current
liabilities 424,784 1,101,415 2,601,633 30 - 4,127,862
Other financial liabilities - current - 2,224,901 8,913 739 - 2,234,553
Current tax liabilities - - 175,426 - 738,425 913,851
Bonds payable - - - 4,800,000 - 4,800,000
Provisions - noncurrent - - - 21,840 205,228 227,068
Others noncurrent liabilities - - - 694,628 67,593 762,221
Total $ 86,797,623 $ 94,613,530 $ 25,372,653 $ 6,738,676 $ 1,080,647 $ 214,603,129
Percentage 40.45% 44.09% 11.82% 3.14% 0.50% 100.00%
Statement of Capital Liquidation Gap
(In Thousands of New Taiwan Dollars)
December 31, 2018
Collection and Payment Period
Total Spot In 3 Months
3 Months-
12 Months
Over 1 Year-
5 Years Over 5 Years
Cash inflow $ 157,911,943 $ 42,916,752 $ 37,033,499 $ 3,868,360 $ 21,273,945 $ 263,004,499
Cash outflow 86,797,623 94,613,530 25,372,653 6,738,676 1,080,647 214,603,129
Amount of cash flow gap $ 71,114,320 $ (51,696,778 ) $ 11,660,846 $ (2,870,316 ) $ 20,193,298 $ 48,401,370

- 163 -
Statement of Cash Flow Analysis for Financial Assets
(In Thousands of New Taiwan Dollars)
June 30, 2018
Collection Period
Total Spot In 3 Months
3 Months-
12 Months
Over 1 Year-
5 Years Over 5 Years
Cash and cash equivalents $ 6,116,267 $ 5,965,074 $ - $ - $ - $ 12,081,341
Financial assets measured at FVTPL -
current 55,325,792 1,654,627 13,490,025 372,717 91,253 70,934,414
Financial assets measured at FVTOCI -
current 11,278,773 - - - - 11,278,773
Securities purchased under resell
agreement - 31,670,375 - - - 31,670,375
Receivable 40,700,427 5,625,551 21,153,087 4,579,724 - 72,058,789
Customers’ margin accounts 22,556,660 - - - - 22,556,660
Stock borrowing collateral price and
guarantee deposits - borrowed
securities 870,123 1,738,853 4,487,451 - - 7,096,427
Other financial assets - current - - 3,782,015 - - 3,782,015
Current tax assets - - 5,572 557 569,624 575,753
Other current assets 46,619,521 615,833 751,384 - - 47,986,738
Financial assets measured at FVTPL -
noncurrent - - 50,188 - 2,819,932 2,870,120
Financial assets measured at FVTOCI -
noncurrent - - - - 2,122 2,122
Financial assets at amortized cost -
noncurrent - - - 298,653 198,054 496,707
Investments accounted for using the
equity method - - - - 11,759,242 11,759,242
Others noncurrent assets - 100,000 149,837 318,978 2,747,388 3,316,203
Total $ 183,467,563 $ 47,370,313 $ 43,869,559 $ 5,570,629 $ 18,187,615 $ 298,465,679
Percentage 61.47% 15.87% 14.70% 1.87% 6.09% 100.00%
Statement of Cash Flow Analysis for Financial Liabilities
(In Thousands of New Taiwan Dollars)
June 30, 2018
Payment Period
Total Spot In 3 Months
3 Months-
12 Months
Over 1 Year-
5 Years Over 5 Years
Short-term borrowings $ 20,000 $ 24,954,628 $ - $ - $ - $ 24,974,628
Commercial papers payable, net - 12,062,236 - - - 12,062,236
Financial liabilities measured at FVTPL -
current 3,450,049 460,881 7,554,270 1,122,733 91,029 12,678,962
Bonds issued under repurchase
agreements - 76,980,900 - - - 76,980,900
Payables 67,146,978 138,393 3,940,735 53,503 - 71,279,609
Guarantee deposits - borrowed securities - 3,773,288 11,903,982 - - 15,677,270
Futures customers’ equity 22,529,017 - - - - 22,529,017
Collections/other payables/other current
liabilities 687,602 1,054,575 2,121,564 4 - 3,863,745
Other financial liabilities - current - 4,211,216 - 350,030 - 4,561,246
Current tax liabilities - - 115,148 - 597,153 712,301
Bonds payable - - - 4,800,000 - 4,800,000
Provisions - noncurrent - - - 22,369 196,727 219,096
Others noncurrent liabilities - - - 641,436 100,725 742,161
Total $ 93,833,646 $ 123,636,117 $ 25,635,699 $ 6,990,075 $ 985,634 $ 251,081,171
Percentage 37.37% 49.24% 10.21% 2.79% 0.39% 100.00%
Statement of Capital Liquidation Gap
(In Thousands of New Taiwan Dollars)
June 30, 2018
Collection and Payment Period
Total Spot In 3 Months
3 Months-
12 Months
Over 1 Year-
5 Years Over 5 Years
Cash inflow $ 183,467,563 $ 47,370,313 $ 43,869,559 $ 5,570,629 $ 18,187,615 $ 298,465,679
Cash outflow 93,833,646 123,636,117 25,635,699 6,990,075 985,634 251,081,171
Amount of cash flow gap $ 89,633,917 $ (76,265,804 ) $ 18,233,860 $ (1,419,446 ) $ 17,201,981 $ 47,384,508
KGI Securities has established statement of capital liquidation gap to estimate how all financial
assets and liabilities in future cash flows can affect KGI Securities and subsidiaries when it comes
to fund dispatching. Cash flow gap statement from June 30, 2019, December 31, 2018 and June 30,
2018, show that the sums from deducting cash outflow from cash inflow are $52,976,187 thousand,
$48,401,370 thousand and $47,384,508 thousand, respectively, all indicating sufficient fund
liquidity.

- 164 -
An observation of fund inflow and outflow in different periods of time shows that current and
receivable items contribute to the most of the financial assets of KGI Securities and subsidiaries,
taking up to nearly 61.81% of the entire financial assets. This shows that most of these financial
assets can be liquidated immediately and therefore have high liquidity. As for financial liabilities,
there is no particular period with a high number of due payments which will put stress on fund
dispatching.
Although an analysis of funds gap shows that the cash outflow during partial periods. Net cash
inflow calculated from net spot financial assets are sufficient to cover the net cash outflows
generated from subsequent periods, an indicator of sufficient fund liquidity.
2) Control mechanism of capital liquidity risk
The independent fund-dispatching department established by KGI Securities takes into
consideration the needs of net cash flow and their timings from various departments and predicts
future cash flows based on the requests submitted by departments with a need for funds. The
department has also established a simulation analysis mechanism for capital flows after considering
short-term capital dispatching in Taiwan as well as international or cross-market transactions in
order to better predict futures needs of funds and set up contingency measures.
KGI Securities also offers suggestions over a secure amount of reserve fund and reports it to the
RMC. The department reviews the standard amount of reserve capital and will take the following
action if available capitals are below 120% of the safe reserve amount:
a) Except all due payments and those whose use of capital cannot be restricted due to the nature of
their business, all the requests for capitals from all business departments need to be approved by
the fund-dispatching department in order to maintain a safe amount of reserve capital.
b) Fund-dispatching department will propose contingency measures to the RMC, which includes
disposal of low yield or unnecessary assets, expanding repurchase agreements with the Central
Bank of Taiwan, financing from securities finance corporations or exploring other fund-raising
methods that will increase available funds to KGI Securities.
CDIB Capital Group and subsidiaries
The management of liquidity risk is aimed to deal with financing CDIB Capital Group’s operations and
mitigate the effects of fluctuations in cash flows by monitoring and maintaining a level of cash and cash
equivalents.
CDIB Capital Group’s Management policies of liquidity risk are as follows:
1) Dispose of surplus capital should consider possible future capital requirements, deconcentration of
capital sources and reasonable liquidity of liability Structure.
2) Pursuant to liquidity risk control, CDIB Capital Group uses performance index of financial structure
and dispatching of funds to set up a system to monitor daily funding gap.
As of June 30, 2019, December 31, 2018 and June 30, 2018, CDIB Capital Group and subsidiaries’
other financial liabilities are $385,676 thousand, $381,410 thousand and $378,846 thousand,
respectively, and will be paid by financial assets and the rest of nonderivative financial liabilities are
$839,758 thousand, $905,189 thousand and $722,032 thousand, respectively, and are mainly all current
liabilities.

- 165 -
China Life Insurance
1) Liquidity risks are classified to “funding liquidity risk” and “market liquidity risk.” “Funding
liquidity risk” represents that China Life Insurance is not able to obtain sufficient funds at a
reasonable funding cost to meet the demands within reasonable time. “Market liquidity risk”
represents the risk that China Life Insurance sells at loss to meet the demand for cash.
China Life Insurance assesses the characteristics of business, monitors short-term cash flows, and
constructs the completed mechanism of liquidity risk management. Furthermore, China Life
Insurance manages market liquidity risk cautiously by considering market trading volumes and
adequacy of holding positions with symmetric. To decentralize market risk when investment and to
maintain investment each aspect (such as asset category, maturity, region, currency and tools)
diversification. Planning emergency financing plan in order to assess how China Life Insurance in
the long term illiquid environment still regularly operate to pay emergency and major funding
requirements.
China Life Insurance regularly monitors market liquidity and formulates plans to use the funds
depending on market conditions and funding demand arrangements for liquidity assets portfolio. To
deal with possible liquidity risk early, China Life Insurance reports duration of assets and liabilities
quarterly, creates cash flow model and reviews cash flow status regularly.
2) Financial assets held for managing liquidity risk and maturity analysis of non-derivative financial
liabilities
a) Financial assets held for managing liquidity risk
China Life Insurance holds cash, highly liquid and superior assets to deal with payment
obligation and the potential urgent funds needs to dispatch in the market environment. Financial
assets for managing liquidity risk are cash and cash equivalents, financial assets at fair value
through profit or loss, financial assets at fair value through other comprehensive income,
financial assets at amortized cost, etc.
b) Maturity analysis of non-derivative financial liabilities
The analysis of cash outflows to China Life Insurance is listed below and based on the residual
term from the date of balance sheet to the maturity. The disclosed amount is in accordance with
cash flows on contracts, so the partial disclosed items are not the same as related items in the
balance sheet.
Non-derivative financial instruments
June 30, 2019
In 1 Year 1-5 Years Over 5 Year Total
Payables $ 18,119,516 $ 28,943 $ - $ 18,148,459
Lease liabilities
(Note) 161,046 390,244 4,875,820 5,427,110
December 31, 2018
In 1 Year 1-5 Years Over 5 Year Total
Payables $ 10,698,549 $ 28,537 $ - $ 10,727,086

- 166 -
June 30, 2018
In 1 Year 1-5 Years Over 5 Year Total
Payables $ 13,236,811 $ 30,383 $ - $ 13,267,194
Note: China Life applied IFRS 16 on January 1, 2019 and decided not to retrospect
comparison period.
c) Maturity analysis of derivative financial liabilities
China Life Insurance operates derivatives including foreign exchange derivative instruments
(such as currency forward contracts, foreign exchange forward).
China Life Insurance has enough operating capital, including cash and cash equivalents, and
highly liquid securities, such as government bonds to pay the investment and liabilities at
maturity. Therefore, the risk of liquidity is extremely low. China Life Insurance enters into
forward contracts and cross currency swaps derivative financial instruments, whose currencies
are highly liquid, so the possibility of selling out and the risk of market liquidity are low. The
forward contracts and cross currency swaps will be operated continually and the capital is
enough to pay for settlement, so the risk of capital liquidity is low.
China Life Insurance’s maturity structure of derivative financial liabilities is as follows:
June 30, 2019
In 90 Days 91-180 Days 181 Days -
1 Year Over 1 Year Total Financial liabilities at fair value
through profit or loss $ 3,474,536 $ 1,803,445 $ 733,151 $ - $ 6,011,132
December 31, 2018
In 90 Days 91-180 Days 181 Days -
1 Year Over 1 Year Total
Financial liabilities at fair value through profit or loss $ 1,782,682 $ - $ 686,445 $ - $ 2,469,127
June 30, 2018
In 90 Days 91-180 Days 181 Days -
1 Year Over 1 Year Total Financial liabilities at fair value
through profit or loss $ 15,957,797 $ 2,788,199 $ 661,409 $ - $ 19,407,405
3) Maturity analysis of lease commitment
a) Operating lease commitment - China Life Insurance as the lessee
The commercial lease contracts for offices, vehicles and equipment signed by China Life
Insurance are within one to four years on average without renewal option. There is no restriction
on China Life Insurance in these contracts. Furthermore, China Life Insurance leases the land
for 70 years by creating surface right and the agreement is a non-cancellable operating lease.

- 167 -
In accordance with the non-cancellable operating lease, the total amount of the minimum lease
payment as at December 31, 2018 and June 30, 2018 are as follows:
December 31,
2018 June 30,
2018
Less than one year $ 111,219 $ 109,471
More than one year but less than five years 438,883 417,163
More than five years 4,834,881 4,875,820
$ 5,384,983 $ 5,402,454
The minimum lease payments of operating lease for the three and six months ended June 30,
2018 amounted to $15,959 thousand and $31,541 thousand, respectively.
b) Operating lease commitments - China Life Insurance as the lessor
The remaining period of commercial property lease contracts China Life Insurance signed are
within one year to fifteen years, and most of these lease contracts contain terms about adjusting
rents according to market environment annually.
In accordance with the non-cancellable operating lease, the total amount of the minimum lease
payment as at December 31, 2018 and June 30, 2018 are as follows:
December 31,
2018 June 30,
2018
Less than one year $ 407,686 $ 419,101
More than one year but less than five years 873,984 978,460
More than five years 223,248 241,358
$ 1,504,918 $ 1,638,919
d. Market risk
KGI Bank and subsidiaries
1) Source and definition of market risk
Market risk is defined as an unfavorable change in macroeconomic and financial market variables,
(such as interest rates, exchange rates, stock prices and commodity prices) which may cause a
potential loss on financial assets held for trading.
2) Risk management policies
In order to have a common-language of market risk management, definition, communication and
measurement, the KGI Bank has developed “Market Risk Policy” based on Regulations Governing
the Capital Adequacy Ratio of Banks and on market risk calculation tables announced by FSC,
international standards, and CDFH’s market risk management policy framework.
The “Market Risk Policy” is applicable to “Trading Book” positions defined by the Regulations
Governing the Capital Adequacy Ratio of the KGI Bank related market risk calculation tables and
the KGI Bank’s book management approach to financial instrument handling.

- 168 -
Following the “Market Risk Policy”, the KGI Bank sets up the “Market Risk Management
Procedure to Trading Activities” to manage market risk throughout the Firm. This procedure
includes risk identification and assessment, risk measurement, risk monitoring and response, risk
reporting and contingency management processes.
3) The procedure of market risk measuring, monitoring, and reporting
The KGI Bank’s market risk limits include position sensitivities, stop-loss limits, Value-at-Risk
(VaR).
Risk factors analyzed through the KGI Bank’s risk measurement systems are sufficient to determine
all market risks of trading positions on balance sheet, including interest rates risk, foreign exchange
risk, equity risk and commodity risk, as well as volatility risks which arise out of the option
transactions.
The KGI Bank’s market risk report includes profit or loss on trading positions, limits usage, stress
testing, trading portfolio risk assessment, as well as significant exception if any.
The risk management unit of the KGI Bank independently performs daily market risk limit controls,
and monthly reports to both the Risk Management Committee and CDFH’s Risk Management
Committee. Besides, the above reports are regularly presented to the Board for reference.
4) Mitigation of risks or hedging of market risk
The KGI Bank’s market risk positions or hedging positions are marked to market on a daily base
through techniques such as model evaluation. All market parameters are updated at least daily in
accordance with changes in market conditions to conduct value assessment of products. Market
Risk Limits are reviewed and controlled based on the revaluation results of traders’ position risk
value, position sensitivity and profit and loss figure on the daily basis.
5) Valuation techniques of market risk
The KGI Bank uses the VaR model and stress testing to evaluate the potential and extreme risk of
trading portfolios. Through variations of the assumptions on market conditions, these techniques
can be used to assess the market risk of positions held and the maximum expected loss.
VaR is calculated using a one-day time horizon with a 95% confidence level.
(In Thousands of New Taiwan Dollars)
For the Six Months Ended
June 30, 2019 For the Year Ended December 31, 2018
For the Six Months Ended
June 30, 2018 Average Highest Lowest Average Highest Lowest Average Highest Lowest
Interest rate risk $ 167,324 $ 226,896 $ 97,544 $ 172,030 $ 263,393 $ 72,541 $ 182,367 $ 263,393 $ 108,589
Equity risk 331 3,764 95 13,929 27,333 3,477 14,251 22,137 6,541
Exchange rate risk 5,092 10,628 3,164 5,034 34,521 2,163 6,447 34,521 3,159
6) Interest rate risk in banking book
The scope of interest rate risk in banking book includes interest rate sensitivity of assets and
liabilities, but do not include risk management of trading book. Interest rate risk in banking book
measures the adverse effects on net interest income of assets, liabilities and off-balance sheet as a
result of adverse fluctuations in interest. Risk assessment not only builds the sensitivity gap between
assets and liabilities, but also quantifies through the dimension of retained earnings and economic
value perspectives.

- 169 -
7) Interest rate risk management of the banking book
The interest rate risk management strategy involving the Bank’s banking book is to minimize the
negative impact of changes in interest rates on net interest income and the net economic value of
equity. The asset-liability management committee (ALMCO) approves the annual banking book
interest rate risk limits and monitors the Bank’s interest rate risk exposures every day. The interest
rate risk management processes involving the banking book include risk identification, risk
measurement, risk control, risk monitor and others. The unit monitoring the banking book interest
rate risk reports interest rate risk exposures regularly to ALMCO, and adjust the structure of assets
and liabilities according to the report, lowering the amount of exposure. For risk monitoring, the
asset and liability management system outputs an analysis report, which is provided to the interest
rate risk execution unit and top management. If risk missing or excess of limit occurred from
monitor, written notices will be passed to interest rate risk implementation units to adjust and
improve the program reported to ALMCO.
8) Concentration of currency risk information
The financial assets and liabilities denominated in foreign currency and with material influence on
KGI Bank and subsidiaries were as follows:
(In Thousands of Foreign Currencies/New Taiwan Dollars)
June 30, 2019
Foreign
Currency
Exchange Rate
(Dollar)
New Taiwan
Dollar
Financial assets
Monetary items
USD $ 6,903,296 31.07 $ 214,499,204
HKD 3,752,128 3.98 14,929,716
EUR 344,673 35.38 12,194,534
CNY 1,133,883 4.52 5,128,781
JPY 14,156,101 0.29 4,086,866
ZAR 667,560 2.20 1,467,964
GBP 37,235 39.38 1,466,301
AUD 41,536 21.80 905,490
SGD 18,824 22.97 432,389
Financial liabilities
Monetary items
USD 8,495,481 31.07 263,971,579
CNY 3,961,984 4.52 17,920,846
EUR 215,366 35.38 7,619,661
JPY 23,930,069 0.29 6,908,611
ZAR 2,281,445 2.20 5,016,898
AUD 134,914 21.80 2,941,128
HKD 389,309 3.98 1,549,060
GBP 5,958 39.38 234,636
NZD 5,475 20.85 114,150

- 170 -
(In Thousands of New Foreign Currencies/Taiwan Dollars)
December 31, 2018
Foreign
Currency
Exchange Rate
(Dollar)
New Taiwan
Dollar
Financial assets
Monetary items
USD $ 6,504,546 30.73 $ 199,904,197
EUR 553,336 35.22 19,488,500
HKD 3,190,724 3.92 12,520,400
CNY 1,282,347 4.48 5,739,271
GBP 35,024 38.89 1,362,084
AUD 43,641 21.68 946,141
JPY 2,497,538 0.28 695,315
SGD 20,472 22.49 460,408
ZAR 202,838 2.13 431,843
Financial liabilities
Monetary items
USD 8,133,541 30.73 249,968,104
CNY 3,795,557 4.48 16,987,396
EUR 391,754 35.22 13,797,578
ZAR 2,048,614 2.13 4,361,500
AUD 100,666 21.68 2,182,447
JPY 4,488,426 0.28 1,249,578
HKD 110,607 3.92 434,023
GBP 3,127 38.89 121,619
NZD 5,713 20.63 117,855
(In Thousands of Foreign Currencies/New Taiwan Dollars)
June 30, 2018
Foreign
Currency
Exchange Rate
(Dollar)
New Taiwan
Dollar
Financial assets
Monetary items
USD $ 8,047,684 30.50 $ 245,454,348
EUR 579,178 35.48 20,549,228
HKD 2,527,039 3.89 9,822,600
CNY 1,499,509 4.60 6,898,339
JPY 15,176,873 0.28 4,184,264
SGD 19,826 22.37 443,499
ZAR 152,656 2.22 339,202
GBP 8,340 40.01 333,692
AUD 8,197 22.54 184,761
(Continued)

- 171 -
June 30, 2018
Foreign
Currency
Exchange Rate
(Dollar)
New Taiwan
Dollar
Financial liabilities
Monetary items
USD $ 9,024,960 30.50 $ 275,261,278
CNY 3,474,495 4.60 15,984,068
EUR 437,832 35.48 15,534,268
JPY 16,014,162 0.28 4,415,104
ZAR 1,652,731 2.22 3,672,367
AUD 133,611 22.54 3,011,597
HKD 177,897 3.89 691,484
NZD 16,751 20.65 345,910
GBP 2,859 40.01 114,375
(Concluded)
9) Disclosure required by the Regulations Governing the Preparation of Financial Reports by Public
Banks.
a) Analysis of KGI Bank’s interest rate-sensitive assets and liabilities (New Taiwan dollars)
June 30, 2019
Item 1 to 90 Days 91 to 180 Days 181 Days to
1 Year Over 1 Year Total
Interest rate-sensitive assets $ 304,038,760 $ 20,713,703 $ 15,602,428 $ 85,137,300 $ 425,492,191
Interest rate-sensitive liabilities 156,135,218 105,645,598 41,481,096 12,549,940 315,811,852
Interest rate sensitivity gap 147,903,542 (84,931,895 ) (25,878,668 ) 72,587,360 109,680,339
Net worth 60,898,670
Ratio of interest rate-sensitive assets to liabilities (%) 134.73
Ratio of interest rate-sensitive gap to net worth (%) 180.10
June 30, 2018
Item 1 to 90 Days 91 to 180 Days 181 Days to
1 Year Over 1 Year Total
Interest rate-sensitive assets $ 288,383,901 $ 15,407,278 $ 6,422,453 $ 78,612,298 $ 388,825,930
Interest rate-sensitive liabilities 140,418,138 108,258,015 49,902,474 6,134,963 304,713,590
Interest rate sensitivity gap 147,965,763 (92,850,737 ) (43,480,021 ) 72,477,335 84,112,340
Net worth 58,504,709
Ratio of interest rate-sensitive assets to liabilities (%) 127.60
Ratio of interest rate-sensitive gap to net worth (%) 143.77
Note 1: The above amounts included only New Taiwan dollar amounts held by KGI Bank
excluded contingent assets and contingent liabilities.
Note 2: Interest rate-sensitive assets and liabilities are interest-earning assets and
interest-bearing liabilities with revenues or costs affected by interest rate changes.
Note 3: Interest rate sensitivity gap = Interest rate-sensitive assets - Interest rate-sensitive
liabilities.
Note 4: Ratio of interest rate-sensitive assets to liabilities = Interest rate-sensitive
assets/Interest rate-sensitive liabilities (interest rate-sensitive assets and interest
rate-sensitive liabilities in New Taiwan dollars).

- 172 -
b) Analysis of KGI Bank’s interest rate-sensitive assets and liabilities (U.S. dollars)
June 30, 2019
(In Thousands of U.S. Dollars, %)
Item 1 to 90 Days 91 to 180 Days 181 Days to
1 Year Over 1 Year Total
Interest rate-sensitive assets $ 3,267,235 $ 159,843 $ 45,985 $ 1,413,429 $ 4,886,492
Interest rate-sensitive liabilities 4,005,545 648,589 759,862 992,903 6,406,899
Interest rate sensitivity gap (738,310) (488,746) (713,877) 420,526 (1,520,407)
Net worth 60,245
Ratio of interest rate-sensitive assets to liabilities (%) 76.27
Ratio of interest rate-sensitive gap to net worth (%) (2,523.71)
June 30, 2018
(In Thousands of U.S. Dollars, %)
Item 1 to 90 Days 91 to 180 Days 181 Days to
1 Year Over 1 Year Total
Interest rate-sensitive assets $ 3,642,720 $ 160,429 $ 47,585 $ 1,504,996 $ 5,355,730
Interest rate-sensitive liabilities 4,486,278 700,485 520,173 883,216 6,590,152
Interest rate sensitivity gap (843,558) (540,056) (472,588) 621,780 (1,234,422)
Net worth (9,431)
Ratio of interest rate-sensitive assets to liabilities (%) 81.27
Ratio of interest rate-sensitive gap to net worth (%) -
Note 1: The above amounts included only U.S. dollars amounts held by KGI Bank, excluded
contingent assets and contingent liabilities.
Note 2: Interest rate-sensitive assets and liabilities are interest-earning assets and
interest-bearing liabilities with revenues or costs affected by interest rate changes.
Note 3: Interest rate sensitivity gap = Interest rate-sensitive assets - Interest rate-sensitive
liabilities.
Note 4: Ratio of interest rate-sensitive assets to liabilities = Interest rate-sensitive
assets/Interest rate-sensitive liabilities (interest rate-sensitive assets and interest
rate-sensitive liabilities in U.S. dollars).
KGI Securities and subsidiaries
Market risk is the risk of potential loss or change in valuation for securities or financial products that
KGI Securities and subsidiaries hold due to the fluctuations of the market risk factors. Such factors
include interest rates (including credit spread) and risk of equity securities and exchange rates and
commodity risk.
KGI Securities utilize risk factor sensitivity and value at risk to measure and contain market risks. KGI
Securities also holds regular stress test to help the management understand the estimated influence on
the income of investment portfolio under potential extreme events or circumstances.

- 173 -
1) Risk factor sensitivity
Using product identification and analysis procedure held by KGI Securities, the corresponding
market risk factor can be determined. Individual risk factor’s entire exposure can be measured by
observing how the value of a financial instrument changes as each risk factor changes. KGI
Securities and subsidiaries monitor the following risk factor sensitivities:
a) Interest rate risk sensitivity: Measured by the change of present value of future cash flows of the
measured holding with each yield curve or credit spread moved 0.01% horizontally.
b) Equity securities risk sensitivity: Measured by the change of the value of investment portfolio
with the price of the underlying assets linked to the equity securities (as the potential loss
amount given that the TAIEX and stock of respective companies drop 1%).
c) Exchange rate risk sensitivity: Measured by the change of present values of corresponding
holdings of currencies with exchange rate for each currency (as the potential loss amount given
that the foreign currencies depreciate 1% against NTD).
d) Commodity risk sensitivity: Measured by the change of present values of corresponding
holdings of currencies with commodity for each currency (as the potential loss amount given
that commodity currencies depreciate 1% against NTD).
The risk sensitivities in the portfolio held by KGI Securities and subsidiaries are as follows:
Comparisons of Risk Sensitive Factors
(In Thousands of New Taiwan Dollars)
Risk Sensitivity June 30,
2019
December 31,
2018
June 30,
2018
Interest rate risk $ 12,832 $ 5,774 $ 7,921
Equity securities risk 4,363,047 2,710,631 4,126,560
Exchange rate risk 4,624,592 957,905 2,056,384
Commodity risk 19,112 10,758 (25,234)
2) Value at risk
Value at risk (“VAR”) is a statistical measurement used to measure the maximum potential loss of a
portfolio in a certain future time horizon and confidence level. KGI Securities and subsidiaries uses
parametric in estimating a value at risk at 99% of confidence interval at duration of 1 day. This
means that among 100 trading days, 1 trading day might see the loss of the positions exceeding the
value at risk estimated the day before. KGI Securities and subsidiaries continue to conduct back
testing daily to ensure the effectiveness of the estimations made by the risk value model.
The comparison of risk value in the trading portfolio held by KGI Securities and subsidiaries were
as follows:
For the Six Months Ended June 30, 2019 June 30, 2019
Average VAR Minimum VAR Maximum VAR Ending VAR
Equity securities $ 107,249 $ 73,809 $ 178,371 $ 106,192
Interest rate 102,211 68,035 163,461 97,788
Exchange rate 21,125 6,918 38,106 29,401
Commodity 8,348 729 21,959 16,637

- 174 -
For the Six Months Ended June 30, 2018 June 30, 2018
Average VAR Minimum VAR Maximum VAR Ending VAR
Equity securities $ 168,488 $ 91,772 $ 301,501 $ 112,343
Interest rate 138,343 79,818 211,119 107,355
Exchange rate 7,791 3,371 17,362 13,767
Commodity 7,969 146 11,516 6,620
3) Stress test
Stress test is one of the tools for risk management. It mainly evaluates the effects extreme changes
in market risk factors in an investment portfolio to help a company’s board of directors and
management understand how potential extreme incidents can affect the market risk sensitivity and
the profit/loss of an investment portfolio.
The main methods of stress test are historic analysis and hypothetical scenarios analysis. The results
will be regularly reported to the risk management committee and the board of directors of KGI
Securities.
4) Foreign currency exchange rate of financial assets and liabilities information
(In Thousands of Foreign Currencies/New Taiwan Dollars)
June 30, 2019
Foreign
Currency
Exchange Rate
(Dollar)
New Taiwan
Dollar
Financial assets
Monetary items
USD $ 2,071,971 31.11 $ 64,463,913
EUR 365,616 35.38 12,935,497
JPY 20,002,842 0.29 5,774,734
CNY 212,254 4.52 960,064
HKD 145,854 3.98 580,149
AUD 7,675 21.80 167,304
Nonmonetary items
USD 1,698,350 31.07 52,771,119
CNY 615,436 4.52 2,783,738
AUD 19,873 21.80 433,225
EUR 7,607 35.38 269,125
Investments accounted for using the
equity method
USD 79,183 31.07 2,460,373
(Continued)

- 175 -
June 30, 2019
Foreign
Currency
Exchange Rate
(Dollar)
New Taiwan
Dollar
Financial liabilities
Monetary items
USD 4,759,595 31.07 147,885,489
EUR 365,156 35.38 12,919,198
JPY 19,713,111 0.29 5,691,089
CNY 272,438 4.52 1,232,290
HKD 112,038 3.98 445,634
AUD 16,618 21.80 362,265
ZAR 55,703 2.20 122,491
Nonmonetary items
USD 241,673 31.07 7,509,249
AUD 8,718 21.80 190,059
CNY 28,263 4.52 127,839
(Concluded)
(In Thousands of Foreign Currencies/New Taiwan Dollars)
December 31, 2018
Foreign
Currency
Exchange Rate
(Dollar)
New Taiwan
Dollar
Financial assets
Monetary items
USD $ 1,554,985 30.78 $ 47,867,143
JPY 23,540,436 0.28 6,553,476
EUR 91,152 35.22 3,210,271
HKD 155,753 3.92 610,893
CNY 33,063 4.48 147,973
Nonmonetary items
USD 1,315,358 30.73 40,424,903
CNY 301,685 4.48 1,350,220
AUD 13,460 21.68 291,811
EUR 4,156 35.22 146,367
Investments accounted for using the
equity method
USD 78,570 30.73 2,414,682
Financial liabilities
Monetary items
USD 4,150,323 30.73 127,546,314
JPY 23,390,109 0.28 6,511,626
EUR 92,580 35.22 3,260,553
HKD 99,051 3.92 388,442
AUD 8,640 21.68 187,315
Nonmonetary items
USD 183,398 30.73 5,636,356
CNY 27,442 4.48 122,818

- 176 -
(In Thousands of Foreign Currencies/New Taiwan Dollars)
June 30, 2018
Foreign
Currency
Exchange Rate
(Dollar)
New Taiwan
Dollar
Financial assets
Monetary items
USD $ 1,809,592 30.50 $ 55,179,815
JPY 19,851,987 0.28 5,472,310
EUR 74,469 35.47 2,641,630
HKD 126,302 3.88 490,516
CNY 38,991 4.60 179,367
Nonmonetary items
USD 929,485 30.50 28,349,299
CNY 523,470 4.60 2,408,170
AUD 35,093 22.54 791,001
Investments accounted for using the
equity method
USD 71,212 30.50 2,171,951
Financial liabilities
Monetary items
USD 4,156,660 30.50 126,765,390
JPY 19,573,435 0.28 5,396,096
EUR 73,588 35.47 2,610,352
AUD 30,434 22.54 685,977
HKD 72,051 3.88 279,641
Nonmonetary items
USD 239,524 30.50 7,305,483
CNY 33,316 4.60 153,267

- 177 -
CDIB Capital Group and subsidiaries
Market risk is defined as an unfavorable change in financial market variables, (such as interest rates,
exchange rates, stock prices and commodity prices) which may cause a potential loss on financial assets
held for trading. Market risk as explained as follows:
1) Foreign currency rate risk information
The financial assets and liabilities denominated in foreign currency and with material influence on
CDIB Capital Group and subsidiaries were as follows:
(In Thousands of Foreign Currencies/New Taiwan Dollars)
June 30, 2019
Foreign
Currency
Exchange Rate
(Dollar)
New Taiwan
Dollar
Financial assets
Monetary items
USD $ 201,459 31.072 $ 6,259,733
HKD 255,697 3.979 1,017,420
CNY 219,012 4.523 990,636
KRW 7,185,036 0.027 193,328
JPY 414,683 0.289 119,719
Nonmonetary items
USD 381,605 31.072 11,857,232
THB 157,735 1.012 159,628
Investment accounted for using the equity
method
USD 104,441 31.072 3,245,176
CNY 675,210 4.523 3,054,112
Financial liabilities
Monetary items
USD 14,436 31.072 448,557

- 178 -
(In Thousands of Foreign Currencies/New Taiwan Dollars)
December 31, 2018
Foreign
Currency
Exchange Rate
(Dollar)
New Taiwan
Dollar
Financial assets
Monetary items
USD $ 223,828 30.733 $ 6,878,905
CNY 187,203 4.476 837,845
HKD 55,585 3.924 218,117
KRW 6,854,094 0.028 188,755
JPY 414,683 0.278 115,448
Nonmonetary items
USD 380,420 30.733 11,691,440
THB 230,845 0.949 219,072
Investment accounted for using the equity
method
CNY 685,898 4.476 3,069,805
USD 89,104 30.733 2,738,434
Financial liabilities
Monetary items
USD 15,381 30.733 472,712
(In Thousands of Foreign Currencies/New Taiwan Dollars)
June 30, 2018
Foreign
Currencies
Exchange Rate
(Dollar)
New Taiwan
Dollars
Financial assets
Monetary items
USD $ 224,515 30.500 $ 6,847,698
HKD 130,654 3.887 507,852
CNY 88,220 4.600 405,848
KRW 6,940,511 0.027 189,767
JPY 417,233 0.276 115,031
Nonmonetary items
USD 401,725 30.500 12,252,602
CNY 97,786 4.600 449,856
THB 210,037 0.920 193,234
KRW 4,089,552 0.027 111,817
Investment accounted for using the equity
method
CNY 687,882 4.600 3,164,533
USD 95,667 30.500 2,917,850
Financial liabilities
Monetary items
USD 36,853 30.500 1,124,026

- 179 -
Sensitivity analysis
The following table details CDIB Capital Group and subsidiaries’ sensitivity to a 1% increase and
decrease in New Taiwan dollars (the functional currency) against the relevant foreign currencies.
The sensitivity analysis included only outstanding foreign currency denominated monetary items,
and adjusts their translation at the end of the reporting period for a 1% change in foreign currency
rates. A positive number below indicates an increase in pre-tax profit associated with the New
Taiwan dollar strengthening 1% against the relevant currency. For a 1% weakening of the New
Taiwan dollar against the relevant currency, there would be an equal and opposite impact on pre-tax
profit, and the balances below would be negative.
Impact on Profit or Loss
For the Six Months Ended
June 30
2019 2018
Monetary items
USD $ 58,112 $ 57,237
HKD 9,900 5,079
CNY 9,740 3,908
KRW 1,904 1,898
JPY 1,197 1,150
2) Interest rate risk
The primary financial assets of CDIB Capital Group and subsidiaries with exposure to interest rates
as of June 30, 2019, December 31, 2018 and June 30, 2018 were cash in banks. Management
believes that interest rate changes would have been no significant effect on CDIB Capital Group
and subsidiaries.
3) Other price risk
CDIB Capital Group and subsidiaries were exposed to equity price risk through its investments in
principal investment business. CDIB Capital Group manages this exposure by setting risk
acceptance limitation concerning industry, country, affiliated groups, and the same group.
If equity prices had been 1% higher/lower, the post-tax income for the six months ended June 30,
2019 and 2018 would increase/decrease by $186,338 thousand and $231,972 thousand, respectively
as a result of the changes in fair value of financial assets at fair value through profit or loss.
China Life Insurance
1) Market risk analysis
Market risk refers to financial assets and liabilities due to market risk factors volatility, making the
change of the value to cause the risk of loss.
China Life Insurance has built value at risk (VaR) model. All financial assets involve market risks
regularly monitor by risk management system and calculate the VaR. Risk control indices are
notional amount and VaR. It will issue risk management reports and execute routine control and
process when over limit. We also report VaR, the use of risk limits and the results of backtesting
regularly to the board of directors or risk management committee.

- 180 -
2) Exchange rate risk
China Life Insurance continues to exercise swaps and forward exchange derivative transactions to
hedge the value change risk of holding foreign currencies because of changes in exchange rates in
accordance with relevant laws and internal control requirements to use the control mechanism to
control this risk.
China Life Insurance’s exchange rate risk is primarily related to operating activities (the currencies
the income or expense used are not the same as the functional currency of China Life Insurance).
Some of China Life Insurance’s accounts receivable and accounts payable are denoted in the same
foreign currency. Under such circumstances, the similar positions will naturally generate the
hedging effect. Some foreign currency positions use forward exchange contracts to manage foreign
exchange risk. As the foregoing natural hedge and foreign exchange forward do not meet the
requirements of hedge accounting in terms of managing exchange rate risk, hedge accounting is not
adopted.
3) Interest rate risk
Interest rate risk refers to the risk resulting from changes in market interest rates which causes
fluctuations in the fair value of financial instruments. China Life Insurance manages interest rate
risk by combinations of fixed and floating interest rate products. Because they do not meet the
requirements for hedge accounting, hedge accounting is not adopted.
4) Equity price risk
China Life Insurance holds equity securities of listed and unlisted companies, and OTC-traded and
non-OTC traded companies. The price of such equity securities will be affected by uncertainties
about the future value of the underlying investment. Equity securities of non-listed and non-OTC
traded companies fall into available-for-sale category. China Life Insurance diversified its
investment and set investment limits for a single equity security to manage price risk of equity
securities. Portfolio information of equity securities is required to be regularly reported to senior
executives of China Life Insurance. The Board of Directors should authorize the senior executives
to review and approve the equity securities of all investment decisions.
5) Value at risk
Value-at-risk is the maximum loss on the portfolio with a given probability defined as the
confidence level, over a given period of time. China Life Insurance uses 99% VaR to measure the
market risk over the next ten days.
VaR model must be able to reasonably and appropriately measure the maximum potential risk of
financial instruments and investment portfolio. VaR model used to manage risk must perform
model validation and backtesting to show that the model can reasonably and effectively measure the
maximum potential risks of the financial instruments or investment portfolio.
6) Stress testing
China Life Insurance measures and evaluates potential risks of the occurrence of extreme and
abnormal events regularly in addition to Value at Risk models. Stress testing measures the potential
impact on the value of the investment portfolio when extreme fluctuations of financial variables
occur.

- 181 -
China Life Insurance performs stress testing regularly by using “Simple Sensitivity” and “Scenario
Analysis” methods. The test is capable of representing the position loss resulted from the movement
of a specific risk factor under different kinds of historical scenarios:
a) Simple sensitivity
Simple Sensitivity measures the dollar amount change for the portfolio value from the
movement of specific risk factors.
b) Scenario analysis
Scenario Analysis measures the dollar amount changes for the total value of investment
positions if stress scenarios occur. The types of scenario include:
i. Historical scenario:
Adding fluctuating risk factors to a specific historical event, China Life Insurance simulates
what the dollar amount of losses for the current investment portfolio would be in the same
period of time.
ii. Hypothetical scenario:
China Life Insurance makes hypothesis with rational expectations from the extreme market
movements to assess the dollar amount of losses for the investment position by taking into
consideration the movement of relevant risk factors.
Risk management department performs the stress testing with historical and hypothetical
scenarios regularly. China Life Insurance’s risk analysis, early warning, and business
management are in accordance with the stress testing report.
Summary of Factor Sensitivity Analysis
June 30, 2019
Risk Factors Changes (+/-) Changes in
Income
Changes in
Equity
Equity risk (stock index) +1% $ - $ 1,807,722
Interest rate risk (yield curve) +1BP (6,664) (542,097)
Exchange risk (foreign
exchange rate)
+1% (NTD for each
currency appreciates 1%)
(1,810,452) (682,389)
December 31, 2018
Risk Factors Changes (+/-) Changes in
Income
Changes in
Equity
Equity risk (stock index) +1% $ 1,594 $ 1,249,417
Interest rate risk (yield curve) +1BP - (431,567)
Exchange risk (foreign
exchange rate)
+1% (NTD for each
currency appreciates 1%)
(1,596,326) (389,592)

- 182 -
June 30, 2018
Risk Factors Changes (+/-) Changes in
Income
Changes in
Equity
Equity risk (stock index) +1% $ 2,176 $ 1,515,631
Interest rate risk (yield curve) +1BP - (408,893)
Exchange risk (foreign
exchange rate)
+1% (NTD for each
currency appreciates 1%)
(1,574,314) (434,210)
7) China Life Insurance’s foreign currency financial assets and liabilities with significant influence as
of June 30, 2019, December 31, 2018 and June 30, 2018 are as follows:
(In Thousands of Foreign Currencies/New Taiwan Dollars)
June 30, 2019
Foreign
Currency
Exchange Rate
(Dollar)
New Taiwan
Dollar
Financial assets
Monetary items
USD $ 35,033,602 31.0720 $ 1,088,567,169
AUD 3,196,130 21.7970 69,666,044
Non-monetary items
USD 631,360 31.0720 19,617,630
Financial labilities
Monetary items
USD 118,260 31.0720 3,674,575
(In Thousands of Foreign Currencies/New Taiwan Dollars)
December 31, 2018
Foreign
Currency
Exchange Rate
(Dollar)
New Taiwan
Dollar
Financial assets
Monetary items
USD $ 32,439,523 30.7330 $ 996,964,533
Non-monetary items
USD 442,376 30.7330 13,595,540
Financial labilities
Monetary items
USD 15,470 30.7330 475,440

- 183 -
(In Thousands of Foreign Currencies/New Taiwan Dollars)
June 30, 2018
Foreign
Currency
Exchange Rate
(Dollar)
New Taiwan
Dollar
Financial assets
Monetary items
USD $ 30,085,603 30.5000 $ 917,610,903
Non-monetary items
USD 570,144 30.5000 17,389,384
The above information is disclosed based on the carrying amount of the foreign currencies, which
has been translated to functional currency.
e. Transfers of financial assets
KGI Bank and subsidiaries
Transferred financial assets not qualifying for full derecognition
Among daily operations of KGI Bank, most of the transactions of transferred financial assets not
qualifying for full derecognition are debt securities under repurchase agreements. As KGI Bank’s right
to receive cash flows of the financial assets transferred to the counterparties, and reflecting the
obligation to repurchase the transferred financial assets for a fixed price at a future date, the transferred
financial assets cannot be used, sold or pledged in the duration of the transaction. KGI Bank does not
derecognize it entirely because KGI Bank remains exposed to interest rate risk and credit risk on these
pledged instruments.
Related information of financial assets and liabilities not qualifying for full derecognition was listed
below:
June 30, 2019
Category
Carrying
Amount of
Transferred
Financial
Assets
Carrying
Amount of
Related
Financial
Liabilities
Fair Value of
Transferred
Financial
Assets
Fair Value of
Related
Financial
Liabilities
Fair Value of
Net Position
Notes and bonds issued under
repurchase agreements
Financial assets at amortized cost $ 310,720 $ 279,648 $ 310,720 $ 279,648 $ 31,072
Financial assets at FVTPL 18,218,274 17,120,970 18,218,274 17,120,970 1,097,304
Financial assets at FVTOCI 28,224,686 25,809,083 28,224,686 25,809,083 2,415,603
Securities purchased under resell
agreements 511,725 2,423,301 511,725 2,423,301 (1,911,576)
December 31, 2018
Category
Carrying
Amount of
Transferred
Financial
Assets
Carrying
Amount of
Related
Financial
Liabilities
Fair Value of
Transferred
Financial
Assets
Fair Value of
Related
Financial
Liabilities
Fair Value of
Net Position
Notes and bonds issued under
repurchase agreements
Financial assets at amortized cost $ 307,330 $ 291,964 $ 307,330 $ 291,964 $ 15,366
Financial assets at FVTPL 8,359,623 7,844,863 8,359,623 7,844,863 514,760
Financial assets at FVTOCI 55,513,141 52,166,855 55,513,141 52,166,855 3,346,286

- 184 -
June 30, 2018
Category
Carrying
Amount of
Transferred
Financial
Assets
Carrying
Amount of
Related
Financial
Liabilities
Fair Value of
Transferred
Financial
Assets
Fair Value of
Related
Financial
Liabilities
Fair Value of
Net Position
Notes and bonds issued under
repurchase agreements
Financial assets at amortized cost $ 305,000 $ 268,400 $ 305,000 $ 268,400 $ 36,600
Financial assets at FVTPL 4,613,327 4,331,458 4,613,327 4,331,458 281,869
Financial assets at FVTOCI 57,959,850 53,750,242 57,959,850 53,750,242 4,209,608
Securities purchased under resell
agreements 861,809 2,969,374 861,809 2,969,374 (2,107,565)
KGI Securities and subsidiaries
1) Transferred financial assets not qualifying for full derecognition
Among daily operations of KGI Securities and subsidiaries, most of the transactions of transferred
financial assets not qualifying for full derecognition are debt securities held by counterparties as
collateral under repurchase agreements or equity securities lent under securities lending agreements.
As the substance of these transactions is secured borrowing, securities that has transferred to
counterparties during the transaction causes KGI Securities’ right to receive cash flows of the
financial assets transferred to the counterparties; KGI Securities only recognized related liabilities
reflecting the obligation to repurchase the transferred financial assets at a fixed price in the future,
and the transferred financial assets cannot be used, sold or pledged in the duration of the
transaction. KGI Securities does not derecognize it entirely because KGI Securities remains
exposed to interest rate risk, credit risk and market risk on these pledged instruments.
Related information of financial assets and liabilities not qualifying for full derecognition was listed
below:
June 30, 2019
Category
Carrying
Amount of
Transferred
Financial
Assets
Carrying
Amount of
Related
Financial
Liabilities
Fair Value of
Transferred
Financial
Assets
Fair Value of
Related
Financial
Liabilities
Net Position of
Fair Value
Financial assets at FVTPL
Transactions with agreements $ 66,266,662 $ 63,681,039 $ 66,266,662 $ 63,681,039 $ 2,585,623
Transaction - borrowed securities 978,846 1,370,385 978,846 1,370,385 (391,539)
December 31, 2018
Category
Carrying
Amount of
Transferred
Financial
Assets
Carrying
Amount of
Related
Financial
Liabilities
Fair Value of
Transferred
Financial
Assets
Fair Value of
Related
Financial
Liabilities
Net Position of
Fair Value
Financial assets at FVTPL
Transactions with agreements $ 52,973,046 $ 51,217,733 $ 52,973,046 $ 51,217,733 $ 1,755,313
Transaction - borrowed securities 826,971 1,157,759 826,971 1,157,759 (330,788)
June 30, 2018
Category
Carrying
Amount of
Transferred
Financial
Assets
Carrying
Amount of
Related
Financial
Liabilities
Fair Value of
Transferred
Financial
Assets
Fair Value of
Related
Financial
Liabilities
Net Position of
Fair Value
Financial assets at FVTPL
Transactions with agreements $ 78,128,231 $ 76,938,259 $ 78,128,231 $ 76,938,259 $ 1,189,972
Transaction - borrowed securities 1,299,609 1,819,453 1,299,609 1,819,453 (519,844)

- 185 -
2) Transferred financial assets qualifying for full derecognition
KGI Securities uses convertible bonds acquired by an underwriter or dealer as the trading object of
the asset swap transaction, then KGI Securities receives consideration by selling it, and exchange
interests arise from convertible bonds for compensation interests according to the contracts, and has
the right to redeem the bonds at any time before the maturity date. KGI Securities does not retain
the control over the transferred assets and derecognizes them since counterparties have the ability to
sell financial assets to third party and no restrictions will be made to counterparties. KGI Securities
still retain the call option of the object, and the maximum exposure of the loss is the book value of
the pledged instruments. Related information of transferred financial assets and liabilities qualifying
for full derecognition are as follows:
Period
Types of
Continuing
Involvement
Outflows of
Repurchased
Transferred
(Derecognized)
Financial
Assets
Book Value of
Continuing
Involvement in
the Balance
Sheet
Fair Value of
Continuing Involvement Maximum of
Loss Exposure
Financial
Assets at
FVTPL
Assets Liabilities
June 30, 2019 Call option $ 11,807,100 $ 966,909 $ 966,909 $ - $ 966,909
December 31, 2018 Call option $ 11,074,500 $ 654,271 $ 654,271 $ - $ 654,271
June 30, 2018 Call option $ 11,765,800 $ 1,139,715 $ 1,139,715 $ - $ 1,139,715
The following table is repurchased transferred financial assets’ undiscounted cash flow maturity
analysis. Information of cash flow is disclosed according to the circumstances of every balance
sheet day.
Period
Types of
Continuing
Involvement
Spot 3 Months 3-12 Months 1-5 Years Over 5 Years Total
June 30, 2019 Call option $ - $ 163,000 $ 3,954,900 $ 7,689,200 $ - $ 11,807,100
December 31, 2018 Call option $ - $ 241,400 $ 1,875,100 $ 8,958,000 $ - $ 11,074,500
June 30, 2018 Call option $ - $ 649,100 $ 2,172,800 $ 8,943,900 $ - $ 11,765,800
The following table shows gains or losses recognized from continuing involvement - call option at
the assets transferred day, continuing involvement of derecognized financial assets until balance
sheet day and revenues and expenses recognized during the period.
Period
Types of
Continuing
Involvement
Gains or Losses
Recognized at
Balance Sheet
Day
Revenues or
Expenses
Recognized from
Continuing
Involvement of
Derecognized
Financial Assets
Until Balance
Sheet Day
Revenues or
Expenses
Recognized
During the
Period
June 30, 2019 Call option $ 2,244 $ (165,501) $ (163,256)
December 31, 2018 Call option $ (12,172) $ (357,181) $ (369,353)
June 30, 2018 Call option $ 40 $ (64,020) $ (63,980)

- 186 -
f. Offsetting financial assets and financial liabilities
KGI Bank and subsidiaries
KGI Bank and subsidiaries have enforceable master netting arrangements or similar agreements signed
with counterparty, and the financial assets and financial liabilities can be offset when both sides of the
transaction have decided to, but gross settlements if have not. One can choose net settlement if the other
side of the transaction is in the breach of contract.
Related information of offsetting financial assets and financial liabilities were as follows:
June 30, 2019
Financial Assets Subject to Offsetting, Enforceable Master Netting Arrangements or Similar Agreements
Types of
Financial
Instruments
Gross Amounts
of Recognized
Financial Assets
(a)
Gross Amounts
of Recognized
Financial
Liabilities
Offset in the
Balance Sheet
(b)
Net Amounts of
Financial Assets
Presented in the
Balance Sheet
(c)=(a)-(b)
Amounts not Offset in the
Balance Sheet (d)
Net Amount
(e)=(c)-(d) Financial
Instruments
(Note)
Cash Collateral
Received
Securities
purchased under
resell
agreements $ 18,837,196 $ - $ 18,837,196 $ 18,837,196 $ - $ -
Derivative
instruments 40,483,065 - 40,483,065 5,980,011 1,854,319 32,648,735
Total $ 59,320,261 $ - $ 59,320,261 $ 24,817,207 $ 1,854,319 $ 32,648,735
June 30, 2019
Financial Liabilities Subject to Offsetting, Enforceable Master Netting Arrangements or Similar Agreements
Types of
Financial
Instruments
Gross Amounts
of Recognized
Financial
Liabilities
(a)
Gross Amounts
of Recognized
Financial Assets
Offset in the
Balance Sheet
(b)
Net Amounts of
Financial
Liabilities
Presented in the
Balance Sheet
(c)=(a)-(b)
Amounts not Offset in the
Balance Sheet (d)
Net Amount
(e)=(c)-(d) Financial
Instruments
(Note)
Cash Collateral
Received
Notes and bonds
issued under
repurchase
agreements $ 45,633,002 $ - $ 45,633,002 $ 45,606,591 $ 26,411 $ -
Derivative
instruments 52,429,554 - 52,429,554 5,980,011 3,314,830 43,134,713
Total $ 98,062,556 $ - $ 98,062,556 $ 51,586,602 $ 3,341,241 $ 43,134,713
December 31, 2018
Financial Assets Subject to Offsetting, Enforceable Master Netting Arrangements or Similar Agreements
Types of
Financial
Instruments
Gross Amounts
of Recognized
Financial Assets
(a)
Gross Amounts
of Recognized
Financial
Liabilities
Offset in the
Balance Sheet
(b)
Net Amounts of
Financial Assets
Presented in the
Balance Sheet
(c)=(a)-(b)
Amounts not Offset in the
Balance Sheet (d)
Net Amount
(e)=(c)-(d) Financial
Instruments
(Note)
Cash Collateral
Received
Securities
purchased under
resell
agreements $ 15,164,692 $ - $ 15,164,692 $ 15,164,692 $ - $ -
Derivative
financial
instruments 23,860,387 - 23,860,387 7,962,286 2,407,631 13,490,470
Total $ 39,025,079 $ - $ 39,025,079 $ 23,126,978 $ 2,407,631 $ 13,490,470

- 187 -
December 31, 2018
Financial Liabilities Subject to Offsetting, Enforceable Master Netting Arrangements or Similar Agreements
Types of
Financial
Instruments
Gross Amounts
of Recognized
Financial
Liabilities
(a)
Gross Amounts
of Recognized
Financial Assets
Offset in the
Balance Sheet
(b)
Net Amounts of
Financial
Liabilities
Presented in the
Balance Sheet
(c)=(a)-(b)
Amounts not Offset in the
Balance Sheet (d)
Net Amount
(e)=(c)-(d) Financial
Instruments
(Note)
Cash Collateral
Received
Notes and bonds
issued under
repurchase
agreements $ 60,303,682 $ - $ 60,303,682 $ 59,626,359 $ 677,323 $ -
Derivative
instruments 44,819,970 - 44,819,970 7,962,286 11,014,447 25,843,237
Total $ 105,123,652 $ - $ 105,123,652 $ 67,588,645 $ 11,691,770 $ 25,843,237
June 30, 2018
Financial Assets Subject to Offsetting, Enforceable Master Netting Arrangements or Similar Agreements
Types of
Financial
Instruments
Gross Amounts
of Recognized
Financial Assets
(a)
Gross Amounts
of Recognized
Financial
Liabilities
Offset in the
Balance Sheet
(b)
Net Amounts of
Financial Assets
Presented in the
Balance Sheet
(c)=(a)-(b)
Amounts not Offset in the
Balance Sheet (d)
Net Amount
(e)=(c)-(d) Financial
Instruments
(Note)
Cash Collateral
Received
Securities
purchased under
resell
agreements $ 21,240,195 $ - $ 21,240,195 $ 21,240,195 $ - $ -
Derivative
instruments 44,122,953 - 44,122,953 11,878,176 4,011,578 28,233,199
Total $ 65,363,148 $ - $ 65,363,148 $ 33,118,371 $ 4,011,578 $ 28,233,199
June 30, 2018
Financial Liabilities Subject to Offsetting, Enforceable Master Netting Arrangements or Similar Agreements
Types of
Financial
Instruments
Gross Amounts
of Recognized
Financial
Liabilities
(a)
Gross Amounts
of Recognized
Financial Assets
Offset in the
Balance Sheet
(b)
Net Amounts of
Financial
Liabilities
Presented in the
Balance Sheet
(c)=(a)-(b)
Amounts not Offset in the
Balance Sheet (d)
Net Amount
(e)=(c)-(d) Financial
Instruments
(Note)
Cash Collateral
Received
Notes and bonds
issued under
repurchase
agreements $ 61,319,474 $ - $ 61,319,474 $ 61,097,592 $ 221,882 $ -
Derivative
instruments 62,844,972 - 62,844,972 11,878,176 14,250,669 36,716,127
Total $ 124,164,446 $ - $ 124,164,446 $ 72,975,768 $ 14,472,551 $ 36,716,127
Note: Financial instruments include master netting arrangements and non-cash collateral.
KGI Securities and subsidiaries
KGI Securities and subsidiaries’ transactions of derivative assets and liabilities do not correspond to the
provisions of IAS, only in the circumstances of default, insolvency or bankruptcy will KGI Securities
have the rights to offset derivative assets and liabilities.

- 188 -
KGI Securities has signed securities repurchase contracts with counterparties, and the agreements
stating that KGI Securities to provide securities as collateral, meanwhile KGI Securities signed
securities resell contracts with counterparties and receive securities as collateral which do not
recognized in the balance sheet. Such contracts do not correspond to the provisions of IAS and bear the
right to offset only in the circumstances of default, insolvency or bankruptcy, therefore, related
securities sell with repurchase agreements and securities purchased with resell agreement are presented
in the balance sheet respectively.
Related information of offsetting financial assets and financial liabilities were as follows:
June 30, 2019
Financial Assets Subject to Offsetting, Enforceable Master Netting Arrangements or Similar Agreements
Types of
Financial
Instruments
Gross Amounts
of Recognized
Financial Assets
(a)
Gross Amounts
of Recognized
Financial
Liabilities
Offset in the
Balance Sheet
(b)
Net Amounts of
Financial Assets
Presented in the
Balance Sheet
(c)=(a)-(b)
Amounts not Offset in the
Balance Sheet (d)
Net Amount
(e)=(c)-(d) Financial
Instruments
(Note)
Cash Collateral
Received
Derivative
instruments $ 2,853,510 $ - $ 2,853,510 $ - $ 511,812 $ 2,341,698
Securities
purchased under
resell
agreements 22,848,839 - 22,848,839 22,848,839 - -
Total $ 25,702,349 $ - $ 25,702,349 $ 22,848,839 $ 511,812 $ 2,341,698
June 30, 2019
Financial Liabilities Subject to Offsetting, Enforceable Master Netting Arrangements or Similar Agreements
Types of
Financial
Instruments
Gross Amounts
of Recognized
Financial
Liabilities
(a)
Gross Amounts
of Recognized
Financial Assets
Offset in the
Balance Sheet
(b)
Net Amounts of
Financial
Liabilities
Presented in the
Balance Sheet
(c)=(a)-(b)
Amounts not Offset in the
Balance Sheet (d)
Net Amount
(e)=(c)-(d) Financial
Instruments
(Note)
Cash Collateral
Received
Derivative
instruments $ 4,172,152 $ - $ 4,172,152 $ - $ 1,102,055 $ 3,070,097
Notes and bonds
issued under
repurchase
agreements 75,686,106 - 75,686,106 75,686,106 - -
Total $ 79,858,258 $ - $ 79,858,258 $ 75,686,106 $ 1,102,055 $ 3,070,097
December 31, 2018
Financial Assets Subject to Offsetting, Enforceable Master Netting Arrangements or Similar Agreements
Types of
Financial
Instruments
Gross Amounts
of Recognized
Financial Assets
(a)
Gross Amounts
of Recognized
Financial
Liabilities
Offset in the
Balance Sheet
(b)
Net Amounts of
Financial Assets
Presented in the
Balance Sheet
(c)=(a)-(b)
Amounts not Offset in the
Balance Sheet (d)
Net Amount
(e)=(c)-(d) Financial
Instruments
(Note)
Cash Collateral
Received
Derivative
instruments $ 2,164,742 $ - $ 2,164,742 $ - $ 435,743 $ 1,728,999
Securities
purchased under
resell
agreements 19,448,822 - 19,448,822 19,448,822 - -
Total $ 21,613,564 $ - $ 21,613,564 $ 19,448,822 $ 435,743 $ 1,728,999

- 189 -
December 31, 2018
Financial Liabilities Subject to Offsetting, Enforceable Master Netting Arrangements or Similar Agreements
Types of
Financial
Instruments
Gross Amounts
of Recognized
Financial
Liabilities
(a)
Gross Amounts
of Recognized
Financial Assets
Offset in the
Balance Sheet
(b)
Net Amounts of
Financial
Liabilities
Presented in the
Balance Sheet
(c)=(a)-(b)
Amounts not Offset in the
Balance Sheet (d)
Net Amount
(e)=(c)-(d) Financial
Instruments
(Note)
Cash Collateral
Received
Derivative
instruments $ 2,899,593 $ - $ 2,899,593 $ - $ 676,921 $ 2,222,672
Notes and bonds
issued under
repurchase
agreements 65,175,218 - 65,175,218 65,175,218 - -
Total $ 68,074,811 $ - $ 68,074,811 $ 65,175,218 $ 676,921 $ 2,222,672
June 30, 2018
Financial Assets Subject to Offsetting, Enforceable Master Netting Arrangements or Similar Agreements
Types of
Financial
Instruments
Gross Amounts
of Recognized
Financial Assets
(a)
Gross Amounts
of Recognized
Financial
Liabilities
Offset in the
Balance Sheet
(b)
Net Amounts of
Financial Assets
Presented in the
Balance Sheet
(c)=(a)-(b)
Amounts not Offset in the
Balance Sheet (d)
Net Amount
(e)=(c)-(d) Financial
Instruments
(Note)
Cash Collateral
Received
Derivative
instruments $ 2,697,084 $ - $ 2,697,084 $ - $ 269,231 $ 2,427,853
Securities
purchased under
resell
agreements 31,650,368 - 31,650,368 31,650,368 - -
Total $ 34,347,452 $ - $ 34,347,452 $ 31,650,368 $ 269,231 $ 2,427,853
June 30, 2018
Financial Liabilities Subject to Offsetting, Enforceable Master Netting Arrangements or Similar Agreements
Types of
Financial
Instruments
Gross Amounts
of Recognized
Financial
Liabilities
(a)
Gross Amounts
of Recognized
Financial Assets
Offset in the
Balance Sheet
(b)
Net Amounts of
Financial
Liabilities
Presented in the
Balance Sheet
(c)=(a)-(b)
Amounts not Offset in the
Balance Sheet (d)
Net Amount
(e)=(c)-(d) Financial
Instruments
(Note)
Cash Collateral
Received
Derivative
instruments $ 5,600,532 $ - $ 5,600,532 $ - $ 733,130 $ 4,867,402
Notes and bonds
issued under
repurchase
agreements 76,938,259 - 76,938,259 76,938,259 - -
Total $ 82,538,791 $ - $ 82,538,791 $ 76,938,259 $ 733,130 $ 4,867,402
Note: Financial instruments include master netting arrangements and non-cash collateral.
China Life Insurance
China Life Insurance holds financial instruments in accordance with paragraph 42 of IAS 32 recognized
by the FSC and the related assets and liabilities are offset on the balance sheet.
China Life Insurance may perform transactions not meeting the requirements of offsetting, but has
enforceable master netting arrangement or other similar agreements with the counterparties. When both
parties agree to settle in net amount, financial assets and financial liabilities could be offset and settled
in net amount, and if not, in total amount. However, if any party in the transaction defaults, the other
party can choose net settlement.

- 190 -
Related information about above offsetting financial assets and financial liabilities are as follows:
June 30, 2019
Financial Assets Subject to Offsetting, Enforceable Master Netting Arrangements or Similar Agreements
Types of
Financial
Instruments
Gross Amounts
of Recognized
Financial Assets
(a)
Gross Amounts
of Recognized
Financial
Liabilities
Offset in the
Balance Sheet
(b)
Net Amounts of
Financial Assets
Presented in the
Balance Sheet
(c)=(a)-(b)
Amounts not Offset in the
Balance Sheet (d)
Net Amount
(e)=(c)-(d) Financial
Instruments
Cash Collateral
Received
Derivative
financial
instruments $ 3,549,581 $ - $ 3,549,581 $ 3,017,918 $ 199,172 $ 332,491
June 30, 2019
Financial Liabilities Subject to Offsetting, Enforceable Master Netting Arrangements or Similar Agreements
Types of
Financial
Instruments
Gross Amounts
of Recognized
Financial
Liabilities
(a)
Gross Amounts
of Recognized
Financial Assets
Offset in the
Balance Sheet
(b)
Net Amounts of
Financial
Liabilities
Presented in the
Balance Sheet
(c)=(a)-(b)
Amounts not Offset in the
Balance Sheet (d)
Net Amount
(e)=(c)-(d) Financial
Instruments
Cash Collateral
Received
Derivative
financial
instruments $ 6,011,132 $ - $ 6,011,132 $ 3,017,918 $ 1,470,016 $ 1,523,198
December 31, 2018
Financial Assets Subject to Offsetting, Enforceable Master Netting Arrangements or Similar Agreements
Types of
Financial
Instruments
Gross Amounts
of Recognized
Financial Assets
(a)
Gross Amounts
of Recognized
Financial
Liabilities
Offset in the
Balance Sheet
(b)
Net Amounts of
Financial Assets
Presented in the
Balance Sheet
(c)=(a)-(b)
Amounts not Offset in the
Balance Sheet (d)
Net Amount
(e)=(c)-(d) Financial
Instruments
Cash Collateral
Received
Derivative
financial
instruments $ 3,132,902 $ - $ 3,132,902 $ 1,543,353 $ 83,901 $ 1,505,648
December 31, 2018
Financial Liabilities Subject to Offsetting, Enforceable Master Netting Arrangements or Similar Agreements
Types of
Financial
Instruments
Gross Amounts
of Recognized
Financial
Liabilities
(a)
Gross Amounts
of Recognized
Financial Assets
Offset in the
Balance Sheet
(b)
Net Amounts of
Financial
Liabilities
Presented in the
Balance Sheet
(c)=(a)-(b)
Amounts not Offset in the
Balance Sheet (d)
Net Amount
(e)=(c)-(d) Financial
Instruments
Cash Collateral
Received
Derivative
financial
instruments $ 2,469,127 $ - $ 2,469,127 $ 1,543,353 $ 503,714 $ 422,060
June 30, 2018
Financial Assets Subject to Offsetting, Enforceable Master Netting Arrangements or Similar Agreements
Types of
Financial
Instruments
Gross Amounts
of Recognized
Financial Assets
(a)
Gross Amounts
of Recognized
Financial
Liabilities
Offset in the
Balance Sheet
(b)
Net Amounts of
Financial Assets
Presented in the
Balance Sheet
(c)=(a)-(b)
Amounts not Offset in the
Balance Sheet (d)
Net Amount
(e)=(c)-(d) Financial
Instruments
Cash Collateral
Received
Derivative
financial
instruments $ 2,074,324 $ - $ 2,074,324 $ 2,074,324 $ - $ -

- 191 -
June 30, 2018
Financial Liabilities Subject to Offsetting, Enforceable Master Netting Arrangements or Similar Agreements
Types of
Financial
Instruments
Gross Amounts
of Recognized
Financial
Liabilities
(a)
Gross Amounts
of Recognized
Financial Assets
Offset in the
Balance Sheet
(b)
Net Amounts of
Financial
Liabilities
Presented in the
Balance Sheet
(c)=(a)-(b)
Amounts not Offset in the
Balance Sheet (d)
Net Amount
(e)=(c)-(d) Financial
Instruments
Cash Collateral
Received
Derivative
financial
instruments $ 19,407,405 $ - $ 19,407,405 $ 2,074,324 $ 7,300,480 $ 10,032,601
57. CAPITAL MANAGEMENT
a. Objective
The basic management objective includes eligible capital to meet the requirements of the regulation and
achieve the minimum capital adequacy ratio so as to control all risks within the risk appetite. In order to
undertake all kinds of risk, the Group conducts risk management based on the risk portfolio and the
assessment of risk characteristics to design the best capital allocation.
b. Capital management procedures
The Group had met the authorities’ minimum requirements for capital adequacy ratio and reported to
the authority quarterly. Eligible capital and legal capital were calculated according to the “Regulations
Governing the Capital Adequacy and Capital Category of Banks”.
c. Group’s capital adequacy ratio (CAR)
(In Thousands of New Taiwan Dollars; %)
Items
Company
June 30, 2019
% of
Ownership
Group’s Eligible
Capital
Group’s Legal
Capital Demand
The Corporation $ 191,398,360 $ 207,991,357
KGI Bank 100.00 70,928,159 52,482,499
KGI Securities 100.00 21,253,701 9,918,503
CDIB Capital Group 100.00 43,626,045 22,614,361
China Development Asset Management
Corp.
100.00 2,347,960 1,587,603
China Life Insurance 34.82 36,759,856 23,081,294
Deduct items 232,713,095 207,716,054
Subtotal 133,600,986 (A) 109,959,563 (B)
Group’s CAR (C)=(A)÷(B) 121.50 (C)

- 192 -
(In Thousands of New Taiwan Dollars; %)
Items
Company
December 31, 2018
% of
Ownership
Group’s Eligible
Capital
Group’s Legal
Capital Demand
The Corporation $ 169,227,317 $ 186,836,128
KGI Bank 100.00 63,912,516 47,125,976
KGI Securities 100.00 19,780,482 9,081,894
CDIB Capital Group 100.00 47,686,090 24,636,062
China Development Asset Management
Corp.
100.00 2,358,918 1,595,846
China Life Insurance 34.96 28,048,402 20,653,219
Deduct items 211,244,920 185,756,820
Subtotal 119,768,805 (A) 104,172,305 (B)
Group’s CAR (C)=(A)÷(B) 114.97 (C)
(In Thousands of New Taiwan Dollars; %)
Items
Company
June 30, 2018
% of
Ownership
Group’s Eligible
Capital
Group’s Legal
Capital Demand
The Corporation $ 170,707,555 $ 193,605,324
CDIB Capital Group 100.00 52,855,994 27,225,190
KGI Securities 100.00 18,647,668 10,877,916
KGI Bank 100.00 56,446,776 48,073,731
China Development Asset Management
Corp.
100.00 2,367,811 1,594,747
China Life Insurance 34.96 30,001,038 19,803,280
Deduct items 218,246,941 191,843,073
Subtotal 112,779,901 (A) 109,337,115 (B)
Group’s CAR (C)=(A)÷(B) 103.15 (C)
d. Financial holding companies’ net eligible capital
(In Thousands of New Taiwan Dollars)
June 30,
2019
December 31,
2018
June 30,
2018
Common stock $ 149,659,821 $ 149,622,812 $ 149,572,949
Capital instruments that comply with Tier 1
capital requirement - - -
Other preferred stock and subordinated bonds 10,000,000 10,000,000 10,000,000
Reserve for raising capital - 10,748 -
Capital surplus 883,080 1,630,992 1,240,569
Legal reserve 7,561,404 6,776,135 6,776,135
Special reserve 10,797,899 565,041 565,041
Retained earnings 8,004,636 14,754,530 12,923,727
Equity adjustment 7,875,127 (10,522,131) (6,505,421)
Deduction: Capital items (3,383,607) (3,610,810) (3,865,445)
$ 191,398,360 $ 169,227,317 $ 170,707,555

- 193 -
The Group’s CARs were 121.50%, 114.97% and 103.15% as of June 30, 2019, December 31, 2018 and
June 30, 2018, respectively. Since the Financial Holding Company Act and related regulations require
that the Group’s CAR should be at least 100%, and the Group’s CARs met its requirement.
58. TRUST BUSINESS OPERATIONS UNDER THE TRUST ENTERPRISES ACT
a. The balance sheets and income statements of the trust accounts and trust property accounts of KGI
Bank were as follows:
Balance Sheets of Trust Accounts
(In Thousands of New Taiwan Dollars)
Trust Assets
June 30,
2019
December 31,
2018
June 30,
2018 Trust Liabilities
June 30,
2019
December 31,
2018
June 30,
2018
Bank deposits $ 1,008,955 $ 585,926 $ 806,202 Payables $ 149,782 $ 151,212 $ 150,401
Short-term investments 27,998,568 28,539,061 29,716,127 Payables on securities under
Financial assets at FVTPL custody 3,683,987 4,839,320 8,072,287
Receivables 10,440 11,640 11,640 Other liabilities 87,351 57,865 70,815
Other financial assets 38,826 50,719 63,819 Donated assets received 1,811 1,811 1,811
Real estate, net 16,450 16,450 10,450 Trust capital 30,024,113 29,835,976 31,235,451
Intangible assets - surface 843,343 534,259 534,259 Accumulated earnings 680,723 675,725 672,794
right 984,534 984,534 984,534
Securities under custody 3,683,987 4,839,320 8,072,287
Other assets 42,664 - 4,241
Total $ 34,627,767 $ 35,561,909 $ 40,203,559 Total $ 34,627,767 $ 35,561,909 $ 40,203,559
Income Statements of Trust Accounts
(In Thousands of New Taiwan Dollars)
For the Three Months Ended
June 30
For the Six Months Ended
June 30
2019 2018 2019 2018
Trust income and gains
Dividend income $ 614 $ 1,200 $ 1,945 $ 1,901
Interest income 363,441 364,662 706,443 728,989
Rental income 6,986 7,090 14,105 14,185
Gain on financial assets at
FVTPL, net - (44,327) - -
Properties transaction gains - (41,818) - -
Other income 2,106 7,670 3,922 10,031
Total trust income and gains 373,147 294,477 726,415 755,106
Trust expenses
Properties transaction losses (1,320,252) (139,262) (1,471,210) (139,262)
Administrative expenses (15,147) (8,552) (21,794) (19,072)
Interest expenses - (1,453) - (1,453)
Loss on financial assets at
FVTPL, net - (3,753) - (3,753)
Other expenses (2,212) (1,263) (4,761) (3,841)
Total trust expenses (1,337,611) (154,283) (1,497,765) (167,381)
Net income $ (964,464) $ 140,194 $ (771,350) $ 587,725

- 194 -
The above income from trust operations were excluded from KGI Bank’s income.
Trust Property Accounts
(In Thousands of New Taiwan Dollars)
Investment Portfolio
June 30,
2019
December 31,
2018
June 30,
2018
Bank deposits $ 1,008,955 $ 585,926 $ 806,202
Short-term investments
Funds 26,318,473 26,786,220 28,119,632
Bonds 1,390,577 1,410,880 1,264,727
Common shares 73,200 73,200 75,900
Structured notes 93,766 93,766 93,766
ETF 122,552 174,995 162,102
Financial assets at FVTPL 10,440 11,640 11,640
Other financial assets 55,276 67,169 74,269
Real estate, net 843,343 534,259 534,259
Intangible assets - surface right 984,534 984,534 984,534
Securities under custody 3,683,987 4,839,320 8,072,287
Other assets 42,664 - 4,241
Total $ 34,627,767 $ 35,561,909 $ 40,203,559
b. The balance sheets and income statements of the trust accounts and trust property accounts of KGI
Securities were as follows:
Balance Sheets of Trust Accounts
(In Thousands of New Taiwan Dollars)
Trust Assets
June 30,
2019
December 31,
2018
June 30,
2018 Trust Liabilities
June 30,
2019
December 31,
2018
June 30,
2018
Bank deposits $ 1,183,876 $ 1,043,226 $ 1,908,252 Payables $ 29,276 $ 11,274 $ 19,847
Financial assets 22,724,467 21,051,505 23,514,841 Trust capital 21,952,916 21,967,226 23,730,428
Receivables 167,410 33,903 223,514 Reserves and retained
earnings 2,093,561 150,134 1,896,332
Total $ 24,075,753 $ 22,128,634 $ 25,646,607 Total $ 24,075,753 $ 22,128,634 $ 25,646,607
Income Statements of Trust Accounts
(In Thousands of New Taiwan Dollars)
For the Three Months Ended
June 30
For the Six Months Ended
June 30
2019 2018 2019 2018
Trust income $ 264,470 $ (158,623) $ 2,186,182 $ 2,569,391
Trust expenses 137,539 (412,046) (2,110,785) (2,286,091)
Income before income tax 402,009 (570,669) 75,397 283,300
Income tax expenses - - - -
Income after income tax $ 402,009 $ (570,669) $ 75,397 $ 283,300
The above income from trust operations were excluded from KGI Securities’ income.

- 195 -
Trust Property Accounts
(In Thousands of New Taiwan Dollars)
Investment Portfolio
June 30,
2019
December 31,
2018
June 30,
2018
Bank deposits $ 1,183,876 $ 1,043,226 $ 1,908,252
Stocks 9,928,836 10,733,485 12,956,211
Funds 11,275,685 9,350,380 9,814,029
Structured notes 1,309,590 957,456 744,601
Bonds 210,356 10,184 -
Total $ 23,908,343 $ 22,094,731 $ 25,423,093
59. DISCLOSURE REQUIRED UNDER ARTICLE 46 OF THE FINANCIAL HOLDING COMPANY
ACT
Please refer to Table 9 (attached).
60. CONDENSED INDIVIDUAL BALANCE SHEETS AND STATEMENTS OF COMPREHENSIVE
INCOME OF GROUP
Please refer to Table 10 (attached).
61. ALLOCATION OF REVENUE, COST AND EXPENSE RESULTING FROM COOPERATION
AND RESOURCES SHARING IN THE GROUP
a. Business or trading behaviors
Please refer to Note 48 for related-party transactions.
b. Integrate business activities
The Corporation has become a full-functioning financial platform for its customers by improving the
overall business performance of the company through integrating the insurance, investment, trust
custody and channel of banking, securities and life insurance.
c. Cross utilization of information or locations and business utilities
In compliance with Article 43 of “Financial Holding Companies Act”, “Financial Holding Subsidiaries
Cross-selling Activities Acts”, “Self-disciplinary Standards” and other related regulations from FSC,
the Corporation has advocated cross-selling activities among China development Financial Holdings
and its Subsidiaries. In addition, the Corporation and its subsidiaries which joined the cross selling
business disclosure protection measures of customer information on official website
(http://www.cdibh.com/chhtml/content/1513) to limit the use of the data, secure the customer
information and related rights when handling cross-selling activities.
d. Allocation of revenues, costs, expenses, profits and losses
Revenue, costs, expenses, profits or losses arising from integrated business activities among
subsidiaries are allocated to each subsidiary based on the related business features or other reasonable
allocation methods.

- 196 -
62. CONTINGENCIES AND COMMITMENTS, DISASTER DAMAGES AND SUBSEQUENT
EVENTS OF SUBSIDIARIES
Please refer to Note 50 to the consolidated financial statements. Information on disaster damages: None.
63. SUBSIDIARIES’ ASSET QUALITY, MANAGEMENT, PROFITABILITY, LIQUIDITY AND
SENSITIVITY TO MARKET RISK
Please refer to Notes 53 and 56 to the consolidated financial statements.
64. SPECIFIC RISK FROM FUTURES DEALING
The futures dealer needs to maintain adequate liquidity in case of its clients fail to fulfill the contracts in the
futures transactions with the features of low financial leverage nature and unpredictable market fluctuation.
If the dealing business fails to maintain the amount of margin, the open contracts may be closed. Thus, the
margin may be lost entirely and may require further payment of deficiency.
65. FINANCIAL RATIOS OF FUTURES-DEALING SUBSIDIARIES
The following financial ratios of KGI Securities’ futures department and KGI Futures Corp. are in
compliance with the requirements of the Rules Governing Futures Commission Merchants.
a. KGI Securities’ futures department
Rule June 30, 2019 December 31, 2018 June 30, 2018 Meet
No. Formula Formula % Formula % Formula % Standard Standard
17 Equities
Total liabilities minus
customers’ equity accounts
$1,687,853
$155,473
=10.86
$1,791,507
$413,737
=4.33
$1,716,176
$449,917
=3.81
≧1 Yes
17 Current assets
Current liabilities
$2,008,929
$155,444
=12.92
$2,330,195
$412,737
=5.65
$2,445,196
$449,917
=5.43
≧1 Yes
22 Equities
Capital stock
$1,687,853
$400,000
=421.96%
$1,791,507
$400,000
=447.88%
$1,716,176
$400,000
=429.04%
≧60%
≧40% Yes
22 Adjusted net capital
Client and proprietary account
$1,379,847
$215,898
=639.12% $1,091,064
$244,118
=446.94%
$1,065,792
$418,752
=254.52%
≧20%
≧15% Yes
b. KGI Futures Corp.
Rule June 30, 2019 December 31, 2018 June 30, 2018 Meet
No. Formula Formula % Formula % Formula % Standard Standard
17 Equities
Total liabilities minus
customers’ equity accounts
$3,340,226
$371,112
=9.00
$3,416,097
$387,747
=8.81
$3,073,512
$284,771
=10.79
≧1 Yes
17 Current assets
Current liabilities
$27,533,781
$25,518,186 =1.08
$24,284,147
$22,117,410 =1.10
$24,808,517
$22,968,371 =1.08 ≧1 Yes
22 Equities
Capital stock
$3,340,226
$760,000 =439.50%
$3,416,097
$760,000 =449.49%
$3,073,512
$760,000 =404.41%
≧60%
≧40% Yes
22 Adjusted net capital
Client and proprietary account
$2,717,198
$7,030,491 =38.65%
$3,005,408
$5,059,084 =59.41%
$2,511,996
$6,085,511 =41.28%
≧20%
≧15% Yes

- 197 -
66. DISCLOSURES REQUIRED UNDER RULE NO. 10703209011 ISSUED BY THE FINANCIAL
SUPERVISORY COMMISSION
KGI’s investments in foreign enterprises are registered in a country whose securities and futures market
regulators are not members of the International Organization of Securities Commissions (IOSCO), and
these companies have no Multilateral Memorandum of Understanding (MMOU) members or didn’t get the
securities or futures licenses signed by the IOSCO. Thus, KGI disclose their foreign investees’ business
conditions and information on related-party transactions as follows:
a. Securities held:
Richpoint Company Limited.
(In U.S. Dollars)
Number of
Shares
Carrying
Amount
Financial assets at FVTPL - non-current
Dragon Investment Fund I Co. 4,375,142 $ 181,581
He Ding Venture Capital Investment Corporation 295,000 48,975
Lien Ding Venture Capital Investment Corporation 210,000 66,669
$ 297,225
b. Derivative instruments and related capital resources:
KGI Asia (Holdings) Pte. Ltd.
(In U.S. Dollars)
Type of derivative
Capital
Resources
Nominal
Amount Carrying Value
Foreign exchange Borrowing $ 26,651,931 $ (398,854)
c. Asset management revenues, service and litigation matters: Note 50(c).
d. Balance sheet: Tables 13-1 to 13-4 (attached).
e. Income statement: Tables 14-1 to 14-4 (attached).
f. Related party transactions or dealings among foreign enterprises: None.
67. ADDITIONAL DISCLOSURES
a. and b. following are the additional disclosures required for the Group:
1) Financing provided: Not applicable to the Corporation, KGI Bank and China Life Insurance. For
other subsidiaries’ information: Please refer to Table 1 (attached).
2) Collaterals/guarantees provided: Not applicable to the Corporation, KGI Bank and China Life
Insurance. For other subsidiaries’ information: Please refer to Table 2 (attached).

- 198 -
3) Marketable securities held: Not applicable to the Corporation, KGI Bank, KGI Securities and
subsidiaries and China Life Insurance. For other subsidiaries’ information: Please refer to Table 3
(attached).
4) Marketable securities were acquired and disposed of, at cost or prices of at least NT$300 million or
10% of the issued capital (subsidiaries acquired and disposed of marketable securities, at cost or
price of at least NT$300 million or 10% of the issued capital): For the Corporation, CDIB Capital
Group and KGI Bank and subsidiaries’ information: None. Not applicable to KGI Securities and
subsidiaries and China Life Insurance. Other subsidiaries’ information please refer to Table 4
(attached).
5) Acquisition of individual real estate at cost of at least NT$300 million or 10% of the paid-in capital:
For the Group’s information: None.
6) Disposal of individual real estate at price of at least NT$300 million or 10% of the issued capital:
For the Group’s information: None.
7) Discount on service fees received from related parties amounting to NT$5 million: For the Group’s
information: None.
8) Receivables from related parties amounting to NT$300 million or 10% of the issued capital: Please
refer to Note 48 and Table 5 (attached).
9) Sale of nonperforming loans: Please refer to Table 7 (attached).
10) For related information on the subsidiaries’ securitization products approved under the Regulation
on Financial Asset Securitization: None.
11) Other significant transactions which may affect the decisions of financial statement users: None.
12) The information of investees: Please refer to Table 6 (attached).
13) Derivative transactions of the Group: Please refer to Notes 8, 54 and 56 to the consolidated financial
statements.
c. Investments in mainland China: Please refer to Table 11 (attached).
d. Business relationships and significant transactions among the Group: Please refer to Table 12
(attached).
68. SEGMENT INFORMATION
The reportable segments of the Corporation are Commercial banking, Securities, Venture Capital and
Insurance. Under the Banking Act of the Republic of China and relevant regulations, Commercial banking
engaged in consumer banking, corporate banking and global market and financial institution. Under the
Securities and Exchange Act and relevant regulations, Securities engaged in wealth management business,
trading business and investment banking business. Venture Capital engaged in investment business directly.
Insurance department operates life insurance business based on the provisions of the insurance law.
The accounting policies of the operating segments are the same as the Corporation’s accounting policies
described in Note 4. The Corporation uses income after tax as the measurement for segment profit and the
basis of performance assessment. The net profit and income before income tax are composed of revenues
and expenses directly attributable to an operating segment.

- 199 -
Segment revenues and results
Following were analysis of the Group’s operating revenue and results by reportable segments:
Commercial
Banking Securities Venture Capital Insurance Other Total
For the three months ended June 30, 2019
Interest profit (loss), net $ 1,701,963 $ 337,103 $ 48,030 $ 13,789,442 $ (110,369 ) $ 15,766,169
Noninterest profit (loss), net 1,031,767 3,264,339 1,698,885 37,594,166 (769,523 ) 42,819,634
Net profit (loss) 2,733,730 3,601,442 1,746,915 51,383,608 (879,892 ) 58,585,803
Reversal of allowance (allowance) for bad
debts commitments and losses on
guarantees, net (83,753 ) 422 - 6 - (83,325 )
Net change in insurance liabilities - - - (44,596,173 ) - (44,596,173 )
Operating expenses (1,482,938 ) (2,820,416 ) (441,426 ) (1,404,707 ) (579,284 ) (6,728,771 )
Income (loss) before income tax 1,167,039 781,448 1,305,489 5,382,734 (1,459,176 ) 7,177,534
Income tax benefit (expense) (213,601 ) 157,353 (61,946 ) (494,364 ) 95,299 (517,259 )
Net income (loss) $ 953,438 $ 938,801 $ 1,243,543 $ 4,888,370 $ (1,363,877 ) $ 6,660,275
For the three months ended June 30, 2018
Interest profit (loss), net $ 1,847,658 $ 523,826 $ 35,151 $ 11,657,688 $ (128,802 ) $ 13,935,521
Noninterest profit (loss), net 496,945 3,452,760 1,575,743 42,969,737 (747,557 ) 47,747,628
Net profit (loss) 2,344,603 3,976,586 1,610,894 54,627,425 (876,359 ) 61,683,149
Reversal of allowance (allowance) for bad
debts commitments and losses on
guarantees, net 96,458 (5,415 ) - (5,357 ) - 85,686
Net change in insurance liabilities - - - (50,629,487 ) - (50,629,487 )
Operating expenses (1,413,915 ) (2,969,357 ) (380,716 ) (906,654 ) (505,200 ) (6,175,842 )
Income (loss) before income tax 1,027,146 1,001,814 1,230,178 3,085,927 (1,381,559 ) 4,963,506
Income tax expense (160,085 ) (165,416 ) (81,174 ) (399,309 ) (227,984 ) (1,033,968 )
Net income (loss) $ 867,061 $ 836,398 $ 1,149,004 $ 2,686,618 $ (1,609,543 ) $ 3,929,538
For the six months ended June 30, 2019
Interest profit (loss), net $ 3,378,065 $ 644,009 $ 105,992 $ 26,928,880 $ (223,615 ) $ 30,833,331
Noninterest profit (loss), net 1,946,638 6,945,900 3,226,933 84,815,513 (1,507,486 ) 95,427,498
Net profit (loss) 5,324,703 7,589,909 3,332,925 111,744,393 (1,731,101 ) 126,260,829
Reversal of allowance (allowance) for bad
debts commitments and losses on
guarantees, net (82,182 ) 3,853 - 72 675 (77,582 )
Net change in insurance liabilities - - - (100,495,491 ) - (100,495,491 )
Operating expenses (2,957,117 ) (5,584,749 ) (803,743 ) (2,560,528 ) (1,135,101 ) (13,041,238 )
Income (loss) before income tax 2,285,404 2,009,013 2,529,182 8,688,446 (2,865,527 ) 12,646,518
Income tax benefit (expense) (418,877 ) 98,936 (91,088 ) (895,265 ) 256,112 (1,050,182 )
Net income (loss) $ 1,866,527 $ 2,107,949 $ 2,438,094 $ 7,793,181 $ (2,609,415 ) $ 11,596,336
For the six months ended June 30, 2018
Interest profit (loss), net $ 3,647,061 $ 1,034,056 $ 71,348 $ 22,388,865 $ (260,931 ) $ 26,880,399
Noninterest profit (loss), net 946,767 6,763,452 3,245,307 83,101,747 (1,298,390 ) 92,758,883
Net profit (loss) 4,593,828 7,797,508 3,316,655 105,490,612 (1,559,321 ) 119,639,282
Allowance for bad debts commitments
and losses on guarantees, net (67,234 ) (100,212 ) - (7,090 ) - (174,536 )
Net change in insurance liabilities - - - (97,233,107 ) - (97,233,107 )
Operating expenses (2,814,004 ) (5,932,373 ) (728,761 ) (2,304,271 ) (1,071,676 ) (12,851,085 )
Income (loss) before income tax 1,712,590 1,764,923 2,587,894 5,946,144 (2,630,997 ) 9,380,554
Income tax benefit (expense) (125,703 ) (357,111 ) (145,097 ) 556,775 (101,888 ) (173,024 )
Net income (loss) $ 1,586,887 $ 1,407,812 $ 2,442,797 $ 6,502,919 $ (2,732,885 ) $ 9,207,530

- 200 -
TABLE 1
CHINA DEVELOPMENT FINANCIAL HOLDING CORPORATION AND SUBSIDIARIES
FINANCINGS PROVIDED
FOR THE SIX MONTHS ENDED JUNE 30, 2019
(In Thousands of New Taiwan Dollars)
No. Financier Counter-party Financial
Statement Account
Related-
party
Maximum
Balance for the
Period
Ending Balance Actual Amount
Drawn Down
Interest
Rate
Nature of
Financing Provided
Transaction
Amount Financing Reasons
Allowance for
Bad Debt
Collateral Financial
Limit for Each
Borrowing
Company
Limit on
Financier’s
Total Financing Item Value
1 Richpoint Company Limited KG Investments Holdings Limited Receivables, net Yes $ 3,728,640 $ 3,728,640 $ - Floating Short-term financing $ - Working capital $ - - $ - $ 14,252,757
(Note 1)
$ 14,252,757
(Note 1)
KGI International Holdings Limited Receivables, net Yes 4,350,080 4,350,080 932,160 Floating Short-term financing - Working capital - - - 14,252,757
2 KG Investments Holdings
Limited
PT KGI Sekuritas Indonesia Receivables, net Yes 497,152 - - Floating Short-term financing - Working capital - - - 14,189,340
(Note 2)
14,189,340
(Note 2)
3 KGI International Holdings
Limited
KGI Asia Limited Receivables, net Yes 1,553,600 1,553,600 - Floating Short-term financing - Working capital - - - 17,938,487
(Note 3)
17,938,487
(Note 3)
PT KGI Sekuritas Indonesia Receivables, net Yes 605,904 605,904 605,904 Floating Short-term financing - Working capital - - - 17,938,487
Note 1: Richpoint Company Limited’s financing limit is based on the “Loan of Funds Making Guideline”. The guideline states that, for each and for all of the borrowing companies, the total amount available for financing should not exceed the net worth of the financing company.
Note 2: KG Investments Holdings Limited’s financing limit is based on the “Loan of Funds Making Guideline”. The guideline states that, for each and for all of the borrowing companies, the total amount available for financing should not exceed the net worth of the financing company.
Note 3: KGI International Holdings Limited’s financing limit is based on the “Loan of Funds Making Guideline”. The guideline states that, for each and for all of the borrowing companies, the total amount available for financing should not exceed the net worth of the financing company.
Note 4: The above companies which are the subsidiaries of the Corporation were eliminated from the consolidated financial statements.

- 201 -
TABLE 2
CHINA DEVELOPMENT FINANCIAL HOLDING CORPORATION AND SUBSIDIARIES
COLLATERALS/GUARANTEE PROVIDED
FOR THE SIX MONTHS ENDED JUNE 30, 2019
(In Thousands of New Taiwan Dollars)
No. Collaterals/Guarantee
Provider
Counter-party
Limits on Each
Counter-party’s
Collateral/
Guarantee
Amounts
Maximum
Balance for the
Period
Ending Balance Actual Amount
Drawn Down
Carrying Value
(as of Balance
Sheet Date) of
Properties
Guaranteed by
Collateral
Ratio of
Accumulated
Amount of
Collateral to Net
Asset Value of
the Latest
Financial
Statement
Maximum
Collateral/
Guarantee
Amounts
Allowable
Provision of
Endorsements by
Parent Company
to Subsidiary
Provision of
Endorsements by
Subsidiary to
Parent Company
Provision of
Endorsements to
the Company in
Mainland China
Name Nature of
Relationship
1 KGI Securities KGI Securities (Singapore) Pte. Ltd. Note 1 $ 6,446,026 $ 735,040 $ 735,040 $ 735,040 $ - 1.14% $ 25,784,103
(Note 2)
No No No
2 KGI International Holdings
Limited
KGI Asia Limited Note 1 17,938,487 1,359,447 963,232 31,072 - 5.37% 17,938,487
(Note 3)
No No No
KGI International Finance Limited Note 1 17,938,487 4,163,648 3,852,928 - - 21.48% No No No
KGI Futures (Hong Kong) Limited Note 1 17,938,487 201,968 201,968 - - 1.13% No No No
KGI Finance Limited Note 1 17,938,487 133,610 133,610 - - 0.74% No No No
KGI International (Hong Kong) Limited Note 1 17,938,487 2,324,364 2,324,364 124,288 - 12.96% No No No
KGI Asia (Holdings) Pte. Ltd. Note 1 17,938,487 3,206,976 3,195,360 1,952,480 - 17.81% No No No
KGI Securities (Singapore) Pte. Ltd. Note 1 17,938,487 621,440 621,440 - - 3.46% No No No
3 CDIB Management
Consulting Corporation
CDIB International Leasing Corp. Note 1 4,320,875 1,708,960 1,242,880 435,008 - 143.82% 4,320,875
(Note 4)
No No Yes
Note 1: The Group owns directly or indirectly over 50% ownership of the investee company.
Note 2: The limit of maximum guarantee provided by KGI Securities is based on “Corporate Endorsement, Guarantee Making Guideline”. For each company, the amount of guarantee should not exceed 10% of the guarantee provider’s net asset value. The total amount available for collaterals or
guarantee should not exceed 40% of the guarantee provider’s net asset value.
Note 3: The limit of maximum guarantee provided by KGI International Holdings Limited is based on the “Corporate Endorsement, Guarantee Making Guideline”. For each and all company, the amount of guarantee provided should not exceed the guarantee provider’s net asset value.
Note 4: CDIB Management Consulting Corporation: The total amount of guarantee provided should not exceed 5 times of the Company’s net asset value of the latest financial report.

- 202 -
TABLE 3
CHINA DEVELOPMENT FINANCIAL HOLDING CORPORATION AND SUBSIDIARIES
MARKETABLE SECURITIES HELD
JUNE 30, 2019
(In Thousands of New Taiwan Dollars/Foreign Currencies)
Holding Company Marketable Securities Type and Issuer
Relationship with
the Holding
Company
Financial Statement Account
June 30, 2019
Note Shares/Face
Value/Units Carrying Value
Percentage of
Ownership (Note 2) Fair Value
CDIB Capital Group Stocks
Tong Hsing Electronic Industries, Ltd. - Financial assets at fair value through profit or loss 1,036,248 $ 113,987 0.63 $ 113,987
Logitech Inc. - Financial assets at fair value through profit or loss 2,965,248 43,647 10.69 43,647
Solar Fine Chemical Co., Ltd. - Financial assets at fair value through profit or loss 4,828,064 13,785 10.83 13,785
Dee Van Enterprise Co., Ltd. - Financial assets at fair value through profit or loss 4,225,979 77,969 6.04 77,969
National Glory Development Corp. - Financial assets at fair value through profit or loss 646,884 10,378 6.47 10,378
Hair O’right International Corp. - Financial assets at fair value through profit or loss 1,735,837 130,188 8.53 130,188
DaBomb Protein Corp. - Financial assets at fair value through profit or loss 2,864,568 74,908 9.79 74,908
Power Venture Co. - Financial assets at fair value through profit or loss 677,245 6,008 5.68 6,008
Ori Vita Bio Application Inc. - Financial assets at fair value through profit or loss 858,690 5,561 0.42 5,561
Yenyo Technology Co., Ltd. - Financial assets at fair value through profit or loss 4,000,000 29,847 9.91 29,847
E-one Moli Energy Corp. - Financial assets at fair value through profit or loss 12,123,772 121,238 2.14 121,238
HealthStream Taiwan Inc. - Financial assets at fair value through profit or loss 4,774,523 55,214 13.96 55,214
Subtron Technology Co., Ltd. - Financial assets at fair value through profit or loss 12,316,000 151,979 4.31 151,979
Orgchem Technologies, Inc. - Financial assets at fair value through profit or loss 1,067,220 13,729 1.95 13,729
General Life Biotechnology Co., Ltd. - Financial assets at fair value through profit or loss 2,520,000 30,120 8.40 30,120
Mec Imex Inc. - Financial assets at fair value through profit or loss 4,802,000 49,593 10.52 49,593
Yieh United Steel Corp. - Financial assets at fair value through profit or loss 6,297,622 40,494 0.24 40,494
Hua-jie (Taiwan) Corp. - Financial assets at fair value through profit or loss 1,300,403 9,279 6.45 9,279
AMIA Co. - Financial assets at fair value through profit or loss 6,000,000 117,300 9.54 117,300
Up Scientech Materials Corp. - Financial assets at fair value through profit or loss 4,651,344 72,766 6.85 72,766
PlexBio Co., Ltd. - Financial assets at fair value through profit or loss 3,526,000 53,454 5.07 53,454
Riselink Restructuring Fund Corporation - Financial assets at fair value through profit or loss 3,289,681 34,715 12.50 34,715
Orient Pharma Co., Ltd. - Financial assets at fair value through profit or loss 2,857,800 51,440 1.83 51,440
Wai-Gin Industrial Co., Ltd. - Financial assets at fair value through profit or loss 1,170,000 1,738 3.44 1,738
ARCOA Communication Co., Ltd. - Financial assets at fair value through profit or loss 7,567,424 129,640 5.64 129,640
Eastern Electronic Co., Ltd. - Financial assets at fair value through profit or loss 4,348,680 25,898 6.47 25,898
Topview Optronics Corp. - Financial assets at fair value through profit or loss 252,000 10,332 1.10 10,332
Foresee Pharmaceuticals Co., Ltd. - Financial assets at fair value through profit or loss 2,507,107 189,036 2.50 189,036
Jochu Technology Co., Ltd. - Financial assets at fair value through profit or loss 4,746,720 73,622 5.98 73,622
Kaohsiung Rapid Transit Corporation. - Financial assets at fair value through profit or loss 3,845,330 31,402 1.38 31,402
STL Technology Co., Ltd. - Financial assets at fair value through profit or loss 4,308,026 114,163 7.88 114,163
Nan Pao Resins Chemical Co., Ltd. - Financial assets at fair value through profit or loss 280,232 43,576 0.23 43,576
DragonJet Corporation - Financial assets at fair value through profit or loss 4,300,000 15,074 4.77 15,074
Vactronics Technologies Inc. - Financial assets at fair value through profit or loss 2,494,309 29,802 5.28 29,802
Terawins, Inc. - Financial assets at fair value through profit or loss 1,913,996 5,960 6.30 5,960
Feature Integration Technology Inc. - Financial assets at fair value through profit or loss 1,340,803 18,543 4.12 18,543
Mosart Semiconductor Corp. - Financial assets at fair value through profit or loss 2,731,098 23,724 10.57 23,724
EVA Technologies Co., Ltd. - Financial assets at fair value through profit or loss 2,150,536 8,962 10.43 8,962
Overseas Investment & Development Corp. - Financial assets at fair value through profit or loss 2,600,000 19,232 2.89 19,232
Microprogram Co., Ltd. - Financial assets at fair value through profit or loss 2,550,000 37,494 7.95 37,494
Lefram Technology Corporation - Financial assets at fair value through profit or loss 7,484,454 36,150 17.48 36,150
TAK Technology Co., Ltd. - Financial assets at fair value through profit or loss 2,467,706 1,028 4.14 1,028
Engineering & IP Advanced Technologies Ltd. - Financial assets at fair value through profit or loss 4,216 - 0.00 -
Excelsior Medical Co., Ltd. - Financial assets at fair value through profit or loss 33,000 104,311 4.81 104,311
JHL. Biotech, Inc. - Financial assets at fair value through profit or loss 8,382,844 528,119 3.98 528,119
Easten Power and Electric Company Limited - Financial assets at fair value through profit or loss 3,201,019 159,628 12.00 159,628
Beauty Essentials International Ltd. - Financial assets at fair value through profit or loss 86,503,067 221,703 8.02 221,703
Neo Solar Power Corp. - Financial assets at fair value through profit or loss 3,675,000 27,831 0.15 27,831
(Continued)

- 203 -
Holding Company Marketable Securities Type and Issuer
Relationship with
the Holding
Company
Financial Statement Account
June 30, 2019
Note Shares/Face
Value/Units Carrying Value
Percentage of
Ownership (Note 2) Fair Value
CDIB Capital Group Engineering & IP Advanced Technologies Ltd. - preferred stock - Financial assets at fair value through profit or loss 6,392,765 $ 706 0.35 $ 706
Lightel Technologies, Inc. - Financial assets at fair value through profit or loss 3,000,000 101,263 43.44 101,263
Apexigen, Inc. - Financial assets at fair value through profit or loss 4,970,588 62,204 9.59 62,204
CDIB Capital Innovation Accelerator Ltd. Associate Financial assets at fair value through profit or loss 30,000,000 318,422 35.71 318,422
CDIB Capital Management Corporation Subsidiary Investments accounted for using the equity method 33,093,889 610,801 100.00 610,801
CDIB & Partners Investment Holding Corporation Associate Investments accounted for using the equity method 313,200,000 5,488,115 28.71 5,488,115
CDIB Capital Creative Industries Limited Associate Investments accounted for using the equity method 50,440,000 521,513 33.63 521,513
CDIB Capital Healthcare Ventures Limited Associate Investments accounted for using the equity method 58,250,000 602,548 33.29 602,548
CDIB Venture Capital Corporation Subsidiary Investments accounted for using the equity method 1,022,790,915 10,117,364 100.00 10,117,364
CDIB Bio Science Ventures I, Inc. Associate Investments accounted for using the equity method 4,431,405 33,729 20.00 33,729
CDIB Bioscience Venture Management (BVI), Inc. Associate Investments accounted for using the equity method 112,500 4,082 30.00 4,082
CDIB Capital Investment II Limited Subsidiary Investments accounted for using the equity method 45,000,000 1,591,554 100.00 1,591,554
CDIB Global Markets Limited Subsidiary Investments accounted for using the equity method 339,392 6,931,989 100.00 6,931,989
CDIB Capital Investment I Limited Subsidiary Investments accounted for using the equity method 132,800,000 8,346,714 100.00 8,346,714
CDIB Capital International Corporation Subsidiary Investments accounted for using the equity method 4,700,000 674,491 100.00 674,491
Fund
CommLaunch - Financial assets at fair value through profit or loss - 53,882 - 53,882
ARCH Venture Fund V, L.P. - Financial assets at fair value through profit or loss - 6,880 - 6,880
Forward Venture V - Financial assets at fair value through profit or loss - 25,548 - 25,548
Sanderling - Financial assets at fair value through profit or loss - 11,527 - 11,527
Samara Capital Partners Fund I Limited - Financial assets at fair value through profit or loss - 84,952 - 84,952
THL Equity Fund VI Investors (Ceridian), L.P. - Financial assets at fair value through profit or loss - 560,443 - 560,443
Corporate bond
Belta (Cayman) Holding Limited - Financial assets at fair value through profit or loss 11,959,916 7,740 - 7,740
Government bonds
A00109 - Fair value through other comprehensive income
financial assets
7,000,000 7,111 - 7,111
A01105 - Fair value through other comprehensive income
financial assets
100,000,000 101,839 - 101,839
A03115 - Fair value through other comprehensive income
financial assets
50,000,000 50,111 - 50,111
CDIB Capital Management Inc. Stocks
ATEN International Co., Ltd. - Financial assets at fair value through profit or loss 65,660 6,074 0.05 6,074
MCM Stamping Co., Ltd. - Financial assets at fair value through profit or loss 70,000 250 0.22 250
ARCOA Communication Co., Ltd. - Financial assets at fair value through profit or loss 783,000 13,414 0.58 13,414
EVA Technologies Co., Ltd. - Financial assets at fair value through profit or loss 297,623 1,240 1.44 1,240
Kwan’s International Co., Ltd. - Financial assets at fair value through profit or loss 101,240 4,768 0.09 4,768
CDIB Capital Innovation Advisors Corporation Subsidiary Investments accounted for using the equity method 1,200,000 14,934 60.00 14,934
CDIB Capital Creative Industries Limited Associate Investments accounted for using the equity method 1,300,001 13,441 1.00 13,441
CDIB Capital Healthcare Ventures Limited Associate Investments accounted for using the equity method 1,750,000 18,102 1.00 18,102
CDIB Private Equity (Hong Kong) Corporation Limited Subsidiary Investments accounted for using the equity method 51,900,000 310,240 100.00 310,240
Funds
CDIB Capital Growth Partners L.P. Associate Financial assets at fair value through profit or loss - 22,933 - 22,933
KGI Victory Money Market Securities Investment Trust Fund Managed by KGI
Securities
Investment Trust
Co., Ltd.
Financial assets at fair value through profit or loss - 80,349 - 80,349
CDIB Private Equity (Hong Kong) Stocks
Corporation Limited CDIB Private Equity (China) Corporation Subsidiary Investments accounted for using the equity method - HK$ 60,442 100.00 HK$ 60,442
CDIB Private Equity Management (Fujian) Enterprise (Limited Partnership) Subsidiary Investments accounted for using the equity method - HK$ 7,859 56.00 HK$ 7,859
CDIB Yida Private Equity Management (Kunshan) Enterprise (Limited
Partnership)
Subsidiary Investments accounted for using the equity method - HK$ 3,707 27.08 HK$ 3,707
CDIB Private Equity (China) Corporation Stocks
CDIB Private Equity (Fujian) Co., Ltd. Subsidiary Investments accounted for using the equity method - CNY 17,476 70.00 CNY 17,476
CDIB Yida Private Equity (Kunshan) Co., Ltd. Subsidiary Investments accounted for using the equity method - CNY 11,489 65.00 CNY 11,489
(Continued)

- 204 -
Holding Company Marketable Securities Type and Issuer
Relationship with
the Holding
Company
Financial Statement Account
June 30, 2019
Note Shares/Face
Value/Units Carrying Value
Percentage of
Ownership (Note 2) Fair Value
CDIB Private Equity (Fujian) Co., Ltd. Stocks
CDIB Private Equity Management (Fujian) Enterprise (Limited Partnership) Associate Investments accounted for using the equity method - CNY 2,469 20.00 CNY 2,469
CDIB Yida Private Equity (Kunshan) Co., Ltd. Stocks
CDIB Yida Private Equity Management (Kunshan) Enterprise (Limited
Partnership)
Subsidiary Investments accounted for using the equity method - CNY 7,025 58.33 CNY 7,025
CDIB Yida Private Equity Management Funds
(Kunshan) Enterprise (Limited Partnership) CDIB Yida Private Equity (Kunshan) Enterprise (Limited Partnership) Associate Investments accounted for using the equity method - CNY 10,298 - CNY 10,298
CDIB Private Equity Management (Fujian) Funds
Enterprise (Limited Partnership) CDIB Private Equity (Fujian) Enterprise (Limited Partnership) Associate Investments accounted for using the equity method - CNY 10,369 - CNY 10,369
CDIB Venture Capital Corporation Stocks
Dee Van Enterprise Co., Ltd. - Financial assets at fair value through profit or loss 1,388,659 25,621 1.98 25,621
Azotek Co., Ltd. - Financial assets at fair value through profit or loss 824,500 18,195 0.00 18,195
Yenyo Technology Co., Ltd. - Financial assets at fair value through profit or loss 500,000 3,731 1.24 3,731
Pai Lung Machinery Mill Co., Ltd. - Financial assets at fair value through profit or loss 1,500,000 479 4.22 479
Fukuta Co., Ltd. - Financial assets at fair value through profit or loss 1,872,753 195,015 4.68 195,015
Handa Pharmaceuticals Inc. - Financial assets at fair value through profit or loss 2,809,000 87,837 2.68 87,837
Sustainable Development Co., Ltd. - Financial assets at fair value through profit or loss 500,000 75,000 1.55 75,000
Sum Max Tech. Limited - Financial assets at fair value through profit or loss 1,434,882 58,615 5.47 58,615
Regal Holding Co., Ltd. - Financial assets at fair value through profit or loss 1,101,000 39,141 2.86 39,141
Sino-American Silicon Products Inc. - Financial assets at fair value through profit or loss 5,708,562 465,819 0.97 465,819
Fusheng Precision Co., Ltd. - Financial assets at fair value through profit or loss 788,000 156,024 0.60 156,024
M2Communication, Inc. - Financial assets at fair value through profit or loss 6,477,527 18,276 14.81 18,276
GSD Technologies Co., Ltd. - Financial assets at fair value through profit or loss 5,698,702 352,750 16.76 352,750
Jochu Technology Co., Ltd. - Financial assets at fair value through profit or loss 3,725,007 57,775 4.69 57,775
STL Technology Co., Ltd. - Financial assets at fair value through profit or loss 5,528,901 146,516 10.11 146,516
Greatland Electronics Taiwan Ltd. - Financial assets at fair value through profit or loss 1,920,000 12,758 5.50 12,758
Shengzhuang Holdings Limited - Financial assets at fair value through profit or loss 610,590 3,425 6.11 3,425
Excelsior Medical Co., Ltd. - Financial assets at fair value through profit or loss 33,000 104,311 4.81 104,311
CBA Sports International Ltd. - Financial assets at fair value through profit or loss 514,821 2,231 0.00 2,231
Cvie Therapeutics Company Limited - Financial assets at fair value through profit or loss 560,000 19,857 4.15 19,857
Shane Global Holding Inc. - Financial assets at fair value through profit or loss 719,700 102,917 0.65 102,917
Viscovery (Cayman) Holding Company Limited - Financial assets at fair value through profit or loss 195,317 6,069 1.85 6,069
Kkday.com International Company Limited - Financial assets at fair value through profit or loss 3,000,000 32,383 1.03 32,383
i-Serve - Financial assets at fair value through profit or loss 2,232,219 157,995 4.17 157,995
Hartec Asia Pte. Ltd. - Financial assets at fair value through profit or loss 2,800,000 89,852 10.23 89,852
Windtree Therapeutic, Inc. - Financial assets at fair value through profit or loss 594,552 80,731 1.85 80,731
iCHEF Co., Ltd. - Financial assets at fair value through profit or loss 11,167,513 102,501 40.74 102,501
4Gamers Entertainment Inc. - Preferred stock A - Financial assets at fair value through profit or loss 24,000 16,406 20.00 16,406
Viscovery (Cayman) Holding Company Limited - Preferred stock A+ - Financial assets at fair value through profit or loss 304,878 9,473 8.20 9,473
Citiesocial Holding Cayman Co., Ltd. - Preferred stock - Financial assets at fair value through profit or loss 479,635 15,536 18.18 15,536
Uimbo CV Inc. - Financial assets at fair value through profit or loss 1,394,145 21,750 10.29 21,750
CCMODA Corp. - Preferred stock - Financial assets at fair value through profit or loss 666,666 15,536 20.00 15,536
Asia Parents Holdings Limited - Financial assets at fair value through profit or loss 248,889 17,400 14.74 17,400
Kneron Inc. - Preferred stock - Financial assets at fair value through profit or loss 1,469,072 191,535 9.50 191,535
Zentera Systems, Inc. - Preferred stock - Financial assets at fair value through profit or loss 1,324,503 78,491 39.35 78,491
FUNP Co., Ltd. - Preferred stock - Financial assets at fair value through profit or loss 400,000 44,744 20.00 44,744
Achieve Made International Limited - Preferred stock - Financial assets at fair value through profit or loss 168,138 12,429 6.67 12,429
Kwan’s International Co., Ltd. - Financial assets at fair value through profit or loss 202,480 9,537 0.17 9,537
United Renewable Energy Co., Ltd. - Financial assets at fair value through profit or loss 5,105,377 38,663 0.20 38,663
CBA Sports International Ltd.- Preferred stock - Financial assets at fair value through profit or loss 2,402,500 10,412 13.73 10,412
Viscovery (Cayman) Holding Company Limited - Preferred stock A++ - Financial assets at fair value through profit or loss 200,000 6,214 10.96 6,214
FunNow Ltd. - Preferred stock - Financial assets at fair value through profit or loss 185,184 33,922 20.00 33,922
4Gamers Entertainment Inc. - Preferred stock B - Financial assets at fair value through profit or loss 8,727 5,966 4.80 5,966
Kkday.com International Company Limited - Financial assets at fair value through profit or loss 5,654,616 61,038 8.66 61,038
Traveler Co., Ltd. - Financial assets at fair value through profit or loss 32,077 24,858 10.85 24,858
(Continued)

- 205 -
Holding Company Marketable Securities Type and Issuer
Relationship with
the Holding
Company
Financial Statement Account
June 30, 2019
Note Shares/Face
Value/Units Carrying Value
Percentage of
Ownership (Note 2) Fair Value
CDIB Venture Capital Corporation Achieve Made International Limiter-Preferred stock E - Financial assets at fair value through profit or loss 336,276 $ 24,858 13.33 $ 24,858
Regent Investment Holding Corp. Associate Investments accounted for using the equity method 500,000 4,859 50.00 4,859
CDIB Venture Capital (Hong Kong) Corporation Limited Subsidiary Investments accounted for using the equity method 1,010,000,000 3,887,930 100.00
3,887,930
Fund
CDIB Capital Growth Partners L.P. Associate Financial assets at fair value through profit or loss - 563,665 - 563,665
KGI Victory Money Market Securities Investment Trust Fund Managed by KGI
Securities
Investment Trust
Co., Ltd.
Financial assets at fair value through profit or loss - 200,639 - 200,639
Corporate bond
Capital Excel Investment Limited - Financial assets at fair value through profit or loss 2,000 43,306 - 43,306
Convertible (exchange) corporate bond
Kkday.com International Company Limited - Financial assets at fair value through profit or loss 1,600,000 49,715 - 49,715
CDIB Venture Capital (Hong Kong) Fund
Corporation Limited CDIB Private Equity (Fujian) Enterprise (Limited Partnership) Associate Investments accounted for using the equity method - HK$ 404,278 - HK$ 404,278
CDIB Yida Private Equity (Kunshan) Enterprise (Limited Partnership) Associate Investments accounted for using the equity method - HK$ 343,536 - HK$ 343,536
CDIB Capital Investment I Limited Stocks
Best Inc. - Financial assets at fair value through profit or loss 1,500,000 US$ 8,265 0.39 US$ 8,265
Casper Sleep, Inc. - Financial assets at fair value through profit or loss 266,690 US$ 7,952 1.00 US$ 7,952
CCAP Best Logistics Holdings Limited - Financial assets at fair value through profit or loss 1,000 US$ 3,045 11.11 US$ 3,045
Mestay Cayman Islands Limited - Preferred stock - Financial assets at fair value through profit or loss 13,722,047 US$ 7,826 3.40 US$ 7,826
Viking 3 Holdings Corporation (SPV) - Financial assets at fair value through profit or loss 18,000,000 US$ 18,000 60.00 US$ 18,000
Giddy Inc. - Financial assets at fair value through profit or loss 666,755 US$ 7,287 6.26 US$ 7,287
Great Team Backend Foundry Inc. - Financial assets at fair value through profit or loss 1,636,800 US$ 796 1.81 US$ 796
Rokid Corporation Ltd - Financial assets at fair value through profit or loss 615,642 US$ 5,000 1.51 US$ 5,000
SCBS 1 Holding Corporation Subsidiary Investments accounted for using the equity method 3,578 US$ 3,496 100.00 US$ 3,496
Fund
Carlyle Asia Partners II, L. P. - Financial assets at fair value through profit or loss - US$ 128 - US$ 128
Ripley Cable Holdings I, L.P. - Financial assets at fair value through profit or loss - US$ 907 - US$ 907
MSD Sports Partners, L.P. - Financial assets at fair value through profit or loss - US$ 10,899 - US$ 10,899
BCP QualTek Investor Holdings, L.P. - Financial assets at fair value through profit or loss - US$ 10,986 - US$ 10,986
CDIB Capital Global Opportunities Fund L.P. Other related parties Financial assets at fair value through profit or loss - US$ 3,666 - US$ 3,666
KKR Talk Co-invest L.P. - Financial assets at fair value through profit or loss - US$ 8,000 - US$ 8,000
CC KDC CO-INVEST L.P. - Financial assets at fair value through profit or loss - US$ 20,007 - US$ 20,007
CDIB Capital Asia Partners L.P. Associate Investments accounted for using the equity method - US$ 104,313 - US$ 104,313
Corporate bond
Garden Fresh (HK) Fruit & Vegetable Beverage Co., Ltd. - Financial assets at fair value through profit or loss 41,875,000 US$ 7,074 - US$ 7,074
Convertible (exchange) corporate bond
Garden Fresh (HK) Fruit & Vegetable Beverage Co., Ltd. - Financial assets at fair value through profit or loss 28,094,510 US$ 10,862 - US$ 10,862
Mestay Cayman Islands Limited - Financial assets at fair value through profit or loss 7,013,490 US$ 4,000 - US$ 4,000
SCBS 1 Holding Corporation Stocks
Simplify Compliance Holdings, LLC. - Financial assets at fair value through profit or loss 2,833,333 US$ 3,254 2.91 US$ 3,254
CDIB Capital Investment II Limited Stocks
Great Rich Technologies Limited - Financial assets at fair value through profit or loss 1,660,000 US$ 2,983 2.46 US$ 2,983
CBA Sports International Ltd. - Financial assets at fair value through profit or loss 508,929 US$ 71 0.89 US$ 71
Indostar Capital - Financial assets at fair value through profit or loss 631,701 US$ 10,768 2.88 US$ 10,768
Indostar Everstone - Financial assets at fair value through profit or loss 860,332 US$ 14,597 8.12 US$ 14,597
CBA Sports International Ltd. - Preferred stock - Financial assets at fair value through profit or loss 2,375,000 US$ 331 13.57 US$ 331
(Continued)

- 206 -
Holding Company Marketable Securities Type and Issuer
Relationship with
the Holding
Company
Financial Statement Account
June 30, 2019
Note Shares/Face
Value/Units Carrying Value
Percentage of
Ownership (Note 2) Fair Value
CDIB Global Markets Limited Stocks
Facebook Inc. - Financial assets at fair value through profit or loss 575 US$ 111 0.00 US$ 111
GoPro, Inc. - Financial assets at fair value through profit or loss 51,878 US$ 283 0.04 US$ 283
Flemingo International (BVI) Ltd. - Financial assets at fair value through profit or loss 1,048 US$ 48,449 50.19 US$ 48,449
Fund
Huaxing Capital Partners II LP - Financial assets at fair value through profit or loss - US$ 9,947 - US$ 9,947
GS TDN Investors Offshore, L.P. - Financial assets at fair value through profit or loss - US$ 525 - US$ 525
CX Partners Fund Alpha Limited - Financial assets at fair value through profit or loss - US$ 6,279 - US$ 6,279
Carlyle Asia Partners III, L.P. - Financial assets at fair value through profit or loss - US$ 1,586 - US$ 1,586
Riverwood Capital Partners L.P. - Financial assets at fair value through profit or loss - US$ 5,070 - US$ 5,070
ECP II (Cayman) Ltd. A - Financial assets at fair value through profit or loss - US$ 8,636 - US$ 8,636
Sino-Century China Private Equity II L. P. - Financial assets at fair value through profit or loss - US$ 384 - US$ 384
KKR Asian Fund II L.P. - Financial assets at fair value through profit or loss - US$ 8,182 - US$ 8,182
Carlyle Asia Partners IV, L.P. - Financial assets at fair value through profit or loss - US$ 18,454 - US$ 18,454
Carlyle Giovanna Partners, L.P. - Financial assets at fair value through profit or loss - US$ 2,054 - US$ 2,054
Tenaya Capital V, L.P. - Financial assets at fair value through profit or loss - US$ 2,871 - US$ 2,871
THL Equity Fund VI Investors (Ceridian), L.P. - Financial assets at fair value through profit or loss - US$ 9,018 - US$ 9,018
Platinum Equity Capital Partners II, L.P. - Financial assets at fair value through profit or loss - US$ 1,052 - US$ 1,052
Industry Ventures Fund VI, L.P. - Financial assets at fair value through profit or loss - US$ 2,524 - US$ 2,524
Platinum Equity Capital Partners III, L.P. - Financial assets at fair value through profit or loss - US$ 4,424 - US$ 4,424
Tenaya Capital VI, LP - Financial assets at fair value through profit or loss - US$ 8,459 - US$ 8,459
Formation8 Partners Fund I, L.P. - Financial assets at fair value through profit or loss - US$ 8,273 - US$ 8,273
Blue Point Capital Partners III, L.P. - Financial assets at fair value through profit or loss - US$ 7,655 - US$ 7,655
Riverwood Capital Partners II L.P. - Financial assets at fair value through profit or loss - US$ 19,023 - US$ 19,023
THL Equity Fund VI Investors (Ceridian) VI, L.P. - Financial assets at fair value through profit or loss - US$ 13,318 - US$ 13,318
CDIB Capital International Corporation Stocks
CDIB Capital International (Hong Kong) Corporation Limited Subsidiary Investments accounted for using the equity method 15,400,000 US$ 5,990 100.00 US$ 5,990
CDIB Capital International (Korea) Corporation Subsidiary Investments accounted for using the equity method 1,848,000 US$ 5,820 100.00 US$ 5,820
CDIB Capital International (USA) Corporation Subsidiary Investments accounted for using the equity method 8,000,000 US$ 1,988 100.00 US$ 1,988
CDIB Capital Asia Partners Limited Subsidiary Investments accounted for using the equity method 100 US$ 70 100.00 US$ 70
China Development Asset Management Corp. Stocks
Waterland Securities Co., Ltd. - Financial assets at fair value through profit or loss 8,034,740 46,646 1.07 46,646
Victor Taichung Machinery Works Co., Ltd. - Financial assets at fair value through profit or loss 94,266 508 0.06 508
Pine Street Asset Management Corp. - Financial assets at fair value through other
comprehensive income
3,886,190 26,020 12.25 26,020
Development Industrial Bank Asset Management Corp. Subsidiary Investments accounted for using the equity method 2,000,000 83,985 100.00 83,985
Chung Hwa Growth 3 Asset Management Corp. Subsidiary Investments accounted for using the equity method 226,000,000 2,486,138 100.00 2,486,138
Chung Hwa Growth 4 Asset Management Corp. Subsidiary Investments accounted for using the equity method 19,000,000 195,005 100.00 195,005
Chung Hwa Growth 3 Asset Management Fund
Corp. KGI Victory Money Market Securities Investment Trust Fund Managed by KGI
Securities
Investment Trust
Co., Ltd.
Financial assets at fair value through profit or loss - 200,605 - 200,605
CDIB Management Consulting Corp. Stocks
CDC Finance & Leasing Corp. Subsidiary Investments accounted for using the equity method 58,328,460 633,352 76.04 633,352
CDIB International Leasing Corp. Subsidiary Investments accounted for using the equity method - 132,053 100.00 132,053
CDC Finance & Leasing Corp. Stocks
Hwahong Corporation Associate Investments accounted for using the equity method 23,750 107 19.00 107
Pacific Electric Wire and Cable Co., Ltd. - Financial assets at fair value through other
comprehensive income
496,574 - 0.07 -
(Continued)

- 207 -
Holding Company Marketable Securities Type and Issuer
Relationship with
the Holding
Company
Financial Statement Account
June 30, 2019
Note Shares/Face
Value/Units Carrying Value
Percentage of
Ownership (Note 2) Fair Value
Global Securities Finance Corporation Bank debentures
E.SUN Bank 1st Subordinate Financial Debentures-A issue in 2014 - Financial assets measured at amortized cost 50,000,000 $ 49,984 - $ 50,077
Sunny Bank Second Subordinated Bank Debentures issued in 2015 - Financial assets measured at amortized cost 200,000,000 199,305 - 199,986
Hwatai Commercial Bank 2nd Subordinate Financial Debentures issued in
2015
- Financial assets measured at amortized cost 100,000,000 99,380 - 99,992
Bank of Panhsin 5th Unsecured Subordinate Financial Debentures issued in
2017
- Financial assets measured at amortized cost 200,000,000 198,085 - 199,986
Taiwan Business Bank's 2nd Subordinated Financial Debentures Issue in
2018
- Financial assets measured at amortized cost 150,000,000 149,842 - 152,608
Government bonds
A05113 - Other assets 100,000,000 99,723 - 100,185
A06102 - Financial assets measured at amortized cost 100,000,000 99,815 - 100,504
Richpoint Company Limited Stocks
Dragon Investment Fund I Co., Ltd - Financial assets at fair value through profit or loss 4,375,142 US$ 182 6.48 US$ 182
He Ding Venture Capital Investment Corporation - Financial assets at fair value through profit or loss 295,000 US$ 49 5.00 US$ 49
Lien Ding Venture Capital Investment Corporation - Financial assets at fair value through profit or loss 210,000 US$ 67 3.00 US$ 67
KG Investments Holdings Limited Subsidiary Investments accounted for using the equity method 156,864,163 US$ 471,744 100.00 US$ 471,744
KGI Venture Capital Co., Ltd. Stocks
Gingy Technology Inc. - Financial assets at fair value through profit or loss 1,148,837 44,067 4.69 44,067
Sustainable Development Co.,Ltd. - Financial assets at fair value through profit or loss 203,490 30,524 0.65 30,524
Wiltrom Co., Ltd. - Financial assets at fair value through profit or loss 1,200,000 42,000 5.05 42,000
Yongda Food Technology co., LTD. - Financial assets at fair value through profit or loss 1,000,000 28,000 5.00 28,000
Global Tek Fabrication Co., Ltd. - Financial assets at fair value through profit or loss 274,000 11,124 0.42 11,124
Drewloong Precision, Inc. - Financial assets at fair value through profit or loss 391,538 63,817 1.31 63,817
Yield Microelectronics Corp. - Financial assets at fair value through profit or loss 505,000 33,583 0.19 33,583
PharmaEssentia Corp. - Financial assets at fair value through profit or loss 137,373 16,553 0.06 16,553
Aslan Pharmaceuticals Limited - Financial assets at fair value through profit or loss 181,000 3,620 0.11 3,620
WinWay Technology Co., Ltd. - Financial assets at fair value through profit or loss 746,000 89,412 2.62 89,412
Jmc Electronics Co., Ltd. - Financial assets at fair value through profit or loss 575,000 54,625 0.58 54,625
EirGenix Inc. - Financial assets at fair value through profit or loss 460,000 14,375 0.31 14,375
San Neng Group Holdings Co., LTD. - Financial assets at fair value through profit or loss 700,000 33,670 1.15 33,670
Fittech Co.,ltd - Financial assets at fair value through profit or loss 639,000 41,842 1.06 41,842
Deluxe Technonlogy Group. - Financial assets at fair value through profit or loss 417,038 16,038 0.88 16,038
uPI semiconductor corp. - Financial assets at fair value through profit or loss 190,665 12,122 0.27 12,122
JG Environmental Technology Co.,Ltd. - Financial assets at fair value through profit or loss 342,000 15,411 1.67 15,411
Asia Metal Industries, Inc. - Financial assets at fair value through profit or loss 650,000 31,629 3.60 31,629
RiTdisplay Corporation - Financial assets at fair value through profit or loss 318,500 18,441 0.47 18,441
Top Bright Holding Co., Ltd. - Financial assets at fair value through profit or loss 500,000 48,000 0.97 48,000
Taiwan Chinsan Electronic Industrial Co., Ltd - Financial assets at fair value through profit or loss 116,991 8,106 0.10 8,106
KGI Information Technology Co., Ltd. Fund
KGI Victory Money Market Securities Investment Trust Fund Managed by KGI
Securities
Investment Trust
Co., Ltd.
Financial assets at fair value through profit or loss - 20,098 - 20,098
Note 1: The Group recognized the related income or loss of investees as required by regulations.
Note 2: The preferred shares held divided by the number of preferred shares outstanding is the percentage of ownership.
Note 3: No securities were treated as collaterals or warrants.
Note 4: The above companies which are the subsidiaries of the Corporation were eliminated from the consolidated financial statements.
(Concluded)

- 208 -
TABLE 4
CHINA DEVELOPMENT FINANCIAL HOLDING CORPORATION AND SUBSIDIARIES
MARKETABLE SECURITIES ACQUIRED AND DISPOSED OF AT COSTS OR PRICES OF AT LEAST NT$300 MILLION OR 10% OF THE PAID-IN CAPITAL
(THE BANK’S SUBSIDIARIES AMOUNTING TO NT$300 MILLION OR 10% OF THE PAID-IN CAPITAL)
FOR THE SIX MONTHS ENDED JUNE 30, 2019
(In Thousands of New Taiwan Dollars/Foreign Currencies)
Company Name Marketable Securities Type and Name Financial Statement Account Counter-party Nature of
Relationship
Beginning Balance Acquisition Disposal Ending Balance
Shares/Face
Value/Units Amount
Shares/Face
Value/Units Amount
Shares/Face
Value/Units Amount Carrying Value
Gain (Loss)
on Disposal
Shares/Face
Value/Units Amount
The Corporation Stocks
The Capital Securities Corporation Financial assets at fair value through
profit or loss
- - 52,711,215 $ 703,034
(Note 1)
- $ - 41,811,000 $ 392,527 $ 557,653 $ (165,126 ) 10,900,215 $ 145,381
(Note 1) China Life Insurance Co., Ltd. Investment accounted for using the
equity method
- - 1,016,752,000 23,371,430 151,102,432 15,447,472
(Note 2)
- - - - 1,167,854,432 38,818,902
CDIB Capital Group Stocks
Taiwan Stock Exchange Financial assets at fair value through
profit or loss
- - 18,449,638
3,188
(Note 1)
- - 18,449,638 1,438,617 3,188 1,435,429 - -
CDIB Global Markets Limited Investment accounted for using the
equity method
- - 339,392 9,142,006 - - - - 2,210,017
(Note 3)
- 339,392 6,931,989
CDIB Venture Capital Corporation Stocks
CDIB Venture Capital (Hong Kong)
Corporation Limited
Investment accounted for using the
equity method
- - 870,000,000 3,337,455 140,000,000 550,475
(Note 4)
- - - - 1,010,000,000 3,887,930
CDIB Global Markets Limited Funds
Carlyle Giovanna Partners, L.P. Financial assets at fair value through profit or loss
- - - US$ 587 (Note 1)
- - - US$ 14,351 US$ 587 US$ 13,764 - -
CDIB Capital Investment I Limited Funds CDIB Capital Asia Partners L.P. Investment accounted for using the
equity method
- - - US$ 88,975
- US$ 15,338
(Note 5)
- - - - - US$ 104,313
CC KDC CO-INVEST LP Financial assets at fair value through
profit or loss
- - - US$ - - US$ 20,441 - - - - - US$ 20,441
(Note 1)
Viking 3 Holdings Corporation Financial assets at fair value through
profit or loss
- - - US$ - - US$ 18,000 - - - - - US$ 18,000
(Note 1)
Note 1: Initial acquisition cost.
Note 2: Consists of cost of purchase $3,112,710 thousand, investment gain $1,467,753 thousand, reduction of treasury stocks $43,625 thousand, increase of paid-in capital $374,868 thousand, increase of retained earnings $98,883 thousand, exchange differences on translating foreign operations of $3,027 thousand, gain of investments
in equity instruments at FVTOCI of $542,720 thousand, gains of investments in debt instruments at FVTOCI of $5,625,494 thousand and increase of other comprehensive income reclassified using the overlay approach $4,265,642 thousand.
Note 3: Consists of capital reduction $2,799,900 thousand, investment gain $484,430 thousand and exchange gain on translating foreign operations of $105,453 thousand.
Note 4: Consists of issuance of common stock for cash $561,904 thousand, investment loss $43,538 thousand and exchange gain on translating foreign operations of $32,109 thousand.
Note 5: Consists of cash dividends $217 thousand, issuance of common stock for cash $12,509 thousand and investment gain $3,046 thousand.

- 209 -
TABLE 5
CHINA DEVELOPMENT FINANCIAL HOLDING CORPORATION AND SUBSIDIARIES
RECEIVABLES FROM RELATED PARTIES AMOUNTING TO NT$300 MILLION OR 10% OF THE PAID-IN CAPITAL
JUNE 30, 2019
(In Thousands of New Taiwan Dollars)
Company Name Related Party Relationship Ending Balance Turnover Rate Overdue Amounts Received
in Subsequent Year
Allowance for
Bad Debts Amount Action Taken
The Corporation CDIB Capital Group Subsidiary $ 525,542
(Note 1)
- $ - - $ - $ -
KGI Bank Subsidiary 541,361
(Note 1)
- - - - -
KGI Securities Co., Ltd. Subsidiary 668,212
(Note 1)
- - - 43,219 -
CDIB Capital Group The Corporation Parent company 317,267
(Note 1)
- - - 38,422 -
CDIB Global Markets Limited Subsidiary 2,796,480 - - - 2,796,480 -
China Life Insurance Co., Ltd. KGI Bank Subsidiary of the parent
company
1,710,500 - - - 1,710,500 -
KGI Securities Co., Ltd. JingHuei Investment Ltd. Other related parties 380,542 - - - 380,542 -
Note 1: Tax receivable result from linked-tax system.
Note 2: The above companies which are the subsidiaries of the Corporation were eliminated from the consolidated financial statements.

- 210 -
TABLE 6
CHINA DEVELOPMENT FINANCIAL HOLDING CORPORATION AND SUBSIDIARIES
INFORMATION ON INVESTED ENTERPRISES
JUNE 30, 2019
(In Thousands of New Taiwan Dollars)
Investor Company Investee Company (Note 1) Location Main Business
Percentage of
Ownership, End
of Period
Carrying Value,
End of Period
(Note 3)
Investment
Gain (Loss)
Consolidated Investment (Note 1)
Note Present Shares
Virtual Shares
(Note 2)
Total
Shares Percentage of
Ownership
The Corporation CDIB Capital Group Taipei City, Taiwan Venture capital 100.00 $ 43,626,045 $ 2,510,962 2,041,115,913 - 2,041,115,913 100.00
KGI Securities Taipei City, Taiwan Financial service 100.00 58,532,200 2,680,204 3,241,843,251 - 3,241,843,251 100.00
KGI Bank Taipei City, Taiwan Commercial bank 100.00 64,390,947 1,781,505 4,606,162,291 - 4,606,162,291 100.00
China Development Asset Management Corp. Taipei City, Taiwan Trading and management of nonperforming loans of financial institution
100.00 2,347,960 35,189 200,000,000 - 200,000,000 100.00
China Life Insurance Taipei City, Taiwan Life insurance 26.16 38,818,902 1,467,753 1,562,035,178 - 1,562,035,178 35.00
Note 1: All present shares and virtual shares of investee company held by the Company, directors, supervisors, the Corporation's managers and affiliates should be included.
Note 2: a. The virtual shares are those shares obtained through a transfer, on the assumption of share transfer, from equity securities purchased or derivative instrument contracts signed and linked to investee company’s equity based on agreed transaction terms and undertaking intention, and for the purpose of investing in company
under the provisions of Article 36, Item 2 and Article 37 of the Company Act.
b. The equity securities mentioned above are specified as those securities under the provision of Article 11, Item 1 of the bylaws to the ROC Securities and Exchange Act, for example, convertible bond and warrant.
c. The derivative instrument contracts mentioned above are specified as those derivative instruments defined by the IFRS 9, for example, stock option.
Note 3: The above companies which are the subsidiaries of the Corporation were eliminated from the consolidated financial statements.

- 211 -
TABLE 7
CHINA DEVELOPMENT FINANCIAL HOLDING CORPORATION AND SUBSIDIARIES
SOLD NONPERFORMING LOANS
FOR THE SIX MONTHS ENDED JUNE 30, 2019
(In Thousands of New Taiwan Dollars)
1. Summary of sold nonperforming loans
Transaction Date Counter Party Type of Loans Carrying Value (Note 1) Selling Price Disposal Gain (Loss)
(Note 2) Other Condition
Relationship of
Counter-party with
the Subsidiaries
2019.03.25 A Secured loans $ 863 $ 1,620 $ 757 - -
2. Sale of nonperforming loans exceeding NT$1 billion (excluding related-party transactions): For the Group: None.

- 212 -
TABLE 8
CHINA DEVELOPMENT FINANCIAL HOLDING CORPORATION AND SUBSIDIARIES
SUBSIDIARIES INCLUDED IN THE CONSOLIDATED FINANCIAL STATEMENTS
JUNE 30, 2019
Consolidated entities
Investor Company Subsidiaries Main Business and Products
Percentage of Ownership
Note June 30, 2019
December 31,
2018 June 30, 2018
The Corporation CDIB Capital Group Venture fund 100.00 100.00 100.00
KGI Securities Financial service 100.00 100.00 100.00
KGI Bank Commercial bank 100.00 100.00 100.00
China Development Asset Management Corp. Trading and management of nonperforming
loans of financial institutions
100.00 100.00 100.00
China Life Insurance Co., Ltd. Life insurance 26.16 25.33 25.33 (Note 1)
CDIB Capital Group CDIB Capital Management Corporation Management and consulting 100.00 100.00 100.00
CDIB Venture Capital Corporation Venture fund 100.00 100.00 100.00
CDIB Global Markets Limited Investment 100.00 100.00 100.00
CDIB Capital Investment I Limited Investment 100.00 100.00 100.00
CDIB Capital Investment II Limited Investment 100.00 100.00 100.00
CDIB Capital International Corporation Management company of venture fund 100.00 100.00 100.00
CDIB Capital International Corporation CDIB Capital International (Hong Kong) Corporation
Limited
Consulting service 100.00 100.00 100.00
CDIB Capital International (USA) Corporation Consulting service 100.00 100.00 100.00
CDIB Capital International (Korea) Corporation Consulting service 100.00 100.00 100.00
CDIB Capital Asia Partners Limited Management of private equity fund 100.00 100.00 100.00
CDIB Capital Investment I Limited SCBS 1 Holding Corporation Investment holdings 100.00 - -
CDIB Venture Capital Corporation CDIB Venture Capital (Hong Kong) Corporation
Limited
Venture fund 100.00 100.00 100.00
CDIB Capital Management Corporation CDIB Private Equity (Hong Kong) Corporation Limited Management and consulting 100.00 100.00 100.00
CDIB Capital Innovation Advisors Corporation Management and consulting 60.00 60.00 60.00
CDIB Private Equity (Hong Kong) Corporation
Limited
CDIB Yida Private Equity Management (Kunshan)
Enterprise (Limited Partnership)
Management and consulting 27.08 27.08 27.08
CDIB Private Equity (China) Corporation Management and consulting 100.00 100.00 100.00
CDIB Private Equity Management (Fujian) Enterprise
(Limited Partnership)
Management and consulting 56.00 56.00 56.00
CDIB Private Equity (China) Corporation CDIB Yida Private Equity (Kunshan) Co., Ltd. Management and consulting 65.00 65.00 65.00
CDIB Private Equity (Fujian) Co., Ltd. Management and consulting 70.00 70.00 70.00
(Continued)

- 213 -
Investor Company Subsidiaries Main Business and Products
Percentage of Ownership
Note June 30, 2019
December 31,
2018 June 30, 2018
CDIB Private Equity (Fujian) Co., Ltd. CDIB Private Equity Management (Fujian) Enterprise
(Limited Partnership)
Management and consulting 20.00 20.00 20.00
CDIB Yida Private Equity (Kunshan) Co., Ltd. CDIB Yida Private Equity Management (Kunshan)
Enterprise (Limited Partnership)
Management and consulting 58.34 58.34 58.34
KGI Securities Richpoint Company Limited Investment holdings 100.00 100.00 100.00
KGI Securities Investment Advisory Co., Ltd. Security investment consulting 100.00 100.00 100.00
KGI Insurance Brokers Co., Ltd. Life/property insurance brokers 100.00 100.00 100.00
KGI Venture Capital Co., Ltd. Venture capital 100.00 100.00 100.00
KGI Securities Investment Trust Co., Ltd. Nominee services, discretionary investment
services
100.00 100.00 100.00
KGI Futures Co., Ltd. Futures investment services 99.61 99.61 99.61
Global Securities Finance Corporation Stock loans and financing purchase of securities 21.99 21.99 21.99 (Note 2)
KGI Futures Co., Ltd. KGI Information Technology Co., Ltd. Management and consulting software services,
data processing digital information supply
services
100.00 100.00 100.00
KGI Information Technology Co., Ltd. KGI Information Technology (Shanghai) Co., Ltd. Information service - - 100.00 (Note 3)
Richpoint Company Limited KG Investments Holdings Limited Investment holdings 100.00 100.00 100.00
KGI Investment Advisory (Shanghai) Co., Ltd. Investment and consulting service 100.00 100.00 100.00
KG Investments Holdings Limited KGI International Holdings Limited Investment holdings 100.00 100.00 100.00
KGI International Holdings Limited KGI Limited Investment holdings 100.00 100.00 100.00
Supersonic Services Inc. Investment holdings 100.00 100.00 100.00
KGI International Limited Investment holdings 100.00 100.00 100.00
Bauhinia 88 Ltd. Investment holdings 100.00 100.00 100.00
KGI Limited KGI Futures (Hong Kong) Limited Futures and options investment and settlement
services
100.00 100.00 100.00
Global Treasure Investments Limited Investment services 100.00 100.00 100.00
KGI Investments Management Limited Insurance brokerage 100.00 100.00 100.00
KGI International Finance Limited Investment and financing services 100.00 100.00 100.00
KGI Hong Kong Limited Management and consulting 100.00 100.00 100.00
KGI Asia Limited Securities investment 100.00 100.00 100.00
KGI Capital Asia Limited Securities investment 100.00 100.00 100.00
KGI Asset Management Limited Asset management 100.00 100.00 100.00
TG Holborn (HK) Limited Other - 100.00 100.00 (Note 4)
KGI Nominees (Hong Kong) Limited Trust agent 100.00 100.00 100.00
Supersonic Services Inc. KGI Korea Limited Investment holdings 100.00 100.00 100.00
KGI International Limited KGI Asia (Holdings) Pte. Ltd. Investment holdings 100.00 100.00 100.00
KGI Capital (Singapore) Pte. Ltd. Futures investment services 100.00 100.00 100.00 (Note 5)
(Continued)

- 214 -
Investor Company Subsidiaries Main Business and Products
Percentage of Ownership
Note June 30, 2019
December 31,
2018 June 30, 2018
KGI Capital Asia Limited KGI Alliance Corporation Investment services 100.00 100.00 100.00
KGI International (Hong Kong) Limited Derivative product services 100.00 100.00 100.00
KGI Finance Limited Investment and financing services 100.00 100.00 100.00
PT KGI Sekuritas Indonesia Securities investment 99.00 99.00 99.00
KGI Asia Limited Grand Cathay Capital (Hong Kong) Limited Investment services - - 100.00 (Note 6)
KGI Asia (Holdings) Pte. Ltd. KGI Securities (Singapore) Pte. Ltd. Securities and futures investment services 100.00 100.00 100.00
KGI Bank CDIB Management Consulting Corporation Management and consulting 100.00 100.00 100.00
CDIB Management Consulting Corporation CDC Finance & Leasing Corp. Leasing 76.04 76.04 76.04
CDIB International Leasing Corp. Leasing 100.00 100.00 100.00
China Development Asset Management Corp. Development Industrial Bank Asset Management Corp. Trading and management of nonperforming
loans of financial institutions
100.00 100.00 100.00
Chung Hwa Growth 3 Asset Management Corp. Trading and management of nonperforming
loans of financial institutions
100.00 100.00 100.00
Chung Hwa Growth 4 Asset Management Corp. Trading and management of nonperforming
loans of financial institutions
100.00 100.00 100.00
Note 1: The Corporation and the subsidiary, KGI securities, jointly held 34.82%, 34.96% and 34.96% of shares of China Life Insurance Co., Ltd on June 30, 2019, December 31, 2018 and June 30, 2018, respectively..
Note 2: KGI Securities held 21.99% of the shares of Global Securities Finance Corporation (GSFC) and obtained more than half of the seats in the board of director, therefore, GSFC should be included in the consolidated financial statements.
Note 3: KGI Information Technology (Shanghai) Co., Ltd. conducted registration of establishment on May 30, 2016, however, KGI Information Technology Co., Ltd. had not invested any capital as of December 28, 2018.
Note 4: TG Holborn (HK) Limited was closed in June 26, 2019.
Note 5: KGI Capital (Singapore) Pte. Ltd. has been discontinued.
Note 6: Grand Cathay Capital (Hong Kong) Limited was closed in October 23, 2018.
(Continued)

- 215 -
Unconsolidated subsidiaries
Investor Company Subsidiaries Main Business and Products
Percentage of Ownership
Note June 30, 2019
December 31,
2018 June 30, 2018
CDIB Capital Group CDIB Biotech USA Investment Co., Ltd. Venture fund - - 50.00 CDIB Biotech USA Investment Co.,
Ltd. was approbated to liquidate
by the Board of Director on April
20, 2008, therefore, CDIB Biotech
USA Investment Co., Ltd. was not
included in the consolidated
financial statement. The company
had liquidated completely in
October 2018.
CDIB Capital Investment I Limited Subicvest Inc. Leasing - - 100.00 Subicvest Inc. was approbated to
liquidate by the Board of Director
on May 24, 2016, therefore,
Subicvest was not included in the
consolidated financial statement.
The company had liquidated
completely in October 2018.
(Concluded)

- 216 -
TABLE 9
CHINA DEVELOPMENT FINANCIAL HOLDING CORPORATION AND
SUBSIDIARIES
DECLARATION OF SUBSIDIARIES’ CREDITS, ENDORSEMENTS OR OTHER
TRANSACTIONS WITH THE SAME PERSON, RELATED PARTY OR AFFILIATE
JUNE 30, 2019
(In Millions of New Taiwan Dollars; %)
The Corporation
Counter-party
Total Amounts
of Credits,
Endorsements
and Other
Transactions
Ratio to Net
Asset Value of
the Corporation
(%)
1. The same customer
Ministry of Finance, R.O.C. $ 131,204 72.33
Taipower Corporation 16,338 9.01
KG Investment Holdings Limited 14,662 8.08
CITIGROUP INC 11,606 6.40
AT&T Inc. 11,330 6.25
Hon Hai Precision Industry Co., Ltd. 10,383 5.72
COMCAST CORP 9,784 5.39
BANK OF AMERICA CORP 9,747 5.37
FANNIE MAE 9,350 5.15
JPMORGAN CHASE & CO 9,020 4.97
GOLDMAN SACHS GROUP INC. 8,999 4.96
VERIZON COMMUNICATIONS 8,765 4.83
QNB FINANCE LTD 8,199 4.52
DEUTSCHE BANK AG 7,648 4.22
NOMURA INTL FUNDING PTE 7,483 4.13
SOCIETE GENERALE 7,111 3.92
Natixis S.A. 7,055 3.89
ADCB FINANCE CAYMAN LTD 7,046 3.88
NATIONAL BANK OF CANADA 7,038 3.88
WELLS FARGO & COMPANY 6,918 3.81
MORGAN STANLEY 6,660 3.67
Republic Of Indonesia 6,643 3.66
CDIB & Partners Investment Holding Corporation 6,403 3.53
Alibaba Group Holding Limited 6,365 3.51
MEXICO 6,159 3.40
FREDDIE MAC 6,116 3.37
HSBC HOLDINGS PLC 6,008 3.31
ROYAL BANK OF CANADA 5,973 3.29
EDF 5,832 3.21
BNP-PARIBAS SA 5,826 3.21
GOVERNMENT NATL MORTGAGE ASSOCIATION 5,677 3.13
(Continued)

- 217 -
Counter-party
Total Amounts
of Credits,
Endorsements
and Other
Transactions
Ratio to Net
Asset Value of
the Corporation
(%)
TSMC $ 5,478 3.02
SAUDI INTERNATIONAL BOND 5,444 3.00
US TREASURY N/B 5,232 2.88
STANDARD CHARTERED PLC 5,131 2.83
Cathay Life Insurance Co.,Ltd. 5,097 2.81
Barclays Plc 5,088 2.80
Nan Ya Plastics Corporation 5,071 2.80
Anheuser-Busch Inbev Finance Inc 5,058 2.79
WESTPAC BANKING CORP 4,869 2.68
COMISION FED DE Electric 4,833 2.66
COOPERATIEVE RABOBANK UA 4,792 2.64
Malayan Banking Bhd 4,792 2.64
Anheuser-Busch Inbev Worldwide Inc 4,771 2.63
RUSSIAN FEDERATION 4,531 2.50
FORMOSA CHEMICALS and FIBRE Corp. 4,424 2.44
CCB Life Insurance Co., Ltd. 4,375 2.41
FIRST ABU DHABI BANK PJSC 4,328 2.39
Cathay Financial Holdings Co., Ltd. 4,306 2.37
Credit Suisse Group AG 4,242 2.34
DBS Bank Ltd. 4,144 2.28
CTCI Develpoment Corp. 3,963 2.18
CREDIT SUISSE LONDON BRANCH 3,848 2.12
LLOYDS BANK PLC 3,816 2.10
BARCLAYS BANK PLC 3,787 2.09
KOMMUNALBANKEN AS 3,787 2.09
CVS Health Corp 3,692 2.04
CDIB Capital Asia Partners 3,661 2.02
Taiwan Cement Corp. 3,557 1.96
The Export-Import Bank of the Republic of China 3,514 1.94
E.SUN Commercial Bank, Ltd. 3,463 1.91
Emirates NBD Bank PJSC 3,359 1.85
KGI Futures Co., Ltd. 3,327 1.83
RELIANCE INDUSTRIES LIMITED 3,324 1.83
BPCE SA 3,264 1.80
Tencent Holdings Ltd. 3,220 1.78
Cathay United Commercial Bank 3,207 1.77
BANK OF NOVA SCOTIA 3,199 1.76
Saudi Arabian Oil Company 3,197 1.76
SinoPac Financial Holdings Company Limited 3,110 1.71
PT Pertamina (Persero) 3,086 1.70
CTBC Financial Holding Co., Ltd. 3,083 1.70
Total $ 545,818 300.89
(Continued)

- 218 -
Counter-party
Total Amounts
of Credits,
Endorsements
and Other
Transactions
Ratio to Net
Asset Value of
the Corporation
(%)
2. The same group
Lin Yuan Group $ 17,433 9.61
Foxconn Technology Group 16,401 9.04
Far Eastern Group 12,082 6.66
CITI Group 12,071 6.65
HSBC Group 11,381 6.27
BPCE Group 10,318 5.69
AB InBev Group 10,075 5.55
Bank of America Group 10,015 5.52
Fubon Group 9,736 5.37
JPMorgan Chase Group 9,648 5.32
Credit Suisse Group 9,194 5.07
Deutsche Bank Group 9,124 5.03
Goldman Sachs Group 8,999 4.96
Barclays Bank Group 8,875 4.89
Gateway Real Estate Fund Group 7,681 4.23
Nomura Group 7,534 4.15
Formosa Plastic Group 7,464 4.11
China Construction Bank Group 7,394 4.08
Societe Generale Group 7,111 3.92
Wells Fargo Bank Group 6,942 3.83
CTBC Group 6,841 3.77
Morgan Stanle Group 6,660 3.67
ASE Group 6,458 3.56
YFY Group 6,448 3.55
LLOYDSBK Group 6,432 3.55
Royal Bank of Canada Group 6,345 3.50
TSMC Group 6,182 3.41
BNP Paribas Group 5,921 3.26
CTCI Group 5,738 3.16
Westpac Banking Group 5,735 3.16
FAB Group 5,734 3.16
Ruentex Group 5,683 3.13
Standard Chartered Group 5,401 2.98
Taishin Group 5,133 2.83
Nanya Plastics Group 5,085 2.80
DBS Group 4,932 2.72
Tencent Group 4,884 2.69
ICBC Group 4,845 2.67
Qsan Technology Group 4,795 2.64
China Development Bank Group 4,762 2.63
Shin Kong Group 4,673 2.58
(Continued)

- 219 -
Counter-party
Total Amounts
of Credits,
Endorsements
and Other
Transactions
Ratio to Net
Asset Value of
the Corporation
(%)
Formosa Chemicals and Fiber Group $ 4,663 2.57
E.SUN Financial Holding Group 4,528 2.50
Mega Financial Holding Group 4,458 2.46
Bank of China Group 4,379 2.41
Evergreen Group 4,209 2.32
Walsin Group 4,192 2.31
Taiwan Cement Group 4,015 2.21
Sinopec Group 3,844 2.12
RELIANCE INDUSTRIES LIMITED Group 3,635 2.00
Farglory Group 3,588 1.98
First Financial Holding Group 3,583 1.98
Yulon Group 3,527 1.94
Chailease Group 3,241 1.79
ScotiaBank Group 3,199 1.76
National Australia Bank Group 3,140 1.73
AU Optronics Group 3,127 1.72
Total $ 379,493 209.20
(Concluded)

- 220 -
TABLE 10
CHINA DEVELOPMENT FINANCIAL HOLDING CORPORATION AND
SUBSIDIARIES
CONDENSED BALANCE SHEETS AND STATEMENTS OF INCOME
The Corporation
1. Balance sheets
(In Thousands of New Taiwan Dollars)
Assets
June 30,
2019
December 31,
2018
June 30,
2018
Cash and cash equivalents $ 7,562,660 $ 4,570,426 $ 7,787,766 Financial assets at fair value through profit or loss 103,334 471,765 947,070
Receivables, net 104,823 50,567 768,358
Current tax assets 1,889,262 1,881,337 1,450,798 Investments accounted for using the equity method, net 207,716,054 185,756,820 191,843,073
Other financial assets 300 500,300 300
Right-of-use assets 4,743 - - Property and equipment, net 28,697 28,054 24,877
Other assets, net 37,779 33,988 25,697
Total $ 217,447,652 $ 193,293,257 $ 202,847,939
Liabilities and Equity
Commercial paper payable, net $ 8,999,434 $ 9,898,975 $ 9,199,397
Payables 5,242,143 722,528 9,706,535
Current tax liabilities 474,098 1,129,319 900,773
Bonds payable 18,000,000 19,000,000 19,000,000 Other borrowings 3,299,871 3,299,951 3,299,803
Provisions 6,948 6,946 18,853
Lease liabilities 5,103 - - Other liabilities 17,322 2,855 10,972
Total liabilities 36,044,919 34,060,574 42,136,333
Equity
Capital
Common stock 149,659,821 149,622,812 149,572,949
Advance receipts for capital stock - 10,748 - Capital surplus 883,080 1,630,992 1,240,569
Retained earnings
Legal reserve 7,561,404 6,776,135 6,776,135 Special reserve 10,797,899 565,041 565,041
Unappropriated earnings 8,004,636 14,754,530 12,923,727
Other Exchange differences on translation of financial statements of
foreign operations (385,461 ) (930,286 ) (1,196,570 )
Unrealized gain (loss) on equity instruments at fair value through other comprehensive income 1,439,137 (66,615 ) 792,905
Unrealized gain (loss) on debt instruments at fair value through
other comprehensive income 5,438,585 (5,071,947 ) (4,709,541 ) Other comprehensive income (loss) reclassified using the overlay
approach 1,383,393 (4,451,944 ) (1,387,854 )
Others (527 ) (1,339 ) (4,361 ) Treasury shares (3,379,234 ) (3,605,444 ) (3,861,394 )
Total equity 181,402,733 159,232,683 160,711,606
Total $ 217,447,652 $ 193,293,257 $ 202,847,939
(Continued)

- 221 -
2. Statements of comprehensive income
(In Thousands of New Taiwan Dollars, Except Earnings Per Share)
For the Three Months Ended
June 30 For the Six Months Ended
June 30
2019 2018 2019 2018
REVENUES
Share of profit of subsidiaries, associates
and joint ventures $ 4,587,277 $ 3,407,607 $ 8,524,153 $ 7,045,875
Others 2,258 4,210 41,732 4,426
Total revenues 4,589,535 3,411,817 8,565,885 7,050,301
EXPENSES AND LOSSES
Operating expenses (322,353) (228,150) (622,041) (515,597)
Others (101,620) (103,114) (205,080) (249,113)
Total expenses and losses (423,973) (331,264) (827,121) (764,710)
NET PROFIT BEFORE INCOME TAX 4,165,562 3,080,553 7,738,764 6,285,591
INCOME TAX BENEFIT (EXPENSE) 26,188 (306,777) 62,679 (235,191)
NET PROFIT FOR THE PERIOD 4,191,750 2,773,776 7,801,443 6,050,400
OTHER COMPREHENSIVE INCOME
(LOSS)
Items that will not be reclassified
subsequently to profit or loss, net of
income tax
Share of the other comprehensive
income (loss) of subsidiaries,
associates and joint ventures 119,228 (902,154) 1,818,615 (1,212,098)
Income tax relating to the items that
will not be reclassified subsequently
to profit or loss 14,858 136,124 (171,130) 203,849
Items that will be reclassified
subsequently to profit or loss, net of
income tax
Share of other comprehensive income
(loss) of subsidiaries, associates and
joint ventures 7,427,693 (2,421,073) 19,183,099 (9,260,836)
Income tax relating to the items that
may be reclassified subsequently to
profit or loss (918,990) 658,736 (2,272,343) 1,404,898
Other comprehensive income (loss)
for the period, net of income tax 6,642,789 (2,528,367) 18,558,241 (8,864,187)
TOTAL COMPREHENSIVE INCOME
(LOSS) FOR THE PERIOD $ 10,834,539 $ 245,409 $ 26,359,684 $ (2,813,787)
BASIC EARNINGS PER SHARE $0.29 $0.19 $0.54 $0.42
DILUTED EARNINGS PER SHARE $0.29 $0.19 $0.54 $0.42
(Continued)

- 222 -
3. Statements of changes in equity
(In Thousands of New Taiwan Dollars, Except Per Share Amount)
Other Equity
Capital
Exchange
Differences on
Unrealized Gains
(Losses) on
Financial Assets
at Fair Value
Unrealized Gains
(Losses) on
Other
Comprehensive
Income (Loss)
Reclassified
Advance Receipts Retained Earnings Translation of through Other Available-for- Using the
for Capital Unappropriated Foreign Financial Comprehensive sale Financial Overlay
Common Stock Stock Capital Surplus Legal Reserve Special Reserve Earnings Statements Income Assets Approach Others Treasury Shares Total Equity
BALANCE AT JANUARY 1, 2018 $ 149,763,034 $ 5,162 $ 1,173,719 $ 5,606,606 $ 2,078,602 $ 13,184,948 $ (2,031,949 ) $ - $ 2,113,838 $ - $ (8,322 ) $ (4,205,566 ) $ 167,680,072
Effect of retrospective application and retrospective restatement - - - - - 2,179,121 - 3,949,970 (2,113,838 ) 545,309 - - 4,560,562
BALANCE AT JANUARY 1, 2018 AS RESTATED 149,763,034 5,162 1,173,719 5,606,606 2,078,602 15,364,069 (2,031,949 ) 3,949,970 - 545,309 (8,322 ) (4,205,566 ) 172,240,634
Appropriation of the 2017 earnings
Legal reserve - - - 1,169,529 - (1,169,529 ) - - - - - - -
Cash dividends - NT$0.6 per share - - - - - (8,974,377 ) - - - - - - (8,974,377 )
Reversal of special reserve - - - - (1,513,561 ) 1,513,561 - - - - - - -
- - - 1,169,529 (1,513,561 ) (8,630,345 ) - - - - - - (8,974,377 )
Net profit for the six months ended June 30, 2018 - - - - - 6,050,400 - - - - - - 6,050,400
Other comprehensive income (loss) for the six months ended June 30, 2018, net of income
tax - - - - - 59 835,379 (7,766,462 ) - (1,933,163 ) - - (8,864,187 )
Total comprehensive income (loss) for the six months ended June 30, 2018 - - - - - 6,050,459 835,379 (7,766,462 ) - (1,933,163 ) - - (2,813,787 )
Cancellation of treasury shares (206,461 ) - - - - - - - - - - 206,461 -
Disposal of the Corporation shares, as treasury shares - - 65,318 - - - - - - - - 137,711 203,029
Share-based payments 16,376 (5,162 ) 1,532 - - - - - - - 3,961 - 16,707
Disposal of equity instruments at fair value through other comprehensive income - - - - - 100,144 - (100,144 ) - - - - -
Changes in special reserve of subsidiaries - - - - - 39,400 - - - - - - 39,400
BALANCE AT JUNE 30, 2018 $ 149,572,949 $ - $ 1,240,569 $ 6,776,135 $ 565,041 $ 12,923,727 $ (1,196,570 ) $ (3,916,636 ) $ - $ (1,387,854 ) $ (4,361 ) $ (3,861,394 ) $ 160,711,606
BALANCE AT JANUARY 1, 2019 $ 149,622,812 $ 10,748 $ 1,630,992 $ 6,776,135 $ 565,041 $ 14,754,530 $ (930,286 ) $ (5,138,562 ) $ - $ (4,451,944 ) $ (1,339 ) $ (3,605,444 ) $ 159,232,683
Appropriation of 2018 earnings
Legal reserve - - - 785,269 - (785,269 ) - - - - - - -
Special reserve - - - - 10,232,858 (10,232,858 ) - - - - - - -
Cash dividends - NT$0.245 per share - - - - - (3,666,666 ) - - - - - - (3,666,666 )
- - - 785,269 10,232,858 (14,684,793 ) - - - - - - (3,666,666 )
Changes in capital surplus from investments in associates and joint ventures accounted for
using the equity method - - (391 ) - - - - - - - - - (391 )
Issuance of cash dividends from capital surplus - - (823,129 ) - - - - - - - - - (823,129 )
Other change in capital surplus - - 54,273 - - - - - - - - - 54,273
Net profit for the six months ended June 30, 2019 - - - - - 7,801,443 - - - - - - 7,801,443
Other comprehensive income (loss) for the six months ended June 30, 2019, net of income
tax - - - - - (851 ) 544,848 12,173,585 - 5,840,659 - - 18,558,241
Total comprehensive income (loss) for the six months ended June 30, 2019 - - - - - 7,800,592 544,848 12,173,585 - 5,840,659 - - 26,359,684
Disposal of the Corporation shares, as treasury shares - - 87,765 - - - - - - - - 218,911 306,676
Share-based payments 37,009 (10,748 ) 1,180 - - (6,793 ) - - - - 812 - 21,460
Changes in percentage of ownership interests in subsidiaries - - (67,610 ) - - (972 ) (23 ) (11,727 ) - (5,322 ) - 7,299 (78,355 )
Disposal of equity instruments at fair value through other comprehensive income - - - - - 145,574 - (145,574 ) - - - - -
Changes in special reserve of subsidiaries - - - - - (3,502 ) - - - - - - (3,502 )
BALANCE AT JUNE 30, 2019 $ 149,659,821 $ - $ 883,080 $ 7,561,404 $ 10,797,899 $ 8,004,636 $ (385,461 ) $ 6,877,722 $ - $ 1,383,393 $ (527 ) $ (3,379,234 ) $ 181,402,733
(Continued)

- 223 -
4. Statements of cash flows
(In Thousands of New Taiwan Dollars)
For the Six Months Ended
June 30
2019 2018
CASH FLOWS FROM OPERATING ACTIVITIES
Net profit before income tax $ 7,738,764 $ 6,285,591
Adjustments for:
Depreciation and amortization expenses 3,745 2,330
Gain (loss) on financial assets at fair value through profit or
loss, net (24,096) 32,340
Interest expense 196,723 208,639
Interest income (14,439) (1,173)
Share-based payment compensation cost 875 5,850
Share of profit of subsidiaries, associates and joint ventures (8,475,613) (7,044,565)
Changes in operating assets and liabilities
Financial assets at fair value through profit or loss 392,527 365,500
Receivables (55,049) 3,690
Other financial assets 500,000 -
Other assets (9,421) 1,389
Payables (25,536) (1,726)
Other liabilities 14,468 (14,212)
Interest paid (136,702) (172,006)
Interest received 15,232 1,173
Dividend received 5,466,966 10,819,942
Income tax paid (600,468) (23,725)
Net cash generated from operating activities 4,987,976 10,469,037
CASH FLOWS FROM INVESTING ACTIVITIES
Purchase of equity investment under equity method (3,112,710) -
Acquisition of property and equipment (2,459) (4,672)
Capital reserve be distributable as dividend shares by cash on
investments accounted for using the equity method 3,000,000 -
Net cash used in investing activities (115,169) (4,672)
CASH FLOWS FROM FINANCING ACTIVITIES
Decrease in commercial paper payable (899,541) (699,968)
Repayments of corporate bonds (1,000,000) (3,000,000)
Others 18,968 8,822
Net cash used in financing activities (1,880,573) (3,691,146)
NET INCREASE IN CASH AND CASH EQUIVALENTS 2,992,234 6,773,219
CASH AND CASH EQUIVALENTS AT THE BEGINNING OF
THE PERIOD 4,570,426 1,014,547
CASH AND CASH EQUIVALENTS AT THE END OF THE
PERIOD $ 7,562,660 $ 7,787,766
(Continued)

- 224 -
KGI Bank
1. Condensed balance sheets
(In Thousands of New Taiwan Dollars)
June 30,
2019
December 31,
2018
June 30,
2018
Cash and cash equivalents, due from the Central
Bank and call loans to banks $ 44,196,302 $ 33,083,932 $ 39,499,232
Financial assets at fair value through profit or loss 98,792,025 81,922,752 98,112,987
Financial assets at fair value through other
comprehensive income (loss) 137,423,654 151,669,704 145,584,944
Debt instruments measured at amortized cost 12,100,300 11,965,807 11,880,146
Securities purchased under resell agreements 18,837,196 15,164,692 21,240,195
Receivables, net 22,642,377 24,305,714 25,973,186
Assets held for sale, net - 29,649 -
Discount and loans, net 355,267,323 335,751,432 330,752,368
Investments accounted for using the equity
method, net 1,786,077 1,654,220 1,762,023
Other financial assets, net 1,130,800 1,476,948 2,990,260
Property and equipment, net 5,323,797 5,374,246 5,534,714
Right-of-use assets, net 2,325,725 - -
Investment property, net 1,105,577 1,108,910 969,550
Deferred tax assets 2,261,196 2,176,684 2,839,524
Other assets, net 5,927,006 13,491,511 17,789,787
Total assets $ 709,119,355 $ 679,176,201 $ 704,928,916
Deposits from the Central Bank and banks $ 20,762,230 $ 21,359,259 $ 33,535,560
Financial liabilities at fair value through profit or
loss 83,863,042 73,866,749 92,128,647
Notes and bonds issued under repurchase
agreements 45,633,002 60,303,682 61,319,474
Payables 10,379,880 6,940,026 7,919,013
Current tax liabilities 541,361 530,563 435,483
Deposits and remittances 448,275,797 421,726,228 425,351,001
Bank debentures payable 10,450,000 7,350,000 1,000,000
Principal received on structured notes 20,110,583 24,020,358 19,912,294
Other financial liabilities - 3,716 4,078
Provisions 431,010 331,602 320,738
Lease liabilities 2,320,784 - -
Deferred tax liabilities 425,382 24,413 230,315
Other liabilities 3,155,678 4,345,130 4,555,256
Total liabilities 646,348,749 620,801,726 646,711,859
Common stock 46,061,623 46,061,623 46,061,623
Capital surplus 7,251,242 7,251,173 7,250,905
Retained earnings 8,432,377 6,567,132 5,958,700
Others 1,025,364 (1,505,453) (1,054,171)
Total equity 62,770,606 58,374,475 58,217,057
Total liabilities and equity $ 709,119,355 $ 679,176,201 $ 704,928,916
(Continued)

- 225 -
2. Condensed statements of comprehensive income
(In Thousands of New Taiwan Dollars, Except Earnings Per Share)
For the Three Months Ended
June 30 For the Six Months Ended
June 30
2019 2018 2019 2018
Interest revenue $ 3,439,702 $ 3,237,032 $ 6,908,553 $ 6,204,258
Interest expense (1,794,505) (1,434,065) (3,648,433) (2,647,370)
Interest profit, net 1,645,197 1,802,967 3,260,120 3,556,888
Noninterest profits and gains, net 1,091,156 569,695 2,052,632 1,035,170
Total net revenues 2,736,353 2,372,662 5,312,752 4,592,058
Reversal of allowance (allowance)
for bad debts and losses on
guarantees, net (85,682) 41,552 (84,953) (142,820)
Operating expenses (1,493,732) (1,401,252) (2,974,086) (2,784,224)
Net profit before income tax 1,156,939 1,012,962 2,253,713 1,665,014
Income tax expense (198,284) (155,618) (392,742) (115,467)
Net profit for the period 958,655 857,344 1,860,971 1,549,547
Other comprehensive income (loss)
for the period, net of income tax 589,335 (261,153) 2,535,091 (1,349,245)
Total comprehensive income (loss)
for the period $ 1,547,990 $ 596,191 $ 4,396,062 $ 200,302
Basic earnings per share $0.21 $0.19 $0.40 $0.34
(Continued)

- 226 -
KGI Securities
1. Condensed balance sheets
(In Thousands of New Taiwan Dollars)
June 30,
2019
December 31,
2018
June 30,
2018
Current assets $ 159,959,322 $ 136,199,128 $ 161,569,005
Noncurrent assets 48,431,646 43,193,399 43,093,365
Total assets $ 208,390,968 $ 179,392,527 $ 204,662,370
Current liabilities $ 141,706,607 $ 114,059,600 $ 139,734,375
Noncurrent liabilities 2,224,104 6,914,191 6,936,562
Total liabilities 143,930,711 120,973,791 146,670,937
Common stock 32,418,432 32,418,432 32,418,432
Capital surplus 8,648,397 8,648,158 8,647,392
Retained earnings 22,565,866 21,243,911 19,616,769
Others 827,562 (3,891,765) (2,691,160)
Total equity 64,460,257 58,418,736 57,991,433
Total liabilities and equity $ 208,390,968 $ 179,392,527 $ 204,662,370
2. Condensed statements of comprehensive income
(In Thousands of New Taiwan Dollars, Except Earnings Per Share)
For the Three Months Ended
June 30 For the Six Months Ended
June 30
2019 2018 2019 2018
Revenues $ 2,356,964 $ 2,821,824 $ 4,947,834 $ 5,256,825
Costs and expenses (2,197,866) (2,314,491) (4,351,281) (4,397,632)
Profit from operations 159,098 507,333 596,553 859,193
Share of profit (loss) of
subsidiaries, associates and joint
ventures 869,830 545,960 1,685,919 1,251,109
Other income and loss 366,146 141,821 557,084 201,654
Total non-operating income or loss 1,235,976 687,781 2,243,003 1,452,763
Net profit before income tax 1,395,074 1,195,114 2,839,556 2,311,956
Income tax benefit (expense) 182,612 (130,575) 146,214 (277,100)
Net profit for the period 1,577,686 1,064,539 2,985,770 2,034,856
Other comprehensive income (loss)
for the period, net of income tax 1,499,513 (256,279) 4,665,190 (1,679,317)
Total comprehensive income (loss)
for the period $ 3,077,199 $ 808,260 $ 7,650,960 $ 355,539
Basic earnings per share $0.49 $0.33 $0.92 $0.63
(Continued)

- 227 -
CDIB Capital Group
1. Condensed balance sheets
(In Thousands of New Taiwan Dollars)
June 30,
2019
December 31,
2018
June 30,
2018
Current assets $ 4,313,942 $ 6,813,888 $ 7,344,733
Noncurrent assets 41,232,046 42,775,502 47,444,926
Total assets $ 45,545,988 $ 49,589,390 $ 54,789,659
Current liabilities $ 1,005,233 $ 941,433 $ 821,697
Noncurrent liabilities 914,710 961,867 1,111,968
Total liabilities 1,919,943 1,903,300 1,933,665
Common stock 20,411,159 20,411,159 20,411,159
Capital surplus 590,103 589,866 4,689,088
Retained earnings 21,431,421 26,234,466 27,338,905
Others 1,193,362 450,599 416,842
Total equity 43,626,045 47,686,090 52,855,994
Total liabilities and equity $ 45,545,988 $ 49,589,390 $ 54,789,659
2. Condensed statements of comprehensive income
(In Thousands of New Taiwan Dollars, Except Earnings Per Share)
For the Three Months Ended
June 30 For the Six Months Ended
June 30
2019 2018 2019 2018
Operating revenues $ 1,356,295 $ 1,238,658 $ 2,727,375 $ 2,793,741
Operating expenses (160,850) (140,269) (347,427) (332,276)
Profit from operations 1,195,445 1,098,389 2,379,948 2,461,465
Non-operating income and
expenses 43,376 147,749 84,324 121,684
Net profit before income tax 1,238,821 1,246,138 2,464,272 2,583,149
Income tax benefit (expense) 35,951 (58,231) 46,690 (67,475)
Net profit for the period 1,274,772 1,187,907 2,510,962 2,515,674
Other comprehensive income (loss)
for the period, net of income tax 345,552 812,100 742,763 408,091
Total comprehensive income (loss)
for the period $ 1,620,324 $ 2,000,007 $ 3,253,725 $ 2,923,765
Basic earnings per share $0.62 $0.58 $1.23 $1.23
(Continued)

- 228 -
China Development Asset Management Corp.
1. Condensed balance sheets
(In Thousands of New Taiwan Dollars)
June 30,
2019
December 31,
2018
June 30,
2018
Current assets $ 65,449 $ 71,658 $ 55,451
Noncurrent assets 3,109,757 3,120,035 3,134,042
Total assets $ 3,175,206 $ 3,191,693 $ 3,189,493
Current liabilities $ 825,650 $ 831,179 $ 819,969
Noncurrent liabilities 1,596 1,596 1,712
Total liabilities 827,246 832,775 821,681
Common Stock 2,000,000 2,000,000 2,000,000
Capital surplus 8,747 8,747 8,743
Retained earnings 360,571 370,120 378,479
Others (21,358) (19,949) (19,410)
Total equity 2,347,960 2,358,918 2,367,812
Total liabilities and equity $ 3,175,206 $ 3,191,693 $ 3,189,493
2. Condensed statements of comprehensive income
(In Thousands of New Taiwan Dollars, Except Per Share Amount)
For the Three Months Ended
June 30 For the Six Months Ended
June 30
2019 2018 2019 2018
Revenues and gains $ 41,664 $ 29,970 $ 68,945 $ 88,475
Expenses and losses (19,900) (17,499) (31,396) (41,715)
Net profit before income tax 21,764 12,471 37,549 46,760
Income tax expense (1,957) (578) (2,359) (3,144)
Net profit for the period 19,807 11,893 35,190 43,616
Other comprehensive income (loss)
for the period, net of income tax (1,409) 385 (1,409) 385
Total comprehensive income (loss)
for the period $ 18,398 $ 12,278 $ 33,781 $ 44,001
Basic earnings per share $0.10 $0.06 $0.18 $0.22
(Continued)

- 229 -
China Life Insurance Co., Ltd.
1. Condensed balance sheets
(In Thousands of New Taiwan Dollars)
June 30,
2019
December 31,
2018
June 30,
2018
Cash and cash equivalents $ 35,058,332 $ 42,947,426 $ 48,852,238
Receivables 25,613,894 17,549,054 14,362,926
Current tax assets 526,131 499,407 81,138
Financial assets at fair value through profit or
loss 292,003,492 215,549,254 207,724,881
Financial assets at fair value through other
comprehensive income (loss) 362,672,751 323,006,735 299,810,106
Financial assets measured at amortized cost 1,011,070,446 950,482,240 885,164,684
Investment property 23,143,515 23,143,854 23,076,973
Loans 33,492,128 33,379,965 32,838,905
Reinsurance assets 658,590 534,353 567,242
Property and equipment 12,291,152 10,722,338 9,739,365
Right-of-use assets 15,328,280 - -
Intangible assets 192,095 230,128 183,978
Deferred tax assets 5,638,009 9,949,639 8,988,626
Other assets 7,574,683 19,859,278 26,741,483
Separate account product assets 71,491,586 63,501,665 62,878,397
Total assets $ 1,896,755,084 $ 1,711,355,336 $ 1,621,010,942
Payables $ 18,148,459 $ 10,727,086 $ 13,267,194
Current tax liabilities 120,624 - 692,854
Financial liabilities at fair value through profit
or loss 6,011,132 2,469,127 19,407,405
Lease liabilities 2,238,490 - -
Insurance liabilities 1,656,037,283 1,552,528,196 1,436,255,645
Foreign exchange valuation reserve 5,191,880 3,169,331 3,070,346
Provisions 116,142 134,940 118,976
Deferred tax liabilities 4,235,919 1,342,297 993,297
Other liabilities 3,228,700 4,388,310 3,277,305
Separate account product liabilities 71,491,586 63,501,665 62,878,397
Total liabilities 1,766,820,215 1,638,260,952 1,539,961,419
Common stock 44,635,823 40,135,823 40,135,823
Capital surplus 7,214,523 2,289,273 2,289,273
Retained earnings 55,708,229 48,243,509 44,711,220
Others 22,376,294 (17,574,221) (6,086,793)
Total equity 129,934,869 73,094,384 81,049,523
Total liabilities and equity $ 1,896,755,084 $ 1,711,355,336 $ 1,621,010,942
(Continued)

- 230 -
2. Condensed statements of comprehensive income
(In Thousands of New Taiwan Dollars, Except Earnings Per Share)
For the Three Months Ended
June 30 For the Six Months Ended
June 30
2019 2018 2019 2018
Operating revenues $ 84,621,355 $ 82,876,859 $ 176,989,711 $ 156,187,489
Operating costs (77,870,278) (79,415,558) (165,653,891) (148,493,597)
Operating expenses (1,613,711) (1,029,447) (2,995,255) (2,545,115)
Profit from operations 5,137,366 2,431,854 8,340,565 5,148,777
Non-operating income and
expenses 1,059 548,149 4,327 553,075
Income from continuing operations
before income tax 5,138,425 2,980,003 8,344,892 5,701,852
Income tax benefit (expense) (494,363) (399,309) (895,265) 556,775
Net income 4,644,062 2,580,694 7,449,627 6,258,627
Other comprehensive income (loss)
for the period, net of income tax 14,274,037 (10,107,799) 39,975,627 (23,561,556)
Total comprehensive income (loss)
for the period $ 18,918,099 $ (7,527,105) $ 47,425,254 $ (17,302,929)
Basic earnings per share $1.15 $0.64 $1.85 $1.56
(Concluded)

- 231 -
TABLE 11
CHINA DEVELOPMENT FINANCIAL HOLDING CORPORATION AND SUBSIDIARIES
INFORMATION ON INVESTMENTS IN MAINLAND CHINA
JUNE 30, 2019
(In Thousands of New Taiwan Dollars, Unless Stated Otherwise)
Investee Company Name Main Businesses and Products Total Paid-in
Capital Investment Type
Accumulated
Outflow of
Investment from
Taiwan as of
January 1, 2019
Investment Flows Accumulated
Outflow of
Investment from
Taiwan as of
June 30, 2019
(Note 4)
Net Income
(Loss) of the
Investee
% Ownership of
Direct or Indirect
Investment
Investment Gain
Carrying
Value as of
June 30, 2019
Accumulated
Inward
Remittance of
Earnings as of
June 30, 2019
Outflow Inflow
Beauty Essential International (Shanghai)
Ltd.
Sale and R&D of the cosmetics. US$ 2,000
thousand
Note 1,b,1) US$ 2,262
thousand
$ - $ - US$ 2,262
thousand
(Note 3) 8.86 $ - $ 67,521 $ -
Beauteek (Shanghai) Co., Ltd. Cosmetics and sin care products sales. US$ 1,700
thousand
Note 1,b,1) - US$ 53
thousand
- US$ 53
thousand
(Note 3) - - 1,633 -
Shanghai Derby Software Co., Ltd. The next-generation electronic distribution
channel operator serving China’s hotel
industry.
US$ 10,000
thousand
Note 1,b,2) US$ 3,267
thousand
- - US$ 3,267
thousand
(Note 3) 6.87 - 107,235 -
Triplex International Biosciences
(Fujian)
Manufacture, sale and R&D medical
diagnostic reagents and instruments.
US$ 35,200
thousand
Note 1,b,3) US$ 1,400
thousand
- - US$ 1,400
thousand
(Note 3) 1.66 - 45,003 -
Hartec Technology (Kunshan) Co., Ltd. NB EMI sputtering. US$ 17,130
thousand
Note 1,b,4) US$ 3,000
thousand
- - US$ 3,000
thousand
(Note 3) 10.23 - 99,603 -
Great Team Backend Foundry
(Dongguan) Ltd.
Analog IC testing and packaging. US$ 87,070
thousand
Note 1,b,5),19) US$ 228
thousand
- - US$ 228
thousand
(Note 3) 1.79 - 7,084 -
MCM (Beijing) Commercial Co., Ltd. Apparel, jewelry, watches, perfumes,
cosmetics, glasses, bags, leather goods
wholesale and retail; import and export of
goods.
EUR 4,460
thousand
Note 1,b,6),20) US$ 182
thousand
- - US$ 182
thousand
(Note 3) 5.00 - 6,442 -
Chengdu Le Me Shi Jia Trading Co., Ltd. Furniture wholesale, metal building
materials wholesale and transport service.
US$ 28,000
thousand
Note 1,b,5),18) US$ 948
thousand
- - US$ 948
thousand
(Note 3) 2.36 - 7,275 -
Chengdu Le Me Shi Jia Information
Technology Co., Ltd.
Furniture wholesale, metal building
materials wholesale and transport service.
US$ 3,000
thousand
Note 1,b,5),18) US$ 33
thousand
- - US$ 33
thousand
(Note 3) 2.36 - 255 -
Tianjin Mei Wei Information
Technology Co., Ltd.
Computer IT consulting and technical
services; computer hardware and software
development; furniture, building
materials, daily commodities, hardware
wholesale.
CNY 171,574
thousand
Note 1,b,5),18) CNY 297
thousand
- - CNY 297
thousand
(Note 3) 2.36 - 2,277 -
Tianjin Mu Yuan Household Trading
Co., Ltd.
Household items; furniture, building
materials, daily commodities, hardware
wholesale.
US$ 500
thousand
Note 1,b,5),18) US$ 42
thousand
- - US$ 42
thousand
(Note 3) 2.36 - 319 -
Jiangyin Suda Huicheng Composite
Material Co., Ltd.
Lithium battery with extruded composite
film
CNY 19,812
thousand
Note 1,b,18) US$ 4,938
thousand
- - US$ 4,938
thousand
(Note 3) 3.89 - 37,885 -
CDIB Private Equity (China)
Corporation
Management and consulting. US$ 7,000
thousand
Note 1,b,8) US$ 7,000
thousand
- - US$ 7,000
thousand
8,856 100.00 8,856 240,523 -
CDIB Private Equity (Fujian) Co., Ltd. Management and consulting. CNY 10,000
thousand
Note 10 - - - - 13,678 70.00 9,575 79,049 -
(Continued)

- 232 -
Investee Company Name Main Businesses and Products Total Paid-in
Capital Investment Type
Accumulated
Outflow of
Investment from
Taiwan as of
January 1, 2019
Investment Flows Accumulated
Outflow of
Investment from
Taiwan as of
June 30, 2019
(Note 4)
Net Income
(Loss) of the
Investee
% Ownership of
Direct or Indirect
Investment
Investment Gain
Carrying
Value as of
June 30, 2019
Accumulated
Inward
Remittance of
Earnings as of
June 30, 2019
Outflow Inflow
CDIB Private Equity Management
(Fujian) Enterprise (Limited
Partnership)
Management and consulting. CNY 12,000
thousand
Note 1,b,8) CNY 6,686
thousand
$ - $ - CNY 6,686
thousand
$ (404) 70.00 $ (283) $ 39,091 $ -
CDIB Private Equity (Fujian) Enterprise
(Limited Partnership)
Equity investment. CNY 1,000,000
thousand
Note 1,b,7),8) CNY 350,000
thousand
- - CNY 350,000
thousand
(28,955) - (10,134) 1,655,525 -
CDIB Yida Private Equity (Kunshan)
Co., Ltd.
Management and consulting. CNY 7,000
thousand
Note 11 - - - - 5,388 65.00 3,502 51,966 -
CDIB Yida Private Equity Management
(Kushan) Enterprise (Limited
Partnership)
Management and consulting. CNY 12,000
thousand
Note 1,b,8) CNY 3,250
thousand
- - CNY 3,250
thousand
(1,375) 65.00 (894) 35,407 -
CDIB Yida Private Equity (Kushan)
Enterprise (Limited Partnership)
Equity investment. CNY 1,000,000
thousand
Note 1,b,7),8) CNY 300,000
thousand
- - CNY 300,000
thousand
(126,349) - (37,905) 1,398,587 -
GSD Industrial (China) Co., Ltd. Pumps manufacture and sale. CNY 50,000
thousand
Note 1,b,9) US$ 2,235
thousand
- - US$ 2,235
thousand
(Note 3) 19.86 - 68,353 -
Beijing Shengzhuang Co., Ltd. Cosmetics sales. CNY 54,300
thousand
Note 1,b,10) US$ 5,000
thousand
- - US$ 5,000
thousand
(Note 3) 5.44 - 151,150 -
Lightel Technologies (Shenzhen) Inc. Fiber optic components, fiber optic
equipment and instruments and LED
lamps.
US$ 4,100
thousand
Note 1,b,11) US$ 337
thousand
- - US$ 337
thousand
(Note 3) 11.58 - 10,076 -
Guohui (China) Co., Ltd. Manufacturing and sale sport apparel,
footwear and accessories.
HK$ 313,432
thousand
Note 1,b,6),12) US$ 2,311
thousand
- - US$ 2,311
thousand
(Note 3) 7.70 - 71,811 -
Fujian Guohui Footwear Co., Ltd. Manufacturing and sale sport apparel,
footwear and accessories.
HK$ 195,686
thousand
Note 1,b,6),12) US$ 1,678
thousand
- - US$ 1,678
thousand
(Note 3) 7.70 - 52,149 -
Jiangsu Stonehenge Industrial Holding
Ltd.
Business in research, development and
manufacture of electro optic technology,
process on TFT-LCD optical, functional
film material, and production and
marketing of other plastic product.
HK$ 761,576
thousand
Note 1,b, 6),21) US$ 9,248
thousand
- - US$ 9,248
thousand
(Note 3) 5.46 - 70,957 -
Tutwo (Xiamen) Outdoor Co., Ltd. Business in wholesale and retail of outdoor
sports products, sporting goods, clothing,
shoes and hats, wholesale, retail and
manufacture of textile and hosiery, leather
garments, leather manufacturing, retail of
kitchenware and daily groceries.
CNY 350,379
thousand
Note 1,b, 13) US$ 7,417
thousand
- - US$ 7,417
thousand
(Note 3) 2.67 - 56,906 -
Best Logistics Technology (China) Co.,
Ltd.
Business in research, development, technical
services, computer information, network
logistics technology and wholesale and
retail of general labor supplies, household
appliances and building materials.
US$ 183,000
thousand
Note 1,b, 14) US$ 211
thousand
- - US$ 211
thousand
(Note 3) - - 2,648 -
Viscovery Business in software development US$ 2,860
thousand
Note 1,b, 15) US$ 36
thousand
- - US$ 36
thousand
(Note 3) 1.80 - 1,119 -
CDIB International Leasing Corporation Financial Leasing and management business
consulting.
CNY 187,750
thousand
Note 1,a US$ 30,000
thousand
- - US$ 30,000
thousand
(40,275) 100.00 (40,275) 132,052 -
(Continued)

- 233 -
Investee Company Name Main Businesses and Products Total Paid-in
Capital Investment Type
Accumulated
Outflow of
Investment from
Taiwan as of
January 1, 2019
Investment Flows Accumulated
Outflow of
Investment from
Taiwan as of
June 30, 2019
(Note 4)
Net Income
(Loss) of the
Investee
% Ownership of
Direct or Indirect
Investment
Investment Gain
Carrying
Value as of
June 30, 2019
Accumulated
Inward
Remittance of
Earnings as of
June 30, 2019
Outflow Inflow
KGI Investment advisory (Shanghai)
Co., Ltd.
Investment consultancy. US$ 4,000
thousand
Note 1,b,16) US$ 4,000
thousand
$ - $ - US$ 4,000
thousand
$ (5,800) 100.00 $ (5,800) $ 31,970 $ -
CCB Life Insurance Company Limited Life insurance.
CNY 7,120,461
thousand
Note 1,a 7,401,464 5,479,505 - 12,880,969 1,664,144 19.90 - 16,218,263 71,756
Changzhou Cheng Xing Environmental
Protection Technology Co., Ltd.
Business in packaging technology
development, and related transfer services
consulting.
US$ 13,380
thousand
Note 1,b,17) US$ 381
thousand
- - US$ 381
thousand
(Note 3) 0.88 - 3,749 -
Cheng Zong Environmental Protection
Technology (Shanghai) Co., Ltd.
Business in Packaging materials, plastic
products, machinery and equipment,
providing molds and related products
wholesale, commission agents.
US$ 5,000
thousand
Note 1,b,17) US$ 107
thousand
- - US$ 107
thousand
(Note 3) 0.88 - 1,046 -
Taro Technology (Hangzhou) Co., Ltd Business in software; network engineering;
intelligent robot; development of hi-tech
product; technical services; transfer of
technological achievements
US$ 30,000
thousand
Note 1,b,22) US$ 2,000
thousand
- - US$ 2,000
thousand
(Note 3) 1.01 - 62,144 -
Rokid Business (Hangzhou) Co., Ltd Business in software; network engineering;
intelligent robot; development of hi-tech
product; technical services; transfer of
technological achievements
US$ 15,000
thousand
Note 1,b,22) US$ 3,000
thousand
- - US$ 3,000
thousand
(Note 3) 1.01 - 93,216 -
Accumulated Investment in
Mainland China as of June 30, 2019
Investment Amounts Authorized by
Investment Commission, MOEA Limit on Investment
$19,543,574 US$805,696 thousand $160,349,921
Note 1: The investment types are as follows:
a. Direct investments.
b. Reinvested through a third area by:
1) Beauty Essentials International Ltd.
2) Derbysoft Holdings Limited.
3) Capital Excel Investments Limited.
4) Hartec Asia Pte Ltd.
5) CDIB Capital Investment I Limited.
6) CDIB Capital Investment II Limited
7) CDIB Venture Capital (Hong Kong) Corporation Limited.
8) CDIB Private Equity (Hong Kong) Corporation Limited.
9) GSD Technologies Co., Ltd.
10) Shengzhuang Holdings Limited.
11) Lightel Technologies, Inc.
12) CBA Sport International Limited.
13) CCAP Tutwo Holdings (Hong Kong) Limited.
14) Best Logistics.
15) Viscovery (Cayman) Holding Company Limited.
16) Richpoint Company Limited.
17) Deluxe Technology Group Co., Ltd.
18) CDIB Capital Asia Partners L.P.
19) Great Team Backend Foundry, Inc.
20) Sungjoo Design Tech & Distribution Inc.
(Continued)

- 234 -
21) Great Rich Technologies Limited.
22) Rokid Corporation Limited.
c. Other.
Note 2: The financial statements were audited by international CPA firms having a corporative relation with CPA firms in the Republic of China.
Note 3: Investee Company was not significantly influenced by the Company; therefore the Group cannot acquire the related financial information.
Note 4: Investment amount authorized or to be authorized by the Investment Commission, MOEA.
Note 5: Subsidiary of the Corporation formerly indirectly invested in Focal Tech (Shenzhen) System Co., Ltd. through its subsidiary’s investment in Focal Tech (Shenzhen) Corporation Ltd. has been listed on the Taiwan Stock Exchange on November 8, 2013, refer to its financial report for the
information.
Note 6: Subsidiary of the Corporation formerly indirectly invested in Kunshan Xinkuangtai Photoelectric Technology Co., Ltd. and Taizhou Kuangli Photoelectric Technology Co., Ltd. through its subsidiary’s investment in Kuangli Photoelectric Technology Co., Ltd. has been listed on the Taiwan
Stock Exchange on October 31, 2014, refer to its financial report for the information.
Note 7: Subsidiary of the Corporation formerly indirectly invested in Yangzhou Enteres Auto Parts Manufacturing Co., Ltd., Yanghou Enteres Industrial Co., Ltd., Yangzhou Enterex Automotive Air-Conditioning Industrial Co., Ltd. and Yangzhou Enterex Auto Parts Distribution Co., Ltd. through
its subsidiary investment in Enteres International Limited has been listed on the Taiwan Stock Exchange on October 16, 2014, refer to its financial report for the information.
Note 8: Subsidiary of the Corporation formerly indirectly invested in China Peptides (Wuhan) Co., Ltd. through its subsidiary’s investment in JHL Biotech, Inc. has been listed on the Taipei Exchange on September 17, 2015, refer to its financial report for the information.
Note 9: Subsidiary of the Corporation formerly indirectly invested in Power Logic Tech (DongGuan) Inc., Dongguan TaiYi Electronics Co., Ltd., Dongguan Yi Quan Electronics Co., Ltd. through Sun Max Tech Limited, has been listed on the Taipei Exchange on December 28, 2017, refer to its
financial report for the information.
Note 10: In 2017, CDIB Private Equity (Fujian) Co., Ltd. was transferred and invested by CDIB Private Equity (China) Corporation.
Note 11: In 2017, CDIB Yida Private Equity (Kunshan) Co., Ltd. was transferred and invested by CDIB Private Equity (China) Corporation.
Note 12: Subsidiary of the Corporation formerly indirectly invested in Gio Van Gogh (International) Jewelry Limited through its subsidiary’s investment in Regal Holding Co., Ltd. has been listed on the Taiwan Stock Exchange on June 26, 2017, refer to its financial report for the information.
Note 13: Subsidiary of the Corporation formerly indirectly invested in San Neng Bakeware (Wuxi) Co., Ltd. through its subsidiary’s investment in San Neng Group Holdings Co., Ltd. has been listed on the Taiwan Stock Exchange on June 25, 2018, refer to its financial report for the information.
Note 14: Subsidiary of the Corporation formerly indirectly invested in Hangzhou Huatong Industries Inc. and Hangzhou Rilong Leather Co., Ltd. through its subsidiary’s investment in Shane Global Holding Inc. has been listed on the Taiwan Stock Exchange on August 15, 2018, refer to its financial
report for the information.
Note 15: CCB Life Insurance Company Limited raised CNY 6,000,000 thousand on 2019. The seasoned equity offering had already collected full proceeds and compelted capital verification on April, 2019. The total paid-in capital after right offering is subject to approval of China Banking and
Insurance Regulatory Commission as of June 30,2019.
(Concluded)

- 235 -
TABLE 12
CHINA DEVELOPMENT FINANCIAL HOLDING CORPORATION AND SUBSIDIARIES
BUSINESS RELATIONSHIPS AND SIGNIFICANT INTERCOMPANY TRANSACTIONS
FOR THE SIX MONTHS ENDED JUNE 30, 2019
(In Thousands of New Taiwan Dollars)
No.
(Note 1) Trader Company Related Party
Flow of
Transactions
(Note 2)
Financial Statement Accounts Amounts Trading
Terms
Transaction
Amount/Total
Consolidated
Revenue or
Total Consolidated
Assets (Note 3)
0 The Corporation CDIB Capital Group 1 Current tax assets $ 525,542 Note 4 0.02%
1 CDIB Capital Group The Corporation 2 Current tax liabilities 525,542 Note 4 0.02%
0 The Corporation CDIB Capital Group 1 Current tax liabilities 317,267 Note 4 0.01%
1 CDIB Capital Group The Corporation 2 Current tax assets 317,267 Note 4 0.01%
0 The Corporation KGI Bank 1 Current tax assets 541,361 Note 4 0.02%
2 KGI Bank The Corporation 2 Current tax liabilities 541,361 Note 4 0.02%
0 The Corporation KGI Securities 1 Current tax assets 668,212 Note 4 0.02%
3 KGI Securities The Corporation 2 Current tax liabilities 668,212 Note 4 0.02%
0 The Corporation KGI Bank 1 Cash and cash equivalents 7,512,535 Note 4 0.25%
2 KGI Bank The Corporation 2 Deposits and remittances 7,512,535 Note 4 0.25%
1 CDIB Capital Group KGI Bank 3 Cash and cash equivalents 138,998 Note 4 0.00%
2 KGI Bank CDIB Capital Group 3 Deposits and remittances 138,998 Note 4 0.00%
3 KGI Securities and its subsidiaries KGI Bank 3 Cash and cash equivalents 129,485 Note 4 0.00%
3 KGI Securities and its subsidiaries KGI Bank 3 Other financial assets 96,961 Note 4 0.00%
2 KGI Bank KGI Securities and its subsidiaries 3 Deposits and remittances 226,446 Note 4 0.01%
3 KGI Securities KGI Bank 3 Other financial assets 918,057 Note 4 0.03%
2 KGI Bank KGI Securities 3 Deposits and remittances 918,057 Note 4 0.03%
(Continued)

- 236 -
No.
(Note 1) Trader Company Related Party
Flow of
Transactions
(Note 2)
Financial Statement Accounts Amounts Trading
Terms
Transaction
Amount/Total
Consolidated
Revenue or
Total Consolidated
Assets (Note 3)
3 KGI Securities KGI Bank 3 Restricted assets $ 1,202,053 Note 4 0.04%
2 KGI Bank KGI Securities 3 Deposits and remittances 1,202,053 Note 4 0.04%
4 China Life Insurance KGI Bank 3 Cash and cash equivalents 203,098 Note 4 0.01%
2 KGI Bank China Life Insurance 3 Deposits and remittances 203,098 Note 4 0.01%
5 CDIB Capital Management Corporation KGI Bank 3 Cash and cash equivalents 47,173 Note 4 0.00%
5 CDIB Capital Management Corporation KGI Bank 3 Other financial assets 200,000 Note 4 0.01%
2 KGI Bank CDIB Capital Management Corporation 3 Deposits and remittances 247,173 Note 4 0.01%
3 KGI Securities and its subsidiaries China Life Insurance 3 Service fee revenue and commission income 220,591 Note 4 0.17%
4 China Life Insurance KGI Securities and its subsidiaries 3 Service fee expense and commission expense 220,591 Note 4 0.17%
2 KGI Bank China Life Insurance 3 Service fee revenue and commission income 178,556 Note 4 0.14%
4 China Life Insurance KGI Bank 3 Service fee expense and commission expense 178,556 Note 4 0.14%
3 KGI Securities KGI Futures Co., Ltd. 3 Financial assets at fair value through profit or loss 937,986 Note 4 0.03%
6 KGI Futures Co., Ltd. KGI Securities 3 Other financial liabilities 937,986 Note 4 0.03%
3 KGI Securities KGI International (Hong Kong) Limited 3 Other financial assets 116,288 Note 4 0.00%
7 KGI International (Hong Kong) Limited KGI Securities 3 Other financial liabilities 116,288 Note 4 0.00%
6 KGI Futures Co., Ltd. KGI Securities (Singapore) Pte. Ltd. 3 Cash and cash equivalents 253,789 Note 4 0.01%
8 KGI Securities (Singapore) Pte. Ltd. KGI Futures Co., Ltd. 3 Payables 253,789 Note 4 0.01%
6 KGI Futures Co., Ltd. KGI Futures (Hong Kong) Limited 3 Other financial assets 108,684 Note 4 0.00%
9 KGI Futures (Hong Kong) Limited KGI Futures Co., Ltd. 3 Other financial liabilities 108,684 Note 4 0.00%
6 KGI Futures Co., Ltd. KGI Securities (Singapore) Pte. Ltd. 3 Other financial assets 1,730,483 Note 4 0.06%
8 KGI Securities (Singapore) Pte. Ltd. KGI Futures Co., Ltd. 3 Other financial liabilities 1,730,483 Note 4 0.06%
(Continued)

- 237 -
No.
(Note 1) Trader Company Related Party
Flow of
Transactions
(Note 2)
Financial Statement Accounts Amounts Trading
Terms
Transaction
Amount/Total
Consolidated
Revenue or
Total Consolidated
Assets (Note 3)
10 Richpoint Company Limited KGI International Holdings Limited 3 Receivables, net 934,343 Note 4 0.03%
11 KGI International Holdings Limited Richpoint Company Limited 3 Other borrowings 934,343 Note 4 0.03%
1 CDIB Capital Group CDIB Global Markets Limited 3 Receivables, net 2,796,480 Note 4 0.09%
12 CDIB Global Markets Limited CDIB Capital Group 3 Payables 2,796,480 Note 4 0.09%
13 CDIB Capital International Corporation CDIB Capital International (Hong Kong) Corporation
Limited
3 Operating expenses 117,441 Note 4 0.09%
14 CDIB Capital International (Hong Kong) Corporation
Limited
CDIB Capital International Corporation 3 Consulting service revenues 117,441 Note 4 0.09%
Note 1: The consolidated entities are identified in the No. column as follows: Parent company - 0; subsidiaries - numbered from 1 by company.
Note 2: Transaction flows are as follows: (1) from parent to subsidiary; (2) from subsidiary to parent; and (3) between subsidiaries.
Note 3: The ratio is calculated as follows: For asset and liability accounts - Transaction amount in the ending period/Total consolidated assets; for income and expense accounts - Transaction amount in the midterm/Total consolidated net profit.
Note 4: The transaction criteria for related parties are similar to those for third parties.
Note 5: Transactions each amounted to at least NT$100 million.
(Concluded)

- 238 -
TABLE 13-1
KGI SECURITIES AND ITS SUBSIDIARIES
BALANCE SHEETS
JUNE 30, 2019
ASSETS
Richpoint
Company
Limited
(In U.S. Dollars)
KG Investments
Holdings
Limited
(In U.S. Dollars)
KGI
International
Holdings
Limited
(In U.S. Dollars)
KGI Investment
Advisory
(Shanghai) Co.,
Ltd.
(In CNY)
CURRENT ASSETS
Cash and cash equivalents $ 62,296 $ 3,489 $ 17,984 $ 7,105,387
Other receivables - related parties 30,000,000 - 30,285,452 -
Other current assets 128,099 - - 35,442
Total current assets 30,190,395 3,489 30,303,436 7,140,829
NONCURRENT ASSETS
Financial assets fair value through profit
or loss - noncurrent 297,225 - - -
Investments accounted for using the
equity method 472,773,121 578,283,733 598,146,109 -
Property and equipment - - - 4,562
Other noncurrent assets - - - 76,840
Total noncurrent assets 473,070,346 578,283,733 598,146,109 81,402
TOTAL $ 503,260,741 $ 578,287,222 $ 628,449,545 $ 7,222,231
LIABILITIES AND EQUITY
CURRENT LIABILITIES
Short-term borrowings $ 44,480,000 $ - $ - $ -
Commercial paper payable - - 20,884,306 -
Other payables 80,042 2 245,090 4,807
Other payables - related parties - 121,626,812 30,000,000 -
Total current liabilities 44,560,042 121,626,814 51,129,396 4,807
NONCURRENT LIABILITIES
Other noncurrent liabilities - - - 152,000
Total noncurrent liabilities - - - 152,000
Total liabilities 44,560,042 121,626,814 51,129,396 156,807
EQUITY
Common stock 147,043,557 156,864,163 209,248,261 25,278,600
Capital reserve 872,149 77,461 54,662,168 10,818
Special reserve - 9,759,135 387,913 -
Retained earnings (accumulated deficit) 296,500,648 275,525,418 298,587,576 (18,223,994)
Other equity 14,284,345 14,434,231 14,434,231 -
Total equity 458,700,699 456,660,408 577,320,149 7,065,424
TOTAL $ 503,260,741 $ 578,287,222 $ 628,449,545 $ 7,222,231

- 239 -
TABLE 13-2
KGI SECURITIES AND ITS SUBSIDIARIES
BALANCE SHEETS
JUNE 30, 2019
(Expressed in U.S. Dollars)
ASSETS KGI Limited
Supersonic
Service Inc.
KGI
International
Limited
CURRENT ASSETS
Cash and cash equivalents $ - $ - $ 432
Total current assets - - 432
NONCURRENT ASSETS
Investments accounted for using the equity method 360,287,344 - 72,743,596
Total noncurrent assets 360,287,344 - 72,743,596
TOTAL $ 360,287,344 $ - $ 72,744,028
LIABILITIES AND EQUITY
CURRENT LIABILITIES
Other payables - related parties $ 80,891,855 $ - $ 2,755,403
Total current liabilities 80,891,855 - 2,755,403
Total liabilities 80,891,855 - 2,755,403
EQUITY
Common stock 308,341,129 100 81,511,717
Accumulated deficit (28,945,640) (100) (11,523,092)
Total equity 279,395,489 - 69,988,625
TOTAL $ 360,287,344 $ - $ 72,744,028

- 240 -
TABLE 13-3
KGI SECURITIES AND ITS SUBSIDIARIES BALANCE SHEETS
JUNE 30, 2019
(Expressed in U.S. Dollars)
ASSETS Bauhinia 88 Ltd.
Global Treasure
Investments
Limited
KGI
Hong Kong
Limited
KGI Nominees
(Hong Kong)
Limited
CURRENT ASSETS
Cash and cash equivalents $ - $ - $ 622,286 $ -
Prepayments - - 744,034 -
Other receivables - - 86,552
Other receivables - related parties - - - 1
Other current assets - 1 2,006,594 -
Total current assets - 1 3,459,466 1
NONCURRENT ASSETS
Property and equipment - - 4,440,481 -
Right-of-use assets - - 19,124,273 -
Total noncurrent assets - - 23,564,754 -
TOTAL $ - $ 1 $ 27,024,220 $ 1
LIABILITIES AND EQUITY
CURRENT LIABILITIES
Other payables $ - $ - $ 13,330,513 $ -
Other payables - related parties - - 13,829,751 -
Lease liabilities - - 4,880,475 -
Total current liabilities - - 32,040,739 -
NONCURRENT LIABILITIES
Lease liabilities - - 14,519,855 -
Other noncurrent liabilities - - 1,772,243 -
Total noncurrent liabilities - - 16,292,098 -
Total liabilities - - 48,332,837 -
EQUITY
Common stock 2 1 15,000 1
Special reserve - - 58,265 -
Accumulated deficit (2) - (21,381,882) -
Total equity - 1 (21,308,617) 1
TOTAL $ - $ 1 $ 27,024,220 $ 1

- 241 -
TABLE 13-4
KGI SECURITIES AND ITS SUBSIDIARIES
BALANCE SHEETS
JUNE 30, 2019
(Expressed in U.S. Dollars)
ASSETS
KGI Korea
Limited
TG Holborn
(HK)
Limited
KGI Asia
(Holdings)
Pte. Ltd.
KGI Capital
(Singapore)
Pte. Ltd.
CURRENT ASSETS
Cash and cash equivalents $ - $ - $ 147,451 $ 4,973
Other receivables - related parties 72,750 - - 3,681,453
Other current assets - - 320,000 -
Total current assets 72,750 - 467,451 3,686,426
NONCURRENT ASSETS
Investments accounted for using the
equity method - - 172,456,627 -
Total noncurrent assets - - 172,456,627 -
TOTAL $ 72,750 $ - $ 172,924,078 $ 3,686,426
LIABILITIES AND EQUITY
CURRENT LIABILITIES
Short-term borrowings $ - $ - $ 62,827,999 $ -
Financial liabilities at fair value
through profit or loss - current - - 398,854 -
Other payables - - 55,360 6,601
Other payables - related parties - - 42,590,308 -
Total current liabilities - - 105,872,521 6,601
Total liabilities - - 105,872,521 6,601
EQUITY
Common stock 10,000 - 75,749,306 5,738,175
Retained earnings (accumulated
deficit) 62,750 - (8,723,941) (1,793,659)
Other equity - - 26,192 (264,691)
Total equity 72,750 - 67,051,557 3,679,825
TOTAL $ 72,750 $ - $ 172,924,078 $ 3,686,426

- 242 -
TABLE 14-1
KGI SECURITIES AND ITS SUBSIDIARIES
STATEMENTS OF COMPREHENSIVE INCOME
FOR THE SIX MONTHS ENDED JUNE 30, 2019
Richpoint
Company
Limited
(In U.S. Dollars)
KG Investments
Holdings
Limited
(In U.S. Dollars)
KGI
International
Holdings
Limited
(In U.S. Dollars)
KGI Investment
Advisory
(Shanghai) Co.,
Ltd.
(In CNY)
REVENUES
Other operating income $ 1 $ (213,492) $ (226,227) $ (14,656)
Total revenues 1 (213,492) (226,227) (14,656)
COSTS AND EXPENSES
Financial costs 675,671 66,800 837,442 -
Employee benefit expenses - - - 730,600
Depreciation and amortization expenses - - - 1,448
Other operating expenses 11,052 20,150 (4,260) 527,014
Total costs and expenses 686,723 86,950 833,182 1,259,062
LOSS FROM OPERATIONS (686,722) (300,442) (1,059,409) (1,273,718)
SHARE OF PROFIT OF SUBSIDIARIES,
ASSOCIATES AND JOINT
VENTURES 21,105,397 21,495,240 22,407,922 -
OTHER REVENUE AND EXPENSE 732,739 97,806 146,727 3,650
NON-OPERATING REVENUE AND
EXPENSE 21,838,136 21,593,046 22,554,649 3,650
NET PROFIT (LOSS) FOR THE PERIOD 21,151,414 21,292,604 21,495,240 (1,270,068)
OTHER COMPREHENSIVE INCOME
(LOSS) 9,672,433 9,672,884 9,672,884 -
TOTAL COMPREHENSIVE INCOME
(LOSS) FOR THE PERIOD $ 30,823,847 $ 30,965,488 $ 31,168,124 $ (1,270,068)

- 243 -
TABLE 14-2
KGI SECURITIES AND ITS SUBSIDIARIES
STATEMENTS OF COMPREHENSIVE INCOME
FOR THE SIX MONTHS ENDED JUNE 30, 2019
(In U.S. Dollars)
KGI Limited
Supersonic
Services Inc.
KGI
International
Limited
REVENUES
Other operating income $ 852 $ - $ -
Total revenues 852 - -
COSTS AND EXPENSES
Other operating expenses - - -
Total costs and expenses - - -
PROFIT FROM OPERATIONS 852 - -
OTHER REVENUE AND EXPENSE (156,894) - -
NON-OPERATING REVENUE AND EXPENSE (156,894) - -
NET LOSS FOR THE PERIOD (156,042) - -
OTHER COMPREHENSIVE INCOME (LOSS) - - -
TOTAL COMPREHENSIVE INCOME (LOSS) FOR
THE PERIOD $ (156,042) $ - $ -

- 244 -
TABLE 14-3
KGI SECURITIES AND ITS SUBSIDIARIES
STATEMENTS OF COMPREHENSIVE INCOME
FOR THE SIX MONTHS ENDED JUNE 30, 2019
(In U.S. Dollars)
Bauhinia 88
Ltd.
Global
Treasure
Investments
Limited
KGI Hong
Kong Limited
KGI Nominees
(Hong Kong)
Limited
REVENUES
Other operating income $ - $ - $ (392,867) $ -
Total revenues - - (392,867) -
COSTS AND EXPENSES
Financial costs - - 543,739 -
Employee benefits - - 29,890,273 -
Depreciation and amortization
expenses - - 3,379,402 -
Other operating expenses - - 6,264,525 -
Total costs and expenses - - 40,077,939 -
LOSS FROM OPERATIONS - - (40,470,806) -
OTHER REVENUE AND EXPENSE - - 35,016,690 -
NON-OPERATING REVENUE AND
EXPENSE - - 35,016,690 -
NET LOSS FOR THE PERIOD - - (5,454,116) -
OTHER COMPREHENSIVE INCOME
(LOSS) - - - -
TOTAL COMPREHENSIVE INCOME
(LOSS) FOR THE PERIOD $ - $ - $ (5,454,116) $ -

- 245 -
TABLE 14-4
KGI SECURITIES AND ITS SUBSIDIARIES
STATEMENTS OF COMPREHENSIVE INCOME
FOR THE SIX MONTHS ENDED JUNE 30, 2019
(In U.S. Dollars)
KGI Korea
Limited
TG Holborn
(HK)
Limited
KGI Asia
(Holdings)
Pte. Ltd.
KGI Capital
(Singapore)
Pte. Ltd.
REVENUES
Derivative assets - counter $ - $ - $ 62,274 $ -
Other operating income - 24 298,767 -
Total revenues - 24 361,041 -
COSTS AND EXPENSES
Financial costs - - 1,069,941 -
Other operating expenses - - 850,794 885
Total costs and expenses - - 1,920,735 885
PROFIT (LOSS) FROM
OPERATIONS - 24 (1,559,694) (885)
OTHER REVENUE AND EXPENSE - - 8,394,800 -
NON-OPERATING REVENUE AND
EXPENSE - - 8,394,800 -
NET PROFIT (LOSS) FOR THE
PERIOD - 24 6,835,106 (885)
OTHER COMPREHENSIVE INCOME
(LOSS) - - 452,869 26,467
TOTAL COMPREHENSIVE INCOME
(LOSS) FOR THE PERIOD $ - $ 24 $ 7,287,975 $ 25,582