chinese cities of opportunity - pwc · 6 citie pportunit 2015 overview for the chinese cities of...
TRANSCRIPT

TianjinShenyangDalianChangchun
HarbinNanjingHangzhouFuzhou
XiamenQingdaoZhengzhouWuhan
GuangzhouShenzhenNanningChongqing
ChengduXi'anLanzhouUrumqi
Chinese Cities of Opportunity2015

China’s urbanisation is not only shaping its future, but also has a profound impact on global development patterns and outlook. This is an extremely complex process which may result in varied outcomes. However, it is only by adopting a new people-centred, inclusive and sustainable urbanisation approach that we can build a bright future.
At the 15th China Development Forum in 2014, China Development Research Foundation (CDRF) and PwC China jointly released the Chinese Cities of Opportunity report. This was the China edition of PwC’s global cities report entitled Cities of Opportunity. While drawing from Cities of Opportunity’s perspectives and analytical framework, Chinese Cities of Opportunity incorporated China’s actual circumstances into its research metrics of 10 dimensions to observe the development of 15 Chinese cities. This methodology and indicator system gave us further insights into the advantages and disadvantages of the sample cities, and was a source of reference for other cities. Positive feedback for last year’s report has given us greater impetus to continue this meaningful project. In this year’s study, we increased the number of cities observed from 15 to 20, and improved our selection of indicators and data collection methodology.
China’s economy has started its shift to the “new normal” state. Including the word “opportunity” in the title of this series of studies is not only a recognition of new normal’s great
challenges and uncertainties, but also an acknowledgement of the key opportunities and development potential arising from deep economic and social transformations yet to be fully identified and explored. As China’s new urbanisation drives deep economic and social transformation, the latter then pushes the former towards substantive development, thereby creating a positive cycle. From this perspective, the 10 dimensions of the assessment framework provide us with constructive and forward-looking guidance. The opportunities contained in China’s new urbanisation process in the new normal state are not only available to the 20 cities in this report but also to the hundreds and thousands of cities and towns in China; they are not just available to today’s urban inhabitants, but also to all future urban and rural residents; they will not only benefit China’s enterprises and families, but also that of the world. China’s new urbanisation approach is, in essence, the path to modernisation for the majority of the population.
Even as the CDRF team played an active role at every stage of preparing this report, we took this as an opportunity to learn from PwC. I take this opportunity to express my appreciation for PwC’s dedication to fulfilling its corporate responsibilities by contributing its wisdom to China’s development. I’m also grateful for the hard work of PwC and CDR’s team members. I look forward to further, deeper cooperation between CDRF and PwC in providing valuable knowledge and insights to our society in the future.
A new perspective on urban studies
Lu Mai
Secretary-General China Development Research Foundation

The China Development Forum (CDF) is an event with far-reaching international influence. PwC China is honoured to be invited to co-develop with the organiser, China Development Research Foundation (CDRF), the Chinese Cities of Opportunity report. CDF provides an excellent platform for the launch of this study on China’s urban transformation.
Annually PwC member firms produce research reports on many of the world’s most important economic topics, such as the annual PwC Global CEO Survey, PwC firms study of the world’s major urban centres in Cities of Opportunity, along with many other specific industry studies.
In the global edition of the Cities of Opportunity report, Beijing, Shanghai and Hong Kong are included as part of the sample of major world cities. In the Chinese edition, the study is focused on 20 Chinese provincial capitals and cities, all of a similar size. Observations on Beijing and Shanghai from the global edition are included as an Appendix to the report. This study is only the beginning. PwC firms look forward to extending the research sample to more cities and including more China-specific factors in the design of the methodology.
What the People's Republic of China has achieved in its over 65-year history is truly remarkable. In addition to achieving record economic growth and providing a quarter of the world
with food and shelter as well as improving socioeconomic opportunities, the country has succeeded in adapting to market-based mechanisms while adding new elements to its traditions.
Over the next 10 to 15 years, China will play an even greater role in the global arena. Not only will the growth of China’s economy become increasingly important, but the local market economy, with its unique “Chinese characteristics” and venerable cultural traditions, will have a profound impact on the world at large. Under the “new normal”, China will continue to integrate into the international community. At PwC China, we also look forward to continued growth within China and the opportunities to work with Chinese entrepreneurs and multinationals to cultivate the local market.
Through the research in this study, PwC China is proud to provide insights that will help China to realize the benefits and address the issues related to growing urbanisation. Congratulations also to PwC China, whose efforts have been instrumental in creating this valuable report: Chinese Cities of Opportunity.
Study of Chinese cities – a PwC China perspective
Dennis Nally
Chairman, PricewaterhouseCoopers International Limited

Contents
Overview ................................................................................................................. 6
City selection ............................................................................................................................6
Data sources .............................................................................................................................6
Design of indicators and variables ............................................................................................6
Scoring ....................................................................................................................................7
Our findings .............................................................................................................................8
In-depth interviews ..................................................................................................................9
Observations
1. Intellectual capital and innovation ...................................................................................10
Interview: Zheng Xinli/China’s urbanisation development strategy ......................................12
2. Important regional cities ..................................................................................................14
Interview: Zhang Hongyi/Shenzhen’s urbanisation process .................................................15
3. Technology readiness .......................................................................................................16
Interview: Li Xinhe/Internet finance ...................................................................................17
4. Healthcare, safety and security .........................................................................................18
5. Transportation and urban planning ..................................................................................20
Interview: Yao Jingyuan/Statistical methodologies .............................................................21
FlyingOn permanent display in Chongli Crescent Culture Square in Zhangjiakou Commissioned for Chongli county in support of Beijing and Zhangjiakou's joint bid for 2022 Winter Olympic Games
6. Sustainability and the natural environment ........ 22
7. Culture and lifestyle ........................................... 24
Interview: Gu Yaoming/Mass sports is a force to be reckoned with in China's urbanisation .................25
8. Economic clout ................................................... 26
9. Ease of doing business ........................................ 28
10. Cost .................................................................... 30
Variables .......................................................... 32
Appendix:
Cities of Opportunity 6 – Beijing ................................ 41
Cities of Opportunity 6 – Shanghai ............................ 43
Acknowledgements ........................................... 45
For further information ................................... 47

6 Cities of Opportunity 2015
Overview
For the Chinese Cities of Opportunities report of 2015, we added five new cities to the sample of 15 cities used in last year’s report. Of these cities (Harbin, Changchun, Lanzhou, Fuzhou and Chengdu), two are in Eastern China and three are in Western China; two are north of the Yangtze River and three are south of it. Looking at the combined sample of 20 cities, they appear to be evenly distributed, since the Qinling Mountains divide them into two almost equal parts in the north and south, and eight cities are located in Central and Western China while 12 are in the coastal region.
City selection When it comes to cities for observation, the selection of cities reflects a particular perspective. The scope for our selection of sample cities was restricted to provincial capitals and municipalities separately listed in the state planning. However, due to our limitations and data collection constraints, we could only select a limited number of cities for observation. Nonetheless, we strove to have every large region represented by at least one city. As with last year, due to the enormous scale of Beijing and Shanghai, we did not include them as part of our study objects, but at the end of the report we attached the key results of these cities from the global study for readers’ reference. This year, we selected 20 cities in total: Shenyang, Dalian, Changchun and Harbin from the Northeast; Xi’an, Lanzhou and Urumqi from the Northwest; Tianjin, Zhengzhou and Wuhan from Central and North China; Nanjing, Hangzhou, Xiamen, Fuzhou and Qingdao from Eastern China; Chongqing and Chengdu from the Southwest; Guangzhou, Shenzhen and Nanning from South China.
The title Cities of Opportunity is symbolic. Opportunity refers to the long-term growth opportunity provided by the new normal development strategy and demonstrated by China’s new
urbanisation development strategy. Each city in China has such an opportunity. Every city has created its own unique development opportunities according to its characteristics and comparative advantages.
Data sources All data in this report are derived from public sources, in particular from the following: 1. central and local statistics, including City Statistical Yearbooks issued by Bureaus of Statistics in various cities; 2. research reports of national think tanks, such as the “papers” series published by the Chinese Academy of Social Sciences; 3. publicly available data issued or sold by research institutions. As the statistical yearbooks of most cities were not issued until January 2015, December 31, 2013 was chosen as the data time-point.
Where data was unavailable, minor adjustments were made. Though statistical yearbooks are under the unified regulation of the National Bureau of Statistics, there are some differences among statistical yearbooks of various cities in terms of statistical classification and data ranges, and several cities lacked entire ranges of data that most cities have. Under these circumstances, we adopted substitution methods. For example, we used province-wide data for a given data category on a per capita basis to deduce data of a city in that province. In such cases, we provide explanations in our report.
Design of indicators and variables A total of 10 indicators and 58 variables were designed for this year’s Cities of Opportunities. Indicator and variable designs are all derived from the methodology used by PwC US for its Cities of Opportunity series for major cities in the world. We modelled that methodology to our observation of Chinese cities. By “model” we mean that
we maintained the same observation perspective. When selecting specific data, we sorted publicly available data by representativeness and comparability and changed the names of indicators or variables as appropriate according to the features of the data. Therefore, the names of indicators and variables in the Chinese version of Cities of Opportunity are not necessarily the same as those in the global version, but the data in both were selected from the same perspective. For example, though the term “number of foreign consulates” in the global version was a good indicator to compare international connectivity for major cities in a country, it was not applicable to cities in China. For issues like this, what we did was to first make an abstraction of the underlying meaning of data definitions, then search for data with similar meaning from China’s available data based on the underlying meaning, and finally rename the selected data. For example, we replaced “number of foreign consulates” with “dependence on foreign trade.”
There are ten observation indicators in Chinese Cities of Opportunity, including intellectual capital and innovation; important regional cities; technology readiness; healthcare, safety and security; transportation and urban planning; sustainability and the natural environment; culture and lifestyle; economic clout; ease of doing business; and cost. Each indicator has four to nine variables which describe its multiple dimensions. For some variables, a single parameter for description was selected, while others needed more than one parameter. Different parameters of a variable were given the same weight. Indicators and variables constitute a multi-dimensional observation perspective, enabling observation findings to be more closely aligned with the nature of a city. After we published our research results last year, some scholars stated that the results in Chinese Cities of Opportunity closely matched people’s general understanding.

PwC 7
Scoring We ranked the 20 sample cities against each variable and assigned points accordingly, one for each level in the ranking. Thus, cities are awarded from one point to 20 points for each variable. That is, the first-ranked city received 20 points and the last-ranked received one point. For the cost variable, however, the highest-cost city accumulated one point, putting it at the bottom; the lowest-cost city accumulated 20 points, putting it in the first place. In the case of a tie between cities for a given variable, they were at the same level in the order and thus received the same number of points, but each also occupied one place-holding position in the ranking. Scoring based on order helps eliminate huge differences among these cities, that is, for a given variable, a city has only one more point than the city below it, regardless of how large the actual difference was between them.
We ranked the 20 cities based on the sum of points across all the variables for each indicator to produce their rankings under each indicator. The sum of points of all variables under the ten indicators generated the final rankings of the 20 cities in the report.
It is worth noting that different methodologies produce different results, and our ranking is meant to facilitate observations in a clear and simple manner, and are not expressions of opinion or criticism. Furthermore, this ranking is based on data available at the end of 2013. Given China’s rapid urbanisation, our conclusions may not fully reflect the sample cities’ most recent developments.

8 Cities of Opportunity 2015
1
2
3
4
5
6
7
8
9
10
11
12
13
14
15
16
17
18
19
20
Important regional cities
Intellectual capital and innovation
Technology readiness
Healthcare, safety and security
Transportation and urban planning
Sustainability and the natural environment
Culture and lifestyle Economic clout Ease of doing business
Cost Score
Shenzhen
Lanzhou
Nanning
Harbin
Changchun
Urumqi
Zhengzhou
Fuzhou
Chongqing
Shenyang
Dalian
Qingdao
Xiamen
Tianjin
Xi'an
Chengdu
Hangzhou
Wuhan
Nanjing
Guangzhou
102 116 74 67 81 76 51 112 141
112 107 71 73 83 70 55 100 124
111 70 68 71 80 70 46 76 102
106 78 46 80 80 58 46 89 103
110 75 71 73 61 56 44 82 122
79 97 51 75 69 52 26 75 103
94 64 44 53 84 46 45 76 102
88 71 35 57 61 60 14 90 117
65 77 62 53 70 62 45 46 109
51 66 45 61 52 71 43 46 117
69 49 37 64 76 55 45 71 89
71 63 34 44 92 57 43 59 69
53 93 16 54 58 55 20 50 81
58 48 53 42 48 53 44 36 88
72 49 29 45 47 35 44 40 104
47 40 20 29 66 39 34 58 79
48 33 23 40 49 36 48 49 62
39 41 19 29 36 38 55 48 65
43 18 25 33 46 60 46 28 69
66 18 20 26 57 18 52 46 68
33
84
70
39
54
63
64
45
79
66
87
75
64
67
86
81
64
64
57
32 852
828
778
756
733
681
671
657
634
631
621
619
555
534
532
498
469
434
432
428
Our findings The top three cities (Shenzhen, Guangzhou and Nanjing) form the first group, for which the sum of points across 58 variables exceeds 770 points, and their rankings are the same as in the previous year. The difference is that the point gaps between them have been slightly extended. Last year, Shenzhen was just one point higher than Guangzhou, and the latter was seven points higher than Nanjing. This year, these two point gaps are 24 and 50 respectively. This is partly because this year’s Chinese Cities of Opportunity added five new cities for observation, which increased the overall data volume by 33%; and partly perhaps because Shenzhen’s service industry has a comparative advantage for development. Nanjing is ranked third. Looking through the ten indicators, we see that Nanjing ranked in the top ten under all indicators, and it ranks second or third in three of them, putting it in the top three in terms of overall observation.
Wuhan, Hangzhou, Chengdu, Xi’an, Tianjin, Xiamen and Qingdao are ranked
fourth to tenth, with the sum of points ranging from 760 to 630. Wuhan stands in the same position as last year but the difference in points between Wuhan and Nanjing is quite large, creating a definite gap between the top three and those ranked fourth or lower. In addition, Wuhan is only 125 points higher than Qingdao, which comes in last among the seven cities. Due to the closeness in point totals, we classified these seven cities out of the 20 cities as the second group. Compared to last year, Hangzhou has moved up in ranking. Chengdu, one of the newly added cities, stands in sixth place. Xi'an and Qingdao also moved up while Tianjin and Xiamen slipped slightly. For specific reasons as to the changes, please refer to the analysis of relevant indicators.
Dalian, Shenyang, Chongqing, Fuzhou, Zhengzhou and Urumqi ranked 11th to 16th, with points from 621 to 498, and form the third group. Shenyang ranked eighth among the 15 cities last year and comes in after Dalian this year, but their point totals across variables are very close. Chongqing, Zhengzhou and
Urumqi are in the same relative positions as last year, while Xi’an and Qingdao have moved up from this group of cities into the second group this year. Fuzhou, a newly added city this year, is ranked 14th.
Cities with total variable points below 470 finish up the list. They are Changchun, Harbin, Nanning and Lanzhou. Changchun, Harbin and Lanzhou are newly added sample cities, and, together with Nanning, they form the last group. Changchun and Harbin are old industrial bases in the northeast, and the provinces they belong to—Jilin and Heilongjiang—are rich in natural resources, educational and cultural heritage and have extensive foundations for economic interaction with Russia, Japan and South Korea. Lanzhou is not only a famous historical city but also a key city in the current “One Belt and One Road” strategy. Nanning is the Chinese city with the closest economic and cultural ties to ASEAN countries. Seen from the perspective of our indicators and variables, these cities have considerable potential.

PwC 9
1
2
3
4
5
6
7
8
9
10
11
12
13
14
15
16
17
18
19
20
Important regional cities
Intellectual capital and innovation
Technology readiness
Healthcare, safety and security
Transportation and urban planning
Sustainability and the natural environment
Culture and lifestyle Economic clout Ease of doing business
Cost Score
Shenzhen
Lanzhou
Nanning
Harbin
Changchun
Urumqi
Zhengzhou
Fuzhou
Chongqing
Shenyang
Dalian
Qingdao
Xiamen
Tianjin
Xi'an
Chengdu
Hangzhou
Wuhan
Nanjing
Guangzhou
102 116 74 67 81 76 51 112 141
112 107 71 73 83 70 55 100 124
111 70 68 71 80 70 46 76 102
106 78 46 80 80 58 46 89 103
110 75 71 73 61 56 44 82 122
79 97 51 75 69 52 26 75 103
94 64 44 53 84 46 45 76 102
88 71 35 57 61 60 14 90 117
65 77 62 53 70 62 45 46 109
51 66 45 61 52 71 43 46 117
69 49 37 64 76 55 45 71 89
71 63 34 44 92 57 43 59 69
53 93 16 54 58 55 20 50 81
58 48 53 42 48 53 44 36 88
72 49 29 45 47 35 44 40 104
47 40 20 29 66 39 34 58 79
48 33 23 40 49 36 48 49 62
39 41 19 29 36 38 55 48 65
43 18 25 33 46 60 46 28 69
66 18 20 26 57 18 52 46 68
33
84
70
39
54
63
64
45
79
66
87
75
64
67
86
81
64
64
57
32 852
828
778
756
733
681
671
657
634
631
621
619
555
534
532
498
469
434
432
428
In-depth interviews To broaden our horizon, we invited five interviewees to talk about their concerns from their personal perspectives. They are Zheng Xinli, former Deputy Director of the Policy Research Office of the Communist Party of China Central Committee and Chairman of the China Committee for Development of Medium and Small Cities and Executive President of China Urbanisation Development Council, Yao Jingyuan, former Chief Economist of the National Bureau of
Statistics and Special Researcher of the Counsellors’ Office of the State Council, Zhang Hongyi, former Vice Mayor of Shenzhen and Executive Director of the China Development Institute, Gu Yaoming, former Secretary-General of the Chinese Olympic Committee and former Executive Member of the Beijing Olympic Committee and Executive Member of the Beijing Olympic Organizing Committee, and Li Xinhe, a young entrepreneur and President of renrendai.com. Interviews with them
did not relate to the specific observation indicators and variables of this report. They focused instead on topics related to urban development and by virtue of their broad professional knowledge and keen insights, added dynamism to Chinese Cities of Opportunity 2015.
In addition, we selected pictures of the sculptor Zhang Hua’s award-winning works, as illustrations for our report, together with city-themed images chosen from our photo library, to create a more visually appealing report.

10 Cities of Opportunity 2015
1. Intellectual capital and innovation
Intellectual capital and the ability to innovate are the basis and driving force of future urban development. Given the new normal of economic development in China today, innovation becomes increasingly important to urbanisation as a source of growth to bolster economic restructuring and sustainable development. We used seven variables to assess elementary and higher education, scientific research, innovation and other areas of development in each of the cities.
According to the results, the overall development in Guangzhou, Nanjing and Hangzhou were similar. Guangzhou showed balanced development across the metrics and thus was given the highest overall score. As one of the oldest open coastal cities, Guangzhou scored the highest in elementary education, and it also achieved above average scores in terms of the proportion of residents who have received higher education to the total population and research quality of key local universities. The city also ranked among the top cities in the three innovation variables: city innovation index, entrepreneurial environment and innovation application. The only area that it falls behind in is public libraries.
Nanjing and Hangzhou scored similarly across the variables. Nanjing received the top ranking in key university research quality, as it boasts the largest number of key state-level laboratories producing high quality research, an indication of the solid educational resource base developed by Nanjing over years of dedicated efforts. Hangzhou, on the other hand, is rated a notch above Nanjing on the innovation front, and scored similarly on the three variables of city innovation index, entrepreneurial environment and innovation applications to Shenzhen and Guangzhou. The city saw a proliferation of small Internet-based start-ups in recent years, and as a result, it ranks second only to Shenzhen in terms of the number of GEM-listed (Growth Enterprise Market) companies and their operating revenues.
Wuhan and Shenzhen’s scores were also close to that of the top three cities. Wuhan is noted for its balanced development across different metrics, and only scored poorly in public libraries and the city innovation index. However, as reforms in China deepen and shift from coastal regions to the Yangtze River delta, Wuhan, as an important city in the Yangtze River economic belt, will need to rely on well-educated professionals and a positive entrepreneurial environment to open up development of their economy.
Shenzhen is the first city to pilot economic reform and opening-up in China. It represents the spirit of innovation and ranks first on all three relevant variables. Technology has always been a pillar of the local economy in Shenzhen. In 2013, the gross value of technological products accounted for more than half of the total above-scale industrial output, and high-tech R&D investment was as high as 4% of Shenzhen’s local GDP, making the city one of the best choices for entrepreneurs. In addition, it also achieved above-average scores for elementary education and public libraries, though in the course of continual development, the proportion of local population who have received a higher education has considerable room for improvement.
1
2
3
4
5
6
7
8
9
10
11
12
13
14
15
16
17
18
19
20
ScoreInnovation applications
Entrepreneurial environment
City innovation index
Research quality of major universities
Public libraries
Harbin
Nanning
Urumqi
Changchun
Qingdao
Chongqing
Fuzhou
Xiamen
Lanzhou
Dalian
Shenyang
Zhengzhou
Chengdu
Tianjin
Xi’an
Shenzhen
Wuhan
Hangzhou
Nanjing
Guangzhou 7 15 18 19 18
15 20 14 14 15
14 18 17 18 19
11 19 9 17 14
20 2 20 20 20
11 18 6 15 11
13 16 16 11 16
2 15 12 16 18
4 4 15 12 9
19 8 8 9 9
18 12 7 13 7
11 10 3 2 3
17 7 10 4 12
6 5 19 7 6
2 11 13 11 13
3 6 11 8 10
11 13 1 5 4
12 1 4 3 5
16 3 5 1 1
6
Proportion of the population receiving higher education
Standard of basic education
20 15
14 19
11 13
18 18
19 1
1
16 17
13 3
5 11
12 16
8 10
6 6
17 20
10 5
7 8
2
2
9 4
12
15 7
3 14
4 9 10 2 6 2
112
111
110
106
102
94
88
79
72
71
69
66
65
58
53
51
48
47
43
39
Shenzhen Photo by Charles Chow

PwC 11
1
2
3
4
5
6
7
8
9
10
11
12
13
14
15
16
17
18
19
20
ScoreInnovation applications
Entrepreneurial environment
City innovation index
Research quality of major universities
Public libraries
Harbin
Nanning
Urumqi
Changchun
Qingdao
Chongqing
Fuzhou
Xiamen
Lanzhou
Dalian
Shenyang
Zhengzhou
Chengdu
Tianjin
Xi’an
Shenzhen
Wuhan
Hangzhou
Nanjing
Guangzhou 7 15 18 19 18
15 20 14 14 15
14 18 17 18 19
11 19 9 17 14
20 2 20 20 20
11 18 6 15 11
13 16 16 11 16
2 15 12 16 18
4 4 15 12 9
19 8 8 9 9
18 12 7 13 7
11 10 3 2 3
17 7 10 4 12
6 5 19 7 6
2 11 13 11 13
3 6 11 8 10
11 13 1 5 4
12 1 4 3 5
16 3 5 1 1
6
Proportion of the population receiving higher education
Standard of basic education
20 15
14 19
11 13
18 18
19 1
1
16 17
13 3
5 11
12 16
8 10
6 6
17 20
10 5
7 8
2
2
9 4
12
15 7
3 14
4 9 10 2 6 2
112
111
110
106
102
94
88
79
72
71
69
66
65
58
53
51
48
47
43
39
12 Cities of Opportunity 2015
Interview: China’s urbanisation development strategy
Zheng XinliFormer Deputy Director of the Policy Research Office of the Communist Party of China Central Committee
Chairman of the China Committee for Development of Medium and Small Cities
Executive President of China Urbanisation Development Council

PwC 13
The urbanisation strategy will remain an important measure to deepen economic reforms and promote economic growth in China going forward. PwC’s report sheds new light on the development of Chinese cities from a number of fresh perspectives.
Urbanisation in China involves a wide variety of factors ranging from macroeconomics to micro issues, from economic governance to social administration. Here, I would like to talk about the binary economic structure. The binary economic structure is the historical product of the planned economy in China. It once played a positive role in China’s economic development, but has now become an obstacle to economic growth under the socialist market economy system. “New urbanisation” needs to gradually abolish the binary system in the Chinese economy to facilitate the fully integrated development of urban and rural areas. To this end, the following two reforms are of utmost importance.
First, the household registration system. The “three 100 million” initiatives must be effectively implemented according to the State Council’s requirements: registering 100 million migrant workers from rural areas, moving an additional 100 million rural workers to central and western cities, and redeveloping substandard living conditions for 100 million households. These initiatives will produce immediate results in terms of growth stabilisation.
Second, unlock potential labour and land resources through rural land tenure reforms. Some argue that China has lost its advantage of having a substantial, low-cost workforce, but I believe this statement was made 20 years too early. China still has an untapped rural workforce of 260 million people, farming a total of 1.8 billion mu of land—that’s an average of only seven mu per person. The introduction of existing agricultural mechanisation technology would allow each person to easily farm up to several hundreds of mu.
In recent years, through reforming urban land systems, we have been able to unlock the massive workforce potential in rural areas simply by introducing intensive farming techniques, thereby improving agricultural productivity. In this way, we have also released the untapped potential of land resources in rural areas through a reform of the rural homestead system. Existing homesteads occupy a total of 255 million mu of rural land. In fact, we only need around 100 million mu to be commercialized through paid transfers, and the remaining 100 million mu or so may be used as new farmland or construction sites as required by the cities.

14 Cities of Opportunity 2015
2. Important regional cities
All 20 cities are basically important regional trade and traffic centres and play a major role in driving regional development. The important regional cities dimension examines six variables of local business travel and convenience of transport, including star graded hotels, international tourists, inbound and outbound flights, total passenger flows, convention/exhibition economic development and airport accessibility.
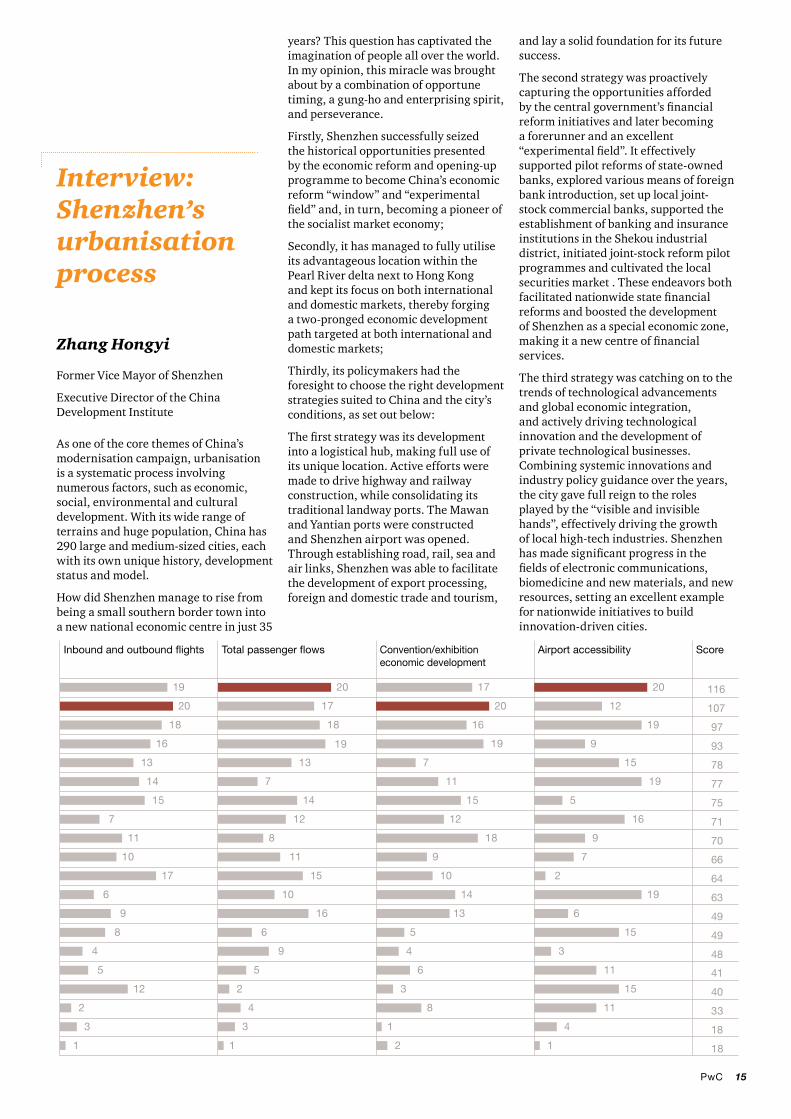
Shenzhen and Guangzhou scored the highest in this aspect, closely followed by Chengdu and Chongqing. The rankings of these two cities represent the development results of the Pearl River delta—the pioneer of economic reform in China—and the southwestern region introduction of the Western Development strategy.
Shenzhen almost tied with Guangzhou in star graded hotels, international tourists and inbound and outbound flights. This is consistent with their status as hubs connecting Guangdong, Hong Kong and Macao. Shenzhen gets the highest scores in total passenger flows and airport accessibility, while Guangzhou is relatively poorly ranked for airport accessibility but scored first place in convention/exhibition economic development as the “Capital of Exhibitions”. The free-trade zone in Guangzhou approved at the end of 2014 is poised to become a window showcasing financial operation between Guangdong, Hong Kong and Macao. As two important hubs, Shenzhen and Guangzhou are well positioned to play an even greater role in regional cooperation and economic opening-up going forward.
Chengdu and Chongqing took third and fourth places respectively as the two main cities in Southwest China. Ever since the introduction of the Western Development strategy, Chengdu has been widely acknowledged as the regional powerhouse and has achieved relatively high economic growth. As the busiest airport in Central and Western China, Shuangliu International Airport in
Chengdu has nearly as many inbound and outbound flights as Bao’an Airport in Shenzhen. Chengdu ranked third out of the 20 cities in terms of total passenger flows, and also outperformed others in airport accessibility. Chongqing, another central city in Western China, is the only municipality directly under central government administration in the region. It displays relatively balanced development across different variables with top rankings in star graded hotels, total passenger flows and exhibition industry development, confirming its status as the core of regional economic and trade activities. In terms of airport accessibility, however, the city did not score as well due to its mountainous feature. Both Chengdu and Chongqing ranked slightly behind coastal cities
such as Shenzhen and Guangzhou on total passenger flows. This is attributable to their locations in Southwest China and the fact that they are late adopters of the opening-up policy, but the two cities have managed to reach the upper tier of the 20 cities following rapid internationalisation in recent years.
It is also worth pointing out that the “One Belt and One Road” strategy put forward by Chairman Xi Jinping will definitely benefit Chengdu and Chongqing given their locations within the Silk Road Economic Belt and the 21st Century Maritime Silk Road. In addition to these two cities, many others in the survey also occupy key positions along the “One Belt and One Road”. We hope they will also seize the opportunities given to them to boost local economic growth.
1
2
3
4
5
6
7
8
9
10
11
12
13
13
15
Star graded hotels International tourists ScoreAirport accessibility Convention/exhibition economic development
Total passenger flowsInbound and outbound flights
Fuzhou
Dalian
Zhengzhou
Shenyang
Xi'an
Qingdao
Nanjing
Tianjin
Hangzhou
Xiamen
Wuhan
Chongqing
Chengdu
Guangzhou
Shenzhen 20 20 19 20 17 20 116
19 19 20 17 20 12 107
12 14 18 18 16 19 97
17 13 16 19 19 9 93
14 16 13 13 7 15 78
9 17 14 7 11 19 77
16 10 15 14 15 5 75
6 18 7 12 12 16 71
16 8 11 8 18 9 70
18 11 10 11 9 7 66
8 12 17 15 10 2 64
7 7 6 10 14 19 63
1 4 9 16 13 6 49
6 9 8 6 5 15 49
13 15 4 9 4 3 48
16
17
18
19
19 Lanzhou
Nanning
Changchun
Urumqi
Harbin 12 2 5 5 6 11 41
3 5 12 2 3 15 40
2 6 2 4 8 11 33
4 3 3 3 1 4 18
12 1 1 1 2 1 18
PwC 15
As one of the core themes of China’s modernisation campaign, urbanisation is a systematic process involving numerous factors, such as economic, social, environmental and cultural development. With its wide range of terrains and huge population, China has 290 large and medium-sized cities, each with its own unique history, development status and model.
How did Shenzhen manage to rise from being a small southern border town into a new national economic centre in just 35
years? This question has captivated the imagination of people all over the world. In my opinion, this miracle was brought about by a combination of opportune timing, a gung-ho and enterprising spirit, and perseverance.
Firstly, Shenzhen successfully seized the historical opportunities presented by the economic reform and opening-up programme to become China’s economic reform “window” and “experimental field” and, in turn, becoming a pioneer of the socialist market economy;
Secondly, it has managed to fully utilise its advantageous location within the Pearl River delta next to Hong Kong and kept its focus on both international and domestic markets, thereby forging a two-pronged economic development path targeted at both international and domestic markets;
Thirdly, its policymakers had the foresight to choose the right development strategies suited to China and the city’s conditions, as set out below:
The first strategy was its development into a logistical hub, making full use of its unique location. Active efforts were made to drive highway and railway construction, while consolidating its traditional landway ports. The Mawan and Yantian ports were constructed and Shenzhen airport was opened. Through establishing road, rail, sea and air links, Shenzhen was able to facilitate the development of export processing, foreign and domestic trade and tourism,
and lay a solid foundation for its future success.
The second strategy was proactively capturing the opportunities afforded by the central government’s financial reform initiatives and later becoming a forerunner and an excellent “experimental field”. It effectively supported pilot reforms of state-owned banks, explored various means of foreign bank introduction, set up local joint-stock commercial banks, supported the establishment of banking and insurance institutions in the Shekou industrial district, initiated joint-stock reform pilot programmes and cultivated the local securities market . These endeavors both facilitated nationwide state financial reforms and boosted the development of Shenzhen as a special economic zone, making it a new centre of financial services.
The third strategy was catching on to the trends of technological advancements and global economic integration, and actively driving technological innovation and the development of private technological businesses. Combining systemic innovations and industry policy guidance over the years, the city gave full reign to the roles played by the “visible and invisible hands”, effectively driving the growth of local high-tech industries. Shenzhen has made significant progress in the fields of electronic communications, biomedicine and new materials, and new resources, setting an excellent example for nationwide initiatives to build innovation-driven cities.
Interview: Shenzhen’s urbanisation process
Zhang Hongyi
Former Vice Mayor of Shenzhen
Executive Director of the China Development Institute
1
2
3
4
5
6
7
8
9
10
11
12
13
13
15
Star graded hotels International tourists ScoreAirport accessibility Convention/exhibition economic development
Total passenger flowsInbound and outbound flights
Fuzhou
Dalian
Zhengzhou
Shenyang
Xi'an
Qingdao
Nanjing
Tianjin
Hangzhou
Xiamen
Wuhan
Chongqing
Chengdu
Guangzhou
Shenzhen 20 20 19 20 17 20 116
19 19 20 17 20 12 107
12 14 18 18 16 19 97
17 13 16 19 19 9 93
14 16 13 13 7 15 78
9 17 14 7 11 19 77
16 10 15 14 15 5 75
6 18 7 12 12 16 71
16 8 11 8 18 9 70
18 11 10 11 9 7 66
8 12 17 15 10 2 64
7 7 6 10 14 19 63
1 4 9 16 13 6 49
6 9 8 6 5 15 49
13 15 4 9 4 3 48
16
17
18
19
19 Lanzhou
Nanning
Changchun
Urumqi
Harbin 12 2 5 5 6 11 41
3 5 12 2 3 15 40
2 6 2 4 8 11 33
4 3 3 3 1 4 18
12 1 1 1 2 1 18

16 Cities of Opportunity 2015
3. Technology readiness
The advent of IT led to a third technological revolution which in turn led to a transformation and upgrade of urban industrialisation standards. As the Chinese economy faces structural adjustments, transformation and upgrades, it is imperative for China to develop energy-efficient, high value-added, strategic emerging industries. As such, technology is the main criterion adopted to assess a city’s technology readiness. It involves four variables: Internet penetration, broadband speed, digital economy and software development and multimedia design.
The scores show Shenzhen, Hangzhou, Guangzhou and Nanjing as the top performers with very similar scores. They are followed closely by Xiamen. Fuzhou, Chengdu, Wuhan, Qingdao and Xi’an post similar results, while most cities with the lowest rankings are in Northeastern and Western China. High-tech development and technical
innovation are thus shown to correlate with local economic fundamentals—economically developed regions boast advantageous fundamentals in terms of acceptance, penetration and levels of investment in the Internet and other types of high technology.
Shenzhen ranks first in this aspect in line with its excellent capability for innovation. In addition to Internet penetration, the city gets the first place for both digital economy and software development and multimedia design, which indicates the highest level of development in e-commerce, software and other Internet-related industries among all 20 cities. Shenzhen is also home to the headquarters of a large number of well-known Internet companies.
Hangzhou, by contrast, has the most balanced development. It ranks third or fourth across the variables and receives the second highest
overall score. In recent years, the city launched a campaign to promote technical innovation and Internet entrepreneurship and has established itself as an important base of small-to-medium-size Internet companies. A number of large well-known Internet enterprises were also created in the process.
Guangzhou takes first place for Internet penetration, second for digital economy, and is highly ranked in the other two variables. Nanjing ranks first for broadband speed and is among the best cities for digital economy and software development and multimedia design, with a middle ranking for Internet penetration.
Development of the Internet economy requires continuous improvement in hardware infrastructure (providing optical fibre and wireless base stations) and soft power (talent attraction and industry chain construction). Despite their relatively low overall rankings, Urumqi, Harbin and Chongqing received middle rankings for Internet penetration and digital economy (Urumqi), broadband speed (Harbin) and software development and multimedia design (Chongqing), with significant room for improvement in the other areas.
1
2
2
4
5
6
7
8
9
10
11
12
13
14
15
Internet penetration Broadband speed Digital economy Software development and multimedia design
Score
Nanning
Zhengzhou
Shenyang
Tianjin
Dalian
Xi'an
Qingdao
Wuhan
Chengdu
Fuzhou
Xiamen
Nanjing
Guangzhou
Hangzhou
Shenzhen 19 15 20 20 74
18 17 18 18 71
20 15 19 17 71
13 20 16 19 68
17 19 17 9 62
14 19 14 6 53
6 16 13 16 51
16 3 15 12 46
12 12 10 11 45
15 8 11 10 44
8 6 9 14 37
1 13 8 13 35
7 6 6 15 34
9 4 12 4 29
10 7 5 3 25
16
17
17
19
20 Chongqing
Harbin
Urumqi
Lanzhou
Changchun 3 10 3 7 23
5 9 4 2 20
11 1 7 1 20
2 11 1 5 19
4 2 2 8 16

PwC 17
Interview: Internet finance
Li XinhePresident of renrendai.com
The Internet has been changing our business models and reshaping our habits. In China’s current new normal environment, the marriage of finance and the Internet has led to a series of “chemical reactions”. To a certain extent, the unique financial environment and technical conditions in China have acted as a catalyst for the rapid development of Internet financing represented by P2P businesses. From the investors’ perspective, there is currently a severe shortage of low-risk, fixed-income investment instruments and a lack of effective investment channels in China, especially for small investors. Approximately 80% of China’s most affluent were born between 1960 and 1989. There is an enormous demand for wealth management services together with a high degree of acceptance of new technologies, such as the Internet and mobile Internet. The total number of Internet users in China has reached 600 million, and Internet penetration has reached over 40%, which means a significant part of the population has already begun using Internet-based financing services. From the perspective of funds supply, Internet financing offers an effective solution to small and
micro businesses’ financing difficulties, including small and micro business owners and sole proprietors who are unable to meet their financing needs. In fact, small and micro businesses often have difficulties obtaining loans due to their lack of acceptable collateral and comprehensive credit records, and their financing needs being low in value, high in frequency and urgency. Only about a third of the 56 million small businesses and sole proprietors in China have borrowings, but only ten percent of these have successfully obtained bank loans. It is projected that the rate of Chinese small businesses receiving financing will increase from 11% in 2013 to 30-40% by 2020, meaning that the financing needs of over 30 million new small businesses and sole proprietors will be met in the next several years. Right now, Internet financing is still in its infancy in China. Internet financing will embrace a period of “golden development” in the next five to ten years as the credit record system reaches maturity, effective Internet risk management is gradually formulated and regulation systems gradually matures. The development of Internet finance will definitely benefit China’s new urbanisation efforts.
Chongqing Photo by David Huang

18 Cities of Opportunity 2015
4. Healthcare, safety and security
For a city to develop, it must constantly increase its appeal, so as to attract a constant flow of talent, materials, capital and information. Improving a city’s attractiveness helps improve its overall competitiveness, as the inflow of materials, capital and information into a city illustrates the city’s importance for development in other areas, while its appeal to human resources is a critical factor in determining its competitiveness. The direction of population flow indicates the city’s hardware environment, but it is usually what it has to offer residents in terms of both hardware and “soft” amenities that gives the city a lasting appeal. Five variables are employed to assess the cities’ population retention ability in terms of healthcare services, security and administration: healthcare resources, medical system service standards, elderly care services, public safety index and government services.
Wuhan maintained its leading position in this aspect and was once again ranked first. As a new entrant, Chengdu performed very well and took the second place, followed by Hangzhou and Guangzhou tied for third place, and Nanjing in fifth.
Wuhan outranked all other 19 cities in healthcare standards. It has the second largest number of third-level A-grade hospitals and is ranked second in terms of public satisfaction regarding healthcare services. Its scores on the other four variables are moderate and average: third place for government services (after Shenzhen and Guangzhou), second for city administration, 9th for information access with considerable room for improvement, above-average performance in terms of beds available in medical institutions and the number of medical practitioners per 10,000
people, and mediocre rankings for public safety index and care of the elderly, with significant room for improvement on road traffic mortality per 10,000 vehicles and fire accidents per 10,000 people.
As a new entrant this year, Chengdu ranked very well on all variables, albeit without any first rankings: second and third places respectively in the number of beds available in medical institutions and the number of medical practitioners per 10,000 people, second in information access indicating a high degree of transparency in government services, and tenth for city administration. In particular, given its location within the China-India-Bangladesh-Myanmar corridor and the Yangtze River economic belt and its status as an important connection point between the Silk Road belt and Yangtze River ecnomy, Chengdu is well poised to benefit from numerous strategic opportunities available to all of these abovementioned regions over the coming years.
Hangzhou ranked first among the 20 cities in elderly care services, with the second highest scores on the number of beds available in medical institutions per 10,000 people and basic urban pension insurance coverage. It has abundant healthcare resources and a high standard of medical services, outranking most cities in both variables.
Guangzhou receives second place in government services, second only to Shenzhen. It also posts above-average performance in health care resources, medical system service standards and elderly care services. Guangzhou falls behind in the public safety index, with the fifth lowest ranking (out of 20) in road traffic mortality per 10,000 vehicles, and low satisfaction scores regarding public safety index.
Nanjing ranks among the top three cities in medical system service standards, elderly care services and public safety index, but does not score as well on the number of beds in medical institutions available per 10,000 people and the number of medical practitioners per 10,000 people when compared with its rankings for local medical system service standards and elderly care services.
1
2
3
3
5
6
7
8
9
10
11
11
13
14
15
Medical system service standards
Elderly care services Public safety index Government servicesHealthcare resources Score
Fuzhou
Shenyang
Zhengzhou
Xiamen
Xi'an
Chongqing
Tianjin
Qingdao
Dalian
Shenzhen
Nanjing
Guangzhou
Hangzhou
Chengdu
Wuhan 15 20 12 15 18 80
19 15 13 11 17 75
16 16 20 7 14 73
14 15 17 8 19 73
6 19 18 19 9 71
4 6 20 17 20 67
13 12 14 14 11 64
8 8 15 20 10 61
1 18 10 14 14 57
4 17 8 17 8 54
13 13 6 7 14 53
4 9 16 18 6 53
11 1 7 10 16 45
17 10 11 3 3 44
5 6 9 7 15 42
16
17
18
18
20 Lanzhou
Harbin
Urumqi
Nanning
Changchun 10 11 5 10 4 40
9 4 2 12 6 33
20 2 5 1 1 29
7 7 3 4 8 29
18 3 1 2 2 26

PwC 19
重庆市渝中区解放碑全景
1
2
3
3
5
6
7
8
9
10
11
11
13
14
15
Medical system service standards
Elderly care services Public safety index Government servicesHealthcare resources Score
Fuzhou
Shenyang
Zhengzhou
Xiamen
Xi'an
Chongqing
Tianjin
Qingdao
Dalian
Shenzhen
Nanjing
Guangzhou
Hangzhou
Chengdu
Wuhan 15 20 12 15 18 80
19 15 13 11 17 75
16 16 20 7 14 73
14 15 17 8 19 73
6 19 18 19 9 71
4 6 20 17 20 67
13 12 14 14 11 64
8 8 15 20 10 61
1 18 10 14 14 57
4 17 8 17 8 54
13 13 6 7 14 53
4 9 16 18 6 53
11 1 7 10 16 45
17 10 11 3 3 44
5 6 9 7 15 42
16
17
18
18
20 Lanzhou
Harbin
Urumqi
Nanning
Changchun 10 11 5 10 4 40
9 4 2 12 6 33
20 2 5 1 1 29
7 7 3 4 8 29
18 3 1 2 2 26
20 Cities of Opportunity 2015
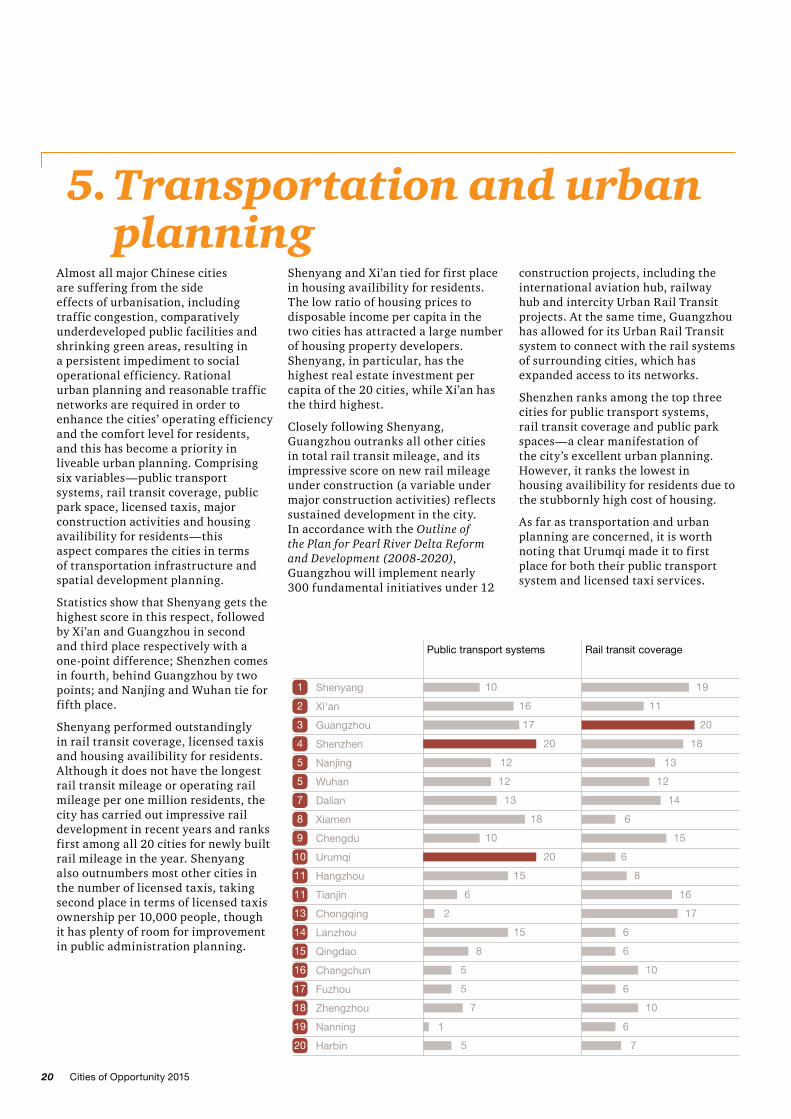
5. Transportation and urban planning
Almost all major Chinese cities are suffering from the side effects of urbanisation, including traffic congestion, comparatively underdeveloped public facilities and shrinking green areas, resulting in a persistent impediment to social operational efficiency. Rational urban planning and reasonable traffic networks are required in order to enhance the cities’ operating efficiency and the comfort level for residents, and this has become a priority in liveable urban planning. Comprising six variables—public transport systems, rail transit coverage, public park space, licensed taxis, major construction activities and housing availibility for residents—this aspect compares the cities in terms of transportation infrastructure and spatial development planning.
Statistics show that Shenyang gets the highest score in this respect, followed by Xi’an and Guangzhou in second and third place respectively with a one-point difference; Shenzhen comes in fourth, behind Guangzhou by two points; and Nanjing and Wuhan tie for fifth place.
Shenyang performed outstandingly in rail transit coverage, licensed taxis and housing availibility for residents. Although it does not have the longest rail transit mileage or operating rail mileage per one million residents, the city has carried out impressive rail development in recent years and ranks first among all 20 cities for newly built rail mileage in the year. Shenyang also outnumbers most other cities in the number of licensed taxis, taking second place in terms of licensed taxis ownership per 10,000 people, though it has plenty of room for improvement in public administration planning.
Shenyang and Xi’an tied for first place in housing availibility for residents. The low ratio of housing prices to disposable income per capita in the two cities has attracted a large number of housing property developers. Shenyang, in particular, has the highest real estate investment per capita of the 20 cities, while Xi’an has the third highest.
Closely following Shenyang, Guangzhou outranks all other cities in total rail transit mileage, and its impressive score on new rail mileage under construction (a variable under major construction activities) reflects sustained development in the city. In accordance with the Outline of the Plan for Pearl River Delta Reform and Development (2008-2020), Guangzhou will implement nearly 300 fundamental initiatives under 12
construction projects, including the international aviation hub, railway hub and intercity Urban Rail Transit projects. At the same time, Guangzhou has allowed for its Urban Rail Transit system to connect with the rail systems of surrounding cities, which has expanded access to its networks.
Shenzhen ranks among the top three cities for public transport systems, rail transit coverage and public park spaces—a clear manifestation of the city’s excellent urban planning. However, it ranks the lowest in housing availibility for residents due to the stubbornly high cost of housing.
As far as transportation and urban planning are concerned, it is worth noting that Urumqi made it to first place for both their public transport system and licensed taxi services.
1
2
3
4
5
5
7
8
9
10
11
11
13
14
15
Public transport systems Rail transit coverage ScoreHousing availibility for residents
Major construction activitiesLicensed taxisPublic park space
Qingdao
Lanzhou
Chongqing
Tianjin
Hangzhou
Urumqi
Chengdu
Xiamen
Dalian
Wuhan
Nanjing
Shenzhen
Guangzhou
Xi'an
Shenyang 10 19 10 19 14 20 92
16 11 11 9 17 20 84
17 20 6 15 19 6 83
20 18 20 12 10 1 81
12 13 17 10 20 8 80
12 12 7 14 17 18 80
13 14 8 13 12 16 76
18 6 14 8 18 6 70
10 15 12 4 10 18 69
20 6 3 20 11 6 66
15 8 9 7 13 9 61
6 16 1 17 10 11 61
2 17 16 1 7 15 58
15 6 13 16 5 2 57
8 6 15 5 5 13 52
16
17
18
19
20 Harbin
Nanning
Zhengzhou
Fuzhou
Changchun 5 10 2 18 2 12 49
5 6 19 2 6 10 48
7 10 4 6 5 15 47
1 6 18 3 15 3 46
5 7 5 11 1 7 36

PwC 21
Former Premier Zhu Rongji once joked that macro analysis relies on “statistics and estimates”. This has been mistakenly interpreted by some as “completely subjective, hot-headed decision making”, because they do not understand the essence of macroeconomic analysis. Premier Zhu was referring to the science of management, and his insightful remark can only be appropriately understood when viewed from the vantage point of a state policymaker. A statistical aggregate should never be seen as the arithmetic sum of partial data, and even scientifically audited aggregates cannot be adequately analysed without practical, experiential knowledge of management.
In China, the National Bureau of Statistics (NBS) is responsible for gathering macroeconomic data, and statistics of individual cities are prepared by provincial-level (including municipalities directly under the central government and autonomous regions) statistical bureaus. However, state-level macroeconomic data is not the arithmetic sum of data gathered by multiple local bureaus, but calculated from a macroeconomic sample size required for national research and development. The NBS has separate survey teams for cities, rural areas and businesses, and these teams report directly to the central government and are responsible for gathering state-level statistics. Furthermore, we have identified certain enterprises as key
investigation targets, for example, over 20,000 first-grade corporate enterprises in China who submit monthly data directly to the NBS. Similarly, city-level statistics are not simply the arithmetic sum of district and county-level data.
As China’s socioeconomic development becomes increasingly sophisticated, it is crucial to avoid double counting when conducting a census. For example, corporate conglomerates and cross-regional operations have already become a general trend among Chinese enterprises, meaning a company may be headquartered in a provincial capital while its branches and subsidiaries may be located throughout or even outside the province. This means that cross-regional economic activities should be reflected in only one set of data. The NBS is required to comply with existing rules of data processing. The publication of statistical data must also be conducted according to legal processes, which requires annual preliminary accounting results to be released in January, preliminary adjusted results at mid-year, and final accounting results at year-end. Annual data is calculated based on the final results.
PwC’s Chinese Cities of Opportunity derives its data primarily from NBS statistics, supplemented with research data released by other organisations, and as such, is a serious academic piece with a strong emphasis on the reliability of data sources and consistency in statistical comparison.
Interview: Statistical Methodologies
Yao JingyuanFormer Chief Economist of the National Bureau of Statistics
Special Researcher of the Counsellors’ Office of the State Council
Vice-Chairman of the National Statistical Society of China
1
2
3
4
5
5
7
8
9
10
11
11
13
14
15
Public transport systems Rail transit coverage ScoreHousing availibility for residents
Major construction activitiesLicensed taxisPublic park space
Qingdao
Lanzhou
Chongqing
Tianjin
Hangzhou
Urumqi
Chengdu
Xiamen
Dalian
Wuhan
Nanjing
Shenzhen
Guangzhou
Xi'an
Shenyang 10 19 10 19 14 20 92
16 11 11 9 17 20 84
17 20 6 15 19 6 83
20 18 20 12 10 1 81
12 13 17 10 20 8 80
12 12 7 14 17 18 80
13 14 8 13 12 16 76
18 6 14 8 18 6 70
10 15 12 4 10 18 69
20 6 3 20 11 6 66
15 8 9 7 13 9 61
6 16 1 17 10 11 61
2 17 16 1 7 15 58
15 6 13 16 5 2 57
8 6 15 5 5 13 52
16
17
18
19
20 Harbin
Nanning
Zhengzhou
Fuzhou
Changchun 5 10 2 18 2 12 49
5 6 19 2 6 10 48
7 10 4 6 5 15 47
1 6 18 3 15 3 46
5 7 5 11 1 7 36

22 Cities of Opportunity 2015
6. Sustainability and the natural environment
China’s GDP grew 7.4% in 2014 to over US$10 trillion, making it the second largest economy in the world. The country is currently facing serious environmental pressure and challenges for its rapid economic growth. China is confronted with an increasing threat to its living environment—including rivers and lakes drying up, desertification of grasslands, deforestation and haze pollution. Given the underdevelopment of resource recycling in most Chinese cities, excessive waste and the resulting serious pollution has formed a vicious cycle where limited ecological capacity has become an obstacle to sustainable urban development.
This year, we attached particular importance to the labour supply variable. Confronted with resource shortages, limited ecological capacity and debilitating pollution, Chinese cities are facing a population migration resulting from the environment’s inability to sustain development, which has profound implications for the structure of urban society in the future. Needless to say, this is the product of extensive industrial development, breakneck city expansion and social management disorder.
This aspect examines sustainability and environmental protection in the cities using five variables: climate, utilisation of resources, green area, labour supply and risk of natural disasters. The results indicate that Shenzhen remains at the top, Qingdao outranks Guangzhou and Nanjing (in a tie for third place) in second place and Xiamen takes fifth place.
Finishing second in the overall rankings, Qingdao stands out from the crowd with the highest scores for both utilisation of resources and green area. Its performance is especially impressive in terms of water consumption per unit of GDP.
As China’s first special economic zone, Shenzhen is renowned for its remarkable economic achievements. High quality city growth has laid a solid foundation for attracting talent, and this explains its top ranking for labour supply. The city receives third place for both climate and utilisation of resources variables.
Similarly, Guangzhou has a fundamentally strong labour supply and ranks second out of the 20 cities. It takes second and third places for climate and green area respectively, while its ranking
in utilisation of resources reveals significant room for improvement.
Despite having a less favorable climate than Guangzhou and Shenzhen, Nanjing outranked most cities (second) in terms of green area per capita and green coverage in completed urban areas. It finishes at third place for labour supply but ties with Lanzhou and Urumqi for last place on the utilisation of resources variable, with the lowest rankings for both centralised sewage treatment rates and water consumption per unit of GDP.
1
2
3
3
5
6
6
8
9
10
11
11
13
14
15
Utilisation of resources Green area Labour supply Risk of natural disastersClimate Score
Xi'an
Chengdu
Fuzhou
Dalian
Chongqing
Hangzhou
Shenyang
Wuhan
Tianjin
Nanning
Xiamen
Nanjing
Guangzhou
Qingdao
Shenzhen 18 18 15 20 5 76
8 20 20 8 15 71
19 9 18 19 5 70
11 3 19 18 19 70
17 6 9 17 13 62
20 4 18 2 16 60
8 14 7 11 20 60
13 17 4 16 8 58
3 19 11 13 11 57
14 15 16 9 2 56
15 7 15 1 17 55
5 10 15 14 11 55
16 9 9 6 13 53
12 16 10 13 1 52
9 12 12 6 7 46
16
17
18
19
20 Lanzhou
Zhengzhou
Changchun
Harbin
Urumqi 4 3 6 8 18 39
1 11 5 15 6 38
2 13 1 11 9 36
10 5 3 3 14 35
6 3 2 4 3 18

PwC 23
6. Sustainability and the natural environment
1
2
3
3
5
6
6
8
9
10
11
11
13
14
15
Utilisation of resources Green area Labour supply Risk of natural disastersClimate Score
Xi'an
Chengdu
Fuzhou
Dalian
Chongqing
Hangzhou
Shenyang
Wuhan
Tianjin
Nanning
Xiamen
Nanjing
Guangzhou
Qingdao
Shenzhen 18 18 15 20 5 76
8 20 20 8 15 71
19 9 18 19 5 70
11 3 19 18 19 70
17 6 9 17 13 62
20 4 18 2 16 60
8 14 7 11 20 60
13 17 4 16 8 58
3 19 11 13 11 57
14 15 16 9 2 56
15 7 15 1 17 55
5 10 15 14 11 55
16 9 9 6 13 53
12 16 10 13 1 52
9 12 12 6 7 46
16
17
18
19
20 Lanzhou
Zhengzhou
Changchun
Harbin
Urumqi 4 3 6 8 18 39
1 11 5 15 6 38
2 13 1 11 9 36
10 5 3 3 14 35
6 3 2 4 3 18

24 Cities of Opportunity 2015
7. Culture and lifestyle
Urban residential lifestyle forms the core of developing a city’s functions. We use four metrics (cultural dynamism, traffic congestion, air quality and standard of living) to assess the cities on their performance in this aspect. Harbin and Guangzhou tie for first place with an overall score of 55, followed by Lanzhou, Shenzhen and Changchun coming in third, fourth and fifth respectively.
Harbin’s excellent performance in the cultural dynamism and traffic congestion variables earned it the top place in the rankings. In recent years, Harbin has carried out a series of major urban construction projects to give the city a facelift, including a new concert hall, city theatre and a number of other cultural venues. On 31 December 2014, the Harbin Symphony Orchestra, known as the “First Orchestra of the Far East”, performed at the new concert hall for the first time. In addition, a large
number of other cultural venues, such as the old Jewish synagogue, Harbin Workers Cultural Palace and Harbin Grand Theatre, are due to open their doors upon completion of renovation or construction work. Harbin’s winter ice festival has also earned the city great fame domestically and overseas.
Tying for first place with Harbin on the standard of living variable, Guangzhou is noted for its exceptionally high standard of living. Guangzhou offers relatively lower prices for housing, clothing, food and other necessities with the same high standard of living as enjoyed in Beijing and Shanghai. It also outperforms in terms of air quality. Other southern coastal cities, such as Fuzhou, Xiamen and Shenzhen, outrank all northern and inland cities in this respect.
Located along the northwest stronghold, Lanzhou ranks third on culture and lifestyle. It has been newly included in
the survey this year as an important city of the “One Belt and One Road” programme. Despite its low overall ranking, Lanzhou is especially recognized for its high scores for cultural dynamism and traffic congestion. Since 2014, the local government has launched and been actively driving a campaign to promote cultural innovation, holding a series of large cultural events, such as the New Year’s Concert, the International Drum Arts Week and the Yellow River Culture and Customs Week, drawing effectively on local cultural resources to raise the city’s cultural influence. As for traffic congestion, Lanzhou pledged in 2012 to “effectively alleviate traffic congestion within three years, and achieve major progress within five years”. Thus far, road traffic has improved significantly through a comprehensive transformation of the urban transport network.

PwC 25
大连市星海广场
Mass sports, also known as social sports, play a critical role in urban development. The rise of mass sports in China is the inevitable product of urban and industrial development.
As the Chinese society and economy undergo rapid growth, the population has become increasingly concentrated in cities. The increase in urban working population and productivity are reshaping peer production and lifestyles. People have more leisure time and therefore a stronger demand for sports and cultural recreation.At the same time, as social competition intensified, people’s mental stress has increased. The proliferation of urban diseases and the early arrival of an aging population have also led to the government and the general public placing greater emphasis on health issues.
The popularity and development of mass sports can also boost the establishment of social and public facilities, thereby becoming a driver of urban economic growth. Mass sports have already become a new point of growth for the national economy.
However, rapid urbanisation means that urban population growth and the expansion of Chinese cities have far outstripped urban planning expectations. Consequently, our cities have been overloaded in recent years, resulting in depletion of all kinds of resources, including mass sports and other urban public facilities. The construction of sports facilities has always lagged behind other urbanisation
developments in both quantitative and spatial terms. We still have a long way to go before we can catch up with Western countries in this respect. For example, public sports areas per capita in Germany reached 3.41m2 in 1976 and was 7.49m2 in Japan in 1990. Public sports area per capita in Beijing’s urban region was only about 1m2 in 2009.
A lack of sporting venues, facilities and professional coaching means that the majority of the population remains unaware of the value of physical exercise and in turn do not engage in sports. A breakdown of the ages of people who exercises regularly shows an imbalance between different age groups, with the smallest group being those in the 20-29 age bracket.
We need to raise people’s awareness and ensure the effective implementation of the National Fitness Programme launched by the State Council a long time ago. Drawing on the experiences of developed countries, active efforts must be made to improve mass sporting facilities and conditions, train more coaches, and gradually address the age group imbalance in mass sports participation. This will have a direct impact on improving the general population’s wellbeing and happiness quotient.
Interview: Mass sports is a force to be reckoned with in China’s urbanisation
Gu YaomingFormer Secretary-General of the Chinese Olympic Committee
Former Executive Member of the Beijing Olympic Organizing Committee
3
4
5
6
6
6
9
9
9
12
12
12
15
Cultural dynamism Traffic congestion Air quality Standard of living Score
15
17
18
19
20
1 Guangzhou 10 10 15 20
1 Harbin 20 19 9 7
Lanzhou 18 18 13 3
Shenzhen 8 8 18 17
Changchun 13 20 10 5
Wuhan 19 9 7 11
Nanjing 16 3 8 19
Nanning 12 16 16 2
Xiamen 2 11 19 13
Xi'an 16 13 1 15
Dalian 3 14 17 11
Hangzhou 12 2 12 18
Fuzhou 7 5 20 12
Zhengzhou 16 12 2 14
Qingdao 6 17 11 9
Shenyang 17 6 4 16
Urumqi 10 15 5 4
Chengdu 5 7 6 8
Chongqing 1 4 14 1
Tianjin 4 1 3 6
55
55
52
51
48
46
46
46
45
45
45
44
44
44
43
43
34
26
20
14

26 Cities of Opportunity 2015
8. Economic clout
Economic clout includes six variables, namely, number of well-known enterprises, financial professionals per 10,000 people, foreign direct investments, size of the technology market, productivity and nominal growth of gross regional product. Our findings show that Shenzhen, Guangzhou and Tianjin are the most influential cities in economic terms.
As the IT industry evolves in China, Shenzhen, renowned as the “Silicon Valley of China”, boasts the largest number of well-known technology companies out of all Chinese cities. It is home to over 300 famous domestic technical companies, including Huawei, ZTE and Tencent, and leading multinationals, thanks to its fully developed local IT industry chain and excellent investment environment. Shenzhen also tops the list in terms of technology market size.
The economic clout of Guangzhou mainly lies in its productivity and nominal growth of gross regional product. In 2013, the city’s GDP grew 11.6% to RMB 1.542 trillion, beating the other 19 cities. Guangzhou has restructured its tertiary industry through continuous development of the logistics, tourism and finance industries since the beginning of the 11th “Five-Year Plan” (2006-2010), successfully transforming itself from an industrial city to one dominated by services. Driven by the rapid growth of the tertiary industry and the Internet boom, Guangzhou’s productivity has consistently remained high.
Tianjin, home to the largest comprehensive port in Northern China, ranks third for economic clout. It has a solid industrial background and takes the lead in foreign direct investments as a major port city with a rising service industry. In addition, Tianjin developed the well-known Binhai High-tech Industrial Development Zone, consisting of six separate technology parks, against a backdrop of the new nationwide urbanisation, giving it the third largest technology market among the 20 cities surveyed.
1
2
3
4
5
6
6
8
9
10
11
12
13
14
15
Number of well-known enterprises
Financial professionals per 10,000 people
ScoreNominal growth of gross regional product
Productivity Size of the technology marketForeign direct investments
Shenzhen
15
15
18
19
20
112
100
90
89
82
76
76
75
71
59
58
50
49
48
46
46
46
40
36
28
Guangzhou
Wuhan
Tianjin
Hangzhou
Nanjing
Xi'an
Chengdu
Dalian
Shenyang
Urumqi
Chongqing
Changchun
Harbin
Qingdao
Lanzhou
Xiamen
Zhengzhou
Fuzhou
Nanning
20
18
19
14
17
17
11
15
10
5
6
12
9
9
3
2
14
5
9
1
19
12
20
11
2
14
16
6
18
15
17
4
10
7
1
13
8
9
3
5
19
16
14
20
11
10
8
16
17
12
2
14
6
5
18
1
9
7
5
3
20
14
12
18
17
16
19
15
9
13
8
10
4
11
7
5
3
2
7
1
19
20
16
16
19
14
9
9
13
11
19
1
3
9
12
6
10
5
4
2
15
20
1
11
10
18
13
14
4
3
6
9
17
7
5
19
2
12
8
16
Apart from Guangzhou, the other two cities included in the “One Belt and One Road” strategy, Xi’an and Urumqi, have both shone in this aspect. Noted for its supply of high quality technical professionals, Xi’an ranks second in terms of size of the technology market. It owes its successful development of the local technology market to the high-tech park established using state subsidies.
Located at the heart of the Eurasian continent, Urumqi is Western China’s gateway to the rest of the Eurasian continent. An important trading market, Urumqi has an industry structure

PwC 27
1
2
3
4
5
6
6
8
9
10
11
12
13
14
15
Number of well-known enterprises
Financial professionals per 10,000 people
ScoreNominal growth of gross regional product
Productivity Size of the technology marketForeign direct investments
Shenzhen
15
15
18
19
20
112
100
90
89
82
76
76
75
71
59
58
50
49
48
46
46
46
40
36
28
Guangzhou
Wuhan
Tianjin
Hangzhou
Nanjing
Xi'an
Chengdu
Dalian
Shenyang
Urumqi
Chongqing
Changchun
Harbin
Qingdao
Lanzhou
Xiamen
Zhengzhou
Fuzhou
Nanning
20
18
19
14
17
17
11
15
10
5
6
12
9
9
3
2
14
5
9
1
19
12
20
11
2
14
16
6
18
15
17
4
10
7
1
13
8
9
3
5
19
16
14
20
11
10
8
16
17
12
2
14
6
5
18
1
9
7
5
3
20
14
12
18
17
16
19
15
9
13
8
10
4
11
7
5
3
2
7
1
19
20
16
16
19
14
9
9
13
11
19
1
3
9
12
6
10
5
4
2
15
20
1
11
10
18
13
14
4
3
6
9
17
7
5
19
2
12
8
16
and high productivity similar to that of Guangzhou, as well as impressive financial business development. In 2009, Xinjiang became the first region to receive approval to set up China’s pilot programme of direct cross-border RMB investment settlement. With the introduction of a “financial trade zone” and a series of other relevant policies by the State Council in 2011, Urumqi became one of the new financial centres in Western China and Central, West and South Asia, benefiting from its location at the heart of the Silk Road Economic Belt.
Nanning is a central regional city situated along China’s north coast, an important gateway to ASEAN countries and the permanent venue for the China-Asean Exposition (CAEXPO). Nanning plans to become a regional aviation and high-speed rail hub for ASEAN countries. At the moment, Nanning’s economic clout is weaker than that of other cities, which presents the potential, opportunity and room for the city to grow. Taking advantage of its late development status, the city is currently at a development stage where many overlapping opportunities exist, which is why we are optimistic about Nanning’s future economic development prospects.
Tianjin Photo by Alex Wang
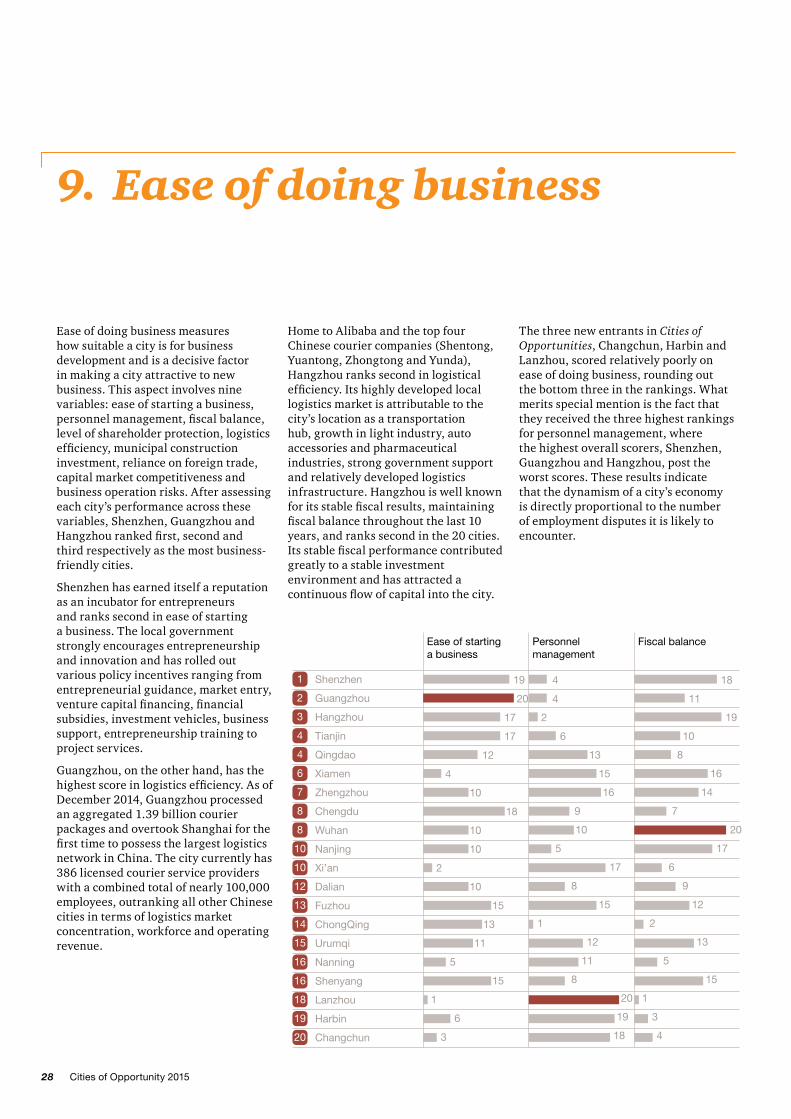
28 Cities of Opportunity 2015
9. Ease of doing business
Ease of doing business measures how suitable a city is for business development and is a decisive factor in making a city attractive to new business. This aspect involves nine variables: ease of starting a business, personnel management, fiscal balance, level of shareholder protection, logistics efficiency, municipal construction investment, reliance on foreign trade, capital market competitiveness and business operation risks. After assessing each city’s performance across these variables, Shenzhen, Guangzhou and Hangzhou ranked first, second and third respectively as the most business-friendly cities.
Shenzhen has earned itself a reputation as an incubator for entrepreneurs and ranks second in ease of starting a business. The local government strongly encourages entrepreneurship and innovation and has rolled out various policy incentives ranging from entrepreneurial guidance, market entry, venture capital financing, financial subsidies, investment vehicles, business support, entrepreneurship training to project services.
Guangzhou, on the other hand, has the highest score in logistics efficiency. As of December 2014, Guangzhou processed an aggregated 1.39 billion courier packages and overtook Shanghai for the first time to possess the largest logistics network in China. The city currently has 386 licensed courier service providers with a combined total of nearly 100,000 employees, outranking all other Chinese cities in terms of logistics market concentration, workforce and operating revenue.
Home to Alibaba and the top four Chinese courier companies (Shentong, Yuantong, Zhongtong and Yunda), Hangzhou ranks second in logistical efficiency. Its highly developed local logistics market is attributable to the city’s location as a transportation hub, growth in light industry, auto accessories and pharmaceutical industries, strong government support and relatively developed logistics infrastructure. Hangzhou is well known for its stable fiscal results, maintaining fiscal balance throughout the last 10 years, and ranks second in the 20 cities. Its stable fiscal performance contributed greatly to a stable investment environment and has attracted a continuous flow of capital into the city.
The three new entrants in Cities of Opportunities, Changchun, Harbin and Lanzhou, scored relatively poorly on ease of doing business, rounding out the bottom three in the rankings. What merits special mention is the fact that they received the three highest rankings for personnel management, where the highest overall scorers, Shenzhen, Guangzhou and Hangzhou, post the worst scores. These results indicate that the dynamism of a city’s economy is directly proportional to the number of employment disputes it is likely to encounter.
1
2
3
4
4
6
7
8
8
10
10
12
13
14
15
Ease of starting a business
Personnel management
Fiscal balance Level of shareholder protection
Logistics efficiency Municipal construction investment
Reliance on foreign trade
Capital market competitiveness
Business operation risks
Score
Shenzhen
16
16
18
19
20
Guangzhou
Hangzhou
Tianjin
Qingdao
Xiamen
Zhengzhou
Chengdu
Wuhan
Nanjing
Xi’an
Dalian
Fuzhou
ChongQing
Urumqi
Nanning
Shenyang
Lanzhou
Harbin
Changchun
141
124
122
117
117
109
104
103
103
102
102
89
88
81
79
69
69
68
65
62
19
20
17
17
12
4
10
18
10
10
2
10
15
13
11
5
15
1
6
3
4
4
2
6
13
15
16
9
10
5
17
8
15
1
12
11
8
20
19
18
18
11
19
10
8
16
14
7
20
17
6
9
12
2
13
5
15
1
3
4
18
13
17
8
20
15
19
1
4
6
14
12
9
7
5
10
2
11
16
3
16
20
19
6
13
19
10
9
15
17
13
9
11
4
14
7
5
3
1
2
14 20 20 12
11 14 19 12
15 15 17 1
20 16 18 16
16 18 10 7
8 19 9 4
3 12 7 13
17 10 16 16
19 5 12 8
18 13 14 2
14 7 11 18
5 17 13 6
3 11 8 4
10 9 15 20
1 6 3 14
8 2 4 17
10 3 5 6
8 4 1 19
4 1 6 9
12 8 2 10

PwC 29
1
2
3
4
4
6
7
8
8
10
10
12
13
14
15
Ease of starting a business
Personnel management
Fiscal balance Level of shareholder protection
Logistics efficiency Municipal construction investment
Reliance on foreign trade
Capital market competitiveness
Business operation risks
Score
Shenzhen
16
16
18
19
20
Guangzhou
Hangzhou
Tianjin
Qingdao
Xiamen
Zhengzhou
Chengdu
Wuhan
Nanjing
Xi’an
Dalian
Fuzhou
ChongQing
Urumqi
Nanning
Shenyang
Lanzhou
Harbin
Changchun
141
124
122
117
117
109
104
103
103
102
102
89
88
81
79
69
69
68
65
62
19
20
17
17
12
4
10
18
10
10
2
10
15
13
11
5
15
1
6
3
4
4
2
6
13
15
16
9
10
5
17
8
15
1
12
11
8
20
19
18
18
11
19
10
8
16
14
7
20
17
6
9
12
2
13
5
15
1
3
4
18
13
17
8
20
15
19
1
4
6
14
12
9
7
5
10
2
11
16
3
16
20
19
6
13
19
10
9
15
17
13
9
11
4
14
7
5
3
1
2
14 20 20 12
11 14 19 12
15 15 17 1
20 16 18 16
16 18 10 7
8 19 9 4
3 12 7 13
17 10 16 16
19 5 12 8
18 13 14 2
14 7 11 18
5 17 13 6
3 11 8 4
10 9 15 20
1 6 3 14
8 2 4 17
10 3 5 6
8 4 1 19
4 1 6 9
12 8 2 10

30 Cities of Opportunity 2015
10. Cost
We examined the cost of people’s clothing, food, housing, transportation and goods in the cities and ranked the cities by employing six variables: public transport, commercial land cost, rental cost, consumer prices, iPhone index and Internet service cost.
As shown in the results, Shenyang outranked Urumqi by one point to take first place. Cities ranked in the third to 16th places show narrow point differences. Xiamen, Hangzhou, Guangzhou and Shenzhen received the lowest rankings, indicating a cost of living significantly higher than the other cities.
Neither Shenyang nor Urumqi scored the highest points in any individual variable, but they received the highest rankings due to balanced overall scores. Specifically, Shenyang ranked second in rental cost and fourth in cost of public transport, commercial land cost and consumer prices. Out of the 20 cities surveyed, Urumqi scored the second highest points overall. In third place is Nanjing, whose consumer prices and Internet service cost ranked highest among all 20 cities. Chongqing outranked all other cities in both rental cost and commercial land cost and scored sixth overall.
It is worth noting that cities with above- average results in this aspect (such as Wuhan and Zhengzhou) also scored similar above-average points for ease of doing business. Specifically, Wuhan recieved the highest score in public transport cost, which means it has the lowest public transport cost among the 20 cities.
Results of the cost-effectiveness dimension this year show a similar trend to last year’s rankings; in other words, the cost effectiveness of a city tends to be conversely correlated with its ease of doing business and economic clout. The lowest-scoring cities for cost effectiveness, Shenzhen, Guangzhou and Hangzhou, received the highest rankings on ease of doing business, and Shenzhen and Guangzhou are ranked first and second respectively for economic clout. Needless to say, economically developed cities with a higher level of business dynamism provide residents with more job opportunities and a broader platform for personal development, and thereby broadening their horizons and
increasing their knowledge. As a city’s human resource improves in quality, enormous organic consumption demand occurs, putting the effectiveness of local resources and supplies to the test. The interplay of these dynamics also dictates changes in local living cost. What is the optimal way to increase a city’s economic clout, and create a healthy business environment while maintaining lower cost of living? This is the challenge facing all city administrators.
Dalian is one of China’s first coastal open cities, Northeast China’s window to foreign investment, the country’s largest port city, a leader in software and services outsourcing and the location of China’s biggest agricultural
Cost of public transport Commercial land cost ScoreInternet service costiPhone indexConsumer pricesRental cost
1
2
3
4
5
6
7
8
9
10
10
10
10
14
15
17
18
19
20
Shenyang
Urumqi
Nanjing
Changchun
Qingdao
Chongqing
Wuhan
Zhengzhou
Dalian
Harbin
Nanning
Tianjin
Fuzhou
Xi'an
Lanzhou
Xiamen
Hangzhou
Guangzhou
Shenzhen
87
86
84
81
79
75
70
67
66
64
64
64
64
63
57
45
39
33
32
17
14
12
16
19
7
20
14
5
12
6
9
9
18
10
15
3
1
3
17
15
13
18
5
20
15
6
19
12
16
11
2
9
10
1
7
4
3
19
9
2
18
13
20
5
15
7
11
17
8
12
10
14
1
4
6
3
17
19
20
12
11
19
9
13
17
14
3
11
17
8
8
5
4
1
2
8 9
13 16
17 20
7 10
12 19
6 3
10 11
5416 Chengdu 4 9 16 6 5 14
1 18
14 4
2 13
4 18
18 7
9 15
11 7
3 12
15 8
16 5
19 2
20 1

PwC 31
futures exchange. Hindered by the overall economic development of Northeast China’s old industrial region, Dalian’s performance for all ten variables has been middle of the road, ranking between seventh and 12th for each of the variables. Dalian ranked the 11th overall, beating the other northeastern cities of Shenyang, Changchun and Harbin.
Cost of public transport Commercial land cost ScoreInternet service costiPhone indexConsumer pricesRental cost
1
2
3
4
5
6
7
8
9
10
10
10
10
14
15
17
18
19
20
Shenyang
Urumqi
Nanjing
Changchun
Qingdao
Chongqing
Wuhan
Zhengzhou
Dalian
Harbin
Nanning
Tianjin
Fuzhou
Xi'an
Lanzhou
Xiamen
Hangzhou
Guangzhou
Shenzhen
87
86
84
81
79
75
70
67
66
64
64
64
64
63
57
45
39
33
32
17
14
12
16
19
7
20
14
5
12
6
9
9
18
10
15
3
1
3
17
15
13
18
5
20
15
6
19
12
16
11
2
9
10
1
7
4
3
19
9
2
18
13
20
5
15
7
11
17
8
12
10
14
1
4
6
3
17
19
20
12
11
19
9
13
17
14
3
11
17
8
8
5
4
1
2
8 9
13 16
17 20
7 10
12 19
6 3
10 11
5416 Chengdu 4 9 16 6 5 14
1 18
14 4
2 13
4 18
18 7
9 15
11 7
3 12
15 8
16 5
19 2
20 1
Tianjin Photo by Alex Zhang

32 Cities of Opportunity 2015
Variables
1. Intellectual capital and innovationPublic librariesLibraries are top-level social education institutions. Unlike schools, they are open to all members of the general public and aim to uplift the lives of everyone. For this reason, local libraries per 100,000 people (number of libraries / permanent residents × 100,000) and public library books per 100 people are used to measure the social resources offered by the sample cities and how convenient it is for residents to access those resources. The data are from statistical yearbooks and Statistical Communique of the People's Republic China on the National Economic and Social Development and the China City Statistical Yearbook.
Standard of basic educationThrough basic education, members of a society are instructed in elementary knowledge, methods and attitudes, with the aim of improving the basic qualities of individuals. The level of basic education in the cities is measured by the ratio of people with a high-school (including secondary vocational school) education or above to the entire population aged 15-64. Data are sourced from the 6th National Census Bulletins of the cities.
Proportion of the population receiving higher education Workers’ knowledge base and learning capacity are measured by considering the number of full-time college and university students per million permanent residents in the cities. The data are from the National Bureau of Statistics.
Research quality of major universitiesThis variable examines the cities’ technical reserves for innovation and research potential. Metrics for the variable are the number of key state-level laboratories belonging to the major universities and their rankings in scientific research. As an integral part of national technological innovation systems, key state-level labs are important bases of basic research and applications thereof for the country. Their establishment under the auspices of key universities reflects the position of those universities as absolute leaders in the relevant research domains. Additionally, research rankings of the major universities are an indicator of their overall research quality. Relevant data are from the Number of State Key Laboratories and the Wu Shulian’s Ranking of 734 Chinese Universities in 2014.
City innovation indexThe aim of this score is to examine the innovative strengths of cities. It measures their overall innovation capabilities using factors including innovation infrastructure and support capacity, technology industrialisation and brand innovation capabilities. The rankings used are sourced from the Cities Innovation Blue Book: China’s Cities Report on Innovation (2014).
Entrepreneurial environmentThe cities are assessed and ranked by examining key elements of the local innovation and entrepreneurial environment, i.e. government support, industry development, talent environment, research and development environment, financial support, intermediary services, market environment and reputation for innovation. The data sources are the China Urban Innovation and Entrepreneurship Environmental Assessment Report 2014 of Tsinghua
University TusPark Research Institute for Innovation. As municipalities directly under the central government are excluded from the report, scores for Tianjin and Chongqing were calculated and ranked against other cities based on the medians of selected cities provided in the report.
Innovation applicationsThis variable examines the socioeconomic benefits derived from innovation as a basic driving force behind urban development, and the contribution of innovative industries to the cities’ economic growth. The Growth Enterprise Market (GEM) is an important capital platform to support innovation and cultivate small/medium-scale high-tech enterprises. Therefore, we assessed the local level of innovation applications by measuring the number and revenues of GEM-listed companies in the cities. The data are from the Shenzhen Stock Exchange.
PwC 33
2. Important regional citiesStar graded hotelsThe number and average occupancy rates of local hotels rated three stars or above are selected as indicators of the demand for these hotels and market saturation in the cities. The two indicators reflect the hospitality, service standards and passenger capacity of the cities. Relevant data are from the National Statistics Bureau’s quarterly Statistical Bulletins of Star Graded Hotels in China for 2013.
International touristsInternational tourists refer to foreigners, overseas Chinese and compatriots from Hong Kong, Macao and Taiwan visiting China as tourists, for official visits, to travel, visit family and friends, recuperate, field trips, attend meetings, or for economic, scientific and technological, cultural, educational, religious, or other purposes. The appeal of the cities to international tourists is assessed by examining the number of inbound visitors staying overnight or longer in China and the average length of stay per visit. Data are from China Tourism Statistics Yearbook.
Inbound and outbound flightsThis variable examines the demand for passenger and cargo air transport in the cities, taking into account the number of inbound and outbound flights to and from the main airports of the cities, including international and domestic civil flights, cargo flights and non-profit flights (excluding military aircraft). Aircraft movements refer to the total number of take-offs (aircraft departures) and landings (aircraft arrivals) in an airport within the reporting period. Each take-off or landing is counted separately as one aircraft movement. Data are from the 2013 National Airport Production Statistical Bulletin of the Civil Aviation Administration of China.
Total passenger flowsTotal passenger traffic refers to the number of passengers actually transported through various means of transport within a certain period of time. It reflects the size of the local passenger transportation market and passenger transportation capacity of a city. Total passenger traffic includes rail, civil aviation, road and waterway passenger traffic. Data are from the China City Statistical Yearbook.
Convention/exhibition economic development The convention and exhibition industry is an important component of the modern services sector. With the rapid development of the Chinese economy, it has become a new socioeconomic growth driver, playing an active role in the transformation of China’s economic development, industry structure optimisation and economic upgrading. This indicator reflects the developmental status of the convention/exhibition industry in the cities by examining the number of professional exhibition venues and their total indoor floor area, along with the annual number of exhibitions held in the cities and their exhibition floor area. Data are from Chinese Convention and Exhibition Industry Development Report 2014.
Airport accessibility This variable reflects how convenient it is to travel from the airport to the city centre, calculated based on the distance between the cities’ airports and their downtown area, types of transportation available, the speed and cost of different means of transport and the degree of convenience associated with them. Relevant data are provided by Air China Limited.
3. Technology readinessInternet penetrationInternet penetration refers to the number of Internet users in a city relative to its permanent residents. It reflects the share of frequent Internet users in a city’s total population and the overall local IT development. Data are from the China City Statistical Yearbook.
Broadband speedAs the medium for information and knowledge dissemination, broadband has become a key infrastructure for coordinated and sustained socioeconomic development in urban areas. The quality and development of broadband networks in the cities are assessed by examining local connection speeds in downloading, surfing and video streaming activities. Data are from the Report on Broadband Speed in China. Since information disclosed in the report is limited only to provincial-level administrative areas (e.g. autonomous regions and municipalities), cities at a lower level are assessed based on data released for the respective provincial administrative areas.
Digital economyThe digital economy is a brand new social, political and economic system where information and business activities are conducted via digital technologies. As a core component of the digital economy, e-commerce development reflects the status of a city’s digital economy, and by extension, the progress of industry restructuring. This indicator considers the density of online retailers and consumers, average store turnover and average online sales per consumer. Relevant data are from China Urban E-commerce Development Index Report 2013.
34 Cities of Opportunity 2015
Software development and multimedia designThe software services industry, characterized by frequent technical upgrades, high value-added products, broad applications, exceptional penetrability and low energy consumption, plays an important supporting and guiding role in urban development. There is a correlation between the size of the software services market and the maturity of emerging high value-added, low-carbon industries, and the effectiveness of industry restructuring. Software industry revenues of the cities are sourced from the Verified Final Statistics of the Software Industry in Central Cities in 2013 released by the Ministry of Industry and Information Technology. In the case of cities for which software revenues are not disclosed, data for higher-level administrative areas are used to calculate the scores (weighted by software revenue as a percentage of total GDP).
4. Healthcare, safety and securityHealthcare resourcesThis variable examines the resources of healthcare institutions (including hospitals, clinics and others) and the supply of healthcare services available in the cities. It involves two indicators: the number of beds in medical institutions available per 10,000 people and the number of medical practitioners and assistant medical practitioners per 10,000 people. Data are from the China City Statistical Yearbook and the National Bureau of Statistics.
Medical system service standardsThis variable examines the service standards of the local medical systems in the cities along two dimensions: (i) basic healthcare service standards are reflected in how satisfied the public is with healthcare services – relevant data come from the Public Service Blue Book: Assessment of Basic Public Services in Chinese Cities; (ii) advanced healthcare services in the cities are assessed based on the number of third-level A-grade hospitals (the top grade of hospitals in China according to the Hospital Classification Administrative Measures), which is indicative of advanced healthcare institutional resources and the supply of healthcare services available in the cities. Relevant data are provided by the National Health and the Family Planning Commission.
Elderly care servicesThe development of elderly care service systems in the cities is assessed by examining the number of beds in elderly welfare institutions available per 10,000 people aged 60 or above, and the coverage rate of basic urban pension insurance. Data are from the China City Statistical Yearbook, local statistics bureaus and civil affairs bureaus.
Public safety indexThis indicator reflects the standards of public safety index in the cities by examining the frequency of accidents and residents’ satisfaction with public safety index. The indicator comprises road traffic mortality per 10,000 vehicles, fire accidents per 10,000 people and urban residents’ satisfaction with public safety index in terms of incidents affecting personal and property safety. The data are sourced from the local statistics bureaus and public security bureaus, China Fire Services Yearbook and the Public Services Blue Book: Assessment of Basic Public Services in Chinese Cities published by the Chinese Academy of Social Sciences.
Government servicesThis variable comprises the government information transparency indicator and city administrative standards indicator, which reflects the transparency of government services and market regulation operations of the cities. The amount and degree of transparency of government information disclosed are analyzed in accordance with the government information access indicator specified in the Chinese Government Website Performance Evaluation Results, and the cities’ administration quality is assessed with reference to relevant findings in the Preliminary Appraisal of Chinese City Administration Standards report.

PwC 35
5. Transportation and urban planningPublic transport systemsThis variable examines the cities’ public transport network passenger capacity and operating efficiency based on the number of buses available per 10,000 people and the turnover rate of public transport passengers. Data are from the China City Statistical Yearbook.
Rail transit coverageAs a critical component of urban public transport and passenger services, rail transit can effectively enhance the travel efficiency of urban residents. In addition, given its far-reaching implications for urban planning and development models, the current development status of a rail transport network reflects the local government’s stance on urban planning and how forward-looking its vision is. The variable includes three indicators, namely, the total operating mileage of rail transit, new rail mileage constructed in the year, and rail transit operating mileage per 10,000 people. Data are from the Construction and Operations of Urban Rail Transit in China – 2013 issued by the China Association of Metros.
Public park spaceThis variable assesses the cities’ ecosystem restoration efforts and their fulfillment of residents’ leisure needs by examining per capita urban park space. Urban parks are defined as public municipal facilities that are open to the general public primarily for recreational purposes and capable of providing certain leisure services. Data are from the Statistical Yearbook of Urban Construction in China.
Licensed taxisTaxis can operate on flexible routes according to customers’ needs and are superior to other means of public urban transport in terms of speed and comfort of travel. Therefore, a city’s supply of officially licensed taxis reflects its economic development and the living standards of its local residents. This variable sheds light on the taxi service supply in the cities through the number of licensed taxis available per 10,000 people. The data is sourced from the China City Statistical Yearbook.
Major construction activitiesThis variable assesses the cities’ capital investment in urban infrastructure construction, renovation and routine maintenance by examining their per capita fiscal expenditure for urban construction maintenance. The length of urban railway under construction is taken as the basis for assessing the construction status of major municipal projects. Data are sourced from the Statistical Yearbook of Urban Construction in China.
Housing availibility for residents This variable assesses the cities’ capital investment in improving their residents’ housing conditions and related market regulation efforts by examining per capita residential property development investment and the housing price/income ratio. Per capita residential property development investment indicates the level of investment in residential property construction by the cities, while the housing price/income ratio, to some extent, reflects the financial pressures faced by residents when they improve their living conditions. Data sources are the China City Statistical Yearbook, the National Bureau of Statistics and statistical yearbooks and bulletins of the respective cities.
6. Sustainability and the natural environmentClimateThis variable quantifies the comfort levels of the cities’ local climates by calculating the average deviation between the annual average local temperature and the optimum temperature (22 degrees Celsius). The smaller the deviation, the more suitable for human habitation the city is, and the more conducive the local environment is to the productive activities of individual workers and enterprises. Average temperatures of the cities are from the China Statistical Yearbook and the statistical yearbooks of the respective cities.
Utilisation of resourcesThe traditional economic model is a linear “resource – product – waste” process, in which as more wealth is created, more resources are consumed and waste generated. This model leads to a significant adverse impact on the environment. A circular economy, on the other hand, operates on the basis of resource recovery and recycling, in keeping with sustainable development concepts. It seeks to harmonize the economic system with the material recycling process of the natural ecosystem.
This variable measures resource efficiency in the cities based on indicators, such as the efficiency of industrial solid waste utilisation, centralized sewage treatment rate, domestic waste decontamination rate, power consumption per unit of GDP and water consumption per unit of GDP. The findings reflect the differences between the cities in terms of circular economic development. Data sources are the China City Statistical Yearbook, Statistical Yearbook of Urban

36 Cities of Opportunity 2015
Construction in China, and statistical yearbooks and bulletins published by statistics bureaus of the respective cities.
Green areaUrban greenery helps protect and restore the environment and build an eco-friendly, sustainable development model. This variable measures the green area in the cities based on indicators, such as per capita green area, green coverage in built-up urban areas and the number of scenic spots rated 4A and 5A. Relevant data are from the Statistical Yearbook of Urban Construction in China and the China National Tourism Administration and the local tourism bureaus of the respective cities.
Labour supplyThis variable measures labour supply conditions in the cities based on the ratio of the population aged between 15 and 64 to the total urban population, and the ratio of the resident population to the registered population. The higher these ratios, the stronger the city’s expected ability to supply labour. Data are from statistical yearbooks and bulletins released by the National Bureau of Statistics and statistics bureaus of the respective cities and the 6th National Census.
Risk of natural disastersThis variable measures the direct economic losses caused by various natural disasters in the cities and their surrounding areas. Direct losses refer to the total economic losses accumulated throughout the course of a disaster, from the primary disaster and immediate, subsequent secondary disasters. Data are from the China Civil Affairs Statistical Yearbook.
7. Culture and lifestyle Cultural dynamismCultural dynamism is an on-going process that drives the transmission of urban civilisation and sets the stage for innovation. Cultural infrastructure in the cities is assessed based on the number of theatres and cinemas per 10,000 people for ease of quantitative comparison, and the size of the local cultural industries is analyzed based on the number of cultural, sports and entertainment professionals per 10,000 people. Relevant data come from the China City Statistical Yearbook and the National Bureau of Statistics.
Traffic congestionThis variable is analyzed based on the list of the most congested cities as ranked by car navigation system manufacturers, TomTom and AutoNavi, in the 2013 Chinese Traffic Congestion Survey Data. Seven sampled cities are not included in the list as their traffic conditions are considered to be less congested than that of the 12 included cities; we used a secondary indicator of traffic congestion in these seven cities based on the number of vehicles on road per square meter. The data are from the Statistical Yearbook of Urban Construction in China.
Air qualityThis variable describes the overall air quality in the cities based on the annual average comprehensive air quality index, which measures six pollutants, namely, PM2.5 (particulate matter with diameter 2.5 micrometers or less), PM10, SO2, NO2, O3 and CO, in accordance with the latest Ambient Air Quality Standards (GB3095-2012). The higher the index, the heavier the pollution. First, indices for each individual pollutant are calculated, and the comprehensive ambient air quality index is obtained by adding the
individual indices. The annual average air quality index should be calculated based on the annual daytime average indices. However, to simplify the process, we used the monthly average instead, which should have led to very similar results. Relevant data are taken from the monthly air quality reports for 74 cities released by China National Environmental Monitoring Centre.
Standard of livingAnalyses of local living standards focus on two dimensions, i.e. the scale and structure of consumption, where scale of consumption is measured by per capita retail sales1—the higher the value, the stronger the spending power; and consumption structure is measured by the Engel coefficient2—the lower the coefficient, the higher the study object’s disposable income and therefore the higher the standard of living.
In addition, per capita electricity consumption3 of urban and rural residents has been introduced as another indicator of local residents’ living standard. Generally speaking, high household electricity consumption is an indication of a larger number of household appliances used in the home. The larger the number and the greater the variety of household electrical appliances used indicate a greater demand for convenience and comfort, and a higher price affordability threshold.

PwC 37
8. Economic cloutNumber of well-known enterprisesThe more household-name companies investing in a city, the more competitive the city must be within the regional economy, and the more influence it has over the regional market. This variable uses the number of top-500 Chinese company headquarters registered4 and Shanghai and Shenzhen A-share listed companies5 in the cities to make an overall assessment.
Financial professionals per 10,000 peopleIn the urbanisation process, infrastructure construction, expansion of public services, promotion of regional economic development and rural work force mobilisation all require considerable financial support. Hence, urbanisation is inseparable from the development of financial services. This variable reflects the number of financial professionals working in the cities. Relevant data are from the China City Statistical Yearbook.
Foreign direct investmentsDirect foreign investment refers to investments in China made by foreign investors by setting up business entities within the country. This variable reflects the development of the externally oriented economy of cities by examining the number of newly signed foreign investment agreements or projects and the yearly amount of foreign investment actually received. The more projects signed and the larger amount of foreign investment received, the more open and externally oriented the local economy is. Data are from the China City Statistical Yearbook.
1-2 Data are from statistical yearbooks and bulletins of the National Bureau of Statistics and statistics bureaus of the respective cities.
3. Data are from the Statistical Yearbook of Urban Construction in China.
4 Data are from "China Top 500" released on the Chinese website of Fortune.
5 Data are from the Shanghai and Shenzhen Stock Exchanges.
Size of the technology marketThe size of the technology market in a city is measured based on its volume of technology import and export transactions. The larger the size of the local technology market, the stronger the city’s capabilities in terms of applying high-tech research results and cultivating high-tech industries. Data are from the National Technology Market Statistics Annual Report released by the Ministry of Science and Technology. For cities whose data are not disclosed in this report, calculations are based on data from the administrative regions at the provincial level (weighted by technology import and export transaction volume as a percentage of total GDP).
Productivity Per capita regional GDP is correlated with the level of productivity in a city. Data are from statistical yearbooks of the National Bureau of Statistics and statistics bureaus in the respective cities.
Nominal growth of gross regional product Nominal growth of gross regional product (GRP) is the result of comparing the ending GRP calculated at current prices and that in the base period. It is a dynamic indicator of the level of activity within a particular economy. Higher nominal growth rates indicate faster economic growth, meaning more rapid improvement in people’s living standards. Data are from the National Bureau of Statistics.

38 Cities of Opportunity 2015
9. Ease of doing businessEase of starting a businessThis variable assesses the differences between the cities in terms of how easy it is to start a new enterprise by examining government support6 and the growth of the local non-state-owned economy7. The more support the local government gives to start-ups and the faster the non-state-owned economy develops, the less restrictions placed on the cities’ entrepreneurial environments and the more accommodating the local economic and political climate is towards the survival of entrepreneurial enterprises.
Personnel managementThis variable is based on the number of labour disputes received per 10,000 employees—the higher the ratio, the higher the number of irreconcilable disputes between employees and employers. This means that general labour disputes are more likely to be resolved through arbitration or litigation, which in turn may result in increases in relevant expenses for business owners. Data are from China Labour Statistical Yearbook. Since the data disclosed in the yearbook are limited to provincial-level administrative areas (including autonomous regions and municipalities), the cities are assessed according to the provincial-level data provided.
Fiscal balance The degree of fiscal balance is measured through the ratio of general budgetary revenue to general budgetary expenditure to reflect the fiscal strength of a city in terms of supporting economic growth. If the result is larger than one, it means revenues are greater than expenditures, and fiscal balance is therefore achieved; on the other hand, if expenditures exceed revenues, this means funds and resources cannot cover cost overrun, which may lead to a negative effect on economic development. Data are from the National Bureau of Statistics.
Level of shareholder protectionThis variable is measured based on the share of seats held by independent directors on the boards of locally registered listed companies. Independent directors of listed companies are obliged to prevent internal manipulation by the controlling shareholders or the management and protect the interests of minority shareholders. The more seats independent directors hold in a listed company, the more effective they will be in the company. Data are from the Shanghai and Shenzhen Stock Exchanges.
Logistics efficiencyLogistics is a product of the highly developed division of labour and specialisation in modern economies. The development of logistics services boosts growth in tertiary industries, further concentrating flows of commerce, capital, information and technology and bringing about synergistic development among a wide range of sectors, such as transportation, trade, finance, information technology and tourism. The efficiency of logistics services reflects a city’s basic conditions and overall operational standards in terms of transportation, information and communication, and warehouse facilities.
As an indicator of the development status of logistics services in the cities, this variable examines logistics efficiency in commodity circulation based on total freight per capita8, courier business volume9 and courier service income10.
Municipal construction investmentThe cities’ overall investment in municipal construction is assessed based on water pipe density, road area per capita, the density of drain pipes in built-up urban areas, and the amount of completed fixed assets in public facilities. It reflects the scale and progress of relevant construction projects. Data are from the Statistical Yearbook of Urban Construction in China and the China City Statistical Yearbook.
Reliance on foreign tradeA city’s reliance on foreign trade is indicated as the ratio of the import and export volume to GDP. It reflects the impact of foreign trade activities on local economic growth. From the perspective of demand as the ultimate economic growth driver, this indicator is also illustrative of the extent to which the city’s economic development is driven by external factors. Data are from the National Bureau of Statistics.
Capital market competitivenessThe cities’ financial competitiveness is assessed based on the performance of the local financial services industry, the strength of financial institutions and financial market size. Data are from China’s Financial Centre Index (CDI CFCI).
6 Data are from China Urban Innovation and Entrepreneurship Environmental Assessment Report 2014.
7 Data are from the Shanghai and Shenzhen Stock Exchanges.
8 Data sourced from the China City Statistical Yearbook.
9-10 Data are from Postal Service Operations in 2013 by China Post.

PwC 39
Business operation risksPotential risks associated with business operations in the cities are measured based on the non-performing loan ratios of commercial banks. The higher the ratio, the higher the risks faced by banks in recovering their loans; the lower the ratio, the lower the loan recovery risks. Data are from the Annual Report of China Banking Regulatory Commission 2013. Since information disclosed in the report is limited to provincial-level administrative areas (e.g., autonomous regions and municipalities), cities at a lower level are assessed based on data released for the provincial administrative areas.
10. CostCost of public transportThis variable examines the cost of buses and taxis in the cities. The cost of bus transportation is calculated based on the local pay-per-use bus fare for IC-card users, and the cost of taxis is calculated based on the average taxi fare per kilometer, factoring in the base price (and the mileage covered) and the incremental fare per additional kilometer (exceeding the initial mileage coverage). Data are from China Price Information Network (chinaprice.gov.cn).
Commercial land costCommercial land cost in the cities are compared by examining the office lease prices and commercial property rentals. Data are from the China Real Estate Information website (realestate.cei.gov.cn).
Rental costData are from the property rentals listed on the China Real Estate Information website. The arithmetic mean of rentals of “Grade 1 locations, Grade 2 locations and Grade 3 locations” published on the website is taken as the basis for comparison.
Hangzhou Photo by Brooke Le

40 Cities of Opportunity 2015
Consumer pricesA food price index and a domestic services price index are established to reflect consumer prices in the cities.
The food price index is calculated using the prices of sample sub-segment products, including rice, soybean oil, pork (arithmetic mean of pig hindquarters and marbled pork prices), eggs, apples, Chinese cabbage and rape. Data are from China Prices Statistical Yearbook 2014.
The domestic services price index mainly covers the costs of four primary types of utilities, i.e. housing property management fees, residential electricity charges, piped gas fees, and the cost of the basic monthly cable (digital) TV package. Data are from China Price Information Network (chinaprice.gov.cn).
iPhone indexThe ratio of the official price of an iPhone 6 (16GB) to the average worker’s salary in each city reveals the hours of labour required to buy an iPhone 6. Data are from the National Bureau of Statistics and Apple’s official website.
Internet service costThe cost of Internet service is measured based on the prices of 12-month 4MB Internet service packages offered by China Telecom in the cities. Data are from the official website of China Telecom.

PwC 41
Appendix Cities of Opportunity 6
This appendix is extracted from the sister publication of Chinese Cities of Opportunity, Cities of Opportunity 6 published by PwC global network in May 2014. PwC’s Cities of Opportunity 6 is part of a series that began in 2007. It provided observations of 30 major cities in the world through 59 variables categorized by 10 indicators. Those indicators have been organised into three families that reflect the fundamentals of a well-balanced city – economics, tools for a changing world and quality. The report aims to offer a global perspective and valuable reference to advance the development of cities worldwide.
According to Cities of Opportunity 6, London, the only city to finish first in three of the 10 indicators—economic clout, city gateway and technology readiness, a category it ties with Seoul—posts the highest score for the first time, with New York coming in second. Despite not having a top rank in any indicator, New York continues to show strong consistency across most of the categories. Rounding out the top five cities are Singapore, Toronto and San Francisco in third, fourth and fifth places respectively. In this report, three Chinese cities are included - Beijing, Shanghai and Hong Kong. Please see below the highlights of Beijing and Shanghai respectively.
An economic giant and global gateway/#1 in GDP growthAfter a stellar performance in economic clout in 2012, Beijing pushes ahead as well to #2 in the city gateway indicator, while also climbing into the top 10 in 16 variables and to #1 in rate of GDP growth.
#2 in economic clout and city gatewayBeijing finishes in the top 5 in 4 out of 5 variables in economic clout. And while the city gives up the top rank to historical powerhouse London, it does so by only a tiny margin. Moreover, it jumps 2 places in GDP growth to #1 and also:
• Ranks #2 in number of Global 500 headquarters (after Tokyo);• Finishes #4 in financial and business services employment; and• Ranks #5 in FDI, tying with Hong Kong.
China’s capital also rises from #3 to #2 as a city gateway, leading Asia (and most continents), thanks to a robust performance across the indicator. It ranks:
• #2 in hotel rooms;• #3 for its connections from airport to central business district• #4 in top 100 airports;• #6 both in passenger flows and international association meetings; and• #10 in international tourists.
Overall#17 Kuala Lumpur#18 Milan#19 Beijing#20 Shanghai#21 Moscow
Economic clout#1 London#2 Beijing#3 New York#4 Paris#5 Shanghai
City gateway#1 London#2 Beijing#3 Singapore#4 Hong Kong#4 Tokyo
Beijing

42 Cities of Opportunity 2015
Striving for sustainabilityBeijing’s drive for sustainability has been severely tested since 2012, and it ties Hong Kong for #21 overall. It drops 16 places to #24 in recycling (affected surely by the change in definitions this year) and continues to have extremely high levels of air pollution—ahead only of Mumbai at the bottom of the table, as in our previous report. However, the city still scores in the top 10 (#10) in public parks and—in another contribution to its overall sustainability—remains a leader (#4) in affordable public transit, ahead of any city in the US or Europe.
Challenges across a wide spectrum of key areasThere is much room for growth generally, as Beijing finishes within the bottom third of the rankings in 8 out of 10 indicators. In cost, uncompetitive tax rates and low purchasing power for its citizens contribute to the fall in the rankings from #17 to #30—making Beijing relatively the most expensive city overall. As shown below, it scores outside of the top 10 in every variable, including:
• #11 in cost of living;• #24 in total corporate tax rate;• #25 in the iPhone index;• #26 in purchasing power; and• #29 in cost of business occupancy.
Another area of concern is the difficulty of doing business in China’s capital, which, of course, minimizes—or even neutralizes—many of the competitive advantages of the city’s global economic clout. In particular, Beijing ranks:
• #21 for resolving insolvency;• #23 in shareholder protection; and• #26 in ease of starting a business.
Beijing also ranks in the bottom 10 in demographics and livability (#21) and health, safety and security (#23). It also finishes #28 in productivity. Perhaps a more livable city—which is also healthier, safer, and more secure—will result in a more productive one. As it ranks 1st in working age population, Beijing should capitalize on that singular demographic advantage to foster a more productive workforce, which, in turn, will further accelerate the city’s economic progress—and which, finally, might lead to an enhancement of its citizens’ quality of life.
Cost#26 Moscow#27 Shanghai#28 Sao Paulo#29 Rio de Janeiro#30 Beijing
Ease of doing business#19 Dubai#20 Milan#21 Beijing#22 Istanbul#22 Sao Paulo

PwC 43
City gateway
#18 Milan#19 Beijing#20 Shanghai#21 Moscow#22 Mexico City
Economic clout#3 New York#4 Paris#5 Shanghai#6 Singapore#7 San Francisco
#5 in economic clout/Major improvements in quality of lifeShanghai continues to rank #5 globally for economic clout, as in 2012, and ties New York for #9 as an urban gateway. It also moves up the table in 6 out of 10 indicators this year. Overall, the city ranks #20 worldwide.
Economic cloutShanghai maintains its top 5 ranking in economic clout, ahead of Singapore, confirming its global role as an urban economic force. Specifically, it ranks:
• #1 in FDI;• #2 in GDP growth, up 2 places from 2012 and just behind Beijing; and• #8 in Global 500 headquarters, a 3-place improvement to secure a top 10 position.
City gateway• Shanghai stays in the top 10 as a city gateway, tying with New York, and:• Maintains its #1 position in hotel rooms;• Ranks #7 in passenger flows;• Scores an 8th-place in the top 100 airports indicator;• Is increasingly popular with international tourists, finishing #9 in that variable;
and• Ranks #10 in the ease of airport connections to its central business district.
Shanghai
City gateway
#7 Paris#8 Dubai#9 Shanghai#9 New York#11 Kuala Lumpur

44 Cities of Opportunity 2015
Progress in several indicatorsChina’s largest city leaps an impressive 10 places overall in demographics and livability to rank #17. It rises 9 places to finish #18 in traffic congestion and maintains its #3 rank in working age population. Positive movement is discernible as well in quality of living and cultural vibrancy.
Shanghai also secures a mid-table position in health, safety and security, climbing 7 places to finish #18. Notably, the city now ranks in the top 10 for least crime, improving by 8 places since 2012.
Although there is still some clear potential in ease of doing business, the city has substantially improved its score this year. Moving up 5 places from the bottom of the table in 2012, it now holds the #25 spot.
Continuing challenges: Cost and, especially, sustainabilityShanghai finishes in the bottom 5 for cost, as well as for sustainability. Overall, costs have nosedived this year, plummeting 12 places, and the city now ranks #27. Results across the indicator illustrate the problems. Moreover, given the city’s economic clout, its performance in purchasing power is surprisingly low.
Shanghai’s #28 ranking, with minimal progress since 2012, also points to the clear challenges facing the city regarding its sustainability and natural environment. At the end of the day, providing a sustainable environment for its residents is critical to continuing to attract and retain forward-thinking businesses in the future.
Cost
#25 Mumbai#26 Moscow#27 Shanghai#28 Sao Paulo#29 Rio de Janeiro
Sustainability and the natural environment
#25 Mumbai#27 Kuala Lumpur#28 Shanghai#29 Jakarta#30 Dubai

PwC 45
Acknowledgements
Zheng XinliFormer Deputy Director of the Policy Research Office of the Communist Party of China Central Committee
Chairman of the China Committee for Development of Medium and Small Cities
Executive President of China Urbanisation Development Council
Zhang HongyiFormer Vice Mayor of Shenzhen
Executive Director of the China Development Institute
Yao JingyuanFormer Chief Economist of the National Bureau of Statistics
Special Researcher of the Counsellors’ Office of the State Council
Vice-Chairman of the National Statistical Society of China
Gu YaomingFormer Secretary-General of the Chinese Olympic Committee
Former Executive Member of the Beijing Olympic Organizing Committee
Li XinhePresident of renrendai.com
Our observation on the cities would not have been possible without insights shared by the following individuals we interviewed. We are most grateful for and would like to acknowledge their contribution.
Eagles Catching the ChicksPart of the collection of the People's Government of Tongling Municipality. Winner of the Award of Excellence at China (Tongling) International City Sculpture Art Creation Camp
46 Cities of Opportunity 2015
Acknowledgements
PwC China Senior Advisor Xiaofeng Cai provided guidance on this report. The following individuals and groups in PwC and China Development Research Foundation contributed to the production of this report.
Advisory group
Jin FangDeputy Secretary-General China Development Research Foundation
Jiantuo YuDirector of Research Department I China Development Research Foundation
Frank LynPwC Mainland China and Hong Kong Markets Leader
David WuPwC China Government and Regulatory Affairs Leader PwC China Beijing Senior Partner
Elton HuangPwC China Shanghai Senior Partner
Jim ChenPwC China North Real Estate Industry Leader PwC China Assurance Partner
Jun JinPwC China Advisory Strategy Consulting Partner
Huchu XuStrategy& Partner, Managing Director, Greater China
Research teamGao Zou (PwC)
Della You (PwC)
Veronica Ni (PwC)
Carrie Zhang (PwC)
Petrel Tang (Strategy&)
Ruizhen Li (PwC)
Christina Soon (PwC)
Grace Lee (PwC)
Hao Chen (China Development Research Foundation)
Project managementJinjin Xu (China Development Research Foundation)
Cynara Tan (PwC)
Echo Chen (PwC)
Faye Ji (PwC)
Jenny Yu (PwC)
DesignStephen Chow (PwC)
Shawn Zhang (PwC)
Max Zhu (PwC)
Data supportJenny Guan (Faculty of Business Administration, University of Macau)
PwC 47
For further information
For further information on cooperation with China Development Research Foundation, please contact:
Cynara TanHead of Marketing and CommunicationsAsia Pacific+852 2289 [email protected]
Echo ChenAssociate Director, Marketing and CommunicationsBeijing+86 10 6533 [email protected]
For enquiries about the research methodology, please contact:
Gao ZouSenior Manager, Marketing and CommunicationsBeijing+86 10 6533 [email protected]
For media enquiries, please contact:
Christy LiangSenior Manager, Marketing and CommunicationsBeijing+86 10 6533 [email protected]
Jenny YuSenior Marketing Consultant, Marketing and CommunicationsBeijing+86 10 6533 [email protected]

www.pwccn.comThis content is for general information purposes only, and should not be used as a substitute for consultation with professional advisors.
© 2015 PwC. All rights reserved. PwC refers to the PwC network and/or one or more of its member firms, each of which is a separate legal entity. Please see www.pwc.com/structure for further details.