chinese exporters, exchange rate exposure, and the...
TRANSCRIPT
Chinese Exporters, Exchange Rate Exposure, and the Valueof the Renminbi�
Andrew B. Bernardy
Tuck School of Business at Dartmouth & NBER
February 2008
Abstract
This paper examines the currency exposure and exchange rate risk management at Chinesetextile and apparel exporters. Chinese exporting �rms have large net exposure to the US dollar.On average a 10 percent increase in the value of the renminbi against the dollar would reducenet revenues by 5.4 percent if the �rms left prices unchanged. This large exposure is drivenheavily by the choice of export pricing currency by the �rms. The regional distribution of salesis more balanced across the major export markets of the US, EU, and Japan. However many�rms are unaware of their indirect currency risk to currencies other than the dollar and most�rms undertake little or no activities to hedge their foreign currency exposure, direct or indirect.The large dollar exposure of Chinese exporters may help explain the reluctance of the People�sBank of China to allow the RMB to undergo a rapid appreciation against the dollar.Keywords: exchange rate exposure, export pricing, invoicing currency, hedging
JEL classi�cation: F23
�Special thanks to Peng Zhang for running the survey and to Emily Chen for excellent researchassistance. Thanks also to the National Science Foundation (SES-0241474) for research support. Resultsand conclusions expressed are those of the author and do not necessarily re�ect the views of the NBER.
y100 Tuck Hall, Hanover, NH 03755, USA, tel: (603) 646-0302, fax: (603) 646-0995, email: [email protected]
Chinese Exporters, Exchange Rate Exposure and the Value of the Renminbi 2
1. Introduction
Since the Chinese government abandoned the strict link of its currency to the U.S.dollar
in July 2005, there has been a great deal of uncertainty about the future course of the
currency and the potential e¤ects on the Chinese economy. Most analyses focus on
macroeconomic variables such as the current account, foreign currency reserves and �ows
of foreign direct investment. This paper pursues a di¤erent approach by examining the
role of exchange rates on Chinese �rms. Based on an original survey of over 230 Chi-
nese textile and apparel exporters, the research documents the exchange rate exposure
of Chinese exporters, their perceptions of currency risk and the methods, if any, they
are employing to manage that risk. The results shed light on the behavior of Chinese
exporters and o¤er an alternate answer to the question of why China has moved slowly
in allowing its currency to appreciate.
Chinese currency is widely perceived to be undervalued against the dollar. Estimates
of the degree of undervaluation against the U.S. dollar range from 7% to 67% according
to Cline and Williamson (2007).1 U.S. government o¢ cials have consistently argued for
a more rapid appreciation of the renminbi against the U.S. dollar in part to avoid more
protectionist measures advocated by critics of the rising bilateral trade imbalance between
the countries. While China formally changed its exchange rate setting procedure in July
2005, it has largely rebu¤ed or sidestepped American pressure to allow the currency to
appreciate more rapidly. The appreciation of the renminbi has been slow enough that,
from July 2005 to October 2007, the renminbi had actually depreciated in nominal terms
against the euro and pound. The issue of the perceived weakness of the Chinese currency
is not limited to the U.S.. In November 2007, European o¢ cials including Jean-Claude
Trichet, president of the European Central Bank, collectively issued a statement urging
China to allow its currency to appreciate more rapidly.
This paper examines the role of currency risk and exposure in Chinese textile and
apparel �rms. The Chinese textile and apparel sectors are particularly relevant for a
study of the consequences of exchange rate policy changes on Chinese �rm behavior.
In 2006, these sectors employed over 9.7 million workers in China, mostly less-educated
and low-skilled, and were a major source of export earnings, almost $140 billion (UN
Statistical Division 2007). Following the elimination of the quota system of the Multi-
Fiber Arrangement in January 2005, Chinese textile and apparel exports are booming
and are once again the subject of contentious trade negotiations and trade sanctions by
1See Cheung, Chinn, and Fujii (2007) for an alternate view on the overvaluation of the renminbi.
Chinese Exporters, Exchange Rate Exposure and the Value of the Renminbi 3
both the U.S. and the European Union. Firms in these industries provide a potential
bellwether for the rest of the Chinese export sector.
Using survey data for 230 exporters, this paper examines the perception of exchange
rate risk as well as the actual currency exposure of the �rms. Chinese �rms exporting
textiles and apparel receive the overwhelming majority (87%) of their foreign exchange
revenues in dollars. However, the distribution of export destinations is much more evenly
balanced between the U.S. (24%), Europe (30%), Japan (14%) and other destinations
(32%) (see Table 3). Most �rms with signi�cant dollar receipts are able to correctly
identify the potential risk of a strengthening of the renminbi against the dollar. However,
this mismatch between currencies and actual destinations means that �rms are much more
likely to be unaware of potential problems if the Chinese currency were to appreciate
against the Japanese yen or European currencies such as the euro and pound.
Even if Chinese �rms correctly evaluate their exposure to currency movements, they
have few options for �nancial risk management. Hedging instruments are not typically
available or well-understood, and where available are relatively expensive. The average
duration of exchange rate hedges is extremely short, suggesting that Chinese exporters are
concentrating on transactional hedging of outstanding sales and are typically not engaged
in o¤setting longer term exposure.
Given the relatively intense competition and low margins in the textile and apparel
industries, the hidden currency exposure and lack of e¤ective risk management techniques
combine to pose a substantial challenge for the �rms. In the aggregate these issues may
present signi�cant di¢ culties for o¢ cials in charge of managing the future course of the
Chinese currency. A rapid appreciation of the Chinese currency could be the source of a
substantial rise in unemployment for some of the most vulnerable employees in the export
sector.
The paper is organized as follows: Section 2 examines related research; currency move-
ments are discusses in Section 3; Section 4 introduces the survey and presents �ndings on
direct and indirect currency exposure at the surveyed �rms; Section 5 documents the gap
between perceived and actual currency exposure; Section 6 examines risk management
practices and �rm responses to further rises in the value of the Chinese currency; and
Section 7 concludes.
2. Related research
This paper is related to a number of ongoing research streams in international eco-
nomics including the e¤ects of exchange rates on �rm performance, currency invoicing,
Chinese Exporters, Exchange Rate Exposure and the Value of the Renminbi 4
and exchange rate risk management. A growing body of research examines the choice
of invoicing currency by exporting �rms. Bacchetta and van Wincoop (2005) �nd that
exporting �rms will price in their own currency when they face less competition in the
foreign market. Engel (2006) develops a theoretical framework that links the choice of
invoicing currency to the variance of prices. Goldberg and Tille (2006) consider the
choice of a third party, or vehicle, currency in the �rm�s export decision. They empha-
size a herding e¤ect to reduce price movements relative to one�s competitors. The survey
results suggest that the dollar is in widespread use as the invoicing currency for Chinese
exporters with important consequences for �rms�perceptions of exchange rate risk.
Firm pricing in the face of exchange rate changes is the subject of a large literature.2
Exporting �rms can choose to o¤set the e¤ects of exchange rate movements by adjusting
prices di¤erentially across markets according to the degree of pricing power, i.e. pricing-
to-market. While the survey does not o¤er direct evidence on pricing-to-market behavior
by Chinese exporters, the results con�rm that the most likely response of Chinese textile
and apparel exporters in the face of an appreciating renminbi is to raise export prices.
In advanced economies there are a range of alternatives for �rms that would like to
reduce their exchange rate exposure, see Froot, Scharstein and Stein (1993). Financial
instruments for managing exchange rate exposure have only recently been introduced in
China. The survey report limited use over short horizons of trade �nancing and �nancial
instruments to reduce exchange rate risk.
The combination of invoicing currency choice, lack of hedging instruments and pricing
responses of Chinese �rms to changes in the value of the renminbi suggest a role for
Chinese exporters in determining the degree of exchange rate pass-through. Marazzi et
al. (2005) attribute part of the decline in exchange rate pass-through in U.S. imports in
more recent years to the rise of Chinese exports. However, going forward in a period
of renminbi appreciation against the dollar, any mitigation of pass-through due to rising
imports from China may be lessened.
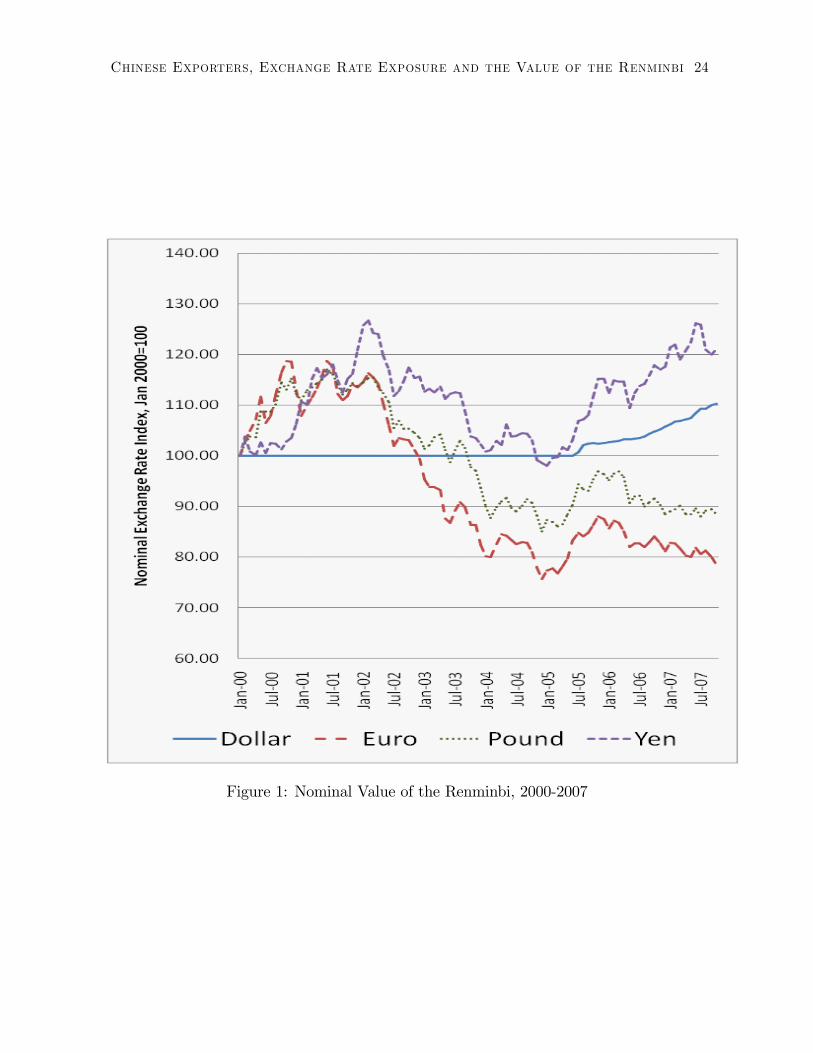
3. Currency Movements
The vast majority of articles about the value of the Chinese currency focus on the
relationship to the U.S. dollar, largely due to the nature of the �xed exchange rate regime
that existed until July 2005. However, Chinese exporters have been exposed to substantial
exchange rate volatility against other currencies both before and after the change in
regime. Figure 1 shows the nominal value of the renminbi against four major currencies.
2See Goldberg and Knetter (1997) for a survey.
Chinese Exporters, Exchange Rate Exposure and the Value of the Renminbi 5
From July 2005 through October 2007, the Chinese currency appreciated 10.8 percent
against the dollar and 14.4 percent against the yen. In contrast the currency actually
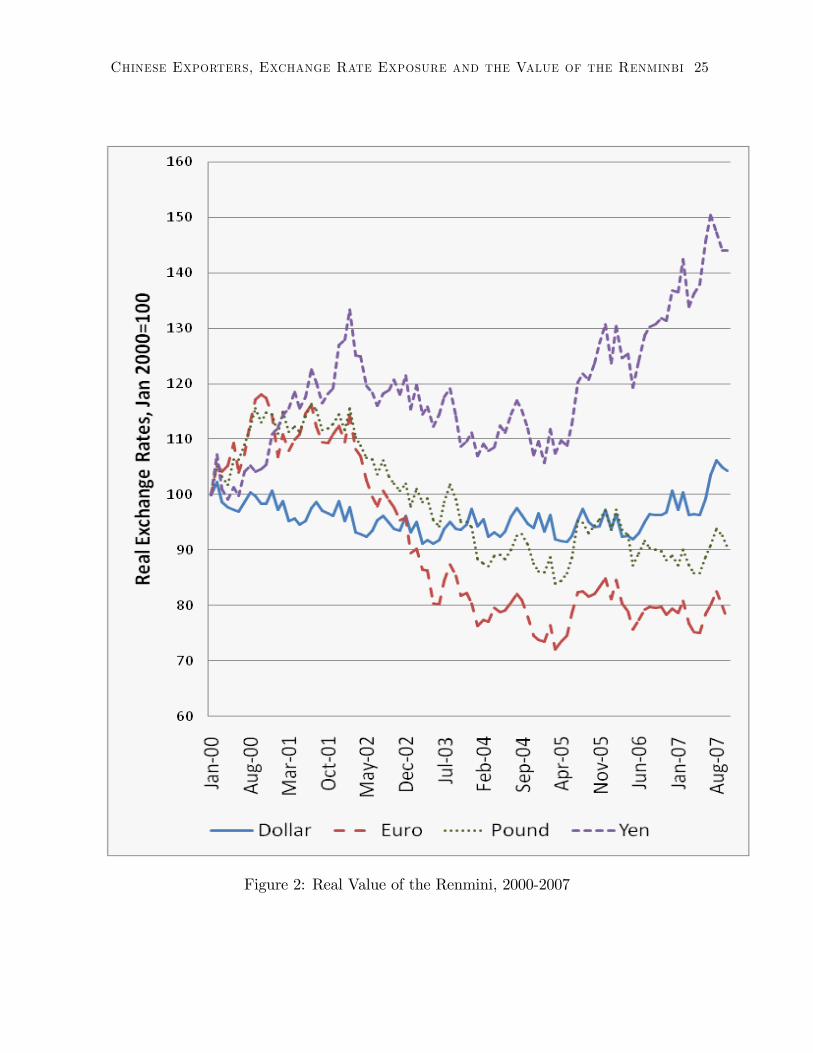
weakened 8.8 percent against the euro and 6.2 percent against the pound. Figure 2
shows real exchange rate movements, i.e. after adjusting for di¤erences in in�ation. The
overall pattern of movements is similar, however, the real value of the chinese currency
against the dollar is roughly unchanged between 2000 and early 2007 with the nominal
appreciation largely o¤set by higher in�ation in the U.S..
Even before the abandonment of the tight link to dollar, Chinese exporters faced
moderate exchange rate movements in their destination markets. Since 2000, the av-
erage year-on-year movement of the real value of the renminbi against the euro, pound
and yen has been between 6.5 and 8.1 percent. However, given the invoicing decisions
discussed below, these currency movements may have been largely perceived by �rms to
be �uctuations in demand.
4. Chinese textile and apparel exporters
The data used in this paper come from a survey of Chinese textile and apparel ex-
porters conducted during July and August 2006. 280 �rms completed the survey of which
230 provided answers to a su¢ cient number of the questions to be deemed as "usable"
responses. The survey was conducted with the help of a private Chinese export assistance
�rm and speci�cally targeted �rms engaged in exporting. Fully 36 percent of the �rms
do not report any sales in the domestic market.
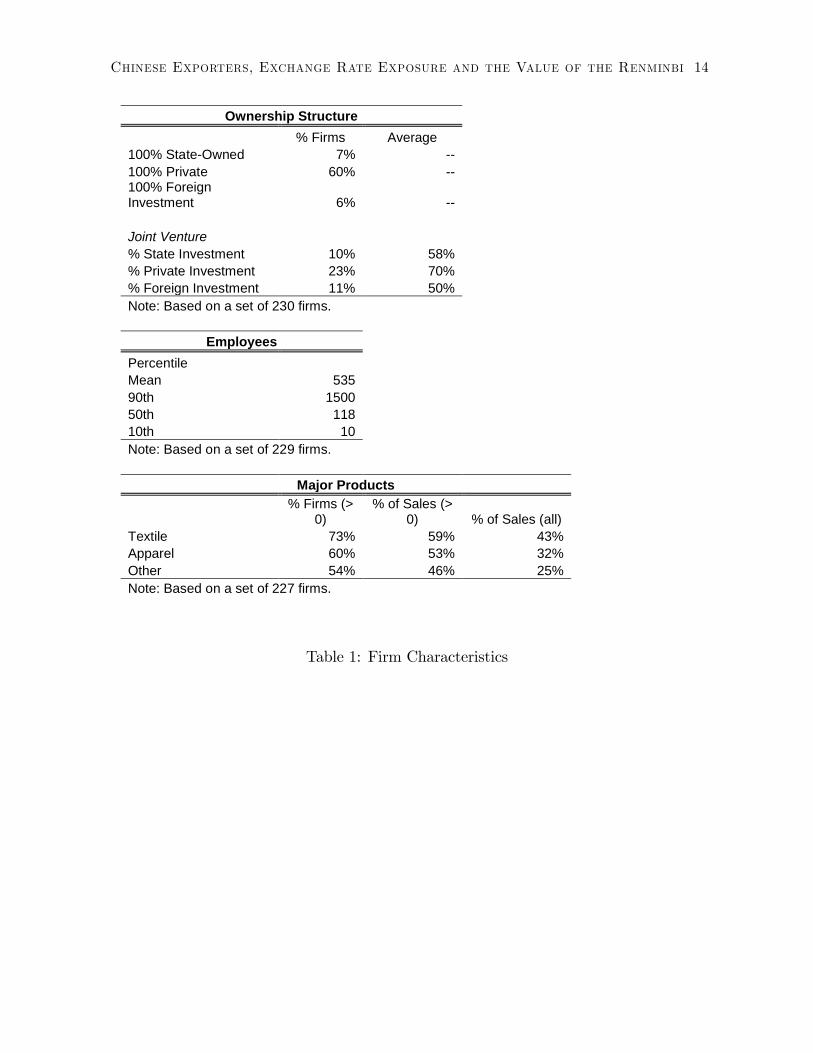
The responding �rms are predominantly private (60 percent) or joint ventures (28
percent) with only a few �rms 100 percent owned by the state (6 percent) and another
small set 100 percent foreign-owned (Table 1). The typical �rm exports both textiles
and apparel as well as other products. Most �rms own the import and export license
themselves. Firms range in size from 3 employees to 10,000 with 118 at the median �rm
and 535 at the average.3
4.1. Currency Exposure
One of the main goals of the survey is to assess the exchange rate exposure of Chinese
exporters and their awareness of exposure to currency movements. The survey took place
one year after a major change in exchange rate policy by the Chinese government that
dropped the �xed rate policy with respect to the U.S. dollar.
3Unfortunately, there is no public information on the characteristics of Chinese exporters in the textileand apparel industry to provide comparisons with the �rms here.
Chinese Exporters, Exchange Rate Exposure and the Value of the Renminbi 6
This section documents the distribution of exports and imports both by currency and
by market. Two forms of �rm exchange rate exposure are analyzed. Direct exposure is
the net position in a currency on a �rm�s books, i.e. the di¤erence between revenues in the
currency and costs in the currency. Indirect exposure measures the net position relative
to a market, i.e. the di¤erence between the �rm�s sales to a market and its purchases
from a market.4 The measure of direct exposure corresponds to most �rms�perceptions
of their operating exchange rate exposure. The indirect measure is potentially a more
accurate indicator of the operating exchange rate risk faced by the �rm.
To illustrate the di¤erences between direct and indirect exposure consider the case of
a medium-sized (U.S.$100m) textile and apparel exporter based in Shanghai interviewed
in preparation for the survey. The �rm exports almost all of its output and its revenues
are 100 percent denominated in U.S. dollars while its markets are equally split between
the U.S., Europe and Japan. The �rm has negligible imported costs. When interviewed,
the �rm�s general manager was acutely aware of the dollar exposure of the �rm and the
pressure the �rm faced due to the rise of the renminbi against the dollar. As a consequence
the �rm was experimenting with various newly-available �nancial instruments to o¤set
its dollar exposure. However, they are deemed to be expensive and di¢ cult to manage.
More importantly, the manager did not identify any potential exposure to the euro or
the yen. Given the �rm�s decision to price entirely in dollars, a rise in the dollar-euro rate
or dollar-yen rate would e¤ectively raise the �rm�s prices to two-thirds of its customers,
and presumably reduce sales and revenue.5 Pricing decisions to European and Japanese
customers are made by product-line specialists who receive no instruction on managing
exchange rate changes. The general manager described a situation of asymmetry whereby
European customers would likely ask for dollar price reductions as their home currency
depreciated but where dollar prices would be held steady as the dollar fell.
4.2. Sales and Costs Across Currencies and Markets
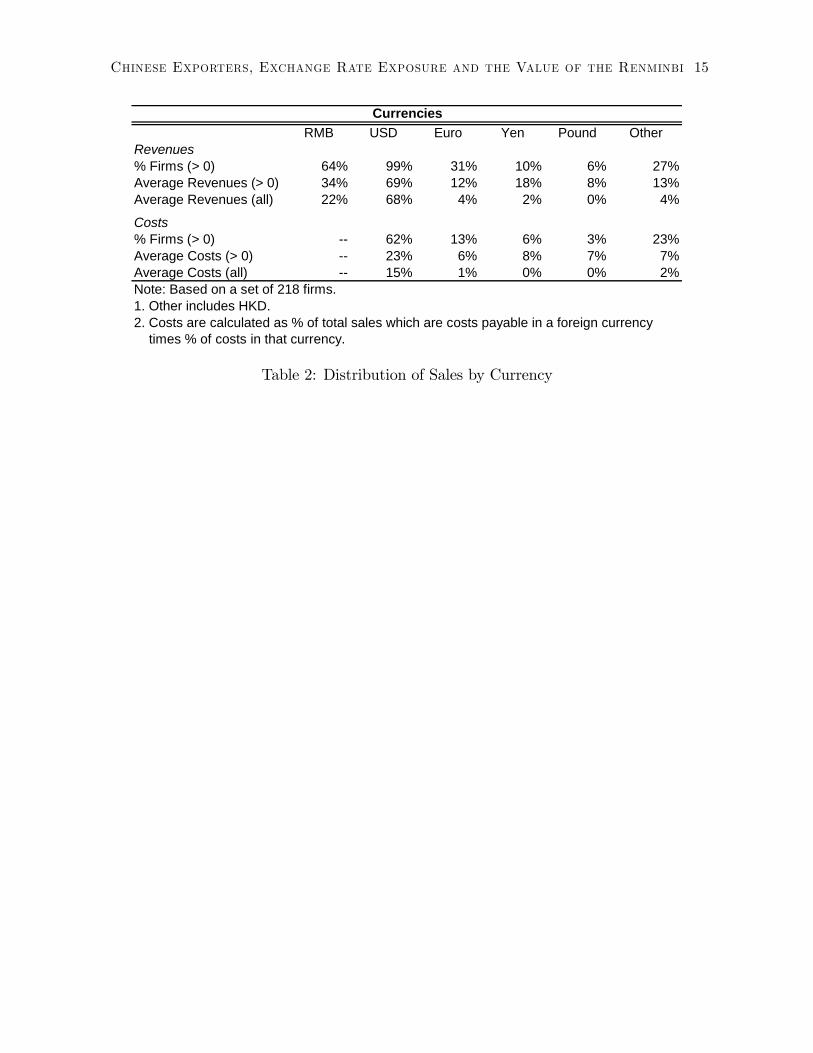
Table 2 reports the distribution of revenues and costs by currency. The average
�rm exports 78 percent of output by value and 88 percent of those export revenues (68.6
percent of total revenues) are denominated in U.S. dollars. Almost every �rm (98.6
percent) reports some revenues in dollars. Many fewer �rms receive revenues in euros
4A more comprehensive measure of indirect exposure would include an assessment of the currencyexposure of competing �rms. Given the magnitude Chinese textile and apparels, it may be reasonablefor these �rms to assume their primary competitors are other Chinese �rms.
5Of course, a simulataneous drop in the renminbi-dollar rate would leave the �rm�s position almostunchanged.
Chinese Exporters, Exchange Rate Exposure and the Value of the Renminbi 7
yen, or pounds, 30.6, 10.2 and 6.0 percent respectively. For the average �rm, revenues in
euros and yen are a much smaller share of export (and overall) revenue, 4.3 (3.4) and 2.4
(1.9) percent respectively. For �rms that report positive revenues in euros, euros receipts
represent 11 percent of total sales, for yen the comparable �gure is 18 percent of sales.
While exports dominate sales for these �rms, imported inputs are a relatively small
share of costs, under 18 percent. The distribution of import costs across currencies shows
a similar pattern, dollars represent the largest share (84 percent) followed by euro and
yen.
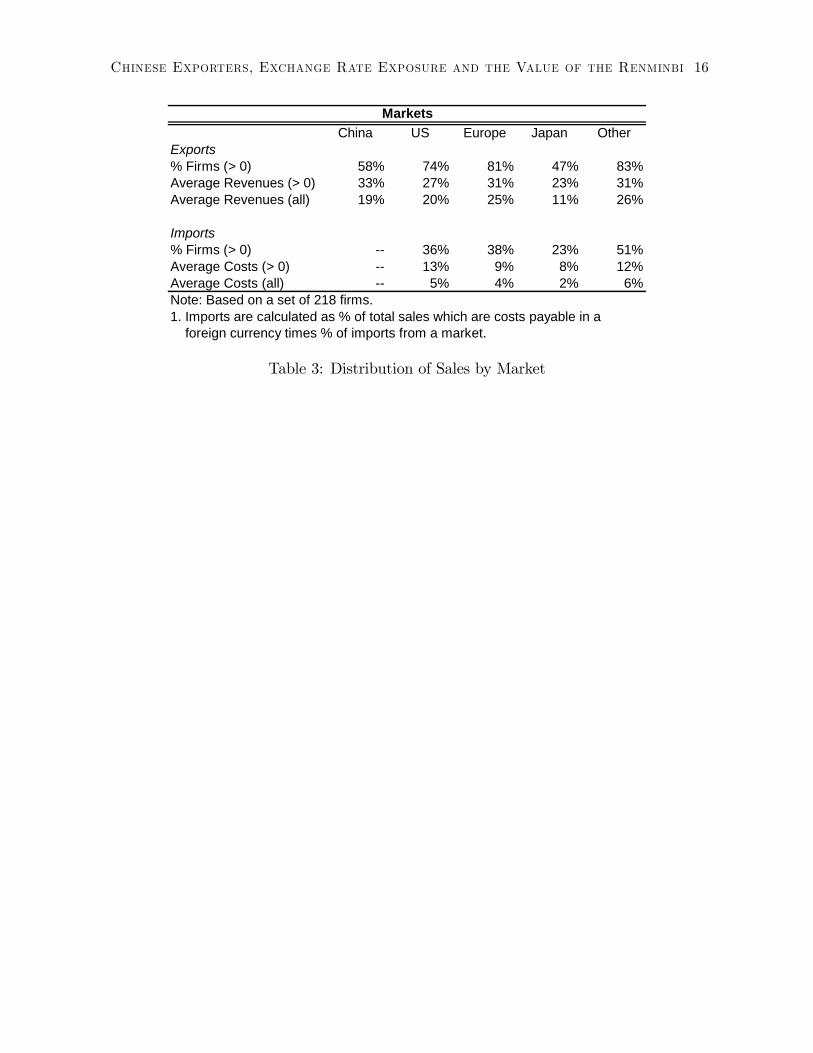
The distribution of export sales and imported inputs across markets is given in Table
3.6 There is a more balanced distribution of exports across destination markets than
across invoiced currencies. While most sales are denominated in dollars, average sales to
the EU in the surveyed �rms are actually greater than those to the U.S., 30.6 and 24.4
percent of export sales respectively. Sales to Japan account for 13.1 percent of exports.
Similarly import costs are relatively evenly distributed, with 28.6 coming from the U.S.
and 22.5 percent from the EU. The balance of sales (and costs) across markets suggest
that the large positive dollar revenues shown by most �rms are a result of dollar pricing
rather than a disproportionately large role of the U.S. as a destination market.
There are several potential explanations for the outsized role of the dollar in revenues
and costs including the size of the U.S. market and dollar-denominated invoicing by
Chinese �rms. In spite of trade restrictions in the form of tari¤s and, especially, quotas,
the U.S. has historically been a large market for Chinese textiles and apparel. However, in
2006, the share of aggregate Chinese textile and apparel exports destined for the U.S.(14%)
was slightly less than the reported exports to the EU (15%) (UN Statistical Division
2007).7 Choosing to price in the destination currency would lead Chinese exporters to
have sizable receipts in U.S. dollars but would not explain the low share of revenues in
euros and pounds. A more likely explanation lies in the choice of exchange rate regimes
by the Chinese government. For many years until July 2005, the renminbi had been
e¤ectively pegged to the U.S. dollar at an unchanged rate of 8.27 yuan per dollar. Under
such an arrangement, pricing in U.S. dollars would be functionally the same as setting
prices in the home currency. The large share of dollar revenue might be the result of
historical pricing practices based on a stable dollar-renminbi link. The question remains
as to whether the dollar will continue to be the invoicing currency of choice for Chinese
6The currencies in Table 2 and the markets in Table 3 do not exactly match, e.g. �rms were askedabout their sales to the EU rather than separately for euro and non-euro countries in Europe.
7This likely understates the share destined for both markets as it does not count re-exports of Chinesegoods from Hong Kong. The recorded US imports of textile and apparel from China in 2006 was $29.8bn.
Chinese Exporters, Exchange Rate Exposure and the Value of the Renminbi 8
exporters as the currency continues to change.
4.3. Direct and Indirect Exposure
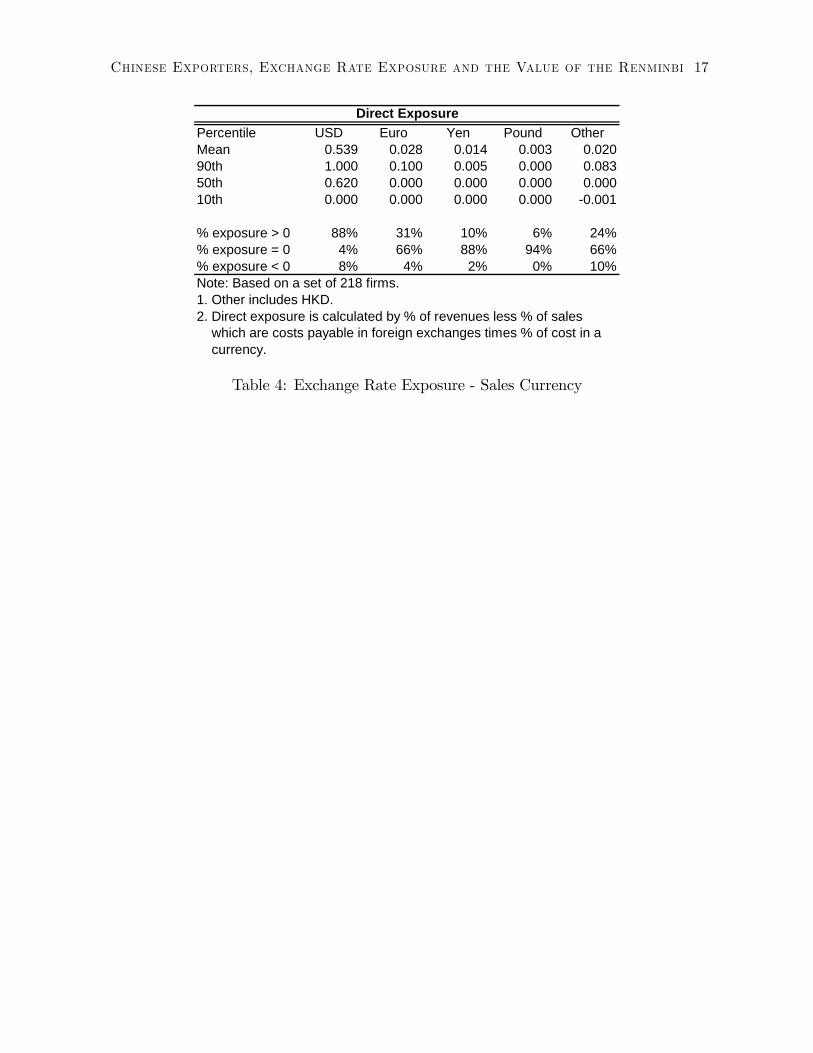
The large share of exports in output and small share of imported costs mean that
most �rms are positively exposed to foreign currencies and in particular the dollar. As
described above, this type of currency exposure will be referred to as direct exposure
and for a given currency, direct exposure is calculated as the di¤erence between revenues
and costs denominated in the currency both given as a percent of total revenues. Table
4 shows the direct exposure for four currencies, the dollar, euro, yen and pound. In
every case the average direct exposure is positive although clearly the U.S. dollar is the
primary currency for both export revenues and import costs and thus dominates the direct
exposure measures.
Over 95 percent of �rms face exposure to the dollar with the vast majority facing
positive direct exposure due to their export pricing in dollars. Average direct exposure
to the dollar is 53.9 percent of total revenues while more than half the �rms have direct
positive exposure to the dollar greater than 62 percent of total revenues. 30 percent of
�rms have positive direct exposure to the euro but only 10 percent of �rms have positive
euro exposure greater than 10 percent of total revenues. For the average �rm, all else
equal, a 10 percent increase in the value of the renminbi against the dollar would result
in a lost of net revenue equal to 5.4 percent of sales.8
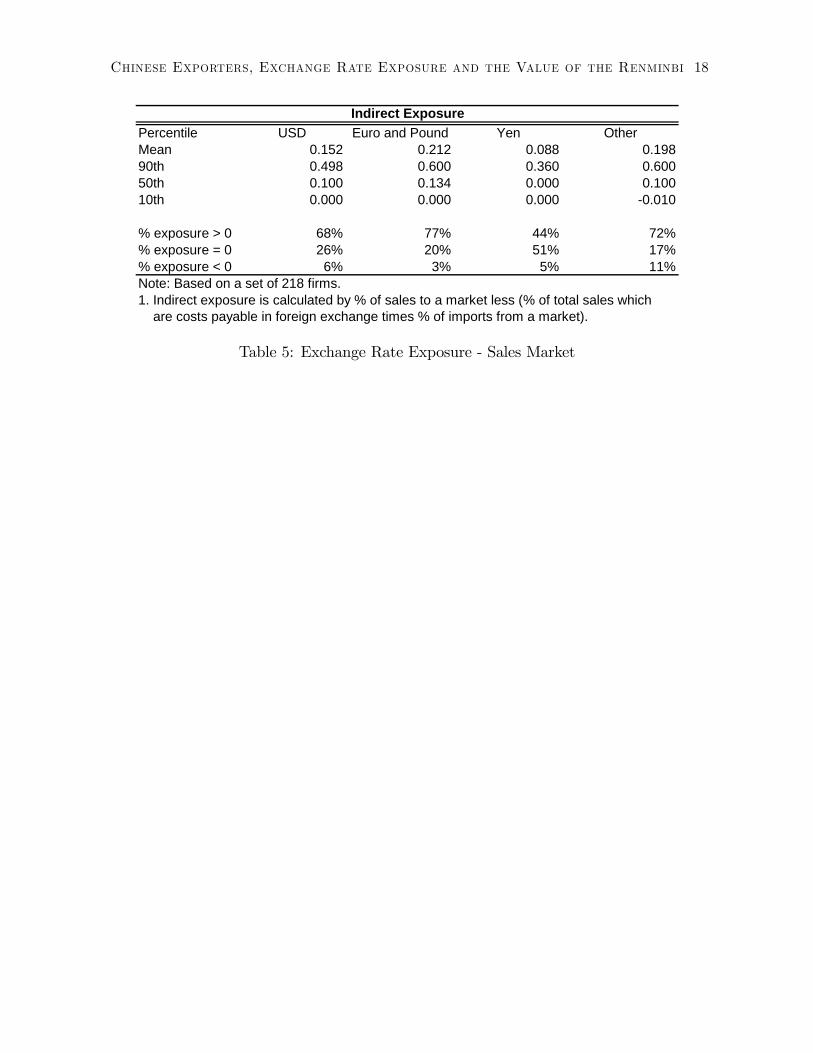
Table 5 shows the indirect exposure across the three main export destinations, the
U.S., EU and Japan, as well as the rest of the world. Indirect exposure is measured as
the di¤erence between sales in a destination market and costs sourced from that market
both given as a percent of total revenues. Unlike direct exposure, most �rms have indirect
exposure to the three major markets and the rest of the world. As with direct exposure,
indirect exposure is largely positive, re�ecting the low level of imported inputs. More
than two-thirds of �rms have positive direct exposure to the U.S. and EU. The average
indirect exposure to the U.S. is 15 percent of sales while indirect exposure to EU countries
is more than 20 percent of sales on average. More �rms have indirect exposure to the EU
than to the U.S. and the level of that exposure is higher.
This disparity between the destination country and currency of the reported revenues
raises the question of whether �rms are aware of their exchange rate exposure. Chinese
textile and apparel exporters may underestimate their exposure to currencies other than
8While �rms did not report pro�t margins, interviews with several exporters suggested margins wellbelow 10 percent and usually below 5 percent.
Chinese Exporters, Exchange Rate Exposure and the Value of the Renminbi 9
the dollar and overestimate their true dollar exposure to the dollar itself. This misper-
ception is not unique to Chinese �rms. Numerous �rms that invoice in their domestic
currency report no foreign exchange exposure.
5. Assessing Currency Exposure
The previous section documented the level of exchange rate exposure in Chinese textile
and apparel exporters. This section examines information on the perception of exchange
rate risk to assess the dimensions of the awareness of the �rms�exposure.
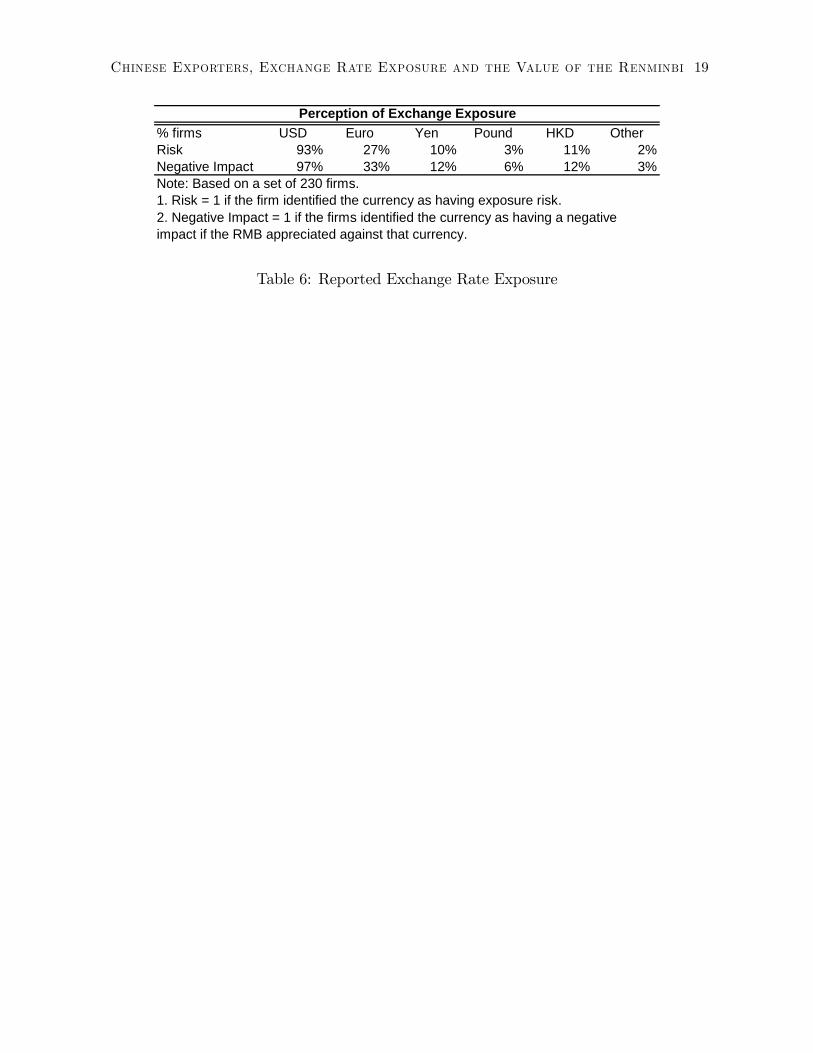
More than 95 percent of the �rms report that they face exchange rate exposure (Table
6). 93.0 percent report exposure to the dollar, while 27.4 percent report exposure to
the euro and 9.6 percent to the yen. When asked if there would be a negative impact
on the �rm if the renminbi appreciated against a particular currency, 97 percent of �rms
responded a¢ rmatively for the dollar, 31 percent for the euro and 12 percent for the yen.
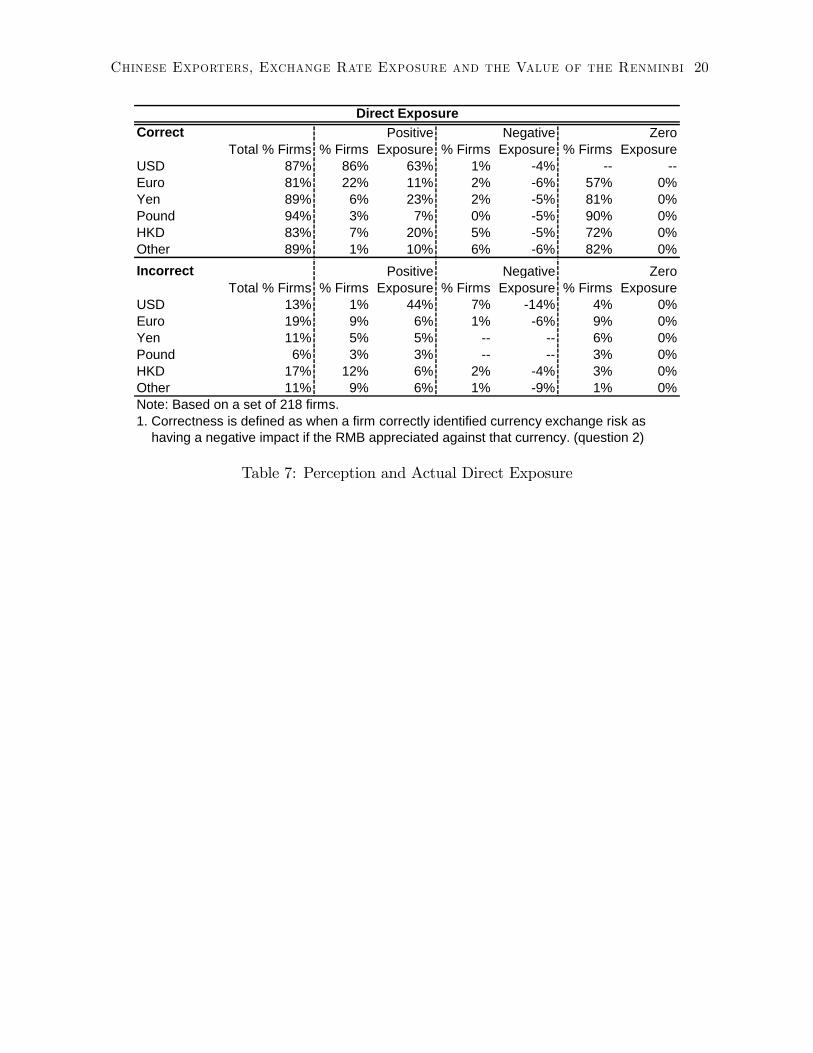
Table 7 assesses how well the �rms�assessments of their exchange rate exposure match
the direct exposures calculated from the �rms�reported sales and costs across currencies.
A �rm is deemed to have correctly assessed its direct currency exposure if it has positive
direct exposure and responded that an renminbi appreciation would hurt the �rm. If
a �rm has no exposure or negative direct exposure to a currency, a correct assessment
corresponds answering no to the same question. The top panel of the table reports on
�rms that assess correctly while the bottom panel reports on incorrect assessments. In
both case the answers are divided by the nature of the actual direct exposure faced by
the �rm, positive, zero or negative.
The answers of the large majority of �rms correspond to their actual direct exchange
rate exposure to individual currencies, More than 80 percent of �rms answer correctly for
every currency. However, the reasons vary substantially across currencies. For the dollar,
most �rms have positive direct exposure and report potential harm from a depreciation
of the dollar. For the euro and other currencies, most �rms that fail to see any risk
from an appreciation of the renminbi report zero or negative direct exposure. Incorrect
assessments of direct dollar exposure usually occur because �rms have zero or negative
direct dollar exposure but report harm from a dollar depreciation against the renminbi.
Conversely for other currencies, �rms are more likely to fail to identify positive direct
exposure to the currency.
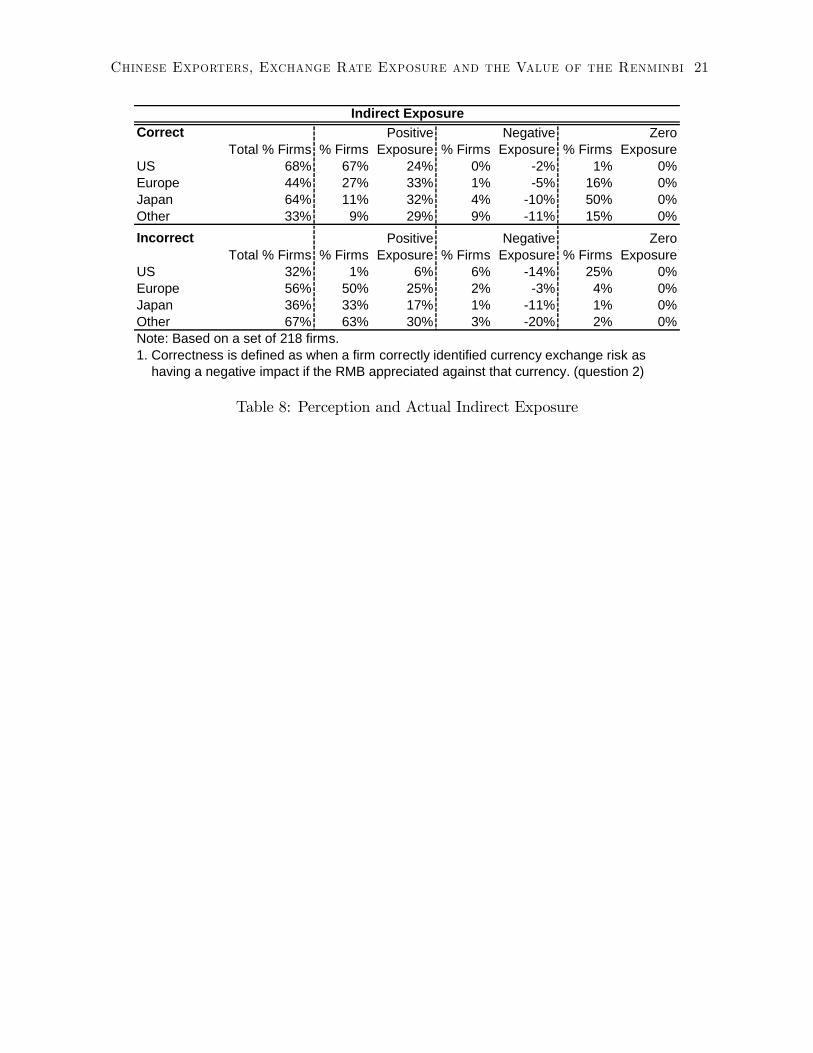
Table 8 reports whether �rms�assessement of exchange rate exposure matches their
observed indirect currency risk as measured by the distribution of sales and costs across
markets. In general �rms are far less likely to identify indirect exchange rate risk than

Chinese Exporters, Exchange Rate Exposure and the Value of the Renminbi 10
direct exchange rate risk. The indirect risk assessments for the U.S. dollar match for only
68 percent of �rms. 25 percent of �rms report that they face exchange rate risk from
the dollar even though their net exposure to the U.S. market is zero. In contrast, for the
yen, �rms�assessment of exchange rate risk matches the observed indirect risk most often
when the indirect risk is zero. However, more than one third of �rms face positive indirect
exposure to Japan, averaging 17 percent of sales, and fail to identify exposure to the yen.
For the EU, the most important export destination for this sample of �rms, fewer than
44 percent of �rms have a match between their assessment of exposure to the euro (and
pound) and their observed indirect exposure.9 More than half the �rms have positive
indirect exposure to the EU but fail to report a negative impact of an appreciation of the
renminbi against the euro or the pound.
These results point to two conclusions: most Chinese exporters are well aware of
currency risk that shows up on their books, i.e. receipts and costs in a foreign currency;
however, the same �rms have limited awareness of exposure to destinations markets other
than the U.S.. The next section examines the exchange rate risk management practices
at these exporters.
6. Risk Management
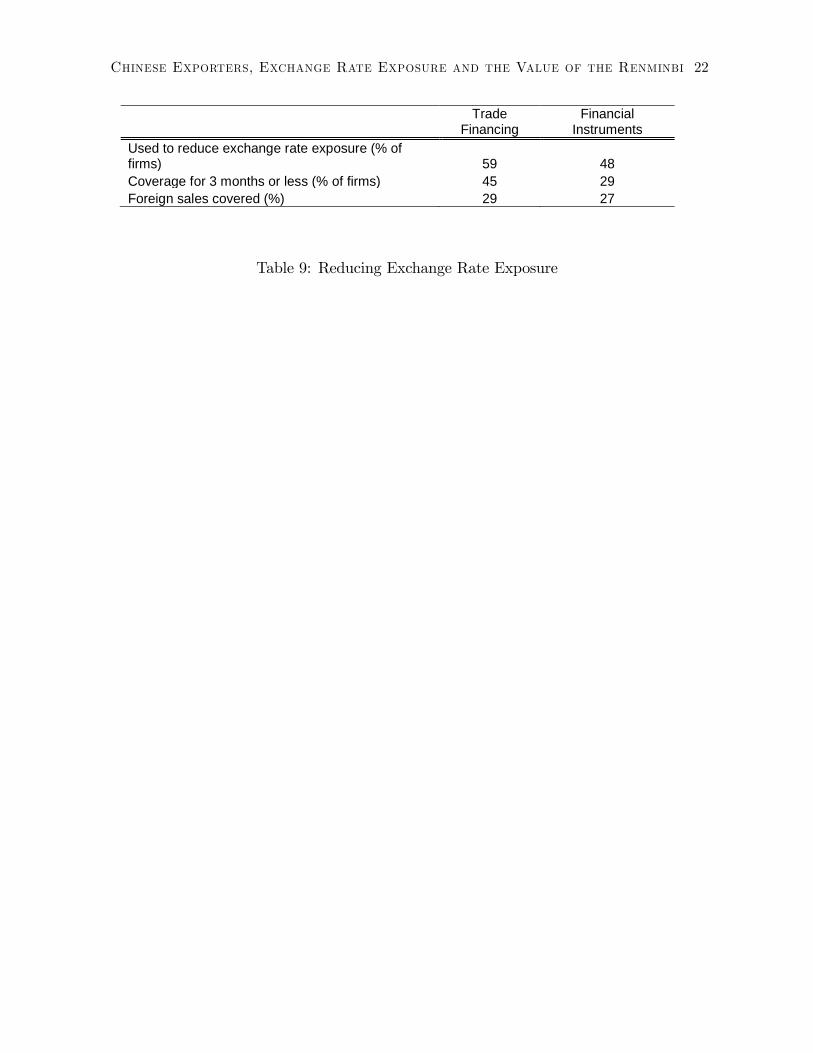
There are relatively few options for Chinese �rms that would like to manage their
currency exposure. The two major options are trade �nancing and a limited set of
�nancial instruments. 59 percent of the �rms report using trade �nancing to reduce
exchange rate exposure, covering 29 percent of their foreign sales and purchases (Table
9). However, even for �rms that use trade �nancing, the duration of the coverage is quite
short, three months or less for more than three quarters of these �rms.
48 percent of �rms report using �nancial instruments to reduce exchange rate risk;
two thirds of those using trade �nancing also use �nancial instruments. Typically these
instruments are obtained from domestic �nancial institutions with the most common being
a foreign exchange rate forward - used by 61 percent of the �rms employing a �nancial
exchange rate instrument. On average 27 percent of exports are covered by �nancial
instruments.
More than three quarters of the �rms have no long term exchange rate risk management
activities. These �rms are particularly vulnerable to the typical year-to-year �uctuations
in exchange rates
9Answers for the euro and pound are combined in evaluating the indirect exposure to the EU.
Chinese Exporters, Exchange Rate Exposure and the Value of the Renminbi 11
Only 45.5 percent of �rms have a senior manager or independent department that
is responsible for foreign exchange rate risk management. Use of both trade �nancing
and �nancial instruments is substantially higher at �rms with such a senior manager or
independent department, 69 versus 49 and 62 versus 36 percent respectively. Similarly,
�rms with foreign exchange risk assessment procedures for new export or import business
are more likely to be using measures to reduce exchange rate exposure.
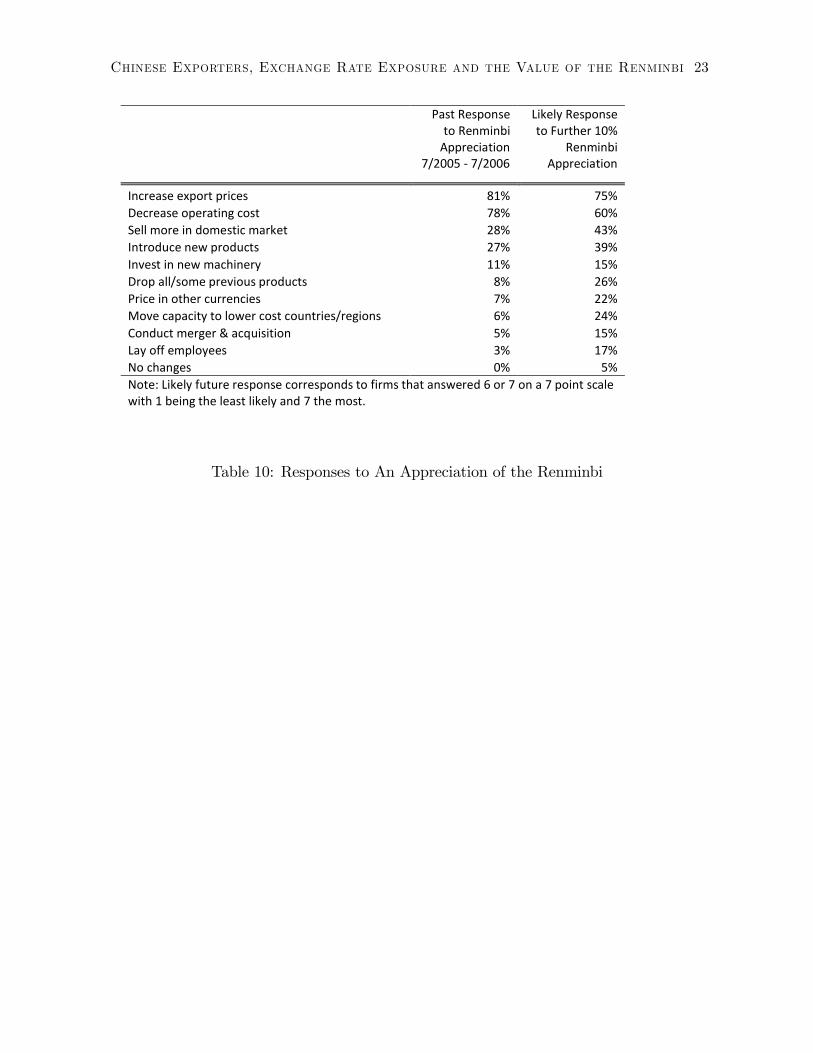
6.1. Responses to a rising renminbi
In the �rst year after the exchange rate regime change, �rms report changing their
behavior in a variety of ways. The most common responses included increasing export
prices, 81 percent, and decreasing operating costs, 78 percent (Table 10). Selling more to
the domestic market and new product introductions were reported by just over a quarter
of the �rms. A quarter of �rms report no sales to the U.S. market, however, these �rms
showed the same responses to the rise of the renminbi as �rms with sales to the U.S.. In
particular, few �rms decided to price in other currencies.
The expected responses to a future 10 percent appreciation of the renminbi also show a
similar pattern. The dominant response is an expected increase in export prices, however,
�rms report a high willingness to try a wider variety of responses. Increased domestic
sales, changes in product mix, and changes in invoicing currency are all more likely going
forward.
7. Conclusions
This paper o¤ers an alternate, �rm-based perspective on the conduct of exchange
rate policy by the Chinese government. Instead of focusing on the �ows of capital and
goods in the aggregate, this study details the exchange rate exposure, perceptions, and
risk management policies of Chinese textile and apparel exporting �rms. Such �rms
face signi�cant exposure to changes in the value of the renminbi that they are either
unable or unwilling to reduce through risk management practices. The typical exporting
�rm continues to disproportionately invoice in U.S. dollars. These large dollar revenues
exaggerate the risk of a dollar depreciation for the �rm. At the same time, the dollar
revenues mask the underlying exposure of most �rms to an appreciation of the renminbi
against the euro, yen or pound.
The People�s Bank of China is aware of the problems facing Chinese exporters as they
conducted a similar survey of their own in the summer of 2006. The results presented here
suggest an explanation for the slow appreciation of the currency and for the increasing
Chinese Exporters, Exchange Rate Exposure and the Value of the Renminbi 12
pressure by the Central Bank on �nancial institutions to o¤er more sophisticated and
less expensive �nancial instruments for exchange rate risk reduction. Given the state of
development of the �nancial sector it is unlikely that the "go-slow" policy of the Bank will
change in the near future. A major worry is that Chinese �rms will not correctly assess
their currency exposure due to the continued weakness of the dollar since July 2005. A
reversal of this trend would appear to pose substantial risks to Chinese exporters and the
Chinese economy more generally.
Chinese Exporters, Exchange Rate Exposure and the Value of the Renminbi 13
References
Cheung, Yin-Wong, Menzie D. Chinn, and Eiji Fujii. 2007. The Overvaluation of Ren-
minbi Undervaluation. NBER Working Paper #12850.
Cline, William R. and John Williamson. 2007. Estimates of the Equilibrium Exchange
Rate of the Renminbi: Is There a Consensus and, If Not, Why Not? Peterson Institute
for International Economics, working paper.
Engel, Charles. 2006. Equivalence Results for Optimal Pass-Through, Optimal Indexing
to Exchange Rates, and Optimal Choice of Currency for Export Pricing. Journal of
the European Economics Association 4, December 2006, 1249-1260.
Froot, Kenneth A., David S. Scharfstein, and Jeremy C. Stein. 1993. Risk Management:
Coordinating Corporate Investment and Financing Policies. The Journal of Finance,
Vol. XLVIII, No. 5, December, 1629-1658.
Goldberg, Linda S. and Cedric Tille. 2006. Vehicle Currency Use in International Trade.
Federal Reserve Bank of New York Sta¤ Report 200, January 2005, (Revised March
2006.
Goldberg, Pinelopi K. and Michael M. Knetter. 1997. Goods Prices and Exchange Rates:
What Have We Learned? Journal of Economic Literature. Vol. XXXV (September),
1243-1272.
Marazzi, Mario; Sheets, Nathan; Vigfusson, Robert J; Faust, Jon; Gagnon, Joseph; Mar-
quez, Jaime; Martin, Robert F; Reeve, Trevor; Rogers, John. 2005. Exchange rate
pass-through to U.S. import prices: some new evidence. Board of Governors of the
Federal Reserve System (U.S.), International Finance Discussion Papers: 833.
United Nations Statistical Division. (2007). Comtrade (UN Commodity Trade Statistics
Database).
Chinese Exporters, Exchange Rate Exposure and the Value of the Renminbi 14
Ownership Structure% Firms Average
100% StateOwned 7% 100% Private 60% 100% ForeignInvestment 6%
Joint Venture% State Investment 10% 58%% Private Investment 23% 70%% Foreign Investment 11% 50%Note: Based on a set of 230 firms.
EmployeesPercentileMean 53590th 150050th 11810th 10Note: Based on a set of 229 firms.
Major Products% Firms (>
0)% of Sales (>
0) % of Sales (all)Textile 73% 59% 43%Apparel 60% 53% 32%Other 54% 46% 25%Note: Based on a set of 227 firms.
Table 1: Firm Characteristics
Chinese Exporters, Exchange Rate Exposure and the Value of the Renminbi 15
CurrenciesRMB USD Euro Yen Pound Other
Revenues% Firms (> 0) 64% 99% 31% 10% 6% 27%Average Revenues (> 0) 34% 69% 12% 18% 8% 13%Average Revenues (all) 22% 68% 4% 2% 0% 4%
Costs% Firms (> 0) 62% 13% 6% 3% 23%Average Costs (> 0) 23% 6% 8% 7% 7%Average Costs (all) 15% 1% 0% 0% 2%Note: Based on a set of 218 firms.1. Other includes HKD.2. Costs are calculated as % of total sales which are costs payable in a foreign currency2. times % of costs in that currency.
Table 2: Distribution of Sales by Currency
Chinese Exporters, Exchange Rate Exposure and the Value of the Renminbi 16
MarketsChina US Europe Japan Other
Exports% Firms (> 0) 58% 74% 81% 47% 83%Average Revenues (> 0) 33% 27% 31% 23% 31%Average Revenues (all) 19% 20% 25% 11% 26%
Imports% Firms (> 0) 36% 38% 23% 51%Average Costs (> 0) 13% 9% 8% 12%Average Costs (all) 5% 4% 2% 6%Note: Based on a set of 218 firms.1. Imports are calculated as % of total sales which are costs payable in a1. foreign currency times % of imports from a market.
Table 3: Distribution of Sales by Market
Chinese Exporters, Exchange Rate Exposure and the Value of the Renminbi 17
Direct ExposurePercentile USD Euro Yen Pound OtherMean 0.539 0.028 0.014 0.003 0.02090th 1.000 0.100 0.005 0.000 0.08350th 0.620 0.000 0.000 0.000 0.00010th 0.000 0.000 0.000 0.000 0.001
% exposure > 0 88% 31% 10% 6% 24%% exposure = 0 4% 66% 88% 94% 66%% exposure < 0 8% 4% 2% 0% 10%Note: Based on a set of 218 firms.1. Other includes HKD.2. Direct exposure is calculated by % of revenues less % of sales2. which are costs payable in foreign exchanges times % of cost in a2. currency.
Table 4: Exchange Rate Exposure - Sales Currency
Chinese Exporters, Exchange Rate Exposure and the Value of the Renminbi 18
Indirect ExposurePercentile USD Euro and Pound Yen OtherMean 0.152 0.212 0.088 0.19890th 0.498 0.600 0.360 0.60050th 0.100 0.134 0.000 0.10010th 0.000 0.000 0.000 0.010
% exposure > 0 68% 77% 44% 72%% exposure = 0 26% 20% 51% 17%% exposure < 0 6% 3% 5% 11%Note: Based on a set of 218 firms.1. Indirect exposure is calculated by % of sales to a market less (% of total sales which1. are costs payable in foreign exchange times % of imports from a market).
Table 5: Exchange Rate Exposure - Sales Market
Chinese Exporters, Exchange Rate Exposure and the Value of the Renminbi 19
Perception of Exchange Exposure% firms USD Euro Yen Pound HKD OtherRisk 93% 27% 10% 3% 11% 2%Negative Impact 97% 33% 12% 6% 12% 3%Note: Based on a set of 230 firms.1. Risk = 1 if the firm identified the currency as having exposure risk.2. Negative Impact = 1 if the firms identified the currency as having a negativeimpact if the RMB appreciated against that currency.
Table 6: Reported Exchange Rate Exposure
Chinese Exporters, Exchange Rate Exposure and the Value of the Renminbi 20
Direct ExposureCorrect Positive Negative Zero
Total % Firms % Firms Exposure % Firms Exposure % Firms ExposureUSD 87% 86% 63% 1% 4% Euro 81% 22% 11% 2% 6% 57% 0%Yen 89% 6% 23% 2% 5% 81% 0%Pound 94% 3% 7% 0% 5% 90% 0%HKD 83% 7% 20% 5% 5% 72% 0%Other 89% 1% 10% 6% 6% 82% 0%Incorrect Positive Negative Zero
Total % Firms % Firms Exposure % Firms Exposure % Firms ExposureUSD 13% 1% 44% 7% 14% 4% 0%Euro 19% 9% 6% 1% 6% 9% 0%Yen 11% 5% 5% 6% 0%Pound 6% 3% 3% 3% 0%HKD 17% 12% 6% 2% 4% 3% 0%Other 11% 9% 6% 1% 9% 1% 0%Note: Based on a set of 218 firms.1. Correctness is defined as when a firm correctly identified currency exchange risk as1. having a negative impact if the RMB appreciated against that currency. (question 2)
Table 7: Perception and Actual Direct Exposure
Chinese Exporters, Exchange Rate Exposure and the Value of the Renminbi 21
Indirect ExposureCorrect Positive Negative Zero
Total % Firms % Firms Exposure % Firms Exposure % Firms ExposureUS 68% 67% 24% 0% 2% 1% 0%Europe 44% 27% 33% 1% 5% 16% 0%Japan 64% 11% 32% 4% 10% 50% 0%Other 33% 9% 29% 9% 11% 15% 0%Incorrect Positive Negative Zero
Total % Firms % Firms Exposure % Firms Exposure % Firms ExposureUS 32% 1% 6% 6% 14% 25% 0%Europe 56% 50% 25% 2% 3% 4% 0%Japan 36% 33% 17% 1% 11% 1% 0%Other 67% 63% 30% 3% 20% 2% 0%Note: Based on a set of 218 firms.1. Correctness is defined as when a firm correctly identified currency exchange risk as1. having a negative impact if the RMB appreciated against that currency. (question 2)
Table 8: Perception and Actual Indirect Exposure
Chinese Exporters, Exchange Rate Exposure and the Value of the Renminbi 22
TradeFinancing
FinancialInstruments
Used to reduce exchange rate exposure (% offirms) 59 48Coverage for 3 months or less (% of firms) 45 29Foreign sales covered (%) 29 27
Table 9: Reducing Exchange Rate Exposure
Chinese Exporters, Exchange Rate Exposure and the Value of the Renminbi 23
Past Responseto Renminbi
Appreciation7/2005 7/2006
Likely Responseto Further 10%
RenminbiAppreciation
Increase export prices 81% 75%Decrease operating cost 78% 60%Sell more in domestic market 28% 43%Introduce new products 27% 39%Invest in new machinery 11% 15%Drop all/some previous products 8% 26%Price in other currencies 7% 22%Move capacity to lower cost countries/regions 6% 24%Conduct merger & acquisition 5% 15%Lay off employees 3% 17%No changes 0% 5%Note: Likely future response corresponds to firms that answered 6 or 7 on a 7 point scalewith 1 being the least likely and 7 the most.
Table 10: Responses to An Appreciation of the Renminbi
Chinese Exporters, Exchange Rate Exposure and the Value of the Renminbi 24
Figure 1: Nominal Value of the Renminbi, 2000-2007
Chinese Exporters, Exchange Rate Exposure and the Value of the Renminbi 25
Figure 2: Real Value of the Renmini, 2000-2007