chlorophyll fluorescence parameter fv/fm measured … · japonica cv. azucena and indica cv. bala...
TRANSCRIPT

Supplementary Figure 1. Development of a rice regulatory association network.
Genome-wide expression profiles of rice genes from various developmental stages and from
environmental stress conditions were used to create separate normalized gene expression matrices (Eij) as
described in Online Methods. Pearson correlations were calculated between all gene pairs in the
expression matrix E, which were then Fisher Z-transformed to get normalized correlations with a N (0,1)
distribution. These values were used to extract correlations between 3082 transcription factors and 35,161
rice genes, to generate a gene-TF matrix Cij representing the normalized correlations of gene i with TF j,
which was further used to derive specific TF-gene correlation scores (Sij). The gene-level correlation
scores were further summarized with functional annotations from GO to derive a TF-process association
network in rice for prediction of TFs regulating specific biological processes.

2
Supplementary Figure 2. Chlorophyll content of WT and HYR lines shown in Fig. 2a. Bars represents
mean ± s.e.m. (n=6), with significance shown (t-test; *, P ≤0.05; **, P ≤0.01). Chlorophyll was extracted
from 2-week grown seedlings, and quantified by absorbance measured spectrophotometrically at 645 and
663 nm.

3
Supplementary Figure 3. Chlorophyll fluorescence parameter Fv/Fm measured using OS1-FL
Chlorophyll Fluorometer. Bars represents mean ± s.e.m. (n=6), with significance shown (t-test; *, P
≤0.05; **, P ≤0.01).
4
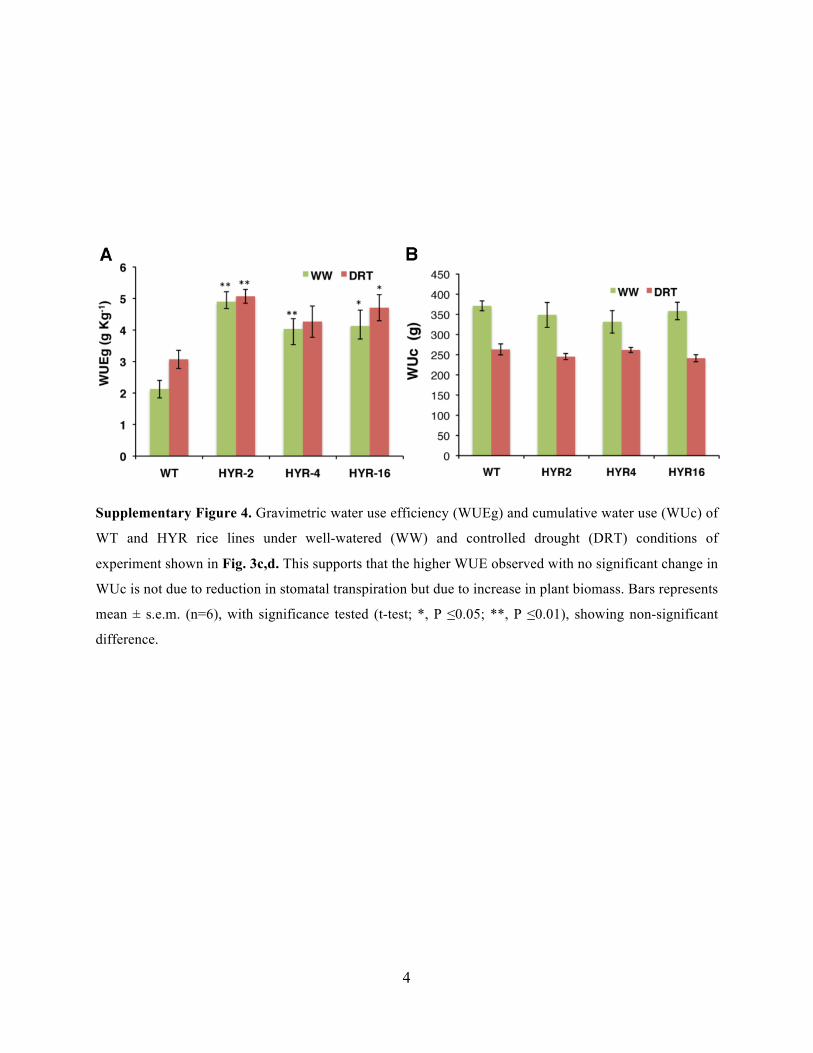
Supplementary Figure 4. Gravimetric water use efficiency (WUEg) and cumulative water use (WUc) of
WT and HYR rice lines under well-watered (WW) and controlled drought (DRT) conditions of
experiment shown in Fig. 3c,d. This supports that the higher WUE observed with no significant change in
WUc is not due to reduction in stomatal transpiration but due to increase in plant biomass. Bars represents
mean ± s.e.m. (n=6), with significance tested (t-test; *, P ≤0.05; **, P ≤0.01), showing non-significant
difference.
5
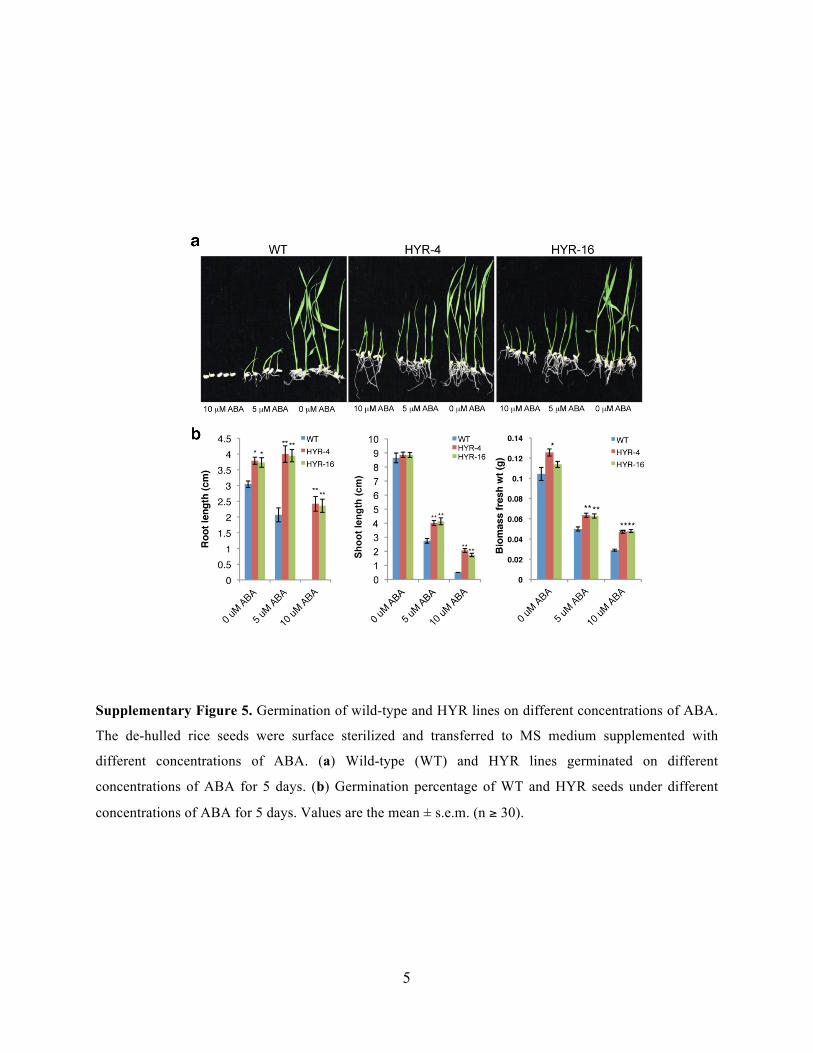
Supplementary Figure 5. Germination of wild-type and HYR lines on different concentrations of ABA.
The de-hulled rice seeds were surface sterilized and transferred to MS medium supplemented with
different concentrations of ABA. (a) Wild-type (WT) and HYR lines germinated on different
concentrations of ABA for 5 days. (b) Germination percentage of WT and HYR seeds under different
concentrations of ABA for 5 days. Values are the mean ± s.e.m. (n ≥ 30).

6
Supplementary Figure 6. Growth performance of HYR lines on different concentrations of ABA. The
de-hulled seeds were surface sterilized and pre-germinated on Whatman filter paper for 2 days. Uniformly
growing pre-germinated seeds were transferred on to MS medium containing different concentrations of
ABA. (a) Plant growth and (b) growth performance parameters of wild-type and HYR seedlings grown
on different concentrations of ABA for 7 days. Values are the mean ± s.e.m. (n ≥ 19); * and ** indicate
significant difference from wild-type, t-test at P≤ 0.05 and P≤ 0.01, respectively.

7
Supplementary Figure 7. Analysis of soluble sugars (glucose, fructose and sucrose) in WT and HYR
lines under well watered (white bars) and drought stressed (grey bars) conditions. Error bars show mean ±
s.e.m. (n=6).

8
Supplementary Figure 8. Effect of high temperature on HYR lines. (a) Spikelet sterility of HYR lines
(red bars) and wild-type (WT) (blue bars) under normal control and high temperature stress. (b) The grain
weight measured as 100 seed weight for HYR and WT under control temperature and high day/night
temperatures. Plants at early boot stage were exposed to high day/night temperature of 36/26 oC until
physiological maturity. Values are the mean ± s.e.m. (n>6) and ‘*’ indicates significant difference from
wild-type, t-test at P<0.05.
9
a
b
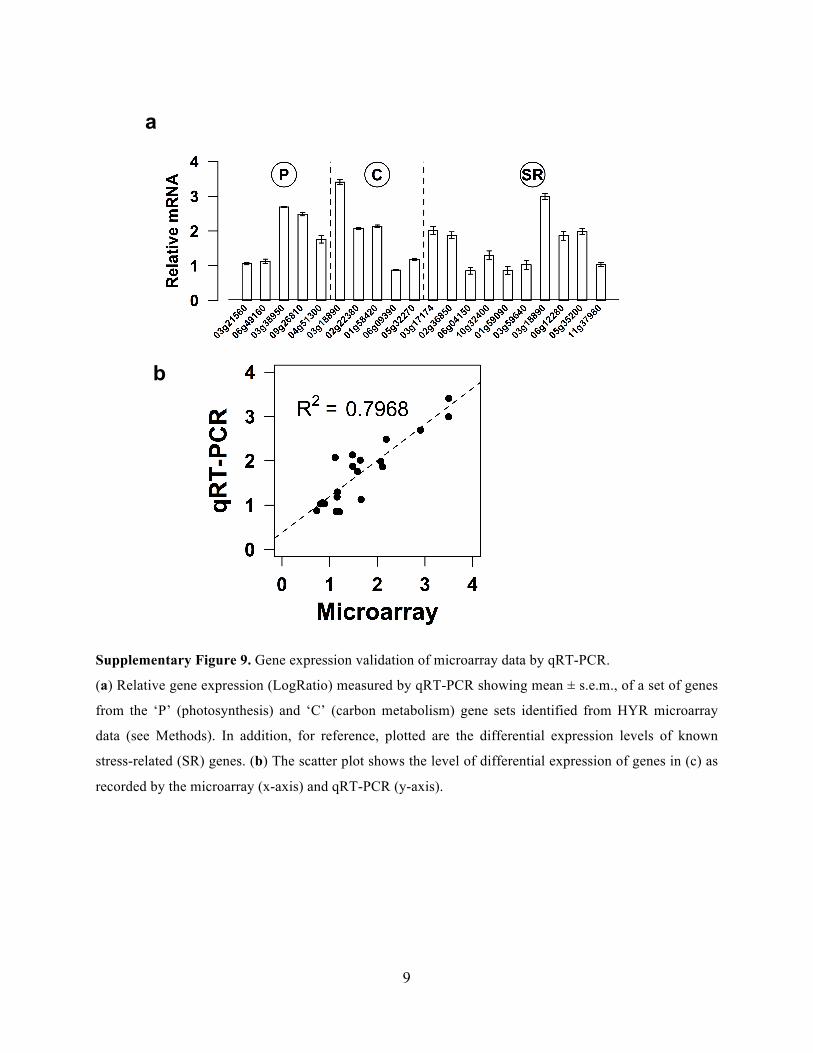
Supplementary Figure 9. Gene expression validation of microarray data by qRT-PCR.
(a) Relative gene expression (LogRatio) measured by qRT-PCR showing mean ± s.e.m., of a set of genes
from the ‘P’ (photosynthesis) and ‘C’ (carbon metabolism) gene sets identified from HYR microarray
data (see Methods). In addition, for reference, plotted are the differential expression levels of known
stress-related (SR) genes. (b) The scatter plot shows the level of differential expression of genes in (c) as
recorded by the microarray (x-axis) and qRT-PCR (y-axis).
10
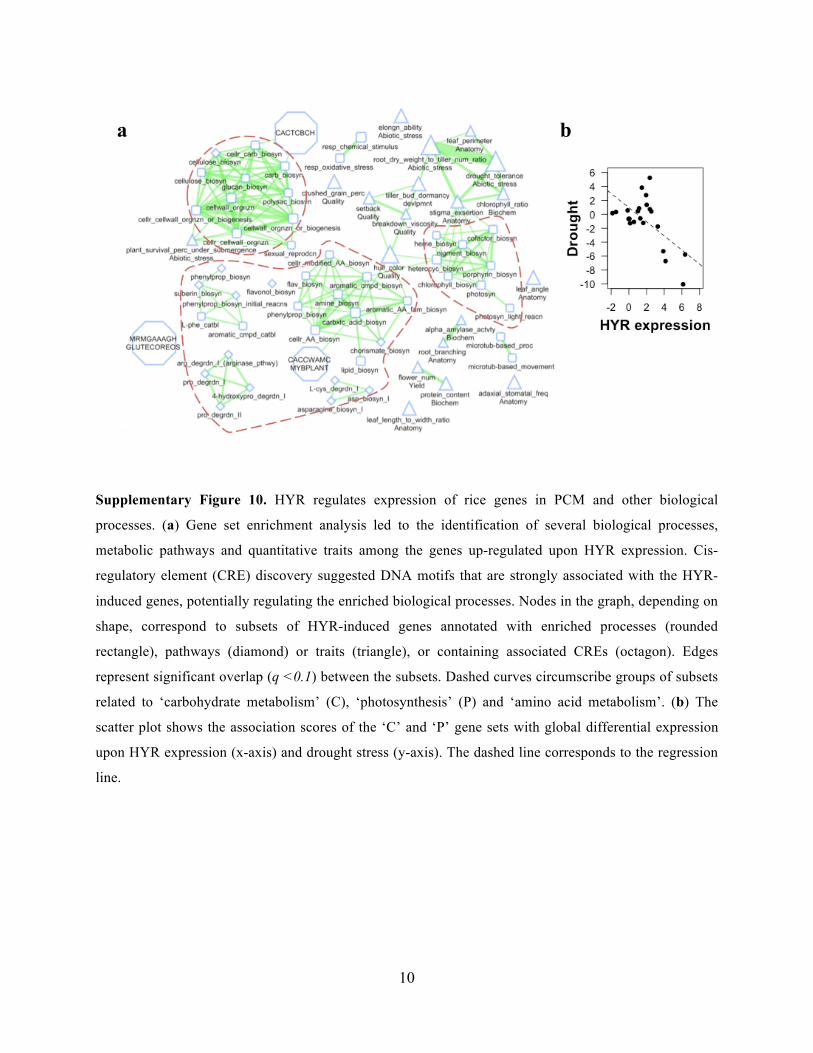
Supplementary Figure 10. HYR regulates expression of rice genes in PCM and other biological
processes. (a) Gene set enrichment analysis led to the identification of several biological processes,
metabolic pathways and quantitative traits among the genes up-regulated upon HYR expression. Cis-
regulatory element (CRE) discovery suggested DNA motifs that are strongly associated with the HYR-
induced genes, potentially regulating the enriched biological processes. Nodes in the graph, depending on
shape, correspond to subsets of HYR-induced genes annotated with enriched processes (rounded
rectangle), pathways (diamond) or traits (triangle), or containing associated CREs (octagon). Edges
represent significant overlap (q <0.1) between the subsets. Dashed curves circumscribe groups of subsets
related to ‘carbohydrate metabolism’ (C), ‘photosynthesis’ (P) and ‘amino acid metabolism’. (b) The
scatter plot shows the association scores of the ‘C’ and ‘P’ gene sets with global differential expression
upon HYR expression (x-axis) and drought stress (y-axis). The dashed line corresponds to the regression
line.
a b

11
Supplementary Figure 11. HYR and its downstream TFs directly regulate transcription of PCM genes.
Gene fusions of HYR and other TFs with the receptor (HER) domain were tested for transactivation of
target genes in the genome (shown in Fig. 6) by RT-PCR using gene specific primers (Supplementary
Table 7, see Online Methods for details), with data shown as mean ± s.e.m. Protoplasts transformed with
HER gene fusions of HYR, GASR2 and ARF1, were tested in the 4 treatments and protoplasts used for
RNA isolation and RT-PCR analysis: Treatments C -control Nipponbare; C+EST -estradiol control; CHX
–cycloheximide (CHX) treatment; CHX+EST –CHX and EST treatment. (a-c) HYR-HER expression for
transactivation of downstream TFs GASR2, ARF1 and WRKY72; (d-f) TF GASR2-HER expression to
test expression of GASR2 downstream genes; (h-i) ARF1-HER expression to test expression of ARF1
regulated genes.

12
Supplementary Figure 12. HYR transcriptionally regulates the expression of drought responsive genes.
Microarray data of HYR expressing genotype was used to identify TF gene that were up-regulated by
HYR and known to be up-regulated under drought (Fig. 1a), data represents mean ± s.e.m. (a) The
HYR/drought regulated TFs, Os01g19970 (MYB), Os06g05350 (Whirly), and Os01g14440 (OsWRKY1)
were tested by ChIP-qPCR for binding of HYR to their promoters. HYR activates the transcription of the
drought-responsive TFs in luciferase transactivation experiments. (b) HYR directly regulates expression
of the drought-responsive genes using HYR-HER fusions in EST/CHX assays.

13
Supplementary Figure 13. HYR directly regulates the expression of heat-responsive genes.
The heat responsive genes were identified from published literature as described in Methods, and that
were differentially expressed in HYR lines, data representing mean ± s.e.m. (a) qPCR analysis of the
heat-responsive genes in HYR lines showing induction. (b) ChIP-qPCR analysis shows HYR binds to the
heat-responsive promoters in vivo and activates the promoter in luciferase transactivation assays. (c) HYR
directly regulates expression of the heat-responsive genes using HYR-HER fusions in EST/CHX assays.

14
Supplementary Figure 14. Regulation of root growth by WRKY72
Rice protoplasts were cotransformed with i) 35S:WRKY72 alone (WRKY72-OX), ii) 35S:HYR, while
non-transfected rice protoplasts served as control and incubated for 24h at 280C. Total RNA was isolated
from the rice protoplast and qPCR analysis of WRKY72 and EXPA8 were done compared to control.
Values are the mean ± s.e.m.of three biological replicates.

15
Supplementary Fig 15. Expression analysis of yield related genes in HYR genotypes.
To study the expression of genes related to tillering in HYR genotypes qPCR was done with two HYR
lines (HYR-4 and HYR-16). The genes tested for qPCR are: RCN, MOC, TBL, LAX, GIF (Tripathi et al.,
2012). The results presented here are expressed as fold change relative to the WT (Nipponbare) plants
grown under the same greenhouse conditions and are mean ± s.e.m. of three biological replicates.

16
Supplementary Fig 16. Expression analysis of HYR in diverse rice genotypes
The expression of HYR was studied by qPCR using total RNA isolated from 25-day old leaf tissue of rice
genotypes grown under control conditions. The results represented here are intrinsic values and are mean
± s.e.m. of three biological replicates.

17
Supplementary Table 1 Differential expression of photosystem II and electron transport genes in HYR
lines as classified by MapMan. The table shows gene names, expression values and putative functions.
Gene Log ratio Q.value FunctionPSIILOC_Os01g59090 1.14 0.038 thylakoid lumenal 20 kDa protein, putative, expressedLOC_Os02g36850 1.482 0.039 oxygen evolving enhancer protein 3, identical, putative, expressedLOC_Os03g17174 1.64 0.02 PsbP, putative, expressedLOC_Os03g21560 0.852 0.035 photosystem II 11 kD protein, putative, expressedLOC_Os03g53640 1.741 0.021 photosystem II 11 kDa proteinLOC_Os04g44200 0.999 0.044 oxygen-evolving enhancer protein 3, chloroplast precursor, putativeLOC_Os08g25900 1.153 0.027 PsbP, putative, expressedLOC_Os08g39430 1.579 0.039 thylakoid lumenal 19 kDa protein, chloroplast precursor, putativeLOC_Os10g21310 2.019 0.025 photosystem II P680 chlorophyll A apoprotein, putative, expressedLOC_Os06g49160 1.661 0.017 thylakoid lumenal 16.5 kDa protein, chloroplast precursor, putative, expressedLOC_Os10g32400 1.162 0.027 PsbP, putative, expressedLOC_Os12g29570 0.9 0.048 Chlorophyll a-b binding proteinElectron TransportLOC_Os04g33630 2.365 0.011 2Fe-2S iron-sulfur cluster binding domain containing protein, expressedLOC_Os07g38000 3.042 0.011 cytochrome c, putative, expressedLOC_Os08g35710 2.601 0.03 expressed proteinLOC_Os02g22260 0.908 0.028 fruit protein PKIWI502, putative, expressedLOC_Os01g03050 -0.712 0.043 fruit protein PKIWI502, putative, expressedLOC_Os01g64120 -3.921 0.02 2Fe-2S iron-sulfur cluster binding domain containing protein, expressedLOC_Os03g11450 -0.698 0.044 expressed proteinLHC1 and PS1LOC_Os10g39150 1.593 0.023 photosystem I P subunitLHC2 LOC_Os01g52240 0.822 0.03 chlorophyll A-B binding protein, putative, expressed LOC_Os02g52650 1.379 0.025 chlorophyll A-B binding protein, putative, expressed LOC_Os07g38960 1.309 0.049 chlorophyll A-B binding protein, putative, expressed LOC_Os09g26810 2.188 0.012 chlorophyll A-B binding protein, putative, expressed
Supplementary Table 1. Differential expression of photosystem II and electron transport genes in HYR lines as classified by MapMan. The table shows gene names, expression values and putative functions.

18
Supplementary Table 2: Rice Microarray Datasets
Dataset Num
Samples Num
Groups Biological
context Genotype Description A
ffym
etri
x -
Arr
ayE
xpre
ss E-MEXP-2267 36 12
Environmental condition response
japonica cv. Amaroo Transcription profiling time course of rice germination under anaerobic conditions, aerobic to anaerobic switch and anaerobic to aerobic switch
E-MEXP-1766 15 5 Environmental
condition response
japonica cv. Amaroo Transcript abundance profiles were examined over the first 24 hours of germination in rice grown under aerobic conditions
Aff
ymet
rix
- GE
O
GSE14403 23 8 Environmental
condition response
indica cv. FL478, Pokkali, IR63731 and
IR29
Root-specific transcriptional profiling of contrasting rice genotypes in response to salinity stress
GSE4471 12 4 Environmental
condition response
japonica cv. Azucena and indica cv. Bala
Expression data from rice varieties Azucena and Bala grown in 0 and 1ppm arsenate
GSE6901 12 4 Environmental
condition response
indica cv. IR64 Expression data for stress treatment in rice seedlings
GSE10054 6 3 Environmental
condition response
indica cv. Zhenshan 97 Expression information of splicing factor OsSKIPa knock-down and overexpressed rice
GSE15448 9 3 Environmental
condition response
indica cv. IR64 Glycinebetaine-induced water-stress tolerance in codA-expressing transgenic indica rice
GSE11175 6 2 Environmental
condition response
japonica cv. Zhonghua 11
Comparison of transcriptome profile between wild-type and dst mutant plants
GSE14275 6 2 Environmental
condition response
NA Expression data for heat shock in rice seedlings
GSE6908 4 2 Environmental
condition response
japonica cv. Nipponbare
Transcript Profiling of the Aerobic and Anoxic Rice Coleoptile
GSE6893 45 15 Tissue/
Developmental stage
indica cv. IR64 Expression data for reproductive development in rice
GSE11966 10 5 Tissue/
Developmental stage
japonica cv. Zhonghua 11
Expression data from rice embryo, endosperm, root, leaf and seedling
GSE16265 10 2 Tissue/
Developmental stage
japonica cv. Nipponbare and indica
cv. 93-11
SNEP: Simultaneous detection of nucleotide and expression polymorphisms using Affymetrix GeneChip
GSE17194 4 2 Tissue/
Developmental stage
indica cv. Zhongxian 3037
Genome-wide gene expression profiling of rice Indica cultivar Zhongxian 3037 and mutant phoenix (pho) panicle
GSE9498 6 2 Tissue/
Developmental stage
japonica cv. Zhonghua 11
Global gene expression profiles of Oryza sativa wild type Zhonghua11 and mutant gif1 in filling stage
BG
I-Y
ale
- G
EO
GSE13131 168 42 Tissue/
Developmental stage
japonica cv. Nipponbare
A transcriptome atlas of rice cell types uncovers cellular, functional and developmental hierarchies

19
Supplementary Table 3 List of Primers used for Chip-qPCR Os03g55090 F TGTTAAGAAATAATAATAAGATCT
Os03g55090 R ACTCCAAGGTTTATATTGTCA
Os06g34070 F AGAAACAGGAACATACCAGTA
Os06g34070 R CTGGTGCGCCAGGAGGAG
Os05g07890 F TTGGATAGCTAGATGACATAATTT
Os05g07890 R GATCTATGGTTCGAATTATTT
Os09g29070 F GTGACCAAATTAATATTGCCC
Os09g29070 R AGAATGTAGGAAGACAAGGTC
Os02g47350 F TATTGGCAGATGTCTTTTAATACA
Os02g47350 R CAAGTTTAGGGACCGGTGATG
Os01g55940 F TGTCCTTTATATTATAGGTTGAT
Os01g55940 R GAGTCTGATCTTTTGGCCACA
Os07g36560 F GCAACCCGCAGTAGGCTAACA
Os07g36560 R CCTTGCTGACGTTGAATCATC
Os10g37640 F TCTCTCTCTCTCTCTCTCTCC
Os10g37640 R ACATGAGAGCGGTTGGTGAAG
Os06g48590 F ATGCACCATGCAGCACTAAGT
Os06g48590 R AGCTAGTCAGATATCGAAACGTAC
Os07g38170 F AAAGGGGCCCTAAACCTAG
Os07g38170 R TTTAATCCCATCTAAACAGGC
Os02g41550 F CCACGCGGAAATCGGGGC
Os02g41550 R CCTCACAGGCGACACGGG
Os02g36850 F CGGCCCGCCCCAACAAAG
Os02g36850 R TCGACCCCCTCGTAGCCT
Os03g21560 F GGCCAATCCCGTCTCCTTT
Os03g21560 R CGTCGGCTTATCCCCTTA
Os08g39430 F GGAGGGAGACGGGGTGGG
Os08g39430 R TCAGAAAGGGAGGAGAGCCGT
Os04g33630 F GTGGGTGGCGGTGGCAAG
Os04g33630 R CACGACGGGCCTCAGCTC
Os02g52650 F GGCGCGGTCGAACGAGCT
Os02g52650 R GTTTAGCCATTAGTCAAAGCAATC
Os07g38960 F CCAGTGATGTGACCATGGGTA
Os07g38960 R AGGACTCCGAGATCTTTCGAT
Os03g41060 F ATGCTACTACTCCTCCAAATG

20
Os03g41060 R GCACTTCACACCGTACCG
Os01g19970 F CTCCCACGTGTCACCCCCA
Os01g19970 R TGCTTTTCCTCCCCGGGC
Os01g13520 F AGCACCAAAGAAGGGGAGGAC
Os01g13520 R CTCTGCTCTCTCTCGTGTCAG
Os01g14440 F GACTCTCCCACTCTCTTCTC
Os01g14440 R TGGTCGACCTGTGGAACG
Os06g05350 F TAAGGCCATAATCTATTTAGG
Os06g05350 R TCAAGCGATCAGGAATTCAGG
Os11g29870 F GAACCTAGCTAGCTAGCTCT
Os11g29870 R AGAGCTAGCTAGCTAGGTTC

21
Supplementary Table 4 List of Primers used for Luciferase Transactivation Assay
Os10g37640 F ACGTTCTAGATCTCTCTCTCTCTCTCTCTCC
Os10g37640 R ACGTGGATCCAATTTAGTGGAGTACTACTCCGTT
Os06g48590 F ACGTTCTAGAATGCACCATGCAGCACTAAGT
Os06g48590 R ACGTGGATCCGCGCCTCTTGGCTTCTTCCTC
Os07g38170 F ACGTTCTAGACCGGACAACCTTAAGTTATTG
Os07g38170 R ACGTGGATCCTTTAATCCCATCTAAACAGGC
Os02g41550 F ACGTTCTAGACCACGCGGAAATCGGGGC
Os02g41550 R ACGTGGATCCGCGACCCAGGCTGTAACCAAA
Os03g55090 F ACGTTCTAGATGTTAAGAAATAATAATAAGATCT
Os03g55090 R ACGTGGATCCTAGGCCGGCGGCCCGAAG
Os06g34070 F ACGTTCTAGACCTTGAGGAGCTAGCCAAAAG
Os06g34070 R ACGTGGATCCCTGGTGCGCCAGGAGGAG
Os05g07890 F ACGTTCTAGACTAAATTTCGAGTCCCATCGG
Os05g07890 R ACGTGGATCCGATCTATGGTTCGAATTATTT
Os09g29070 F ACGTTCTAGAGAGCGACGGCGGGGGGCG
Os09g29070 R ACGTGGATCCAAAAAGAAGTGGGCCCATCTAGTA
Os02g47350 F ACGTAAGCTTTATTGGCAGATGTCTTTTAATACA
Os02g47350 R ACGTGGATCCTACTAACTCCATATATCTAGATCT
Os01g55940 F ACGTTCTAGATGTCCTTTATATTATAGGTTGAT
Os01g55940 R ACGTGGATCCACACGGCTCTAACTAAAAATCCAT
Os07g36560 F ACGTAAGCTTAACCGCAAGGCTAGGCTTTTG
Os07g36560 R ACGTGGATCCCCTTGCTGACGTTGAATCATC
Os01g19970 F ACGTTCTAGACTTATGCACGAGACAAGGATA
Os01g19970 R ACGTGGATCCTGCTTTTCCTCCCCGGGC
Os01g14440 F ACGTTCTAGAAAAGAACAATTCTACCTCCCA
Os01g14441 R ACGTGGATCCTGGTCGACCTGTGGAACG
Os06g05350 F ACGTTCTAGAAGGTTTCTTAATTTGTTTTCTTGA
Os06g05350 R ACGTGGATCCCGCCGGCCTGTGGCTAGG
Os02g36850 F ACGTTCTAGACTAGGGGAGCTTTAGATTTTAAGA
Os02g36850 R ACGTGGATCCTCGACCCCCTCGTAGCCT
Os03g21560 F ACGTAAGCTTTCCTTTTACTTGATTTTCTGCTG
Os03g21560 R ACGTGGATCCCGTCGGCTTATCCCCTTA
Os08g39430 F ACGTTCTAGAACCATTTCTATGAACACCTCCA
Os08g39430 R ACGTGGATCCTCAGAAAGGGAGGAGAGCCGT

22
Os04g33630 F ACGTTCTAGATCGGTGGTTTAGCTGGCGG
Os04g33630 R ACGTGGATCCCACGACGGGCCTCAGCTC
Os02g52650 F ACGTTCTAGAAAGAGTATATTAAATACCGGTGTT
Os02g52650 R ACGTAGATCTGTTTAGCCATTAGTCAAAGCAATC
Os07g38960 F ACGTTCTAGAAATGGTAAGTGTAGATTTTTGATG
Os07g38960 R ACGTGGATCCAGGACTCCGAGATCTTTCGAT
Os03g41060 F GATCTCTAGATCGATGGGAAATATGGGAGCC
Os03g41060 R GATCGGATCCATCGGTTACCTGAAGCAGCGT
Os01g13520 F GATCTCTAGAGCCAAATGTTATTCTATCTATTAC
Os01g13520 R GATCGGATCCAGAGAAGAAGAAGAAGAAGAG
Os11g29870 F GATCTCTAGAGATTATAAGACGATATGACAGGTG
Os11g29870 R GATCGGATCCGAAGTTCTCCATCTCGACCAA
luc f GATCGGATCCATGGAAGATGCCAAAAACATTAAG
luc r GATCGGTACCTTAGACGTTGATCCTGGCGCT
hlucf GATCGGATCCATGGCTTCCAAGGTGTACGAC
hluc r GATCGGTACCTTAGACGTTGATCCTGGCGCT
HYR F GATCGGATCCATGGATCGAGACGAGAGCTTG
HYR R GATCGGTACCTCAGGAATGGTTCCACAGGCT
Os11g29870 F ACGTGGATCCATGGAGAACTTCCCGATACTC
Os11g29870 R ACGTGGTACCCTACTGGAACATGTGGGAAGC
Os03g41060 F ACGTGGATCCATGAAGACCCGCCGGGCC
Os03g41060 R ACGTGGTACCTCAGGGGCACTTGGGCCT
Os01g13520 F ACGTGGATCCATGTCGTCGCAAGGAGCAGGA
Os01g13520 R ACGTGGTACCCTAAAACCCAGTCTTCTGATCCTG

23
Supplementary Table 5 Primers used for identification of Direct targets by HER qPCR analysis
Os02g36850 F CCATGTCGTGGAAGTACGTG
Os02g36850 R TCGGTCATGTTATCGACGAG
Os03g21560 F GTCGACGATCAACATGGACA
Os03g21560 R TACATCTCCCTGAAGGACGG
Os08g39430 F TCAAGGTGTACTACGGCACG
Os08g39430 R GGTTGAAGAACTCGCTGTCC
Os04g33630 F ACCGTCACCACACCAATTCT
Os04g33630 R CGTCCAGGATGTAGGTGTCC
Os02g52650 F GGCACTCTTCTTTGTCCAGC
Os02g52650 R TAGCCAACCTCCCATTCTTG
Os07g38960 F AAGATCGGCATCCTCAACAC
Os07g38960 R CAGCTCCTTGATCTTCTCCG
Os07g36560 F GGAAGGATCAGTGAGGTGGA
Os07g36560 R GCGTCACCTGAATGAAGAGG
Os09g29070 F CCGAGAATCCATCTCCGTTA
Os09g29070 R CTTCACCTGCTGCCTTTTTC
Os02g47350 F AGGAGGTCAAGTGGATGGTG
Os02g47350 R AAACCCGGTGTCTCTGTGTC
Os01g55940 F CTCTACAGCCTCCTCATGCC
Os01g55940 R ACACGTTGTAGGGGTCGAAG
Os03g55090 F GTTTGTGCCTGACCCAAGAT
Os03g55090 R GTACTCGTGAATCGTCCGGT
Os05g07890 F GTACGGCGTCTGCTACCTCT
Os05g07890 R GAGCCGAAGTAGAAGGTGGA
Os06g34070 F AGCCCGAAAAGTTTGGATTT
Os06g34070 R ATACCATCCCAGCTCCAGTG
Os10g37640 F GCTCAAGGCAGAGAAATTGG
Os10g37640 R GGGCATCGTTCTTTCTACCA
Os06g48590 F GGCTCGCACAAACAACACTA
Os06g48590 R TCCTGGAAATATTGGCTTGC
Os07g38170 F AACGCCTGGCTCAAGAAGTA
Os07g38170 R AGAAGAAGGAGCGCTTGGAT
Os02g41550 F TGCACCGAGCTGTATTCTTG
Os02g41550 R CCTCCACAACCTCACCATCT

24
Os03g41060 F CGCTGCTAATGCTTCTCCTC
Os03g41060 R ACTTGGGCCTCTTCCTGG
Os06g05350 F TTTCAAGGGGAGGAGTGATG
Os06g05350 R CCTAGTGTACGCCCGTGAAT
Os01g13520 F TCTGCAGTGGTCAGGTTCTG
Os01g13520 R TCTTCTCATGCTGTTGTGGC
Os01g19970 F GGTCTCACATCAGATGGGCT
Os01g19970 R CCACTCTCTGCAGAAGACCC
Os01g14440 F AGGACCAAGAACGTGGTGAC
Os01g14440 R CTTCCTCATGTTGGCATCCT
Os11g29870 F GGCCGTCAAGAACAACAAAT
Os11g29870 R TGAGGATGTGCTCGAAGTTG