choices for better journeys: summary report of …...better availability and reliability, would be...
TRANSCRIPT
Produced by the Cambridgeshire Research Group
Choices for Better Journeys: Summary Report of Engagement Findings Final Draft
May 2019
2
‘Cambridgeshire Research Group’ is the brand name for Cambridgeshire County Council’s Research function based within the Business Intelligence Service. As well as supporting the County Council we take on a range of work commissioned by other public sector bodies both within Cambridgeshire and beyond.
All the output of the team and that of our partners is published on our dedicated website
www.cambridgeshireinsight.org.uk
For more information about the team phone 01223 715300
Document Details
Title: Choices for Better Journeys: Summary Report of Engagement Findings
Date Created: 29/04/2019
Description:
Produced by: Cambridgeshire County Council Business Intelligence Service
On behalf of: Greater Cambridgeshire Partnership
Geographic Coverage: Cambridgeshire
Format: PDF
Key Contact [email protected]
Status: Final Draft
Usage Statement: This product is the property of the Research and Performance Team, Cambridgeshire County Council. If you wish to reproduce this document either in whole, or in part, please acknowledge the source and the author(s).
Disclaimer: Cambridgeshire County Council, while believing the information in this publication to be correct, does not guarantee its accuracy nor does the County Council accept any liability for any direct or indirect loss or damage or other consequences, however arising from the use of such information supplied.
3
Contents
EXECUTIVE SUMMARY ............................................................................................................... 5
Who We Spoke To .................................................................................................................. 5
Demographics .................................................................................................................... 5
Primary Journey ................................................................................................................. 5
Key Findings ........................................................................................................................... 6
INTRODUCTION .......................................................................................................................... 8
Consultation and Analysis Methodology ................................................................................... 9
Consultation Strategy ............................................................................................................ 9
Identification of the Audience ........................................................................................... 9
Design of Consultation Materials ....................................................................................... 9
Design of Consultation Questions...................................................................................... 9
Analysis ............................................................................................................................ 10
Quality Assurance ................................................................................................................ 11
Data Integrity ................................................................................................................... 11
ENGAGEMENT CONTEXT .......................................................................................................... 12
Respondent Profile .............................................................................................................. 12
Respondent’s gender ....................................................................................................... 12
Respondent’s age ............................................................................................................. 13
Respondent’s employment status ................................................................................... 14
Respondent’s disability status ......................................................................................... 14
Geographical breakdown ................................................................................................. 15
Journey Profile ..................................................................................................................... 16
Reason for most frequent journey .................................................................................. 16
Journey combination ....................................................................................................... 17
Start and finish destination .............................................................................................. 18
Time of most frequent journey ........................................................................................ 19
Mode of transport ........................................................................................................... 21
PUBLIC TRANSPORT ................................................................................................................. 23
Support for the vision to significantly improve public transport ........................................ 23
Importance of public transport network elements ............................................................. 24
OPTION SPECIFICS .................................................................................................................... 26
Public transport improvement funding ideas ...................................................................... 26
Funding ideas - variation by key group ............................................................................ 28
4
Increases to parking charges ............................................................................................... 35
Parking charges – variation by key group ........................................................................ 36
Changes to vehicle access .................................................................................................... 39
Changes to vehicle access – variation by key group ........................................................ 40
A system of flexible or pollution charging ........................................................................... 43
Flexible or pollution charging – variation by key group .................................................. 44
JOURNEYS BY CAR .................................................................................................................... 47
Awareness of current ‘other’ travel options ....................................................................... 47
Factors which may change respondent’s most important journey ..................................... 48
SOCIAL MEDIA AND EVENTS .................................................................................................... 51
STAKEHOLDERS ........................................................................................................................ 52
APPENDIX 1 .............................................................................................................................. 53
Journey type ..................................................................................................................... 56
Combining journey ........................................................................................................... 56
Journey start and end point ............................................................................................. 56
Outward journey time ..................................................................................................... 56
Inward journey time ........................................................................................................ 57
Flexibility in journey time ................................................................................................ 57
Mode of transport ........................................................................................................... 57
Combination with other modes of transport .................................................................. 58
Q10: Importance of public transport network elements ................................................ 58
Q11: Extent to which supportive of the vision to improve public transport .................. 59
Q12: Ranking of funding ideas ......................................................................................... 60
Q12: Ranking of funding ideas – Travel to work internally respondents ........................ 61
Q12: Ranking of funding ideas – Travel to work external to internal respondents ........ 61
Q12: Ranking of funding ideas – Travel to work car drivers ............................................ 62
Q12: Ranking of funding ideas – Travel to work cyclists ................................................. 62
Q12: Ranking of funding ideas – Travel to work public transport ................................... 63
Q12: Ranking of funding ideas – Travel for other journeys ............................................. 63
Q13: Average scores of support if increases were made to parking charges ................. 64
Q14: Average scores of support if changes were made to vehicle access ...................... 65
Q15: Average scores support if flexible/pollution charging was introduced .................. 66
Q16: Awareness of ‘other’ transport options amongst car drivers ................................. 67
Q17: Factors which may change the way car drivers make their journey ...................... 67
5
EXECUTIVE SUMMARY
Who We Spoke To
Between 25 February and 31 March 2019 the Greater Cambridge Partnership held an
extensive engagement exercise to obtain feedback from the public and stakeholders on the
transformation and funding of public transport.
Demographics Gender distribution in the sample was fairly even with 46% males and 49% females. When
compared to the Cambridgeshire population, a slightly higher proportion of respondents
were of working age with a slightly lower proportion aged over 75 (likely linked to the
targeting of the engagement towards those working in Cambridge).
Primary Journey
40%
11%
2%
6%
2%
0%
24%
1%
4%
6%
1%
0%
1%
0% 10% 20% 30% 40% 50%
Car (as a lone driver)
Car (shared with other…
Guided bus
Local bus service
Park & Ride (bus)
Park & Ride (cycle)
Bicycle
Cargo bike
Walking
Train
Motorbike
Other motor vehicle
Other
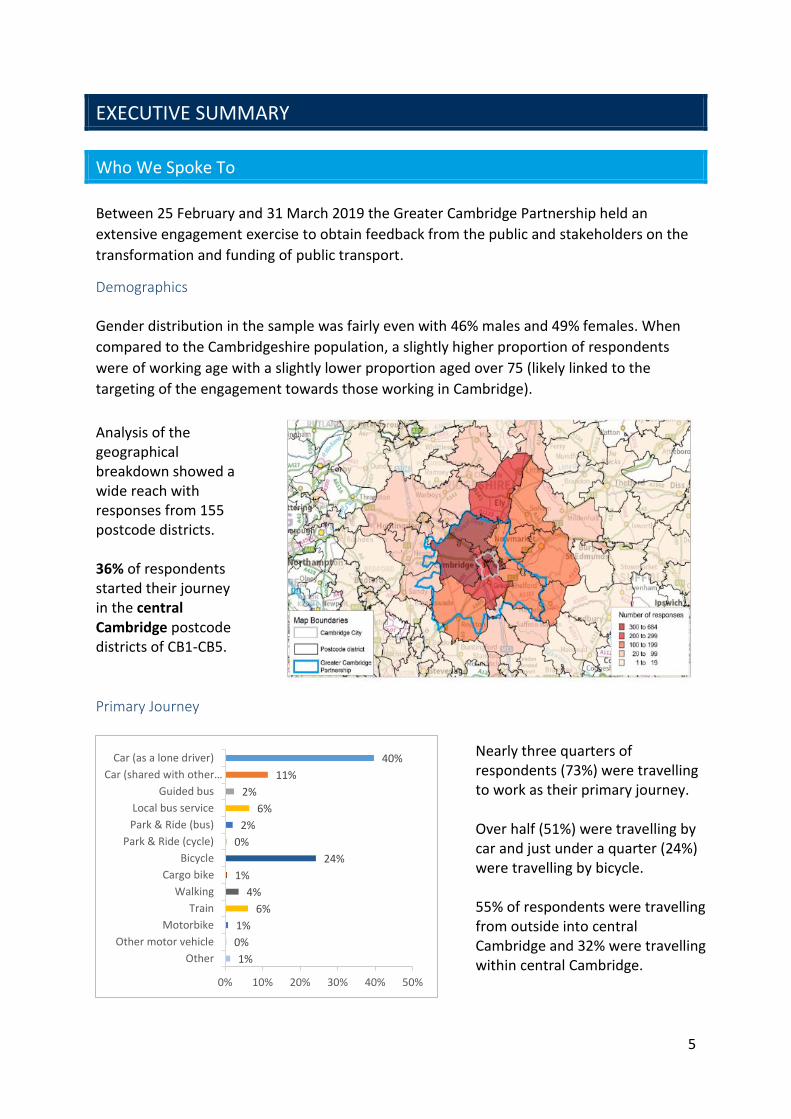
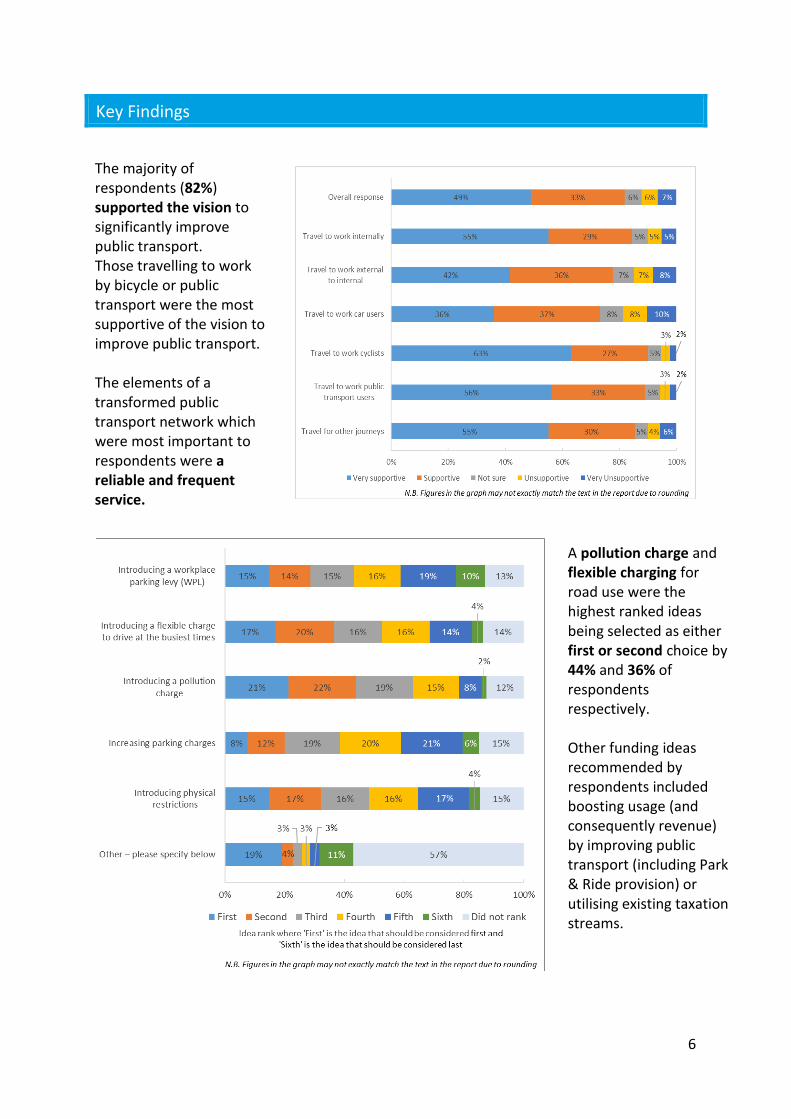
Analysis of the geographical breakdown showed a wide reach with responses from 155 postcode districts. 36% of respondents started their journey in the central Cambridge postcode districts of CB1-CB5.
Nearly three quarters of respondents (73%) were travelling to work as their primary journey. Over half (51%) were travelling by car and just under a quarter (24%) were travelling by bicycle. 55% of respondents were travelling from outside into central Cambridge and 32% were travelling within central Cambridge.
6
Key Findings
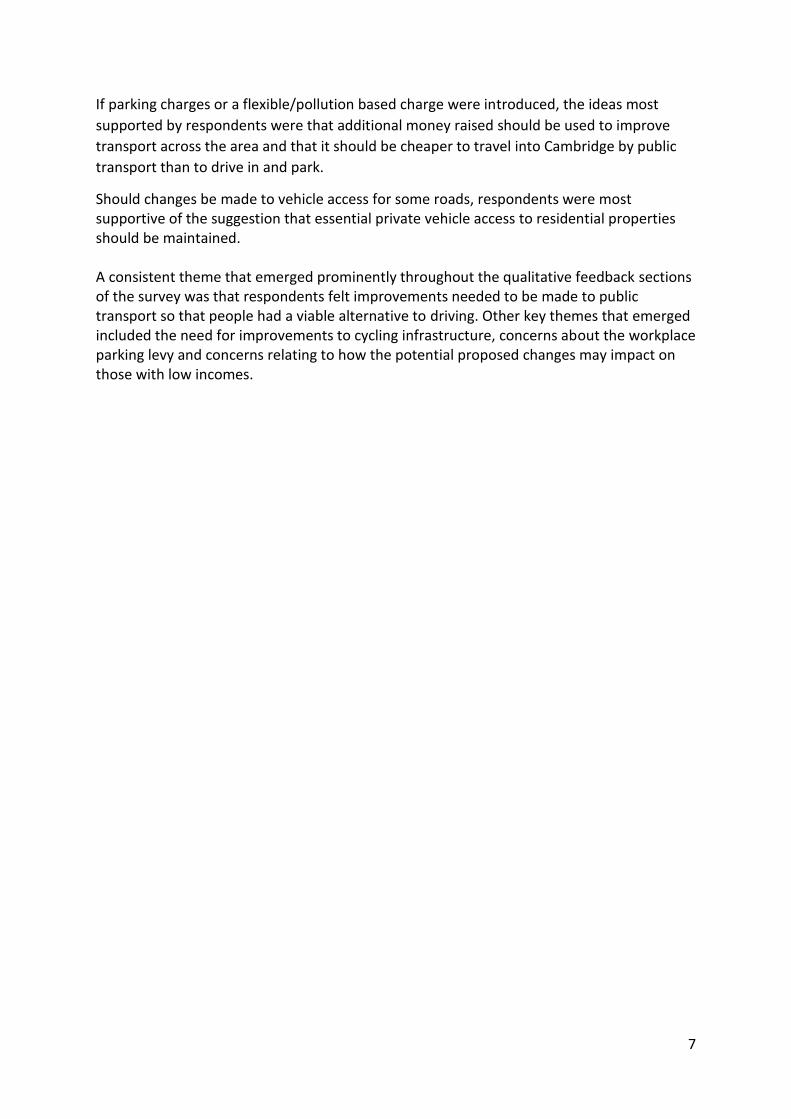
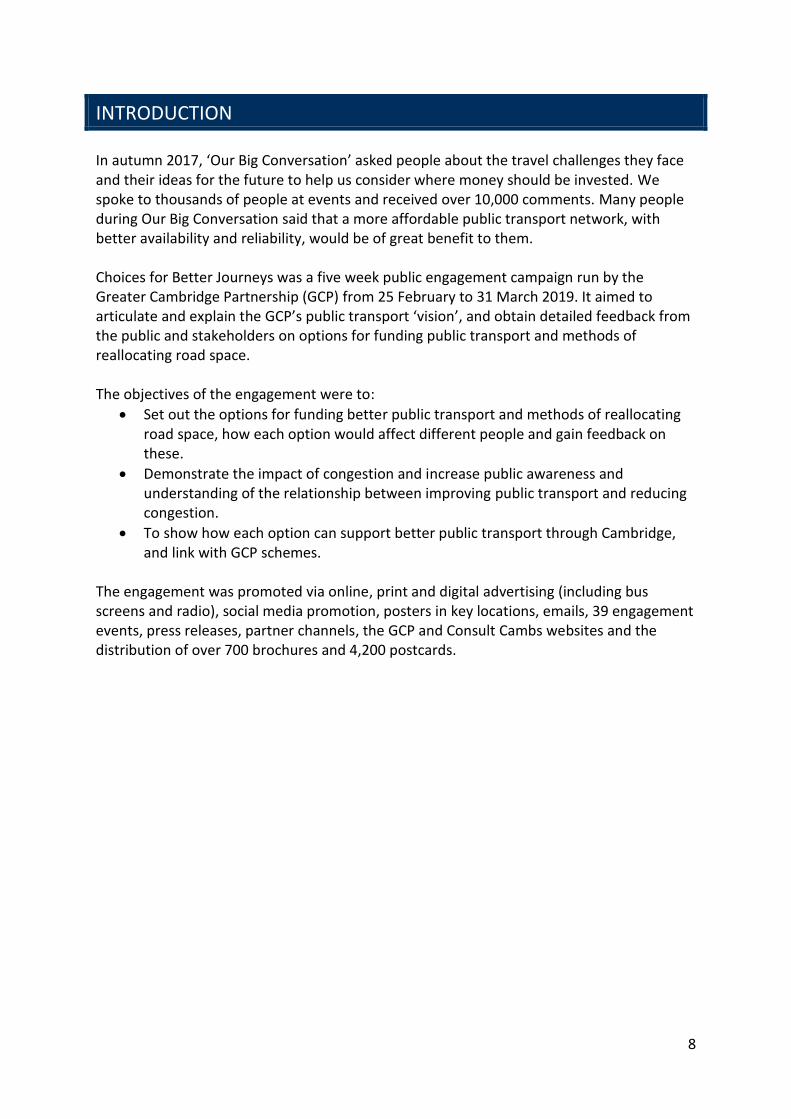
A pollution charge and flexible charging for road use were the highest ranked ideas being selected as either first or second choice by 44% and 36% of respondents respectively. Other funding ideas recommended by respondents included boosting usage (and consequently revenue) by improving public transport (including Park & Ride provision) or utilising existing taxation streams.
The majority of respondents (82%) supported the vision to significantly improve public transport. Those travelling to work by bicycle or public transport were the most supportive of the vision to improve public transport. The elements of a transformed public transport network which were most important to respondents were a reliable and frequent service.
7
If parking charges or a flexible/pollution based charge were introduced, the ideas most
supported by respondents were that additional money raised should be used to improve
transport across the area and that it should be cheaper to travel into Cambridge by public
transport than to drive in and park.
Should changes be made to vehicle access for some roads, respondents were most supportive of the suggestion that essential private vehicle access to residential properties should be maintained. A consistent theme that emerged prominently throughout the qualitative feedback sections of the survey was that respondents felt improvements needed to be made to public transport so that people had a viable alternative to driving. Other key themes that emerged included the need for improvements to cycling infrastructure, concerns about the workplace parking levy and concerns relating to how the potential proposed changes may impact on those with low incomes.
8
INTRODUCTION In autumn 2017, ‘Our Big Conversation’ asked people about the travel challenges they face and their ideas for the future to help us consider where money should be invested. We spoke to thousands of people at events and received over 10,000 comments. Many people during Our Big Conversation said that a more affordable public transport network, with better availability and reliability, would be of great benefit to them. Choices for Better Journeys was a five week public engagement campaign run by the Greater Cambridge Partnership (GCP) from 25 February to 31 March 2019. It aimed to articulate and explain the GCP’s public transport ‘vision’, and obtain detailed feedback from the public and stakeholders on options for funding public transport and methods of reallocating road space. The objectives of the engagement were to:
Set out the options for funding better public transport and methods of reallocating road space, how each option would affect different people and gain feedback on these.
Demonstrate the impact of congestion and increase public awareness and understanding of the relationship between improving public transport and reducing congestion.
To show how each option can support better public transport through Cambridge, and link with GCP schemes.
The engagement was promoted via online, print and digital advertising (including bus screens and radio), social media promotion, posters in key locations, emails, 39 engagement events, press releases, partner channels, the GCP and Consult Cambs websites and the distribution of over 700 brochures and 4,200 postcards.
9
Consultation and Analysis Methodology
Consultation Strategy
The strategy for the Choices for Better Journeys survey was designed by the GCP communications team. The survey was developed in collaboration with Cambridge Ahead and was also delivered in association with Cambridge Network, Cambridgeshire Chambers of Commerce and Cambridge BID.
Identification of the Audience The consultation was open for anyone to contribute to. The key target audience were individuals or organisations that are interested because they live and travel in the areas that the scheme may affect. Through Cambridge Ahead (a partnership of local employers), Cambridge Network, Cambridgeshire Chambers of Commerce and Cambridge BID, the materials and survey reached out to a significant number of people working in Cambridge. Design of Consultation Materials It was identified that the audience for the engagement required a great deal of detailed information upon which to base their responses. So whilst the key consultation questions were relatively straight forward (people were asked to provide details of their most frequent Cambridge journey, express how important elements of a public transport were to them, rank potential funding ideas and to express how far they supported a range of options for making changes to transport within the Cambridge area), a twelve-page information document was produced and supplemented with additional information available online on the GCP and Consult Cambs websites and at key locations. This document explained the GCP’s strategy and discussed the reasons why changes to the transport network in Greater Cambridge were being considered. It also provided detailed information on each of the options to enable residents to understand the options and compare the pros and cons.
Design of Consultation Questions The engagement questions themselves were designed to be neutral and clear to understand. For the first section of the survey there was a focus on questions relating to respondents’ most frequent Cambridge journey, before moving onto questions relating to the overall vision of improving public transport and potential funding ideas. The next set of questions focused on specific options for funding and making changes to the transport network and the final section of the survey focused on multiple choice questions relating to respondents’ personal details, allowing comparison between groups. The main tools for gathering comments were an online survey and a paper return survey which was available on request. It was recognised that online engagement, whilst in theory
10
available to all residents, could potentially exclude those without easy access to the internet. Events were held to collect responses face to face and other forms of response e.g. detailed written submissions and social media comments were also received and have been incorporated into the analysis of the feedback. The survey included the opportunity for ‘free-text’ responses and the analysis approach taken has enabled an understanding of sentiment as well as the detailed points expressed.
Analysis The strategy for analysis of the consultation was as follows:
An initial quality assurance review of the data was conducted and a review with the
engagement team carried out to identify any issues or changes that occurred during
the consultation process.
A set of frequencies were then produced and checks made against the total number
of respondents for each question and the consultation overall. A basic sense check of
the data was made at this point with issues such as checking for duplicate entries,
data entry errors and other quality assurance activities taking place.
o Duplicate Entries. Measures were in place to avoid analysing duplicated
entries. The online survey software collects the timestamp of entries so
patterns of deliberate duplicate entries can be spotted and countered.
o Partial Entries. The system records all partial entries as well as those that
went through to completion (respondent hit submit). These are reviewed
separately and in a few cases, where a substantial response has been made
(as opposed to someone just clicking through), then these are added to the
final set for analysis.
o Within the analysis a search for any unusual patterns within the responses
was carried out, such as duplicate or ‘cut and paste’ views being expressed
on proposals.
Closed questions (tick box) are then analysed using quantitative methods which are
then presented in the final report through charts, tables and descriptions of key
numerical information.
Data was also cross-tabulated where appropriate, for example, to explore how
respondents with different journey types answered questions. Characteristic data
was then used to provide a general overview of the ‘reach’ of the consultation in
terms of input from people of different socio-economic status and background.
Free-text questions were analysed using qualitative methods, namely through
thematic analysis. Key themes were identified using specialist software and then
responses tagged with these themes (multiple tags can be given to the same
11
response). At this stage totals of tagged themes are created and the themes with the
most tags are summarised in the final report. Comment themes are listed in order of
the number of comments received, from most to least.
The final report is then written to provide an objective view of the results of the
consultation.
Quality Assurance
Data Integrity To ensure data integrity was maintained, checks were performed on the data.
A visual check of the raw data showed no unusual patterns. There were no large blocks of identical answers submitted at a similar time.
Date / time stamp of submissions showed no unusual patterns.
Text analysis showed no submissions of duplicate text.
12
ENGAGEMENT CONTEXT
Respondent Profile
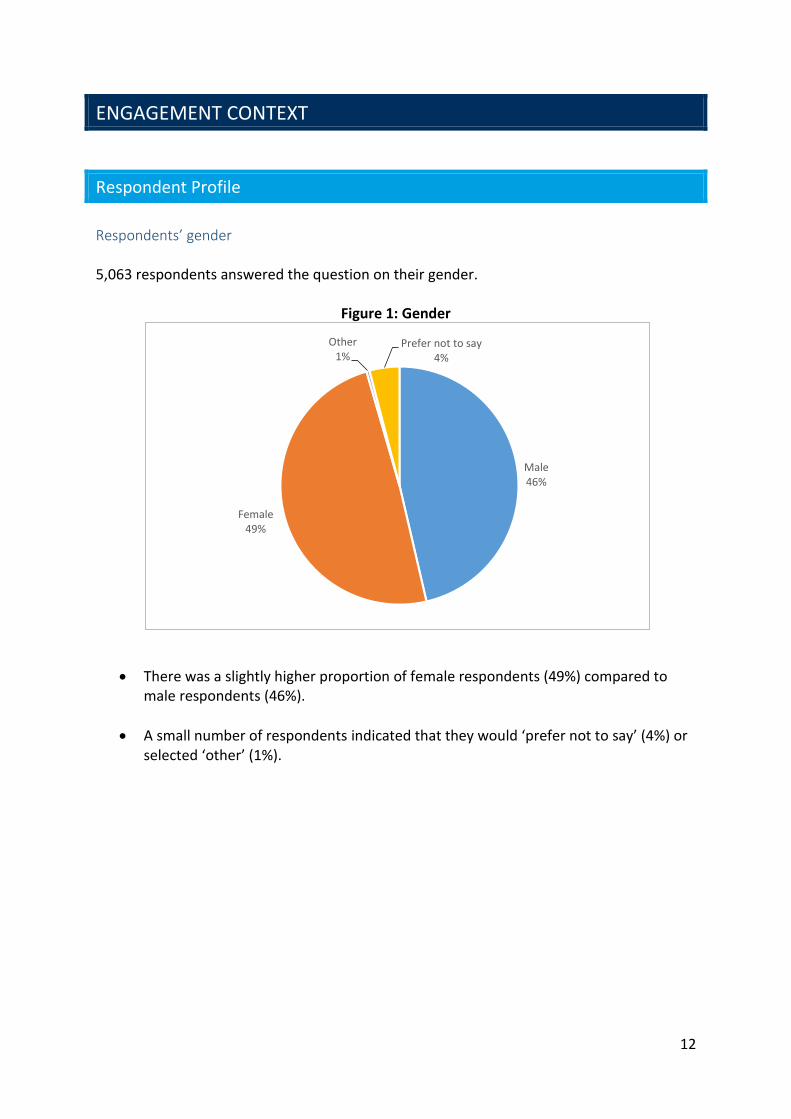
Respondents’ gender 5,063 respondents answered the question on their gender.
Figure 1: Gender
There was a slightly higher proportion of female respondents (49%) compared to male respondents (46%).
A small number of respondents indicated that they would ‘prefer not to say’ (4%) or selected ‘other’ (1%).
Male46%
Female49%
Other1%
Prefer not to say4%
13
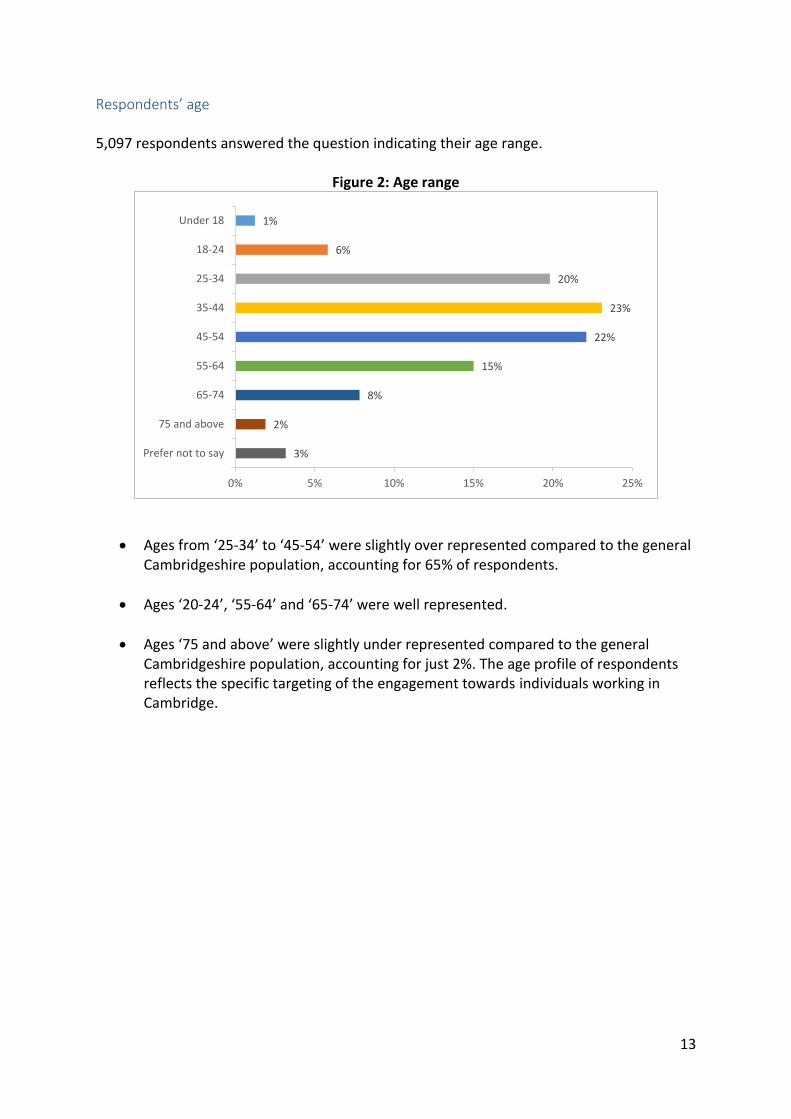
Respondents’ age 5,097 respondents answered the question indicating their age range.
Figure 2: Age range
Ages from ‘25-34’ to ‘45-54’ were slightly over represented compared to the general Cambridgeshire population, accounting for 65% of respondents.
Ages ‘20-24’, ‘55-64’ and ‘65-74’ were well represented.
Ages ‘75 and above’ were slightly under represented compared to the general Cambridgeshire population, accounting for just 2%. The age profile of respondents reflects the specific targeting of the engagement towards individuals working in Cambridge.
1%
6%
20%
23%
22%
15%
8%
2%
3%
0% 5% 10% 15% 20% 25%
Under 18
18-24
25-34
35-44
45-54
55-64
65-74
75 and above
Prefer not to say
14
Respondents’ employment status
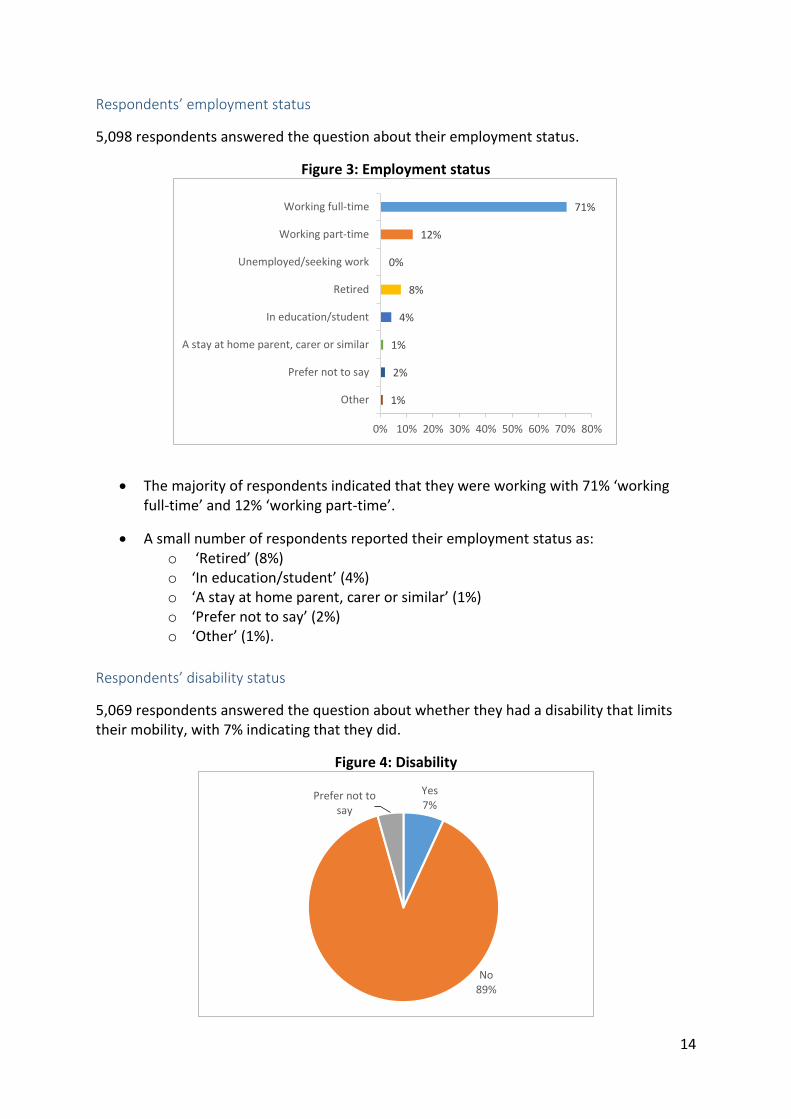
5,098 respondents answered the question about their employment status.
Figure 3: Employment status
The majority of respondents indicated that they were working with 71% ‘working full-time’ and 12% ‘working part-time’.
A small number of respondents reported their employment status as: o ‘Retired’ (8%) o ‘In education/student’ (4%) o ‘A stay at home parent, carer or similar’ (1%) o ‘Prefer not to say’ (2%) o ‘Other’ (1%).
Respondents’ disability status
5,069 respondents answered the question about whether they had a disability that limits their mobility, with 7% indicating that they did.
Figure 4: Disability
71%
12%
0%
8%
4%
1%
2%
1%
0% 10% 20% 30% 40% 50% 60% 70% 80%
Working full-time
Working part-time
Unemployed/seeking work
Retired
In education/student
A stay at home parent, carer or similar
Prefer not to say
Other
Yes7%
No89%
Prefer not to say
15
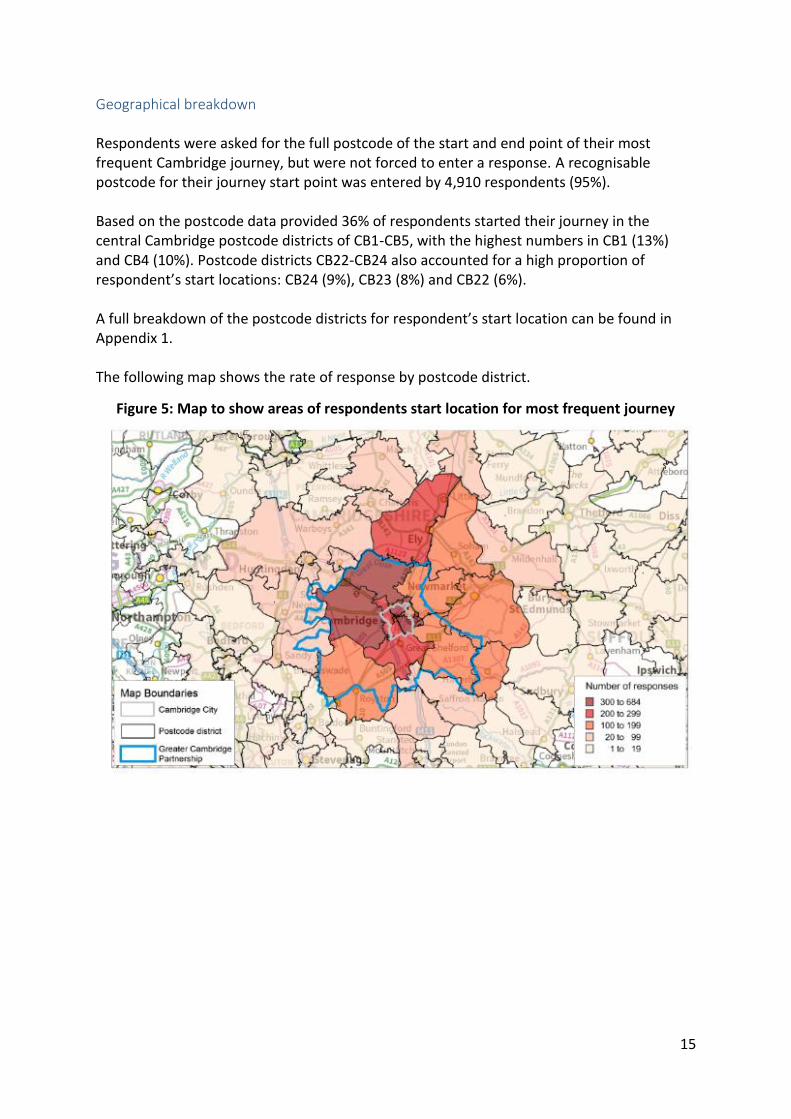
Geographical breakdown Respondents were asked for the full postcode of the start and end point of their most frequent Cambridge journey, but were not forced to enter a response. A recognisable postcode for their journey start point was entered by 4,910 respondents (95%). Based on the postcode data provided 36% of respondents started their journey in the central Cambridge postcode districts of CB1-CB5, with the highest numbers in CB1 (13%) and CB4 (10%). Postcode districts CB22-CB24 also accounted for a high proportion of respondent’s start locations: CB24 (9%), CB23 (8%) and CB22 (6%). A full breakdown of the postcode districts for respondent’s start location can be found in Appendix 1. The following map shows the rate of response by postcode district.
Figure 5: Map to show areas of respondents start location for most frequent journey
16
Journey Profile
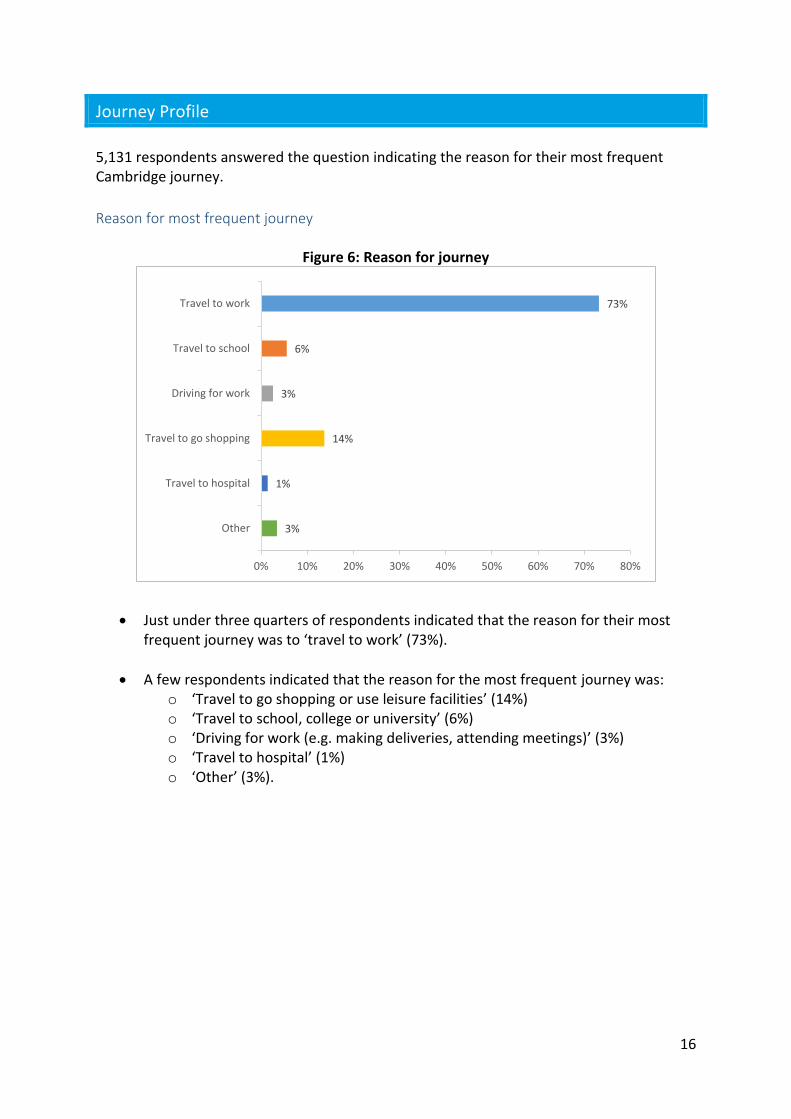
5,131 respondents answered the question indicating the reason for their most frequent Cambridge journey.
Reason for most frequent journey
Figure 6: Reason for journey
Just under three quarters of respondents indicated that the reason for their most frequent journey was to ‘travel to work’ (73%).
A few respondents indicated that the reason for the most frequent journey was: o ‘Travel to go shopping or use leisure facilities’ (14%) o ‘Travel to school, college or university’ (6%) o ‘Driving for work (e.g. making deliveries, attending meetings)’ (3%) o ‘Travel to hospital’ (1%) o ‘Other’ (3%).
73%
6%
3%
14%
1%
3%
0% 10% 20% 30% 40% 50% 60% 70% 80%
Travel to work
Travel to school
Driving for work
Travel to go shopping
Travel to hospital
Other
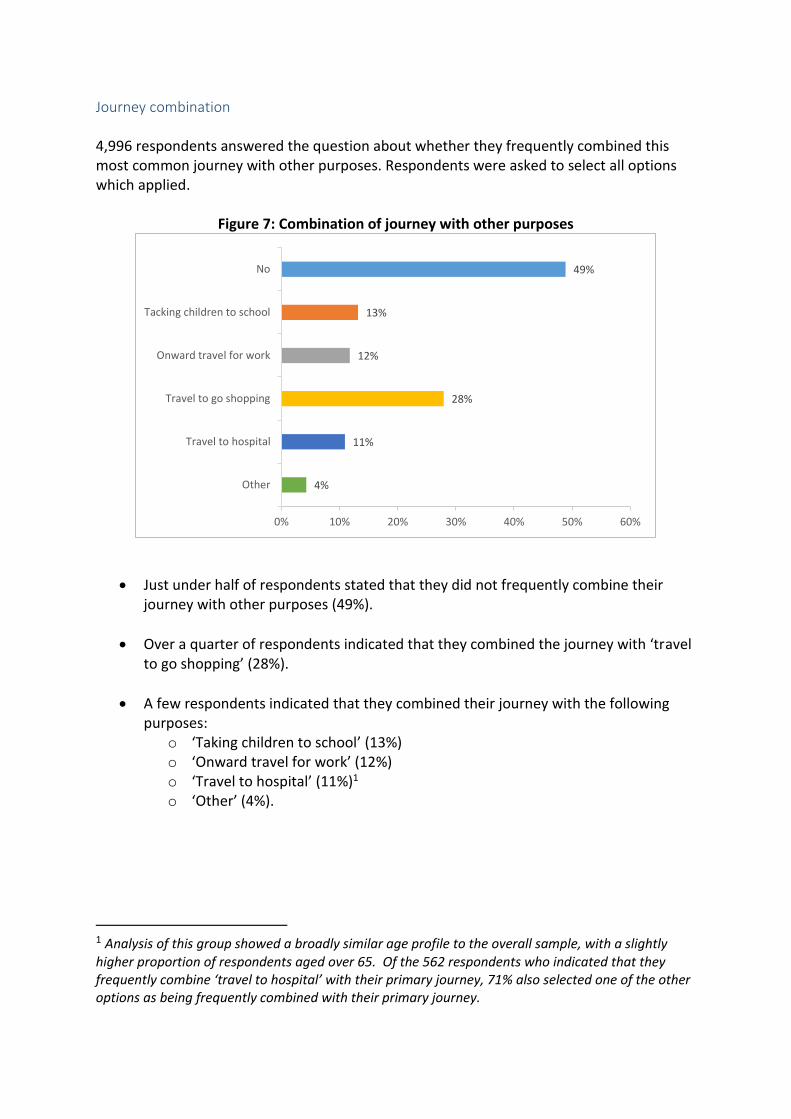
Journey combination 4,996 respondents answered the question about whether they frequently combined this most common journey with other purposes. Respondents were asked to select all options which applied.
Figure 7: Combination of journey with other purposes
Just under half of respondents stated that they did not frequently combine their journey with other purposes (49%).
Over a quarter of respondents indicated that they combined the journey with ‘travel to go shopping’ (28%).
A few respondents indicated that they combined their journey with the following purposes:
o ‘Taking children to school’ (13%) o ‘Onward travel for work’ (12%) o ‘Travel to hospital’ (11%)1 o ‘Other’ (4%).
1 Analysis of this group showed a broadly similar age profile to the overall sample, with a slightly higher proportion of respondents aged over 65. Of the 562 respondents who indicated that they frequently combine ‘travel to hospital’ with their primary journey, 71% also selected one of the other options as being frequently combined with their primary journey.
49%
13%
12%
28%
11%
4%
0% 10% 20% 30% 40% 50% 60%
No
Tacking children to school
Onward travel for work
Travel to go shopping
Travel to hospital
Other
.
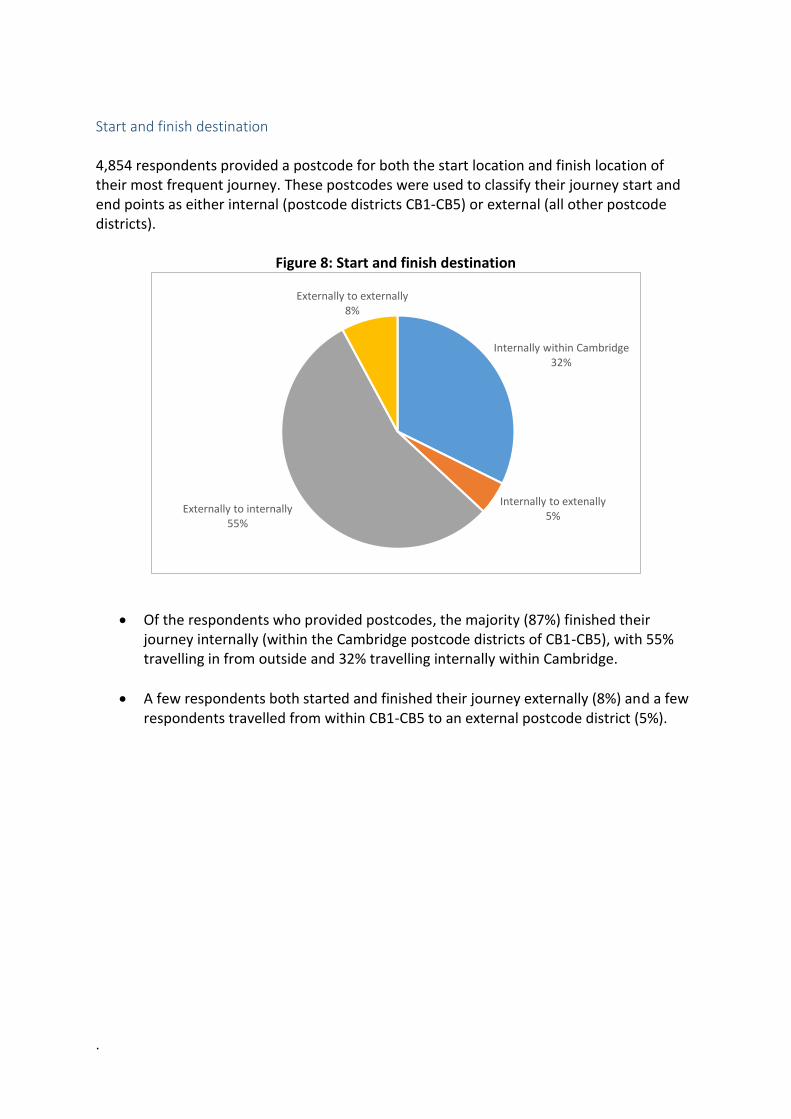
Start and finish destination 4,854 respondents provided a postcode for both the start location and finish location of their most frequent journey. These postcodes were used to classify their journey start and end points as either internal (postcode districts CB1-CB5) or external (all other postcode districts).
Figure 8: Start and finish destination
Of the respondents who provided postcodes, the majority (87%) finished their journey internally (within the Cambridge postcode districts of CB1-CB5), with 55% travelling in from outside and 32% travelling internally within Cambridge.
A few respondents both started and finished their journey externally (8%) and a few respondents travelled from within CB1-CB5 to an external postcode district (5%).
Internally within Cambridge32%
Internally to extenally5%
Externally to internally55%
Externally to externally8%
19
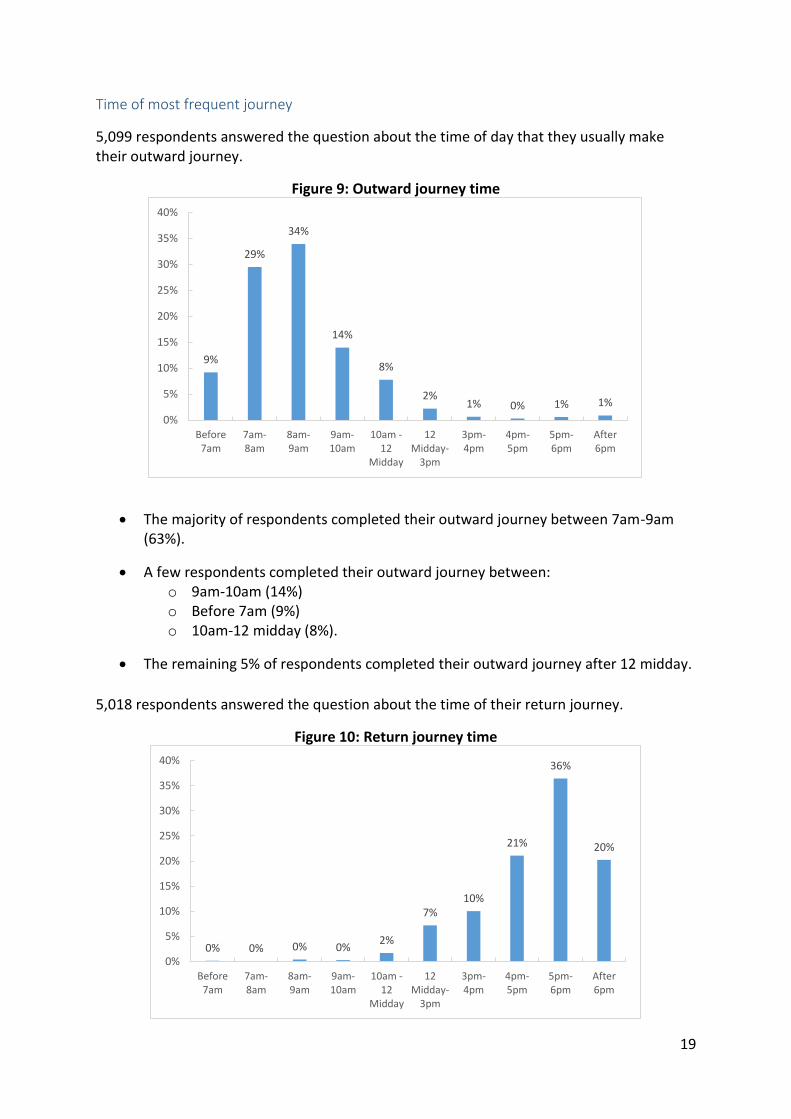
Time of most frequent journey
5,099 respondents answered the question about the time of day that they usually make their outward journey.
Figure 9: Outward journey time
The majority of respondents completed their outward journey between 7am-9am (63%).
A few respondents completed their outward journey between: o 9am-10am (14%) o Before 7am (9%) o 10am-12 midday (8%).
The remaining 5% of respondents completed their outward journey after 12 midday.
5,018 respondents answered the question about the time of their return journey.
Figure 10: Return journey time
9%
29%
34%
14%
8%
2%1% 0% 1% 1%
0%
5%
10%
15%
20%
25%
30%
35%
40%
Before7am
7am-8am
8am-9am
9am-10am
10am -12
Midday
12Midday-
3pm
3pm-4pm
4pm-5pm
5pm-6pm
After6pm
0% 0% 0% 0%2%
7%10%
21%
36%
20%
0%
5%
10%
15%
20%
25%
30%
35%
40%
Before7am
7am-8am
8am-9am
9am-10am
10am -12
Midday
12Midday-
3pm
3pm-4pm
4pm-5pm
5pm-6pm
After6pm
20
Over three quarters of respondents (78%) completed their return journey after 4pm, with 5pm-6pm being the most common journey time (36%).
A few respondents completed their return journey between: o 3pm-4pm (10%) o 12 midday-3pm (7%) o 10am-12 midday (2%).
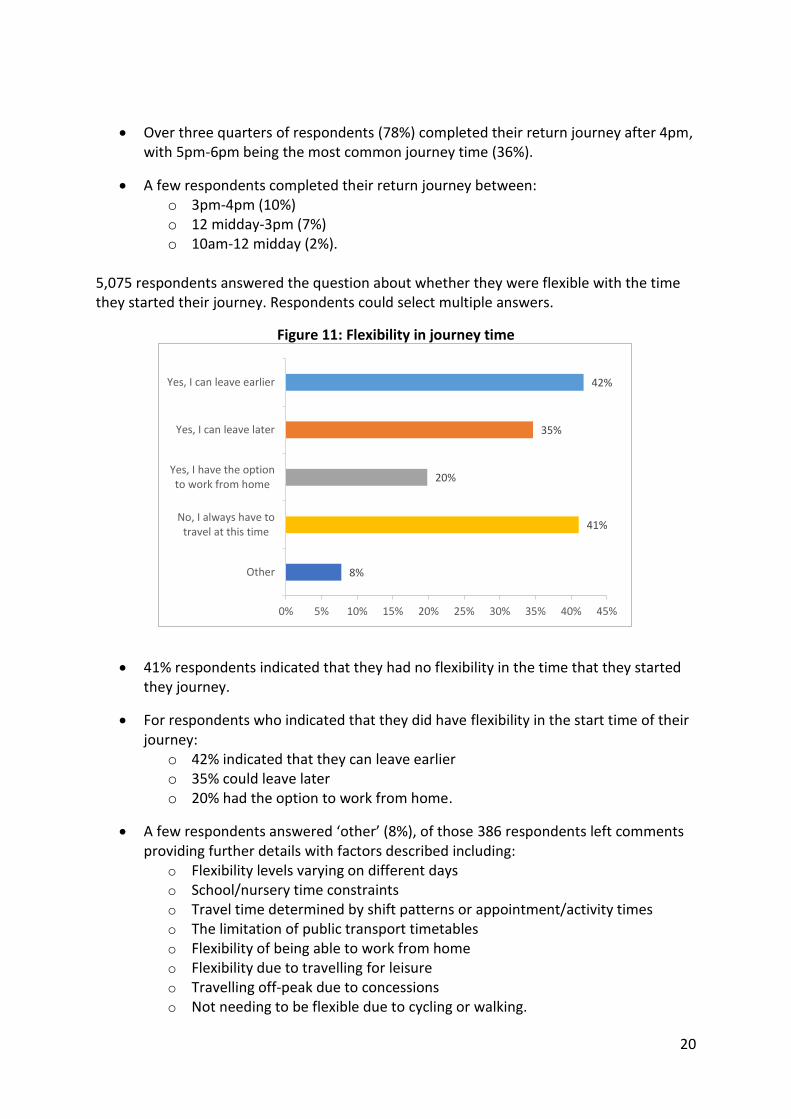
5,075 respondents answered the question about whether they were flexible with the time they started their journey. Respondents could select multiple answers.
Figure 11: Flexibility in journey time
41% respondents indicated that they had no flexibility in the time that they started they journey.
For respondents who indicated that they did have flexibility in the start time of their journey:
o 42% indicated that they can leave earlier o 35% could leave later o 20% had the option to work from home.
A few respondents answered ‘other’ (8%), of those 386 respondents left comments providing further details with factors described including:
o Flexibility levels varying on different days
o School/nursery time constraints
o Travel time determined by shift patterns or appointment/activity times
o The limitation of public transport timetables o Flexibility of being able to work from home
o Flexibility due to travelling for leisure o Travelling off-peak due to concessions o Not needing to be flexible due to cycling or walking.
42%
35%
20%
41%
8%
0% 5% 10% 15% 20% 25% 30% 35% 40% 45%
Yes, I can leave earlier
Yes, I can leave later
Yes, I have the optionto work from home
No, I always have totravel at this time
Other
21
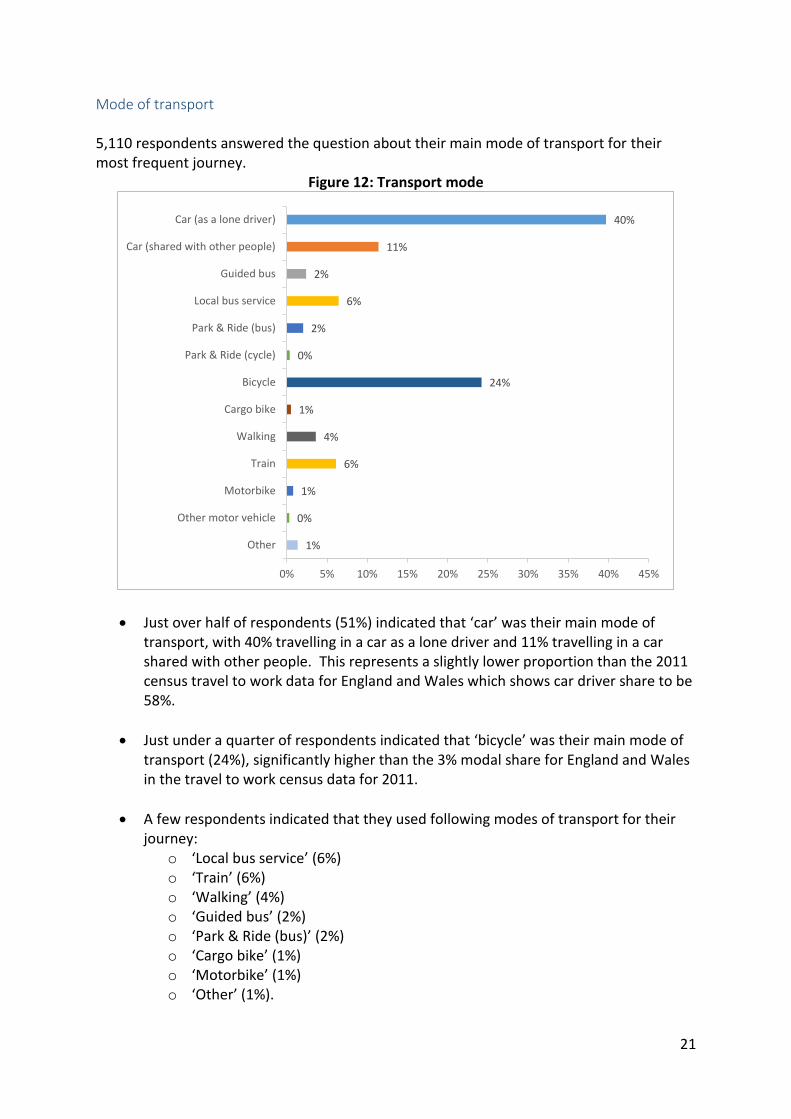
Mode of transport 5,110 respondents answered the question about their main mode of transport for their most frequent journey.
Figure 12: Transport mode
Just over half of respondents (51%) indicated that ‘car’ was their main mode of transport, with 40% travelling in a car as a lone driver and 11% travelling in a car shared with other people. This represents a slightly lower proportion than the 2011 census travel to work data for England and Wales which shows car driver share to be 58%.
Just under a quarter of respondents indicated that ‘bicycle’ was their main mode of transport (24%), significantly higher than the 3% modal share for England and Wales in the travel to work census data for 2011.
A few respondents indicated that they used following modes of transport for their journey:
o ‘Local bus service’ (6%) o ‘Train’ (6%) o ‘Walking’ (4%) o ‘Guided bus’ (2%) o ‘Park & Ride (bus)’ (2%) o ‘Cargo bike’ (1%) o ‘Motorbike’ (1%) o ‘Other’ (1%).
40%
11%
2%
6%
2%
0%
24%
1%
4%
6%
1%
0%
1%
0% 5% 10% 15% 20% 25% 30% 35% 40% 45%
Car (as a lone driver)
Car (shared with other people)
Guided bus
Local bus service
Park & Ride (bus)
Park & Ride (cycle)
Bicycle
Cargo bike
Walking
Train
Motorbike
Other motor vehicle
Other
22
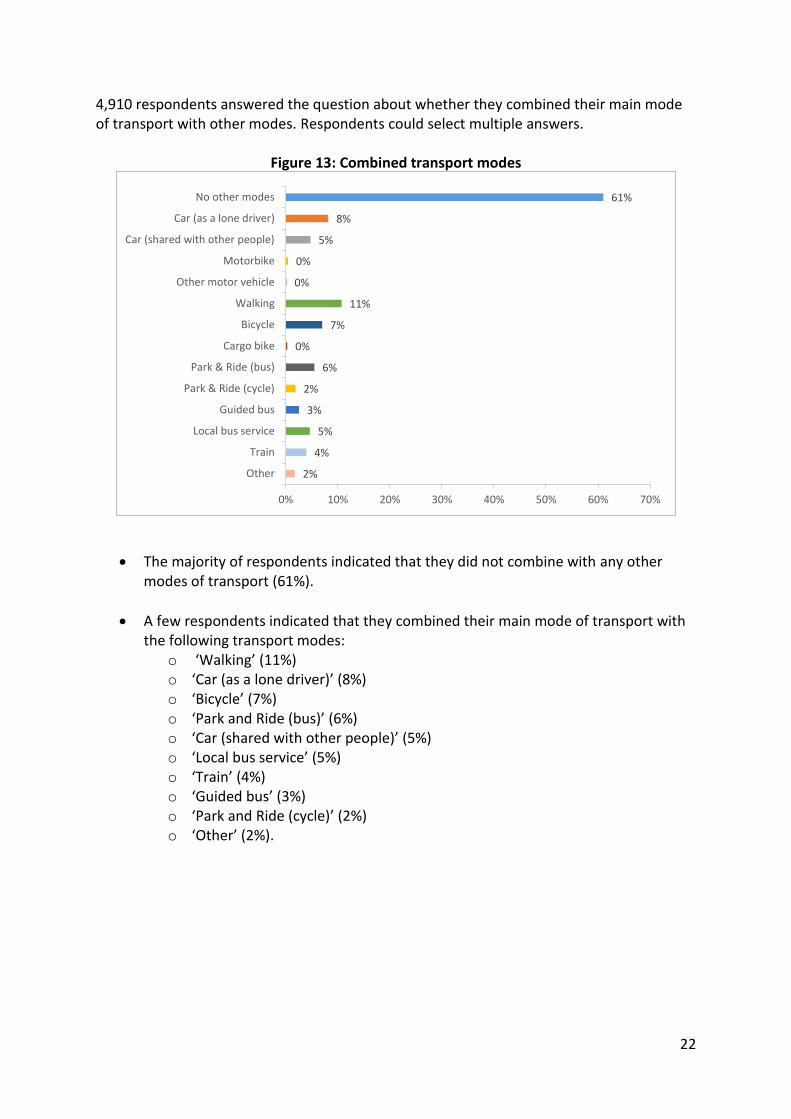
4,910 respondents answered the question about whether they combined their main mode of transport with other modes. Respondents could select multiple answers.
Figure 13: Combined transport modes
The majority of respondents indicated that they did not combine with any other modes of transport (61%).
A few respondents indicated that they combined their main mode of transport with the following transport modes:
o ‘Walking’ (11%) o ‘Car (as a lone driver)’ (8%) o ‘Bicycle’ (7%) o ‘Park and Ride (bus)’ (6%) o ‘Car (shared with other people)’ (5%) o ‘Local bus service’ (5%) o ‘Train’ (4%) o ‘Guided bus’ (3%) o ‘Park and Ride (cycle)’ (2%) o ‘Other’ (2%).
61%
8%
5%
0%
0%
11%
7%
0%
6%
2%
3%
5%
4%
2%
0% 10% 20% 30% 40% 50% 60% 70%
No other modes
Car (as a lone driver)
Car (shared with other people)
Motorbike
Other motor vehicle
Walking
Bicycle
Cargo bike
Park & Ride (bus)
Park & Ride (cycle)
Guided bus
Local bus service
Train
Other
23
PUBLIC TRANSPORT
Support for the vision to significantly improve public transport
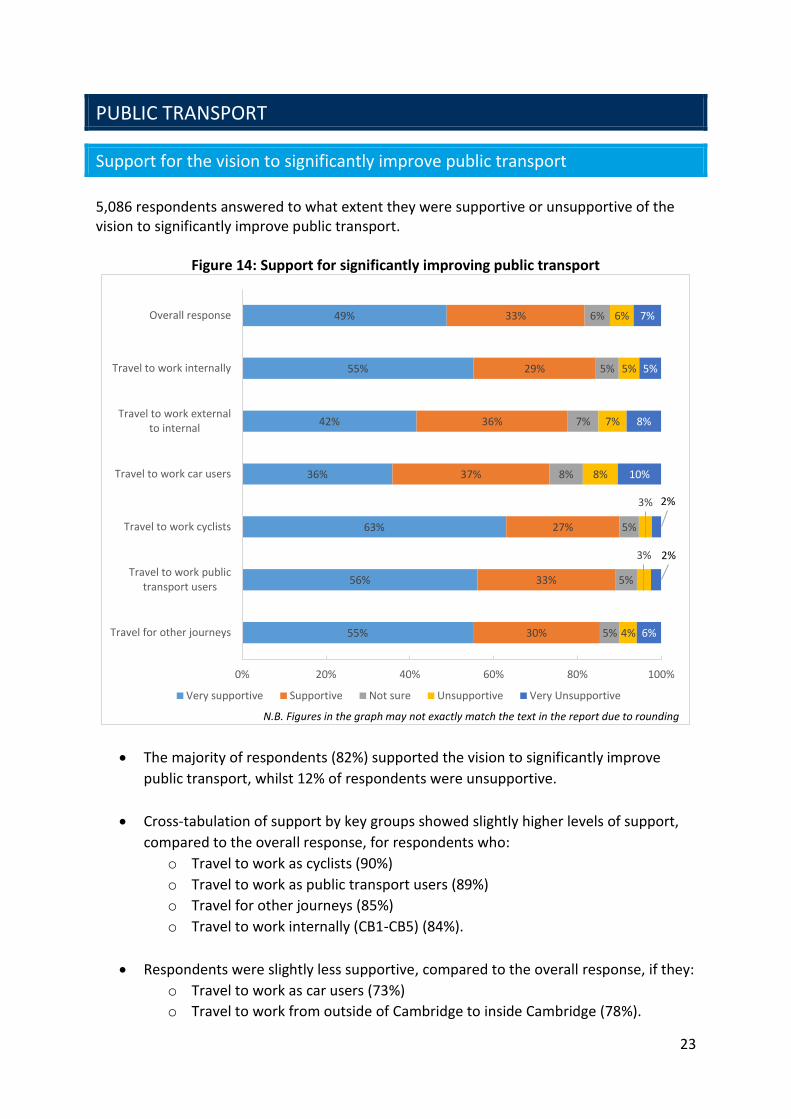
5,086 respondents answered to what extent they were supportive or unsupportive of the vision to significantly improve public transport.
Figure 14: Support for significantly improving public transport
The majority of respondents (82%) supported the vision to significantly improve
public transport, whilst 12% of respondents were unsupportive.
Cross-tabulation of support by key groups showed slightly higher levels of support,
compared to the overall response, for respondents who:
o Travel to work as cyclists (90%)
o Travel to work as public transport users (89%)
o Travel for other journeys (85%)
o Travel to work internally (CB1-CB5) (84%).
Respondents were slightly less supportive, compared to the overall response, if they:
o Travel to work as car users (73%)
o Travel to work from outside of Cambridge to inside Cambridge (78%).
49%
55%
42%
36%
63%
56%
55%
33%
29%
36%
37%
27%
33%
30%
6%
5%
7%
8%
5%
5%
5%
6%
5%
7%
8%
3%
3%
4%
7%
5%
8%
10%
2%
2%
6%
0% 20% 40% 60% 80% 100%
Overall response
Travel to work internally
Travel to work externalto internal
Travel to work car users
Travel to work cyclists
Travel to work publictransport users
Travel for other journeys
Very supportive Supportive Not sure Unsupportive Very Unsupportive
N.B. Figures in the graph may not exactly match the text in the report due to rounding
24
Importance of public transport network elements
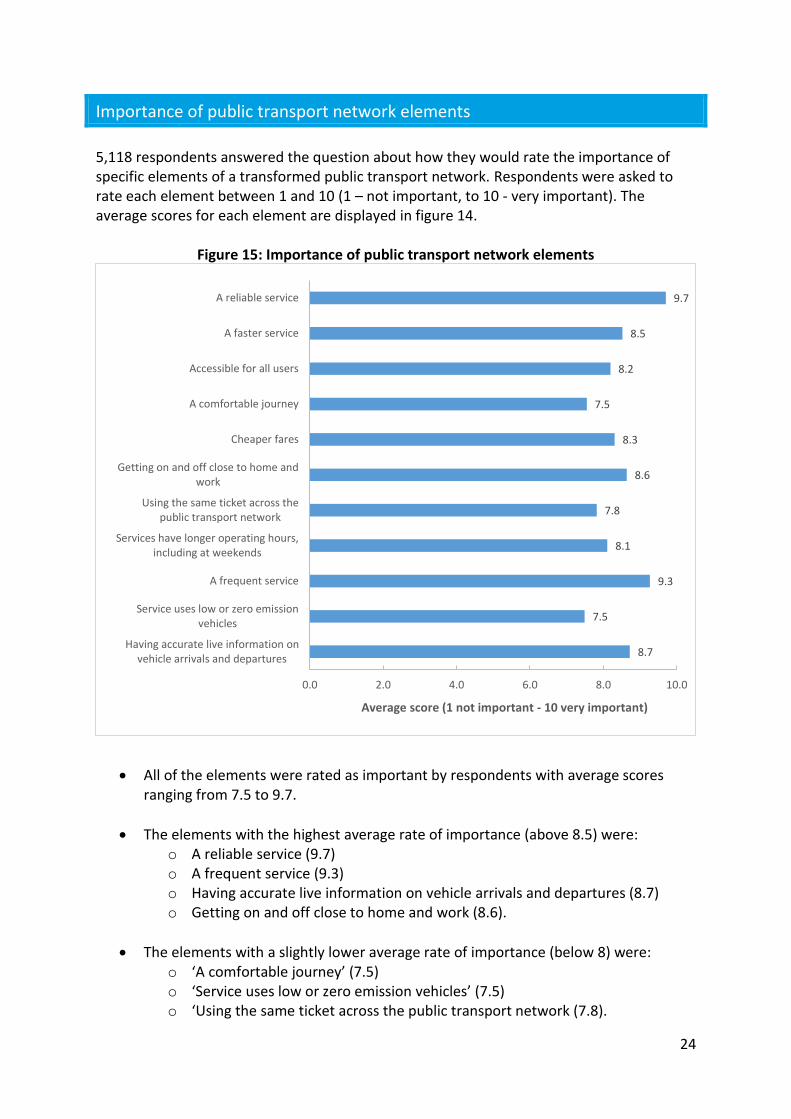
5,118 respondents answered the question about how they would rate the importance of specific elements of a transformed public transport network. Respondents were asked to rate each element between 1 and 10 (1 – not important, to 10 - very important). The average scores for each element are displayed in figure 14.
Figure 15: Importance of public transport network elements
All of the elements were rated as important by respondents with average scores ranging from 7.5 to 9.7.
The elements with the highest average rate of importance (above 8.5) were: o A reliable service (9.7) o A frequent service (9.3) o Having accurate live information on vehicle arrivals and departures (8.7) o Getting on and off close to home and work (8.6).
The elements with a slightly lower average rate of importance (below 8) were: o ‘A comfortable journey’ (7.5) o ‘Service uses low or zero emission vehicles’ (7.5) o ‘Using the same ticket across the public transport network (7.8).
9.7
8.5
8.2
7.5
8.3
8.6
7.8
8.1
9.3
7.5
8.7
0.0 2.0 4.0 6.0 8.0 10.0
A reliable service
A faster service
Accessible for all users
A comfortable journey
Cheaper fares
Getting on and off close to home andwork
Using the same ticket across thepublic transport network
Services have longer operating hours,including at weekends
A frequent service
Service uses low or zero emissionvehicles
Having accurate live information onvehicle arrivals and departures
Average score (1 not important - 10 very important)
25
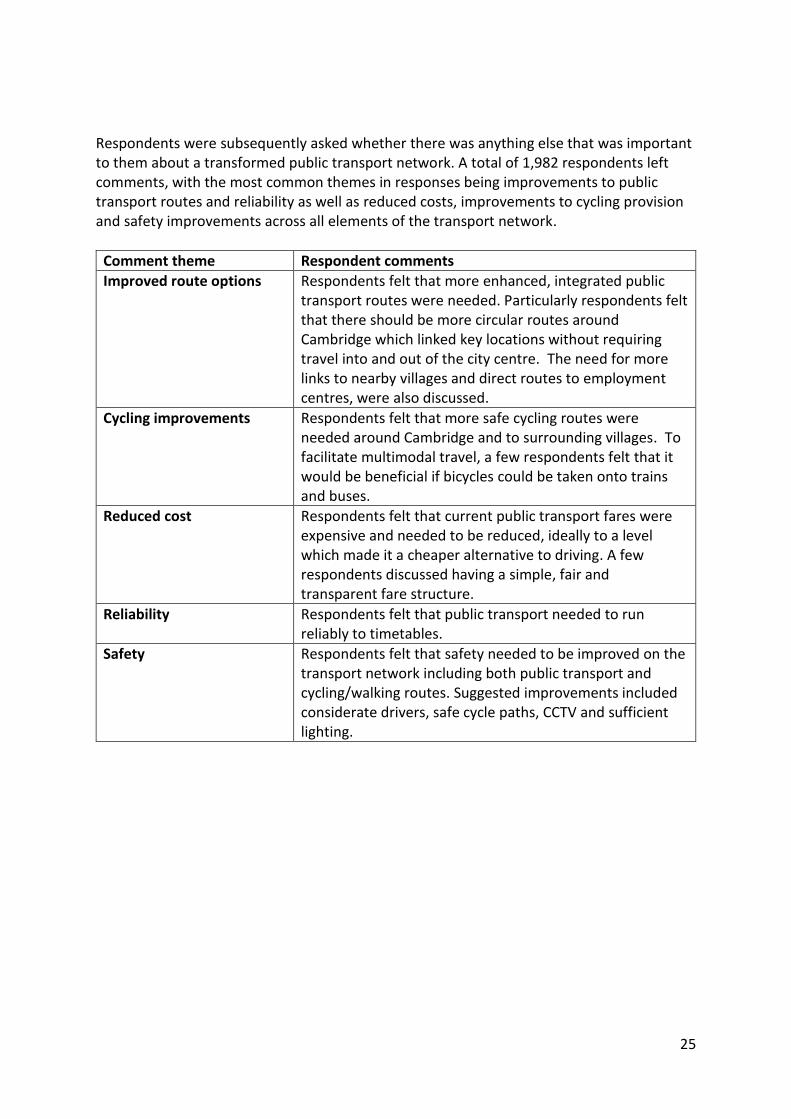
Respondents were subsequently asked whether there was anything else that was important to them about a transformed public transport network. A total of 1,982 respondents left comments, with the most common themes in responses being improvements to public transport routes and reliability as well as reduced costs, improvements to cycling provision and safety improvements across all elements of the transport network.
Comment theme Respondent comments
Improved route options Respondents felt that more enhanced, integrated public transport routes were needed. Particularly respondents felt that there should be more circular routes around Cambridge which linked key locations without requiring travel into and out of the city centre. The need for more links to nearby villages and direct routes to employment centres, were also discussed.
Cycling improvements Respondents felt that more safe cycling routes were needed around Cambridge and to surrounding villages. To facilitate multimodal travel, a few respondents felt that it would be beneficial if bicycles could be taken onto trains and buses.
Reduced cost Respondents felt that current public transport fares were expensive and needed to be reduced, ideally to a level which made it a cheaper alternative to driving. A few respondents discussed having a simple, fair and transparent fare structure.
Reliability Respondents felt that public transport needed to run reliably to timetables.
Safety Respondents felt that safety needed to be improved on the transport network including both public transport and cycling/walking routes. Suggested improvements included considerate drivers, safe cycle paths, CCTV and sufficient lighting.
26
OPTION SPECIFICS
Public transport improvement funding ideas
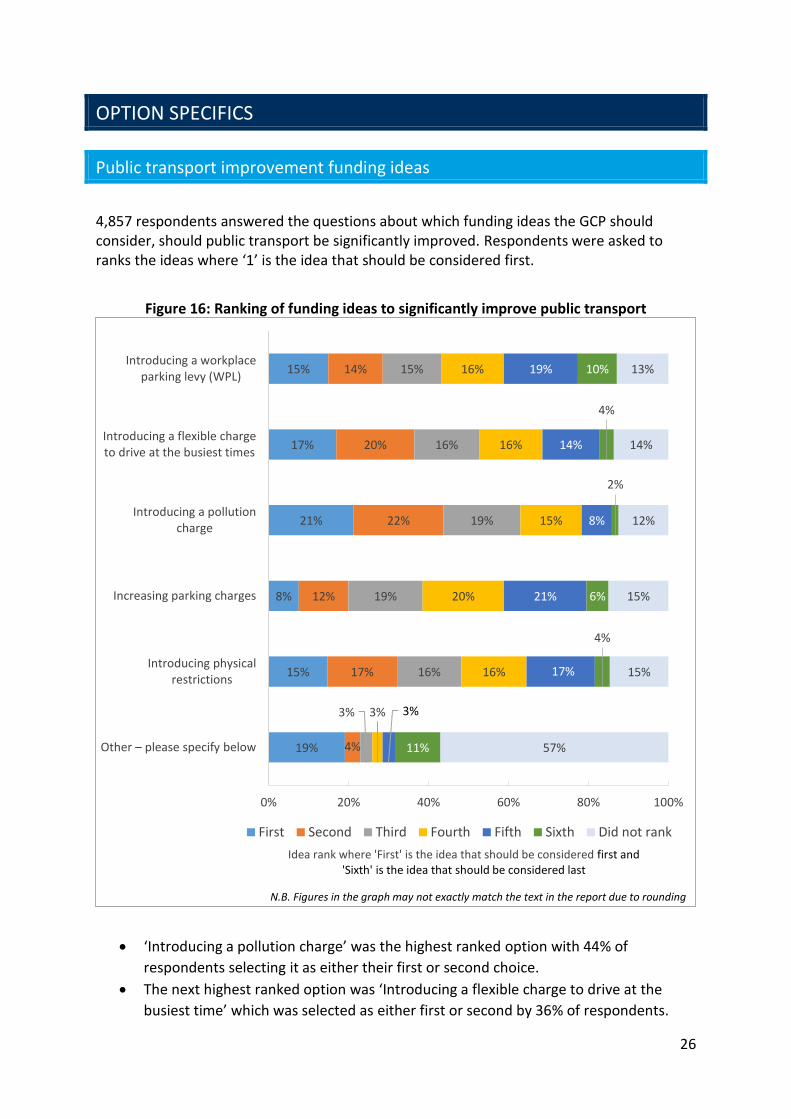
4,857 respondents answered the questions about which funding ideas the GCP should consider, should public transport be significantly improved. Respondents were asked to ranks the ideas where ‘1’ is the idea that should be considered first.
Figure 16: Ranking of funding ideas to significantly improve public transport
‘Introducing a pollution charge’ was the highest ranked option with 44% of
respondents selecting it as either their first or second choice.
The next highest ranked option was ‘Introducing a flexible charge to drive at the
busiest time’ which was selected as either first or second by 36% of respondents.
15%
17%
21%
8%
15%
19%
14%
20%
22%
12%
17%
4%
15%
16%
19%
19%
16%
3%
16%
16%
15%
20%
16%
3%
19%
14%
8%
21%
17%
3%
10%
4%
2%
6%
4%
11%
13%
14%
12%
15%
15%
57%
0% 20% 40% 60% 80% 100%
Introducing a workplaceparking levy (WPL)
Introducing a flexible chargeto drive at the busiest times
Introducing a pollutioncharge
Increasing parking charges
Introducing physicalrestrictions
Other – please specify below
First Second Third Fourth Fifth Sixth Did not rank
Idea rank where 'First' is the idea that should be considered first and 'Sixth' is the idea that should be considered last
N.B. Figures in the graph may not exactly match the text in the report due to rounding
27
‘Increasing parking charges’ was the lowest ranked option with just 20% selecting it
as first or second and over a quarter (26%) selecting it as fifth or sixth.
Less than half of respondents (43%) provided a ranking for ‘Other’, however, of
those that did a high proportion ranked this option highly with 19% of all
respondents ranking ‘Other’ as their first choice.
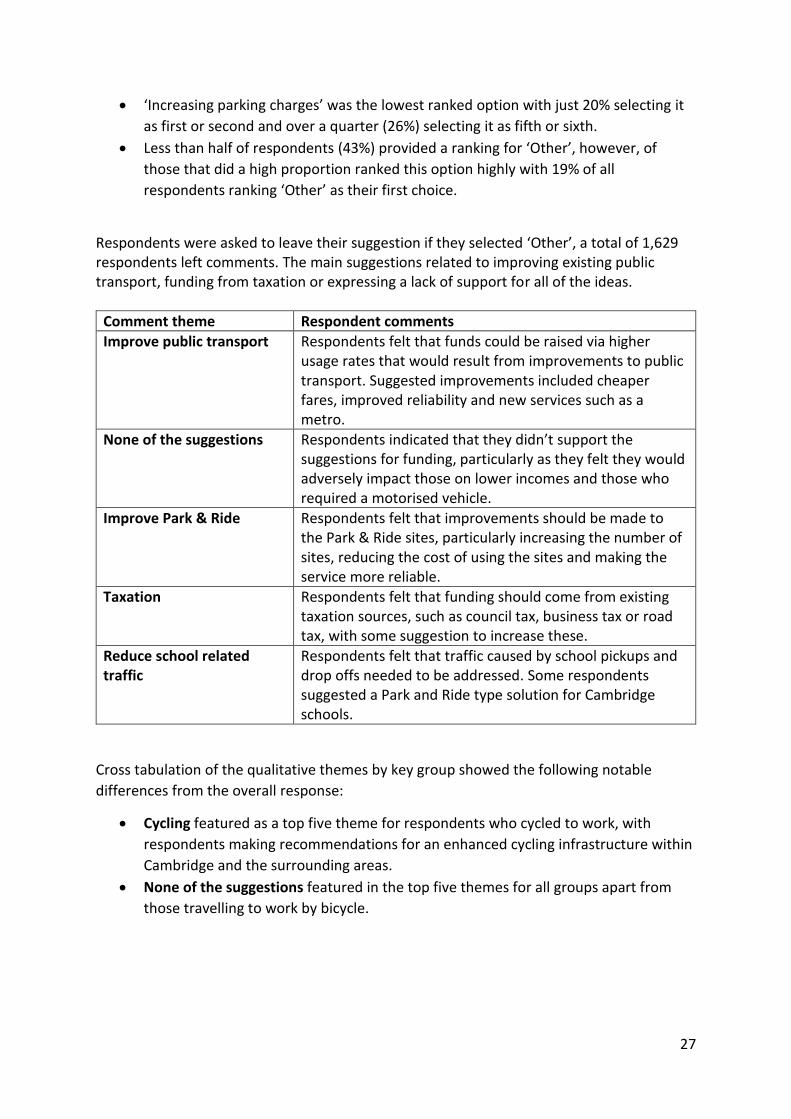
Respondents were asked to leave their suggestion if they selected ‘Other’, a total of 1,629 respondents left comments. The main suggestions related to improving existing public transport, funding from taxation or expressing a lack of support for all of the ideas.
Comment theme Respondent comments
Improve public transport Respondents felt that funds could be raised via higher usage rates that would result from improvements to public transport. Suggested improvements included cheaper fares, improved reliability and new services such as a metro.
None of the suggestions Respondents indicated that they didn’t support the suggestions for funding, particularly as they felt they would adversely impact those on lower incomes and those who required a motorised vehicle.
Improve Park & Ride Respondents felt that improvements should be made to the Park & Ride sites, particularly increasing the number of sites, reducing the cost of using the sites and making the service more reliable.
Taxation Respondents felt that funding should come from existing taxation sources, such as council tax, business tax or road tax, with some suggestion to increase these.
Reduce school related traffic
Respondents felt that traffic caused by school pickups and drop offs needed to be addressed. Some respondents suggested a Park and Ride type solution for Cambridge schools.
Cross tabulation of the qualitative themes by key group showed the following notable
differences from the overall response:
Cycling featured as a top five theme for respondents who cycled to work, with
respondents making recommendations for an enhanced cycling infrastructure within
Cambridge and the surrounding areas.
None of the suggestions featured in the top five themes for all groups apart from
those travelling to work by bicycle.
28
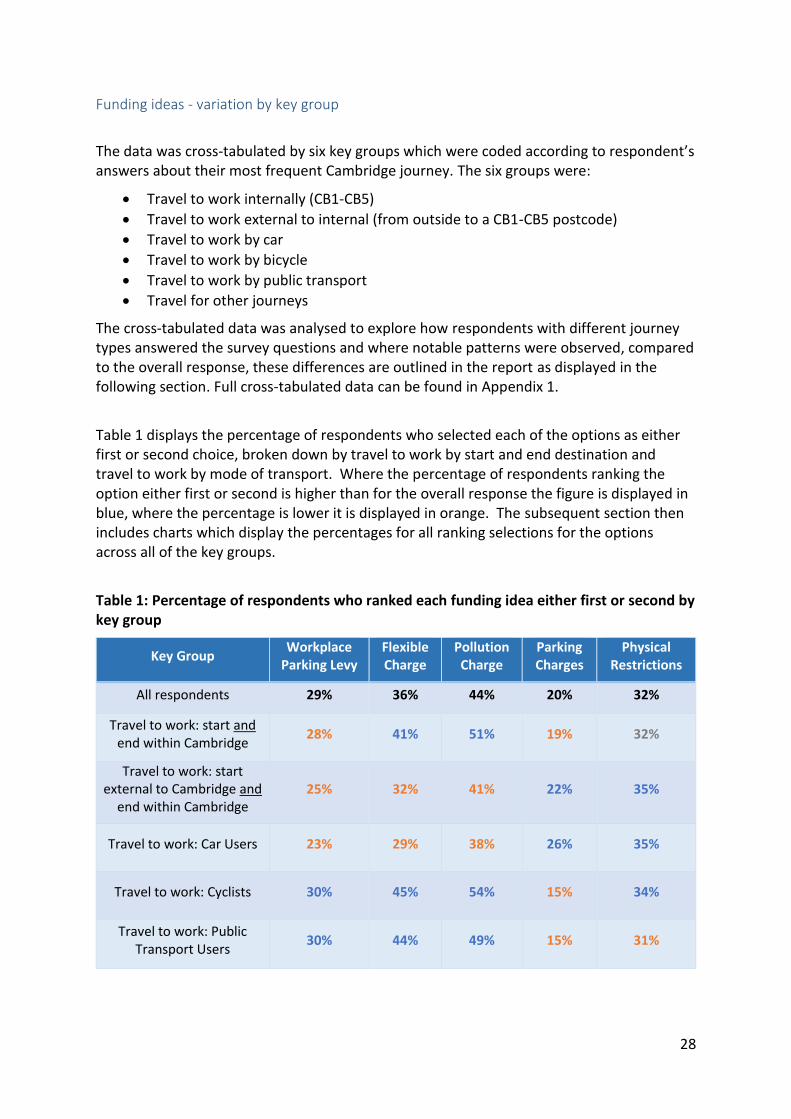
Funding ideas - variation by key group
The data was cross-tabulated by six key groups which were coded according to respondent’s answers about their most frequent Cambridge journey. The six groups were:
Travel to work internally (CB1-CB5)
Travel to work external to internal (from outside to a CB1-CB5 postcode)
Travel to work by car
Travel to work by bicycle
Travel to work by public transport
Travel for other journeys
The cross-tabulated data was analysed to explore how respondents with different journey types answered the survey questions and where notable patterns were observed, compared to the overall response, these differences are outlined in the report as displayed in the following section. Full cross-tabulated data can be found in Appendix 1.
Table 1 displays the percentage of respondents who selected each of the options as either first or second choice, broken down by travel to work by start and end destination and travel to work by mode of transport. Where the percentage of respondents ranking the option either first or second is higher than for the overall response the figure is displayed in blue, where the percentage is lower it is displayed in orange. The subsequent section then includes charts which display the percentages for all ranking selections for the options across all of the key groups.
Table 1: Percentage of respondents who ranked each funding idea either first or second by key group
Key Group Workplace
Parking Levy Flexible Charge
Pollution Charge
Parking Charges
Physical Restrictions
All respondents 29% 36% 44% 20% 32%
Travel to work: start and end within Cambridge
28% 41% 51% 19% 32%
Travel to work: start external to Cambridge and
end within Cambridge 25% 32% 41% 22% 35%
Travel to work: Car Users 23% 29% 38% 26% 35%
Travel to work: Cyclists 30% 45% 54% 15% 34%
Travel to work: Public Transport Users
30% 44% 49% 15% 31%
29
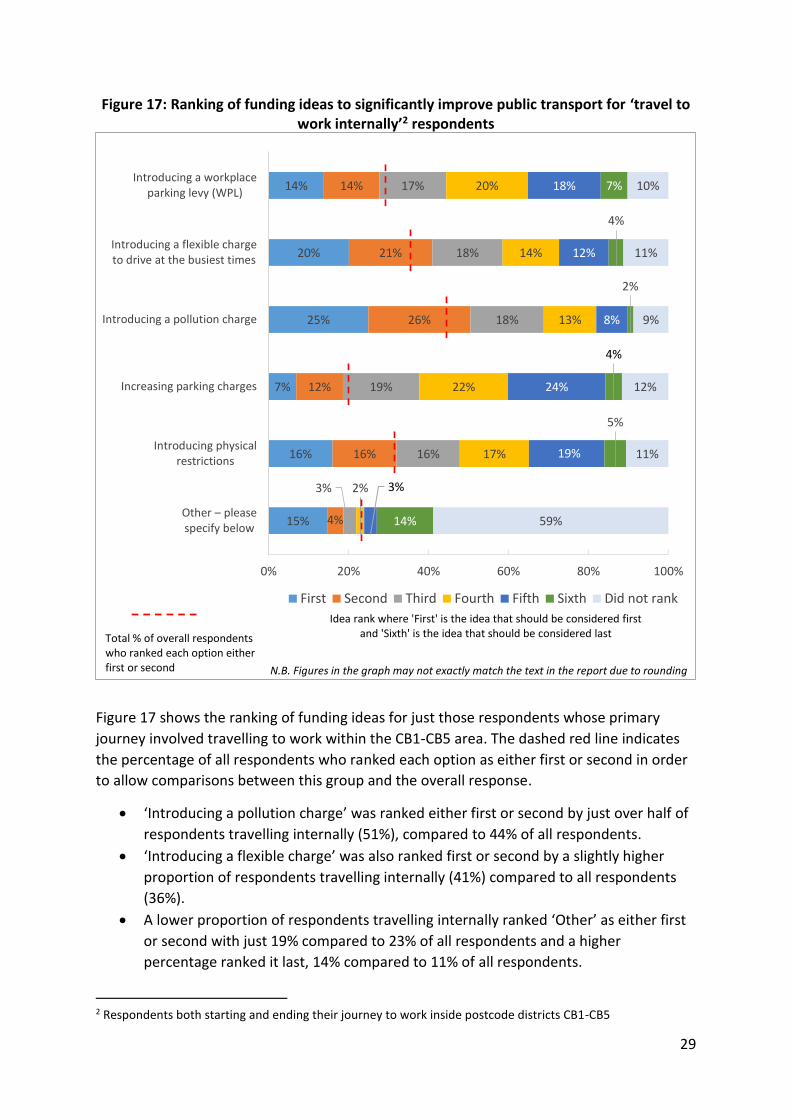
Figure 17: Ranking of funding ideas to significantly improve public transport for ‘travel to work internally’2 respondents
Figure 17 shows the ranking of funding ideas for just those respondents whose primary
journey involved travelling to work within the CB1-CB5 area. The dashed red line indicates
the percentage of all respondents who ranked each option as either first or second in order
to allow comparisons between this group and the overall response.
‘Introducing a pollution charge’ was ranked either first or second by just over half of
respondents travelling internally (51%), compared to 44% of all respondents.
‘Introducing a flexible charge’ was also ranked first or second by a slightly higher
proportion of respondents travelling internally (41%) compared to all respondents
(36%).
A lower proportion of respondents travelling internally ranked ‘Other’ as either first
or second with just 19% compared to 23% of all respondents and a higher
percentage ranked it last, 14% compared to 11% of all respondents.
2 Respondents both starting and ending their journey to work inside postcode districts CB1-CB5
14%
20%
25%
7%
16%
15%
14%
21%
26%
12%
16%
4%
17%
18%
18%
19%
16%
3%
20%
14%
13%
22%
17%
2%
18%
12%
8%
24%
19%
3%
7%
4%
2%
4%
5%
14%
10%
11%
9%
12%
11%
59%
0% 20% 40% 60% 80% 100%
Introducing a workplaceparking levy (WPL)
Introducing a flexible chargeto drive at the busiest times
Introducing a pollution charge
Increasing parking charges
Introducing physicalrestrictions
Other – please specify below
First Second Third Fourth Fifth Sixth Did not rank
Idea rank where 'First' is the idea that should be considered first and 'Sixth' is the idea that should be considered lastTotal % of overall respondents
who ranked each option either first or second N.B. Figures in the graph may not exactly match the text in the report due to rounding
30
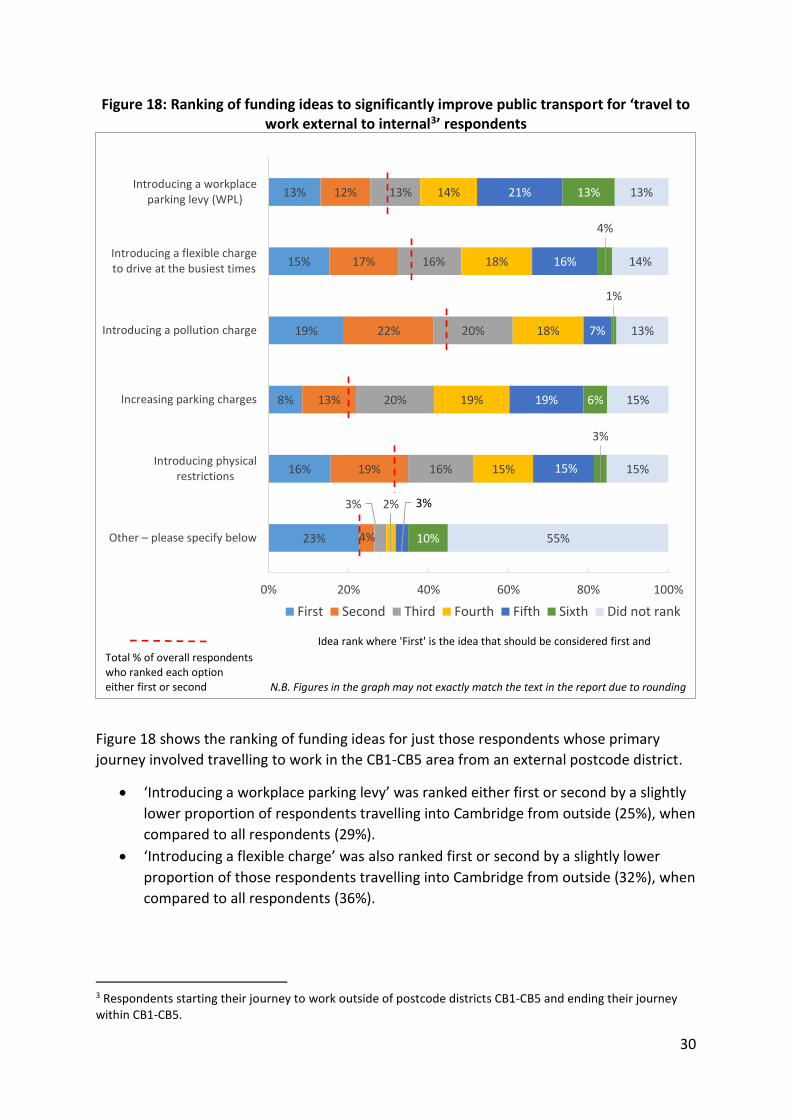
Figure 18: Ranking of funding ideas to significantly improve public transport for ‘travel to work external to internal3’ respondents
Figure 18 shows the ranking of funding ideas for just those respondents whose primary
journey involved travelling to work in the CB1-CB5 area from an external postcode district.
‘Introducing a workplace parking levy’ was ranked either first or second by a slightly
lower proportion of respondents travelling into Cambridge from outside (25%), when
compared to all respondents (29%).
‘Introducing a flexible charge’ was also ranked first or second by a slightly lower
proportion of those respondents travelling into Cambridge from outside (32%), when
compared to all respondents (36%).
3 Respondents starting their journey to work outside of postcode districts CB1-CB5 and ending their journey within CB1-CB5.
13%
15%
19%
8%
16%
23%
12%
17%
22%
13%
19%
4%
13%
16%
20%
20%
16%
3%
14%
18%
18%
19%
15%
2%
21%
16%
7%
19%
15%
3%
13%
4%
1%
6%
3%
10%
13%
14%
13%
15%
15%
55%
0% 20% 40% 60% 80% 100%
Introducing a workplaceparking levy (WPL)
Introducing a flexible chargeto drive at the busiest times
Introducing a pollution charge
Increasing parking charges
Introducing physicalrestrictions
Other – please specify below
First Second Third Fourth Fifth Sixth Did not rank
Idea rank where 'First' is the idea that should be considered first and
Total % of overall respondents who ranked each option either first or second N.B. Figures in the graph may not exactly match the text in the report due to rounding
31
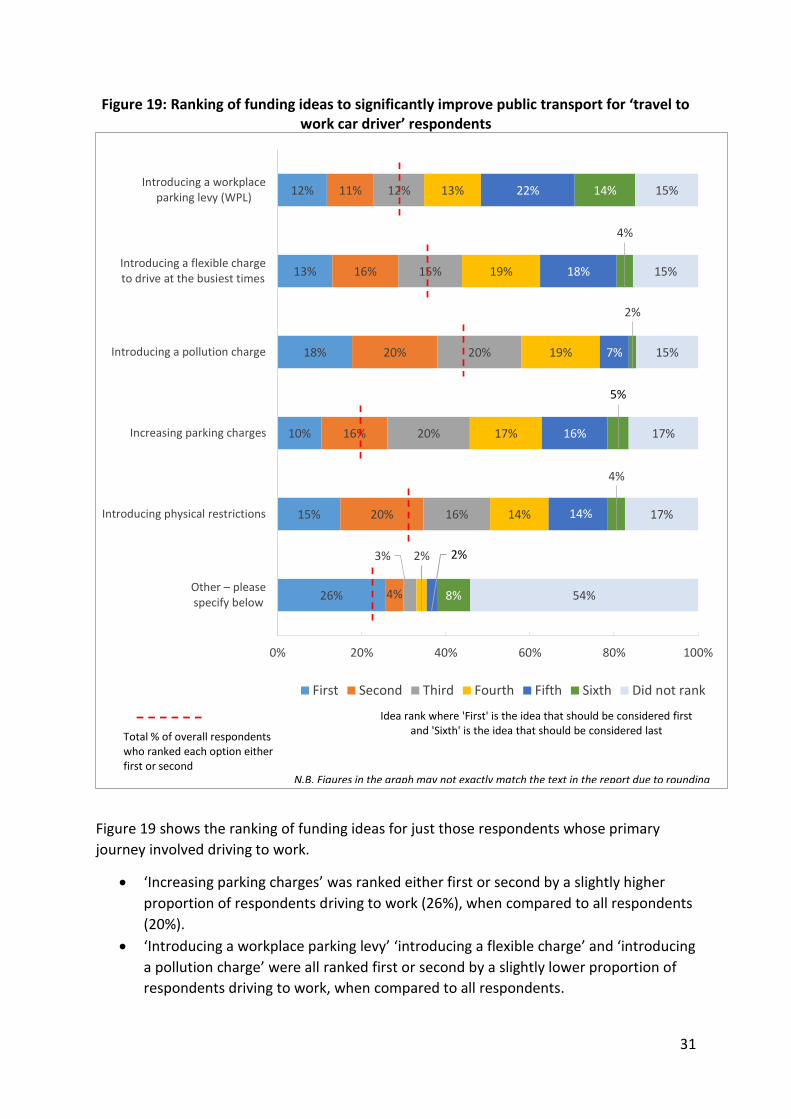
Figure 19: Ranking of funding ideas to significantly improve public transport for ‘travel to work car driver’ respondents
Figure 19 shows the ranking of funding ideas for just those respondents whose primary
journey involved driving to work.
‘Increasing parking charges’ was ranked either first or second by a slightly higher
proportion of respondents driving to work (26%), when compared to all respondents
(20%).
‘Introducing a workplace parking levy’ ‘introducing a flexible charge’ and ‘introducing
a pollution charge’ were all ranked first or second by a slightly lower proportion of
respondents driving to work, when compared to all respondents.
12%
13%
18%
10%
15%
26%
11%
16%
20%
16%
20%
4%
12%
15%
20%
20%
16%
3%
13%
19%
19%
17%
14%
2%
22%
18%
7%
16%
14%
2%
14%
4%
2%
5%
4%
8%
15%
15%
15%
17%
17%
54%
0% 20% 40% 60% 80% 100%
Introducing a workplaceparking levy (WPL)
Introducing a flexible chargeto drive at the busiest times
Introducing a pollution charge
Increasing parking charges
Introducing physical restrictions
Other – please specify below
First Second Third Fourth Fifth Sixth Did not rank
Idea rank where 'First' is the idea that should be considered first and 'Sixth' is the idea that should be considered last
Total % of overall respondents who ranked each option either first or second
N.B. Figures in the graph may not exactly match the text in the report due to rounding
32
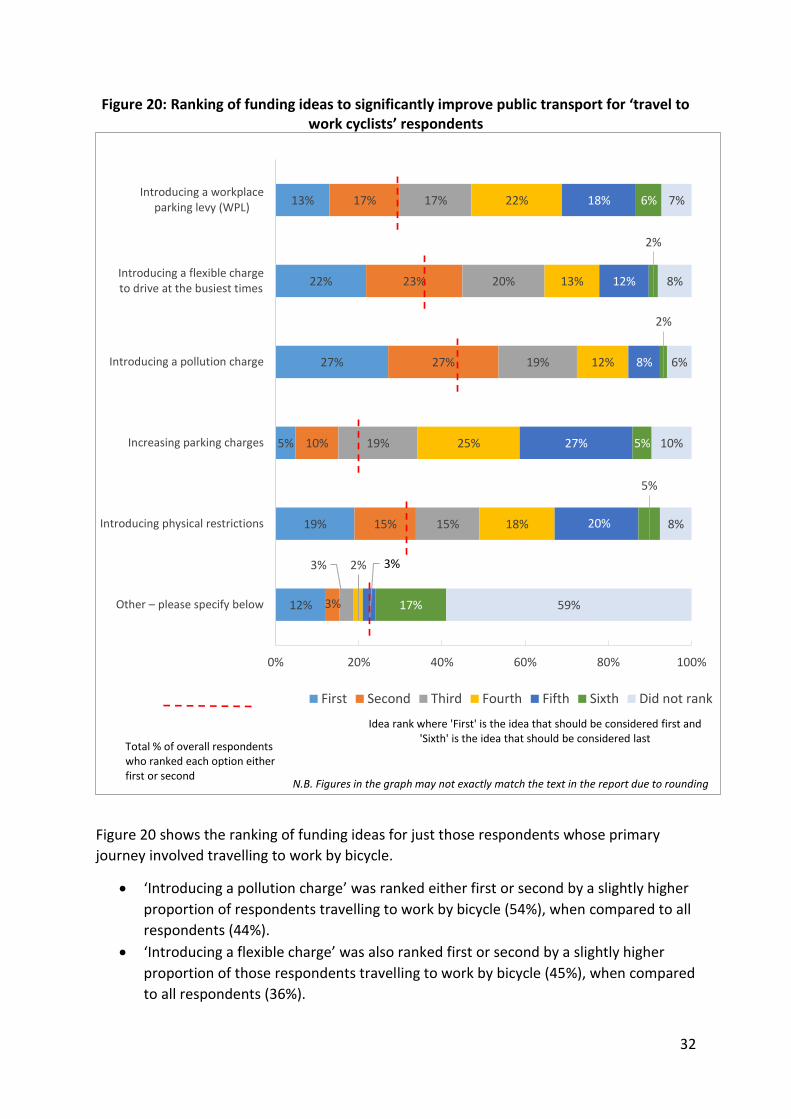
Figure 20: Ranking of funding ideas to significantly improve public transport for ‘travel to work cyclists’ respondents
Figure 20 shows the ranking of funding ideas for just those respondents whose primary
journey involved travelling to work by bicycle.
‘Introducing a pollution charge’ was ranked either first or second by a slightly higher
proportion of respondents travelling to work by bicycle (54%), when compared to all
respondents (44%).
‘Introducing a flexible charge’ was also ranked first or second by a slightly higher
proportion of those respondents travelling to work by bicycle (45%), when compared
to all respondents (36%).
13%
22%
27%
5%
19%
12%
17%
23%
27%
10%
15%
3%
17%
20%
19%
19%
15%
3%
22%
13%
12%
25%
18%
2%
18%
12%
8%
27%
20%
3%
6%
2%
2%
5%
5%
17%
7%
8%
6%
10%
8%
59%
0% 20% 40% 60% 80% 100%
Introducing a workplaceparking levy (WPL)
Introducing a flexible chargeto drive at the busiest times
Introducing a pollution charge
Increasing parking charges
Introducing physical restrictions
Other – please specify below
First Second Third Fourth Fifth Sixth Did not rank
Idea rank where 'First' is the idea that should be considered first and 'Sixth' is the idea that should be considered last
Total % of overall respondents who ranked each option either first or second
N.B. Figures in the graph may not exactly match the text in the report due to rounding
33
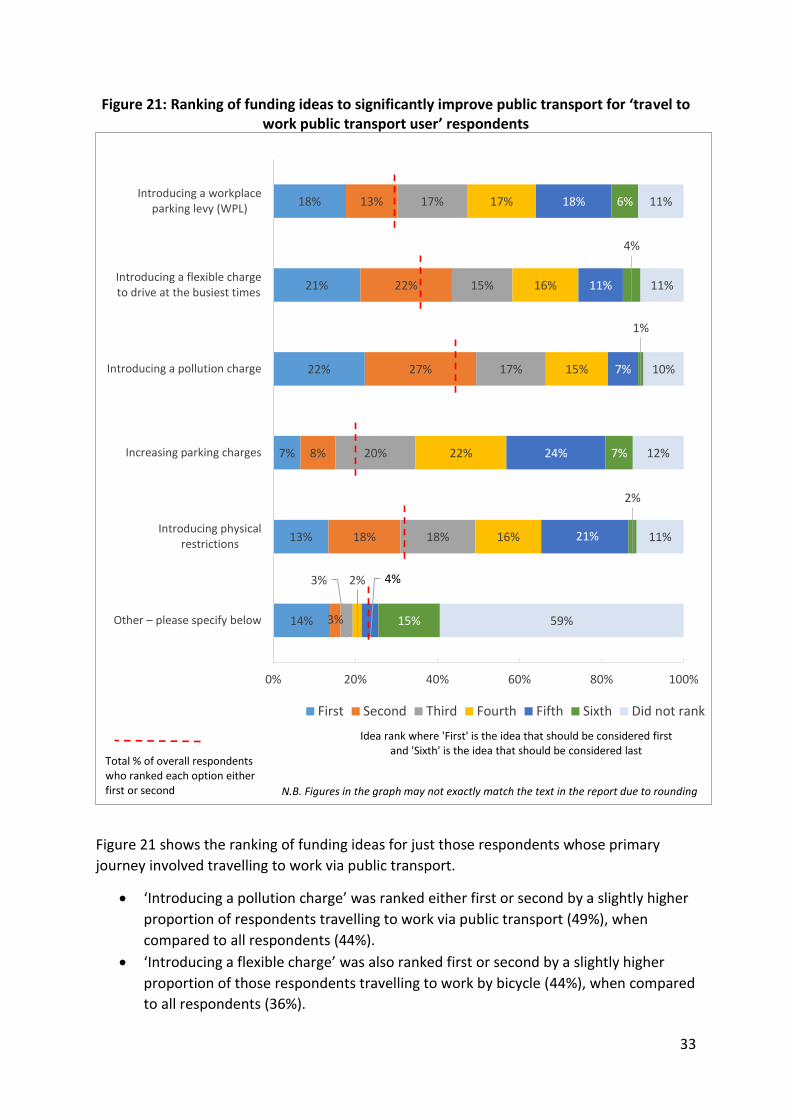
Figure 21: Ranking of funding ideas to significantly improve public transport for ‘travel to work public transport user’ respondents
Figure 21 shows the ranking of funding ideas for just those respondents whose primary
journey involved travelling to work via public transport.
‘Introducing a pollution charge’ was ranked either first or second by a slightly higher
proportion of respondents travelling to work via public transport (49%), when
compared to all respondents (44%).
‘Introducing a flexible charge’ was also ranked first or second by a slightly higher
proportion of those respondents travelling to work by bicycle (44%), when compared
to all respondents (36%).
18%
21%
22%
7%
13%
14%
13%
22%
27%
8%
18%
3%
17%
15%
17%
20%
18%
3%
17%
16%
15%
22%
16%
2%
18%
11%
7%
24%
21%
4%
6%
4%
1%
7%
2%
15%
11%
11%
10%
12%
11%
59%
0% 20% 40% 60% 80% 100%
Introducing a workplaceparking levy (WPL)
Introducing a flexible chargeto drive at the busiest times
Introducing a pollution charge
Increasing parking charges
Introducing physicalrestrictions
Other – please specify below
First Second Third Fourth Fifth Sixth Did not rank
Idea rank where 'First' is the idea that should be considered first and 'Sixth' is the idea that should be considered last
Total % of overall respondents who ranked each option either first or second N.B. Figures in the graph may not exactly match the text in the report due to rounding
34
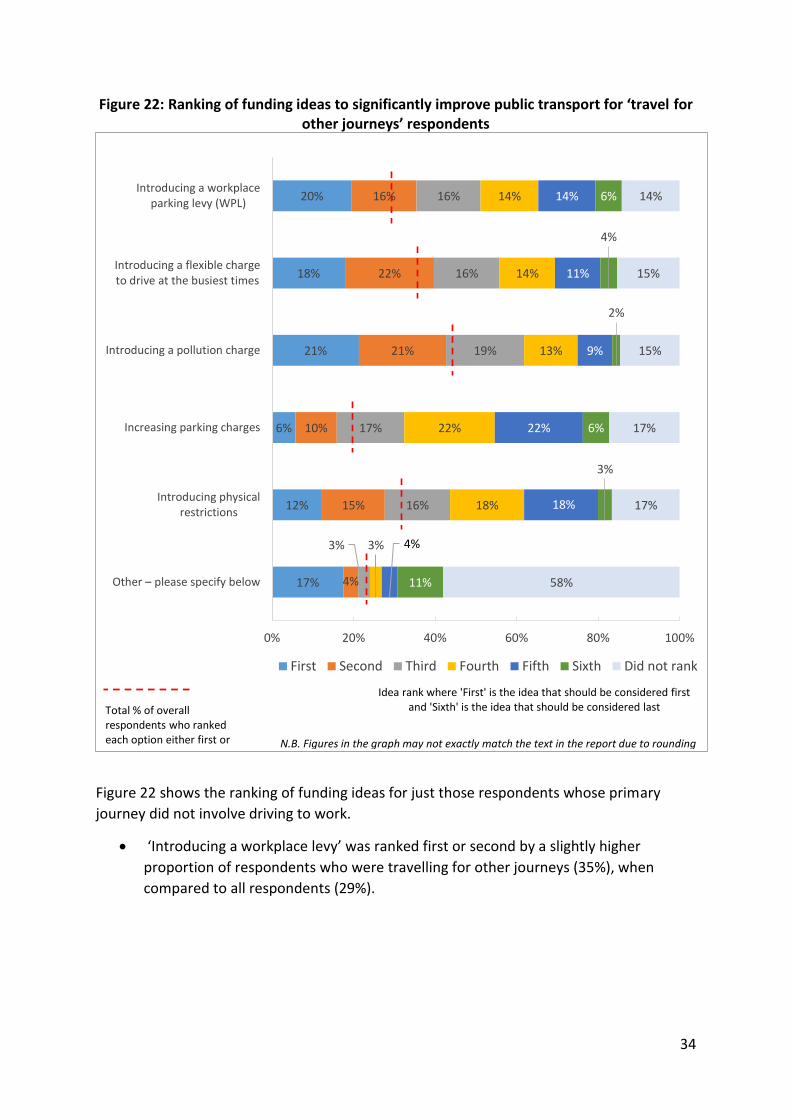
Figure 22: Ranking of funding ideas to significantly improve public transport for ‘travel for other journeys’ respondents
Figure 22 shows the ranking of funding ideas for just those respondents whose primary
journey did not involve driving to work.
‘Introducing a workplace levy’ was ranked first or second by a slightly higher
proportion of respondents who were travelling for other journeys (35%), when
compared to all respondents (29%).
20%
18%
21%
6%
12%
17%
16%
22%
21%
10%
15%
4%
16%
16%
19%
17%
16%
3%
14%
14%
13%
22%
18%
3%
14%
11%
9%
22%
18%
4%
6%
4%
2%
6%
3%
11%
14%
15%
15%
17%
17%
58%
0% 20% 40% 60% 80% 100%
Introducing a workplaceparking levy (WPL)
Introducing a flexible chargeto drive at the busiest times
Introducing a pollution charge
Increasing parking charges
Introducing physicalrestrictions
Other – please specify below
First Second Third Fourth Fifth Sixth Did not rank
Idea rank where 'First' is the idea that should be considered first and 'Sixth' is the idea that should be considered lastTotal % of overall
respondents who ranked each option either first or N.B. Figures in the graph may not exactly match the text in the report due to rounding
35
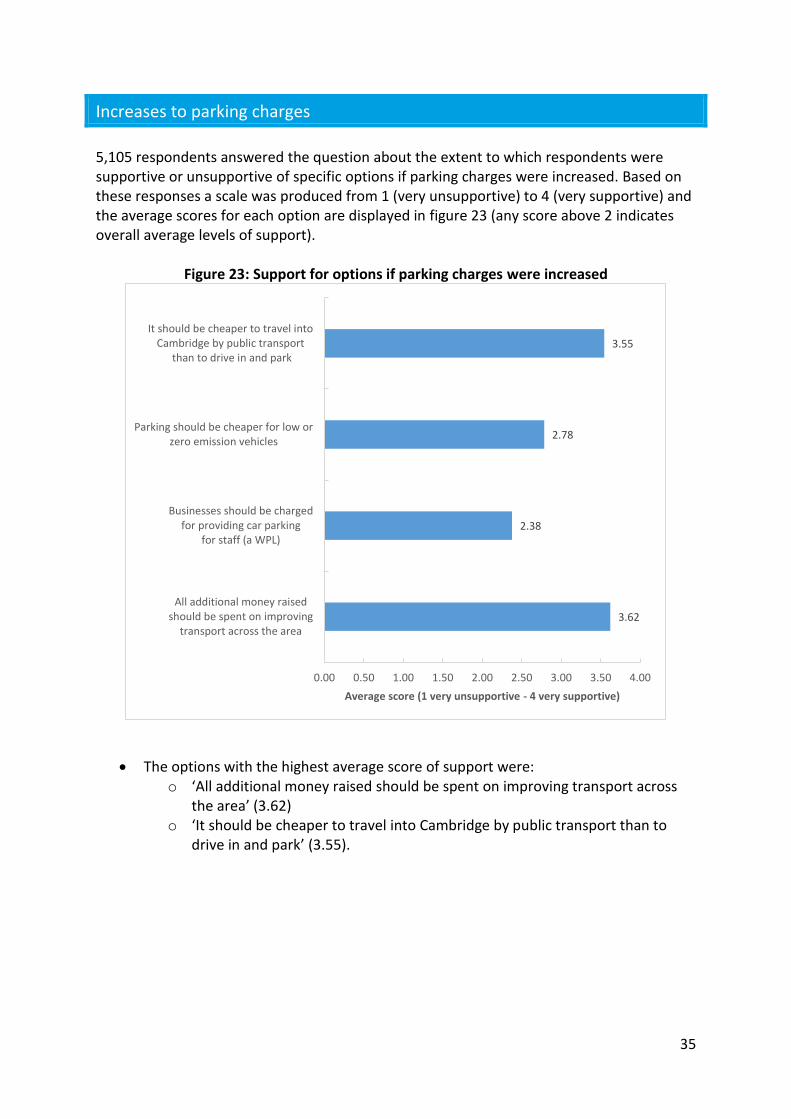
Increases to parking charges
5,105 respondents answered the question about the extent to which respondents were supportive or unsupportive of specific options if parking charges were increased. Based on these responses a scale was produced from 1 (very unsupportive) to 4 (very supportive) and the average scores for each option are displayed in figure 23 (any score above 2 indicates overall average levels of support).
Figure 23: Support for options if parking charges were increased
The options with the highest average score of support were: o ‘All additional money raised should be spent on improving transport across
the area’ (3.62) o ‘It should be cheaper to travel into Cambridge by public transport than to
drive in and park’ (3.55).
3.55
2.78
2.38
3.62
0.00 0.50 1.00 1.50 2.00 2.50 3.00 3.50 4.00
It should be cheaper to travel intoCambridge by public transport
than to drive in and park
Parking should be cheaper for low orzero emission vehicles
Businesses should be chargedfor providing car parking
for staff (a WPL)
All additional money raisedshould be spent on improving
transport across the area
Average score (1 very unsupportive - 4 very supportive)
36
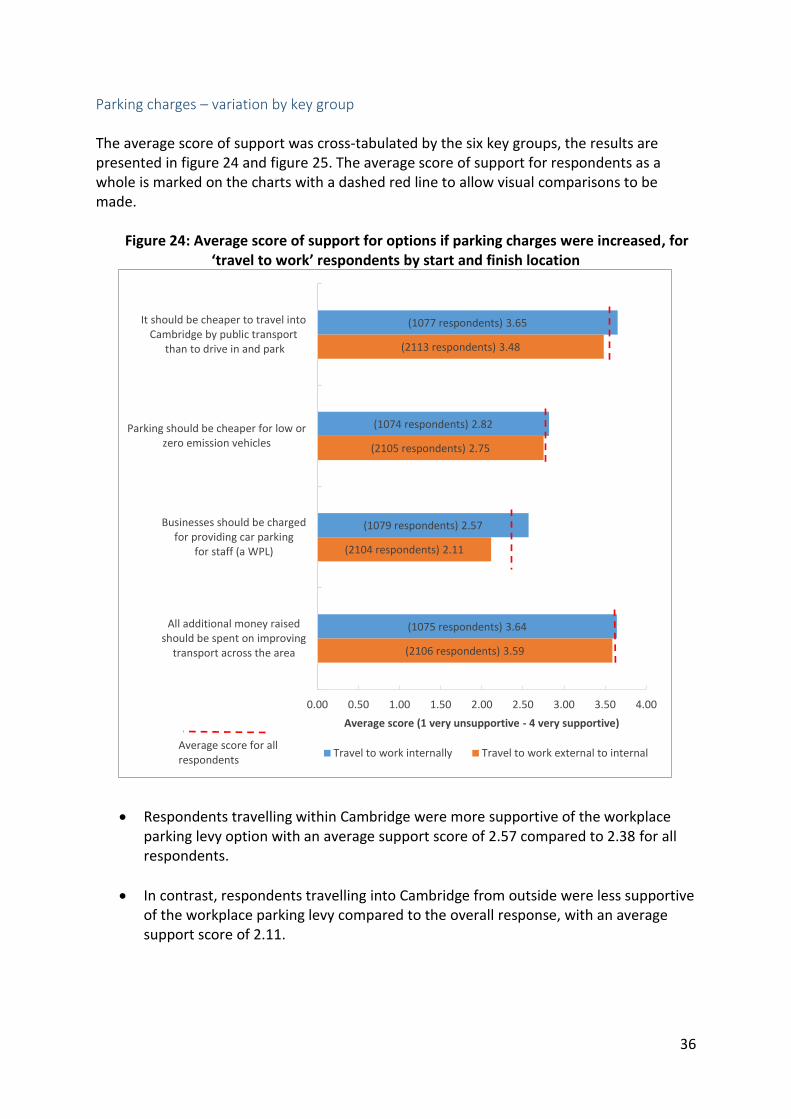
Parking charges – variation by key group The average score of support was cross-tabulated by the six key groups, the results are presented in figure 24 and figure 25. The average score of support for respondents as a whole is marked on the charts with a dashed red line to allow visual comparisons to be made.
Figure 24: Average score of support for options if parking charges were increased, for ‘travel to work’ respondents by start and finish location
Respondents travelling within Cambridge were more supportive of the workplace parking levy option with an average support score of 2.57 compared to 2.38 for all respondents.
In contrast, respondents travelling into Cambridge from outside were less supportive of the workplace parking levy compared to the overall response, with an average support score of 2.11.
(1077 respondents) 3.65
(1074 respondents) 2.82
(1079 respondents) 2.57
(1075 respondents) 3.64
(2113 respondents) 3.48
(2105 respondents) 2.75
(2104 respondents) 2.11
(2106 respondents) 3.59
0.00 0.50 1.00 1.50 2.00 2.50 3.00 3.50 4.00
It should be cheaper to travel intoCambridge by public transport
than to drive in and park
Parking should be cheaper for low orzero emission vehicles
Businesses should be chargedfor providing car parking
for staff (a WPL)
All additional money raisedshould be spent on improving
transport across the area
Average score (1 very unsupportive - 4 very supportive)
Travel to work internally Travel to work external to internalAverage score for all respondents
37
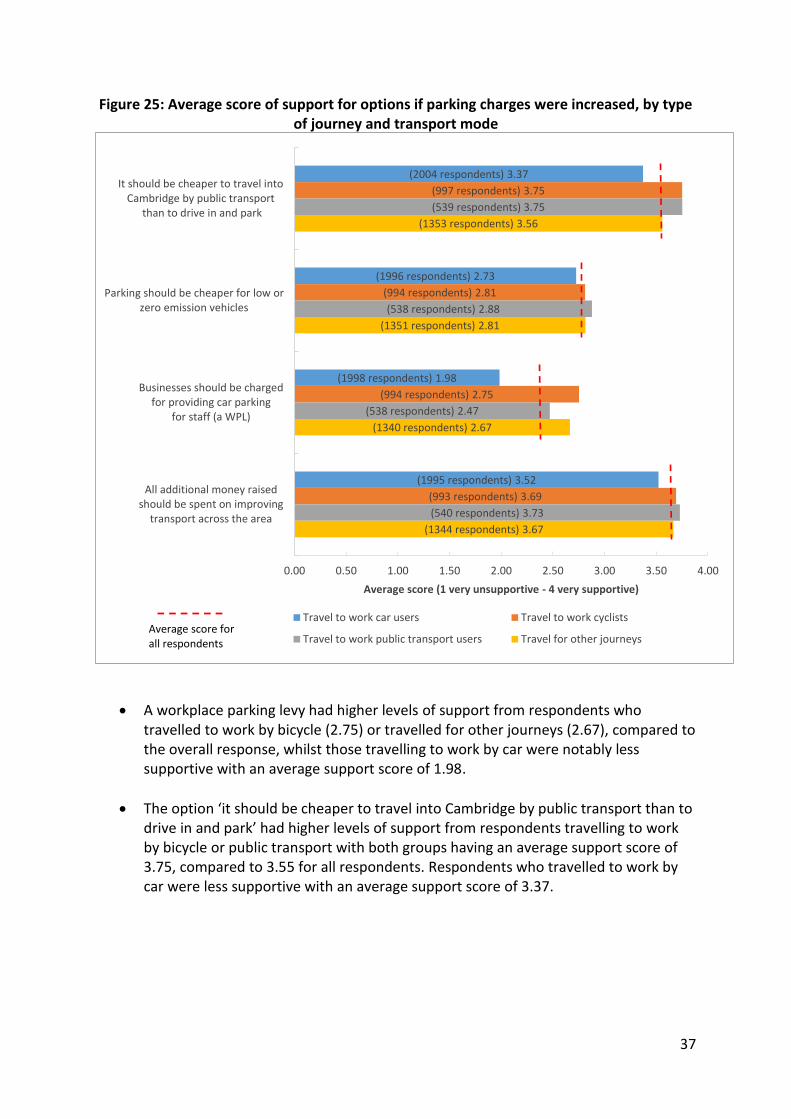
Figure 25: Average score of support for options if parking charges were increased, by type of journey and transport mode
A workplace parking levy had higher levels of support from respondents who travelled to work by bicycle (2.75) or travelled for other journeys (2.67), compared to the overall response, whilst those travelling to work by car were notably less supportive with an average support score of 1.98.
The option ‘it should be cheaper to travel into Cambridge by public transport than to drive in and park’ had higher levels of support from respondents travelling to work by bicycle or public transport with both groups having an average support score of 3.75, compared to 3.55 for all respondents. Respondents who travelled to work by car were less supportive with an average support score of 3.37.
(2004 respondents) 3.37
(1996 respondents) 2.73
(1998 respondents) 1.98
(1995 respondents) 3.52
(997 respondents) 3.75
(994 respondents) 2.81
(994 respondents) 2.75
(993 respondents) 3.69
(539 respondents) 3.75
(538 respondents) 2.88
(538 respondents) 2.47
(540 respondents) 3.73
(1353 respondents) 3.56
(1351 respondents) 2.81
(1340 respondents) 2.67
(1344 respondents) 3.67
0.00 0.50 1.00 1.50 2.00 2.50 3.00 3.50 4.00
It should be cheaper to travel intoCambridge by public transport
than to drive in and park
Parking should be cheaper for low orzero emission vehicles
Businesses should be chargedfor providing car parking
for staff (a WPL)
All additional money raisedshould be spent on improving
transport across the area
Average score (1 very unsupportive - 4 very supportive)
Travel to work car users Travel to work cyclists
Travel to work public transport users Travel for other journeysAverage score for all respondents
38
Respondents were asked whether they had any further comments on making changes to
parking. A total of 1,737 respondents left comments on this question.
Comment theme Respondent comments
Improve public and alternative methods of transport
Respondents felt that changes should not be made until public transport and alternative methods of transport, such as walking and cycling, were significantly improved.
Concerns relating to the Workplace Parking Levy (WPL)
Respondents were concerned that a WPL may result in costs being passed onto employees, with particular concern for low paid workers. Respondents were also concerned about the negative impact of a WPL, particularly on small businesses, and the potential to discourage businesses from Cambridge.
Car parking required Respondents felt many people needed parking due to a lack of viable alternative methods of transport or needing flexible transport from a personal vehicle due to the particulars of employment or personal circumstances.
Current parking is expensive
Respondents felt that current parking charges were already excessively high in comparison to other cities and that further charges would negatively impact businesses and those who required a personal vehicle.
Issues with cheaper parking for low or zero emission vehicles
Respondents felt that this option would have an adverse impact on those with low incomes, who wouldn’t be able to afford lower emission vehicles, and that this would not be effective in reducing congestion in the long term as more vehicles become green.
Cross tabulation of the qualitative themes by key group showed the following notable
differences from the overall response:
Reduce parking emerged as a top five theme for the ‘travel to work internally’ and
‘travel to work cyclist’ groups. Respondents suggested that existing parking provision
should be reduced within Cambridge, particularly on-street parking.
Resident parking emerged as a top five theme for the ‘travel for other journeys’
group. Most respondents indicated support for maintaining or increasing current
resident parking schemes. Respondents discussed the benefits of reducing on-street
commuter parking by introducing more resident only restrictions.
‘Current parking is expensive’ was discussed by less respondents who travelled to
work internally or travelled to work by bicycle and did not feature in the top five
themes for either group.
39
Changes to vehicle access
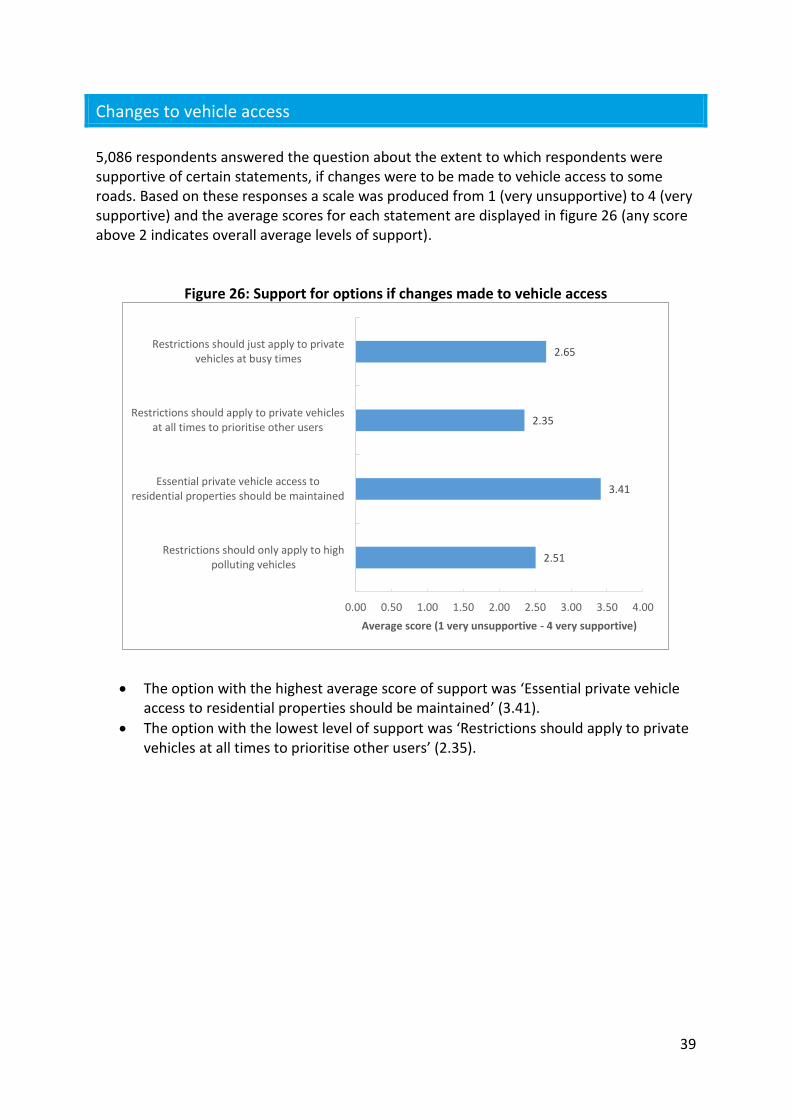
5,086 respondents answered the question about the extent to which respondents were supportive of certain statements, if changes were to be made to vehicle access to some roads. Based on these responses a scale was produced from 1 (very unsupportive) to 4 (very supportive) and the average scores for each statement are displayed in figure 26 (any score above 2 indicates overall average levels of support).
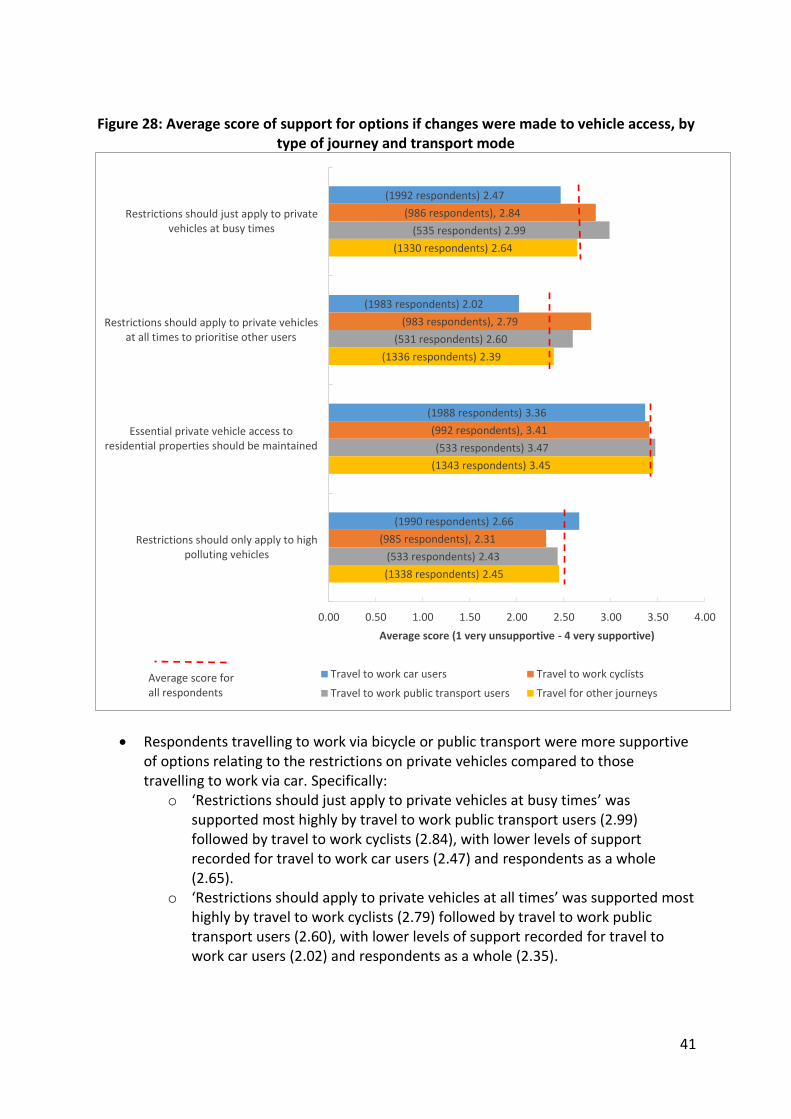
Figure 26: Support for options if changes made to vehicle access
The option with the highest average score of support was ‘Essential private vehicle access to residential properties should be maintained’ (3.41).
The option with the lowest level of support was ‘Restrictions should apply to private vehicles at all times to prioritise other users’ (2.35).
2.65
2.35
3.41
2.51
0.00 0.50 1.00 1.50 2.00 2.50 3.00 3.50 4.00
Restrictions should just apply to privatevehicles at busy times
Restrictions should apply to private vehiclesat all times to prioritise other users
Essential private vehicle access toresidential properties should be maintained
Restrictions should only apply to highpolluting vehicles
Average score (1 very unsupportive - 4 very supportive)
40
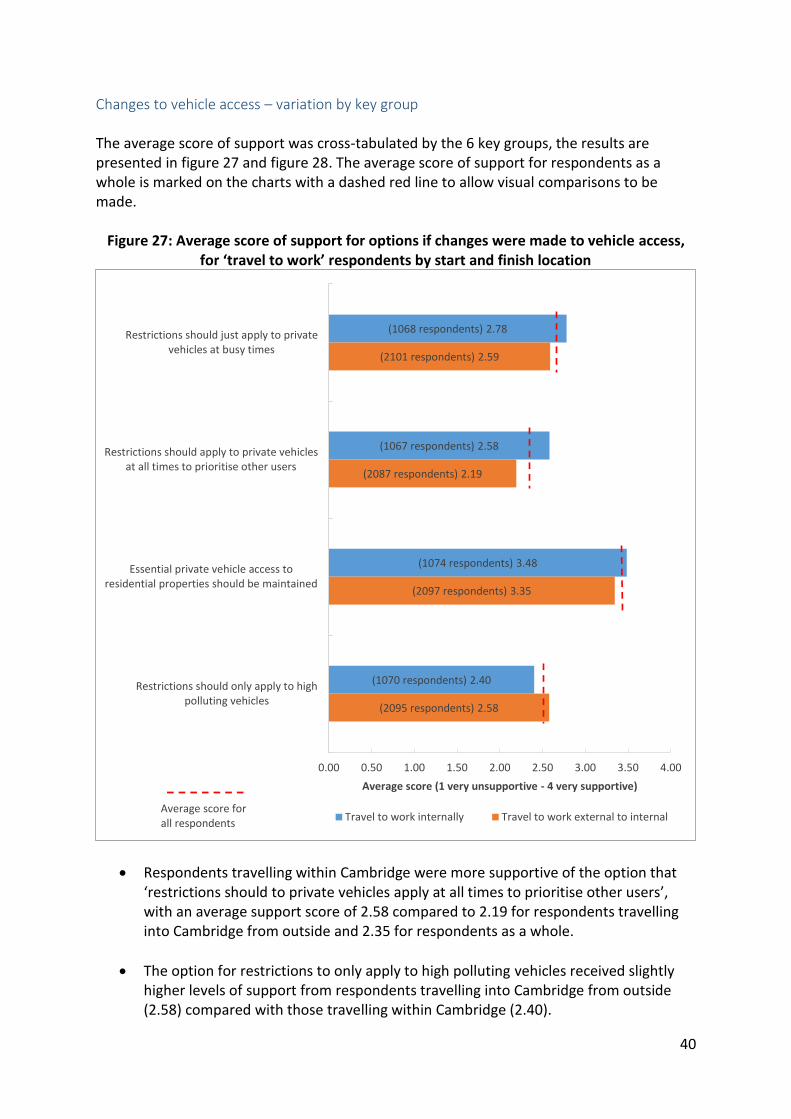
Changes to vehicle access – variation by key group The average score of support was cross-tabulated by the 6 key groups, the results are presented in figure 27 and figure 28. The average score of support for respondents as a whole is marked on the charts with a dashed red line to allow visual comparisons to be made.
Figure 27: Average score of support for options if changes were made to vehicle access,
for ‘travel to work’ respondents by start and finish location
Respondents travelling within Cambridge were more supportive of the option that ‘restrictions should to private vehicles apply at all times to prioritise other users’, with an average support score of 2.58 compared to 2.19 for respondents travelling into Cambridge from outside and 2.35 for respondents as a whole.
The option for restrictions to only apply to high polluting vehicles received slightly higher levels of support from respondents travelling into Cambridge from outside (2.58) compared with those travelling within Cambridge (2.40).
(1068 respondents) 2.78
(1067 respondents) 2.58
(1074 respondents) 3.48
(1070 respondents) 2.40
(2101 respondents) 2.59
(2087 respondents) 2.19
(2097 respondents) 3.35
(2095 respondents) 2.58
0.00 0.50 1.00 1.50 2.00 2.50 3.00 3.50 4.00
Restrictions should just apply to privatevehicles at busy times
Restrictions should apply to private vehiclesat all times to prioritise other users
Essential private vehicle access toresidential properties should be maintained
Restrictions should only apply to highpolluting vehicles
Average score (1 very unsupportive - 4 very supportive)
Travel to work internally Travel to work external to internalAverage score forall respondents
41
Figure 28: Average score of support for options if changes were made to vehicle access, by
type of journey and transport mode
Respondents travelling to work via bicycle or public transport were more supportive of options relating to the restrictions on private vehicles compared to those travelling to work via car. Specifically:
o ‘Restrictions should just apply to private vehicles at busy times’ was supported most highly by travel to work public transport users (2.99) followed by travel to work cyclists (2.84), with lower levels of support recorded for travel to work car users (2.47) and respondents as a whole (2.65).
o ‘Restrictions should apply to private vehicles at all times’ was supported most highly by travel to work cyclists (2.79) followed by travel to work public transport users (2.60), with lower levels of support recorded for travel to work car users (2.02) and respondents as a whole (2.35).
(1992 respondents) 2.47
(1983 respondents) 2.02
(1988 respondents) 3.36
(1990 respondents) 2.66
(986 respondents), 2.84
(983 respondents), 2.79
(992 respondents), 3.41
(985 respondents), 2.31
(535 respondents) 2.99
(531 respondents) 2.60
(533 respondents) 3.47
(533 respondents) 2.43
(1330 respondents) 2.64
(1336 respondents) 2.39
(1343 respondents) 3.45
(1338 respondents) 2.45
0.00 0.50 1.00 1.50 2.00 2.50 3.00 3.50 4.00
Restrictions should just apply to privatevehicles at busy times
Restrictions should apply to private vehiclesat all times to prioritise other users
Essential private vehicle access toresidential properties should be maintained
Restrictions should only apply to highpolluting vehicles
Average score (1 very unsupportive - 4 very supportive)
Travel to work car users Travel to work cyclists
Travel to work public transport users Travel for other journeys
Average score for all respondents
42
Travel to work car users were slightly more supportive of the option for restrictions to only apply to high polluting vehicles (2.66), when compared to the overall response (2.51) and the other key groups.
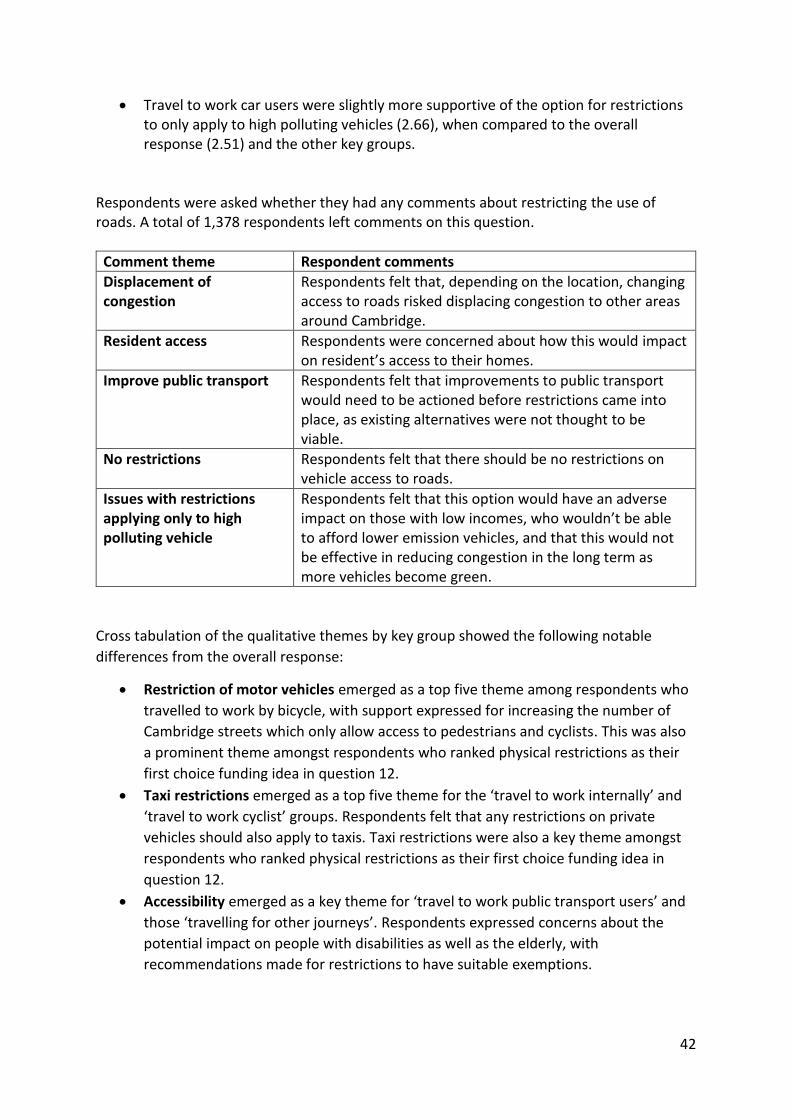
Respondents were asked whether they had any comments about restricting the use of roads. A total of 1,378 respondents left comments on this question.
Comment theme Respondent comments
Displacement of congestion
Respondents felt that, depending on the location, changing access to roads risked displacing congestion to other areas around Cambridge.
Resident access Respondents were concerned about how this would impact on resident’s access to their homes.
Improve public transport Respondents felt that improvements to public transport would need to be actioned before restrictions came into place, as existing alternatives were not thought to be viable.
No restrictions Respondents felt that there should be no restrictions on vehicle access to roads.
Issues with restrictions applying only to high polluting vehicle
Respondents felt that this option would have an adverse impact on those with low incomes, who wouldn’t be able to afford lower emission vehicles, and that this would not be effective in reducing congestion in the long term as more vehicles become green.
Cross tabulation of the qualitative themes by key group showed the following notable
differences from the overall response:
Restriction of motor vehicles emerged as a top five theme among respondents who
travelled to work by bicycle, with support expressed for increasing the number of
Cambridge streets which only allow access to pedestrians and cyclists. This was also
a prominent theme amongst respondents who ranked physical restrictions as their
first choice funding idea in question 12.
Taxi restrictions emerged as a top five theme for the ‘travel to work internally’ and
‘travel to work cyclist’ groups. Respondents felt that any restrictions on private
vehicles should also apply to taxis. Taxi restrictions were also a key theme amongst
respondents who ranked physical restrictions as their first choice funding idea in
question 12.
Accessibility emerged as a key theme for ‘travel to work public transport users’ and
those ‘travelling for other journeys’. Respondents expressed concerns about the
potential impact on people with disabilities as well as the elderly, with
recommendations made for restrictions to have suitable exemptions.
43
A system of flexible or pollution charging
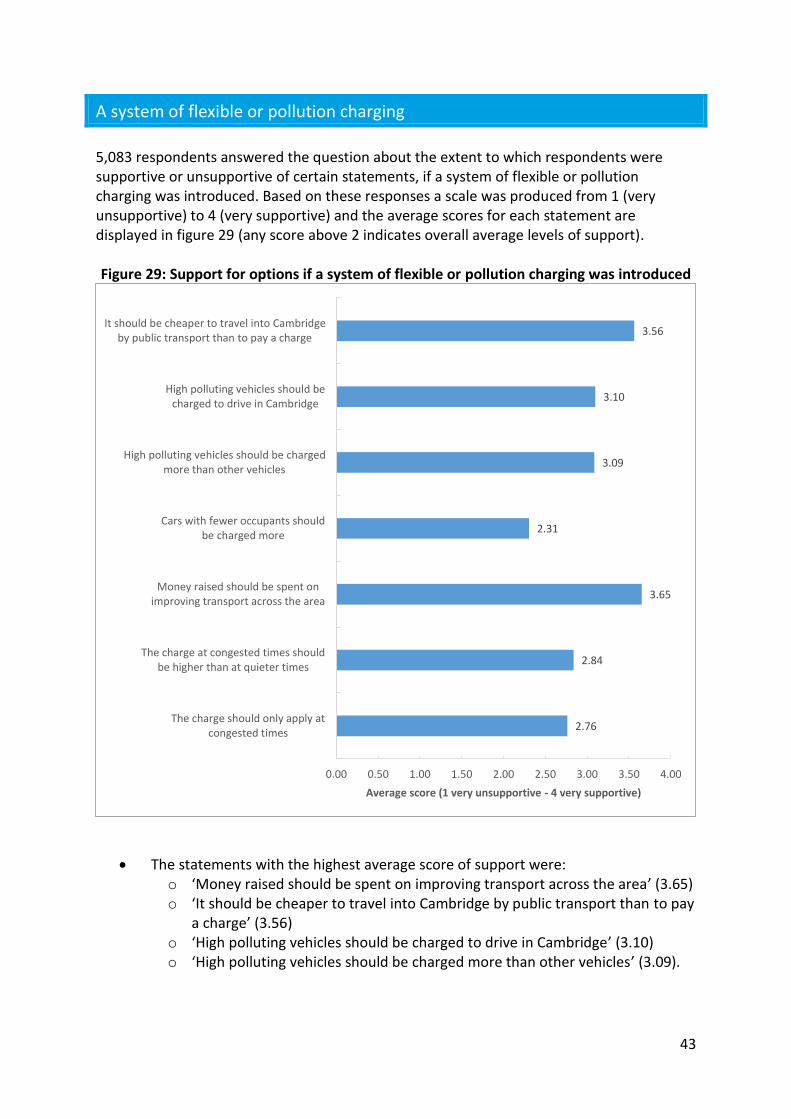
5,083 respondents answered the question about the extent to which respondents were supportive or unsupportive of certain statements, if a system of flexible or pollution charging was introduced. Based on these responses a scale was produced from 1 (very unsupportive) to 4 (very supportive) and the average scores for each statement are displayed in figure 29 (any score above 2 indicates overall average levels of support). Figure 29: Support for options if a system of flexible or pollution charging was introduced
The statements with the highest average score of support were: o ‘Money raised should be spent on improving transport across the area’ (3.65) o ‘It should be cheaper to travel into Cambridge by public transport than to pay
a charge’ (3.56) o ‘High polluting vehicles should be charged to drive in Cambridge’ (3.10) o ‘High polluting vehicles should be charged more than other vehicles’ (3.09).
3.56
3.10
3.09
2.31
3.65
2.84
2.76
0.00 0.50 1.00 1.50 2.00 2.50 3.00 3.50 4.00
It should be cheaper to travel into Cambridgeby public transport than to pay a charge
High polluting vehicles should becharged to drive in Cambridge
High polluting vehicles should be chargedmore than other vehicles
Cars with fewer occupants shouldbe charged more
Money raised should be spent onimproving transport across the area
The charge at congested times shouldbe higher than at quieter times
The charge should only apply atcongested times
Average score (1 very unsupportive - 4 very supportive)
44
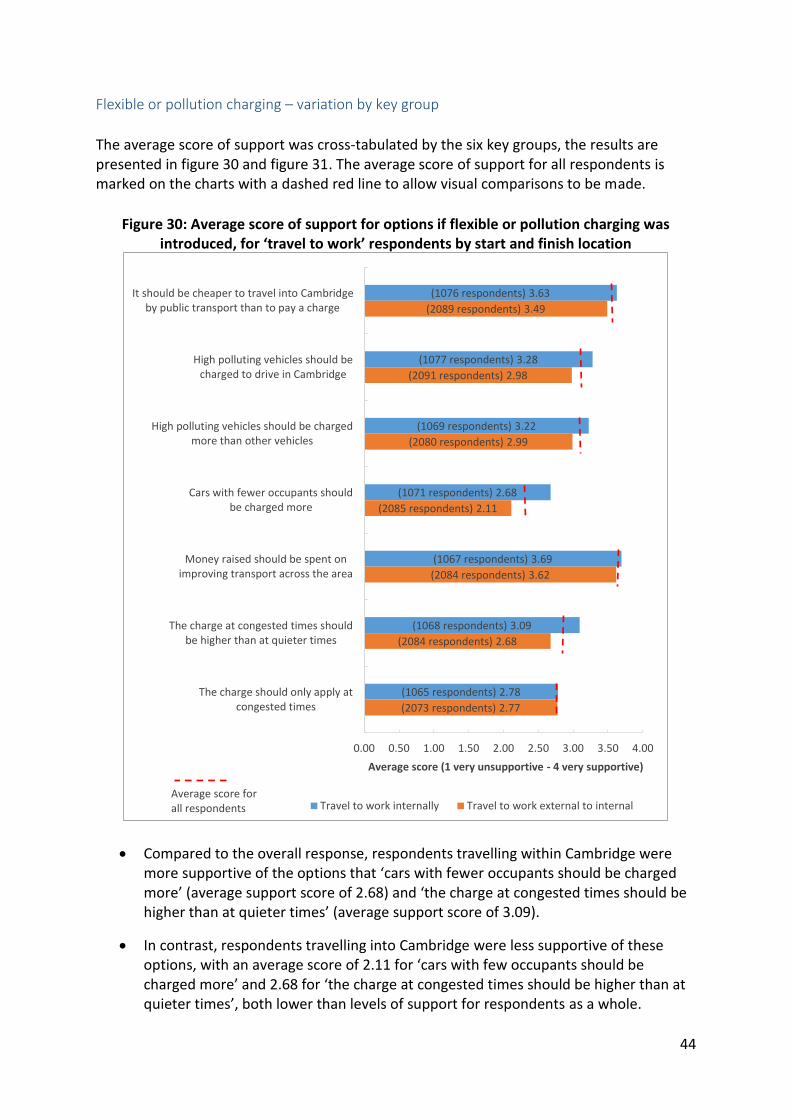
Flexible or pollution charging – variation by key group
The average score of support was cross-tabulated by the six key groups, the results are presented in figure 30 and figure 31. The average score of support for all respondents is marked on the charts with a dashed red line to allow visual comparisons to be made.
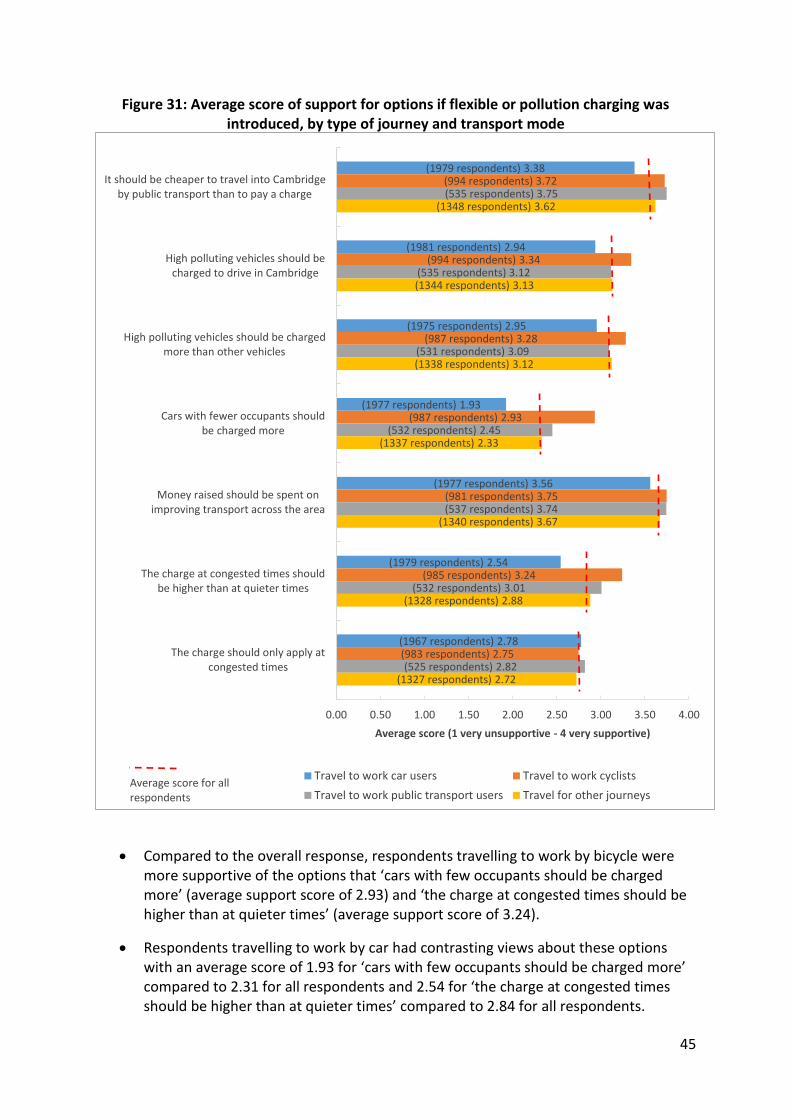
Figure 30: Average score of support for options if flexible or pollution charging was introduced, for ‘travel to work’ respondents by start and finish location
Compared to the overall response, respondents travelling within Cambridge were more supportive of the options that ‘cars with fewer occupants should be charged more’ (average support score of 2.68) and ‘the charge at congested times should be higher than at quieter times’ (average support score of 3.09).
In contrast, respondents travelling into Cambridge were less supportive of these options, with an average score of 2.11 for ‘cars with few occupants should be charged more’ and 2.68 for ‘the charge at congested times should be higher than at quieter times’, both lower than levels of support for respondents as a whole.
(1076 respondents) 3.63
(1077 respondents) 3.28
(1069 respondents) 3.22
(1071 respondents) 2.68
(1067 respondents) 3.69
(1068 respondents) 3.09
(1065 respondents) 2.78
(2089 respondents) 3.49
(2091 respondents) 2.98
(2080 respondents) 2.99
(2085 respondents) 2.11
(2084 respondents) 3.62
(2084 respondents) 2.68
(2073 respondents) 2.77
0.00 0.50 1.00 1.50 2.00 2.50 3.00 3.50 4.00
It should be cheaper to travel into Cambridgeby public transport than to pay a charge
High polluting vehicles should becharged to drive in Cambridge
High polluting vehicles should be chargedmore than other vehicles
Cars with fewer occupants shouldbe charged more
Money raised should be spent onimproving transport across the area
The charge at congested times shouldbe higher than at quieter times
The charge should only apply atcongested times
Average score (1 very unsupportive - 4 very supportive)
Travel to work internally Travel to work external to internalAverage score for all respondents
45
Figure 31: Average score of support for options if flexible or pollution charging was introduced, by type of journey and transport mode
Compared to the overall response, respondents travelling to work by bicycle were more supportive of the options that ‘cars with few occupants should be charged more’ (average support score of 2.93) and ‘the charge at congested times should be higher than at quieter times’ (average support score of 3.24).
Respondents travelling to work by car had contrasting views about these options with an average score of 1.93 for ‘cars with few occupants should be charged more’ compared to 2.31 for all respondents and 2.54 for ‘the charge at congested times should be higher than at quieter times’ compared to 2.84 for all respondents.
(1979 respondents) 3.38
(1981 respondents) 2.94
(1975 respondents) 2.95
(1977 respondents) 1.93
(1977 respondents) 3.56
(1979 respondents) 2.54
(1967 respondents) 2.78
(994 respondents) 3.72
(994 respondents) 3.34
(987 respondents) 3.28
(987 respondents) 2.93
(981 respondents) 3.75
(985 respondents) 3.24
(983 respondents) 2.75
(535 respondents) 3.75
(535 respondents) 3.12
(531 respondents) 3.09
(532 respondents) 2.45
(537 respondents) 3.74
(532 respondents) 3.01
(525 respondents) 2.82
(1348 respondents) 3.62
(1344 respondents) 3.13
(1338 respondents) 3.12
(1337 respondents) 2.33
(1340 respondents) 3.67
(1328 respondents) 2.88
(1327 respondents) 2.72
0.00 0.50 1.00 1.50 2.00 2.50 3.00 3.50 4.00
It should be cheaper to travel into Cambridgeby public transport than to pay a charge
High polluting vehicles should becharged to drive in Cambridge
High polluting vehicles should be chargedmore than other vehicles
Cars with fewer occupants shouldbe charged more
Money raised should be spent onimproving transport across the area
The charge at congested times shouldbe higher than at quieter times
The charge should only apply atcongested times
Average score (1 very unsupportive - 4 very supportive)
Travel to work car users Travel to work cyclists
Travel to work public transport users Travel for other journeysAverage score for all respondents
46
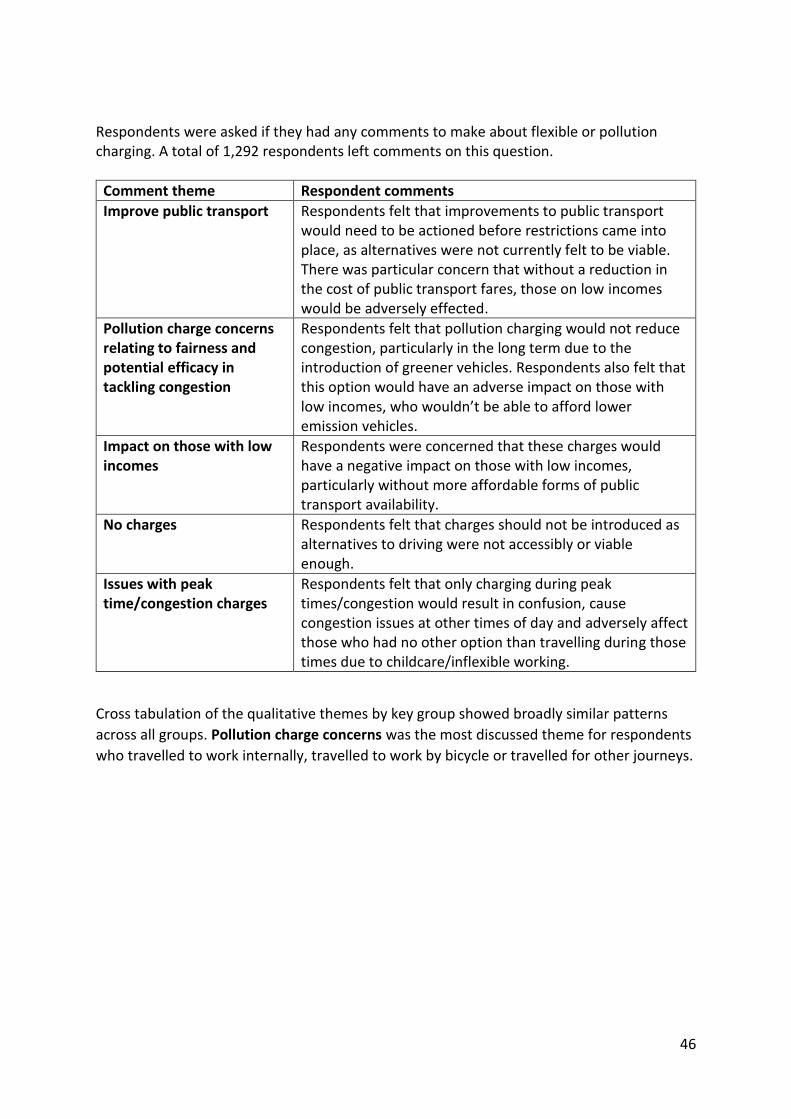
Respondents were asked if they had any comments to make about flexible or pollution charging. A total of 1,292 respondents left comments on this question.
Comment theme Respondent comments
Improve public transport Respondents felt that improvements to public transport would need to be actioned before restrictions came into place, as alternatives were not currently felt to be viable. There was particular concern that without a reduction in the cost of public transport fares, those on low incomes would be adversely effected.
Pollution charge concerns relating to fairness and potential efficacy in tackling congestion
Respondents felt that pollution charging would not reduce congestion, particularly in the long term due to the introduction of greener vehicles. Respondents also felt that this option would have an adverse impact on those with low incomes, who wouldn’t be able to afford lower emission vehicles.
Impact on those with low incomes
Respondents were concerned that these charges would have a negative impact on those with low incomes, particularly without more affordable forms of public transport availability.
No charges Respondents felt that charges should not be introduced as alternatives to driving were not accessibly or viable enough.
Issues with peak time/congestion charges
Respondents felt that only charging during peak times/congestion would result in confusion, cause congestion issues at other times of day and adversely affect those who had no other option than travelling during those times due to childcare/inflexible working.
Cross tabulation of the qualitative themes by key group showed broadly similar patterns
across all groups. Pollution charge concerns was the most discussed theme for respondents
who travelled to work internally, travelled to work by bicycle or travelled for other journeys.
47
JOURNEYS BY CAR
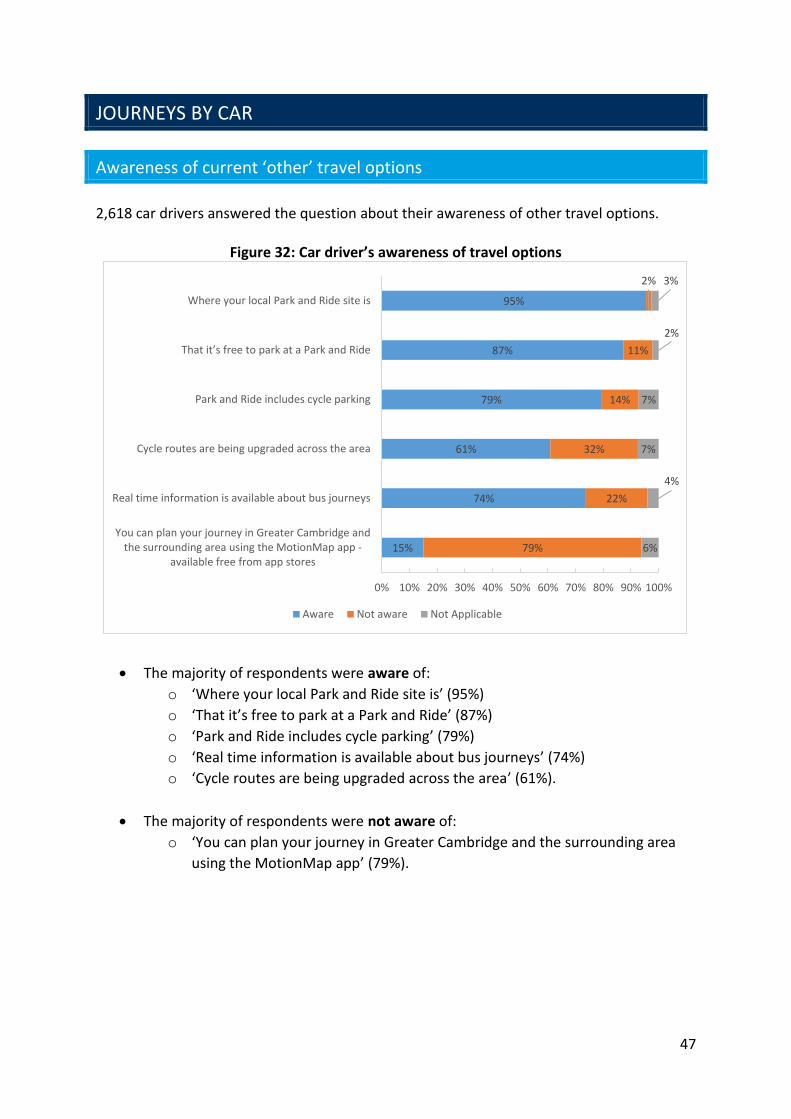
Awareness of current ‘other’ travel options
2,618 car drivers answered the question about their awareness of other travel options.
Figure 32: Car driver’s awareness of travel options
The majority of respondents were aware of:
o ‘Where your local Park and Ride site is’ (95%)
o ‘That it’s free to park at a Park and Ride’ (87%)
o ‘Park and Ride includes cycle parking’ (79%)
o ‘Real time information is available about bus journeys’ (74%)
o ‘Cycle routes are being upgraded across the area’ (61%).
The majority of respondents were not aware of:
o ‘You can plan your journey in Greater Cambridge and the surrounding area
using the MotionMap app’ (79%).
95%
87%
79%
61%
74%
15%
2%
11%
14%
32%
22%
79%
3%
2%
7%
7%
4%
6%
0% 10% 20% 30% 40% 50% 60% 70% 80% 90% 100%
Where your local Park and Ride site is
That it’s free to park at a Park and Ride
Park and Ride includes cycle parking
Cycle routes are being upgraded across the area
Real time information is available about bus journeys
You can plan your journey in Greater Cambridge andthe surrounding area using the MotionMap app -
available free from app stores
Aware Not aware Not Applicable
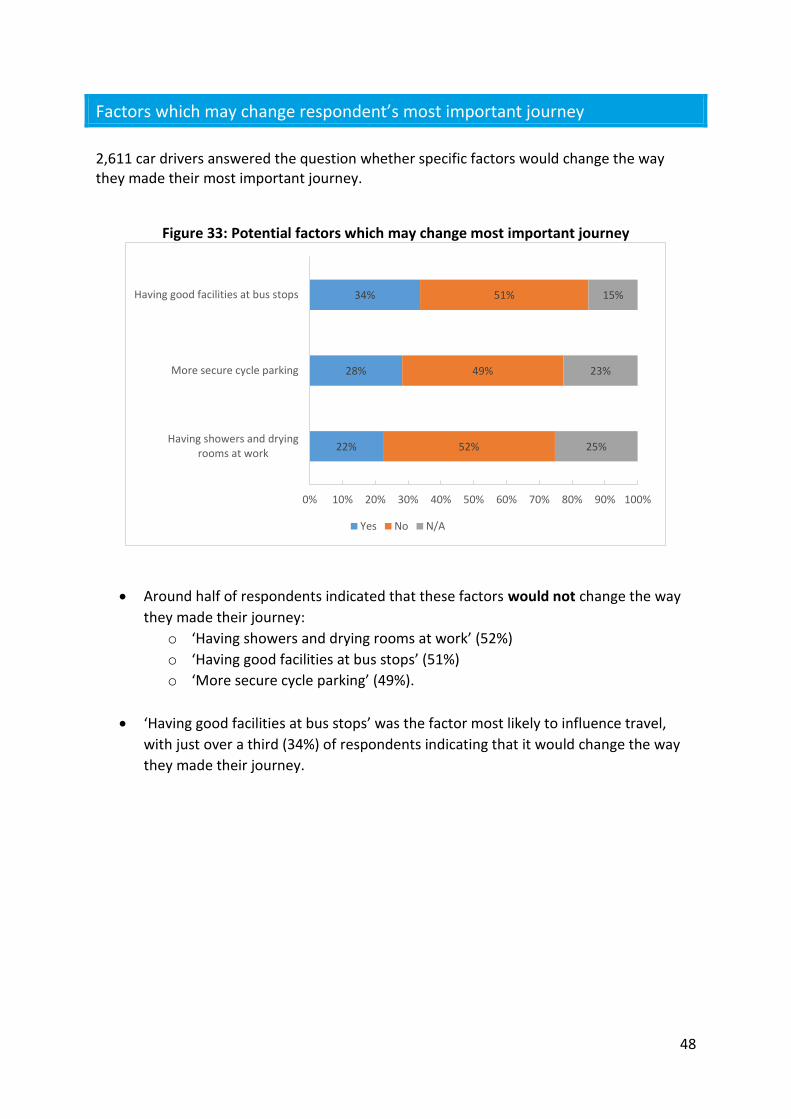
48
Factors which may change respondent’s most important journey
2,611 car drivers answered the question whether specific factors would change the way they made their most important journey.
Figure 33: Potential factors which may change most important journey
Around half of respondents indicated that these factors would not change the way
they made their journey:
o ‘Having showers and drying rooms at work’ (52%)
o ‘Having good facilities at bus stops’ (51%)
o ‘More secure cycle parking’ (49%).
‘Having good facilities at bus stops’ was the factor most likely to influence travel,
with just over a third (34%) of respondents indicating that it would change the way
they made their journey.
22%
28%
34%
52%
49%
51%
25%
23%
15%
0% 10% 20% 30% 40% 50% 60% 70% 80% 90% 100%
Having showers and dryingrooms at work
More secure cycle parking
Having good facilities at bus stops
Yes No N/A
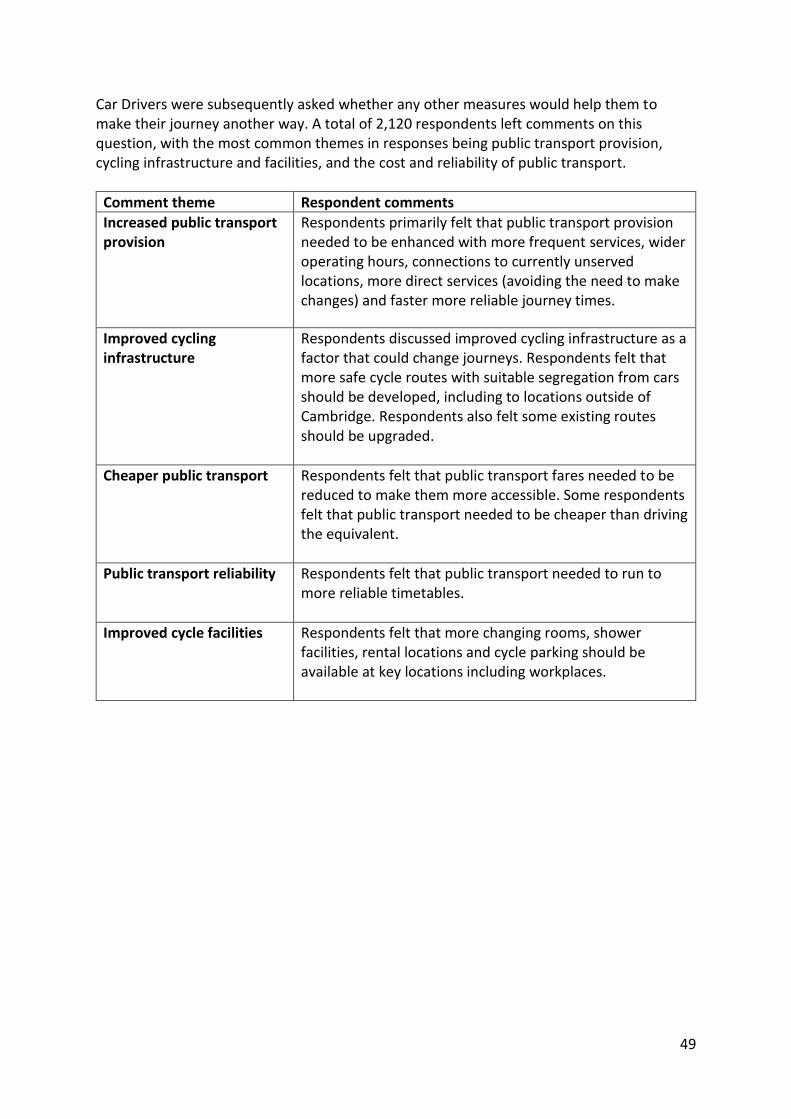
49
Car Drivers were subsequently asked whether any other measures would help them to make their journey another way. A total of 2,120 respondents left comments on this question, with the most common themes in responses being public transport provision, cycling infrastructure and facilities, and the cost and reliability of public transport.
Comment theme Respondent comments
Increased public transport provision
Respondents primarily felt that public transport provision needed to be enhanced with more frequent services, wider operating hours, connections to currently unserved locations, more direct services (avoiding the need to make changes) and faster more reliable journey times.
Improved cycling infrastructure
Respondents discussed improved cycling infrastructure as a factor that could change journeys. Respondents felt that more safe cycle routes with suitable segregation from cars should be developed, including to locations outside of Cambridge. Respondents also felt some existing routes should be upgraded.
Cheaper public transport Respondents felt that public transport fares needed to be reduced to make them more accessible. Some respondents felt that public transport needed to be cheaper than driving the equivalent.
Public transport reliability Respondents felt that public transport needed to run to more reliable timetables.
Improved cycle facilities Respondents felt that more changing rooms, shower facilities, rental locations and cycle parking should be available at key locations including workplaces.
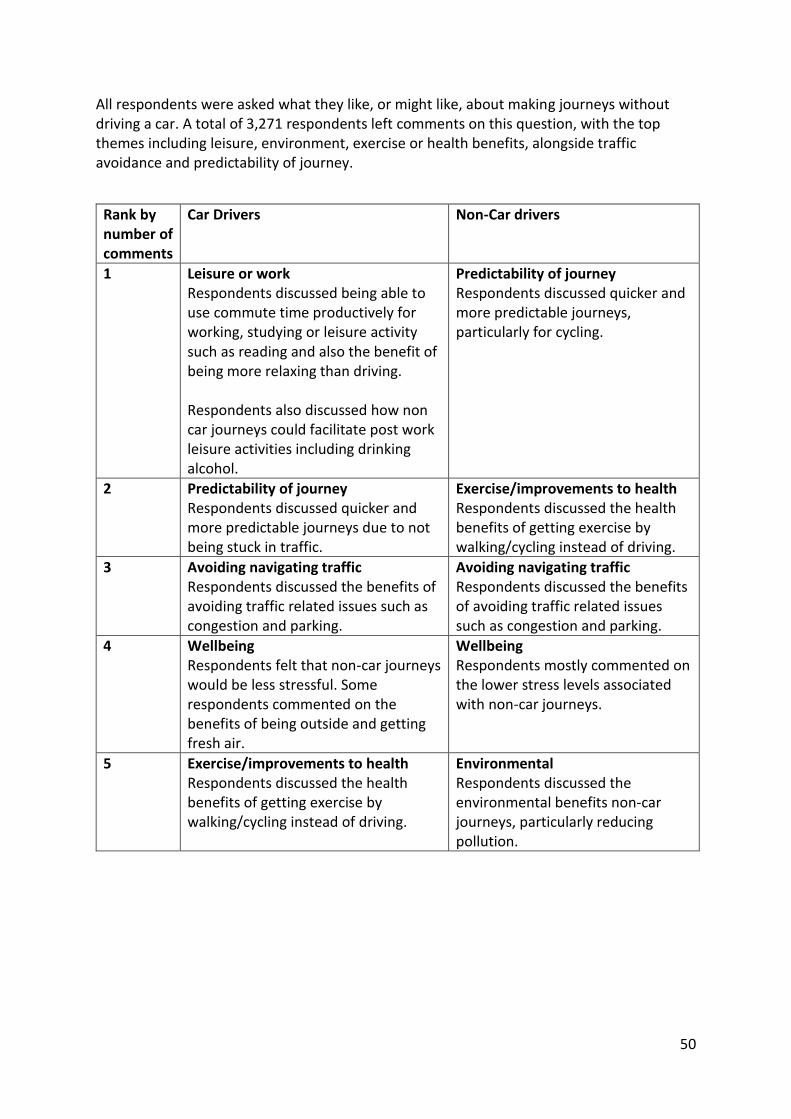
50
All respondents were asked what they like, or might like, about making journeys without driving a car. A total of 3,271 respondents left comments on this question, with the top themes including leisure, environment, exercise or health benefits, alongside traffic avoidance and predictability of journey.
Rank by number of comments
Car Drivers Non-Car drivers
1 Leisure or work Respondents discussed being able to use commute time productively for working, studying or leisure activity such as reading and also the benefit of being more relaxing than driving. Respondents also discussed how non car journeys could facilitate post work leisure activities including drinking alcohol.
Predictability of journey
Respondents discussed quicker and more predictable journeys, particularly for cycling.
2 Predictability of journey Respondents discussed quicker and more predictable journeys due to not being stuck in traffic.
Exercise/improvements to health
Respondents discussed the health benefits of getting exercise by walking/cycling instead of driving.
3 Avoiding navigating traffic
Respondents discussed the benefits of avoiding traffic related issues such as congestion and parking.
Avoiding navigating traffic
Respondents discussed the benefits of avoiding traffic related issues such as congestion and parking.
4 Wellbeing
Respondents felt that non-car journeys would be less stressful. Some respondents commented on the benefits of being outside and getting fresh air.
Wellbeing
Respondents mostly commented on the lower stress levels associated with non-car journeys.
5 Exercise/improvements to health Respondents discussed the health benefits of getting exercise by walking/cycling instead of driving.
Environmental Respondents discussed the environmental benefits non-car journeys, particularly reducing pollution.
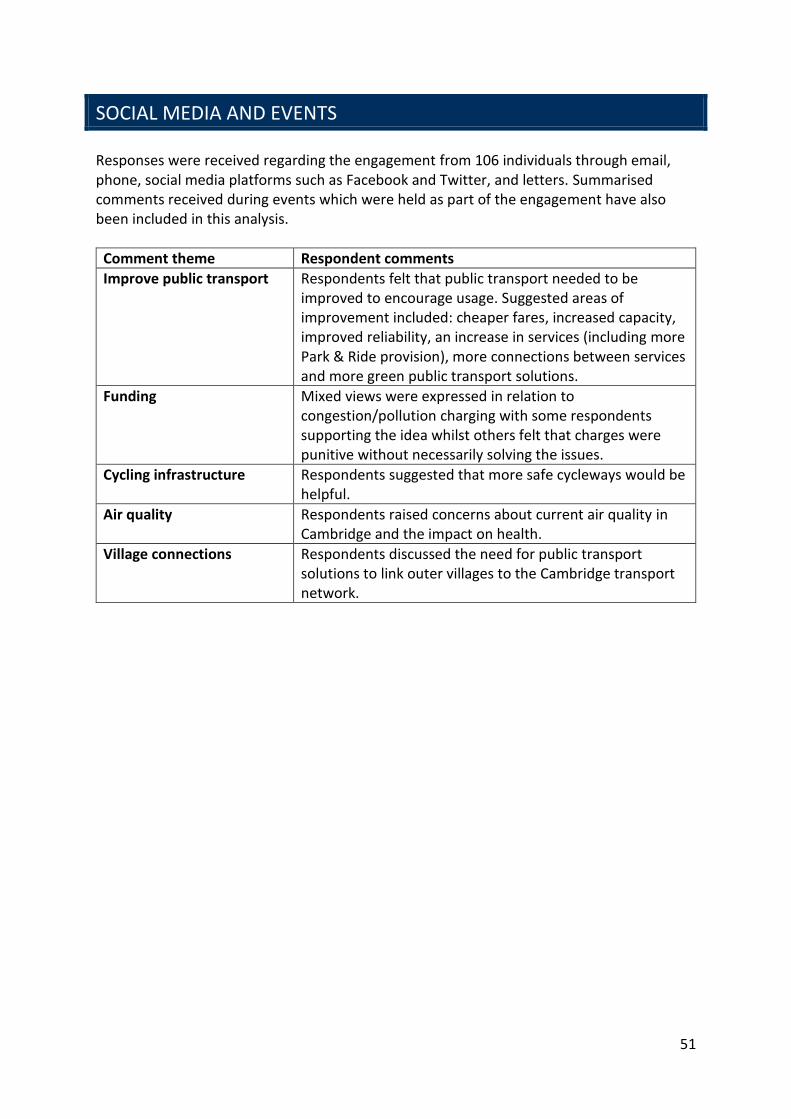
51
SOCIAL MEDIA AND EVENTS Responses were received regarding the engagement from 106 individuals through email, phone, social media platforms such as Facebook and Twitter, and letters. Summarised comments received during events which were held as part of the engagement have also been included in this analysis.
Comment theme Respondent comments
Improve public transport Respondents felt that public transport needed to be improved to encourage usage. Suggested areas of improvement included: cheaper fares, increased capacity, improved reliability, an increase in services (including more Park & Ride provision), more connections between services and more green public transport solutions.
Funding Mixed views were expressed in relation to congestion/pollution charging with some respondents supporting the idea whilst others felt that charges were punitive without necessarily solving the issues.
Cycling infrastructure Respondents suggested that more safe cycleways would be helpful.
Air quality Respondents raised concerns about current air quality in Cambridge and the impact on health.
Village connections Respondents discussed the need for public transport solutions to link outer villages to the Cambridge transport network.
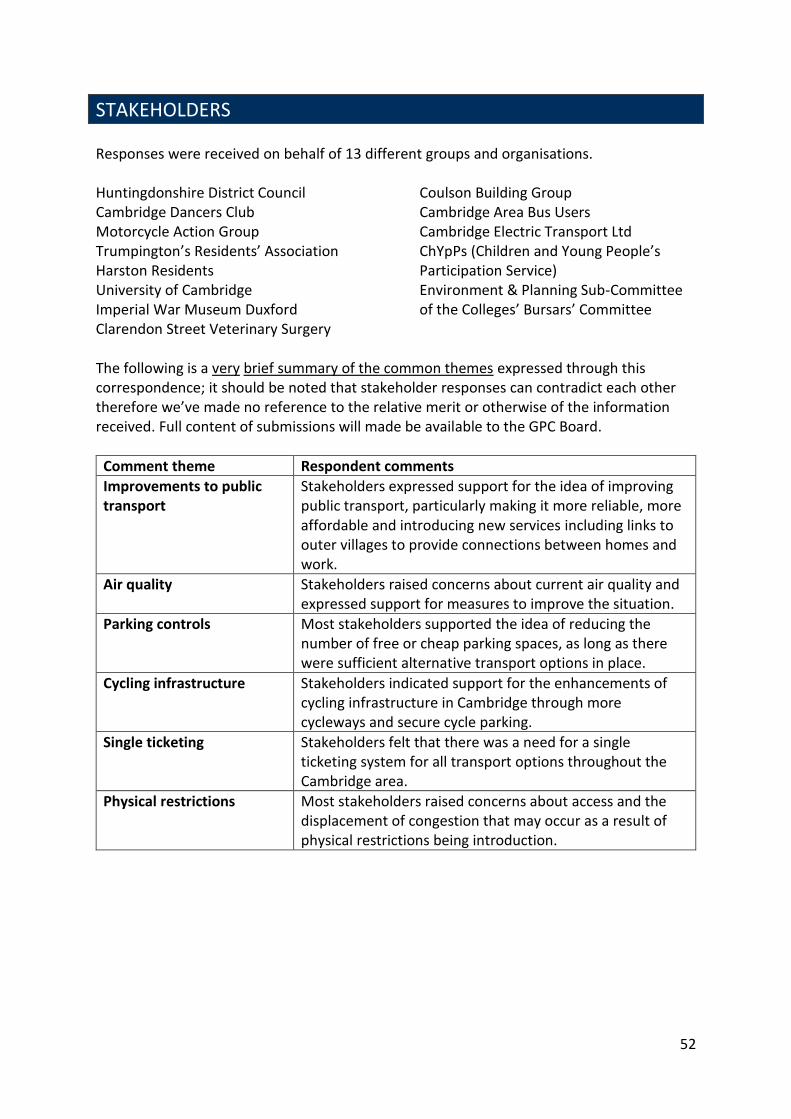
52
STAKEHOLDERS Responses were received on behalf of 13 different groups and organisations. Huntingdonshire District Council Cambridge Dancers Club Motorcycle Action Group Trumpington’s Residents’ Association Harston Residents University of Cambridge Imperial War Museum Duxford Clarendon Street Veterinary Surgery
Coulson Building Group Cambridge Area Bus Users Cambridge Electric Transport Ltd ChYpPs (Children and Young People’s Participation Service) Environment & Planning Sub-Committee of the Colleges’ Bursars’ Committee
The following is a very brief summary of the common themes expressed through this correspondence; it should be noted that stakeholder responses can contradict each other therefore we’ve made no reference to the relative merit or otherwise of the information received. Full content of submissions will made be available to the GPC Board.
Comment theme Respondent comments
Improvements to public transport
Stakeholders expressed support for the idea of improving public transport, particularly making it more reliable, more affordable and introducing new services including links to outer villages to provide connections between homes and work.
Air quality Stakeholders raised concerns about current air quality and expressed support for measures to improve the situation.
Parking controls Most stakeholders supported the idea of reducing the number of free or cheap parking spaces, as long as there were sufficient alternative transport options in place.
Cycling infrastructure Stakeholders indicated support for the enhancements of cycling infrastructure in Cambridge through more cycleways and secure cycle parking.
Single ticketing Stakeholders felt that there was a need for a single ticketing system for all transport options throughout the Cambridge area.
Physical restrictions Most stakeholders raised concerns about access and the displacement of congestion that may occur as a result of physical restrictions being introduction.
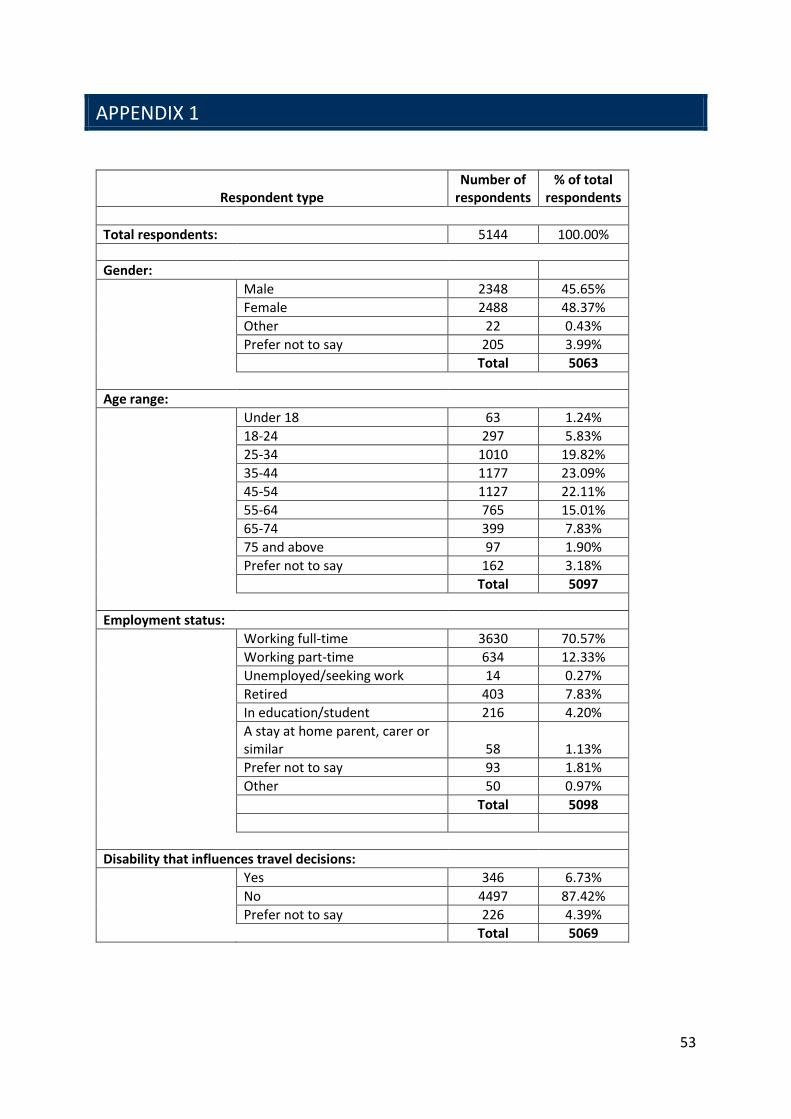
53
APPENDIX 1
Respondent type Number of
respondents % of total
respondents
Total respondents: 5144 100.00%
Gender:
Male 2348 45.65%
Female 2488 48.37%
Other 22 0.43%
Prefer not to say 205 3.99%
Total 5063
Age range: Under 18 63 1.24%
18-24 297 5.83%
25-34 1010 19.82%
35-44 1177 23.09%
45-54 1127 22.11%
55-64 765 15.01%
65-74 399 7.83%
75 and above 97 1.90%
Prefer not to say 162 3.18%
Total 5097
Employment status: Working full-time 3630 70.57%
Working part-time 634 12.33%
Unemployed/seeking work 14 0.27%
Retired 403 7.83%
In education/student 216 4.20%
A stay at home parent, carer or similar 58 1.13%
Prefer not to say 93 1.81%
Other 50 0.97%
Total 5098
Disability that influences travel decisions:
Yes 346 6.73%
No 4497 87.42%
Prefer not to say 226 4.39%
Total 5069
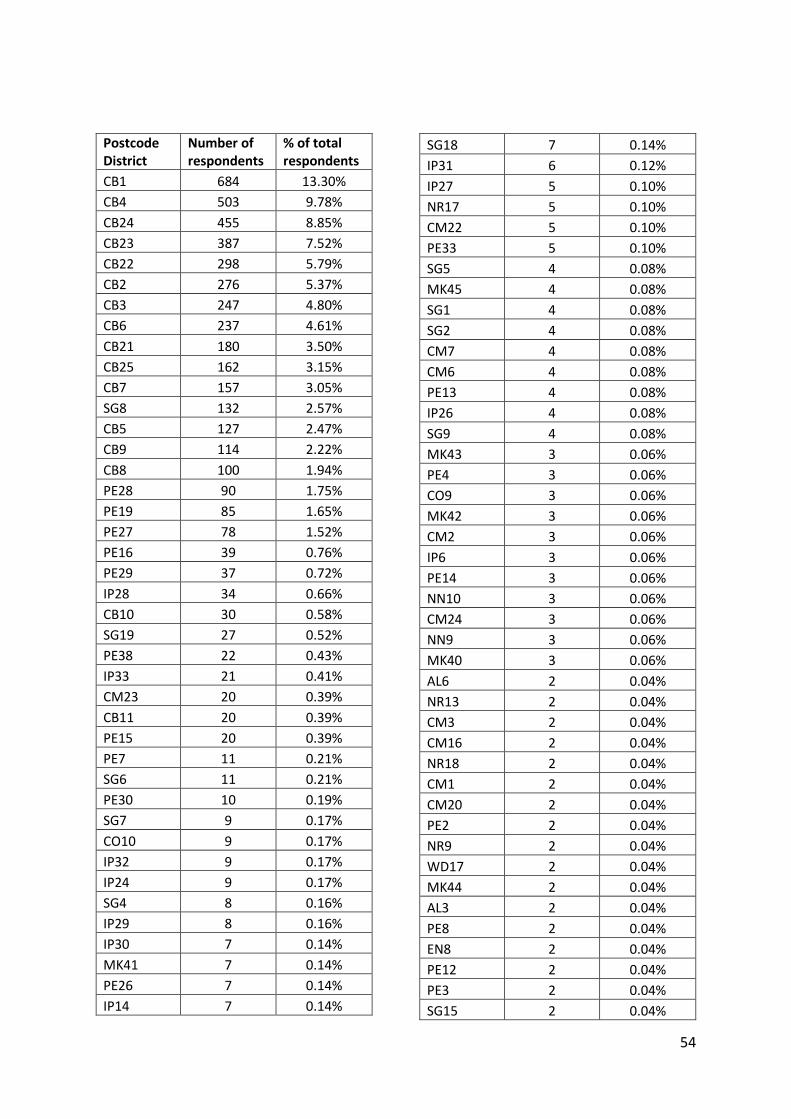
54
Postcode District
Number of respondents
% of total respondents
CB1 684 13.30%
CB4 503 9.78%
CB24 455 8.85%
CB23 387 7.52%
CB22 298 5.79%
CB2 276 5.37%
CB3 247 4.80%
CB6 237 4.61%
CB21 180 3.50%
CB25 162 3.15%
CB7 157 3.05%
SG8 132 2.57%
CB5 127 2.47%
CB9 114 2.22%
CB8 100 1.94%
PE28 90 1.75%
PE19 85 1.65%
PE27 78 1.52%
PE16 39 0.76%
PE29 37 0.72%
IP28 34 0.66%
CB10 30 0.58%
SG19 27 0.52%
PE38 22 0.43%
IP33 21 0.41%
CM23 20 0.39%
CB11 20 0.39%
PE15 20 0.39%
PE7 11 0.21%
SG6 11 0.21%
PE30 10 0.19%
SG7 9 0.17%
CO10 9 0.17%
IP32 9 0.17%
IP24 9 0.17%
SG4 8 0.16%
IP29 8 0.16%
IP30 7 0.14%
MK41 7 0.14%
PE26 7 0.14%
IP14 7 0.14%
SG18 7 0.14%
IP31 6 0.12%
IP27 5 0.10%
NR17 5 0.10%
CM22 5 0.10%
PE33 5 0.10%
SG5 4 0.08%
MK45 4 0.08%
SG1 4 0.08%
SG2 4 0.08%
CM7 4 0.08%
CM6 4 0.08%
PE13 4 0.08%
IP26 4 0.08%
SG9 4 0.08%
MK43 3 0.06%
PE4 3 0.06%
CO9 3 0.06%
MK42 3 0.06%
CM2 3 0.06%
IP6 3 0.06%
PE14 3 0.06%
NN10 3 0.06%
CM24 3 0.06%
NN9 3 0.06%
MK40 3 0.06%
AL6 2 0.04%
NR13 2 0.04%
CM3 2 0.04%
CM16 2 0.04%
NR18 2 0.04%
CM1 2 0.04%
CM20 2 0.04%
PE2 2 0.04%
NR9 2 0.04%
WD17 2 0.04%
MK44 2 0.04%
AL3 2 0.04%
PE8 2 0.04%
EN8 2 0.04%
PE12 2 0.04%
PE3 2 0.04%
SG15 2 0.04%
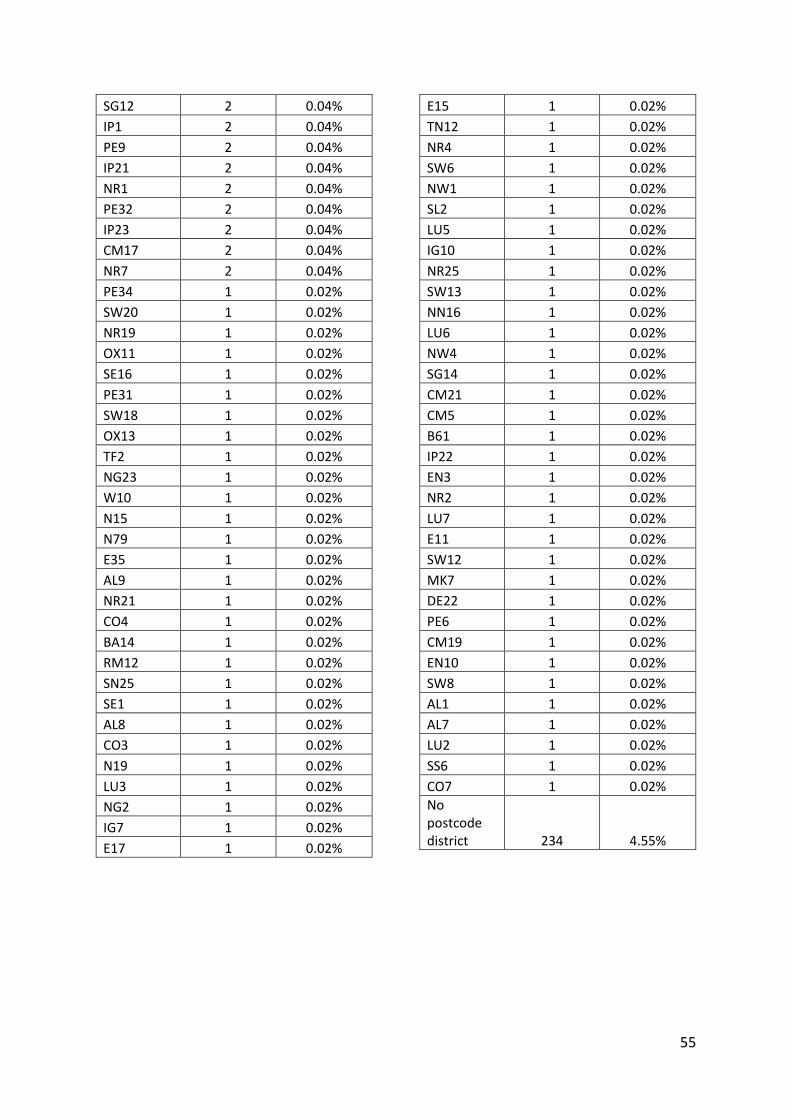
55
SG12 2 0.04%
IP1 2 0.04%
PE9 2 0.04%
IP21 2 0.04%
NR1 2 0.04%
PE32 2 0.04%
IP23 2 0.04%
CM17 2 0.04%
NR7 2 0.04%
PE34 1 0.02%
SW20 1 0.02%
NR19 1 0.02%
OX11 1 0.02%
SE16 1 0.02%
PE31 1 0.02%
SW18 1 0.02%
OX13 1 0.02%
TF2 1 0.02%
NG23 1 0.02%
W10 1 0.02%
N15 1 0.02%
N79 1 0.02%
E35 1 0.02%
AL9 1 0.02%
NR21 1 0.02%
CO4 1 0.02%
BA14 1 0.02%
RM12 1 0.02%
SN25 1 0.02%
SE1 1 0.02%
AL8 1 0.02%
CO3 1 0.02%
N19 1 0.02%
LU3 1 0.02%
NG2 1 0.02%
IG7 1 0.02%
E17 1 0.02%
E15 1 0.02%
TN12 1 0.02%
NR4 1 0.02%
SW6 1 0.02%
NW1 1 0.02%
SL2 1 0.02%
LU5 1 0.02%
IG10 1 0.02%
NR25 1 0.02%
SW13 1 0.02%
NN16 1 0.02%
LU6 1 0.02%
NW4 1 0.02%
SG14 1 0.02%
CM21 1 0.02%
CM5 1 0.02%
B61 1 0.02%
IP22 1 0.02%
EN3 1 0.02%
NR2 1 0.02%
LU7 1 0.02%
E11 1 0.02%
SW12 1 0.02%
MK7 1 0.02%
DE22 1 0.02%
PE6 1 0.02%
CM19 1 0.02%
EN10 1 0.02%
SW8 1 0.02%
AL1 1 0.02%
AL7 1 0.02%
LU2 1 0.02%
SS6 1 0.02%
CO7 1 0.02%
No postcode district 234 4.55%
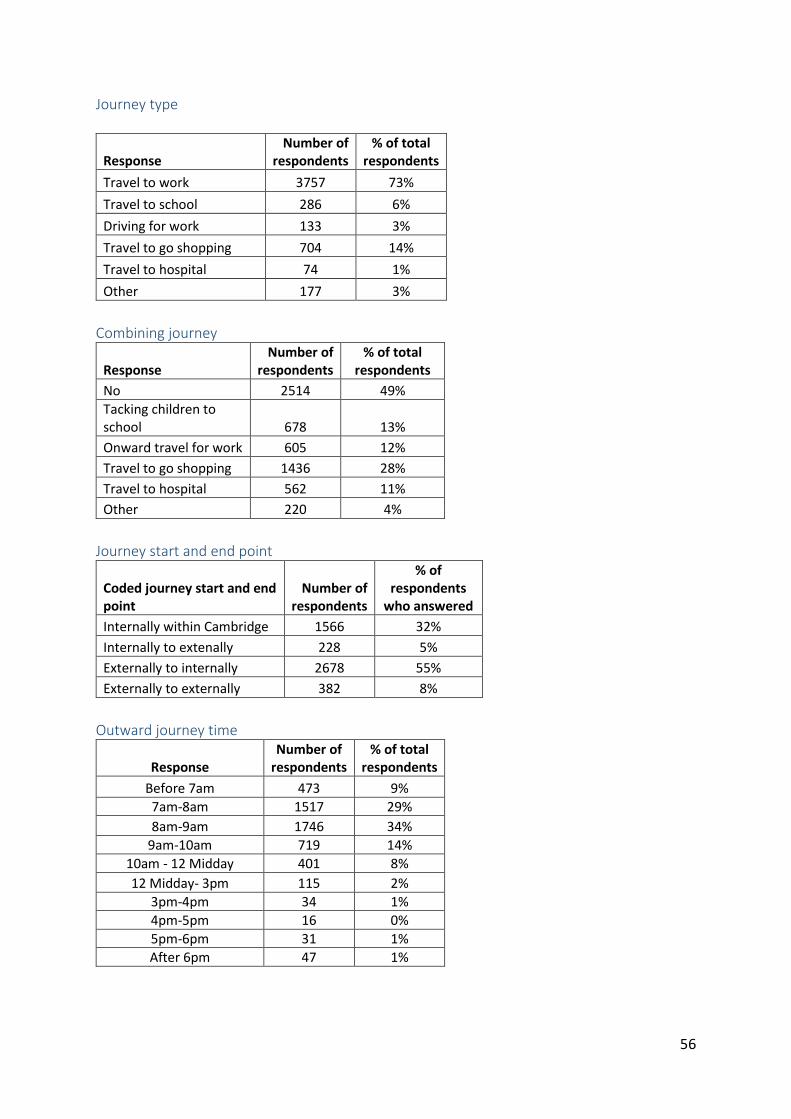
56
Journey type
Response Number of
respondents % of total
respondents
Travel to work 3757 73%
Travel to school 286 6%
Driving for work 133 3%
Travel to go shopping 704 14%
Travel to hospital 74 1%
Other 177 3%
Combining journey
Response Number of
respondents % of total
respondents
No 2514 49%
Tacking children to school 678 13%
Onward travel for work 605 12%
Travel to go shopping 1436 28%
Travel to hospital 562 11%
Other 220 4%
Journey start and end point
Coded journey start and end point
Number of respondents
% of respondents
who answered
Internally within Cambridge 1566 32%
Internally to extenally 228 5%
Externally to internally 2678 55%
Externally to externally 382 8%
Outward journey time
Response Number of
respondents % of total
respondents
Before 7am 473 9%
7am-8am 1517 29%
8am-9am 1746 34%
9am-10am 719 14%
10am - 12 Midday 401 8%
12 Midday- 3pm 115 2%
3pm-4pm 34 1%
4pm-5pm 16 0%
5pm-6pm 31 1%
After 6pm 47 1%
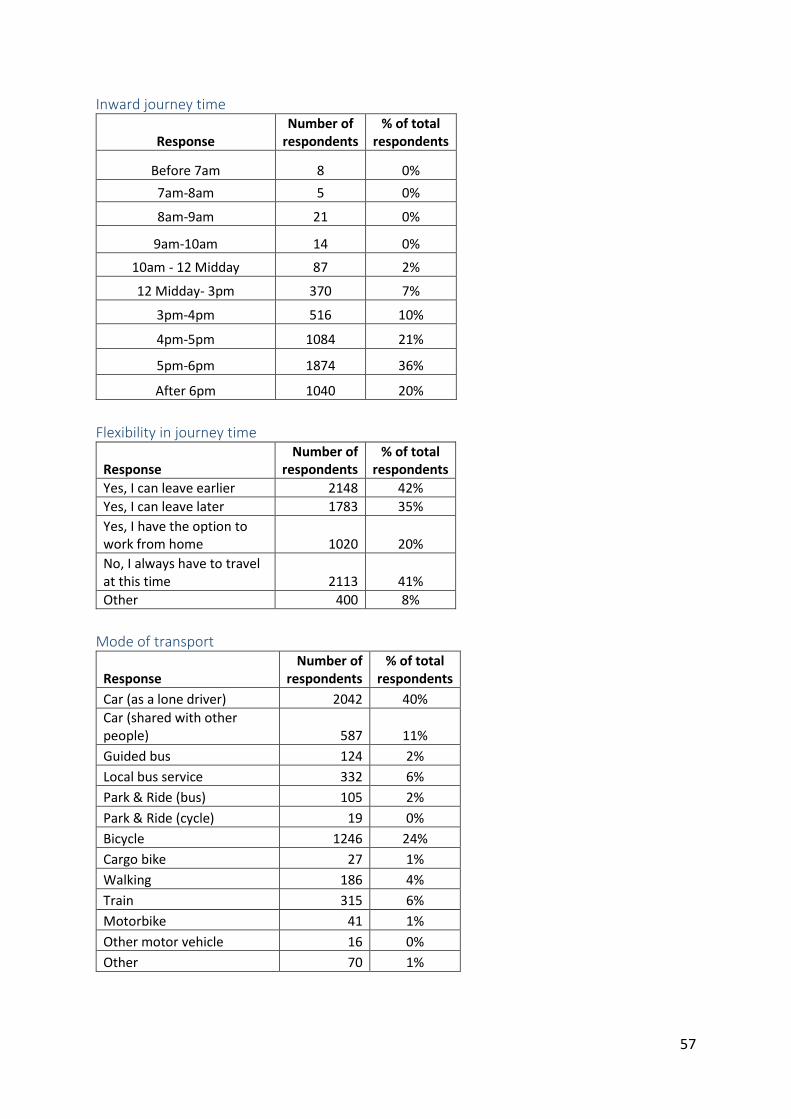
57
Inward journey time
Response Number of
respondents % of total
respondents
Before 7am 8 0%
7am-8am 5 0%
8am-9am 21 0%
9am-10am 14 0%
10am - 12 Midday 87 2%
12 Midday- 3pm 370 7%
3pm-4pm 516 10%
4pm-5pm 1084 21%
5pm-6pm 1874 36%
After 6pm 1040 20%
Flexibility in journey time
Response Number of
respondents % of total
respondents
Yes, I can leave earlier 2148 42%
Yes, I can leave later 1783 35%
Yes, I have the option to work from home 1020 20%
No, I always have to travel at this time 2113 41%
Other 400 8%
Mode of transport
Response Number of
respondents % of total
respondents
Car (as a lone driver) 2042 40%
Car (shared with other people) 587 11%
Guided bus 124 2%
Local bus service 332 6%
Park & Ride (bus) 105 2%
Park & Ride (cycle) 19 0%
Bicycle 1246 24%
Cargo bike 27 1%
Walking 186 4%
Train 315 6%
Motorbike 41 1%
Other motor vehicle 16 0%
Other 70 1%
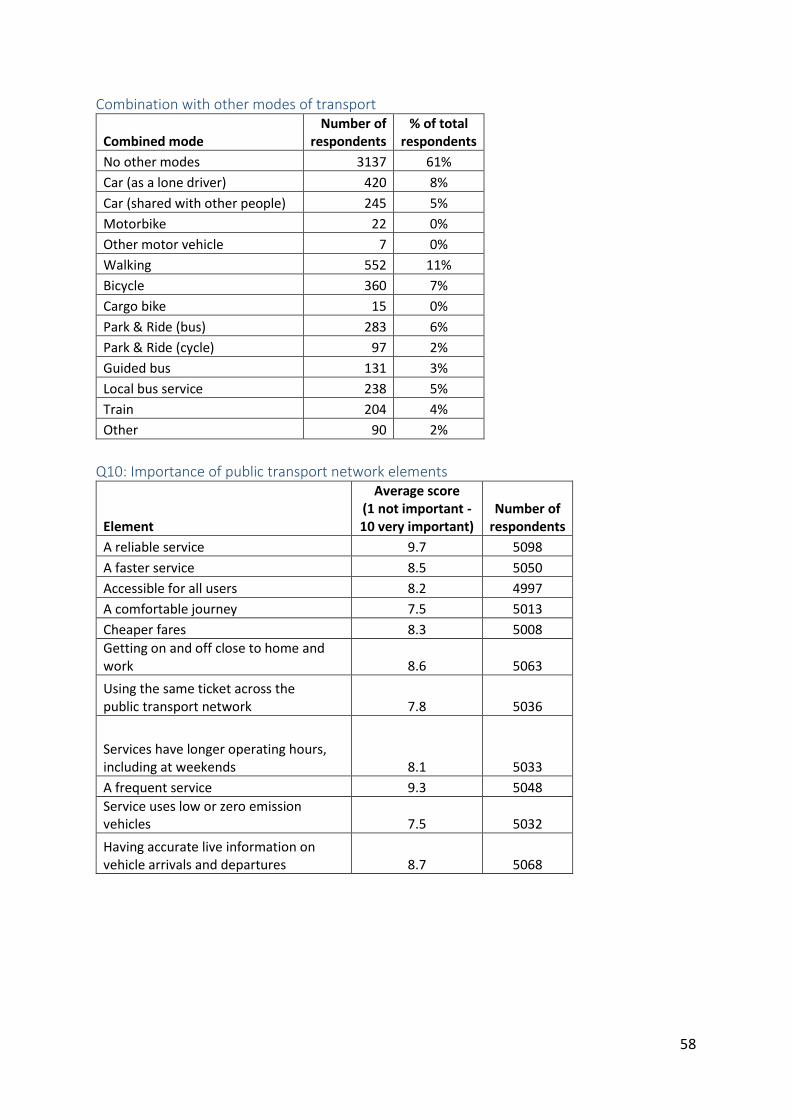
58
Combination with other modes of transport
Combined mode Number of
respondents % of total
respondents
No other modes 3137 61%
Car (as a lone driver) 420 8%
Car (shared with other people) 245 5%
Motorbike 22 0%
Other motor vehicle 7 0%
Walking 552 11%
Bicycle 360 7%
Cargo bike 15 0%
Park & Ride (bus) 283 6%
Park & Ride (cycle) 97 2%
Guided bus 131 3%
Local bus service 238 5%
Train 204 4%
Other 90 2%
Q10: Importance of public transport network elements
Element
Average score (1 not important - 10 very important)
Number of respondents
A reliable service 9.7 5098
A faster service 8.5 5050
Accessible for all users 8.2 4997
A comfortable journey 7.5 5013
Cheaper fares 8.3 5008
Getting on and off close to home and work 8.6 5063
Using the same ticket across the public transport network 7.8 5036
Services have longer operating hours, including at weekends 8.1 5033
A frequent service 9.3 5048
Service uses low or zero emission vehicles 7.5 5032
Having accurate live information on vehicle arrivals and departures 8.7 5068
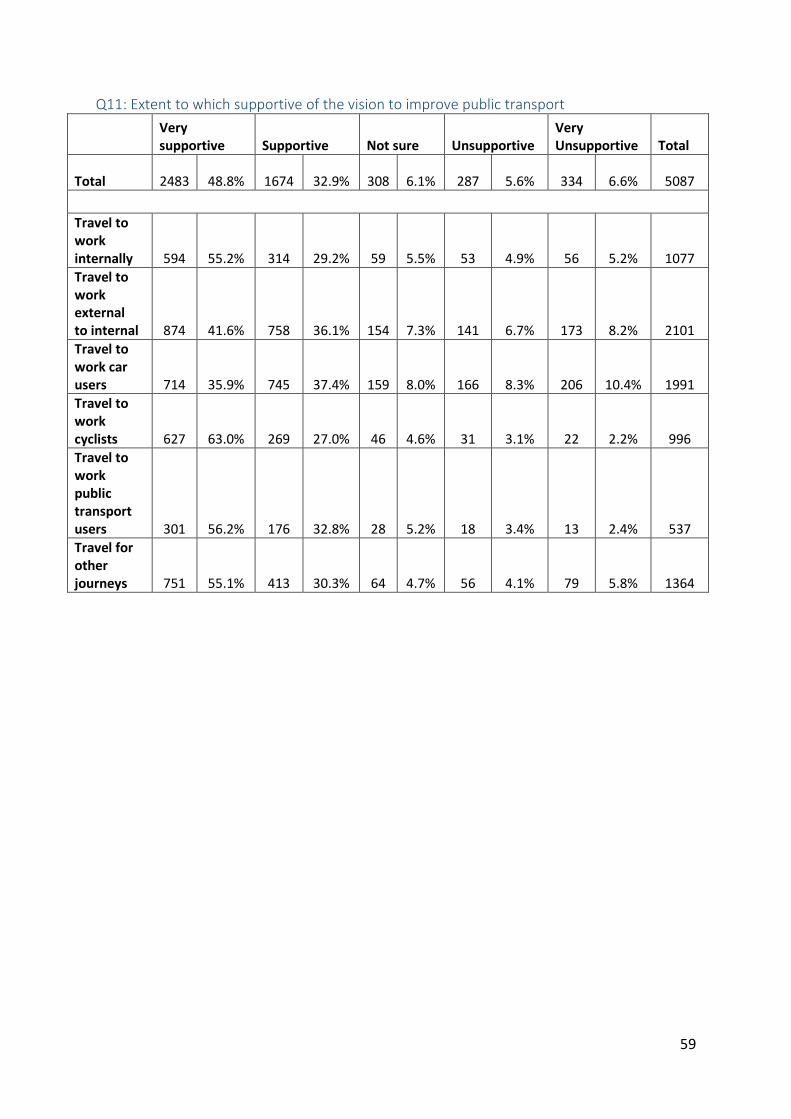
59
Q11: Extent to which supportive of the vision to improve public transport
Very supportive Supportive Not sure Unsupportive
Very Unsupportive Total
Total 2483 48.8% 1674 32.9% 308 6.1% 287 5.6% 334 6.6% 5087
Travel to work internally 594 55.2% 314 29.2% 59 5.5% 53 4.9% 56 5.2% 1077
Travel to work external to internal 874 41.6% 758 36.1% 154 7.3% 141 6.7% 173 8.2% 2101
Travel to work car users 714 35.9% 745 37.4% 159 8.0% 166 8.3% 206 10.4% 1991
Travel to work cyclists 627 63.0% 269 27.0% 46 4.6% 31 3.1% 22 2.2% 996
Travel to work public transport users 301 56.2% 176 32.8% 28 5.2% 18 3.4% 13 2.4% 537
Travel for other journeys 751 55.1% 413 30.3% 64 4.7% 56 4.1% 79 5.8% 1364
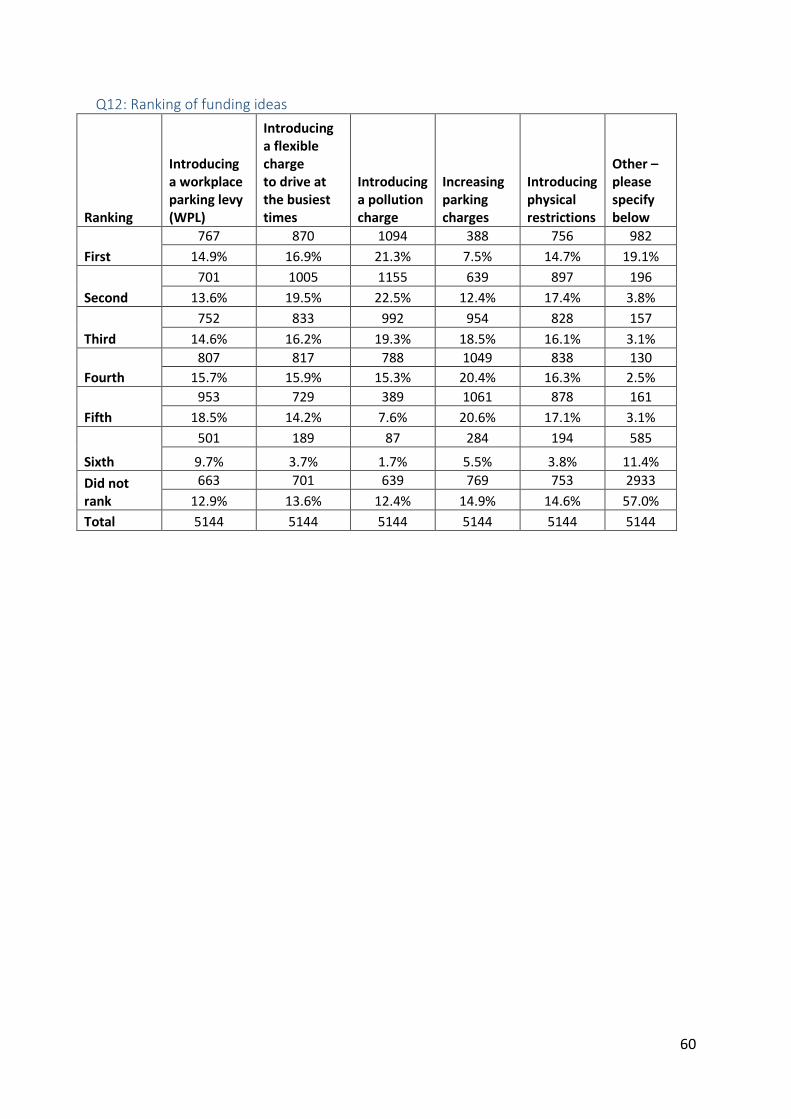
60
Q12: Ranking of funding ideas
Ranking
Introducing a workplace parking levy (WPL)
Introducing a flexible charge to drive at the busiest times
Introducing a pollution charge
Increasing parking charges
Introducing physical restrictions
Other – please specify below
First
767 870 1094 388 756 982
14.9% 16.9% 21.3% 7.5% 14.7% 19.1%
Second
701 1005 1155 639 897 196
13.6% 19.5% 22.5% 12.4% 17.4% 3.8%
Third
752 833 992 954 828 157
14.6% 16.2% 19.3% 18.5% 16.1% 3.1%
Fourth
807 817 788 1049 838 130
15.7% 15.9% 15.3% 20.4% 16.3% 2.5%
Fifth
953 729 389 1061 878 161
18.5% 14.2% 7.6% 20.6% 17.1% 3.1%
Sixth
501 189 87 284 194 585
9.7% 3.7% 1.7% 5.5% 3.8% 11.4%
Did not rank
663 701 639 769 753 2933
12.9% 13.6% 12.4% 14.9% 14.6% 57.0%
Total 5144 5144 5144 5144 5144 5144
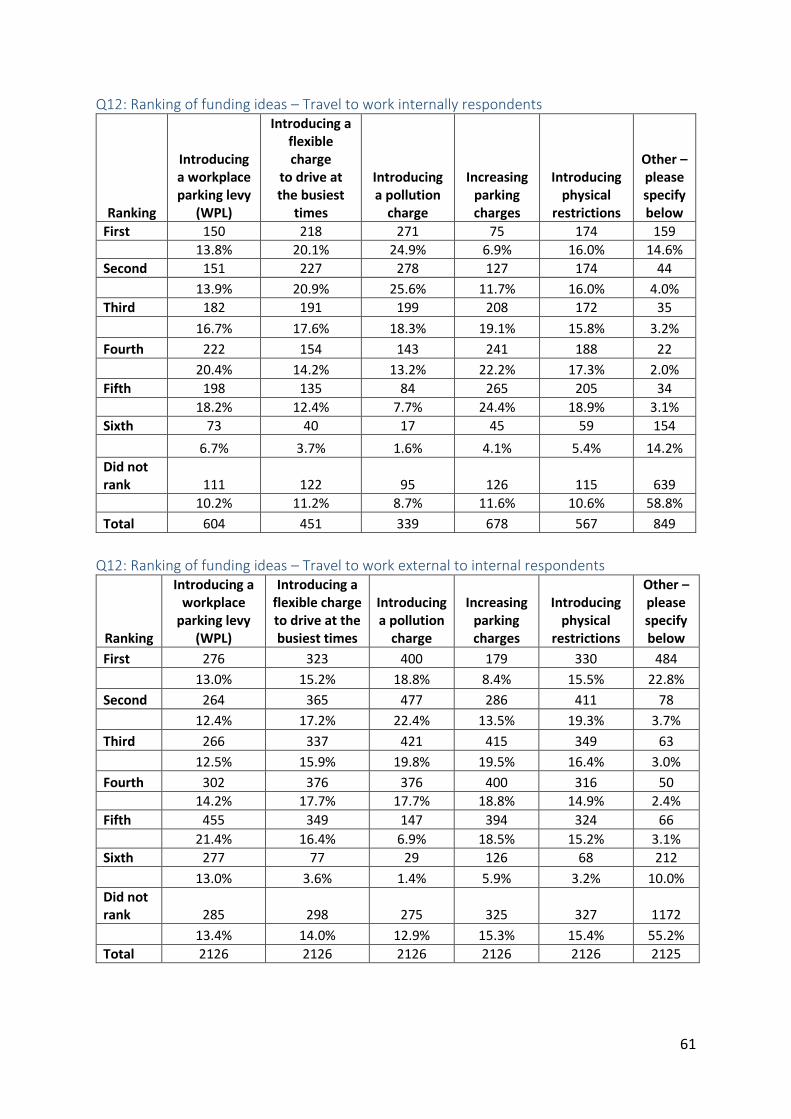
61
Q12: Ranking of funding ideas – Travel to work internally respondents
Ranking
Introducing a workplace parking levy
(WPL)
Introducing a flexible charge
to drive at the busiest
times
Introducing a pollution
charge
Increasing parking charges
Introducing physical
restrictions
Other – please specify below
First 150 218 271 75 174 159
13.8% 20.1% 24.9% 6.9% 16.0% 14.6%
Second 151 227 278 127 174 44
13.9% 20.9% 25.6% 11.7% 16.0% 4.0%
Third 182 191 199 208 172 35
16.7% 17.6% 18.3% 19.1% 15.8% 3.2%
Fourth 222 154 143 241 188 22
20.4% 14.2% 13.2% 22.2% 17.3% 2.0%
Fifth 198 135 84 265 205 34
18.2% 12.4% 7.7% 24.4% 18.9% 3.1%
Sixth 73 40 17 45 59 154
6.7% 3.7% 1.6% 4.1% 5.4% 14.2%
Did not rank 111 122 95 126 115 639
10.2% 11.2% 8.7% 11.6% 10.6% 58.8%
Total 604 451 339 678 567 849
Q12: Ranking of funding ideas – Travel to work external to internal respondents
Ranking
Introducing a workplace
parking levy (WPL)
Introducing a flexible charge to drive at the busiest times
Introducing a pollution
charge
Increasing parking charges
Introducing physical
restrictions
Other – please specify below
First 276 323 400 179 330 484
13.0% 15.2% 18.8% 8.4% 15.5% 22.8%
Second 264 365 477 286 411 78
12.4% 17.2% 22.4% 13.5% 19.3% 3.7%
Third 266 337 421 415 349 63
12.5% 15.9% 19.8% 19.5% 16.4% 3.0%
Fourth 302 376 376 400 316 50
14.2% 17.7% 17.7% 18.8% 14.9% 2.4%
Fifth 455 349 147 394 324 66
21.4% 16.4% 6.9% 18.5% 15.2% 3.1%
Sixth 277 77 29 126 68 212
13.0% 3.6% 1.4% 5.9% 3.2% 10.0%
Did not rank 285 298 275 325 327 1172
13.4% 14.0% 12.9% 15.3% 15.4% 55.2%
Total 2126 2126 2126 2126 2126 2125
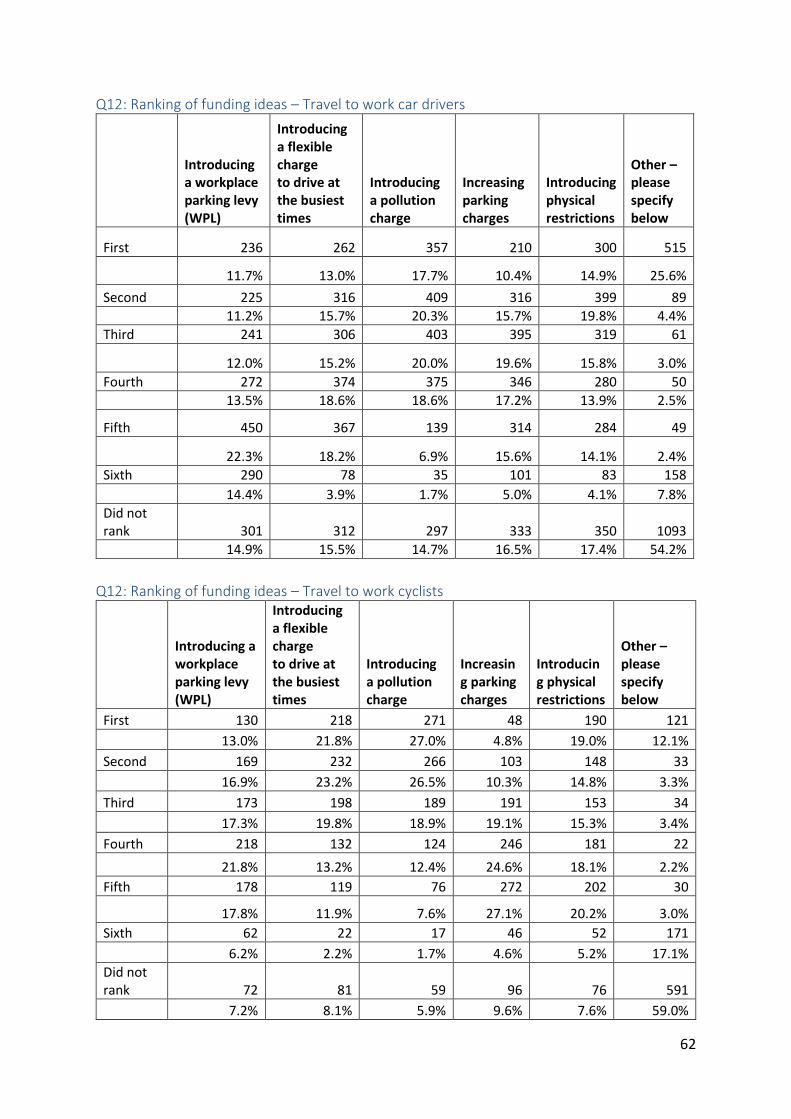
62
Q12: Ranking of funding ideas – Travel to work car drivers
Introducing a workplace parking levy (WPL)
Introducing a flexible charge to drive at the busiest times
Introducing a pollution charge
Increasing parking charges
Introducing physical restrictions
Other – please specify below
First 236 262 357 210 300 515
11.7% 13.0% 17.7% 10.4% 14.9% 25.6%
Second 225 316 409 316 399 89
11.2% 15.7% 20.3% 15.7% 19.8% 4.4%
Third 241 306 403 395 319 61
12.0% 15.2% 20.0% 19.6% 15.8% 3.0%
Fourth 272 374 375 346 280 50
13.5% 18.6% 18.6% 17.2% 13.9% 2.5%
Fifth 450 367 139 314 284 49
22.3% 18.2% 6.9% 15.6% 14.1% 2.4%
Sixth 290 78 35 101 83 158
14.4% 3.9% 1.7% 5.0% 4.1% 7.8%
Did not rank 301 312 297 333 350 1093
14.9% 15.5% 14.7% 16.5% 17.4% 54.2%
Q12: Ranking of funding ideas – Travel to work cyclists
Introducing a workplace parking levy (WPL)
Introducing a flexible charge to drive at the busiest times
Introducing a pollution charge
Increasing parking charges
Introducing physical restrictions
Other – please specify below
First 130 218 271 48 190 121
13.0% 21.8% 27.0% 4.8% 19.0% 12.1%
Second 169 232 266 103 148 33
16.9% 23.2% 26.5% 10.3% 14.8% 3.3%
Third 173 198 189 191 153 34
17.3% 19.8% 18.9% 19.1% 15.3% 3.4%
Fourth 218 132 124 246 181 22
21.8% 13.2% 12.4% 24.6% 18.1% 2.2%
Fifth 178 119 76 272 202 30
17.8% 11.9% 7.6% 27.1% 20.2% 3.0%
Sixth 62 22 17 46 52 171
6.2% 2.2% 1.7% 4.6% 5.2% 17.1%
Did not rank 72 81 59 96 76 591
7.2% 8.1% 5.9% 9.6% 7.6% 59.0%
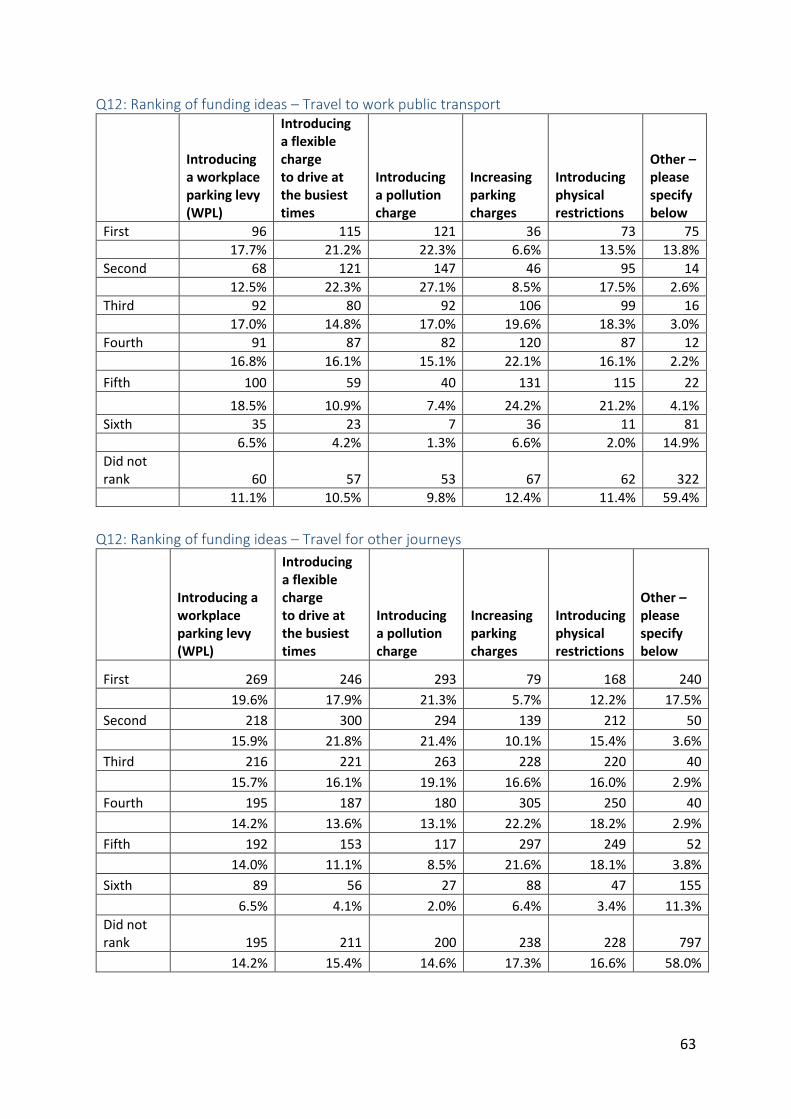
63
Q12: Ranking of funding ideas – Travel to work public transport
Introducing a workplace parking levy (WPL)
Introducing a flexible charge to drive at the busiest times
Introducing a pollution charge
Increasing parking charges
Introducing physical restrictions
Other – please specify below
First 96 115 121 36 73 75
17.7% 21.2% 22.3% 6.6% 13.5% 13.8%
Second 68 121 147 46 95 14
12.5% 22.3% 27.1% 8.5% 17.5% 2.6%
Third 92 80 92 106 99 16
17.0% 14.8% 17.0% 19.6% 18.3% 3.0%
Fourth 91 87 82 120 87 12
16.8% 16.1% 15.1% 22.1% 16.1% 2.2%
Fifth 100 59 40 131 115 22
18.5% 10.9% 7.4% 24.2% 21.2% 4.1%
Sixth 35 23 7 36 11 81
6.5% 4.2% 1.3% 6.6% 2.0% 14.9%
Did not rank 60 57 53 67 62 322
11.1% 10.5% 9.8% 12.4% 11.4% 59.4%
Q12: Ranking of funding ideas – Travel for other journeys
Introducing a workplace parking levy (WPL)
Introducing a flexible charge to drive at the busiest times
Introducing a pollution charge
Increasing parking charges
Introducing physical restrictions
Other – please specify below
First 269 246 293 79 168 240
19.6% 17.9% 21.3% 5.7% 12.2% 17.5%
Second 218 300 294 139 212 50
15.9% 21.8% 21.4% 10.1% 15.4% 3.6%
Third 216 221 263 228 220 40
15.7% 16.1% 19.1% 16.6% 16.0% 2.9%
Fourth 195 187 180 305 250 40
14.2% 13.6% 13.1% 22.2% 18.2% 2.9%
Fifth 192 153 117 297 249 52
14.0% 11.1% 8.5% 21.6% 18.1% 3.8%
Sixth 89 56 27 88 47 155
6.5% 4.1% 2.0% 6.4% 3.4% 11.3%
Did not rank 195 211 200 238 228 797
14.2% 15.4% 14.6% 17.3% 16.6% 58.0%
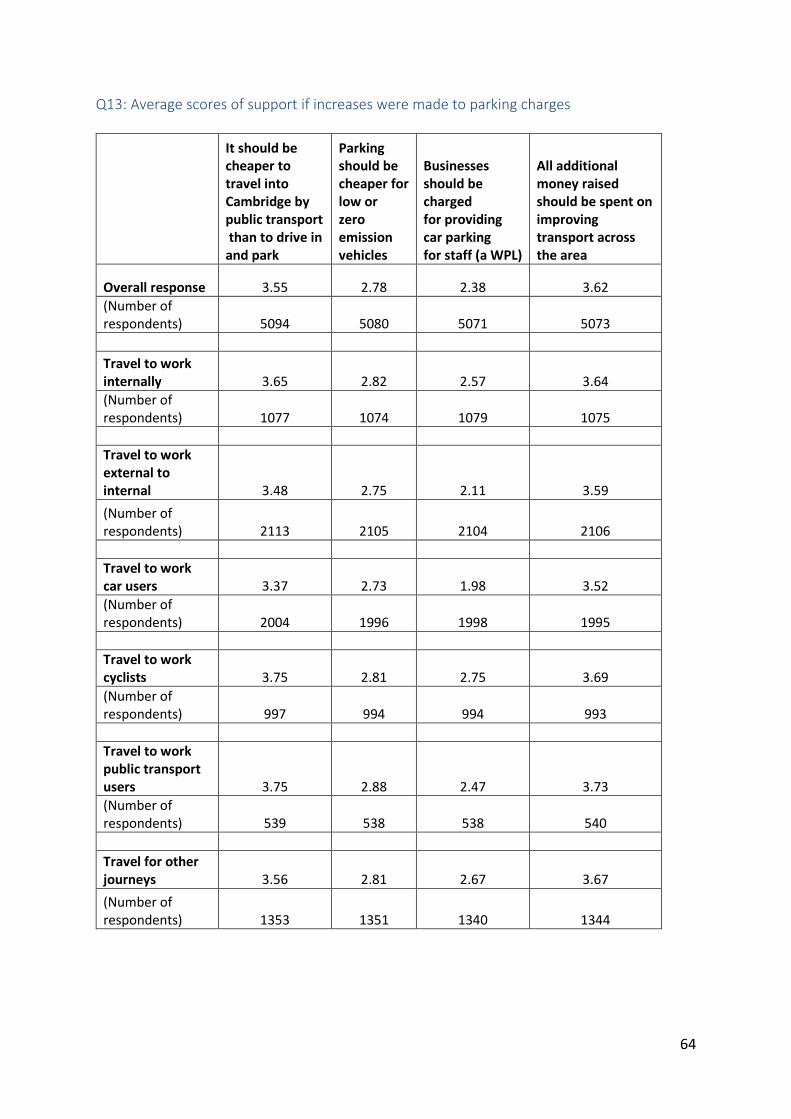
64
Q13: Average scores of support if increases were made to parking charges
It should be cheaper to travel into Cambridge by public transport than to drive in and park
Parking should be cheaper for low or zero emission vehicles
Businesses should be charged for providing car parking for staff (a WPL)
All additional money raised should be spent on improving transport across the area
Overall response 3.55 2.78 2.38 3.62
(Number of respondents) 5094 5080 5071 5073
Travel to work internally 3.65 2.82 2.57 3.64
(Number of respondents) 1077 1074 1079 1075
Travel to work external to internal 3.48 2.75 2.11 3.59
(Number of respondents) 2113 2105 2104 2106
Travel to work car users 3.37 2.73 1.98 3.52
(Number of respondents) 2004 1996 1998 1995
Travel to work cyclists 3.75 2.81 2.75 3.69
(Number of respondents) 997 994 994 993
Travel to work public transport users 3.75 2.88 2.47 3.73
(Number of respondents) 539 538 538 540
Travel for other journeys 3.56 2.81 2.67 3.67
(Number of respondents) 1353 1351 1340 1344
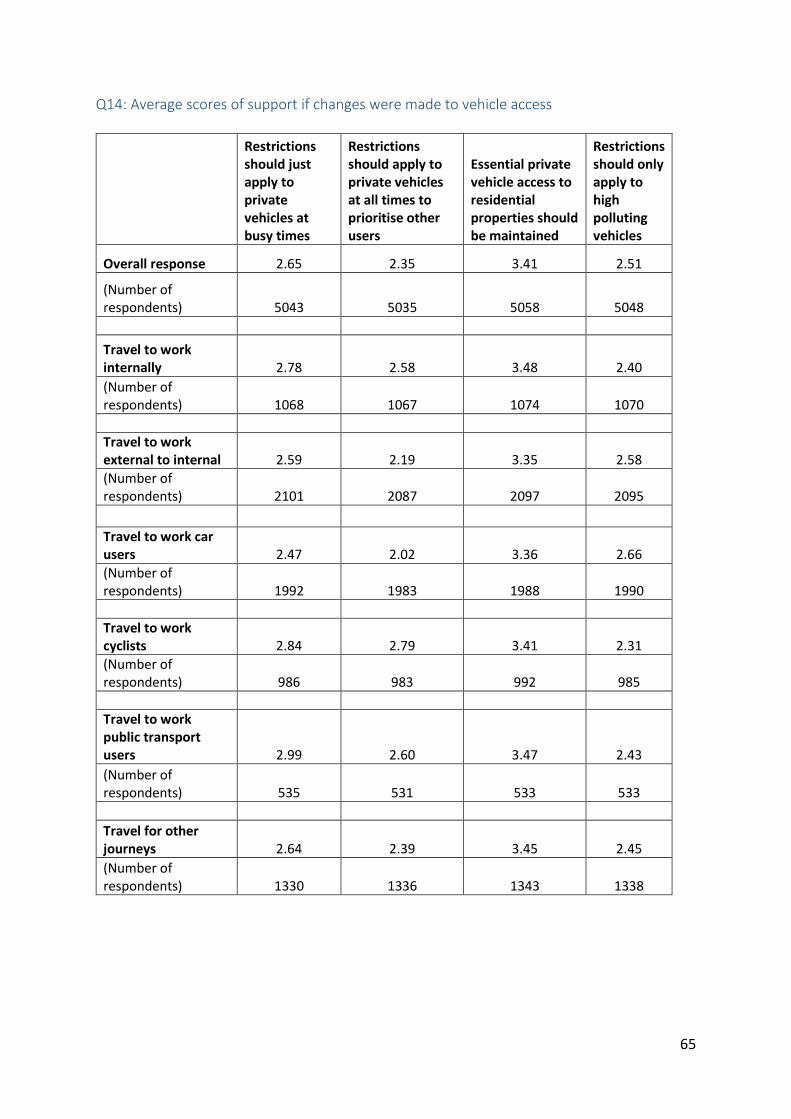
65
Q14: Average scores of support if changes were made to vehicle access
Restrictions should just apply to private vehicles at busy times
Restrictions should apply to private vehicles at all times to prioritise other users
Essential private vehicle access to residential properties should be maintained
Restrictions should only apply to high polluting vehicles
Overall response 2.65 2.35 3.41 2.51
(Number of respondents) 5043 5035 5058 5048
Travel to work internally 2.78 2.58 3.48 2.40
(Number of respondents) 1068 1067 1074 1070
Travel to work external to internal 2.59 2.19 3.35 2.58
(Number of respondents) 2101 2087 2097 2095
Travel to work car users 2.47 2.02 3.36 2.66
(Number of respondents) 1992 1983 1988 1990
Travel to work cyclists 2.84 2.79 3.41 2.31
(Number of respondents) 986 983 992 985
Travel to work public transport users 2.99 2.60 3.47 2.43
(Number of respondents) 535 531 533 533
Travel for other journeys 2.64 2.39 3.45 2.45
(Number of respondents) 1330 1336 1343 1338

66
Q15: Average scores support if flexible/pollution charging was introduced
It should be cheaper to travel into Cambridge by public transport than to pay a charge
High polluting vehicles should be charged to drive in Cambridge
High polluting vehicles should be charged more than other vehicles
Cars with fewer occupants should be charged more
Money raised should be spent on improving transport across the area
The charge at congested times should be higher than at quieter times
The charge should only apply at congested times
Overall response 3.56 3.10 3.09 2.31 3.65 2.84 2.76
(Number of respondents) 5055 5055 5031 5031 5034 5024 5002
Travel to work internally 3.63 3.28 3.22 2.68 3.69 3.09 2.78
(Number of respondents) 1076 1077 1069 1071 1067 1068 1065
Travel to work external to internal 3.49 2.98 2.99 2.11 3.62 2.68 2.77
(Number of respondents) 2089 2091 2080 2085 2084 2084 2073
Travel to work car users 3.38 2.94 2.95 1.93 3.56 2.54 2.78
(Number of respondents) 1979 1981 1975 1977 1977 1979 1967
Travel to work cyclists 3.72 3.34 3.28 2.93 3.75 3.24 2.75
(Number of respondents) 994 994 987 987 981 985 983
Travel to work public transport users 3.75 3.12 3.09 2.45 3.74 3.01 2.82
(Number of respondents) 535 535 531 532 537 532 525
Travel for other journeys 3.62 3.13 3.12 2.33 3.67 2.88 2.72
(Number of respondents) 1348 1344 1338 1337 1340 1328 1327
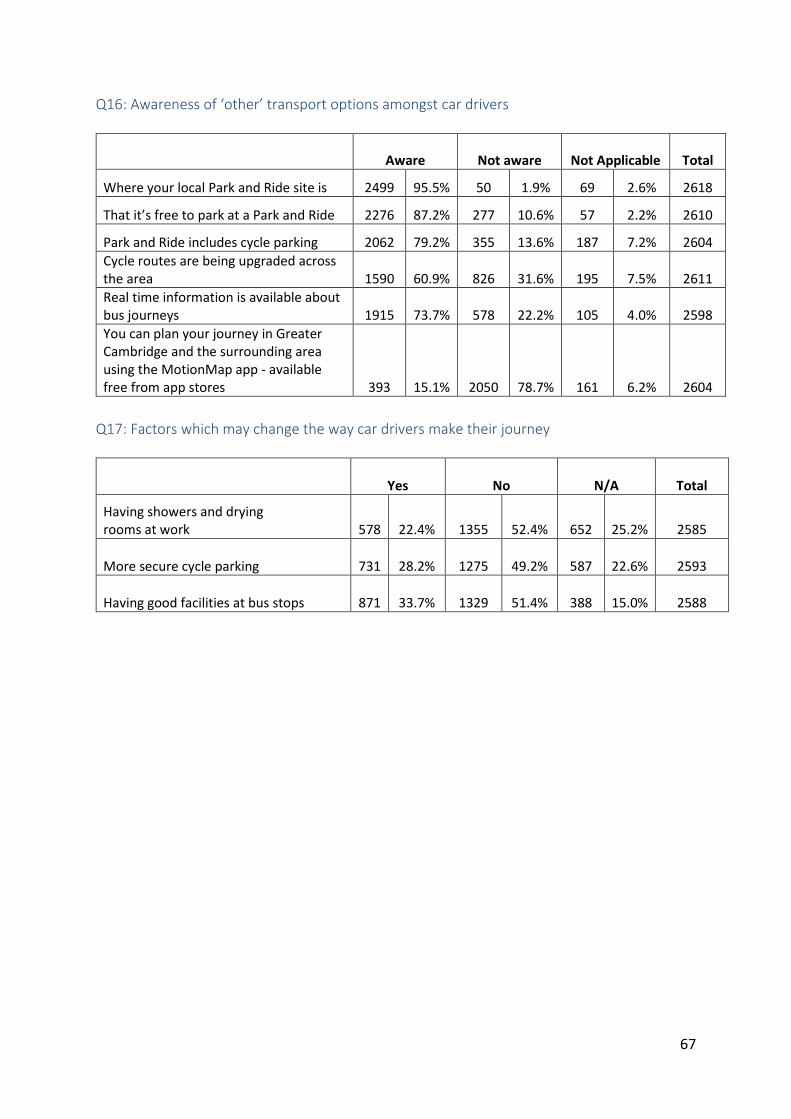
67
Q16: Awareness of ‘other’ transport options amongst car drivers
Aware Not aware Not Applicable Total
Where your local Park and Ride site is 2499 95.5% 50 1.9% 69 2.6% 2618
That it’s free to park at a Park and Ride 2276 87.2% 277 10.6% 57 2.2% 2610
Park and Ride includes cycle parking 2062 79.2% 355 13.6% 187 7.2% 2604
Cycle routes are being upgraded across the area 1590 60.9% 826 31.6% 195 7.5% 2611
Real time information is available about bus journeys 1915 73.7% 578 22.2% 105 4.0% 2598
You can plan your journey in Greater Cambridge and the surrounding area using the MotionMap app - available free from app stores 393 15.1% 2050 78.7% 161 6.2% 2604
Q17: Factors which may change the way car drivers make their journey
Yes No N/A Total
Having showers and drying rooms at work 578 22.4% 1355 52.4% 652 25.2% 2585
More secure cycle parking 731 28.2% 1275 49.2% 587 22.6% 2593
Having good facilities at bus stops 871 33.7% 1329 51.4% 388 15.0% 2588