cholesterol oxidation in roasted salmon fish with
TRANSCRIPT
Louisiana State UniversityLSU Digital Commons
LSU Master's Theses Graduate School
2005
Cholesterol oxidation in roasted salmon fish withdifferent cooking oilsTing ZhangLouisiana State University and Agricultural and Mechanical College, [email protected]
Follow this and additional works at: https://digitalcommons.lsu.edu/gradschool_theses
Part of the Life Sciences Commons
This Thesis is brought to you for free and open access by the Graduate School at LSU Digital Commons. It has been accepted for inclusion in LSUMaster's Theses by an authorized graduate school editor of LSU Digital Commons. For more information, please contact [email protected].
Recommended CitationZhang, Ting, "Cholesterol oxidation in roasted salmon fish with different cooking oils" (2005). LSU Master's Theses. 408.https://digitalcommons.lsu.edu/gradschool_theses/408
CHOLESTEROL OXIDATION IN ROASTED SALMON FISH WITH DIFFERENT COOKING OILS
A Thesis Submitted to the Graduate Faculty of the
Louisiana State University and Agricultural and Mechanical College
in partial fulfillment of the requirements for the degree of
Master of Science
in
the Department of Food Science
by Ting Zhang
B.S. Beijing University of Chemical Technology, 2000 M.S., Louisiana State University, 2003
May 2005
ii
Acknowledgements
It is a pleasure to thank the many people who made this thesis possible.
It is difficult to overstate my gratitude to my supervisor, Dr. Zhimin Xu, who has
brought me extraordinary research opportunities, supervised me, provided resources
and subjects, and offered direction. With his enthusiasm, his inspiration, and his great
efforts to explain things clearly and simply, he helped to make the experiments fun for
me. Throughout my thesis-writing period, he provided encouragement, sound advice,
good teaching, and lots of good ideas.
I would like to thank my committee member, Dr. Witoon Prinyawiwatkul and Dr.
Jon Bell, for passing me many leads and helping to set up the project.
I wish to thank my entire extended family for their supporting.
iii
Table of Contents
Acknowledgements ......................................................................................................ii
List of Tables.................................................................................................................v
List of Figures..............................................................................................................vi
Abstract..................................................................................................................... viii
Chapter 1 Introduction................................................................................................1
Chapter 2. Review of Literature .................................................................................3 2.1. Cholesterol Oxidation .................................................................................3 2.1.1. Chemical Structure of Cholesterol and Cholesterol Oxidation
Products........................................................................................................3 2.1.2. Autoxidation.............................................................................................5 2.1.2.1. Kinetic Model of Cholesterol Autoxidation During Heating................5 2.1.2.2. Formation of Cholesterol Oxidation Products During Heating ............7 2.1.3. Photooxidation .........................................................................................8 2.2. Toxicity of Cholesterol Oxidation Products..............................................10 2.3. Effect of Food Components on Cholesterol Oxidation.............................11 2.3.1. Lipids in Foods ......................................................................................11 2.3.2. Antioxidants in Foods ............................................................................13 2.3.2.1. Ascorbyl Palmitate and α-Tocopherol.................................................14 2.3.2.2. Antioxidant in Plant Oils.....................................................................15 2.3.2.3. Phytosterol ..........................................................................................17 2.4. Fish and Fish Products ..............................................................................17 2.5. Cholesterol Extraction and Analysis.........................................................19 2.5.1 Saponification and Extraction.................................................................19 2.5.2. HPLC Analysis.......................................................................................20 2.5.3. GC Analysis ...........................................................................................21 2.5.4. Comparison of HPLC and GC-MS........................................................23
Chapter 3 Methodology .............................................................................................24 3.1. Cholesterol and Cholesterol Oxidation Products Analysis Using
GC-MS.......................................................................................................24 3.1.1. GC-MS Operating Condition.................................................................24 3.1.3. Determination of Cholesterol and Cholesterol Oxidation Products ......24 3.1.3.1. Identification .......................................................................................24 3.1.3.2. Standard Curves and Quantification ...................................................26 3.2. Cholesterol Oxidation Model....................................................................27 3.2.1. Stock Solution ........................................................................................27 3.2.2. Cholesterol Oxidation Test Tube Preparation ........................................27 3.2.3. Heating Conditions ................................................................................28
iv
3.3. Lab Prepared Soybean or Rice Bran Oil...................................................29 3.4. Treatments Groups with Various Cooking Oils ........................................30 3.5. Cholesterol Oxidation in Salmon Fish Meat with and Without
Cooking Oils ..............................................................................................32 3.5.1. Salmon Sample Preparation...................................................................32 3.5.2. Moisture Content ...................................................................................32 3.5.3. Roasting Control and Treatment of Salmon Fish Meat .........................32 3.5.4. Oil Extraction from Salmon Samples ....................................................33 3.6. Vitamin E Analysis Using HPLC..............................................................34 3.7. Statistical Analysis ....................................................................................35
Chapter 4 Results and Discussions ...........................................................................36 4.1. Cholesterol and Cholesterol Oxidation Products Analysis Method..........36 4.1.1. GC Column Selection for the Cholesterol Analysis ..............................36 4.1.2. GC-MS Operating Conditions ...............................................................37 4.1.3. Other GC Method ..................................................................................39 4.1.3.2. TLC Method........................................................................................40 4.1.3.3. HPLC Method.....................................................................................41 4.1.3.4. Advantages of Our GC-MS Method ...................................................41 4.1.4. Standard Curves .....................................................................................42 4.2. Oil Extraction............................................................................................43 4.2.1. Extraction Yield .....................................................................................43 4.2.2. Comparison of Lab Prepared and Commercial Oils ..............................44 4.2.2.1. Color, Physical and Chemical Differences .........................................44 4.2.2.2. Industry Process of Refining Oil.........................................................44 4.3. Cholesterol Oxidation Model....................................................................45 4.3.1. Cholesterol Oxidation ............................................................................45 4.3.2. COP Formation ......................................................................................47 4.4. Vitamin E Contents in Cooking Oils.........................................................49 4.5. Cholesterol Oxidation with Different Cooking Oils Treatment................52 4.6. Cholesterol and Cholesterol Oxidation Products in Salmon Fish
Meat with and without Cooking Oils.........................................................58 4.6.1 Salmon Samples......................................................................................58 4.6.2. Cholesterol Oxidation in Salmon Fish Meat..........................................60 4.6.3. Cholesterol Oxidation Product Formation .............................................62
Chapter 5 Conclusions...............................................................................................64
References ...................................................................................................................65
Vita ..............................................................................................................................72
v
List of Tables
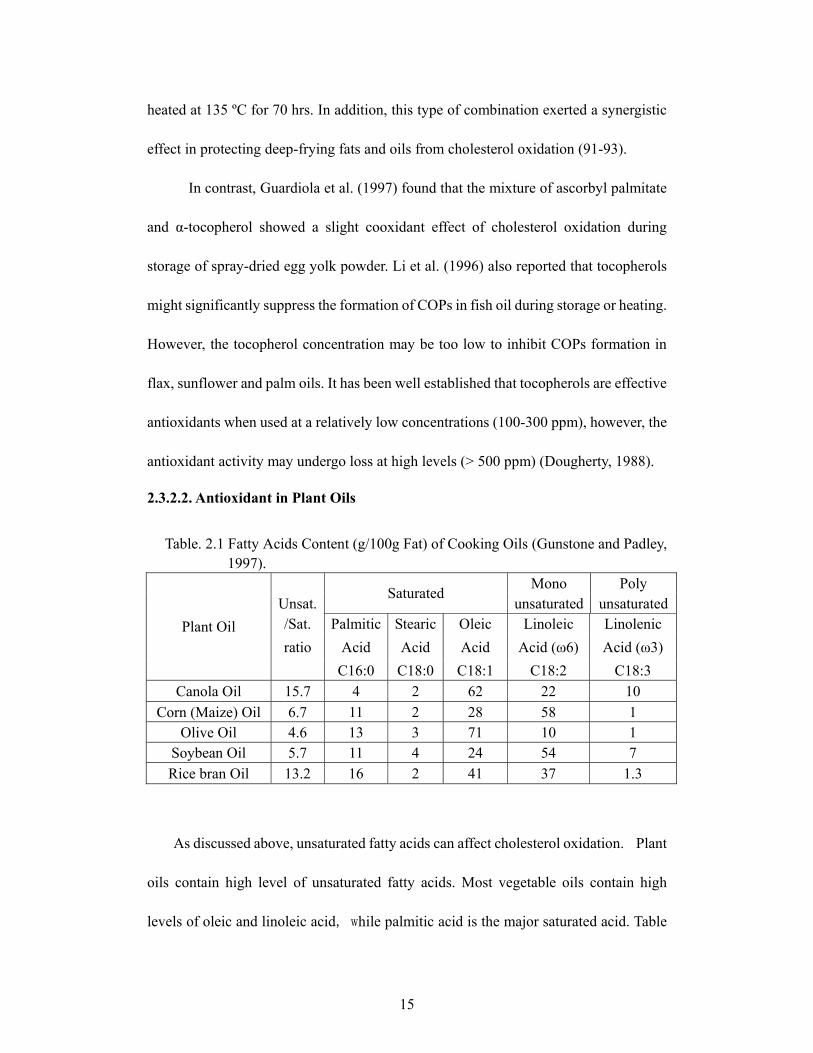
Table. 2.1 Fatty Acids Content (G/100g Fat) of Cooking Oils (Gunstone and Padley, 1997)....................................................................................................15
Table 3.1 The Amount of Injection Used to Make Standard Curves of 5α-Cholestane, Cholesterol and 7-Ketocholesterol...................................................................26
Table 3.2 Cholesterol Sample Heating Times and Temperatures ................................28
Table 3.3 Control and Treated Salmon Sample Heating Times and Temperatures......32
Table 4.1 Moisture, Fat, and Cholesterol Content of Salmon Samples .......................58
vi
List of Figures
Figure 2.1. The Chemical Structure of Cholesterol. ......................................................3
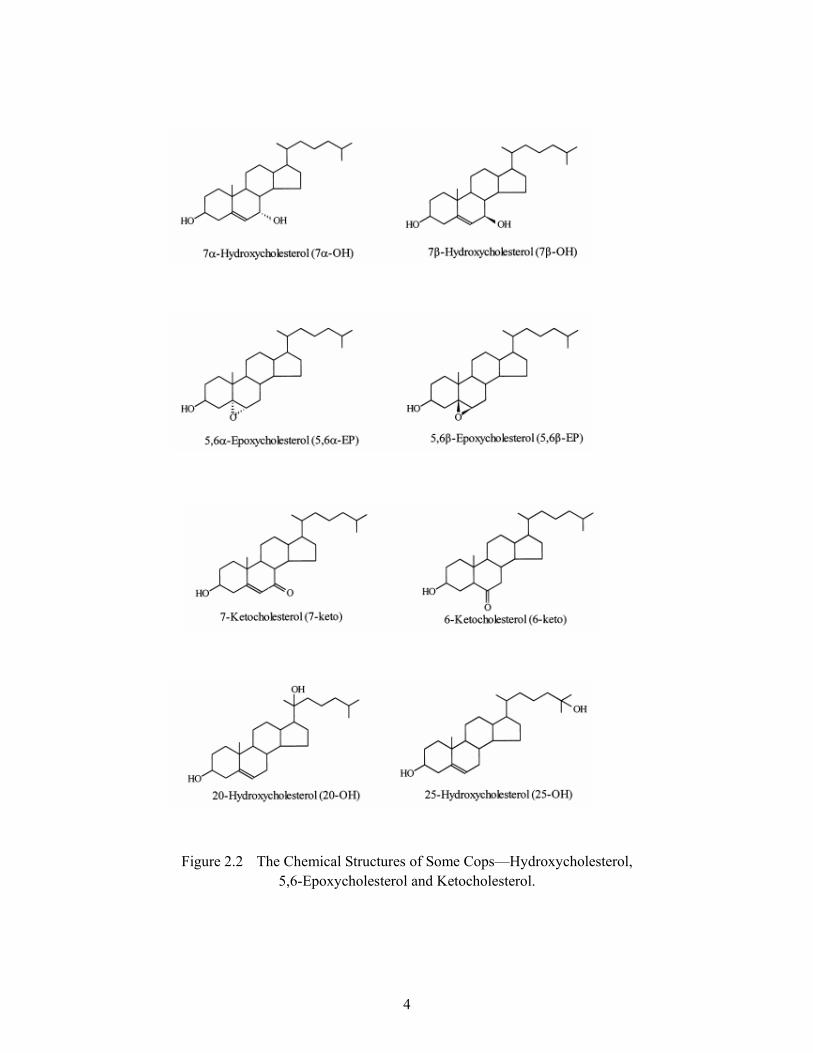
Figure 2.2 The Chemical Structures of Some Cops— Hydroxycholesterol,5,6-Epoxycholesterol and Ketocholesterol........................4
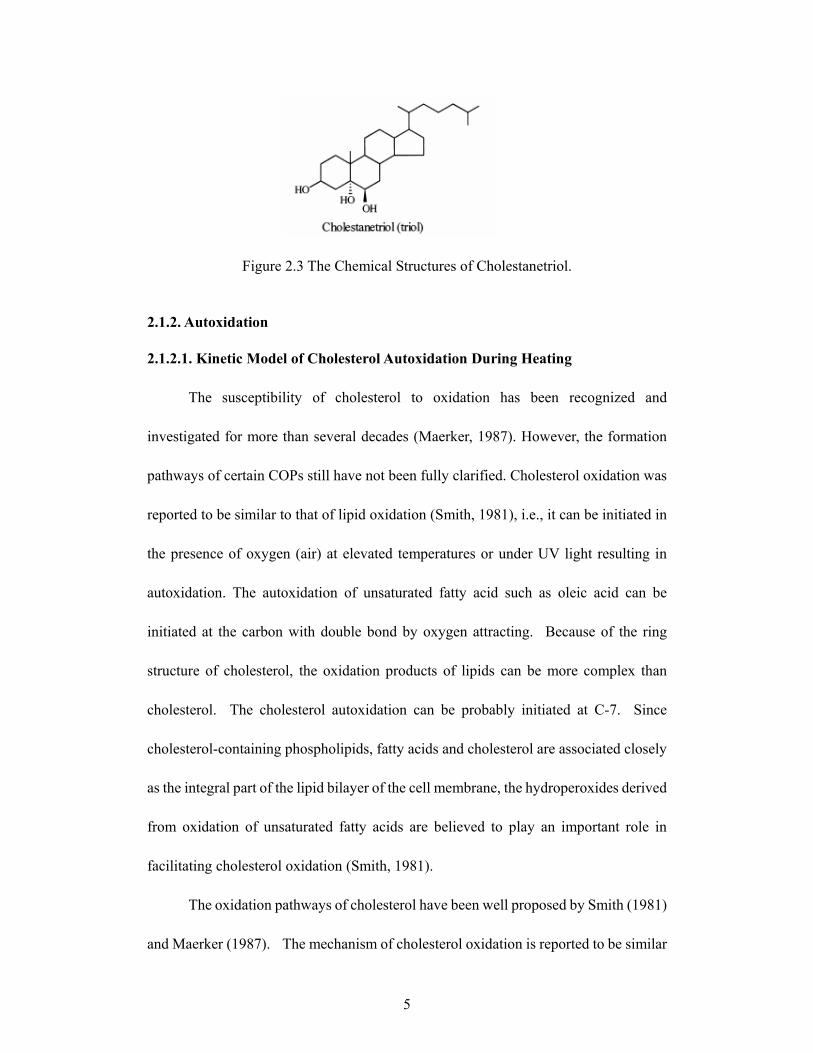
Figure 2.3 The Chemical Structures of Cholestanetriol.................................................5
Figure 2.4. Major Pathways of Cholesterol Oxidation: .................................................6
Figure 2.5. The Formation Pathways of Some COPs During Irradiation (Nielson, 1996)...................................................................................................9
Figure 2.6. Chemical Structure of Tocopherols And Tocotrienols...............................16
Figure 3.1 Mass-Spectrum Fingerprint of 5α-Cholestane, Cholesterol, 7-Ketocholesterol .............................................................................................25
Figure 3.2 Procedures of Preparing Cholesterol Oxidation Test Sample during Heating .............................................................................................................28
Figure 3.3 Flowchart of Preparing Lab Made Soybean and Rice Bran Oil .................29
Figure 3.4 Procedures of Preparing Cholesterol Oxidation Samples with Different Cooking Oils during Heating ...........................................................................31
Figure 3.5 Procedures of Extraction Cholesterol from Salmon Samples ....................34
Figure 4.1 GC-MS Chromatogram of A Standard Mixture of 5α-Cholestane (Internal Standard), Cholesterol, and 7-Ketocholesterol..................................38
Figure 4.2. Changes of Retained Cholesterol during Heating at 125, 150, 175, and 200°C ...............................................................................................................46
Figure 4.3. Production of 7-Ketocholesterol in Pure Cholesterol Samples during Heating at 125, 150, 175, And 200°C .............................................................48
Figure 4.4. Hplc Chromatogram of Tocopherols and Tocotrienols of High Concentrated Rice Bran Oil .............................................................................50
vii
Figure 4.5. Content of Vitamin E Isomers in Cooking Oils.........................................51
Figure 4.6. Changes of Retained Cholesterol in Pure Cholesterol and Oil Mixed Samples at 150°C .............................................................................................54
Figure 4.7. Changes of Retained Cholesterol in Pure Cholesterol and Oil Mixed Samples at 175°C .............................................................................................55
Figure 4.8. Production of 7-Ketocholesterol in Pure Cholesterol and Oil Mixed Sample during Heating at 150°C .....................................................................56
Figure 4.9. Production of 7-Ketocholesterol in Pure Cholesterol and Oil Mixed Sample during Heating at 175°C .....................................................................57
Fighre 4.10. Gas Chromatography of Roasted Salmon Oil with Rice Bran Oil........59
Figure 4.11. Change of Retained Cholesterol in The Control and Treatments during Heating at 150, 175, and 200℃ ............................................................61
Figure 4.12 Production of 22-Ketocholesterol in The Treatmented Salmon Samples during Heating at 175 and 200°C ......................................................63
viii
Abstract
The effects of plant source cooking oils on cholesterol oxidation during heating in
cholesterol standard and salmon meat model were investigated. A GC-MS system was
used to identify and quantify of cholesterol and cholesterol oxidation products. The
capabilities of different plant source cooking oils in preventing cholesterol oxidation
were compared. Commercial plant oils used in this experiment included corn oil,
canola oil, olive oil, soybean oil, and rice bran oil. Two lab prepared crude soybean
and rice bran oils were also used in this study to evaluate their capabilities of preventing
cholesterol oxidation. The tocopherols and tocotrienols antioxidants in those oils were
measured by a HPLC system as well. In both cholesterol and salmon meat models, it
was found that the cholesterol level decreased with increasing heating temperature and
time. The cholesterol decreasing in the salmon meat model was not as fast as in the
cholesterol model. Ketocholesterol was the major cholesterol oxidation product in the
two models. Soybean oil had the highest capability in preventing cholesterol oxidation,
while rice bran oil had the lowest capability among these oils. The soybean oil had the
highest alpha and gamma-tocopherol levels, which were considered to be the major
antioxidant components of preventing cholesterol oxidation. The commercial oils had
lower level of tocopherol and tocotrienol than the lab prepared oil due to the loss of
those antioxidants during oil refining procedures. The different capacities between lab
prepared soybean oil and rice bran oil in salmon samples were not as significant as in
cholesterol model since the salmon meat may contain antioxidants in itself and reduce
the total amount of cholesterol oxidation.
1
Chapter 1 Introduction
Cholesterol is an essential molecule for humans as a component of cell membrane
and as a precursor of steroid hormones and bile acids. Many foods containing high
level of cholesterol, such as eggs, seafood, milk, and meat, are important sources of
cholesterol. However, cholesterol in foods is readily oxidized to form cholesterol
oxidation products (COPs) when exposed to light, oxygen, active chemicals and high
temperature. High intake of COPs from foods could result in cardiovascular diseases
and formation of certain types of cancers. Therefore, lowering the COPs level in daily
foods is very important. Cooking oils from plants are considered a rich source of
tocopherols and tocotrienols, which are important antioxidants for preventing lipid
oxidation. The antioxidants may also have capabilities of preventing cholesterol
oxidation and reducing COPs production during heating. However, information on
prevention of cholesterol oxidation by various cooking oils during heating is limited.
As many studies indicated the health beneficial effects of consuming fish meat, fish and
fish oil are becoming more and more important food in our diet. The advantages of
fish and fish oil have been related with the fat composition that is rich in long-chain ω-3
fatty acids, particularly eicosapentaenoic fatty acid (EPA) and docosahexaenoic fatty
acids (DHA). High-fat fish species, such as salmon, which are the main supply of ω-3
PUFAs in the diet, also show significant cholesterol content. The cholesterol in
salmon may readily to be oxidized during cooking and forms COPs. In this study, oils
with higher capability of preventing cholesterol oxidation were mixed with salmon
2
meat. The protective capability of those oils against cholesterol oxidation in salmon
meat during heating were also investigated
In this study, the capabilities of cooking oils were investigated by using
cholesterol and salmon meat model. The results could help us to understand the
relationships between cholesterol oxidation and COPs production and the role of
different cooking oils in prevention of cholesterol oxidation and COPs production in
food systems during heating. This study may provide guidance for preparing
cholesterol-rich foods that would minimize COPs and reduce the possible risk of heart
diseases and cancer.
The hypothesis of this study is that cholesterol will be oxidized significantly
with increasing either the heating temperature or time. Plant source cooking oils have
the capacity of protecting cholesterol oxidation and the formation of COPs during
heating. The protective capability of plant source cooking oils in the cholesterol
model will protect the cholesterol in roasted salmon meat as well.
The research objectives include, developing a model for evalutating cholesterol
oxidation and COPs, investigating capabilities of different cooking oils in preventing
cholesterol oxidation during heating, and investigating cholesterol oxidation in control
and roasted salmon samples with selected cooking oils. A GC-MS system was used to
evaluate the cholesterol oxidation and monitor the formation of cholesterol oxidation
products.
3
Chapter 2. Review of Literature
2.1. Cholesterol Oxidation
2.1.1. Chemical Structure of Cholesterol and Cholesterol Oxidation Products
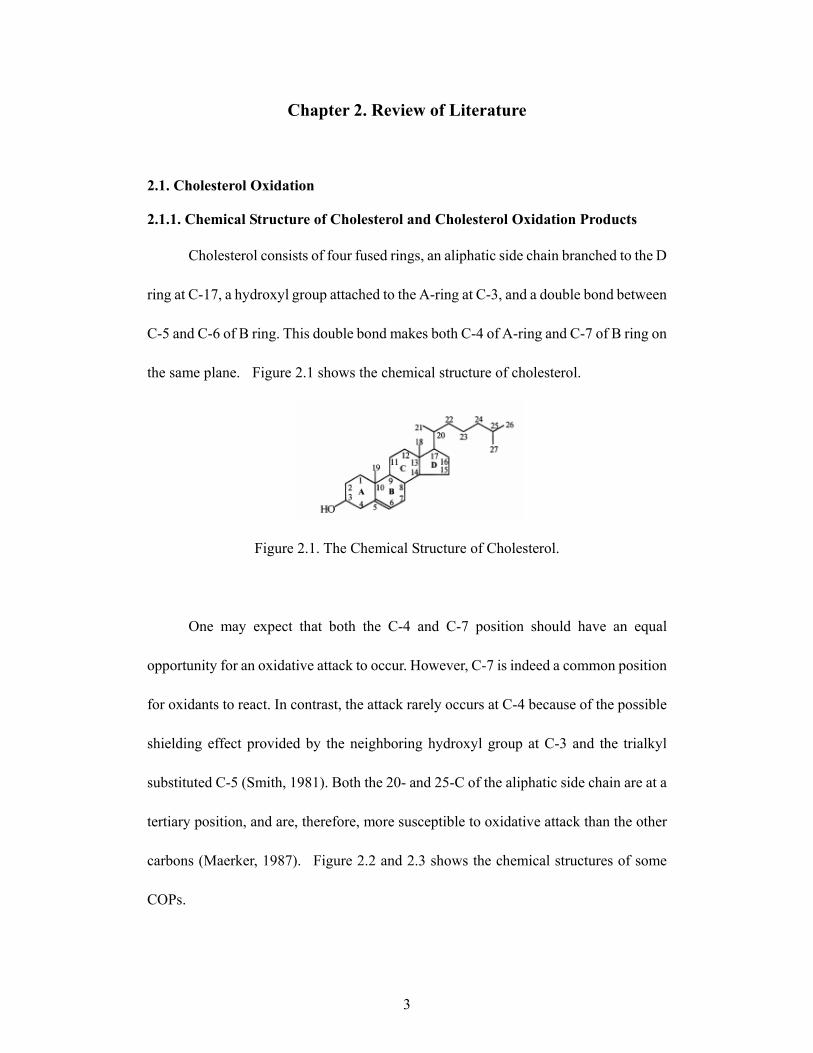
Cholesterol consists of four fused rings, an aliphatic side chain branched to the D
ring at C-17, a hydroxyl group attached to the A-ring at C-3, and a double bond between
C-5 and C-6 of B ring. This double bond makes both C-4 of A-ring and C-7 of B ring on
the same plane. Figure 2.1 shows the chemical structure of cholesterol.
Figure 2.1. The Chemical Structure of Cholesterol.
One may expect that both the C-4 and C-7 position should have an equal
opportunity for an oxidative attack to occur. However, C-7 is indeed a common position
for oxidants to react. In contrast, the attack rarely occurs at C-4 because of the possible
shielding effect provided by the neighboring hydroxyl group at C-3 and the trialkyl
substituted C-5 (Smith, 1981). Both the 20- and 25-C of the aliphatic side chain are at a
tertiary position, and are, therefore, more susceptible to oxidative attack than the other
carbons (Maerker, 1987). Figure 2.2 and 2.3 shows the chemical structures of some
COPs.
4
Figure 2.2 The Chemical Structures of Some Cops—Hydroxycholesterol, 5,6-Epoxycholesterol and Ketocholesterol.
5
Figure 2.3 The Chemical Structures of Cholestanetriol.
2.1.2. Autoxidation
2.1.2.1. Kinetic Model of Cholesterol Autoxidation During Heating
The susceptibility of cholesterol to oxidation has been recognized and
investigated for more than several decades (Maerker, 1987). However, the formation
pathways of certain COPs still have not been fully clarified. Cholesterol oxidation was
reported to be similar to that of lipid oxidation (Smith, 1981), i.e., it can be initiated in
the presence of oxygen (air) at elevated temperatures or under UV light resulting in
autoxidation. The autoxidation of unsaturated fatty acid such as oleic acid can be
initiated at the carbon with double bond by oxygen attracting. Because of the ring
structure of cholesterol, the oxidation products of lipids can be more complex than
cholesterol. The cholesterol autoxidation can be probably initiated at C-7. Since
cholesterol-containing phospholipids, fatty acids and cholesterol are associated closely
as the integral part of the lipid bilayer of the cell membrane, the hydroperoxides derived
from oxidation of unsaturated fatty acids are believed to play an important role in
facilitating cholesterol oxidation (Smith, 1981).
The oxidation pathways of cholesterol have been well proposed by Smith (1981)
and Maerker (1987). The mechanism of cholesterol oxidation is reported to be similar
6
to that of lipid oxidation because both can undergo a series of free radical chain
reactions to form peroxides and other degradation products (Smith, 1981). It has been
established that the initiation period of lipid oxidation belongs to the first-order reaction,
and the second-order reaction follows afterward (Bateman et al., 1953).
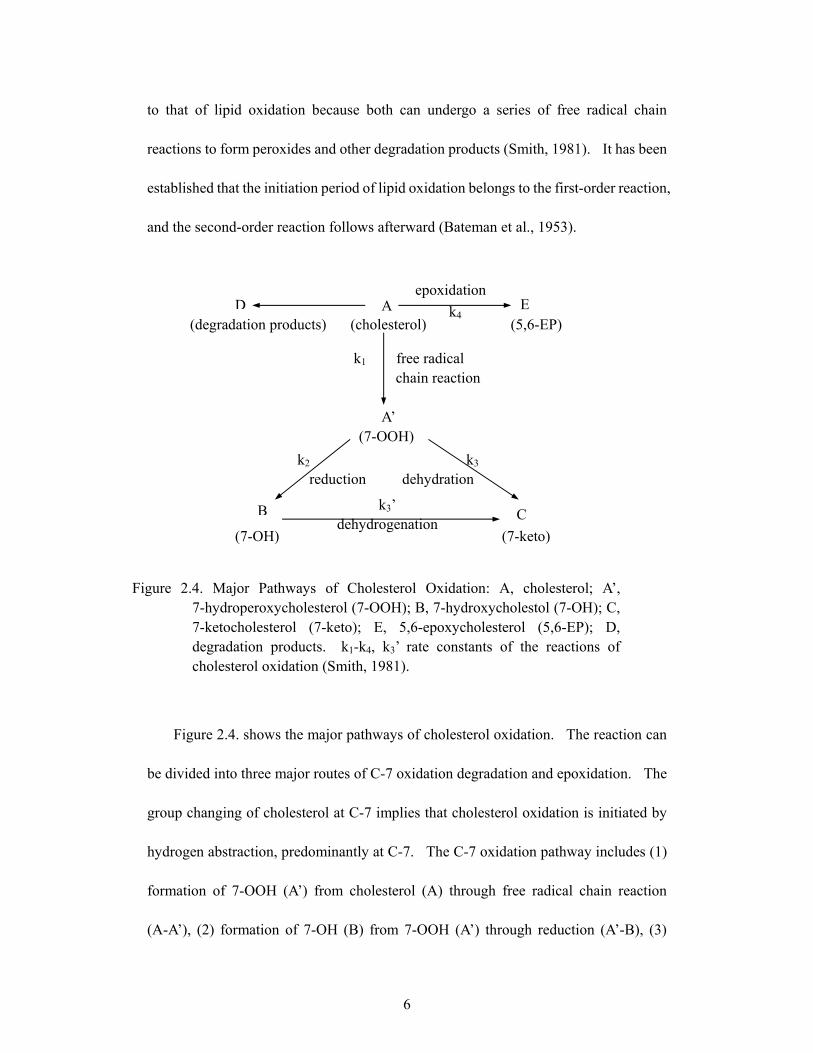
Figure 2.4. Major Pathways of Cholesterol Oxidation: A, cholesterol; A’, 7-hydroperoxycholesterol (7-OOH); B, 7-hydroxycholestol (7-OH); C, 7-ketocholesterol (7-keto); E, 5,6-epoxycholesterol (5,6-EP); D, degradation products. k1-k4, k3’ rate constants of the reactions of cholesterol oxidation (Smith, 1981).
Figure 2.4. shows the major pathways of cholesterol oxidation. The reaction can
be divided into three major routes of C-7 oxidation degradation and epoxidation. The
group changing of cholesterol at C-7 implies that cholesterol oxidation is initiated by
hydrogen abstraction, predominantly at C-7. The C-7 oxidation pathway includes (1)
formation of 7-OOH (A’) from cholesterol (A) through free radical chain reaction
(A-A’), (2) formation of 7-OH (B) from 7-OOH (A’) through reduction (A’-B), (3)
(7-OOH)
B C
E epoxidation
(degradation products) (cholesterol) (5,6-EP)
k1 free radical chain reaction
A’
D
k2 k3 reduction dehydration
(7-OH) (7-keto)
k3’ dehydrogenation
k4 A
7
formation of 7-keto (C) from 7-OOH (A’) through dehydration (A’-C), and (4)
formation of 7-keto (C) from 7-OH (B) through dehydrogenation (B-C). The
epoxidation pathway includes the formation of 5,6-EP (E) from cholesterol through
7-OOH (A’) (A+A’-E). In cholesterol degradation pathway, cholesterol may also be
decomposed to form other products (D) such as short-chain hydrocarbons, aldehydes,
ketones, or alcohols.
However, the information of cholesterol degradation reaction was complicated
and very limited because these degraded compounds were not identified. By comparing
the reaction rate of the major reaction pathways of cholesterol oxidation, it can be found
that k1>k4>k3>k2>k3’, that is free radical chain reaction > epoxidation > dehydration >
reduction > dehydrogenation (Chien et al., 1998).
2.1.2.2. Formation of Cholesterol Oxidation Products during Heating
Cholesterol is reported to be more stable in solid form than in liquid form, and the
latter is more susceptible to oxidation than the former (Nawar et al., 1991; Kim and
Nawar, 1993). Cholesterol was oxidized in fast rate when it was heated over 200 ºC
(Park and Addis, 1986). In Chien and Wang’s study (1998), it was found that the
percentages of 7-OOH (7α-OOH and 7β-OOH) increased sharply during the initial
heating period. Then they reached a plateau after heating for 6 minutes or more.
Similarly, the percentage of 7-OH (7α-OH and 7β-OH) also increased sharply during
the first 10 minutes of heating and reached a plateau thereafter. The percentages of
both 7-keto and 5,6-EP (5,6α-EP and 5,6β-EP) increased with increasing heating time
over a 30-minute period. The formation of 7-keto can be attributed to the dehydration
8
of 7-OOH or dehydrogenation of 7-OH under dry and oxygen-rich conditions (Teng et
al., 1973; Kim and Nawar, 1993; Nielsen et al., 1996).
For 5,6-EP formation, it has been reported that when there is enough reaction of
epoxidation, 7-OOH formed during heating (Smith, 1981, 1987; Maerker and Bunick,
1986). In Chien and Wang’s study (1998), the epoxide formation was observed at the
beginning period of heating. It suggested that the 7-OOH was formed in adequate
amounts for the reaction of epoxide formation to proceed at the beginning of heating.
Maerker and Bunick’s study (1986) also demonstrated that the 5,6 EP concentration
increased along with increasing of 7-OOH concentration during heating of cholesterol
at 80 ºC in an aqueous dispersion at pH 8 for 24 hours. These results implied that the
differences in heating treatment of cholesterol may greatly affect the formation and
degradation rates of 7-OOH. The 5,6-EP was formed in the greatest amount, followed
by 7-keto, 7-OH, and 7-OOH.
The side chain oxidation occurs when cholesterol in the solid phase or in the
crystalline form during heating. The oxygen of free radical attack at tertiary C-20 and
C-25 position generates 20-OOH and 25-OOH, respectively (Smith, 1987). These
hydroperoxides can be further degraded to 20-OH and 25-OH, which are quite stable
and can sustain consecutive heating at 100°C for 6 months. However, this type of
oxidation is not observed in solution or in aqueous dispersion (Maerker, 1987).
2.1.3. Photooxidation
Photosensitizers, such as chlorophyll and hematoporphyrin, can absorb energy
in the form of radiation and transfer it to from the singlet oxygen so that the more active
9
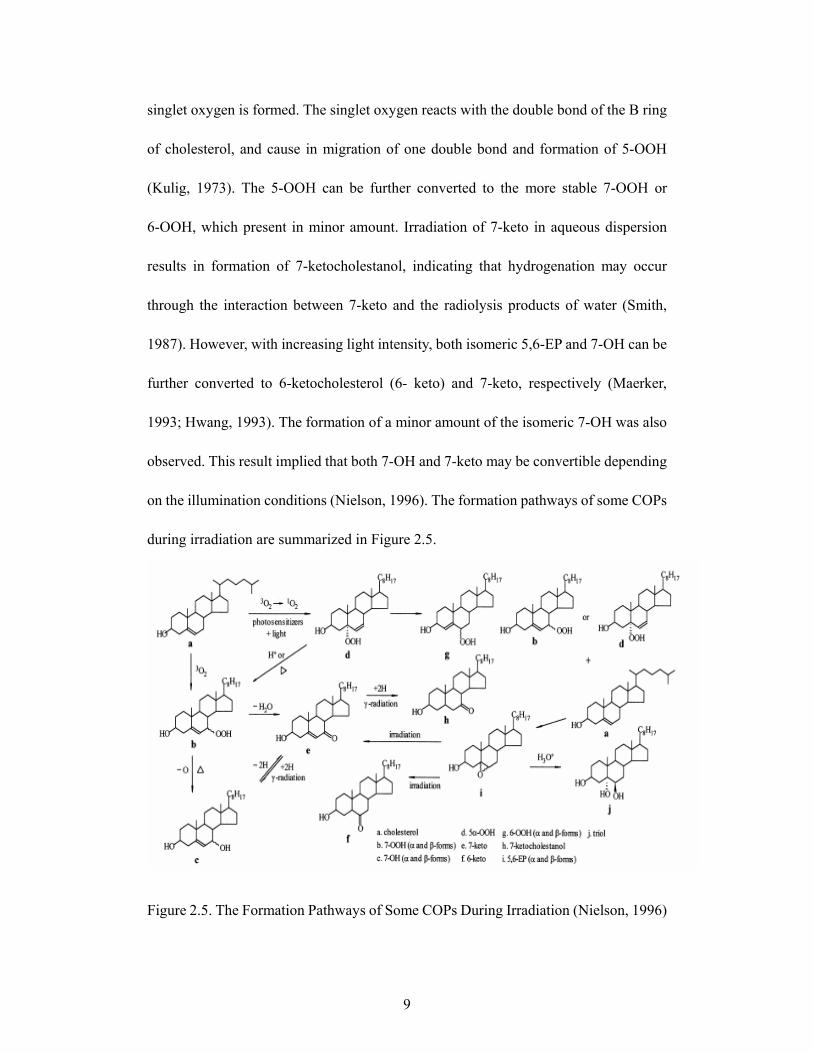
singlet oxygen is formed. The singlet oxygen reacts with the double bond of the B ring
of cholesterol, and cause in migration of one double bond and formation of 5-OOH
(Kulig, 1973). The 5-OOH can be further converted to the more stable 7-OOH or
6-OOH, which present in minor amount. Irradiation of 7-keto in aqueous dispersion
results in formation of 7-ketocholestanol, indicating that hydrogenation may occur
through the interaction between 7-keto and the radiolysis products of water (Smith,
1987). However, with increasing light intensity, both isomeric 5,6-EP and 7-OH can be
further converted to 6-ketocholesterol (6- keto) and 7-keto, respectively (Maerker,
1993; Hwang, 1993). The formation of a minor amount of the isomeric 7-OH was also
observed. This result implied that both 7-OH and 7-keto may be convertible depending
on the illumination conditions (Nielson, 1996). The formation pathways of some COPs
during irradiation are summarized in Figure 2.5.
Figure 2.5. The Formation Pathways of Some COPs During Irradiation (Nielson, 1996)
10
2.2 Toxicity of Cholesterol Oxidation Products
In recent years, COPs have drawn much attention mainly because of their
potential health implications. Numerous studies have shown that COPs may possess
biological effects such as mutagenicity (Sevanian, 1986), angiotoxicity (Dorset, 1992),
carcinogenicity (Morin, 1991), cytotoxicity, atherogenicity and cell membrane damage
(Guardiola, 1996), and inhibition of cholesterol biosynthesis (Addis, 1990, 1991). In
addition, COPs may induce atherosclerosis (Imai, 1976).
Foods rich in cholesterol content such as dairy products, eggs and meat products,
are prone to undergo autoxidation or enzymatic oxidation and form COPs. COPs can
also be generated during food preparation when exposed to heat, air, light and radiation
(Smith, 1992). Moreover, inappropriate storage conditions will also facilitate COPs
formation (Paniangvait, 1995).
Due to the complexity of food itself, it is difficult to study cholesterol oxidation
in real food systems. The results observed in the pure cholesterol samples may not be
identical to those in real food systems because of numerous factors such as the presence
of water, protein, fat, carbohydrate, and other components in foods. For instance, Kim
and Nawar (1991) demonstrated that the stability of cholesterol in complex mixtures in
influence by interaction among lipid components and their decomposition products.
Yan and White (1990) also concluded that the accumulation of COPs in a high
temperature, cholesterol-rich food system is a dynamic one, depending upon the
amount of cholesterol present, the treatment of oil (intermittent or continuous heating),
and the severity of the heat treatment.
11
2.3. Effect of Food Components on Cholesterol Oxidation
2.3.1. Lipids in Foods
Park and Addis (1992) studied the formation of COPs in tallow heated at 135,
150, 165 or 180ºC for 70, 144 and 216 hrs. Only 7-keto and 5,6α-EP were found, and
the amount of 7-keto formed during frying increased linearly with heating time. In a
similar study, Park and Addis (1986) isolated five COPs from tallow heated at 155 ºC
for 400 hrs. These COPs were identified as 7α-OH, β-OH, 7-keto, 5,6α-EP and 5,6β-EP.
Approximately 25% cholesterol was lost, and five COPs, triol, 7-keto,
7-oxo-cholesta-3, 5 -diene, 7α-OH and 5,6α-EP (5,6β-EP) were detected in tallow
heated at 142-184 °C for 56-70 hrs (Csiky, 1982). Likewise, Park and Addis (1986) also
observed a 40-50% cholesterol loss in tallow heated at 155 and 190 ºC for 300 hrs and
identified 7α-OH, 7β-OH, 7-keto and 5,6α-EP. Zhang et al. (1991) investigated the
COPs contents in fried oil from fast food restaurants. It was found that after continuous
frying for 15 days, a high amount of COPs (50 ppm) was present, however, it began to
decline thereafter. This is probably because COPs can undergo degradation after
prolonged heating.
Yan and White (1990) studied cholesterol oxidation in heated lard enriched with
2 and 10 times the mount of the cholesterol contained originally in lard. Both 7-keto
and 5,6α-EP were the predominant COPs found, while 7α-OH, 7β-OH and triol were
formed in minor amounts. Results also indicated that after heating at 180 ºC (10 hrs per
day) for 24 days, lard enriched with cholesterol at 10 times was more susceptible to the
formation of COPs than that enriched with cholesterol at 2 times. However, the
12
degradation rate of cholesterol of the former lower level was slower than that of the
high level. Chen et al. (1996) analyzed the COPs in heated lard, and five COPs, 7-keto,
cholesta-4,6-diene-3-one, 5,6α-EP (5,6β-EP), 7β-OH, and triol were detected. In most
cases, the COPs contents increase with increasing heating time, however, several COPs,
5,6α-EP, 5,6β-EP and 7β-OH, increased in the first 100 hrs and then declined thereafter.
The highly toxic cholesteroltriol could not be detected until heating time reached 20 hrs.
The long heating period or high temperature may cause the degradation of COPs to a
great extent in foods. Some other harmful compounds may be produced at high level as
well.
Polyunsaturated triglycerides components, such as salt, triglyceride, β-carotene
and chlorophyll have been reported to have a great impact on the rate of cholesterol
oxidation. Kim and Nawar (1991) found that in the presence of triglyceride, cholesterol
oxidation was facilitated, and the rate of cholesterol oxidation should be dependent
upon the degree of unsaturation of triglyceride. This is because the unsaturated fatty
acid can be oxidized to form free radicals and peroxides during heating, both of which
can promote oxidation of cholesterol (Korytowski et al., 1992). This phenomenon is
often referred to as “cooxidation”. Likewise, the stability of lipid in foods during
heating may also be affected by cholesterol. Osada et al. (1993) reported that the
levels of COPs in processed seafood were much higher than other food products
because that fish contains a relatively higher amount of polyunsaturated fatty acids
Zhang et al. (1991) detected six COPs, 7β-OH, 5,6β-EP, 5,6α-EP, triol, 7-keto
and 25-OH, in French-fried potatoes, which were fried in animal-vegetable shortenings
13
at local restaurants. Surprisingly, triol, derived from isomeric 5,6-EP, was formed in the
largest amount, followed by 7-keto and 25-OH. Since triol was rarely found in foods,
this result further demonstrated that some drastic heat treatments could produce triol.
This is probably because that during frying, both steam and free fatty acids are formed
through water evaporation and triglyceride hydrolysis, which in turn results in the
formation of triol from 5,6α-EP or 5,6β-EP.
2.3.2. Antioxidants in Foods
Generally, heat, pH, light, oxygen, water activity, and the presence of
unsaturated fatty acids are the major factors that influence COPs formation during food
processing or storage (Dionisi, 1998). Due to the potential health risk of consumption
of COPs-containing foods, it is important to learn more about the formation and
inhibition of COPs in foods during heating or illumination.
Several researchers reported that some antioxidants sufficiently inhibited
cholesterol oxidation, which was induced by oxidants such as hydrogen peroxide and
nitrogen oxide, or prooxidants such as metal ions (Guardiola, 1997). Rankin and Pike
(1993) examined the inhibition of COPs formation by some antioxidants in an aqueous
meat model system at pH 5.5 and 80 ºC. Results showed that with the exception of
tocopherols, rosemary oleoresin, quercetin, myricetin and BHA were not effective
against 7-keto formation. Similarly, Maerker and Unruh (1986) also showed that BHT
was not effective against cholesterol oxidation. However, an opposite result was
reported by Madhavi (1995), who revealed that BHA, BHT, propyl gallate, tertiary
butylhydroquinone and α-tocopherol exhibited an inhibitory effect for cholesterol
14
autoxidation in an aqueous model system. This difference may be due to the variety of
buffer systems and surfactants, the concentrations of antioxidants, and the presence of
prooxidants.
2.3.2.1. Ascorbyl Palmitate and α-Tocopherol
As the mechanism of the cholesterol oxidation has been demonstrated to be
similar to that of lipid oxidation (Smith, 1981), the incorporation of antioxidants to a
cholesterol-containing food should retard cholesterol oxidation effectively. Park and
Addis (1986) studied the effects of ascorbyl palmitate and α-tocopherol on the
inhibition of cholesterol oxidation in tallow during heating. Results showed that both
possessed the ability of inhibiting cholesterol oxidation at 135 ºC. However, at 165 and
180 ºC, only a minor inhibition effect occurred. This is probably because both ascorbyl
palmitate and α-tocopherol may undergo degradation during heating at high
temperatures. Yan and White (1990) also found that cholesterol oxidation could be
inhibited by incorporation of methyl silicone into lard during heating.
The concentration of antioxidants affects the ability to decrease cholesterol
oxidation as well. Tocopherols are known to delay the role of cholesterol oxidation. Of
the various isomers, γ- and δ-tocopherols were more effective in inhibiting cholesterol
oxidation than α-tocopherol in an aqueous model system (Labuza, 1991). Some studies
have also suggested that α-tocopherol possesses an inhibitory effect against cholesterol
autoxidation at a level of 0.02% or 0.2%, but exhibit prooxidant activity at a level of 2%
(Rankin and Pike, 1993). Park and Addis (1986) reported that a combination of
ascorbyl palmitate and α-tocopherol could prevent the formation of COPs in tallow
15
heated at 135 ºC for 70 hrs. In addition, this type of combination exerted a synergistic
effect in protecting deep-frying fats and oils from cholesterol oxidation (91-93).
In contrast, Guardiola et al. (1997) found that the mixture of ascorbyl palmitate
and α-tocopherol showed a slight cooxidant effect of cholesterol oxidation during
storage of spray-dried egg yolk powder. Li et al. (1996) also reported that tocopherols
might significantly suppress the formation of COPs in fish oil during storage or heating.
However, the tocopherol concentration may be too low to inhibit COPs formation in
flax, sunflower and palm oils. It has been well established that tocopherols are effective
antioxidants when used at a relatively low concentrations (100-300 ppm), however, the
antioxidant activity may undergo loss at high levels (> 500 ppm) (Dougherty, 1988).
2.3.2.2. Antioxidant in Plant Oils
Table. 2.1 Fatty Acids Content (g/100g Fat) of Cooking Oils (Gunstone and Padley,
1997). Mono Poly
Unsat. Saturated
unsaturated unsaturated /Sat. Palmitic Stearic Oleic Linoleic Linolenic ratio Acid Acid Acid Acid (ω6) Acid (ω3)
Plant Oil
C16:0 C18:0 C18:1 C18:2 C18:3 Canola Oil 15.7 4 2 62 22 10
Corn (Maize) Oil 6.7 11 2 28 58 1 Olive Oil 4.6 13 3 71 10 1
Soybean Oil 5.7 11 4 24 54 7 Rice bran Oil 13.2 16 2 41 37 1.3
As discussed above, unsaturated fatty acids can affect cholesterol oxidation. Plant
oils contain high level of unsaturated fatty acids. Most vegetable oils contain high
levels of oleic and linoleic acid, while palmitic acid is the major saturated acid. Table
16
2.1 shows the fatty acid profile of some cooking oils. Olive and canola oil has over
50% oleic acid, soybean and corn oil have more linoleic acid than oleic acid. Both fatty
acids levels are high in rice bran oil (Gunstone and Padley, 1997).
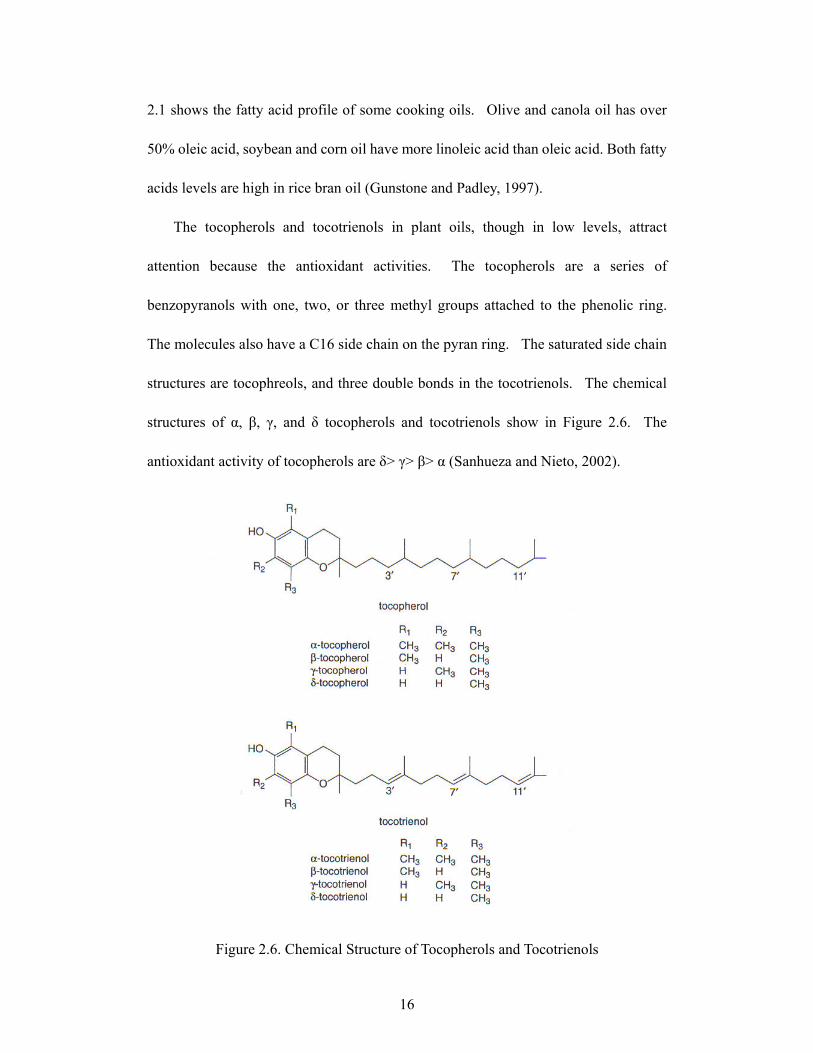
The tocopherols and tocotrienols in plant oils, though in low levels, attract
attention because the antioxidant activities. The tocopherols are a series of
benzopyranols with one, two, or three methyl groups attached to the phenolic ring.
The molecules also have a C16 side chain on the pyran ring. The saturated side chain
structures are tocophreols, and three double bonds in the tocotrienols. The chemical
structures of α, β, γ, and δ tocopherols and tocotrienols show in Figure 2.6. The
antioxidant activity of tocopherols are δ> γ> β> α (Sanhueza and Nieto, 2002).
Figure 2.6. Chemical Structure of Tocopherols and Tocotrienols
17
Walnut oil and wheatgerm are good sources of tocopherols. Others with high
vitamin E activity include sunflower, cottonseed, safflower, and palm oils.
Antioxidant activity is high in soybean oil, corn oil, and walnut oil. The tocopherols
are partially removed during oil refining. This reduced oxidative stability but can
furnish a concentrate that can be added back. Much natural antioxidant comes from a
by-product of soybean refining. Soy is now the prime source of oil. The bean contains
high quality protein (38-42%) and oil (18-22%), which is usually recovered by hexane
extraction (Gunstone and Padley, 1997).
2.3.2.3. Phytosterol
Phytosterol contained in vegetable oils is known to exert a hypocholesterolemic
function. The antioxidant effects of phytosterol and its components, beta-sitosterol,
stigmasterol, and campesterol, against lipid peroxidation were examined by making a
comparison with 2,2,5,7,8-pentamethyl-6-chromanol (PMC) (Yoshida and Niki, 2003).
Phytosterol also suppressed the oxidation and consumption of alpha-tocopherol.
Stigmasterol accelerated the oxidation of both methyl linoleate in solution and PLPC
liposomal membranes in aqueous dispersions, which was ascribed to the oxidation of
allylic hydrogens at the 21- and 24-positions. The study shows that phytosterol
chemically acts as an antioxidant, a modest radical scavenger, and physically as a
stabilizer in the membranes (Yoshida and Niki, 2003).
2.4. Fish and Fish Products
Osada et al. (1993) reported that raw fish contains essentially no COPs, however,
following air-drying, the content of COPs largely increased in sardine and squid (287
18
and 146 ppm). Ohshima et al. (1993) also found a high amount of COPs (9.6-138 ppm)
in commercial salted and dried anchovies, Northern cod, Pacific cod, Japanese whiting
and Pacific herring. These levels are probably higher than those enerated in most food
items. Kao and Hwang (1997) analyzed COPs in dried squid and found that 7α-OH,
7β-OH, 5,6β-EP, 5,6α-EP, 7-keto, 20α-OH, 25-OH and triol were present. When dried
squid was baked at 200 �C for 10 min, the cholesterol level dropped from 7300 to 6020
ppm while the total COPs level increased from 12.07 to 43.46 ppm, significantly lower
than that reported by Osada et al. (1993). The loss of cholesterol was at a much larger
magnitude than the formation of COPs, revealing that most of the cholesterol was
degraded to other compounds. The total cholesterol level in fresh fish does not exceed
that of milk or eggs but the COPs formed in processed fish are more than those formed
in milk and egg products. The high content of unsaturated fatty acids in fish is the main
cause of such a phenomenon.
The study of Li et al. (1996) revealed that a mixture of cholesterol and fish oil
generated much more COPs than that of cholesterol and flax oil, sunflower oil or palm
oil. Compared to a mixture of cholesterol and palm oil, cholesterol and fish oil
produced COPs more than 30 folds over a storage period of 35 days. This result is
expected, since fish oil contained fatty acid with a higher degree of unsaturation than
that of palm oil. Theoretically speaking, both flax and sunflower oils also contain high
levels of polyunsaturated fatty acid (> 66%) and should be prone to COPs formation.
However, the amount of COPs formed in both oils were less than that in fish oil. This is
probably because that fish oil contains a high amount of long-chain unsaturated fatty
19
acids such as eicosapentaenoic (EPA) and docosahexaenoic acids (DHA), which should
facilitate the oxidation rate of cholesterol. In addition, the presence of antioxidants in
flax and sunflower oils, such as tocopherols, may also delay cholesterol oxidation. It
has been well stablished that tocopherols are able to delay cholesterol oxidation and
protect lipids against autoxidation at an appropriate concentration (Nawar, 1996).
2.5. Cholesterol Extraction and Analysis
2.5.1. Saponification and Extraction
Saponification is a vital step, which is conducted routinely to remove
triglyceride, free fatty acid and water soluble impurities during extraction of COPs
from foods (Finocchiaron, 1983�Park and Addis, 1986). Two saponification
procedures, cold and hot saponification, are often employed. Many reports have shown
that high recovery can be achieved by cold saponification at 25°C (Yan and White,
1990; Pie, 1990), and the formation of COPs artifacts can be retarded. However, the
saponification time is too long (18-20 h). Thus, some authors used hot saponification
(56°C) to facilitate the extraction of COPs from foods (Maerker and Uniuh, 1990).
Nevertheless, it has been reported that hot saponification may degrade 7-keto and
isomeric epoxides to form artifacts(Peng et al. 1979).
To remedy these problems several authors used silica gel- or C18 cartridges to
extract COPs from foods (Missler, 1985). Nourooz-Zadeh and Appelqvist (1988)
employed a Sep-Pak silica cartridge to enrich COPs. The cartridge was washed with
hexane-1,2-dichloroethane (9:1, v/v) to remove triacylglycerols, followed by
1,2-dichloroethanemethanol (1:1, v/v) to elute COPs and polar lipids. This method was
20
rapid in removing excessive amount of lipids and the recoveries of both radio labeled
3H-cholesterol and 3H-triol reached 90% and 97%, respectively. Therefore, the method
is suitable for lipid-rich products such as milk powders. Hwang and Maerker (1993)
applied a solid phase extraction (SPE) column to extract COPs from meats. The lipid
extract was loaded in the column and eluted serially with hexane-ethyl acetate of 100:2
(v/v), 85:15 (v/v) and 4:6 (v/v), respectively. The first fraction contained triacylglycerol
and lipid-soluble impurities, while the second fraction contained 4-cholesten-3-one, 4,
6-cholestadien-3-one and 4-cholestene-3,6-dione. The other COPs, including α-EP,
β-EP and 7-keto, were eluted in the third fraction.
Penazzi et al. (1995) used an SPE florisil cartridge to purify 7-keto in several
foods. The sample-loaded cartridge was washed with 2-propanol-heptane (2:98, v/v) to
remove triacylglycerols and cholesterol, and 7-keto was eventually recovered by
acetone. Also, the authors used an SPE silica cartridge to isolate 7-keto from the same
food items. The cartridge was first washed by hexane-diethyl ether (8:2, v/v) to remove
impurities, followed by elution of 7-keto by two solvents, hexane-diethyl ether (1:1, v/v)
and methanol (100%). The last two fractions containing enriched 7-keto were pooled
for further analysis. The application of an SPE cartridge has been considered an easier
and faster method than the cold saponification method (Penazzi et al, 1995).
2.5.2. HPLC Analysis
HPLC is one of the most widely used techniques for separation of COPs and has
been shown to elute COPs effectively (Rose-Sallin, 1995; Fontana, 1992). Both
reversed- and normal-phase columns have been applied to the separation of COPs.
21
The reversed-phase column is currently used more often than the normalphase column.
Ansari and Smith (1979) developed two HPLC methods using a silica gel or a C18
column, respectively, to resolve 10 COPs by using an isocratic solvent system of
hexane-isopropanol (24:1, v/v) or acetonitrile-water (9:1, v/v), with detection at 212
nm. A C18 column provides a better resolution than a silica gel column.
Tsai and Hudson (1981) also developed a HPLC method to resolve 10 COPs by
using a binary solvent system of hexane-2-propanol (100:3, v/v), with a flow rate at 3.0
ml/min and by refractive index detection (RI). Separation is complete within 28 min.,
however, several COPs are not adequately resolved. Tsai and Hudson (1984) used
HPLC to purify COPs in egg yolk by mploying a solvent system of 2-propanol-hexane
(2:98, v/v), with RI detection and flow rate 1 ml/min. Two COPs, 5,6α-EP and 5,6β-EP,
are adequately resolved, however, the separation time (50 min.) is too long. Kou and
Holmes (1985) further used a reversed-phase HPLC column to purify 25-OH, followed
by quantitation on a silicic acid column, with detection at 205 nm and flow rate at 1.7
ml/min. The authors reported that the application of two columns is necessary to obtain
the consistent baseline resolution of 25-OH from the other contaminating peaks. Chen
and Chen (1994) evaluated both CN- and C18-columns for the separation of COPs.
Hexane-2-propanol (95:5, v/v) was used as the mobile phase for the former, which
resolved 8 COPs standards within 18 min.
2.5.3. GC Analysis
Numerous GC methods have been developed to separate the various COPs in
foods (Zubillaga, 1991; Nourooz-Zadeh, 1990). The combination of GC and the flame
22
ionization detector (FID) provides a powerful tool to precisely quantify COPs. For
cholesterol and COPs analyses, the conversion of these compounds to trimethylsilyl
(TMS) ether derivatives is a frequently applied step to stabilize some of the diols
(Maerker, 1987). Li et al. (1996) separated cholesterol and 8 COPs with good
resolution by using a fused silica capillary (dimethyl polysiloxane) column. With the
help of the purified standards, they identified and quantified several COPs in baked
dried squid. The application of GC-MS with a selected ion monitoring mode (SIM) and
a capillary column is generally regarded as the most rapid and sensitive mean to
identify COPs (Parks and Addis 1992).
By comparing the mass spectrum with the established chemical library, COPs
can be easily identified with high accuracy. Park and Addis (1986) used a GC-MS with
a fused silica capillary column to identify and quantify 7β-OH, 25-OH, 5,6α-EP,
5,6β-EP, 7-keto and triol in heated tallow. Ohshima et al. (1993) analyzed COPs in fish
products by conversion of them to TMS-derivatives and subsequent separation and
detection by GC with a flame ionization detector (GC-FID). The identification of these
COPs was carried out in a quadruple MS fitted with an electron ionization source, and
six COPs, 7β-OH, 7-keto, 5,6α-EP, 5,6β-EP, 25-OH and triol were quantified.
Schmarr et al. (1996) determined COPs in several food products using GCFID
and GC-MS, and a high recovery was found for the moderate polar and polar oxysterols,
how ever, the less polar COPs may undergo partial loss by this method. The identified
COPs include 7α-OH, 7β-OH, 19-OH, 20β-OH, 25-OH, 5,6α-EP, 5,6β-EP, 7-keto,
3,5-dihydroxy-5α-cholestan-6-one and triol. Among these COPs, some (19-OH and
23
20β-OH) were rarely identified by HPLC. Due to the chemical properties of COPs,
most of the GC columns used are with low polarity.
2.5.4. Comparison of HPLC and GC-MS
HPLC and GC-MS are the most frequently used methods for COPs analysis.
HPLC is often carried out under ambient temperatures while GC is under high
temperatures. Although the resolution power of HPLC is theoretically inferior to that of
GC, the former can provide an ideal means for sample recovery and purification.
Meanwhile, HPLC can simplify the quantification procedure, shorten the analysis time
and introduce fewer artifacts (Tsai and Hudson, 1981). HPLC is commonly equipped
with an UV detector to monitor COPs, however, some double bound-free COPs such as
the isomeric 5,6-EP and triol can not be detected.
The narrow absorbance range of most COPs may result in interference with
detection as well as limitation of the choice of solvents. In addition, the production of
solvent waste by HPLC analysis poses a disposal problem. On the other hand, GC can
be used to resolve geometric isomers, which can not be separated by HPLC. As
mentioned, the combination of GC and MS is an effective tool for COPs analysis,
which includes not only quantification but also identification. The mass spectrums
derived from GC-MS assist elucidation of the chemical structures of COPs and further
contribute to their identification. However, the major drawback of GC is that it may
also thermally destroy cholesterol and B-ring hydroperoxide to form artifacts
(Finocchiaro, 1984). In addition, COPs need a derivatization step for GC separation,
which extend the analysis time and affect the quantization accuracy.
24
Chapter 3 Methodology
3.1 Cholesterol and Cholesterol Oxidation Products Analysis Using GC-MS
3.1.1. GC-MS Operating Condition
The cholesterol and cholesterol oxidation products in cholesterol and salmon
models were determined using a GC-MS system. The GC-MS system consisted of
Varian CP 3800 GC and Saturn 2000 MS (Varian, Inc., Walnut Creek, CA) with a
SAC-5 fused silica capillary column (30m x 0.25 mm x 0.25 mm file thickness)
(Supelco Inc., Bellefonte, PA). Helium was used as the carried gas at flow rate of
2ml/min. The injection port temperature was set at 300℃. The GC oven temperature
was increased by 15℃/min to temperature 250℃ from initial temperature of 200℃.
The MS detector was turned on after 4 min of running time. The split ratio was set at
1:20. Before injecting sample, water/air level in the GC-MS system was checked to
below 20%.
3.1.3. Determination of Cholesterol and Cholesterol Oxidation Products
3.1.3.1. Identification
Cholesterol and cholesterol oxidation products in samples were identified by
matching the retention times and typical ion spectrums with their standards. The
retention time and ion spectrum of each compound was obtained by injecting standard
mixture into the GC-MS system. The standard mixture solution consisted of
5α-cholestane (internal standards), cholesterol, and 7-ketocholesterol. These
compounds in unknown samples were identified by matching their retention times with
the standard compounds. Because the components in nature food systems were much
25
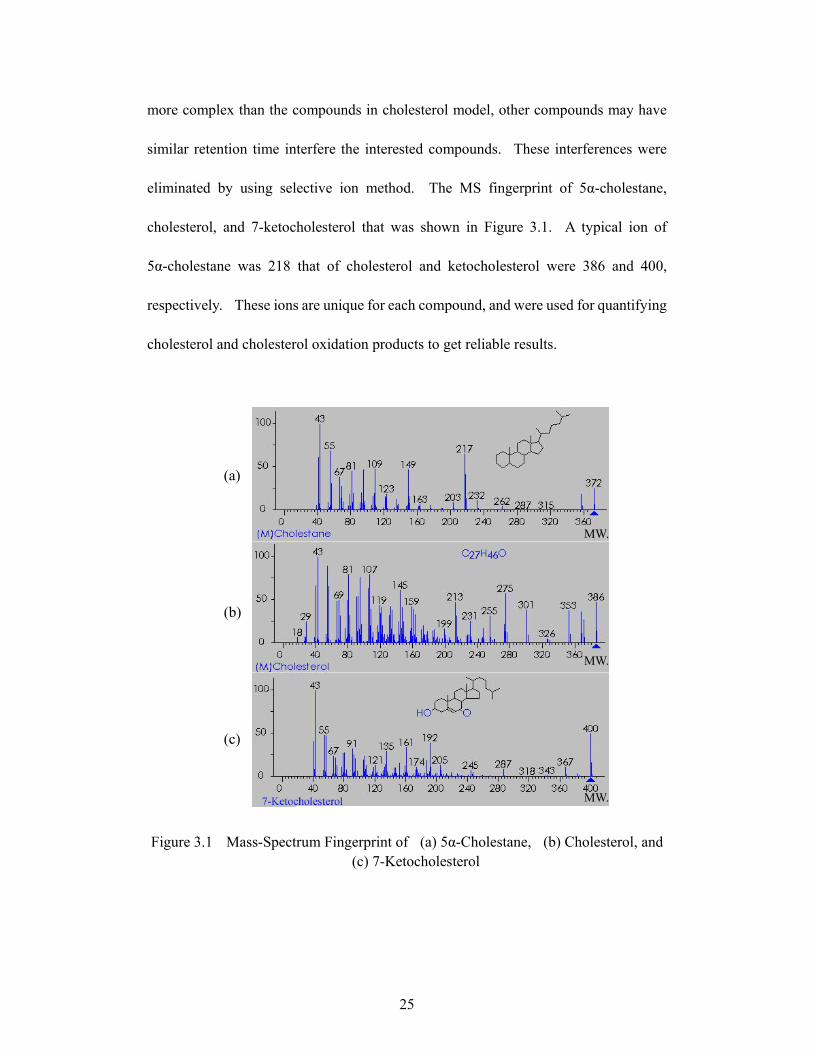
more complex than the compounds in cholesterol model, other compounds may have
similar retention time interfere the interested compounds. These interferences were
eliminated by using selective ion method. The MS fingerprint of 5α-cholestane,
cholesterol, and 7-ketocholesterol that was shown in Figure 3.1. A typical ion of
5α-cholestane was 218 that of cholesterol and ketocholesterol were 386 and 400,
respectively. These ions are unique for each compound, and were used for quantifying
cholesterol and cholesterol oxidation products to get reliable results.
Figure 3.1 Mass-Spectrum Fingerprint of (a) 5α-Cholestane, (b) Cholesterol, and (c) 7-Ketocholesterol
(c)
(b)
(a)
MW.
MW.
MW.
26
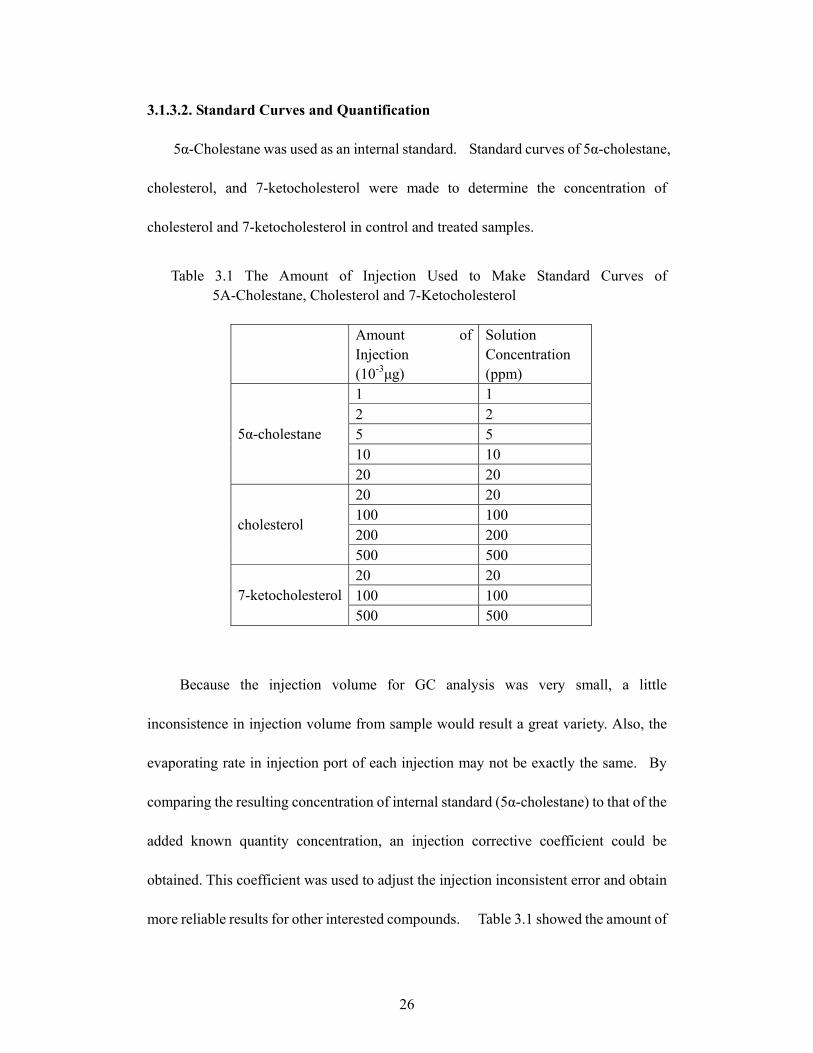
3.1.3.2. Standard Curves and Quantification
5α-Cholestane was used as an internal standard. Standard curves of 5α-cholestane,
cholesterol, and 7-ketocholesterol were made to determine the concentration of
cholesterol and 7-ketocholesterol in control and treated samples.
Table 3.1 The Amount of Injection Used to Make Standard Curves of
5Α-Cholestane, Cholesterol and 7-Ketocholesterol
Amount of Injection (10-3µg)
Solution Concentration (ppm)
1 1 2 2 5 5 10 10
5α-cholestane
20 20 20 20 100 100 200 200
cholesterol
500 500 20 20 100 100 7-ketocholesterol500 500
Because the injection volume for GC analysis was very small, a little
inconsistence in injection volume from sample would result a great variety. Also, the
evaporating rate in injection port of each injection may not be exactly the same. By
comparing the resulting concentration of internal standard (5α-cholestane) to that of the
added known quantity concentration, an injection corrective coefficient could be
obtained. This coefficient was used to adjust the injection inconsistent error and obtain
more reliable results for other interested compounds. Table 3.1 showed the amount of
27
injection to make each standard curve at the injection volume of 1µg. Concentration
and –peak height standard curves of the three compounds were made.
3.2. Cholesterol Oxidation Model
3.2.1. Stock Solution
One g of 5α-cholestane was weighed and diluted by hexane in a 1000ml
volumetric flask. Cholesterol stock solution was made by dissolving 5.00 g standard
cholesterol sample in 1000 ml hexane in a volumetric flask. The concentrations of stock
solutions were 1000 ppm for 5α-cholestane and 5000 ppm for cholesterol. The stock
solutions were stored in dark at 4℃ before use. The sample solutions used for
cholesterol oxidation model were diluted from the stock solution.
3.2.2. Cholesterol Oxidation Test Tube Preparation
Cholesterol solution was made from the cholesterol stock solution by diluting 1
ml of the stock solution in hexane to a 100 ml. One ml of cholesterol solution was
added into a 25 ml test tube. The hexane in the test tube was evaporated under vacuum
by a CentriVap Mobil System (Labconco, Kansas City, MO). Thus, 50 µg of
cholesterol was coating on the bottom of the test tube uniformly. The test tube coating
with cholesterol could be heated directly or mixed with other substance to monitor the
degree of the cholesterol oxidation during heating.
Vacuum evaporating under was fast and safe way to dry and coat cholesterol in
the test tube. CentriVip system consistes of a centrifugation and a vacuume. Centrifugal
force with heat and vacuum are used to rapidly dry samples. A vacuum was applied in
the chamber to lower solvent boiling point to a low temperature, the lower temperature
was avoid to change the sample properties. Use centrifugation eliminates bumping
28
caused by vacuum and concentrates the solute in the bottom of the tube. This allows
total solutes to be recovered during the solvent evaporation. The evaporated solvent
was trapped into a container placed in a low temperature chamber. The trapped
solvent could be reused if necessary.
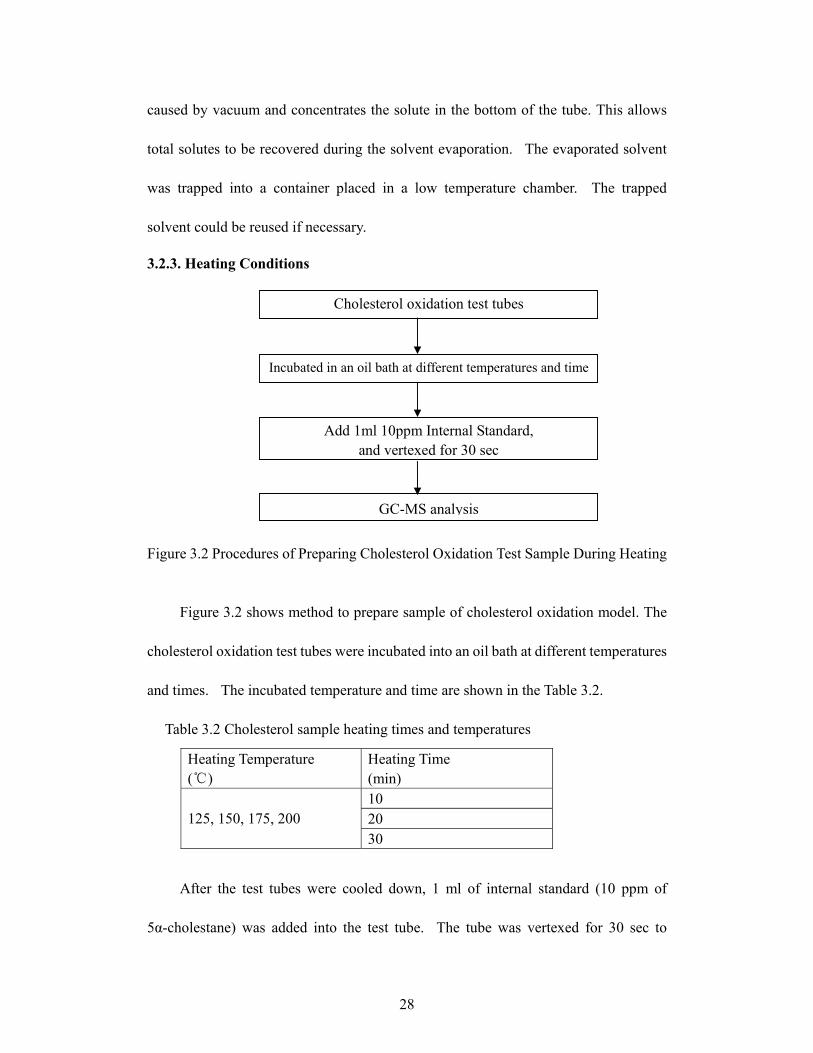
3.2.3. Heating Conditions
Figure 3.2 Procedures of Preparing Cholesterol Oxidation Test Sample During Heating
Figure 3.2 shows method to prepare sample of cholesterol oxidation model. The
cholesterol oxidation test tubes were incubated into an oil bath at different temperatures
and times. The incubated temperature and time are shown in the Table 3.2.
Table 3.2 Cholesterol sample heating times and temperatures
Heating Temperature (℃)
Heating Time (min) 10 20 125, 150, 175, 200 30
After the test tubes were cooled down, 1 ml of internal standard (10 ppm of
5α-cholestane) was added into the test tube. The tube was vertexed for 30 sec to
Cholesterol oxidation test tubes
Incubated in an oil bath at different temperatures and time
Add 1ml 10ppm Internal Standard, and vertexed for 30 sec
GC-MS analysis
29
dissolve the cholesterol and cholesterol oxidation products produced during heating,
and mixed them with the internal standard solution well. One µl of this solution was
injected into the GC-MS system for determining the cholesterol and cholesterol
oxidation products.
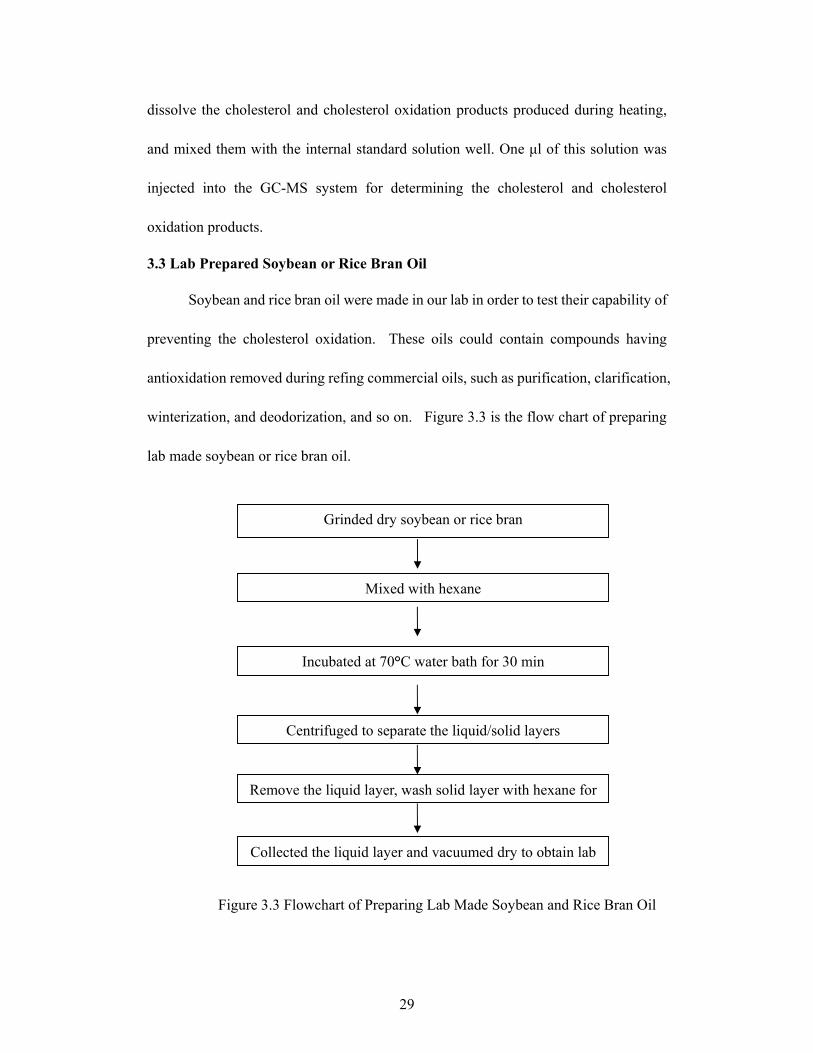
3.3 Lab Prepared Soybean or Rice Bran Oil
Soybean and rice bran oil were made in our lab in order to test their capability of
preventing the cholesterol oxidation. These oils could contain compounds having
antioxidation removed during refing commercial oils, such as purification, clarification,
winterization, and deodorization, and so on. Figure 3.3 is the flow chart of preparing
lab made soybean or rice bran oil.
Figure 3.3 Flowchart of Preparing Lab Made Soybean and Rice Bran Oil
Grinded dry soybean or rice bran
Incubated at 70°C water bath for 30 min
Centrifuged to separate the liquid/solid layers
Remove the liquid layer, wash solid layer with hexane for
Collected the liquid layer and vacuumed dry to obtain lab
Mixed with hexane
30
Soybean and rice bran was dried prior to solvent extraction, because many
organic solvents could not easily penetrate into foods containing high level of water and
result in inefficient. Dried samples were finely grinded to produce a more
homogeneous sample and to increase the surface area of lipid exposed to extraction as
well. One hundred g of grinded soybean or rice bran was mixed with 500 ml hexane.
The mixture was incubated into a water bath at 70 ºC and shock for 30 min. The flask
that contained grinded soybean/rice bran and hexane was shaken vigorously during
extraction so the organic solvent and aqueous phase were allowed to separate. After
the mixture was cooled down, it was centrifuged by a Hermle Labortechnik Centrifuge
(Wehingen, German) at 4000 rpm for 10 min to separate the hexane layer from solid
phases. The hexane layer was then transferred out to a clean 500 ml flask. This
procedure was repeated another two times with 100 ml of fresh hexane to improve the
efficiency of the extraction. All the solvent fractions were collected together. The lab
prepared soybean and rice bran oil were obtained after all hexane was evaporated by
vacuum drying. The CentriVap Mobile System was used to eveporate hexane
undervacuum.
3.4. Treatments Groups with Various Cooking Oils
Figure 3.4 shows the procedures of preparing cholesterol oxidation samples
mixing with different cooking oils during heating. One ml of cook oil was dissolved in
100 ml of hexane to oil solution. Then 1 ml of the oil solution was added into the
cholesterol oxidation test tubes. The solution of cooking oil and cholesterol were
vortexed for 30 second to mix cholesterol and oil well. The homogenous mixture in the
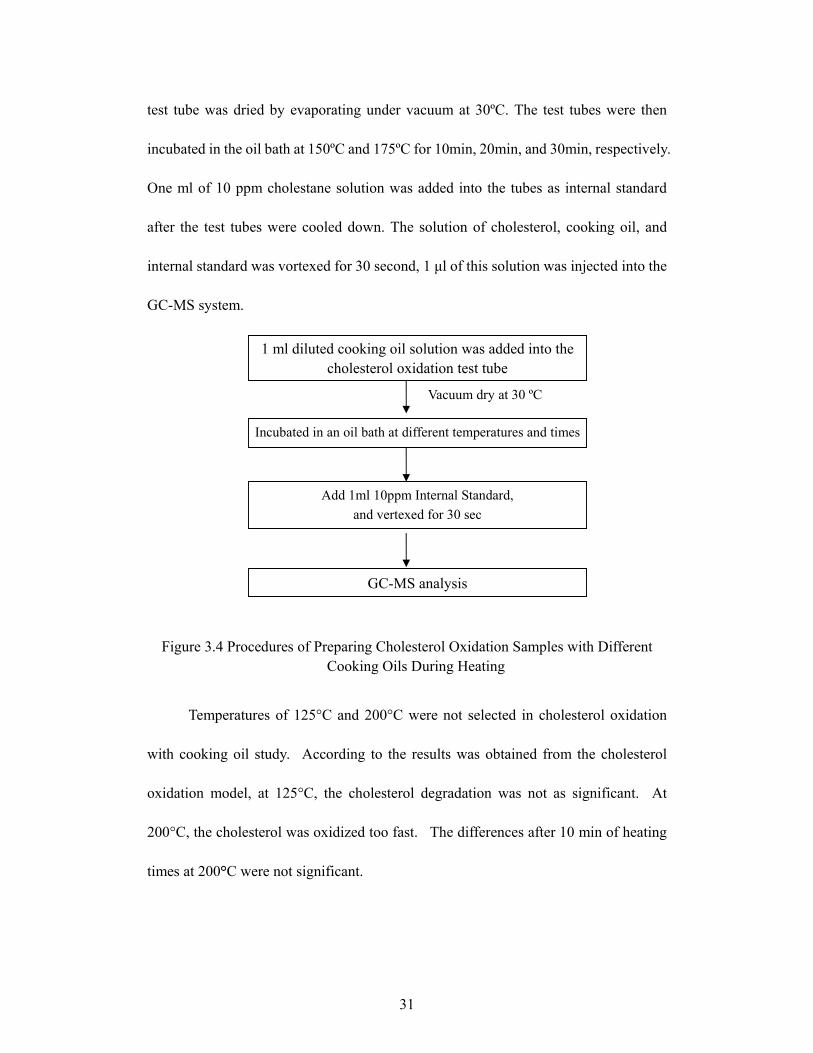
31
test tube was dried by evaporating under vacuum at 30ºC. The test tubes were then
incubated in the oil bath at 150ºC and 175ºC for 10min, 20min, and 30min, respectively.
One ml of 10 ppm cholestane solution was added into the tubes as internal standard
after the test tubes were cooled down. The solution of cholesterol, cooking oil, and
internal standard was vortexed for 30 second, 1 µl of this solution was injected into the
GC-MS system.
Figure 3.4 Procedures of Preparing Cholesterol Oxidation Samples with Different
Cooking Oils During Heating
Temperatures of 125°C and 200°C were not selected in cholesterol oxidation
with cooking oil study. According to the results was obtained from the cholesterol
oxidation model, at 125°C, the cholesterol degradation was not as significant. At
200°C, the cholesterol was oxidized too fast. The differences after 10 min of heating
times at 200°C were not significant.
1 ml diluted cooking oil solution was added into the cholesterol oxidation test tube
Incubated in an oil bath at different temperatures and times
Add 1ml 10ppm Internal Standard, and vertexed for 30 sec
GC-MS analysis
Vacuum dry at 30 ºC
32
3.5. Cholesterol Oxidation in Salmon Fish Meat with and Without Cooking Oils
3.5.1. Salmon Sample Preparation
Salmon fish fillet were bought from local market. The fillet skin was removed.
The salmon fish meat was homogenized to avoid cholesterol level variable due to the
different lipid contents in different part of the fish fillet. For the salmon fish meat
without adding cooking oil (control group), each sample contained 3.0 g of salmon
sample. For the salmon fish meat with cooking oil (the treatment group), 0.3 g of rice
bran oil or lab made soybean oil was mixed with 3 g of salmon samples evenly to
prevent the formation of oil coat. The salmon meat of control and treatment were
pressed to form approximate 5 mm thickness and 25 mm diameter when heating.
3.5.2. Moisture Content
Ten grams of fresh salmon fish was weighted and put into the 55℃ oven for 24
hours. The sample was spreaded as uniformly thin as possible. The salmon sample
was weighted again after heating (ASTM).
The moisture content = 100% (Original weight-Dried weight)/Original weight
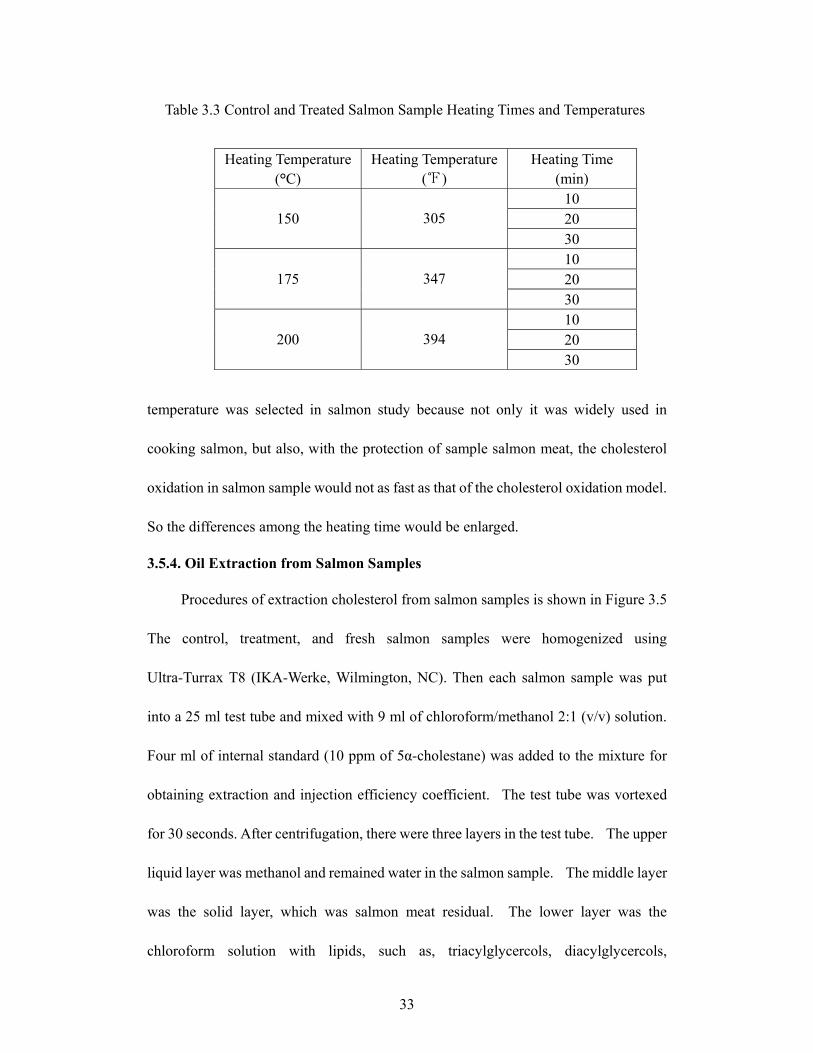
3.5.3. Roasting Control and Treatment of Salmon Fish Meat
The control and treatment salmon samples were put into kitchen oven (Hotpoint
automatic oven) the temperature and time indicated in the Table 3.3. Normal roasting
temperatures for cooking salmon were selected for heating control and treatment
samples. Generally, the roasting time very from 325℉ to 425℉, and the cooking
times are from 12 min to 25 min. Although the temperature of 200°C was not selected
in cholesterol oxidation with cooking oils model due to the cholesterol degradated too
fast. The differences after 10 min heating at 200°C were not significant. However, the
33
Table 3.3 Control and Treated Salmon Sample Heating Times and Temperatures
Heating Temperature
(°C) Heating Temperature
(℉) Heating Time
(min) 10 20 150
305
30 10 20 175
347
30 10 20 200
394
30
temperature was selected in salmon study because not only it was widely used in
cooking salmon, but also, with the protection of sample salmon meat, the cholesterol
oxidation in salmon sample would not as fast as that of the cholesterol oxidation model.
So the differences among the heating time would be enlarged.
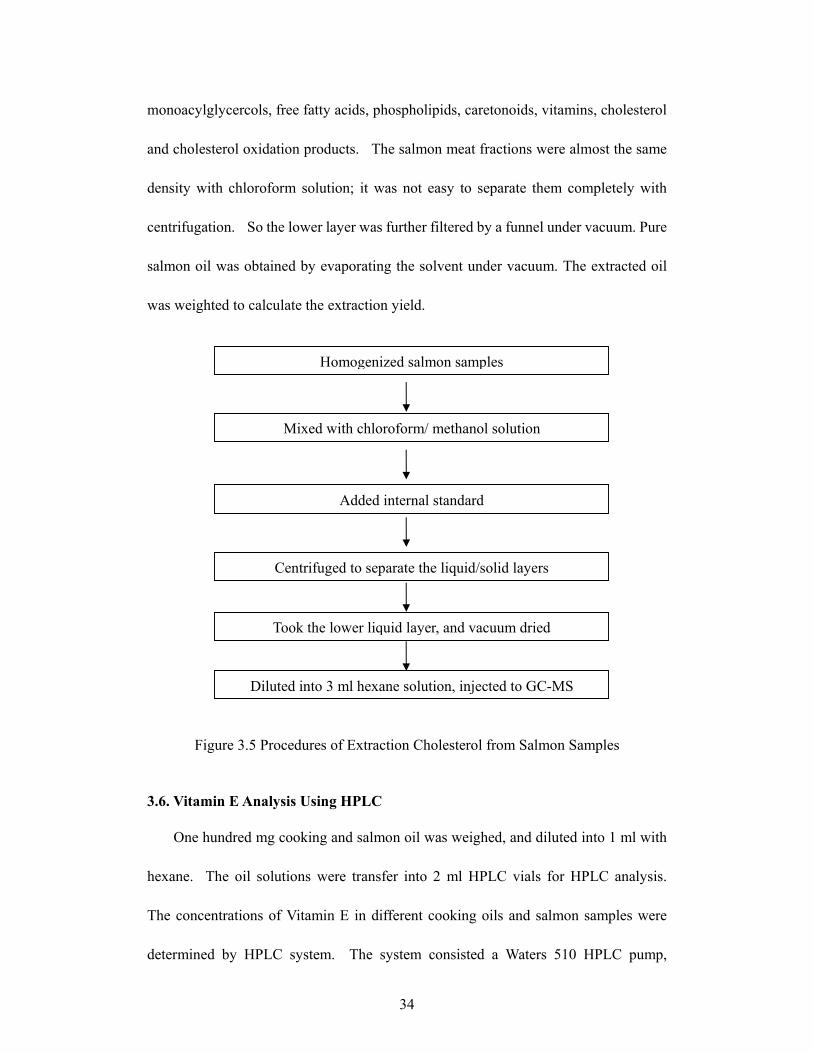
3.5.4. Oil Extraction from Salmon Samples
Procedures of extraction cholesterol from salmon samples is shown in Figure 3.5
The control, treatment, and fresh salmon samples were homogenized using
Ultra-Turrax T8 (IKA-Werke, Wilmington, NC). Then each salmon sample was put
into a 25 ml test tube and mixed with 9 ml of chloroform/methanol 2:1 (v/v) solution.
Four ml of internal standard (10 ppm of 5α-cholestane) was added to the mixture for
obtaining extraction and injection efficiency coefficient. The test tube was vortexed
for 30 seconds. After centrifugation, there were three layers in the test tube. The upper
liquid layer was methanol and remained water in the salmon sample. The middle layer
was the solid layer, which was salmon meat residual. The lower layer was the
chloroform solution with lipids, such as, triacylglycercols, diacylglycercols,
34
monoacylglycercols, free fatty acids, phospholipids, caretonoids, vitamins, cholesterol
and cholesterol oxidation products. The salmon meat fractions were almost the same
density with chloroform solution; it was not easy to separate them completely with
centrifugation. So the lower layer was further filtered by a funnel under vacuum. Pure
salmon oil was obtained by evaporating the solvent under vacuum. The extracted oil
was weighted to calculate the extraction yield.
Figure 3.5 Procedures of Extraction Cholesterol from Salmon Samples
3.6. Vitamin E Analysis Using HPLC
One hundred mg cooking and salmon oil was weighed, and diluted into 1 ml with
hexane. The oil solutions were transfer into 2 ml HPLC vials for HPLC analysis.
The concentrations of Vitamin E in different cooking oils and salmon samples were
determined by HPLC system. The system consisted a Waters 510 HPLC pump,
Homogenized salmon samples
Added internal standard
Centrifuged to separate the liquid/solid layers
Took the lower liquid layer, and vacuum dried
Diluted into 3 ml hexane solution, injected to GC-MS
Mixed with chloroform/ methanol solution
35
Waters 717 Plus Autosampler, Discovery C18 HPLC column (25 cm x 3 mm, 5 µm)
(Supelco Inc., Bellefonte, PA), and Waters 474 Scanning Fluorescence Detector. The
mobile phase was a mixture solution of 0.8% acetate acid, 0.8% ethyl acetate, and
98.4% of hexane, and the flow rate was 2 ml/min. The mobile phase solution was
degassed with very low pressure of helium before pumped into the HPLC system. The
sample injection volume was 25 µl. The HPLC system without the column was first
flashed using methanol for 20 min to eliminate any contamination in the system. After
flashing, the mobile phase was pumped into the system without column to get rid of the
methanol in the system. The column was connected after 10 min of flushing with
mobile phase. Disconnection the column was to prevent washing solution entering the
column, thus would largely increase the balance time. Equinity the column with
mobile phase for 30 min to fill the whole column with mobile phase. This could be
monitored on the output from the computer that connected with the detector. A
straight base line indicated the finishing of balance.
3.7. Statistical Analysis
Each of control and treatment groups was replicated three times at the same
heating temperature and time. T test procedure (Excel Data Analysis, Microsoft Inc.,
Seattle, WA) was used to compare the loss of cholesterol and production of
7-ketocholesterol between control and each treatment group. Significant difference
among means was considered at P < 0.05.
36
Chapter 4 Results and Discussions
4.1. Cholesterol and Cholesterol Oxidation Products Analysis Method
4.1.1. GC Column Selection for the Cholesterol Analysis
Column selection is based on five primary factors: sample, stationary phase type,
column ID, stationary phase film thickness, and column length. The stationary phase
is a polymeric film coated on the inner wall of the capillary column. Differences of the
chemical and physical properties of injected organic compounds and their interactions
with the stationary phase are the very critical principles for the successful separation.
Retention time is that how long the time of analyzed compound is retained in the
column. The most important characteristic of stationary phase is polarity, because it
dictates selectivity, or the ability of the column to separate sample components. A
nonpolar column is best for analyses of nonpolar compounds. Interactions between
nonpolar compounds and a nonpolar phase are dispersive, thus separation is based
exclusively on the boiling points of the molecules (Supelco, 1999; Restek, 2004).
Cholesterol and most of its COPs are low polarity. A fused silica column with coating
film of poly (5% diphenyl/95% dimethylsiloxane) was selected in this study. The
tolerance temperature limits of this column is -60°C to 320°C, which is high enough be
used in the reproducible analyses of plant sterols, cholesterol, and COPs. A Rtx-5
(phenyl/ methylsiloxane) column was used by Echarte (2001) and Al-Saghir et al.
(2004) to test cholesterol and COPs. However, chemical derivatization was needed to
apply to the cholesterol samples before injection.
37
When selecting the capillary column inside diameter (ID), two factors need to be
considered: efficiency (number of theoretical plates) and sample capacity (the amount
of any one sample component that can be applied to the column without causing a
overload. Narrower columns (0.10mm-0.32mm ID) provide the best resolution, while
wider columns (0.53mm and 0.75mm ID) provide the greatest sample capacity (VWR
International). In our study, the efficiency of the column is much more important, so a
narrow column with 0.25 mm ID was selected. As the concentration of the cholesterol
sample in this study was low and the injection volume was small, the over loading
problem for the narrow column could be avoid.
4.1.2. GC-MS Operating Conditions
Factors considered for a GC operation include sample concentration, injection
volume, column temperature, and flow rate of carrier gas. The optimal parameters
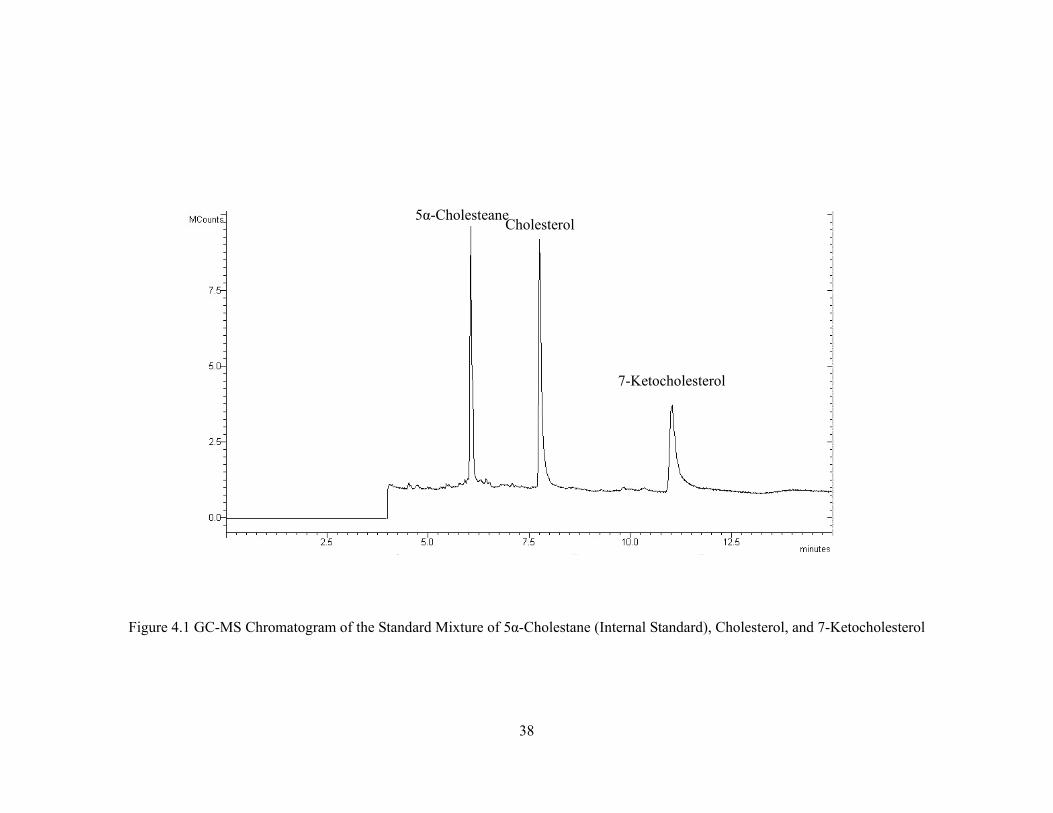
were developed after numeric trials of standard and actual samples. Figure 4.1 is the
chromatogram of 5-cholestane, cholesterol, and 7-ketoncholesterol using the optimized
operation condition. The retention time of 5α-cholestane, cholesterol, and
7-ketoncholesterol was 7.024min, 9.998min, and 14.986 min, respectively. Narrow
peaks of each component without overlay was obtained, the differences of retention
time (resolution) among the components was big enough. The peak of the highest
component of the sample (cholesterol) was not much different from that of the internal
standard.
38
Figure 4.1 GC-MS Chromatogram of the Standard Mixture of 5α-Cholestane (Internal Standard), Cholesterol, and 7-Ketocholesterol
Cholesterol
7-Ketocholesterol
5α-Cholesteane
39
The concentration of the sample was selected. The sample could not be
vaporized completely at the injection port, if the concentration was too high. The
unvaporized sample was not sent into the column and resulted low injection efficiency.
The left over sample was carbonized by the high temperature; the carbonized
compounds could stick on the injection port, and cause contaminations. In case, the
peak heights of sample solutions at different concentrations were not linear. Injection
volume has to be increased to make the peaks detectable and analyzable if the sample
concentration was too low. Increasing injection volume might reduce the vaporization
efficiency and cause over load of the injection port and. In this study, when the
injection volume is 1 µl, the suitable concentration of internal standard (5α-cholestane),
cholesterol, and 7-ketocholesterol was 10 ppm, 50 ppm, and 100 ppm, respectively.
The column temperature was optimized when sensitivity and resolution of a
complex mixture was achieved in the shortest possible run time. Several temperature
programs were tested in this study. The condition for the highest sensitivity was: the
GC oven temperature was increased by 15�/min to a final temperature of 250� from
the initial temperature of 200�. The detector was closed at the first 2.5 min to avoid the
solvent peak. Too much amount of ions went into the detector, such as the solvent,
would reduce the life time of the detector. Because the flow rate of carrier gas could be
changed by increasing column temperature, the pressure control is set up to ensure the
constant flow rate.
4.1.3. Other GC Method
Chemical derivatization was done in sample preparation in Fletours et al. (2000)’s
study. The reason for chemical derivatization is to impart nonvolatility to volatile
compounds. The low volatility may result from the size of the molecule and the
resultant large dispersion forces holding the molecule together. Higher molecules may
40
have a low volatility due to the strong intermolecular attractions between polar groups.
In the latter case, masking the polar groups or modifying polar by chemical
derivatization can dramatically increase the volatility. However, yield of chemical
derivatization could be lower for some compounds. It could lower the sensitivity of
GC analysis. With the operating conditions used in this study, the cholesterol and
cholesterol oxidation product could be separated very well and determined without
using chemical derivatization by using the GC column as shown in Figure 4.1.
A fused silica capillary column (15 m x 0.32 mm id), coated with SPB-1 with
higher 1.0-mm film thickness, was used in Fletours et al. (2000)’s study. The drawbacks
of increasing the film thickness include, reducing column efficiency, increasing
retention times and the temperature at which a sample component will elute from the
column, and reducing the upper temperature limit (Supelco, 1999). A shorter column
also has less resolution than a longer column. Furthermore, as a chemical
derivatization is needed in their study, the sample preparation for GC analysis was more
complicated.
4.1.3.2. TLC Method
Thin-layer chromatography (TLC) has been used previously for separation of
COPs (Herian and Lee, 1985; Lube et al., 1986). Although TLC can readily separate
some side-chain and B-ring hydroxycholesterols, the separation of cholesterol
hydroperoxides has been difficult (Teng et al. 1973). TLC is used mainly to separate
and determine the concentration of different types of lipid groups in foods, e.g.
triacylglycerols, diacylglycerols, monoacylglycerols, cholesterol, cholesterol oxides
and phospholipids. This procedure is inexpensive and allows rapid analysis of and is
popular in testing cholesterol and COPs (Maerker and Bunick, 1986). TLC can be
used to confirm the identity of COPs based on their distinctive color development after
41
spraying with sulfuric acid and observation under UV light (Maerker and Bunick, 1986).
The disadvantage of the TLC technique is that the resolution is low and precise
orientation of the separated components on the plate may vary from one run to another.
No standard sample can be used to appreciate the variations.
4.1.3.3. HPLC Method
HPLC is one of the most powerful analytical procedures for separating and
analyzing the lipids. It has been used to determine cholesterol and its oxidation
products (Teng, 1991; Chen, 1994). Compared to TLC, it allows detection and
determination of a larger range of compounds at higher sensitivity. The HPLC method
shows very good separation power and selectivity for cholesterol and COPs. Kou and
Holmes (1985) used a reversed-phase HPLC column to purify 25-OH, followed by
quantization on a silicic acid column, with detection at 205 nm and flow rate at 1.7
ml/min. The authors reported that the application of two columns is necessary to obtain
the consistent baseline resolution of 25-OH from the other contaminating peaks. The
major disadvantages of HPLC methods are the low sensitivity for cholesterol and COPs,
and running time is relatively longer. The concentration needed for HPLC is at least
1000 ppm (Chen, 1994). That study also evaluated C18-columns for the separation of
COPs. A gradient system of acetonitritemethanol in various proportions was used
within 60 min running time.
4.1.3.4. Advantages of Our GC-MS Method
GC can be used to resolve geometric isomers, which can not be separated by HPLC.
The combination of GC and MS is an effective tool for COPs analysis, which includes
not only quantification but also identification. The mass spectrums obtained from
GC-MS assist elucidation of the chemical structures of COPs and further contribute to
their identification. The MS fingerprint is shown if Figure 3.1. The advantages of our
42
method including simple sample preparation (a chemical derivatization is not
necessary), higher sensitivity and resolution, and could select ion for quantification in
case of overlap problem to interested peaks.
4.1.4. Standard Curves
The standard curves of 5α-cholestane, cholesterol, and 7-ketocholesterol was
y=215.89x (R2 = 0.9424), y=12.839x (R2 = 0.9945), and y=76.03x (R2 = 0.9228),
respectively. The typical ion of cholesterol (386) was also picked to make standard
curve, y=1.0642x (R2 = 0.9712). For each injection, the real concentration of the
internal standard in that specific injection was calculated by using the peak height of the
5α-cholestane and its standard curve. This calculated concentration was then divided
by the solution concentration (10 ppm), so the ratio of the amount that really injected
into the GC column to the amount of injection was obtained. The injection ratio was
later multiplied to the concentrations of cholesterol and other COPs obtained from their
standard curves, to get the true concentration of these compounds.
For example, a concentration- peak height standard curves of internal standard
and cholesterol are:
Height IS = 215.89 x Conc IS.
Height chol = 12.839 x Conc chol.
An unknown cholesterol oxidation sample with the internal standard concentration
of 10 ppm is injected into the GC system. The peak height of internal standard and
cholesterol is 1960 KCount and 540 KCount. According the standard curve of internal
standard, the true internal standard concentration should be
1960/215.89 = 9.08 ppm.
So the injection corrective coefficient is
100*9.08/10 = 90.8%.
43
The peak height of cholesterol is corrected to
540 x 90.8% = 485.2 KCount.
So the cholesterol concentration of the unknown sample is
485.2/12.839 = 37.7 ppm.
4.2. Oil Extraction
4.2.1. Extraction Yield
An ideal solvent for extraction would completely extract all interested components
from a food, while leaving all other components behind. In practice, the efficiency of
solvent extraction depends on the polarity of the interested compound compared to the
polarity of the solvent. Polar lipids, such as glycolipids or phospholipids, are more
soluble in polar solvents, such as alcohols, than in non-polar solvents, such as hexane.
Different compounds have different polarities means that it is impossible to select a
single organic solvent to extract them all. Thus extraction yield of different lipids, such
as triglyceride and cholesterol, depends on the polarity of the organic solvent used to in
extraction: the total lipid/cholesterol content determined using one solvent may be
different from that determined using another solvent. In addition, a solvent should also
have a relatively low boiling point, so that it can easily be removed by evaporation
(Gunstone and Padley, 1997). Ethyl ether and petroleum ether are the most commonly
used solvents, but pentane and hexane are also used for some foods. Chloroform is a
popular solvent, particularly for compounds of intermediate polarity such as cholesterol
and most COPs. Hexane is a good solvent only for lipids of low polarity. We used
hexane to extract soybean and rice bran oil, so some antioxidant, such as Vitamin E.
Phytochemicals could be extracted along with lipid. The salmon oil was extracted by
chloroform/methanol solution, which was more able to extract on cholesterol and
cholesterol oxidation products.
44
The extraction rates of soybean and rice bran oil were 19.2% and 18.34%,
respectively. Soybean contains appropriately 18%-21% lipid that various from species
(Erickson, 1980). Rice bran which is obtained as a by-product in the milling of brown
rice kernel to yield the familiar white rice, has an oil content that varies from 12 to 23 %,
depending on variety of rice and degree of milling (Gupta, 1989; Saunders, 1986).
Amarasinghe and Gangodavilage (2002) extracted rice bran oil with the extraction ratio
of 16.7%.
4.2.2. Comparison of Lab Prepared and Commercial Oils
4.2.2.1. Color, Physical and Chemical Differences
The color and viscosity differences between the commercial and lab prepared oils
were compared by visual observation. The commercial oils had bright and light
yellow color. The oils were very clear and semi-translucent. The lab prepared oils had
darker yellow color. They were not as clear and translucent as commercial oils, and not
as fluid as commercial oil at room temperature. Because lab prepared oil also contains
triglycerides, phospholipids, phenolic compounds, and phytosterols. The other
compounds increased the viscosity of lab oils and made the oils darker color.
4.2.2.2. Industry Process of Refining Oil
Oil is first degummed by a more aggressive medium, such as citric or phosphoric
acid to hydrate the phosphatides, and permit them separation from the oil. The next
step is neutralization with sodium hydroxide. The primary objective of the
neutralization is to remove the free fatty acids in the crude oil. These two procedures
may destroy some phenolic compounds by reacting with acid or alkyl. Neutral refined
oil than washed hot soft water and dried under a moderate vacuum at an oil temperature
of 90-100°C. The oil is then bleached by bleaching clays, which are naturally occurring
bentonite and montmorillonite clays. Bleaching clays can also remove trace metals and
45
phosphatides in the oil. The final step of refining is deordorization, which is a steam
distillation process that is carried out at high temperature (200-260�). This step
removes partial of natural tocopherol and tocotrienol antioxidants (Norris, 1985).
These compounds may also reduced by thermal degradation during the refining
procedure (Gunstone and Padley, 1997).
The phenolic compounds in the lab prepared oil may have antioxidation function
and reinforce other antioxidants in the oil to inhibit the cholesterol oxidation during
heating (Karakaya et al., 2001; Fukumoto and Mazza, 2000). Processing removes
over 30% of the vitamin E. In the lab prepared oils, phenolic compounds, which are
mostly removed during the bleaching step of commercial oil refining, were most likely
retained. Thus, the loss of antioxidants during oil refining may also be a critical factor
for those oils having lower capability in preventing cholesterol oxidation. In this study,
the level of 7-ketocholeserol in the lab prepared rice bran oil and soybean oil treatment
is much lower than that of commercial rice bran oil and soybean oil treatment,
respectively (Figure 4.6 and 4.7). The tocopherols and tocotrienols in the commercial
and lab prepared soybean and rice bran oils were tested by the HPLC and will be
discussed below.
4.3. Cholesterol Oxidation Model
4.3.1. Cholesterol Oxidation
Percentages of retained cholesterol during heating at different temperatures and
times were depicted in Figure 4.2. Less than 30% of cholesterol was lost after 30 min
of heating at 125°C. At 150°C heating temperature, the loss of cholesterol increased to
70% after 30 min. This was in agreement with the result reported by Chien et al.
(1998), where 64.8% of cholesterol was lost at the same heating temperature (150°C)
for 30 min. At 175°C heating temperature, the losses of cholesterol were 61, 87, and
88% at 10, 20, and 30 min, respectively.
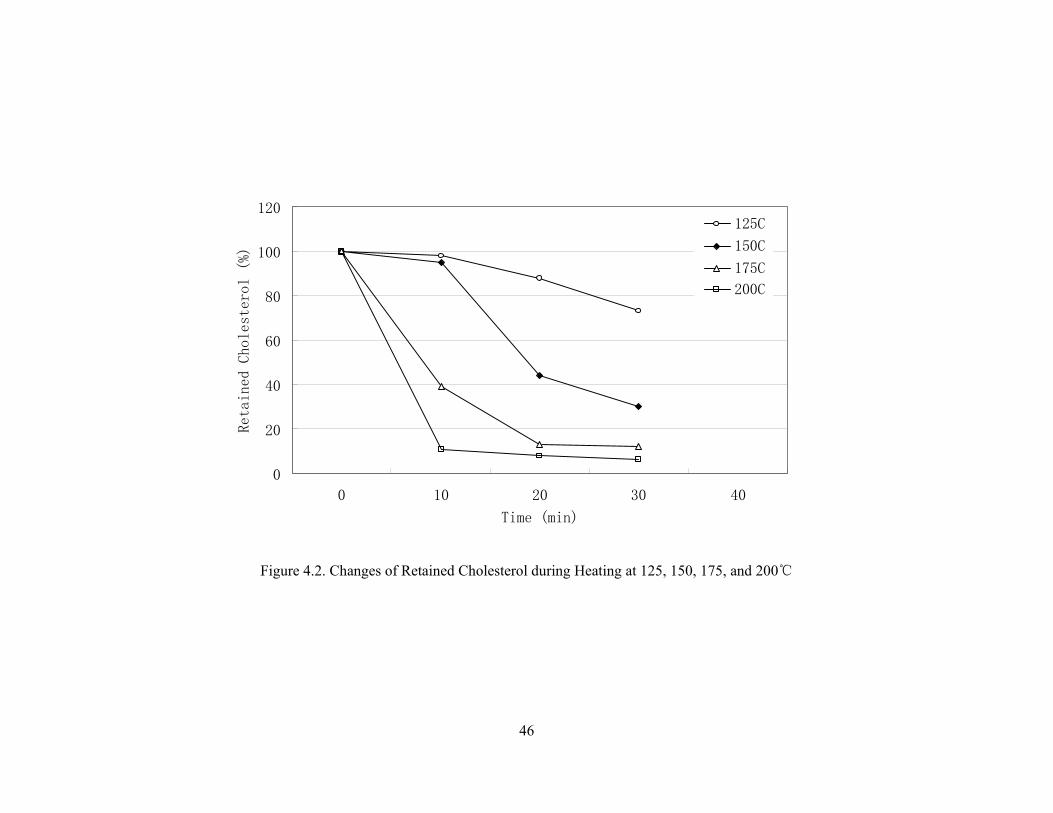
46
0
20
40
60
80
100
120
0 10 20 30 40
Time (min)
Retained Cholesterol (%)
125C
150C
175C
200C
Figure 4.2. Changes of Retained Cholesterol during Heating at 125, 150, 175, and 200℃
47
Only 11% of cholesterol was retained after heating at 200℃ for 10 min. These
results indicated that the loss of cholesterol by heating was extremely rapid when the
heating temperature was over 175 ℃.
4.3.2. COP Formation
7-Ketocholesterol has been found as a primary COP in many foods (Echarte, 2001;
Petron et al., 2003). It was also the principal COP in this study even in the low
concentration cholesterol model that was used. Figure 4.3 indicated the changes of
7-ketocholesterol when the cholesterol was heated at different temperatures and times.
7-ketocholesterol was not detected even after cholesterol had been heated at 125°C for
30 min. However, it was found when the heating temperature was raised to 150°C.
At 150°C, the concentration of 7-ketocholesterol was drastically increased to 2.11
µg/ml during 30 min of heating. At 175°C heating, it rapidly increased to 2.06 µg/ml
in 10 min and then leveled off. After 10 min heating at 200°C, the 7-ketocholesterol
concentration continuously decreased after it reached the highest concentration (2.46
µg/ml). The production of 7-ketocholesterol did not correspond to the loss of
cholesterol at 200 °C. And the rate of degradation of cholesterol at 200°C was less
than the rate of degradation of 7-ketocholesterol after 10 min heating.
This result suggested that the production of 7-ketocholesterol took place at
150°C and was greater than its degradation at the temperature. When the heating
temperature was raised over 175 °C, this procudtion rate could be suppressed by its
degradation. The degradation rate of 7-ketocholesterol could be less or higher than its
production under different heating temperatures, time, and concentrations of
cholesterol. It may be the reason why the different production rates of
7-ketocholesterol were reported in different model studies (Osada, 1994).
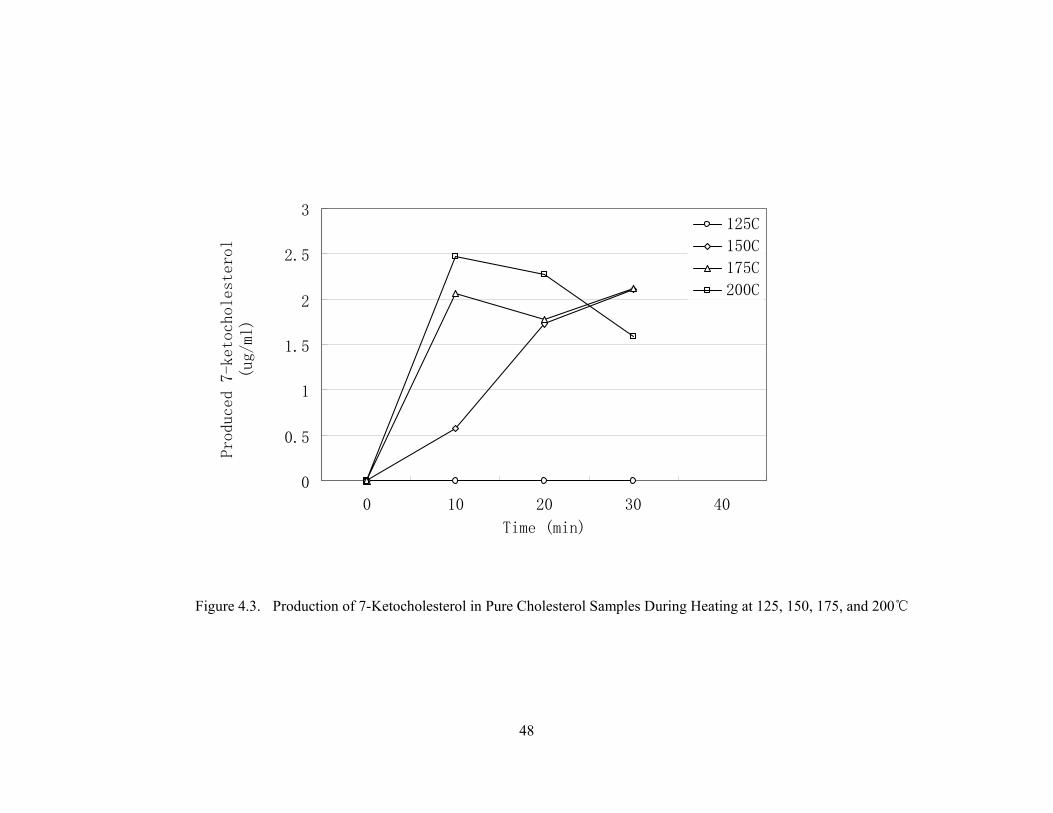
48
0
0.5
1
1.5
2
2.5
3
0 10 20 30 40
Time (min)
Produced 7-ketocholesterol
(ug/ml)
125C
150C
175C
200C
Figure 4.3. Production of 7-Ketocholesterol in Pure Cholesterol Samples During Heating at 125, 150, 175, and 200℃
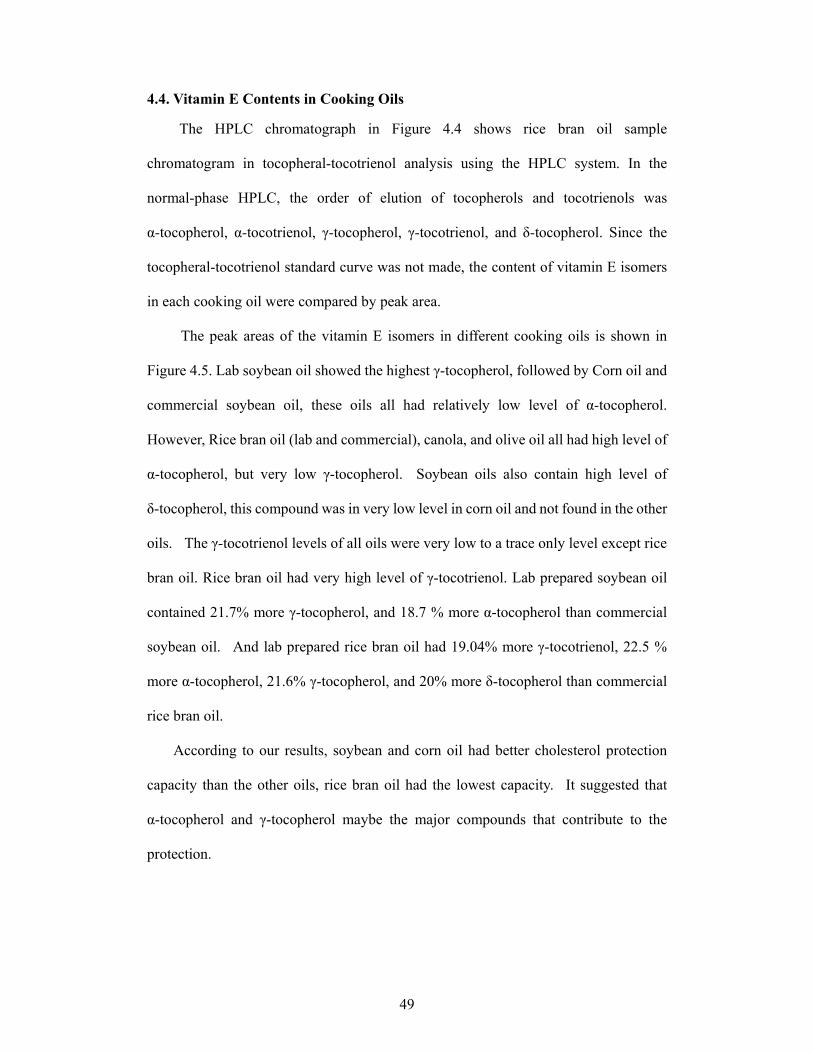
49
4.4. Vitamin E Contents in Cooking Oils
The HPLC chromatograph in Figure 4.4 shows rice bran oil sample
chromatogram in tocopheral-tocotrienol analysis using the HPLC system. In the
normal-phase HPLC, the order of elution of tocopherols and tocotrienols was
α-tocopherol, α-tocotrienol, γ-tocopherol, γ-tocotrienol, and δ-tocopherol. Since the
tocopheral-tocotrienol standard curve was not made, the content of vitamin E isomers
in each cooking oil were compared by peak area.
The peak areas of the vitamin E isomers in different cooking oils is shown in
Figure 4.5. Lab soybean oil showed the highest γ-tocopherol, followed by Corn oil and
commercial soybean oil, these oils all had relatively low level of α-tocopherol.
However, Rice bran oil (lab and commercial), canola, and olive oil all had high level of
α-tocopherol, but very low γ-tocopherol. Soybean oils also contain high level of
δ-tocopherol, this compound was in very low level in corn oil and not found in the other
oils. The γ-tocotrienol levels of all oils were very low to a trace only level except rice
bran oil. Rice bran oil had very high level of γ-tocotrienol. Lab prepared soybean oil
contained 21.7% more γ-tocopherol, and 18.7 % more α-tocopherol than commercial
soybean oil. And lab prepared rice bran oil had 19.04% more γ-tocotrienol, 22.5 %
more α-tocopherol, 21.6% γ-tocopherol, and 20% more δ-tocopherol than commercial
rice bran oil.
According to our results, soybean and corn oil had better cholesterol protection
capacity than the other oils, rice bran oil had the lowest capacity. It suggested that
α-tocopherol and γ-tocopherol maybe the major compounds that contribute to the
protection.
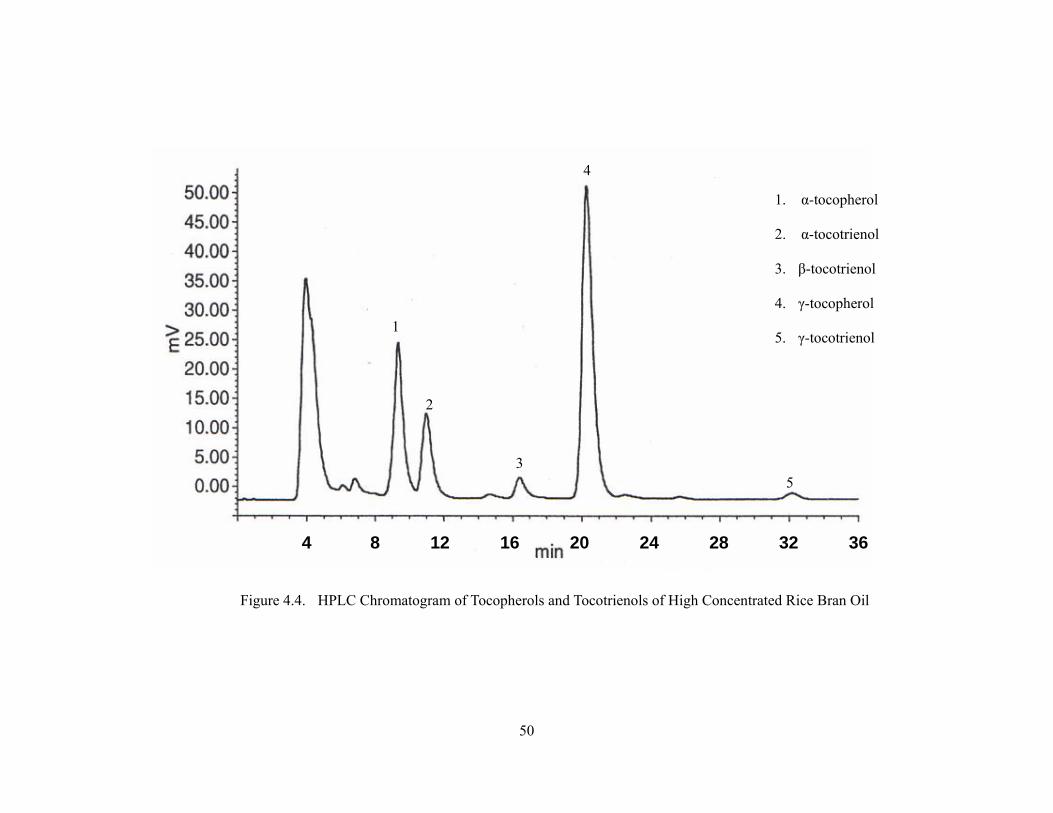
50
Figure 4.4. HPLC Chromatogram of Tocopherols and Tocotrienols of High Concentrated Rice Bran Oil
4 8 12 16 20 24 28 32 36
1. α-tocopherol
2. α-tocotrienol
3. β-tocotrienol
4. γ-tocopherol
5. γ-tocotrienol 1
3
4
5
2
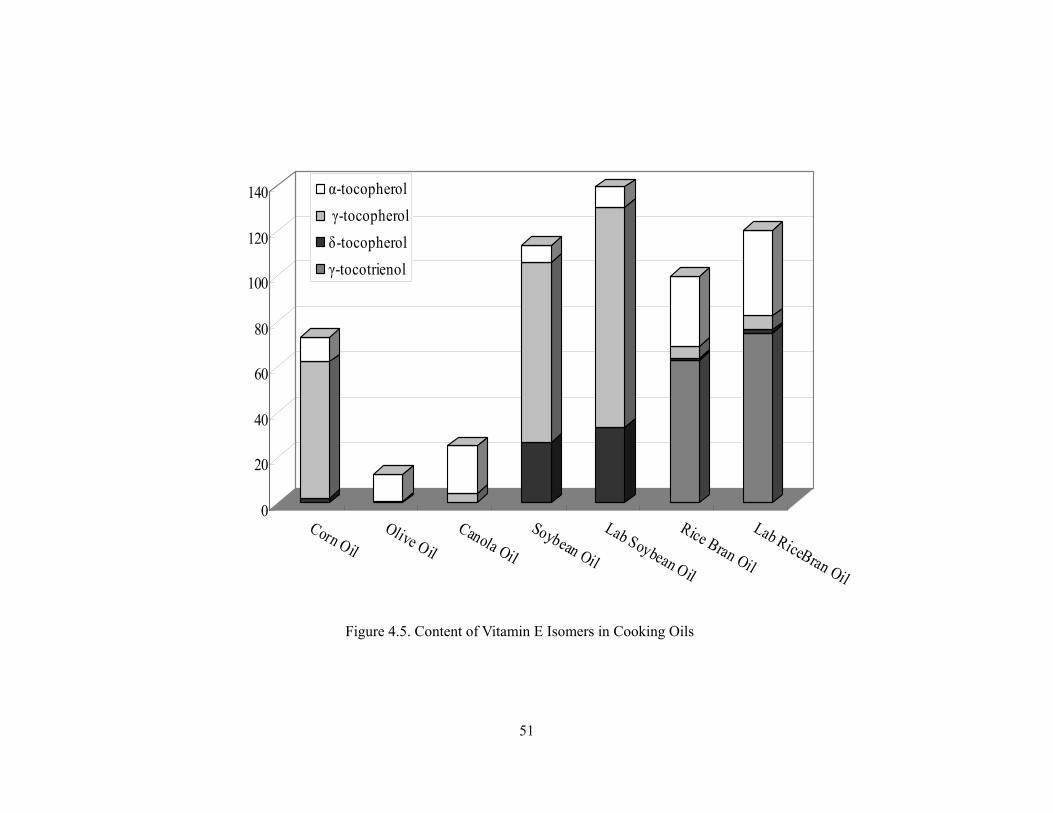
51
0
20
40
60
80
100
120
140
Corn OilOlive Oil
Canola Oil
Soybean Oil
Lab Soybean Oil
Rice Bran Oil
Lab RiceBran Oil
α-tocopherol γ-tocopherolδ-tocopherolγ-tocotrienol
Figure 4.5. Content of Vitamin E Isomers in Cooking Oils
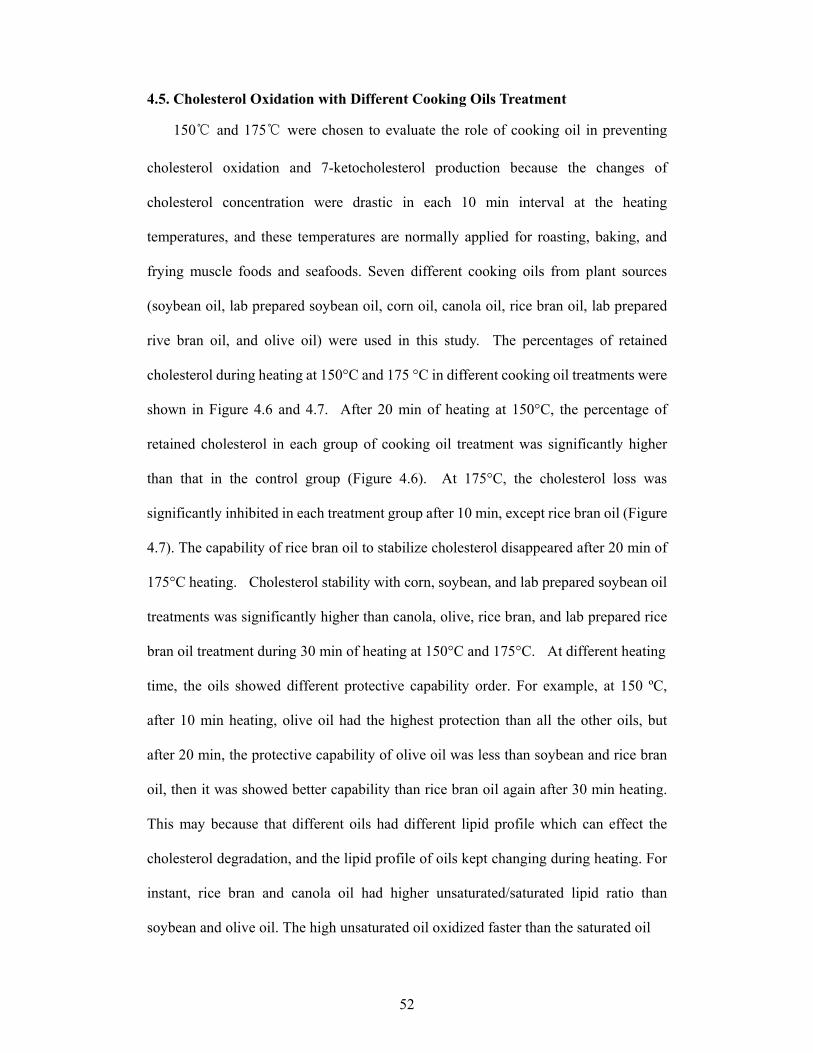
52
4.5. Cholesterol Oxidation with Different Cooking Oils Treatment
150℃ and 175℃ were chosen to evaluate the role of cooking oil in preventing
cholesterol oxidation and 7-ketocholesterol production because the changes of
cholesterol concentration were drastic in each 10 min interval at the heating
temperatures, and these temperatures are normally applied for roasting, baking, and
frying muscle foods and seafoods. Seven different cooking oils from plant sources
(soybean oil, lab prepared soybean oil, corn oil, canola oil, rice bran oil, lab prepared
rive bran oil, and olive oil) were used in this study. The percentages of retained
cholesterol during heating at 150°C and 175 °C in different cooking oil treatments were
shown in Figure 4.6 and 4.7. After 20 min of heating at 150°C, the percentage of
retained cholesterol in each group of cooking oil treatment was significantly higher
than that in the control group (Figure 4.6). At 175°C, the cholesterol loss was
significantly inhibited in each treatment group after 10 min, except rice bran oil (Figure
4.7). The capability of rice bran oil to stabilize cholesterol disappeared after 20 min of
175°C heating. Cholesterol stability with corn, soybean, and lab prepared soybean oil
treatments was significantly higher than canola, olive, rice bran, and lab prepared rice
bran oil treatment during 30 min of heating at 150°C and 175°C. At different heating
time, the oils showed different protective capability order. For example, at 150 ºC,
after 10 min heating, olive oil had the highest protection than all the other oils, but
after 20 min, the protective capability of olive oil was less than soybean and rice bran
oil, then it was showed better capability than rice bran oil again after 30 min heating.
This may because that different oils had different lipid profile which can effect the
cholesterol degradation, and the lipid profile of oils kept changing during heating. For
instant, rice bran and canola oil had higher unsaturated/saturated lipid ratio than
soybean and olive oil. The high unsaturated oil oxidized faster than the saturated oil
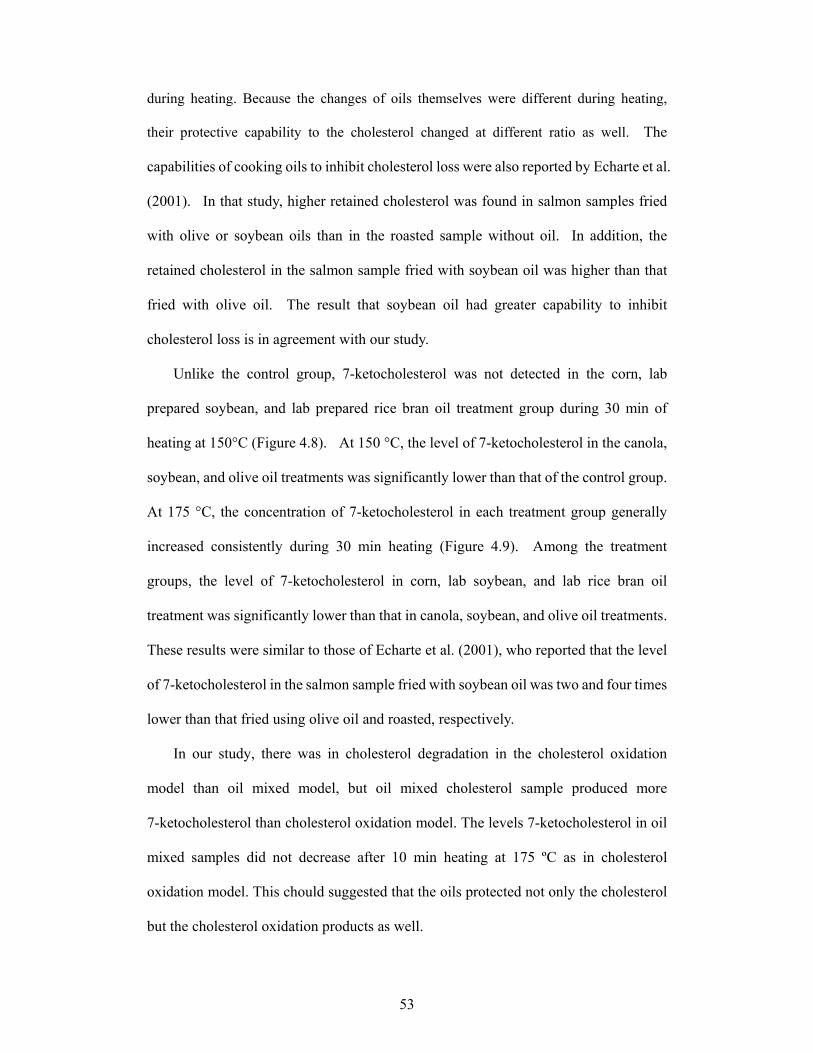
53
during heating. Because the changes of oils themselves were different during heating,
their protective capability to the cholesterol changed at different ratio as well. The
capabilities of cooking oils to inhibit cholesterol loss were also reported by Echarte et al.
(2001). In that study, higher retained cholesterol was found in salmon samples fried
with olive or soybean oils than in the roasted sample without oil. In addition, the
retained cholesterol in the salmon sample fried with soybean oil was higher than that
fried with olive oil. The result that soybean oil had greater capability to inhibit
cholesterol loss is in agreement with our study.
Unlike the control group, 7-ketocholesterol was not detected in the corn, lab
prepared soybean, and lab prepared rice bran oil treatment group during 30 min of
heating at 150°C (Figure 4.8). At 150 °C, the level of 7-ketocholesterol in the canola,
soybean, and olive oil treatments was significantly lower than that of the control group.
At 175 °C, the concentration of 7-ketocholesterol in each treatment group generally
increased consistently during 30 min heating (Figure 4.9). Among the treatment
groups, the level of 7-ketocholesterol in corn, lab soybean, and lab rice bran oil
treatment was significantly lower than that in canola, soybean, and olive oil treatments.
These results were similar to those of Echarte et al. (2001), who reported that the level
of 7-ketocholesterol in the salmon sample fried with soybean oil was two and four times
lower than that fried using olive oil and roasted, respectively.
In our study, there was in cholesterol degradation in the cholesterol oxidation
model than oil mixed model, but oil mixed cholesterol sample produced more
7-ketocholesterol than cholesterol oxidation model. The levels 7-ketocholesterol in oil
mixed samples did not decrease after 10 min heating at 175 ºC as in cholesterol
oxidation model. This chould suggested that the oils protected not only the cholesterol
but the cholesterol oxidation products as well.
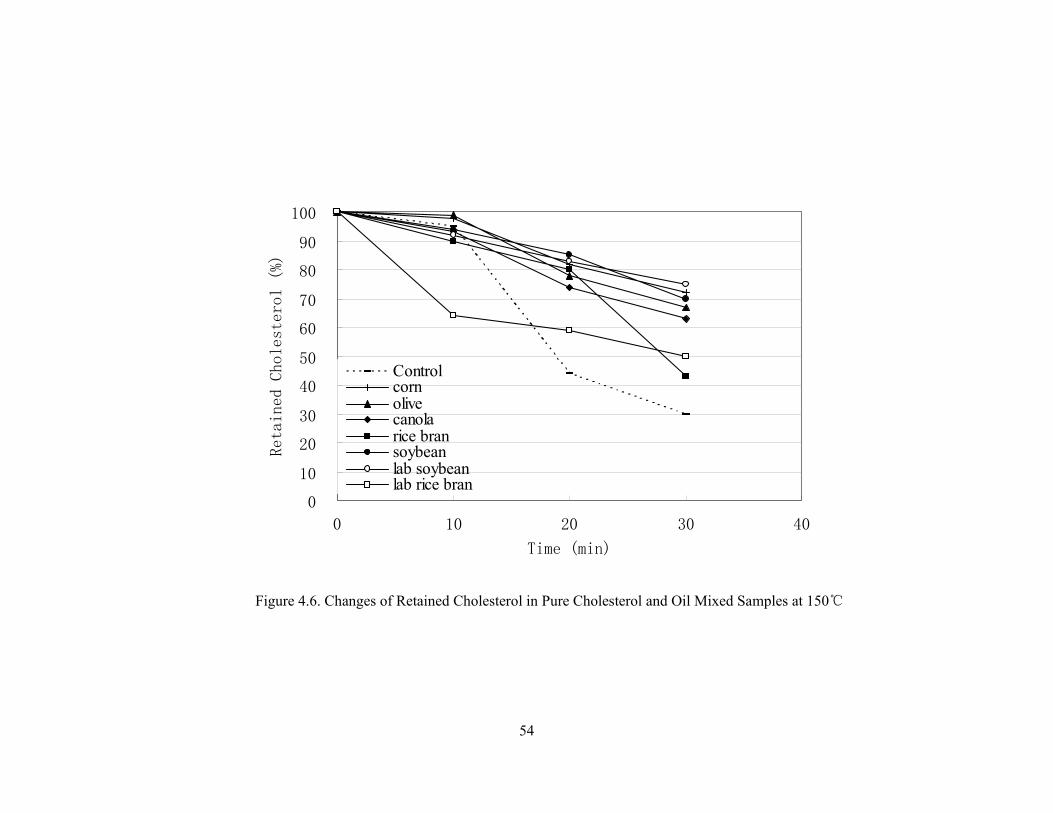
54
0
10
20
30
40
50
60
70
80
90
100
0 10 20 30 40
Time (min)
Retained Cholesterol (%)
Controlcornolivecanolarice bransoybeanlab soybeanlab rice bran
Figure 4.6. Changes of Retained Cholesterol in Pure Cholesterol and Oil Mixed Samples at 150℃
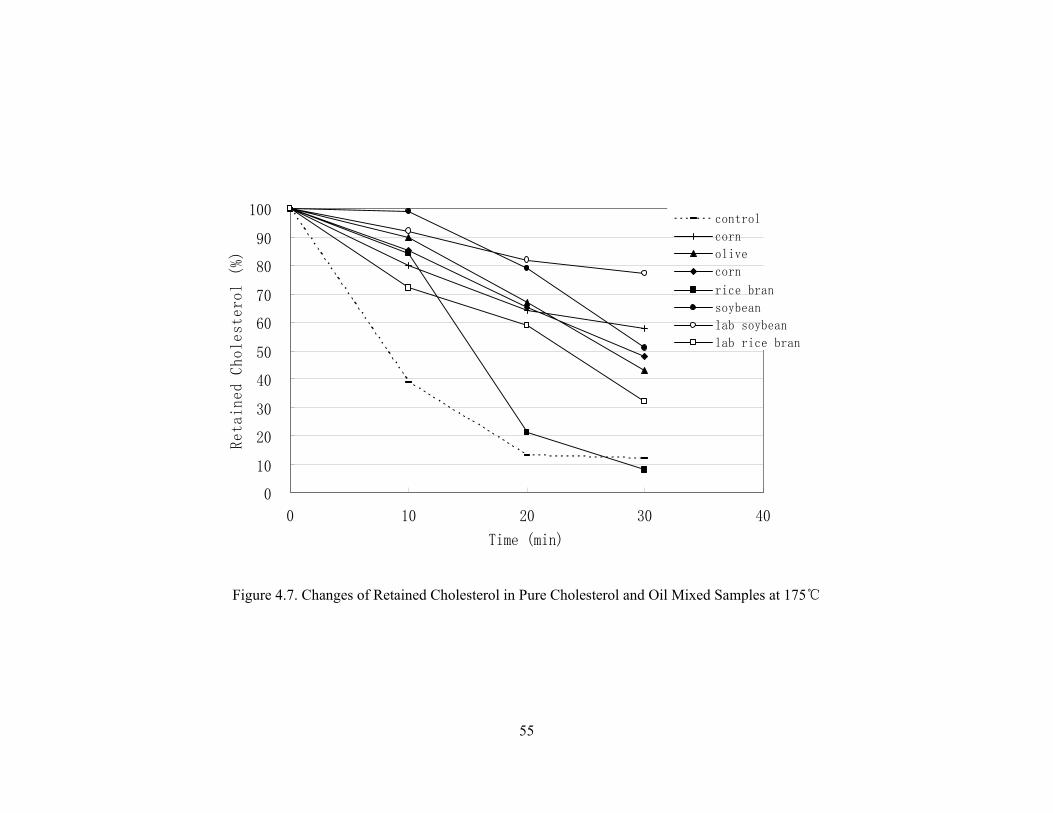
55
0
10
20
30
40
50
60
70
80
90
100
0 10 20 30 40
Time (min)
Retai
ned
Chol
est
ero
l (%)
control
corn
olive
corn
rice bran
soybean
lab soybean
lab rice bran
Figure 4.7. Changes of Retained Cholesterol in Pure Cholesterol and Oil Mixed Samples at 175℃
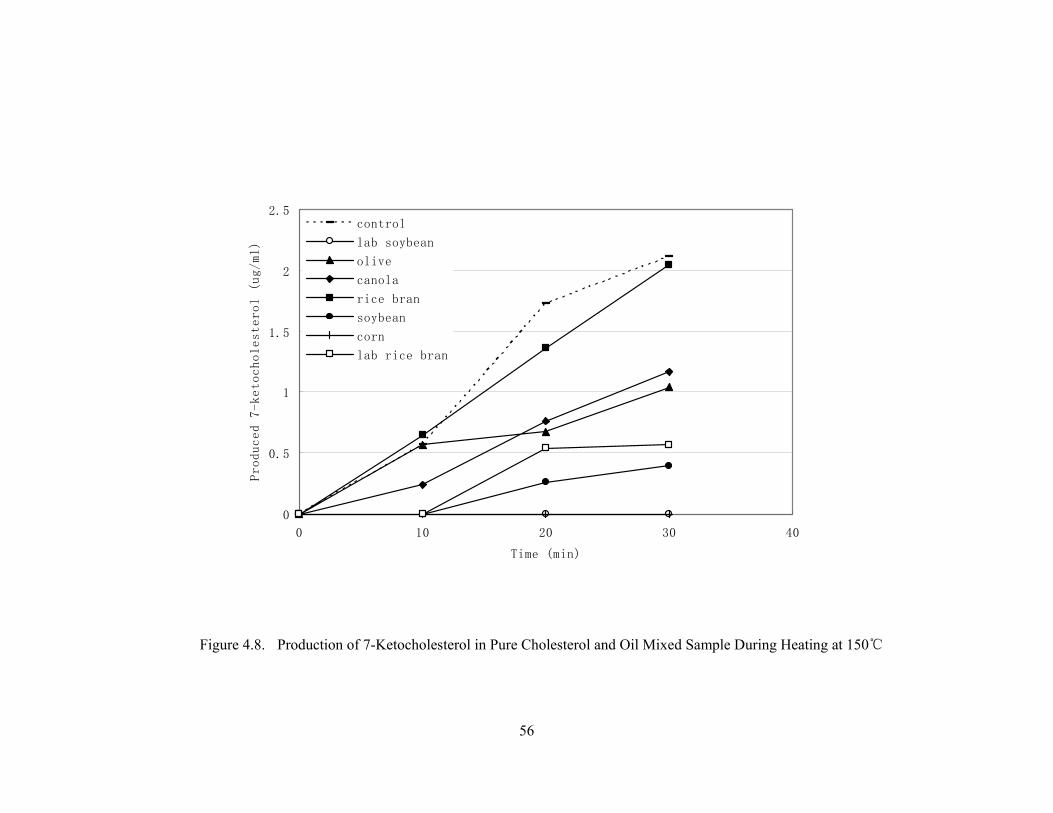
56
0
0.5
1
1.5
2
2.5
0 10 20 30 40
Time (min)
Produced 7-ketocholesterol (ug/ml)
control
lab soybean
olive
canola
rice bran
soybean
corn
lab rice bran
Figure 4.8. Production of 7-Ketocholesterol in Pure Cholesterol and Oil Mixed Sample During Heating at 150℃
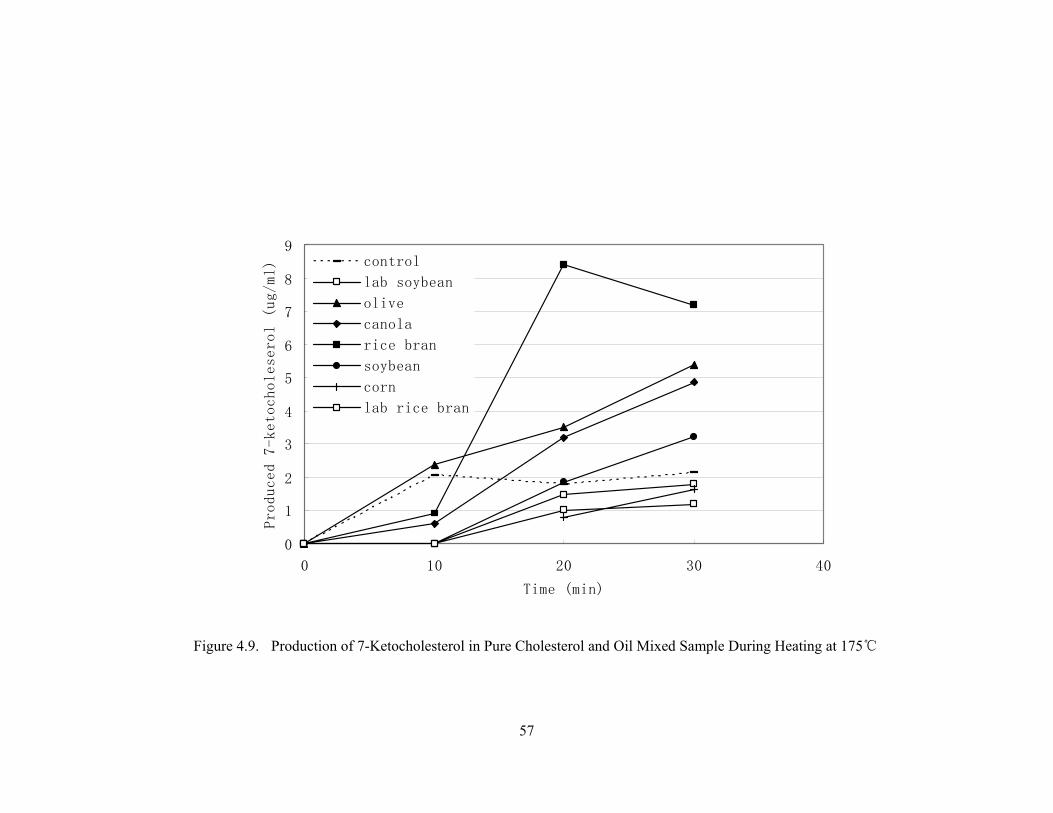
57
0
1
2
3
4
5
6
7
8
9
0 10 20 30 40
Time (min)
Produced 7-ketocholeserol (ug/ml) control
lab soybean
olive
canola
rice bran
soybean
corn
lab rice bran
Figure 4.9. Production of 7-Ketocholesterol in Pure Cholesterol and Oil Mixed Sample During Heating at 175℃
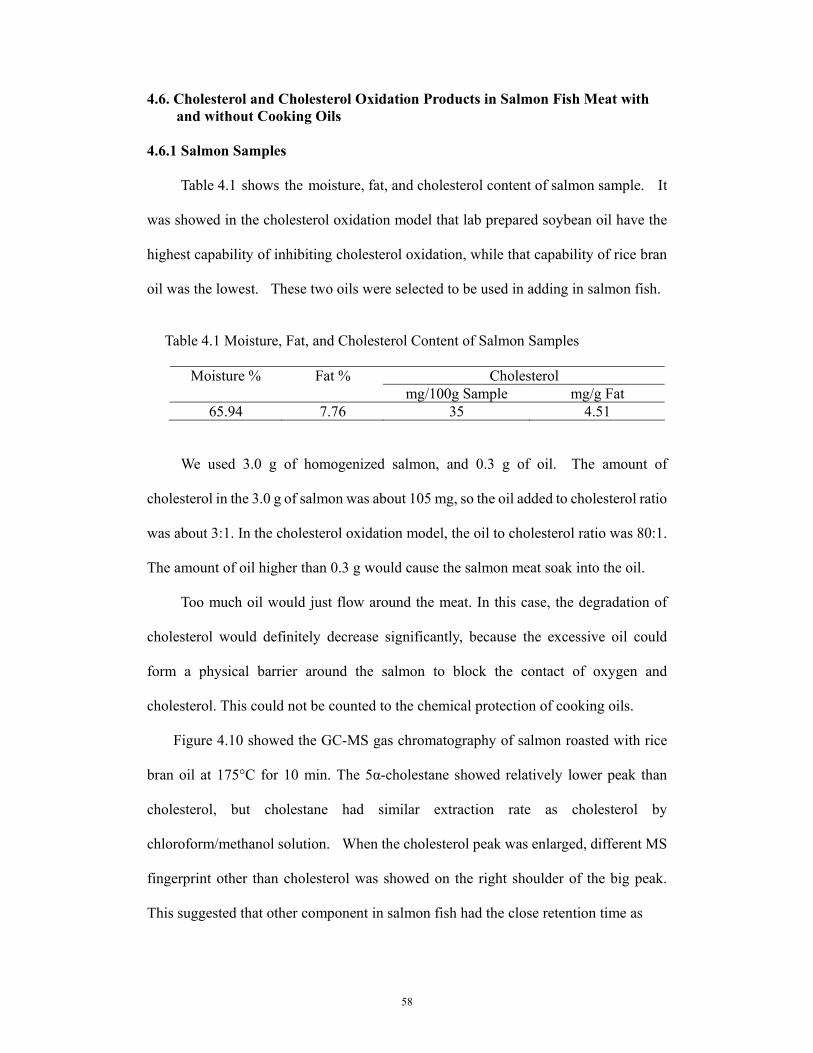
58
4.6. Cholesterol and Cholesterol Oxidation Products in Salmon Fish Meat with and without Cooking Oils
4.6.1 Salmon Samples
Table 4.1 shows the moisture, fat, and cholesterol content of salmon sample. It
was showed in the cholesterol oxidation model that lab prepared soybean oil have the
highest capability of inhibiting cholesterol oxidation, while that capability of rice bran
oil was the lowest. These two oils were selected to be used in adding in salmon fish.
Table 4.1 Moisture, Fat, and Cholesterol Content of Salmon Samples
Cholesterol Moisture % Fat % mg/100g Sample mg/g Fat
65.94 7.76 35 4.51
We used 3.0 g of homogenized salmon, and 0.3 g of oil. The amount of
cholesterol in the 3.0 g of salmon was about 105 mg, so the oil added to cholesterol ratio
was about 3:1. In the cholesterol oxidation model, the oil to cholesterol ratio was 80:1.
The amount of oil higher than 0.3 g would cause the salmon meat soak into the oil.
Too much oil would just flow around the meat. In this case, the degradation of
cholesterol would definitely decrease significantly, because the excessive oil could
form a physical barrier around the salmon to block the contact of oxygen and
cholesterol. This could not be counted to the chemical protection of cooking oils.
Figure 4.10 showed the GC-MS gas chromatography of salmon roasted with rice
bran oil at 175°C for 10 min. The 5α-cholestane showed relatively lower peak than
cholesterol, but cholestane had similar extraction rate as cholesterol by
chloroform/methanol solution. When the cholesterol peak was enlarged, different MS
fingerprint other than cholesterol was showed on the right shoulder of the big peak.
This suggested that other component in salmon fish had the close retention time as
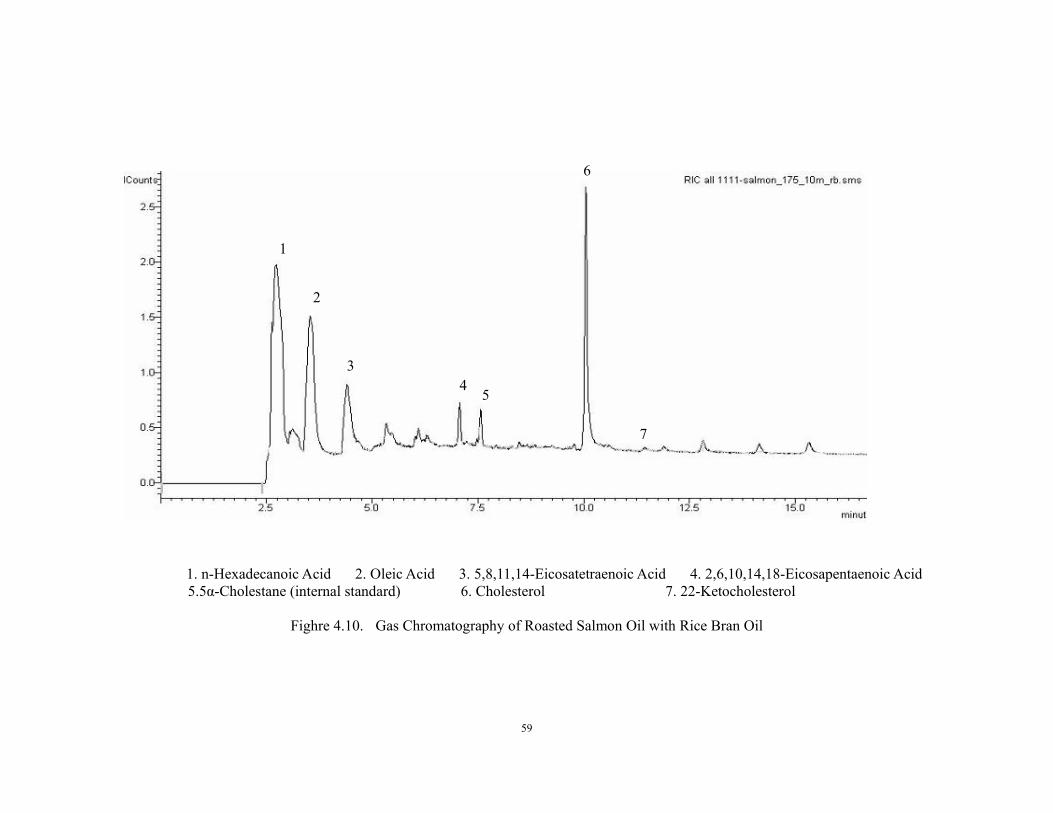
59
1. n-Hexadecanoic Acid 2. Oleic Acid 3. 5,8,11,14-Eicosatetraenoic Acid 4. 2,6,10,14,18-Eicosapentaenoic Acid 5.5α-Cholestane (internal standard) 6. Cholesterol 7. 22-Ketocholesterol
Fighre 4.10. Gas Chromatography of Roasted Salmon Oil with Rice Bran Oil
1
2
3 4 5
6
7
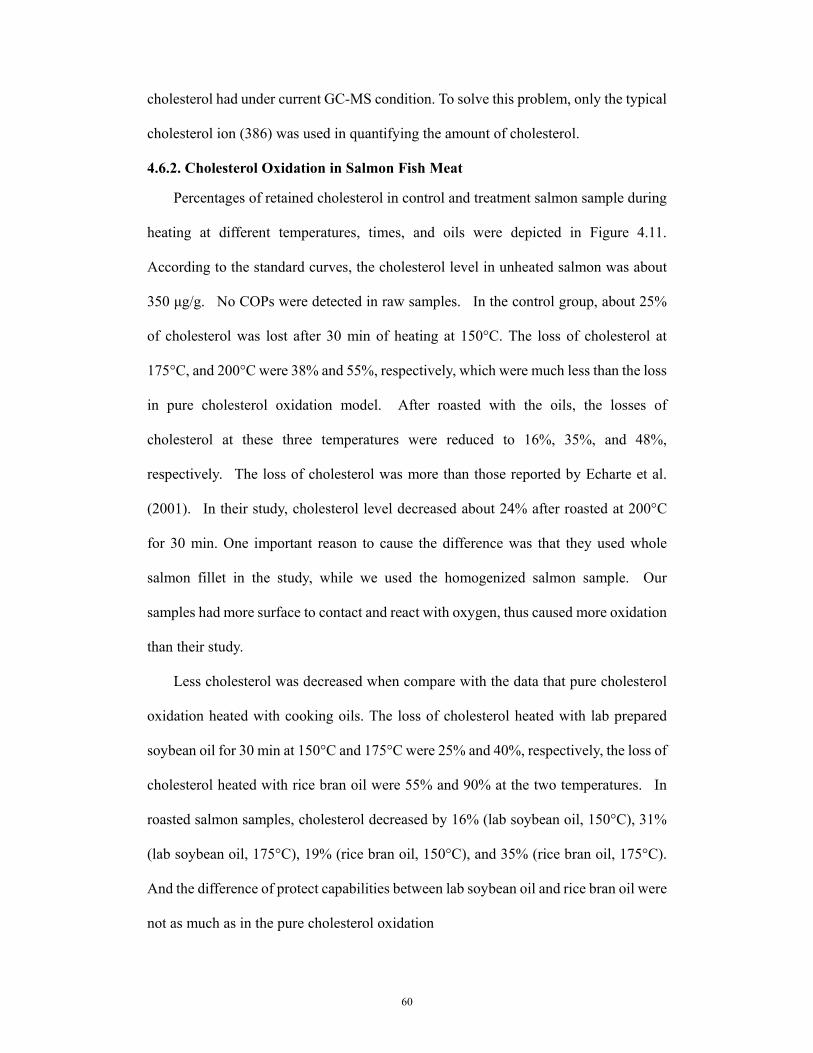
60
cholesterol had under current GC-MS condition. To solve this problem, only the typical
cholesterol ion (386) was used in quantifying the amount of cholesterol.
4.6.2. Cholesterol Oxidation in Salmon Fish Meat
Percentages of retained cholesterol in control and treatment salmon sample during
heating at different temperatures, times, and oils were depicted in Figure 4.11.
According to the standard curves, the cholesterol level in unheated salmon was about
350 µg/g. No COPs were detected in raw samples. In the control group, about 25%
of cholesterol was lost after 30 min of heating at 150°C. The loss of cholesterol at
175°C, and 200°C were 38% and 55%, respectively, which were much less than the loss
in pure cholesterol oxidation model. After roasted with the oils, the losses of
cholesterol at these three temperatures were reduced to 16%, 35%, and 48%,
respectively. The loss of cholesterol was more than those reported by Echarte et al.
(2001). In their study, cholesterol level decreased about 24% after roasted at 200°C
for 30 min. One important reason to cause the difference was that they used whole
salmon fillet in the study, while we used the homogenized salmon sample. Our
samples had more surface to contact and react with oxygen, thus caused more oxidation
than their study.
Less cholesterol was decreased when compare with the data that pure cholesterol
oxidation heated with cooking oils. The loss of cholesterol heated with lab prepared
soybean oil for 30 min at 150°C and 175°C were 25% and 40%, respectively, the loss of
cholesterol heated with rice bran oil were 55% and 90% at the two temperatures. In
roasted salmon samples, cholesterol decreased by 16% (lab soybean oil, 150°C), 31%
(lab soybean oil, 175°C), 19% (rice bran oil, 150°C), and 35% (rice bran oil, 175°C).
And the difference of protect capabilities between lab soybean oil and rice bran oil were
not as much as in the pure cholesterol oxidation
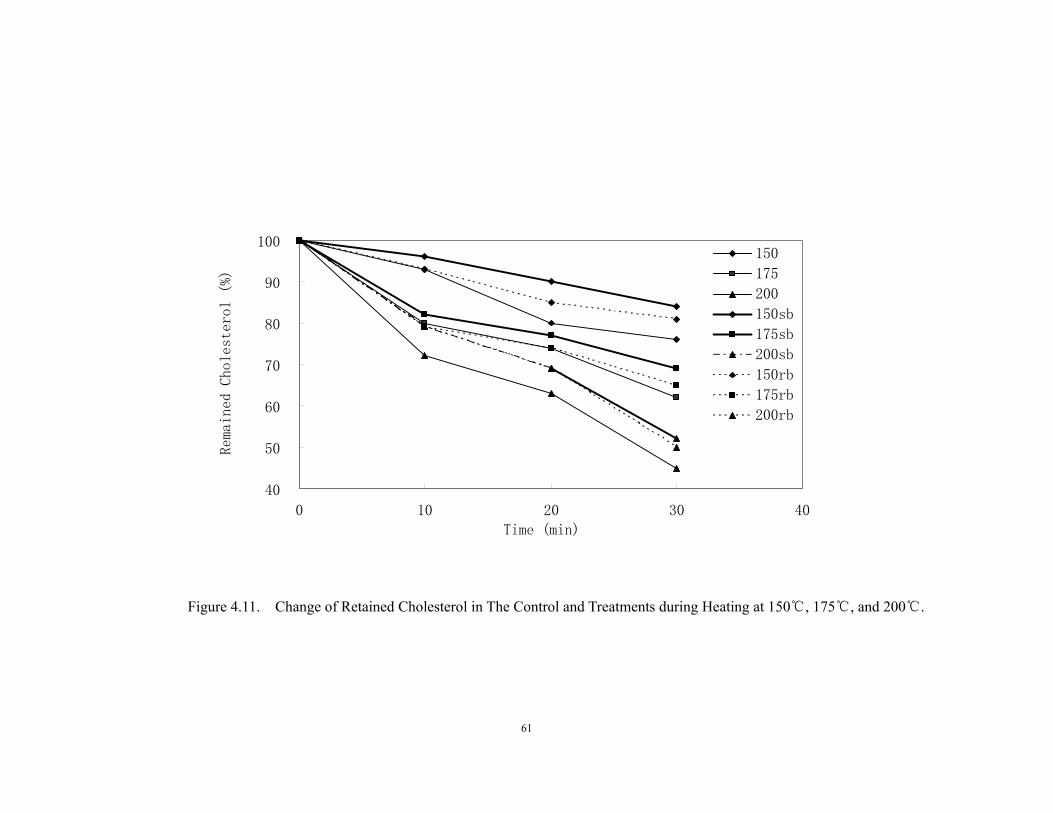
61
40
50
60
70
80
90
100
0 10 20 30 40
Time (min)
Rema
ined
Cho
lest
erol
(%)
150
175
200
150sb
175sb
200sb
150rb
175rb
200rb
Figure 4.11. Change of Retained Cholesterol in The Control and Treatments during Heating at 150℃, 175℃, and 200℃.
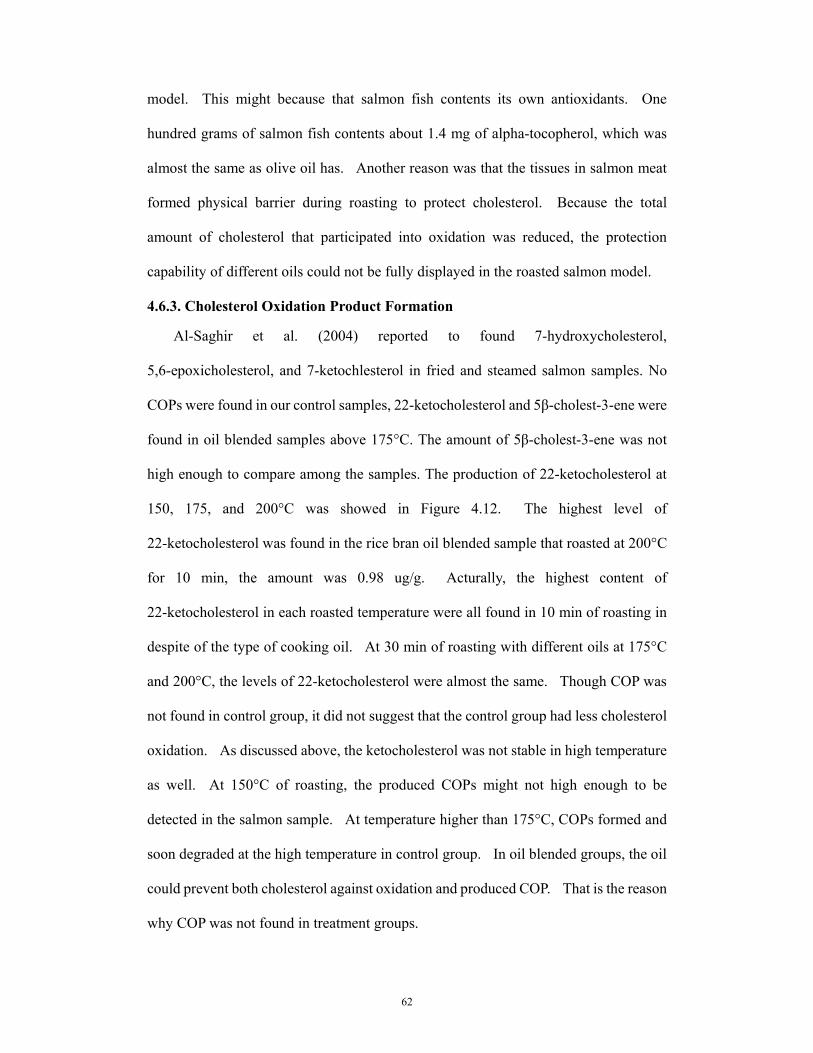
62
model. This might because that salmon fish contents its own antioxidants. One
hundred grams of salmon fish contents about 1.4 mg of alpha-tocopherol, which was
almost the same as olive oil has. Another reason was that the tissues in salmon meat
formed physical barrier during roasting to protect cholesterol. Because the total
amount of cholesterol that participated into oxidation was reduced, the protection
capability of different oils could not be fully displayed in the roasted salmon model.
4.6.3. Cholesterol Oxidation Product Formation
Al-Saghir et al. (2004) reported to found 7-hydroxycholesterol,
5,6-epoxicholesterol, and 7-ketochlesterol in fried and steamed salmon samples. No
COPs were found in our control samples, 22-ketocholesterol and 5β-cholest-3-ene were
found in oil blended samples above 175°C. The amount of 5β-cholest-3-ene was not
high enough to compare among the samples. The production of 22-ketocholesterol at
150, 175, and 200°C was showed in Figure 4.12. The highest level of
22-ketocholesterol was found in the rice bran oil blended sample that roasted at 200°C
for 10 min, the amount was 0.98 ug/g. Acturally, the highest content of
22-ketocholesterol in each roasted temperature were all found in 10 min of roasting in
despite of the type of cooking oil. At 30 min of roasting with different oils at 175°C
and 200°C, the levels of 22-ketocholesterol were almost the same. Though COP was
not found in control group, it did not suggest that the control group had less cholesterol
oxidation. As discussed above, the ketocholesterol was not stable in high temperature
as well. At 150°C of roasting, the produced COPs might not high enough to be
detected in the salmon sample. At temperature higher than 175°C, COPs formed and
soon degraded at the high temperature in control group. In oil blended groups, the oil
could prevent both cholesterol against oxidation and produced COP. That is the reason
why COP was not found in treatment groups.
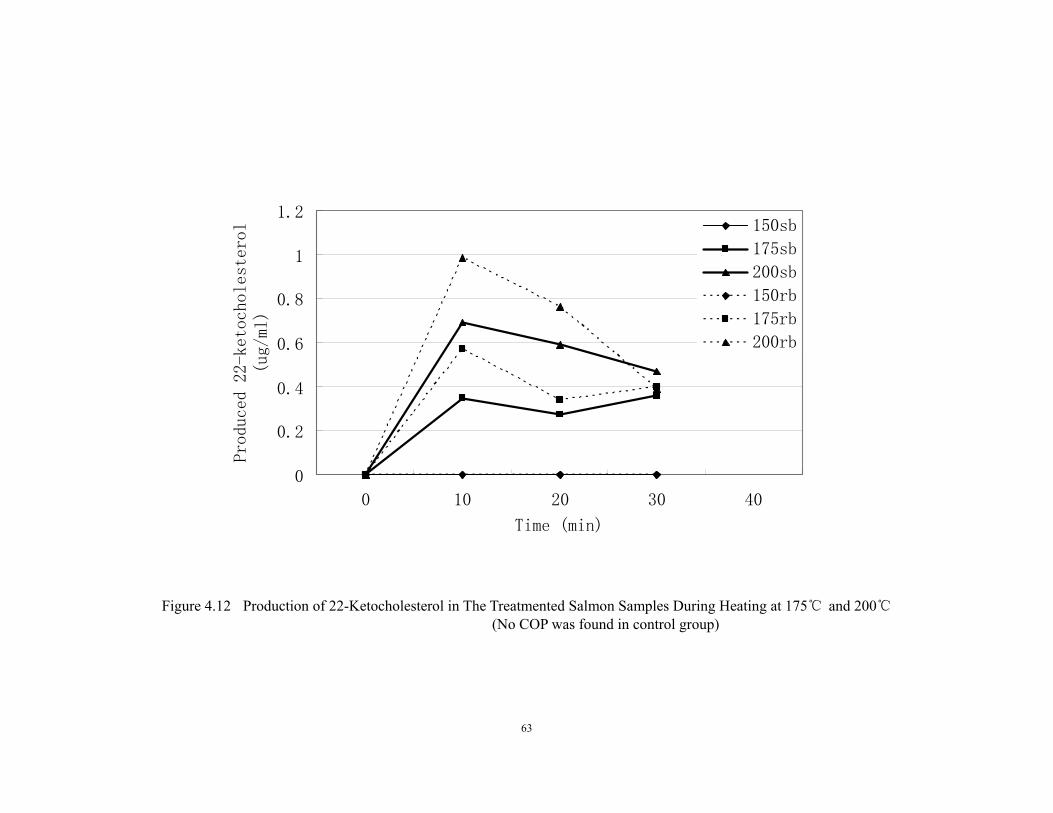
63
0
0.2
0.4
0.6
0.8
1
1.2
0 10 20 30 40
Time (min)
Produced 22-ketocholesterol
(ug/ml)
150sb
175sb
200sb
150rb
175rb
200rb
Figure 4.12 Production of 22-Ketocholesterol in The Treatmented Salmon Samples During Heating at 175℃ and 200℃ (No COP was found in control group)
64
Chapter 5 Conclusions
Some plant source cooking oils could reduce cholesterol loss and prevent
ketocholesterol production during heating in both pure cholesterol oxidation and
salmon fish meat model. In the cholesterol oxidation model, the concentration of
cholesterol decreased with increasing heating temperature and heating time. The level
of 7-ketocholesterol was increased during heating, but decreased after the highest level
was reached at heating temperature above 175°C. It suggested that 7-ketocholesterol
was not stable at high temperature either.
The soybean oil had the highest capacity of preventing cholesterol oxidation, and
rice bran oil had the lowest capability. Soybean oil contained the highest level of alpha
and gamma-tocopherol, which was considered as the major compounds against
cholesterol oxidation among those oils. The lab prepared oils have higher capability
than commercial oil in preventing cholesterol oxidation. About 19-25% more
tocopherols and tocotrienols in the lab prepared oils than those amount in commercial
oils.
Cholesterol oxidation in roasted salmon meat model were not as much as, but
exhibited the same trend as that in cholesterol oxidation model. It suggested that the
protection of meat tissues and the antioxidants in salmon itself could play an important
role in preventing cholesterol oxidation. Ketocholesterol was found only in oil mixed
salmon samples at the roasting temperature higher than 175°C since the oils stabilized
not only the cholesterol but also the COPs. The difference between the protective
capacity of lab soybean and rice bran oil were not significant as in pure cholesterol
oxidation model, because that the cholesterol oxidation in salmon meat were low which
reduced the difference.
65
References Addis, P. B. 1990. Coronary heart disease: An update with emphasis on dietary lipid oxidation products. Nutr. Rev. 62: 7-10. Addis, P. B. and Warner, G. J. 1991. The potential health aspects of lipid oxidation products in food. In “Free Radicals and Food Additives”. Aruoma, O. I. and Halliwell, B. ed. Taylar and Francis Ltd., London, England. pp. 77-119. Al-Saghir, S., Thurner, K., Wagner, K-H., and Frisch, G., 2004. Effects of different cooking procedures on lipid quality and cholesterol oxidation of farmed salmon fish (salmo salar). Journal of Agriculture and Food Chemistry. 52:5290-5296. Amarasinghe, B. M. W. and Gangodavilage, N. C. , 2002. Rice Bran Oil Extraction in Sri Lanka: Data for Process Equipment Design. Food and Bioproducts Processing. 82(C1):174-178 Ansari, G. A. S. and Smith, L. L. 1979. Highperformance liquid chromatography of cholesterol autoxidation products. Journal of Chromatography. 175: 307-315. ASTM D 4959-89, Standard Test Method for Determination of Water (Moisture) Content of Fish by Direct Heating Method Bateman, L., Hughes, H., Morris, A. L. 1953, Hydroperoxide decomposition in relation to the initiation of radical chain reactions. Faraday Soc. 14: 190-199. Bascoul, J., Domergue, M., Olle, M. and Paulet, A.C. 1986. Autoxidation of cholesterol in tallows heated under deep fried condition: Evaluation of oxysterol by GLC and TLCFID. Lipids 21: 383-387. Chen, B.H. and Chen, Y.C., 1994. Evaluation of the analysis of cholesterol oxides by liquid chromatography. Journal of Chromatography 661: 127-136. Chen, Y.C., Chiu, C.P. and Chen, B.H., 1994. Determination of cholesterol oxides in heated lard by liquid chromatography. Food Chem. 50: 53-58. Chien, J.T., Wang, H.C., Chen, B.H., 1998. Kinetic model of the cholesterol oxidation during heating. Journal of American Oil Chemists Society. 46: 2572-2577. Csiky, I. 1982. Trace enrichment and separation of cholesterol oxidation products by adsorption high-performance liquid chromatography. Journal of Chromatography. 661: 381-389. Dionisi, F., Golay, P. A., Aeschlimann, J. M. and Fay, L. B. 1998. Determination of cholesterol oxidation products in milk powders: Methods comparison and validation. Journal of Agricaltural and Food Chemistry 46: 2227-2233. Dorset, D.L. 1992. Binary phase behavior of angiotoxic oxidized cholesterols with cholesterol. Biochim. Biophys. Acta 1127: 293-297.
66
Dougherty, M. E. 1988. Tocopherols as food antioxidants. General Foods World 33: 222-223. Echarte, M.,Zulet, A., and Astiasaran, I., 2001. Oxidation Process Affecting Fatty Acids and Cholesterol in Fried and Roasted Salmon. Journal of Agricultural and Food Chemistry. 49:5662-5667. Erickson, D.R., Pryde, E.H., Brekke, O.L., Mounts, T.L., Falb, R.A. 1980. Handbook of Soy Oil Processing and Utilization. American Soybean Association and the American Oil Chemistís Society. St. Louis, Missouri and Champaign, Illinois. Finocchiaro, T. E., Lee, K. and Richarson, T. 1984. Identification and quantification of cholesterol oxides in grated cheese and bleached butteroil. Journal of American Oil Chemists Society. 61: 877-883. Finocchiaro, T. E. and Richarson, T. 1983. Sterol oxides in food-stuffs: A review. J. Food Prot. 46: 917-925. Fontana, A., Antoniazzi, G., Cimino, G., Mazza, E., Trivellone, E. and Zanone, B. 1992. High-resolution NMR detection of cholesterol oxides in spray-dried egg yolk. Journal of Food Science. 57: 869-872. Fukumoto, L.R., and Mazza, G., 2000. Assessing antioxidant and prooxidant activities of phenolic compounds. Journal of Agriculture and Food Chemistry. 48:3579-3604. Gordon, M. H. and Kourimská, L. 1995. The effects of antioxidants on changes in oil during heating and deep frying. Journal of Science and Food Agriculture. 68: 347-353. Guardiola, F., Codony, R., Rafecas, M., Grau, A., Jordan, A. and Boatella, J. 1997. Oxysterol formation in spray-dried egg processed and stored under various conditions: Prevention and relationship with other quality parameters. Journal of Agricultural and Food Chemistry. 45: 2229-2243. Guardiola, F., Codony, R., Addis, P. B., Rafecas, R. and Boatella, J. 1996. Biological effects of oxysterols: Current status. Food Chem. Toxicol. 34: 193-211. Gunstone, F.D. and Padley, F.B. Lipid Technologies and Applications. Part I. Introduction 2. Major source of lipids. Marcel Dekken Inc, New York, 1997, p.19-51. Gunstone, F.D. and Padley, F.B. Lipid Technologies and Applications. Part II. Processing 6. Refining. Marcel Dekken Inc, New York, 1997, p.137-168. Gupta,H.P., 1989, Rice Bran Offers in Indian Oil Source. Journal of American Oil Chemistís Society. 66: 620-623. Herian, A. M. and Lee, K. 1985. 7α and 7β-hydroxycholesterols formed in a dry egg nog mix exposed to fluorescent light. Journal of Food Science. 50: 267-277.
67
Huber, K. C., Pike, O. A. and Huber, C. S. 1995. Antioxidant inhibition of cholesterol oxidation in a spray-dried food system during accelerated storage. J. Food Sci. 60: 909-912, 916. Hwang, K. T. and Maeker, G. 1993. Quantitation of cholesterol oxidation products in unirradiated and irradiated meats. Journal of American Oil Chemistís Society. 70: 371-375. Hwang, K. T. and Maeker, G. 1993. Quantitation of cholesterol oxidation products in unirradiated and irradiated meats. Journal of American Oil Chemistís Society. 70: 371-375. Imai, H., Werthessen, N. T., Taylor, B. and Lee, K. T. 1976. Angiotoxicity and atherosclerosis due to contaminants of USP-grade cholesterol. Arch. Pathol. Med. 100: 565-572. Kao, Y. M. and Hwang-Sun, L. 1997. Analysis of cholesterol oxidation products in dried squid. Food Science. Taiwan 24: 242-257. Karakaya, S., Tas, A.A., and El, S.N., 2001. Antioxidant activity of some foods containing phenolic compounds. Inter. J. Food Sci. Nurtri. 52:501-508. Kim, S. K., Nawar, W. W. Parameters influencing cholesterol oxidation. Lipids, 1993, 28, 917-922. Kim, S. K. and Nawar, W. W. 1991. Oxidation interactions of cholesterol with triacylglycerols. Journal of American Oil Chemists Society. 68: 931-934. Kou, I. L. and Holmes, R. P. 1985. The analysis of 25-hydroxycholesterol in plasma and cholesterol-containing foods by HPLC. Journal of Chromatography. 330: 339-346. Korytowski, W., Bachowski, G. J. and Girotti, A. W. 1992. Photoperoxidation of cholesterol in homogeneous solution, isolated membranes, and cells: Comparison of the 5α- and 6β-hydroperoxides as indicators of singlet oxygen intermediacy. Photochem. Photobiol. 56: 1-8. Kulig, M. J. and Smith, L. L. 1973. Sterol metabolism. XXV. Cholesterol oxidation by singlet molecular oxygen. Journal of Organic Chemistry. 38: 3639-3642. Kumar, N., and Singhal, O.P., 1991. Cholesterol oxides and Atheroschlerosis: A Review. Journal of Science and Food Agriculture. 55:497-510. Labuza, T. P. 1991. Kinetics of lipid oxidation in foods. CRC Crit. Rev. in Food Tech. 2: 355-405. Li, S. X., Cherian, G., Ahn, D. U., Hardin, R.T. and Sim, J. S. 1996. Storage, heating, and tocopherols affect cholesterol oxides formation in food oils. Journal of Agricultural and Food Chemistry. 44: 3830-3834. Luby, J. M., Gary, J. I., Harte, B. R. and Ryan, T. C., 1986. Photooxidation of cholesterol in butter. Journal of Food Science. 51: 904-907.
68
Maerker, G. Cholesterol autoxidation -- current status. Journal of American Oil Chemists Society, 1987, 64, 388-392. Maerker, G. and Jones, K. C. 1993. A-ring oxidation products from _-irradiation of cholesterol in liposomes. Journal of American Oil Chemists Society. 70: 451-455. Maerker, G. and Bunick, F. J. 1986. Cholesterol oxides II. Measurement of the 5,6-epoxides during cholesterol oxidation in aqueous dispersion. Journal of American Oil Chemists Society. 63: 771-777. Maerker, G. and Unruh, J. Jr. 1986. Cholesterol oxides I. Isolation and determination of some cholesterol oxidation products. Journal of American Oil Chemists Society. 63: 767-771. Missler, S. R., Wasilchuk, B. A. and Merit, C.1985. Seperation and identification of cholesterol oxidation products in dried egg preparations. Journal of Food Science. 50: 595-598, 646. Madhavi, D. L., Singhal, R. S. and Kulkarni, P. R. 1995. Technological aspects of food antioxidants. In “Food Antioxidants: Technological, Toxicological and Health Perspectives”. Madhavi, D. L., Deshpande, S. S. and Salunkhe, D. K. ed. Dekker, New York, U.S.A. Morin, R. J., Hu, B., Peng, S. K. and Sevanian, A. 1991. Cholesterol oxides and carcinogenesis. J. Clin. Lab. Anal. 5: 219-225. Nawar, W. W. 1996. Lipids. In “Food Chemistry”. 3rd ed. pp. 225-320. Fennema, O. R. ed. Marcel Dekker, New York, U.S.A. Nawar, W. W., Kim, S. K. 1991. Oxidative interaction of cholesterol with triacylglycerols. Journal of American Oil Chemists Society. 86: 931-934. Nielson, J. H., Olsen, C. E. and Skibsted, L. H. 1996. Cholesterol oxidation in a heterogeneous system initiated by water-soluble radicals. Food Chemistry. 56: 33-37. Nielson, J. H., Olsen, C. E., Skibsted, L.H. 1996, Cholesterol oxides II. Measurement of the 5,6-epoxides during cholesterol oxidation in aqueous dispersion. Food Chemistry. 56:33-37. Norris, F.A., Deodorization. Bailey’s industrial oil and fat products. Vol. 3 (Applewhite, T.H. Ed.), Wiley, New York, 1985, p.127. Nourooz-Zadeh, J. and Appelqvist, L.-A. 1988. Cholesterol oxides in Swedish foods and ingredients: Milk powder products. Journal of Food Science. 53: 74-79. Nourooz-Zadeh, J. 1990. Determination of autoxidation products from free or total cholesterol: A new multistep enrichment methodology including the enzymatic release of esterified cholesterol. Journal of Agricultural and Food Chemistry. 38:1667-1673. Ohshima, T., Li, N. and Koizumi, C. 1993. Oxidative decomposition of cholesterol in fish products. Journal of American Oil Chemists Society. 70: 595-600.
69
Osada, K., Kodama, T., Cui, L., Yamada, K. and Sugano, M. 1993. Levels and formation of oxidized choleaterols in processed foods. Journal of Agricultural and Food Chemistry. 41: 1893-1898. Osada, K., Kodama, T., Yamada, K. and Sugano, M., 1994. Lymphatic absorption of oxidaized cholesterol in rats. Lipids, 29:555-559. Park, S. W., Addis, P. B. 1986. Identification and quantitative estimation of oxidized cholesterol derivatives in heated tallow. Journal of American Oil Chemists Society. 34: 653-659. Park, S. W. and Addis, P. B. 1992. Methods of analysis of cholesterol oxides. Biological Effects of Cholesterol Oxides. Peng, S. K. and Morin, J.R. ed. CRC Press: Boca Raton, FL., U.S.A. pp. 33-70. Park, S. W. and Addis, P. B. 1986. Further investigation of oxidized cholesterol derivatives in heated fats. Journal of Food Science. 51: 1380-1381 Paniangvait, P., King, A. J., Jones, A. D. and German, B. G. 1995. Cholesterol oxides in foods of animal origin. Journal of Food Science. 60: 1159-1174. Peng, S. K., Taylor, C. B., Tham, P., Werthessen, N. T. and Mikkelson, B. 1979. Cytotoxicity of oxidation derivatives of cholesterol on cultured aortic smooth muscle cells and their effect on cholesterol biosynthesis. Am. J. Clin. Nutr. 32: 1033-1042. Penazzi, G., Caboni, M. F., Zunin, P., Evangelisti, F., Tiscornia, E., Gallina Toschi, T. and Lercker, G. 1995. Routine high-performance chromatographic determination of free 7-ketocholesterol in some foods by two different analytical methods. Journal of American Oil Chemists Society. 72: 1523-1527. Petron, M.J., Garcia-Regueiro, J.A., Martin, L., Muriel, E., and Antequera, T., 2003. Identification and quantification of cholesterol and cholesterol oxidation products in different types of Iberian Hams. Journal of Agricultural and Food Chemistry. 51: 5786-5791. Pie, J. E., Spahis, K. and Seillan, C. 1990. Evaluation of oxidative degradation of cholesterol in food and food ingredients: Identification and quantification of cholesterol oxides. Journal of Agricultural and Food Chemistry. 38: 973-979. Rankin, S. A. and Pike, O. A. 1993. Cholesterol autoxidation inhibition varies among several natural antioxidants in an aqueous model system. Journal of Food Science. 58: 653-655. Restek Corp. Restek GC column selection guide Rose-Sallin, C., Hugget, A. C., Bosset, J. O., Tabacchi, R. and Fay, L. B. 1995. Quantification of cholesterol oxidation products in milk powders using [2H7]cholesterol to monitor cholesterol autoxidation artifacts. Journal of Agricultural and Food Chemistry. 43: 935-941.
70
Sander, B.D., Smith, D.E., Addis, P.B. and Park, S.W., 1989. Effects of prolonged and adverse storage conditions on levels of cholesterol oxidation products in dairy products. Journal of Food Science 54: 874-879. Sanhueza, V.J., Nieto, S., 2002. Effect of synthetic antioxidants on cholesterol stability during the thermal-induced oxidation of a polyunsaturated vegetable oil. Journal of American Oil Chemists Society. 79:325-328. Saunders R.M., 1986, Rice Bran Composition and Potential Food Uses, Food Reviews International, 1:465-495. Sevanian, A. and Peterson, A. R. 1986. The cytotoxic and mutagenic properties of cholesterol oxidation products. Food Chem. Toxicol. 24: 1103-1110. Schmarr, H.-G., Gross, H. B. and Shibamoto, T. 1996. Analysis of polar cholesterol oxidation products: Evaluation of a new method involving transesterification, solid phase extraction, and gas chromatography. Journal of Agricultural and Food Chemistry. 44: 512-517. Smith L. L. 1992. The oxidation of cholesterol. In “Biological Effects of Cholesterol Oxides”. pp. 7-31. Peng, S. K. and Morin, J. R. ed. CRC Press: Boca Raton, FL., U.S.A. Smith, L. L. Cholesterol autoxidation; Plenum Press: New York, 1981. Smith, L. L. 1987. Cholesterol autoxidation 1981-1986. Chemical Physical Lipids 44: 87-125. Supelco, 1999, Bulletin 875-C Supelco Capillary GC Columns. p. 1-30. Teng, J. I.; Kulig, M. J., Smith, L. L., Kan, G., Lier, J. E. V. Sterol metabolism. XX. Cholesterol-degradation products. Journal of Food Science, 1988, 53, 1913-1918. Teng, J. I., Kulig, M. J., Smith, L. L., Kan, G. and Lier, J. E. V. 1973. Sterol metabolism. XX. Cholesterol 7β-hydroperoxide. Journal of Organic Chemistry. 38: 119-123. Teng, J. I. 1991. Column variation in the analysis of ocysterols using normal-phase high performance liquid chromatography. LC-GC 9: 214-219. Tsai, L. S. and Hudson, C. A. 1981. High performance liquid chromatography of oxygenated cholesterols and related compounds. Journal of American Oil Chemists Society. 58: 931-934. Tsai, L.-S. and Hudson, C. A. 1984. Cholesterol oxides in commercial dry egg products isolation and identification. Journal of Food Science. 49:1245-1248. VWR International, GC-column selection guide. Yan, P. S. and White, P. J., 1990. Cholesterol oxidation in heated lard enriched with two levels of cholesterol. Journal of American Oil Chemists Society. 67: 927-931.
71
Yoshida Y, Niki E., 2003. Antioxidant effects of phytosterol and its components. J Nutr Sci Vitaminol (Tokyo). 49(4):277-280. Zhang, W.B., Addis, P.B. and Krick, T.P. 1991. Quantification of 5α-cholestane-3β, 5,6β-triol and other cholesterol oxidation products in fast food French fried potatoes. Journal of Food Science. 56: 716-718. Zubillaga, M. P. and Maerker, G. 1991. Quantitation of three cholesterol oxidation products in raw meat and chicken. Journal of Food Science. 56: 1194-1196.
72
Vita
Ting Zhang was born in Dalian, China, on September, 1977. In the year 1996,
she attended the School of Material Science and Technology, Beijing University of
Chemical Technology, and pursued a number of interests both within and without the
university curriculum. These interests eventually led her to make a decision to study
aboard in the United States. In the year of 2003, she got her master’s degree in textile
science in the School of Human Ecology at Louisiana State University. She began
her master’s degree in the Department of Food Science at Louisiana State University
in the same year.