ci - eric - education resources information center for the series are abas gozan, reta hendrati...
TRANSCRIPT

DOCUMENT RESUME
ED 356 547 EA 024 806
TITLE Sector Review: Workshops I and II. Pengian kebijakan,Subsektor Pendidikan, SD dan SMP. East Java Province,West Java Province, South Sulawes Province.Educational Policy and Planning Project.
INSTITUTION Florida State Univ., Tallahassee. Learning SystemsInst.; Improving the Efficiency of EducationalSystems Consortium.
SPONS AGENCY Agency for International Development (IDCA),Washington, DC.; Ministry of Education and Culture(Indonesia).
PUB DATE [88]
NOTE 72p.PUB TYPE Guides Non-Classroom Use (055)
EDRS PRICE MF01/PC03 Plus Postage.DESCRIPTORS Educational Development; Elementary Secondary
Education; *Evaluation Methods; Foreign Countries;*Measures (Individuals); *Personnel Data; *PersonnelEvaluation; Research Methodology; Workshops
IDENTIFIERS *Indonesia
ABSTRACT
This publication contains the first two of threetraining workshop manuals designed to be used in conducting an updateof the Indonesian Education and Human Resources Sector Assessment.Workshop I covers the basic concepts, skills, and methods needed todesign subsector updates and develop a draft plan for updateactivities. Workshops II and III test, evaluate, and revise skillsand products with a special emphasis on improving draft reports. Inthe Workshop I manual, a framework is provided to identify theinformation and analyses required for the assessment update. Themanual also provides information on basic concepts ..nd definitions,the education-production function, indicators of equity andefficiency, quantitative data methods, components of subsectordescriptions, interview methods, cost analysis, unit and cycle costcalculations, and postworkshop assignments. The Workshop II manualfocuses on the use of concepts and skills in sector work. There aretwo major objectives: (1) review, discus, and finalize the Nationaland provincial contexts for the review of primary and secondaryschooling, and describe the status of their subsectors, as well asneeds, plans, and constraints; and (2) analyze the issues related toequity, internal efficiency, external efficiency, administration andsupervision, and the costs and financing of primary and juniorsecondary schooling in each province. (JPT)
***** ** * ********** *** ***********,cIReproductions supplied by EDRS are the best that can be made
from the original document.***********************************************************************

EDUCA'TIONAL POLICY AND
PLANNING PROJECTA GOVERNMENT OF INDONESIA - USAID PROJECT
Sector ReviewWorkshops I and IIPengian KebflSubsektor PendidikanSD dan SMPEast Java Province
West Java Province
South Sulawesi Province
Pusat Informatika
Balitbang Dikbud
DEPARTMEN PENDIDIKAN
DAN KEBUDAYAAN
L "
U S DEPARTMENT OF EDUCATIONqtly e of Educahonal Research and ImprovementIDUCATIC)NAL RESOURCES INFORMATION
CENTER (ERIC)VT'Ots document nas been reproduced as
,Itrorn the person or organtzatt, n
Moor changes have been made to trnprovereproduction dualdy
Prents 01 new or op,00ns slated mu-us dOcu.rnent Do not necessardy represent ott.ctatOF RI POS.IrOo Or policy
Center for Informatics
Office of Educational and Cultural Research and Development
MINISTRY OF EDUCATION
AND CULTURE
Jakarta, Indonesia
4.
"PERMISSION TO REPRODUCE THISMATERIAL HAS BEEN GRANTED BY
TO THE EDUCATIONAL RESOURCESINFORMAT!ON CENTER IEPICI

PREFACE
The Educational Policy and Planning (EPP) Project is a seven year project conductedjointly by the Indonesia Ministry of Education (MOEC) and the United States Agencyfor International Development (USAID). The overall project objective is to improve thequality of education in Indonesia by assisting the MOEC, through the Office ofEducational and Cultural Research and Development (Balitbang Dikbud), to formulatebetter policies and long-term plans. The project aims to improve policy formulation andlong-term planning by improving the timeliness, relevance and accuracy of educationaldata collection, the subsequent analyses of such data, and their ultimate use for policy anddecisionmaking.
There are three major components of the EPP Project: (1) development of anintegrated management informations system (MIS) within the MOEC, (2) enhancementof MOEC policy research and analysis capacity, and (3) support for MOEC institutionaldevelopment at the national and provincial level through training and technical assis-tance. EPP technical advisory staff work closely with counterpart Indonesian staff as partof a collaborative process of developing institutional capacity.
Dr. BoedionoHead, Center for Informatics
Office of Educational and Cultural Research and DevelopmentDepartment of Education and Culture
Republic of Indonesia
The EPP Project in collaboration with the USAID Improving the Efficiency ofEducational Systems (ZEES) Project, publishes EPP documents in order to disseminatethis knowledge and extend its usefulness. EPP has carried out a series of policy studiesdesigned to provide answers to key questions facing Indonesian educators. Theseinclude:
The Quality of Basic EducationThe Quality and Efficiency of Vocational/Technical EducationThe Strengthening of Local Education CapacityDeveloping Indicators of Educational EfficiencyTeacher Education IssuesCurriculum Reform and Textbook ProductionEducation, Economic, and Social Development
This series has been planned under the direction of Moegiadi, Balitbang Dikbud, andBoediono, Center for Informatics, Balitbang Dikbud and Simon Ju, EPP Chief of Party.
Editors for the series are Abas Gozan, Reta Hendrati Dewi, Center for Informatics,and Jerry Messec, IEES, Florida State University.

Table of Contents
Workshop I 1
Workshop II 37

Balitbang Dikbud Coordinators
Wesley SimanjuntakSiti Sofiah
East JavaMuryantoBartoZainal ArifinRetno Laksmaningsih
S. SulawesiA. Qadir GassitigLa NafieMax J. Pa lloUmar Tirtarahara
West JavaAgus SuriamiharjaDana ReTati Iriani
Central MinistryHaryanto GuyubDjoko PurnomoSiswantariAbdul Manan AkhamdEry KusumaRusliansyah AnwarRetno W. Wibowo S.Agus Salim
Participants
Bagren Kanwil DepdikbudPus lit IKIP SurabayaBagren Kanwil DepdikbudFakultas Kedokteran Gigi
Balai Penelitian LAINFISIPOL UNHAS, KampusKanwil DepdikbudProgram Diploma IKIP UPG
FPBS IKIP BandungSubag PRP Baren KanwilKasis Pengembang Wilayah, Bappeda DT I
Bagren Ditjen DikdasmenBiro PerencanaanPusat PenelitianPusat PenelitianPusat Pengujjian, Balitbang DikbudBagian Perecanaan, Balitbang DikbudPusat InfcrmatikaPusat Informatika

Sector ReviewWorkshop I
Pengian KebijakanSubsektor PendidikanSD dan SMPEast Java Province
West Java Province
South Sulawesi Province
Introduction
Workshop Design
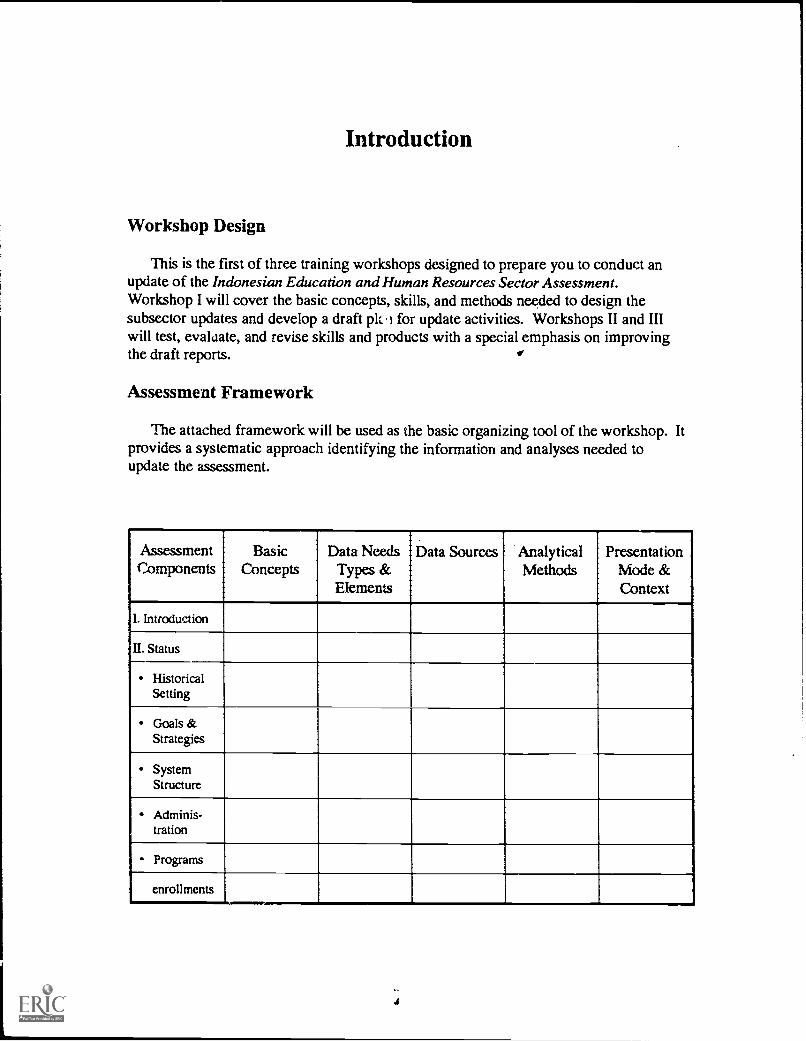
This is the first of three training workshops designed to prepare you to conduct anupdate of the Indonesian Education and Human Resources Sector Assessment.Workshop I will cover the basic concepts, skills, and methods needed to design thesubsector updates and develop a draft plz. i for update activities. Workshops II and IIIwill test, evaluate, and revise skills and products with a special emphasis on improvingthe draft reports.
Assessment Framework
The attached framework will be used as the basic organizing tool of the workshop. Itprovides a systematic approach identifying the information and analyses needed toupdate the assessment.
AssessmentComponents
BasicConcepts
Data NeedsTypes &Elements
Data Sources AnalyticalMethods
PresentationMode &Context
I. Introduction
II. Status
HistoricalSetting
Goals &Strategies
SystemStructure
Adminis-tration
- Programs
enrollments
4

AssessmentComponents
BasicConcepts
Data NeedsTypes &Elements
Data Sources AnalyticalMethods
PresentationMode &Context
staff
curricularmaterials
failities &equipment
evaluation &supervision
costs &financing
DI. Analysis
Needs
Plans
Constraints
IV. Issues
ExternalEfficiency
InternalEfficiency
Access &Equity
sex, ethicity,region
Administraticn&Supervision
Costs &Financing
unit costs
cycle costs

Workshop Activity Schedule
14 January
8:00 am Opening Remarks: Professor Dr. Moegiadi & Dr. LynchIntroduction to Workshop: Drs. Kemmerer & Cresswell
10:00 Break/ refreshments
10:30 Introduction
12:00 Lunch
2:00 pm Basic Concepts & Definitions
5:00 Supper
7:00 Assessment of Participant's Strengths and Weaknesses
15 January
8:00 am Introduction of the Education Production Function
10:00 Break
10:30 Continue Discussion of the Education Production Function
12:00 Lunch
2:00 pm Participant Exercise: Indicators
5:00 Supper
7:00 Participant Report & Discussion
16 January
8:00 am Components of Subsector Description
10:00 Break
10:30 Continue Discussion of Components
12:00 Lunch
2:00 pm Participant Exercise: Data Needs
5:00 Supper
7:00 Participant Report and Discussion
*1

Workshop Activity Schedule
17 January
8:00 am Identification and Documentation of Subsector Issues; Examinationof Quantitative Data
10:00 Break
10:30 Continue Discussion of Quantitative Data Methodology
12:00 Lunch
2:00 Participant Exercise
5:00 Supper
7:00 Participant Reports and Discussion
18 January
8:00 am Enrollment Projection Methods
10:00 am Break
10:30 Progression, Repetition, and Dropout Rates: Assumptions Methods
12:00 Break for the Weekend
21 January
8:00 am Qualitative Data: Interview Methods
10:00 Break
10:30 Continuation of Interview Methods
12:00 Lunch
2:00 pm Practice Interview Techniques; Plan Interviews in Jakarta
5:00 Supper
7:00 Planning Techniques: Dr. Boediono
22 January
8:00 am Cost Analysis: Concepts and Methods
10:00 Break 1ilr
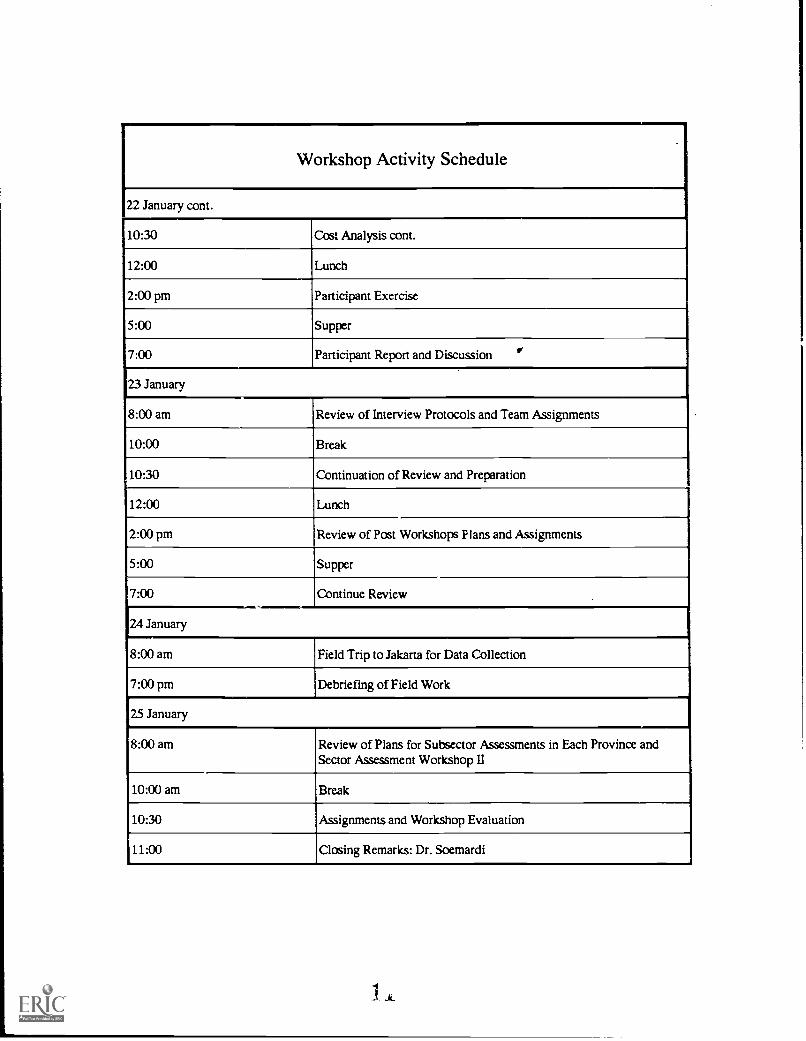
Workshop Activity Schedule
22 January cont.
10:30 Cost Analysis cont.
12:00 Lunch
2:00 pm Participant Exercise
5:00 Supper
7:00 Participant Report and Discussion ir
23 January
8:00 am Review of Interview Protocols and Team Assignments
10:00 Break
10:30 Continuation of Review and Preparation
12:00 Lunch
2:00 pm Review of Post Workshops Plans and Assignments
5:00 Supper
7:00 Continue Review
24 January
8:00 am Field Trip to Jakarta for Data Collection
7:00 pm Debriefing of Field Work
25 January
8:00 am Review of Plans for Subsector Assessments in Each Province andSector Assessment Workshop Il
10:00 am Break
10:30 Assignments and Workshop Evaluation
11:00 Closing Remarks: Dr. Soemardi

Basic Concepts and Definitions
Sector Assessments
Sector Assessments, as the name implies, are a form of evaluation. Such assessmentsare designed to evaluate a sector (e.g., education) or a subsector's (e.g., primary school)performance in terms of system goals (not the researchers goals). In almost all countriestwo standards are used to evaluate public investments: efficiency and equity.
Efficiency
Efficiency refers to the least cost means of producing a given end or the mostproductive use in terms of goal attainment of a given amount of resources. Two types ofefficiency analysis are useful in assessing educational systems. They are internal andexternal efficiency analysis.
Internal Efficiency analysis addresses the relationship between the resources (inputs)invested in an activity and the immediate or shorter term objectives (outputs) of thatactivity.
Typical internal efficiency issues in education include: the quality and quality ofresources invested given specific goals, the processes used to transform inputs intooutputs, and the reliability and validity of input, process, and output measures.
External Efficiency analysis addresses the relationship between the resources(inputs) invested in an activity and the longer term objectives (outcomes) of that activity.
Typical external efficiency issues in education include the relationship between theknowledge and skills produced at one level of the system and those required for successat either the next level of schooling or on-the-job. Other :;;sues relate to the ability ofeducational systems to affect the longer term personal values, attitudes, and behaviorsdesired by society and as evidenced in good citizenship, good parenting, and productivityin the workplace.
Efficiency and Effectiveness.
The concept of effectiveness is subsumed under the concept of efficiency.Effectiveness refers to goal attainment without reference to the costs involved. Thebroader concept of efficiency adds the dimension of cost to the evaluation of goalattainment. If two schools are equally effective, the school which has used fewerresources to meet the proscribed goals is more efficient.

Equity
Equity simply means fairness. Equity standards, therefore, reflect societal consensusat a given point in time about what constitutes a fair allocation of resources. In terms ofeducation this may be summarized as who pays, who benefits, and why. Equity analysis,therefore, may focus on either the collection of resources for schooling (who pays) or thedistribution of resources for schooling. Typical equity issues include those related toaccess to schooling of different groups (ethnic minorities, women, handicappedindividuals, etc.) and the supply of teachers and other government resources to individualschools. Equity issues can be further distinguished on the basis of whether they are casesof horizontal or vertical equity.
Horizontal equity refers to the treatment of individuals whdare considered to besimilar in terms of certain relevant characteristics. Whether or not primary students ofaverage ability in Jakarta and Sulawesi have the opportunity to learn the same curriculumis a horizontal equity issue.
Vertical equity refers to the treatment of individuals who are considered to bedissimilar in terms of certain characteristics. Whether remote rural or handicappedstudents should be provided with greater resources for learning is a vertical equity issue.

The Education Production Function
The Education Production Function is simply a mathematical formula that describesthe relationship between desired outputs or outcomes and inputs. Here we are interestednot so much in the mathematics but in modeling the relationships in the production ofeducation. The basic model is shown on the next few pages.
The model outlined in the two figures suggests that the long-term goals of theeducational system (success at the next level of schooling or on the job, good citizens,and good parents are related to the shorter-term system outputs (education outputs(enhanced cognitive, social, and physical skills). The ability ot the system to produce thedesired outputs is, in turn, a function of the quality and quantity of the inputs and theprocesses used to transform those inputs into outputs.
Inputs
Educational inputs consist of all the school, classroom, community, and homeresources invested in the production of learning and other objectives of schooling.
School resources consist of the quality and quantity of resources available in theschool. Indicators of the quality and quantity of school resources include such things asthe characteristics of the:
personnel (administrators, teachers, students, etc.)curriculumfacilitiestextbooks, materials, and equipmentetc.
Classroom resources consist of the the quality and quantity of resources assigned to aparticular class. Indicators of the quality and quantity of classroom resources includesuch things as the characteristics of:
teacherstudentsspacetextbooks, materials, and equipmentetc.

The
Edu
catio
n Pr
oduc
tion
Func
tion
Inpu
ts(
Proc
esse
sO
utpu
tsO
utco
mes

The
Edu
catio
n P
rodu
ctio
nF
unct
ion
Inpu
ts
Scho
ol R
esou
rces
Cla
ssro
om r
esou
rces
Com
mun
ity r
esou
rces
Hom
e re
sour
ces
1 'I
Proc
esse
s
Scho
ol o
rgan
izat
ion
Cla
ssro
om m
etho
dolo
gies
Hom
e/ c
omm
unity
orga
niza
tion
Out
puts
Gai
n in
cog
nitiv
e sk
ills
Gai
n in
soc
ial s
kills
Gai
n in
phy
sica
l dex
erity
Out
com
es
Succ
ess
at th
e ne
xt le
vel
of s
choo
ling
or o
n th
e jo
b
Goo
d ci
tizen
s
Goo
d pa
rent
s

Community resources consist of the quality and quantity of learning related resourcesavailable in the community. Indicators of the quality and quantity of communityresources include such things as the characteristics of:
librarycommunity centertutorial servicesetc.
Home resources consist of the quality and quantity of learning related resourcesavailable in the home. Indicators of the quality and quantity of family resources includesuch things as the characteristics of:
parentsparental time spent with childrenbookscomputersfacilities for studyetc.
Processes
The processes by which inputs are transformed into the desired outputs can also bedivided into those that take place in the school, classroom, community, and home. Inschools, teacher and students with particular characteristics (ability, age, etc.) are sortedinto classrooms of a specific size. The way they are sorted affects the methodologiesteachers are able to use. For example, if a classroom was built for 20 students but isassigned to a class of 40 students, the teacher cannot divide the students into smallgroups. Similarly, if students of like ability are grouped together, the possibility does notexist of organizing the class so that the quicker students help the slower students.
School processes consist of the way resources are combined at the school buildinglevel to support student learning. Indicators of the quality of school processes include:
Organization of students acid teachers into classesOrganization of extracurricular activitiesOrganizatirm of in-school study time, etc.

Classroom processes consist of the way the teacher combines resources (includingher own time) to produce student learning. Indicators of the quality and quantity ofquality of classroom processes include such things as:
Type of methodologyRecitationSmall group workSeatworkHomeworkProportion of time spent on instructionStudent time-on-tasketc.
Community & Home Processes consist of the way resources are combined at thecommunity and household levels to support student learning. Indicators include suchthings as:
The way parents spend time with childrenThe format of community programsetc.
Outputs
While it is assumed that schools, communities, and families desire the same outputs,such is not always the case. Where all prioritize outputs in the same way (e.g. allemphasize gains in student learning, all resources can be said to supplement thoseprovided by the school. Some parents, however, may use their resources to complementwhat is done in the school e.g., they may wish to emphasize religious learning. Thiswould lead them to spend their resources on religion lessons. Other parents may wish touse their resources to encourage students to pursue goals other than those related tolearning, e.g. take care of younger siblings or work in the fields, etc. In such cases, theymay use their resources to compete with the school. Understanding whether parental andcommunity resources are supplementary, complementary, or competitive to thoseprovided in school is important to understanding the particular mix of outputs producedby any one school. Indicators of outputs include such things: progression, repetition, andgraduation rates and student achievement.
4- -

Outcomes
The longer-term outcomes of schooling depend, as do the shorter-term outputs onwhat the actual goals of the school, community, parents, and the student were, as well ason the inputs and processes. Indicators of outcomes include success in higher levels ofschooling, success on-the-job, etc.

Participant Exercise: Indicators of Equity and Efficiency
The purpose of this exercise is to practice the concepts and skills needed tounderstand, review, and develop indicators of efficiency and equity as part of sectorassessment work. The concepts involved in this exercise include:
internal efficiencyequitygoalsinputsoutputsaggregation of datadisaggregation of data
1. Examine Table 48 in Statistic Persekolahn, 1988/89. Prepare a brief writtenstatement of whether or not the ratio in Table 48 is a good indicator of resourceinputs and why or why not.
2. Does the data in Table 48 indicate equity problems? If so, what are they?
3. Prepare a rough draft of a chart which would show whether or not there are equityproblems indicated in Table 48.
4. Describe how the ratios in Table 48 could have been aggregated from other tables inStatistic Persekolahn, 1988/89. Identify the tables (by number and page) contsiningdisaggregated components of Table 48.
5. Prepare a table which shows whether or not a disaggregated examination ofpupil/teacher ratios reveals the same patterns as the aggregated ones.
6. Briefly describe the assumptions which appear to have been used in computing theratios in Table 48. Are these good assumptions.
9

Participant Exercise: Quantitative Data Methods
This exercise uses three tables from the Education and Human Resources SectorAssessment: Yemen Arab Republic (1986). Copies of the tables are available.
Table 4.3 presents data on student characteristics and enrollments. What does thetable tell you about the participation of boys and girls in primary schools?
Do Tacks 4.4 and 4.5 improve the picture of the opportunities for boys and girlsshown in Table 4.3.
Using all three tables, prepare a presentation on the different participation rates ofboys and girls in primary schools in Yemen. Do these participation rates suggest anequity problem?
What other data would you like to review before making recommendations aboutimproving participation rates in primary education?

TAOLE 1.3
PRIMARY SCHOOL EMPOLLMENTS.W GOVERNORATE
1902/13
Gov=auJNATE/
SCA or STUDEHT
GRADE LEVEL
TOTAL
ONE
TWO
THREE
FOUR
FIVE
SIX
Sinai - Male
Female
Tale
- Male
raalie
Hodeldah-Male
rowel.
Ibb
- male
noels
Dhamat - Meta
Female
Ilajjah - Male
Female
Beulah - Hale
1ee110
Wade - Hale
Female
Mahweet.- male
Female
Ma'clb - Male
Female
Al -Jaw]- male
female
TOTAL
- Hal.
37610
Sill
16114
10017
15680
3316
26764
5147
16007
1411
1720
794
5076
III
1591
165
3031
543
1761
116
66781
146,826
11,241
30111
64311
32154
6841
13325
-2430
22)21
3553
11175
1083
1)61
531
3670
680
2731
144
3196
314
811 52
511SL
122,230
22,225
24548
4634
21683
5104
5156
1663
17687
1910
11493
740
6004
265
1520
113
2119
94
3964
213
841
SO
621 58
100,114
15,214
17115
2574
18265
3153
5711
1117
11287
579
5185
255
1331
121
2701
194
1615 64
2664
103
765 11
550
20
70,423
8,611
11152
1724
14715
2346
3104
116
6211
122
2975 95
111164
1342 14
104 11
1230 42
410 1
174 1
44,987
5,626
A
7010
1411
11707
1822
1706
561
1618
272
171156
11727
897 71
419 1
625 27
351 3
33
30,242
4,287
128,511
25,321
115,4)1
29,603
50,209
1,109
811,447
12,114
48,554
1,721
30,161
1,811
17,206
2,520
12,257
465
16,111
1,242
5,097
270
2,64)
211
514.924
67.201
Sources
Hintst-y of Wfieation. Edueatilmal Statistics, 1B84.
9 .tI
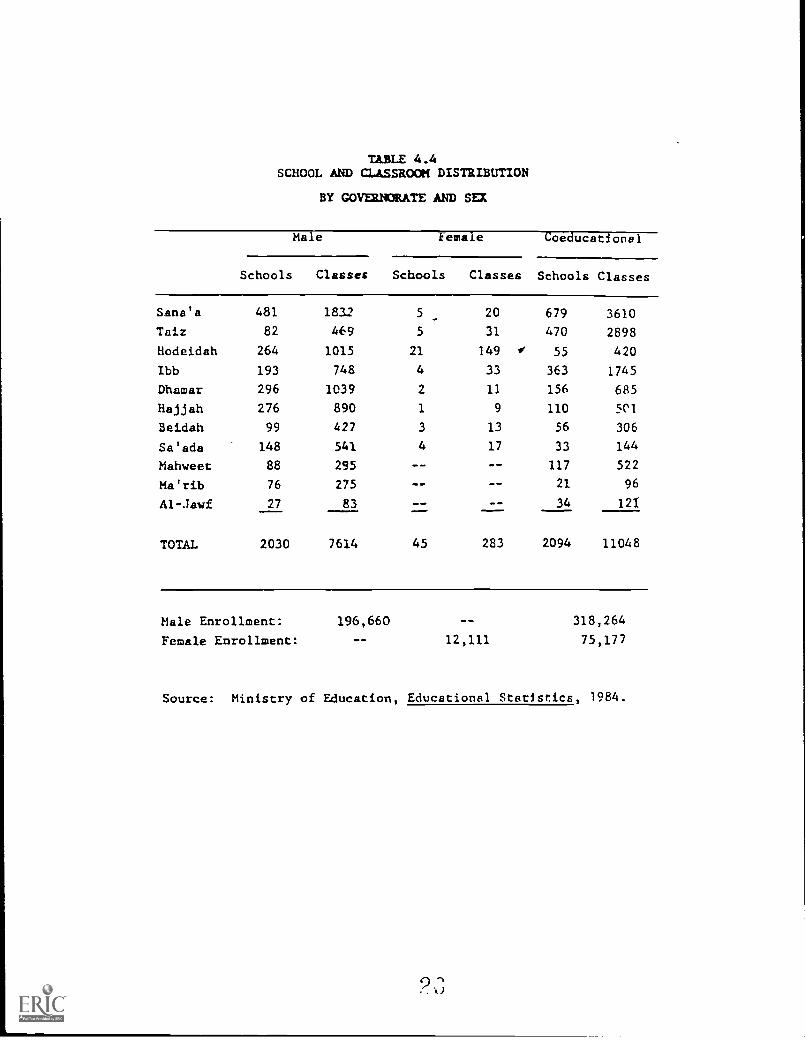
TABLE 4.4SCHOOL AND CLASSROOM DISTRIBUTION
BY GOVERNORATE AND SEX
Ma e ema e oe ucatlonal
Schools Classes Schools Classes Schools Classes
Sana'a 481 1832 5 20 679 3610
Taiz 82 469 5 31 470 2898
Hodeidah 264 1015 21 149 0 55 420
Ibb 193 748 4 33 363 1745
Dhamar 296 1039 2 11 156 685
Hajjah 276 890 1 9 110 501
Beidah 99 427 3 13 56 306
Salads 148 541 4 17 33 144
Mahweet 88 295 117 522
Ma'rib 76 275 %Ow 10 4. 21 96
Al-Jawf 27 83 34 121
TOTAL 2030 7614 45 283 2094 11048
Male Enrollment:
Female Enrollment:
196,660 318,264
75,177
Source: Ministry of Education, Educational Statistics, 1984.

TABLE 4.5
COMPLETE AND INCOMPLETE PRIMARY SCHOOLS,
1982/83
BY TYPE AND HIGHEST GRADE OFFERED
Schools, by
Highest Crede
Presently Offered
TYPE OF SCHOOL
First
Grade
Second
Grade
Third
Grade
Fourth
Grade
Fifth
Grade
Sixth (Complete
Grade
School)
Boys' Schools:
Number
183
281
434
338
336
358
Enrollment
11707
19232
31772
34231
30965
68753
% of Total Enrollment
6.0%
9.8
16.2
17.4
15.7
35.0
Girls' Schools:
Number
77
52
321
Enrollment
410
500
390
86
573
10152
% of Total Enrollment
3.4%
4.1
3.2
0.7
4.7
83.8
Coeducational Schools:
44.
Number
51
131
296
383
377
856
Enrollment
3400
10798
29173
41968
47052
26105('
% of Total Enrollment
0.9%
2.7
7.4
10.7
12.0
66.4
All Schools:
Number
241
419
735
723
716
1235
Enrollment
15517
30530
61335
76285
78590
339955
% of Total Enrollment
2.6%
5.1
1('.2
12.7
13.1
56.5
Source:
Ministry of Education,
Educational Statistics, 1984.
9

Components of Subsector Descriptions
Outline of Data Needs
Introduction
A. Rationale for concentration of Basic Education
B. Rationale for concentration on the provincial level
National Context
A. History and Status
B. Educational policies, plans, strategies
In generalSpecific to Primary and Junior Secondary
Plans for expansiona. MOEC
- public- private
b. MOR- public- private
Plans for improvementa. MOEC (curriculum, textbooks, teachers, etc.)
- public- private- nonformal- Packet B
b. MOR (curriculum, textbooks, teachers, etc.)- public- private
f

Provincial Context
A. History and Status
B. Educational policies, plans, strategies
In generalSpecific to Primary and Junior Secondary
Plans for expansiona. MOEC
- public- private
b. MOR- public- private
Plans for improvementa. MOEC (curriculum, textbooks, teachers, etc.)
- public- private- nonformal- Packet B
b. MOR (curriculum, textbooks, teachers, etc.)- public- private
C. Economic conditions and implications
General economic conditionsTransition to an industrial economy/society
a. growth by sectors of economyb. growth in govt. revenues
Manpower needs for Basic Education graduates
D. Political and social setting
DecentralizationPublic demand for schooling
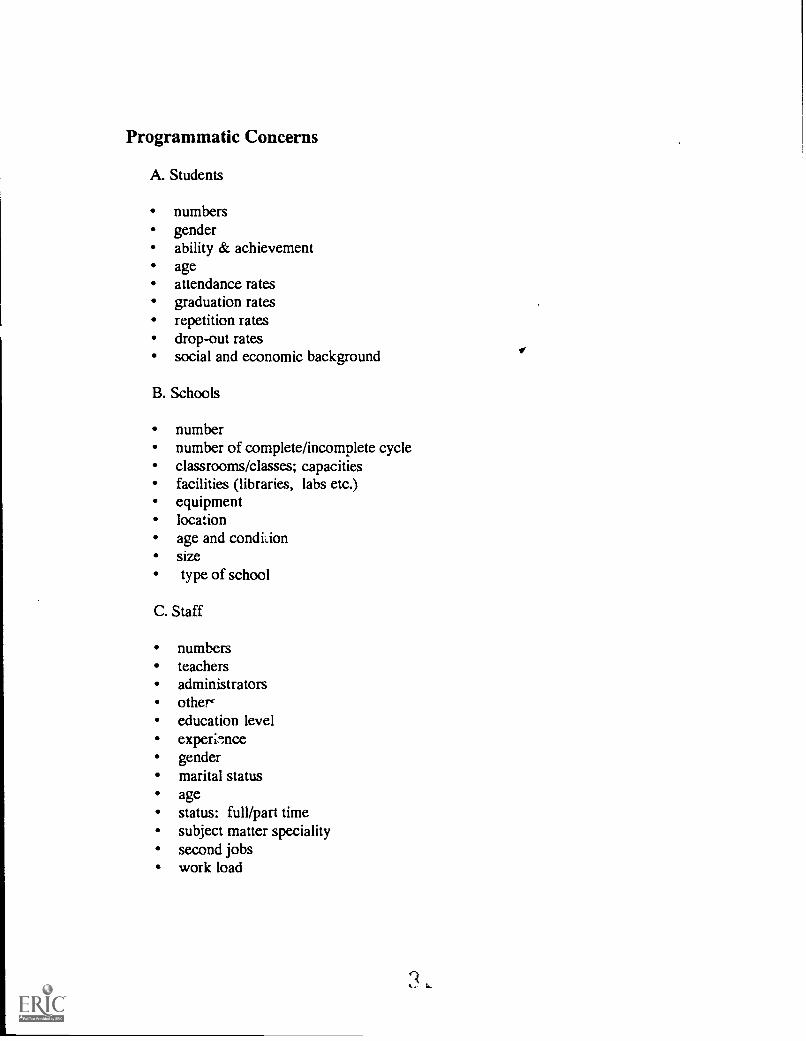
Programmatic Concerns
A. Students
numbersgenderability & achievementageattendance ratesgraduation ratesrepetition ratesdrop-out ratessocial and economic background
B. Schools
numbernumber of complete/incomplete cycleclassrooms/classes; capacitiesfacilities (libraries, labs etc.)equipmentlocationage and conditionsizetype of school
C. Staff
numbersteachersadministratorsother.'education levelexperimcegendermarital statusagestatus: full/part timesubject matter specialitysecond jobswork load
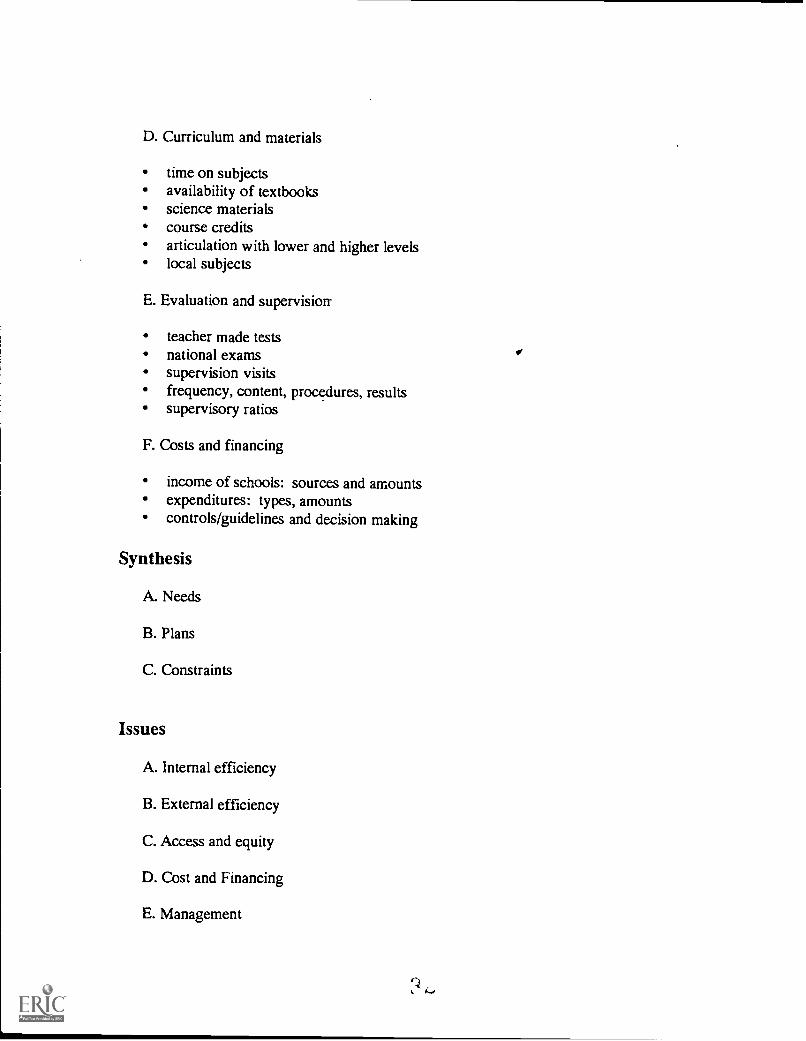
D. Curriculum and materials
time on subjectsavailability of textbooksscience materialscourse creditsarticulation with lower and higher levelslocal subjects
E. Evaluation and supervision.
teacher made testsnational examssupervision visitsfrequency, content, procedures, resultssupervisory ratios
F. Costs and financing
income of schools: sources and amountsexpenditures: types, amountscontrols/guidelines and decision making
Synthesis
A. Needs
B. Plans
C. Constraints
Issues
A. Internal efficiency
B. External efficiency
C. Access and equity
D. Cost and Financing
E. Management

Policy Recommendations
(Note: there should be a policy recommendation for each of the issues described)

Participant Exercise
Expand Outline of Data Needs as appropriate and next to each item determinewhether the data exists (already collected in the form you .seed it) and/or where to obtainthe data. In addition, assign team members the responsibility for the collection ofdifferent types of data.
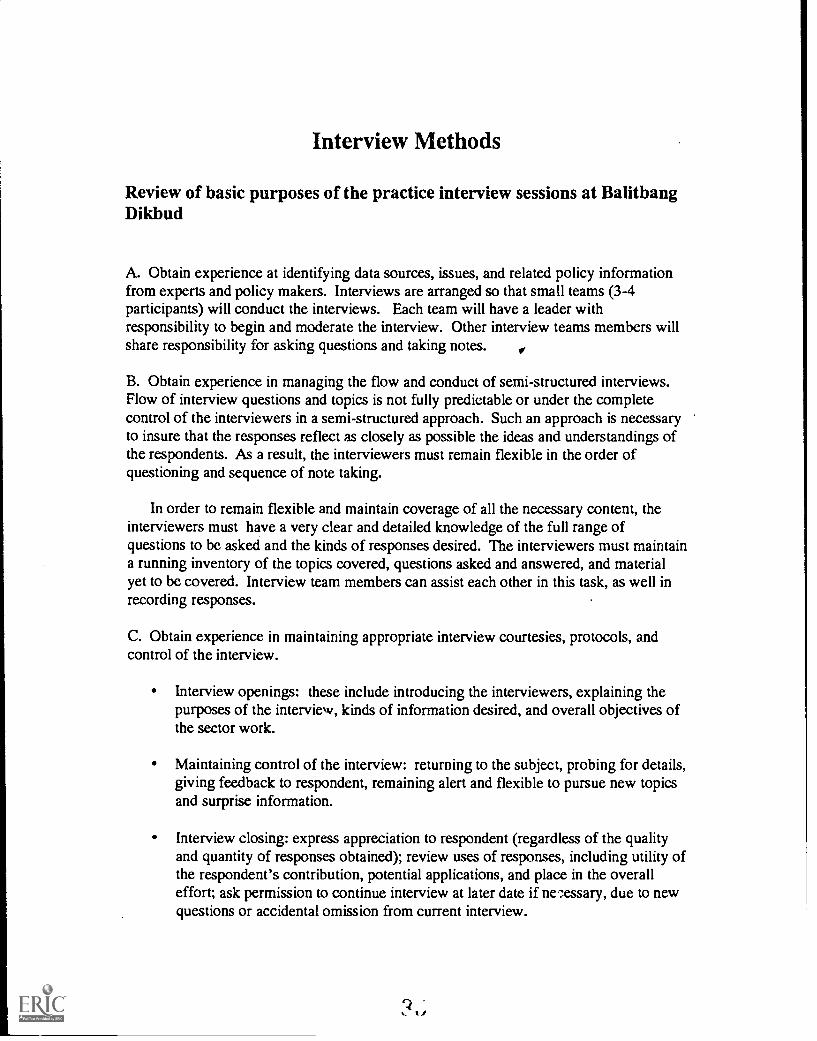
Interview Methods
Review of basic purposes of the practice interview sessions at BalitbangDikbud
A. Obtain experience at identifying data sources, issues, and related policy informationfrom experts and policy makers. Interviews are arranged so that small teams (3-4participants) will conduct the interviews. Each team will have a leader withresponsibility to begin and moderate the interview. Other interview teams members willshare responsibility for asking questions and taking notes.
B. Obtain experience in managing the flow and conduct of semi-structured interviews.Flow of interview questions and topics is not fully predictable or under the completecontrol of the interviewers in a semi-structured approach. Such an approach is necessaryto insure that the responses reflect as closely as possible the ideas and understandings ofthe respondents. As a result, the interviewers must remain flexible in the order ofquestioning and sequence of note taking.
In order to remain flexible and maintain coverage of all the necessary content, theinterviewers must have a very clear and detailed knowledge of the full range ofquestions to be asked and the kinds of responses desired. The interviewers must maintaina running inventory of the topics covered, questions asked and answered, and materialyet to be covered. Interview team members can assist each other in this task, as well inrecording responses.
C. Obtain experience in maintaining appropriate interview courtesies, protocols, andcontrol of the interview.
Interview openings: these include introducing the interviewers, explaining thepurposes of the interview, kinds of information desired, and overall objectives ofthe sector work.
Maintaining control of the interview: returning to the subject, probing for details,giving feedback to respondent, remaining alert and flexible to pursue new topicsand surprise information.
Interview closing: express appreciation to respondent (regardless of the qualityand quantity of responses obtained); review uses of responses, including utility ofthe respondent's contribution, potential applications, and place in the overalleffort; ask permission to continue interview at later date if ner:essary, due to newquestions or accidental omission from current interview.

Preliminary data analysis
A. Initial analysis
Material in notes should be expanded and elaborated by interviewers as soon aspossible following the interview.
Expanded notes should be divided into sections according to the topics andsubtopics in the DATA NEEDS outline (which is the basic outline of the SectorAssessment Report). Separate content of notes into index cards (or other sortablemedium), identified by topic and source). Interview content can then be arrangedinto the organizational structure of the draft report itself.
B. Expanded Analysis: possible techniques of treating interview data, based onspecific issues or questions.
Flowcharts and verbal action plans of important processes (as in managementdecisionmaking)
Descriptions of decision rules and contingencies on which decisions are based.
Definitional and conceptual structures relevant to policy problems, conflicts, andissues. For example, a detailed inquiry into what policy makers mean by"quality" when they talk about quality improvements in education.
Identification of issues and priorities.
Identification of needs and constraints.In the Sector Assessment method, the terms issues, needs, and constraints haveparticular meanings. An issue is a topic on which there are conflicting orincompatible positions or opinions about what action or decision should be taken.An issue is different from a problem. Policymakers may all agree on thedefinition of a problem, and disagree about how to solve it. For example, ashortage of teachers for the expansion of Jr. Secondary Education may be aserious problem. A related issue may be whether or not the salaries of Jr.Secondary teachers should be raised so as to attract greater numbers into thoseranks.
The term needs refers to resources or decisions that a policymaker oradministrator identifies as necessary to achieve some objective. For example,expanding training facilities for Jr. Secondary teachers may require manythousand new places, and therefore new classroom space, in the appropriate Sr.Secondary schools or IKIP's. The required new classroom space would bereferred to as a need.

A constraint is condition or problem that interferes with or prevents theaccomplishment of an objective. Lack of sufficient financial or human resources arecommon constraints that are often mentioned. Other constraints could be beliefs ortraditions, such as a belief that children should study only their local language in theprimary grades.
A statement of priorities is one that identifies a clear order of preference amongalternative actions or recommendations. That is, saying something is important is not astatement of priorities. A statement of priorities might be, for example, that expandingopportunities for Jr. Secondary Education is more important and therefore should bedone before expanding opportunities in higher education.

Cost Analysis
Efficiency analysis includes effectiveness analysis. It adds to the concept ofeffectiveness (goal attainment), the concept of cost (what is sacrificed to realize the goal).
Effectiveness 4.4. goal attainment
Efficiency ....* goal attainment at the least cost
Costs are generated by the interaction of inputs and processes. For example, the costof providing French differs with class size. If the salary of a French teacher with amasters' degree is Rp. 100,000 a month, the average cost per student is Rp. 10,000 permonth in a class of 10 students; Rp. 5,000 per month in a class of 20 students; and Rp.2,500 per month in a class of 40 students.
There are two main approaches to the analysis of educational costs. They are theaggregate approach and the ingredients approach.
Aggregate Approach
The aggregate approach uses existing expenditure data to estimate the value of thepublic and private investments in education. For example, the expenditure data in theBotswana Sector Assessment are broken down by source (level of government, fees),level of schooling, and type of expenditure. For example, Table 2.29, p2-102 isstructured as follows:
Estimates of Local Expenditures
District/Budget
Category
District A District B District C District D District E
A. Employees
Salaries
Wages
Uniforms
Training
B. Maintenance

District/Budget
Category
District A District B District C District D District E
C. Special
Furniture &Equipment
Textbooks &Stationary
Teachingmaterials
Sportsequipment,prizes, other
Room & boardfor students
Grants tomission schoolsfor books &supplies
Evening schoolsal.
TOTAL
In that assessment, the aggregate approach was used only for the analysis ofgovernment investments. Since information on private and community expenditures arenot systematically maintained in Yemen, it was necessary to use the ingredients approachto estimate the contributions from these sources.
Ingredients Approach
The ingredients approach estimates the value of public and private investments byfirst listing expenditure items and then determining their cost. For example, how wouldyou estimate the cost to families in Indonesia of a junior secondary students education ina public school. What are the ingredients?
BP3Other donations

UniformsTextbooksSuppliesOpportunity cost
Is cost data useful in the absence of benefit or effectiveness data? Yes, but only toidentify potential problem areas. For example, if data are available on the unit cost (totalcost divided by number of students) of different levels and types of schooling, you mightcompare the cost among levels and types. By setting primary school equal to 1.0, youmight find the following.
Primary 01.0Junior Secondary 04.0Brigades 05.3Other vocational/technical 11.2Polytechnic 15.6Teacher training 05.0University 37.8
How would you interpret this??
Basically, there are four types of cost analysis. Each type is described in detail inLevin (1983) and Windham (1988). They are:
cost-effectiveness analysisbenefit/cost analysisleast-cost analysiscost-utility analysis
For the type of sector work you are doing, unit and cycle cost analysis, a form ofcost-effectiveness analysis is especially useful and will be described later.
In Indonesia, the complexity of the education sector (public/private, the stronginvolvement of government and parental financing in both public and private, and therelative scarcity of detail on the routine and development budgets) make cost-analysis ofany type exceptionally difficult.
Most assessments of the education sector in Indonesia rely on an ingredient approach.More specifically, attempts have been made to construct income and expenditure profilesof 'typical' schools using the ingredients approach. Step 1 involved identifying thesources of particular types of expenditure (see Vol. II, pp.6-65ff) .
(10

Government Sources Private Sources
PDK APBD I APBD II SPP/DPP BP3rnmomi.
Other
A. Salaries
1. Teaching x x x
2. Non-teaching
x
3. Remun-eration
x x x
B. Texts x x
C. Materials x x x x
D. Mainten-ance
x x x x
E. Upgrading x x x x x
F. Students x
G. Super-vision
x
Step 2 consisted of determining the typical characteristics of specific types ofschools. These included such things as enrollments, class size, student/teacher ratio,number of full-time equivalent and part-time teachers, etc.
In step 3, the cost of major items in school budgets were estimated on the basis of theschool characteristics and finally, these costs were spread over the number of students toestimate the cost per pupil per year of different levels and types of school. None of thesesteps could have been skipped.
4.

Unit and Cycle Cost Calculations
Definitions
The unit cost is the total cost (sum of government and family expenditures) perstudent. Cycle cost is the average number of student years it is necessary to provide (andpay for) to produce a graduate. The optimal cycle cost is the unit cost times the numberof years in the cycle. Cycle costs in excess of that calculation reflect wastage from eitherrepetition or dropouts. Cycle cost analysis assumes that whatever else is desired in termsof outputs, government and parents value graduates, that is, one of the objectives ofschooling is to produce graduates.
V
Steps in the Calculation
1. Calculate the unit cost
2. Estimate grade to grade progession (review MOEC worksheets & Windham, p.124ff.)
3. Sum the total years of schooling for the cycle (this includes the years of schooling(including repetition) of both the graduates and the dropouts.
4. Divide the number of graduates by the total years of schooling provided.
The calculation dramatically reveals the number of graduates that can be expectedrelative to the number who enrolled in the cycle in the normal length of the cycle. Forexample, it may show that for every 100 students beginning primary school only 50graduate in six year time. If sufficient information is available it may be clear whetherthis is due to excessive repetition or dropout behavior. Both can be addressed by policy.Cycle cost analysis may also expose inefficiencies related to under or over financing onesector relative to another or one type of schooling relative to another.
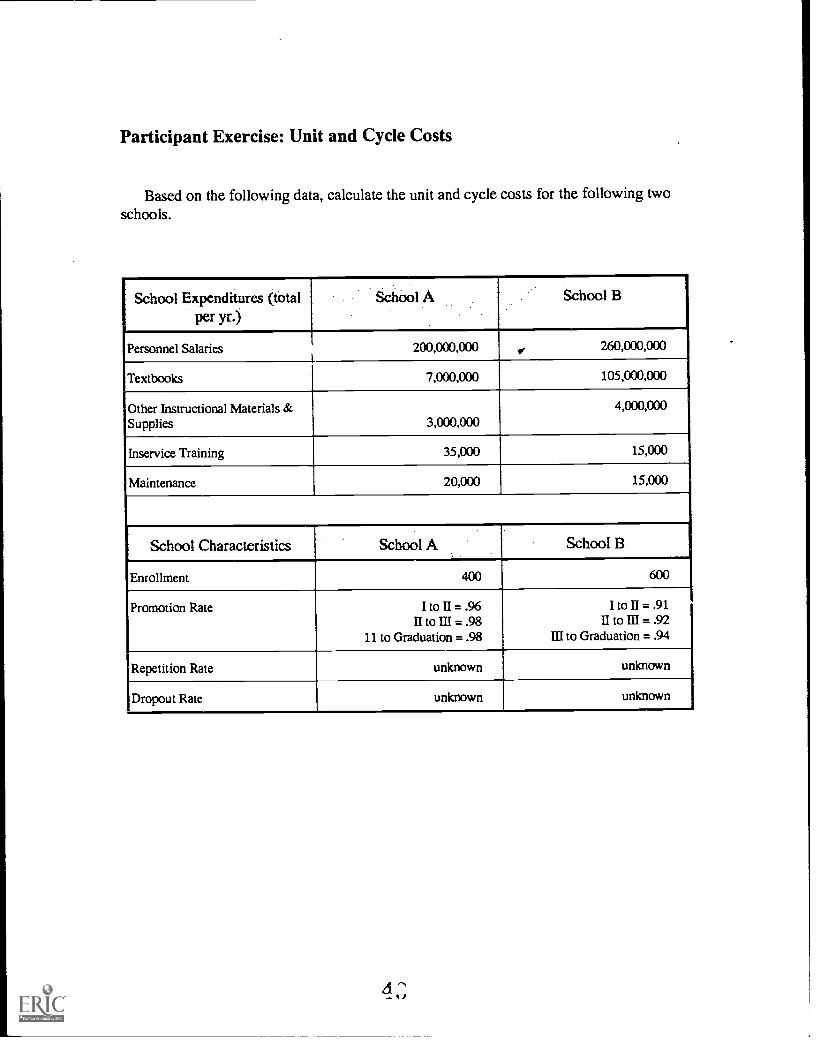
Participant Exercise: Unit and Cycle Costs
Based on the following data, calculate the unit and cycle costs for the following twoschools.
School Expenditures (total
Per yr.)School A School B
Personnel Salaries 200,000,000 o 260,000,000
Textbooks 7,000,000 105,000,000
Other Instructional Materials &Supplies 3,000,000
4,000,000
Inservice Training 35,000 15,000
Maintenance 20,000 15,000
School Characteristics School A School B
Enrollment 400 600
Promotion Rate Ito II=.96litoD1=.98
11 to Graduation = .98
ItoII=.91IItoIII=.92
DI to Graduation = .94
Repetition Rate unknown unknown
Dropout Rate unknown unknown

Post Workshop Assignments
1. Complete reading of the Workshop I materials:
Windham, D.M. (1988). Indicators of Educational Effectiveness and Efficiency.Tallahassee, FL: IEES, Florida State University.
Levin, H.M. (1983). Cost-Effectiveness Analysis: A Primer. Newbury Park, CA:Sage Publications.
Chapter One: Executive Summary. In Indonesia Education and HumanResources Sector Review (1986). Tallahassee, FL: IEES, Florida State University.
Chapter Six: Secondary Education. In Indonesia Education and HumanResources Sector Review (1986). Tallahassee, FL: IEES, Florida State University.
Pigozzi, M.J. and Cieutat, V. J. (1988). Education and Human Resources SectorAssessment Manual. Tallahassee, FL: IEES, Florida State University.
2. Review and revise (if necessary) data collection assignments, work calendar, andresource requests for provincial sector assessments.
3. Collect all necessary subsector data from provincial and national sources(documents). Conduct all necessary data collection interviews and compile results.(May 1)
4. Draft national and provincial context statements. (May 15)
5. Draft subsector chapter sections containing descriptions of each subsector (materialin Part III of "Outline of Data Needs".(May 15)
6. Conduct analysis interviews and draft anaysis sections for each subsector Part IV andPart V of "Outline of Data Needs." (July 15)

Sector ReviewWorkshop II
Pengian KebijakanSubsektor PffididikanSD dan SNIPEast Java Province
West Java Province
South Sulawesi Province

Introduction
Objectives of Workshop II
The first workshop focused on the concepts and skills needed for sector work. Thesecond focuses on the use of those concepts and skills. There are two major objectives ofthe workshop.
to review, discuss, and finalize: (a) the National and provincial contexts for thereview of primary and junior secondary schooling; (b) descriptions of the statusof the primary and junior secondary subsectors; and (c) tie description of needs,plans, and constraints.
to analyze the issues related to equity, internal efficiency, external efficiency,administration and supervision, and the costs and financing of primary and juniorsecondary schooling in each province.
To accomplish these objectives less time will be spent in whole group activities andmore time will be spent either working in teams or on team assignments than was thecase in the last workshop. Time in the whole group will be spent on the analysis of theissues you have identified.
Analytic Framework
In our work on these issues and in the small group work, the analytic frame shown onthe next page will be used. Discussion will move from the question (e.g., who has accessto junior secondary school) to the data (e.g. who attends junior secondary) to statisticalanalysis (e.g. enrollments are 85% urban, 15% rural) to the interpretation of the data (e.g.few schools are available in rural areas) to policy recommendations or options (e.g., thejunior secondary grades should be added to primary schools in rural areas).
4.

4r
Ass
essm
ent S
teps
Dat
a
1Sta
tistic
alA
naly
sis
Inte
rpre
tatio
nP
olic
yO
ptio
ns
A

Que
stio
nD
ata
Sta
tistic
al A
naly
sis
Inte
rpre
tatio
nP
olic
y O
ptio
ns

QU
ES
TIO
NS
IN F
IVE
AR
EA
S
1. A
cces
s &
Equ
ity
2. In
tern
al E
ffici
ency
3. E
xter
nal E
ffici
ency
4. A
dmin
istr
atio
n &
Sup
ervi
sion
5. C
osts
& F
inan
cing
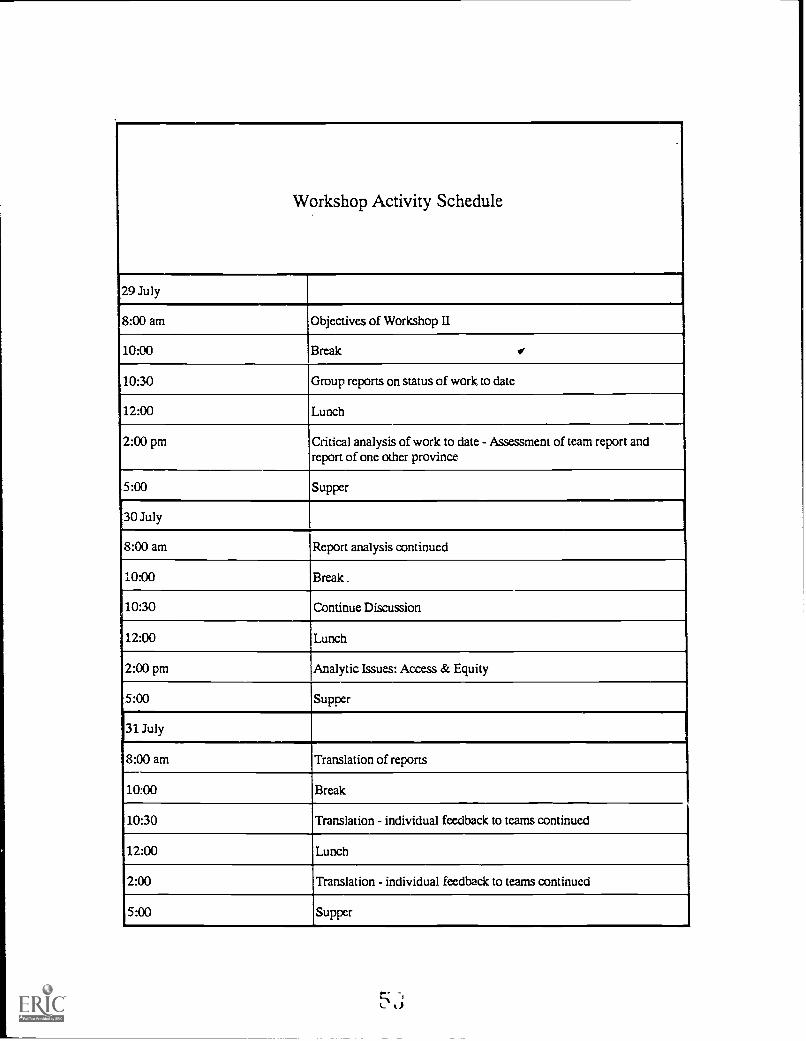
Workshop Activity Schedule
29 July
8:00 am Objectives of Workshop 11
10:00 Break Ir
10:30 Group reports on status of work to date
12:00 Lunch
2:00 pm Critical analysis of work to date - Assessment of team report andreport of one other province
5:00 Supper
30 July
8:00 am Report analysis continued
10:00 Break .
10:30 Continue Discussion
12:00 Lunch
2:00 pm Analytic Issues: Access & Equity
5:00 Supper
31 July
8:00 am Translation of reports
10:00 Break
10:30 Translation - individual feedback to teams continued
12:00 Lunch
2:00 Translation - individual feedback to teams continued
5:00 Supper
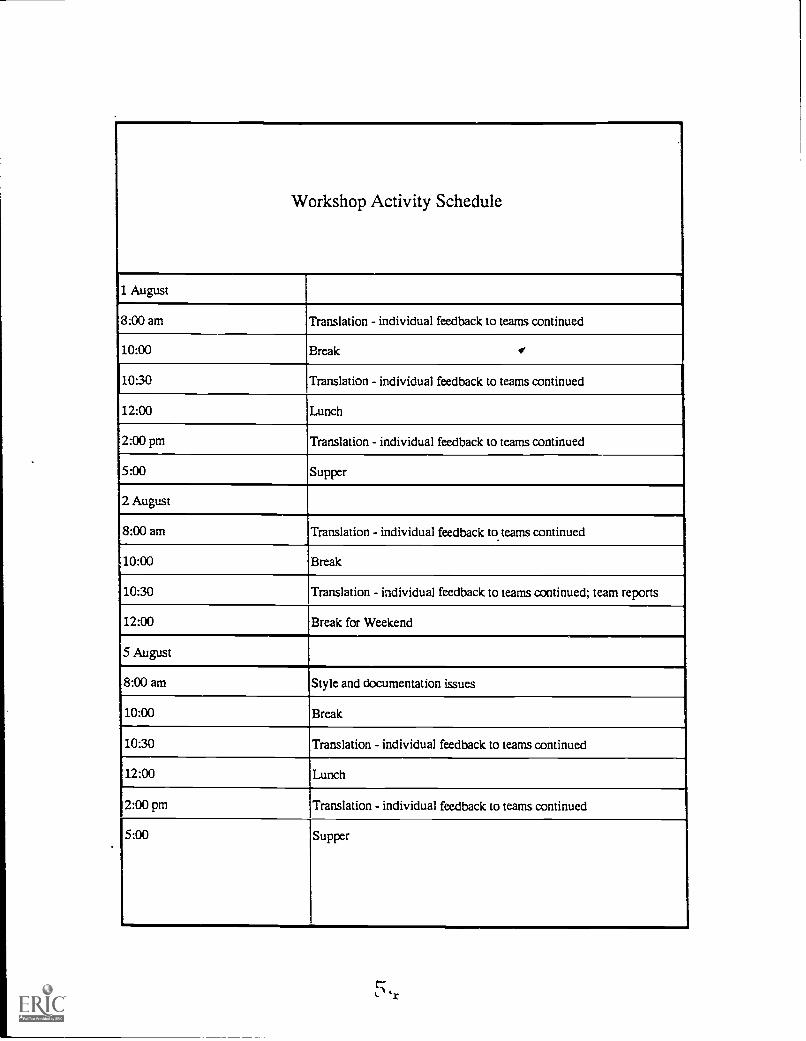
Workshop Activity Schedule
1 August
8:00 am Translation - individual feedback to teams continued
10:00 Break 1
10:30 Translation - individual feedback to teams continued
12:00 Lunch
2:00 pm Translation - individual feedback to teams continued
5:00 Supper
2 August
8:00 am Translation - individual feedback to teams continued
10:00 Break
10:30 Translation - individual feedback to teams continued; team reports
12:00 Break for Weekend
5 August
8:00 am Style and documentation issues
10:00 Break
10:30 Translation - individual feedback to teams continued
12:00 Lunch
2:00 pm Translation - individual feedback to teams continued
5:00 Supper
5,r

Workshop Activity Schedule
6 August
8:00 am Review of outline and content of each section of the report
10:00 Break
10:30 Analytic Issues: Internal and External Efficiency
12:00 Lunch
2:00 Discussion continued
5:00 Supper
7 August
8:00 am Translation - individual feedback to teams continued
10:00 Break
10:30 Translation - individual feedback to teams continued
12:00 Lunch
2:00 pm Translation - individual feedback to teams continued
5:00 Supper
8 August
8:00 am Analytic Issues: Administration & Supervision
10:00 Break
10:30 Discussion continued
12:00 Lunch
2:00 pm Discussion continued
5:00 Supper
8:00 Pak Boediono - Seminar on planning models

Workshop Activity Schedule
9 August
8:00 am Compilation of draft reports
10:00 Break i10:30 Pak Mocgiadi - Discussion of issues related to provincial work
5,
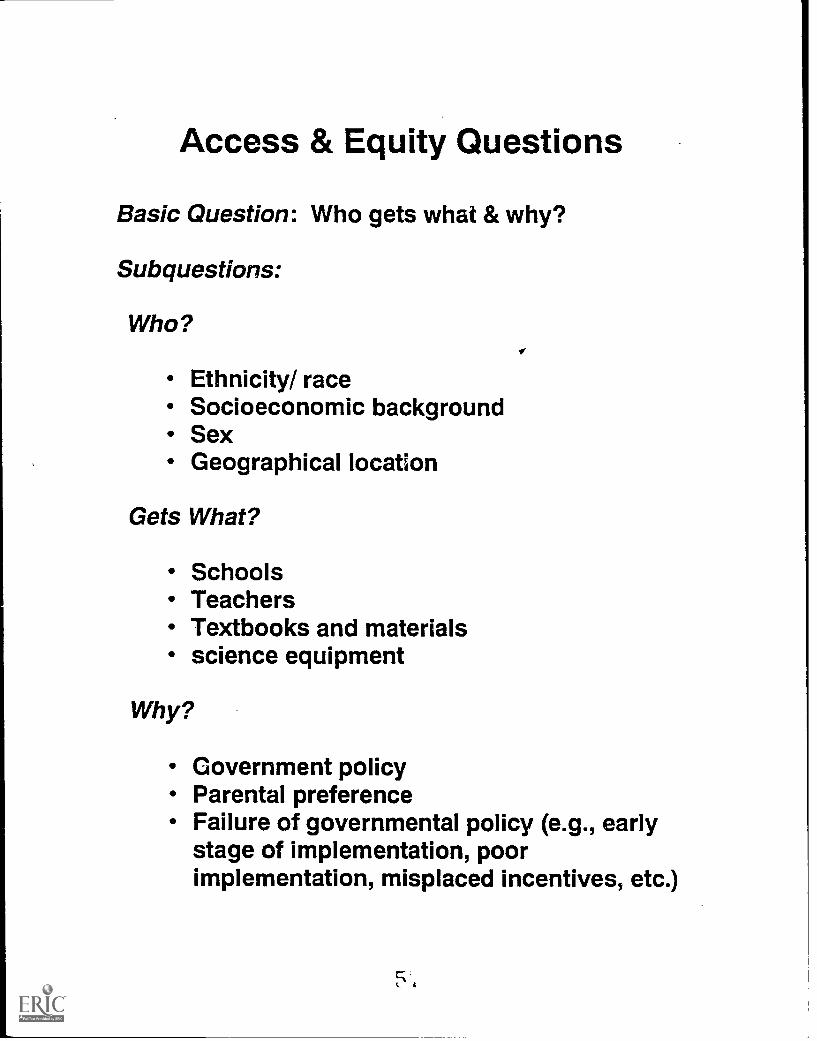
Access & Equity Questions
Basic Question: Who gets what & why?
Subquestions:
Who?V
Ethnicity/ raceSocioeconomic backgroundSexGeographical location
Gets What?
SchoolsTeachersTextbooks and materialsscience equipment
Why?
Government policyParental preferenceFailure of governmental policy (e.g., earlystage of implementation, poorimplementation, misplaced incentives, etc.)

Que
stio
nD
ata
Sta
tistic
al A
naly
sis
inte
rpre
tatio
nP
olic
y O
ptio
ns
Who
goe
s to
scho
ol?
Enr
ollm
ents
by:
- le
vel
- et
hnic
ity/r
ace
- se
x-
geog
raph
ical
loca
tion
Bre
akdo
wns
acr
oss
& w
ithin
cat
egor
ies
Com
puta
tions
of
sim
ple
prop
ortio
ns
L a
.'
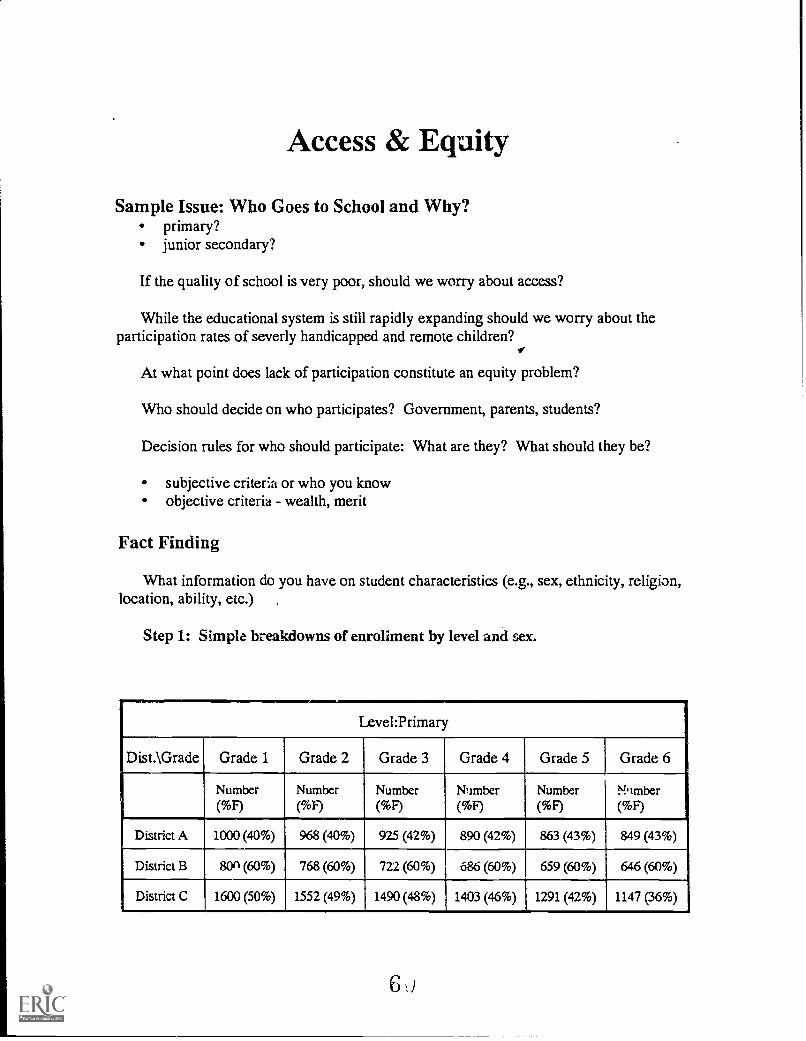
Access & Equity
Sample Issue: Who Goes to School and Why?primary?junior secondary?
If the quality of school is very poor, should we worry about access?
While the educational system is still rapidly expanding should we worry about theparticipation rates of severly handicapped and remote children?
At what point does lack of participation constitute an equity problem?
Who should decide on who participates? Government, parents, students?
Decision rules for who should participate: What are they? What should they be?
subjective criteria or who you knowobjective criteria - wealth, merit
Fact Finding
What information do you have on student characteristics (e.g., sex, ethnicity, religion,location, ability, etc.)
Step 1: Simple breakdowns of enrollment by level and sex.
MIIMININVI10! IMIIAIMOIli
Level:Primary
Dist.\Grade Grade 1 Grade 2 Grade 3 Grade 4 Grade 5 Grade 6
Number
(%F)
Number(%}.)
Number
(%F)
Number( %F)
Number(%F)
Member( %F)
District A 1000 (40%) 968 (40%) 925 (42%) 890 (42%) 863 (43%) 849 (43%)
District B 8011(60%) 768 (60%) 722 (60%) 686 (60%) 659 (60%) 646 (60%)
District C 1600 (50%) 1552 (49%) 1490 (48%) 1403 (46%) 1291 (42%) 1147 (36%)
6:)

Note: This analysis should not be based on one years data. A more accurate picture isobtained by looking at six years data (following a cohort) or calculating a two yearinter -grade cohort. To remind yourself of the differential effects of these approaches seeWindham, pp.57-63.
Step 2. Initial interpretation
FACT: Districts A and C have differential progression rates for boys and girls whilein District B boys and girls progress at the same rate. In District A fewer girls beginschooling (assume 49/51 distribution among all 6 yr olds) but once in school girlsprogress (stay in or are promoted) at a greater rate than do boys. In District C theopposite is true. Boys progress at a greater rate than do girls. As girls reach the uppergrades their progression rates sharply fall.
Step 3: Gathering Additional Information
To understand the progression rates in these districts more information is needed. InDistrict C it looks like girls are dropping out at a greater rate as they approach the age ofmarriage. Is this true? Why are the boys dropping out in District A? Are they neededfor farming? Why is District B different? This information can be obtained by lookingat more quantitative data (# school age boys, girls employed in the district, average ageof marriage of young women, acceptance rates into junior secondary and by interviewinglocal leaders.
Interpretation and Policy Options
The answer to the question why reveals the constraints and opportunities for policychange. If, for insance, girls drop out as they near marriage, there may be a culturalconstraints to their continuing in school. This interpretation would lead to a different setof policy options or recommendations than would the interpretation that the teachersencourage the boys but not the girls to continue in school.

/
Interpretation A
Girls drop out as they marryor become eligible to marry
Interpretation B
Only boys are encouragedto remain in school
amia
I
Policy Options A
1. Work with localofficals, religious leaders,etc. to change opinion re:what is appropriate.
2. Offer special classes foryoung women in theevening.
3. Remove any regulationsbarring the admission ofmarried students.
Policy Options B
1. Work with principals,teachers, and parents.
2. Reward schools withhigh retention rates foryoung women.
3. Provide specialincentives for girls - e.g.free textbooks, etc.

Internal Efficiency Questions
Basic Questions: Do the quantity and quality of resourcesinvested in schooling produce the desired short-term results?at the least cost?
Sub questions:
What are the desired short-term objectives?
Are the desired short-term objectives being met?
What resources are invested in schooling?
Are the "purchased" resources of sufficient quantityand/or quality necessary to produce the desired outputs?
Are the "purchased" resources delivered to schools in atimely fashion?
Are the resources used appropriately given theshort-term objectives?
f

Que
stio
nD
ata
Sta
tistic
al A
naly
sis
Inte
rpre
tatio
nP
olic
y O
ptio
ns
Wha
t res
ourc
es a
repr
ovid
ed to
scho
ols?
Dis
trib
utio
n of
qual
ified
teac
hers
.T
each
er/s
tude
ntra
tios
by:
- di
stric
t-
urba
n/ru
ral
Dis
trib
utio
n of
Boo
ks, e
tc.
Bre
akdo
wn
P,;

External Efficiency Questions
Basic Questions: Do the quantity and quality of resourcesinvested in schooling produce the desired longer-term results?at the least cost? In brief are the longer-term results ofschooling those desired by society?
Sub questions:
What are the desired longer-term objectives of schooling?
Are the desired longer-term objectives being met?
How are the short-term and the long-term objectives ofschooling related?

External EfficiencyIn contrast to internal efficiency which focuses on the cost-effectiveness of the
processes used to produce the short-term objectives of schooling, external efficiencyfocuses on whether the longer-term objectives are being met cost-effectively.
Step 1: Determine the long-term objectives of schooling.
preparation for employment
preparation for higher levels of schooling
preparation for participation in government as citizens, etc.
Step 2: Identify indicators of external efficiency.
graduates are successful in gaining entrance to next level ofschooling
graduates are successful in handling the curriculum at the nextlevel
graduates are successful in obtaining and maintaining jobs
graduates are good citizens
graduates are good parents
Step 3: Gather evidence related to indicators
Teachers at higher levels complain about students' entry level skills
High rates of repetition are observed at first grade in next cycle
Employers complain about graduates basic literacy and numeracyskills, attitudes toward work, etc.
Step 4: Analyse evidence, draw conclusions, and make recommendations

Sample External Efficiency Question
Is academic or vocational schooling a more cost-effective way to prepare studentsfor the labor market?
What data are needed to answer this question?
What types of analysis would be needed?
How would different data, analyses, and interpretations lead todifferent policy recommendations?

Que
stio
nD
ata
Sta
tistic
al A
naly
sis
inte
rpre
tatio
nP
olic
y O
ptio
ns
Is a
cade
mic
or
voca
tiona
lsc
hool
ing
bette
rpr
epar
atio
n fo
rem
ploy
men
t?
cost
s an
dou
tcom
es o
fdi
ffere
nt ty
pes
ofsc
hool
ing?
brea
kdow
ns b
yty
pe o
f sch
ool
mul
tivar
iate
ana
lysi
s
A

Administration & SupervisionBasic Question: How well do the current administrative and
supervisory systems promote and support quality, efficiency, and equity inthe schools?
What is needed to promote and support quality, efficiency, and equity?
1. Good organizational system
design
resources
technology
2. Good personnel
3. Good information
4. Good decision making
What are the elements of a good organizational system?
1. Elements of organizational design
Authority structure
relationship of authority to responsibility
appropriate foundations of authority
clarity in delineation of authority
appropriate centralization
functional span of control
Coordination and control mechanisms
Work flow and technology
task specialization
rules & procedures
decision making
7

2. Necessary resources
Tangible resources & technology
funds
facilities
equipment
transportation
communication
information technology
Intangible resources
authority & status
3. Information
I
relevant: contributes to answering questions or resolving uncertainty aboutissues or problems that are important to the user of the information.
timely: available to the user when needed to answer inquiries, conduct analyses,or make decisions about important issues or problems.
accurate: reflects a true or valid observation or impression of the subjectinvolved.
meaningful: is in a form (level of aggregation, type of presentation, or symbolsystem) that allows the user to interpret and understand the information
manageable: in an amount, physical medium, and organization that allows theuser to perform the necessary manipulations and analyses.
ti