cibccanadianindexfund annualfinancialstatements · balance-endofperiod 13,818 14,060 12,367 10,771...
TRANSCRIPT

The accompanying notes are an integral part of these financial statements.
CIBC Canadian Index Fund
Annual Financial Statementsfor the financial year ended December 31, 2017
† Securities LendingThe tables that follow indicate the Fund had assets involved in securities lending transactionsoutstanding as at December 31, 2017 and 2016.
Aggregate Valueof Securities
on Loan($000s)
AggregateValue
of Collateralfor Loan
($000s)x
x
December 31, 2017 40,166 41,639x
December 31, 2016 44,279 46,191x
Collateral Type* ($000s)i ii iii iv
xx
December 31, 2017 25,013 16,626 – –x
December 31, 2016 19,431 26,760 – –x
x
* See note 2j for Collateral Type definitions.
Organization of the Fund (note 1)The Fund was established on July 8, 1996 (Date Established).
Inception Datexx
Class A July 25, 1996x
Premium Class November 23, 2011x
Institutional Class November 29, 2011x
Class O June 1, 2010xx
Statements of Financial Position(in 000s, except per unit amounts)
As at December 31, 2017 and 2016 (note 1)
December 31, 2017 December 31, 2016x
xxx
Assetsxxx
Current assetsx
Investments (non-derivative financial assets) † (notes2 and 3) $ 601,830 $ 549,538
x
Cash including foreign currency holdings, at fair value 52 152x
Margin 55 264x
Cash collateral received for securities on loan (note 2j) 25,013 19,431x
Dividends receivable 1,480 1,351x
Receivable for units issued 335 433x
Other receivables – 1x
Derivative assets 2 –xxx
Total Assets 628,767 571,170xxx
Liabilitiesxxx
Current liabilitiesx
Obligation to repay cash collateral under securitieslending (note 2j) 25,013 19,431
x
Payable for units redeemed 949 286x
Other accrued expenses 2 1x
Derivative liabilities – 9xxx
Total Liabilities 25,964 19,727xxx
Net Assets Attributable to Holders ofRedeemable Units (note 5) $ 602,803 $ 551,443
xxx
Net Assets Attributable to Holders ofRedeemable Units per Class
x
Class A $ 417,578 $ 398,921x
Premium Class $ 172,738 $ 141,270x
Institutional Class $ 1,076 $ 174x
Class O $ 11,411 $ 11,078xxx
Net Assets Attributable to Holders ofRedeemable Units per Unit (note 5)
x
Class A $ 30.22 $ 28.37x
Premium Class $ 13.97 $ 13.12x
Institutional Class $ 14.06 $ 13.21x
Class O $ 13.85 $ 13.00x
1
The accompanying notes are an integral part of these financial statements.
CIBC Canadian Index Fund
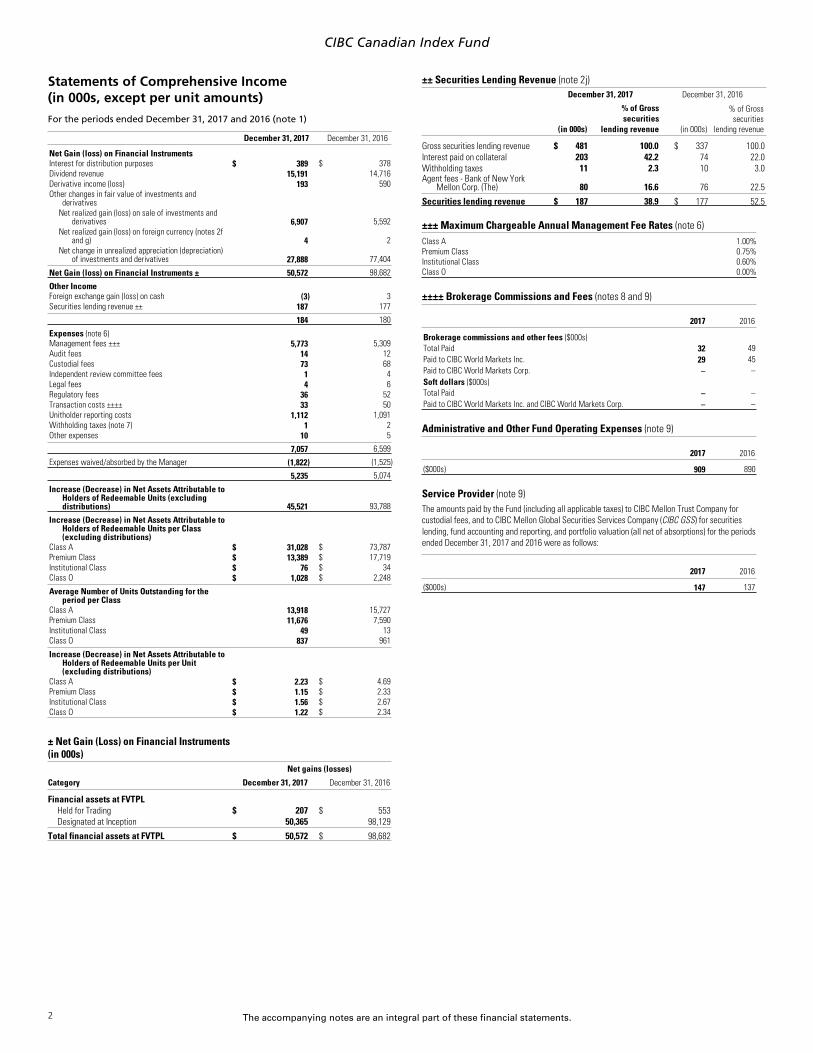
Statements of Comprehensive Income(in 000s, except per unit amounts)
For the periods ended December 31, 2017 and 2016 (note 1)
December 31, 2017 December 31, 2016x
x
Net Gain (loss) on Financial Instrumentsx
Interest for distribution purposes $ 389 $ 378x
Dividend revenue 15,191 14,716x
Derivative income (loss) 193 590x
Other changes in fair value of investments andderivatives
x
Net realized gain (loss) on sale of investments andderivatives 6,907 5,592
x
Net realized gain (loss) on foreign currency (notes 2fand g) 4 2
x
Net change in unrealized appreciation (depreciation)of investments and derivatives 27,888 77,404
xxx
Net Gain (loss) on Financial Instruments ± 50,572 98,682xx
x
Other Incomex
Foreign exchange gain (loss) on cash (3) 3x
Securities lending revenue ±± 187 177xxx
184 180xx
x
Expenses (note 6)x
Management fees ±±± 5,773 5,309x
Audit fees 14 12x
Custodial fees 73 68x
Independent review committee fees 1 4x
Legal fees 4 6x
Regulatory fees 36 52x
Transaction costs ±±±± 33 50x
Unitholder reporting costs 1,112 1,091x
Withholding taxes (note 7) 1 2x
Other expenses 10 5xxx
7,057 6,599xx
x
Expenses waived/absorbed by the Manager (1,822) (1,525)xx
x
5,235 5,074xx
x
Increase (Decrease) in Net Assets Attributable toHolders of Redeemable Units (excludingdistributions) 45,521 93,788
xx
x
Increase (Decrease) in Net Assets Attributable toHolders of Redeemable Units per Class(excluding distributions)
x
Class A $ 31,028 $ 73,787x
Premium Class $ 13,389 $ 17,719x
Institutional Class $ 76 $ 34x
Class O $ 1,028 $ 2,248xxx
Average Number of Units Outstanding for theperiod per Class
x
Class A 13,918 15,727x
Premium Class 11,676 7,590x
Institutional Class 49 13x
Class O 837 961xxx
Increase (Decrease) in Net Assets Attributable toHolders of Redeemable Units per Unit(excluding distributions)
x
Class A $ 2.23 $ 4.69x
Premium Class $ 1.15 $ 2.33x
Institutional Class $ 1.56 $ 2.67x
Class O $ 1.22 $ 2.34x
x
± Net Gain (Loss) on Financial Instruments(in 000s)
Net gains (losses)
Category December 31, 2017 December 31, 2016x..
Financial assets at FVTPL..
Held for Trading $ 207 $ 553..
Designated at Inception 50,365 98,129......
Total financial assets at FVTPL $ 50,572 $ 98,682..
±± Securities Lending Revenue (note 2j)December 31, 2017 December 31, 2016
(in 000s)
% of Grosssecurities
lending revenue (in 000s)
% of Grosssecurities
lending revenuexx
Gross securities lending revenue $ 481 100.0 $ 337 100.0x
Interest paid on collateral 203 42.2 74 22.0x
Withholding taxes 11 2.3 10 3.0x
Agent fees - Bank of New YorkMellon Corp. (The) 80 16.6 76 22.5
xxx
Securities lending revenue $ 187 38.9 $ 177 52.5xx
±±± Maximum Chargeable Annual Management Fee Rates (note 6)xx
Class A 1.00%x
Premium Class 0.75%x
Institutional Class 0.60%x
Class O 0.00%xx
±±±± Brokerage Commissions and Fees (notes 8 and 9)
2017 2016x
x
Brokerage commissions and other fees ($000s)x
Total Paid 32 49x
Paid to CIBC World Markets Inc. 29 45x
Paid to CIBC World Markets Corp. – –x
Soft dollars ($000s)x
Total Paid – –x
Paid to CIBC World Markets Inc. and CIBC World Markets Corp. – –xx
Administrative and Other Fund Operating Expenses (note 9)
2017 2016x
x
($000s) 909 890xx
Service Provider (note 9)The amounts paid by the Fund (including all applicable taxes) to CIBC Mellon Trust Company forcustodial fees, and to CIBC Mellon Global Securities Services Company (CIBC GSS) for securitieslending, fund accounting and reporting, and portfolio valuation (all net of absorptions) for the periodsended December 31, 2017 and 2016 were as follows:
2017 2016x
x
($000s) 147 137xx
2

The accompanying notes are an integral part of these financial statements.
CIBC Canadian Index Fundx
Statements of Changes in Net Assets Attributable to Holders of Redeemable Units(in 000s)For the periods ended December 31, 2017 and 2016 (note 1)
Class A Units Premium Class Units Institutional Class Units Class O Units
December 31,2017
December 31,2016
December 31,2017
December 31,2016
December31, 2017
December 31,2016
December 31,2017
December 31,2016
xx.
Increase (Decrease) in Net Assets Attributable toHolders of Redeemable Units (excludingdistributions) $ 31,028 $ 73,787 $ 13,389 $ 17,719 $ 76 $ 34 $ 1,028 $ 2,248
xxx.
Distributions Paid or Payable to Holders ofRedeemable Units ‡
x.
From net investment income (5,385) (6,045) (3,497) (3,389) (24) (4) (266) (295)x.xx
(5,385) (6,045) (3,497) (3,389) (24) (4) (266) (295)xxx.
Redeemable Unit Transactionsx.
Amount received from the issuance of units 52,800 39,834 37,279 81,619 829 160 3,878 1,775x.
Amount received from reinvestment of distributions 5,361 6,015 3,453 3,313 24 4 266 295x.
Amount paid on redemptions of units (65,147) (117,106) (19,156) (24,679) (3) (186) (4,573) (5,203)x.xx
(6,986) (71,257) 21,576 60,253 850 (22) (429) (3,133)xxx.
Increase (Decrease) in Net Assets Attributable toHolders of Redeemable Units 18,657 (3,515) 31,468 74,583 902 8 333 (1,180)
x.
Net Assets Attributable to Holders of Redeemable Unitsat Beginning of Period 398,921 402,436 141,270 66,687 174 166 11,078 12,258
x.xx
Net Assets Attributable to Holders of Redeemable Unitsat End of Period $ 417,578 $ 398,921 $ 172,738 $ 141,270 $ 1,076 $ 174 $ 11,411 $ 11,078
xxx.
Redeemable Units Issued and Outstanding (note 5)x.
As at December 31, 2017 and 2016x.
Balance - beginning of period 14,060 16,714 10,771 5,979 13 15 852 1,110x.
Redeemable units issued 1,817 1,536 2,766 6,554 62 13 287 148x.
Redeemable units issued on reinvestments 178 213 248 254 1 – 20 23x.xx
16,055 18,463 13,785 12,787 76 28 1,159 1,281x.
Redeemable units redeemed (2,237) (4,403) (1,418) (2,016) – (15) (335) (429)x.xx
Balance - end of period 13,818 14,060 12,367 10,771 76 13 824 852x
x
‡ Net Capital and Non-Capital Losses (note 7)As at December 2017, the Fund had net capital and non-capital losses (in $000s) for income tax purposes available to be carried forward as follows:
Total Net Capital Losses
Total Non-Capital Lossesthat Expire in:
2027 to 2037x..
38,812 –.
.
3
The accompanying notes are an integral part of these financial statements.
CIBC Canadian Index Fundx
x
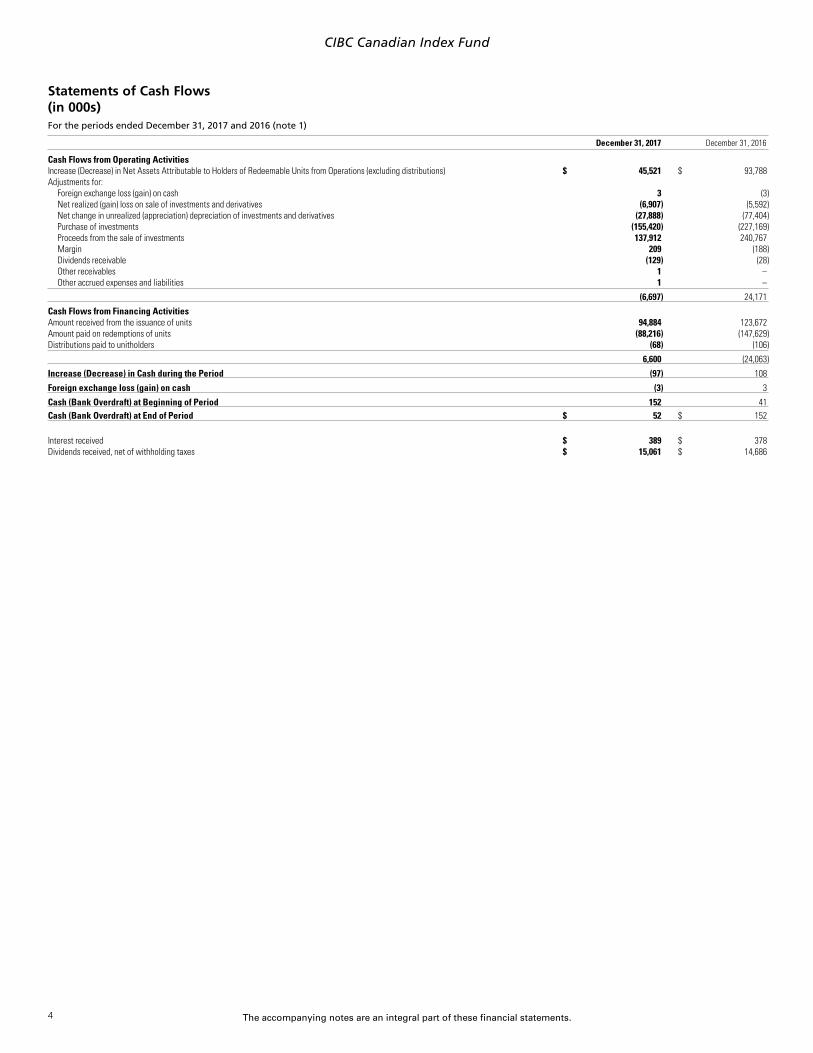
Statements of Cash Flows(in 000s)For the periods ended December 31, 2017 and 2016 (note 1)
December 31, 2017 December 31, 2016xx.
Cash Flows from Operating Activitiesx.
Increase (Decrease) in Net Assets Attributable to Holders of Redeemable Units from Operations (excluding distributions) $ 45,521 $ 93,788x.
Adjustments for:x.
Foreign exchange loss (gain) on cash 3 (3)x.
Net realized (gain) loss on sale of investments and derivatives (6,907) (5,592)x.
Net change in unrealized (appreciation) depreciation of investments and derivatives (27,888) (77,404)x.
Purchase of investments (155,420) (227,169)x.
Proceeds from the sale of investments 137,912 240,767x.
Margin 209 (188)x.
Dividends receivable (129) (28)x.
Other receivables 1 –x.
Other accrued expenses and liabilities 1 –x.xx
(6,697) 24,171xxx.
Cash Flows from Financing Activitiesx.
Amount received from the issuance of units 94,884 123,672x.
Amount paid on redemptions of units (88,216) (147,629)x.
Distributions paid to unitholders (68) (106)x.xx
6,600 (24,063)xxx.
Increase (Decrease) in Cash during the Period (97) 108xxx.
Foreign exchange loss (gain) on cash (3) 3xxx.
Cash (Bank Overdraft) at Beginning of Period 152 41xxx.
Cash (Bank Overdraft) at End of Period $ 52 $ 152x
x.
Interest received $ 389 $ 378x.
Dividends received, net of withholding taxes $ 15,061 $ 14,686
4

The accompanying notes are an integral part of these financial statements.
CIBC Canadian Index Fund
x
Schedule of Investment Portfolio As at December 31, 2017
SecurityNumber
of Shares
AverageCost
($000s)
FairValue
($000s)
% ofNet
Assetsx
CANADIAN EQUITIES..
Consumer Discretionary..
BRP Inc. 10,003 329 465..
Canada Goose Holdings Inc. 9,642 331 383..
Canadian Tire Corp. Ltd., Class 'A' 16,941 647 2,777..
Cineplex Inc. 17,384 328 649..
Cogeco Communications Inc. 6,270 211 542..
Corus Entertainment Inc., Class 'B' 29,864 490 350..
Dollarama Inc. 27,307 511 4,289..
Dorel Industries Inc., Class 'B' 7,174 210 223..
EnerCare Inc. 28,466 420 584..
Gildan Activewear Inc. 58,313 481 2,368..
Great Canadian Gaming Corp. 15,596 349 527..
Hudson's Bay Co. 28,933 554 326..
Linamar Corp. 12,496 253 915..
Magna International Inc. 90,277 1,800 6,431..
Martinrea International Inc. 23,652 208 379..
Quebecor Inc., Class 'B' 45,670 340 1,082..
Restaurant Brands International Inc. 62,953 2,877 4,864..
Shaw Communications Inc., Class 'B' 114,213 1,851 3,277..
Sleep Country Canada Holdings Inc. 9,586 299 320..
Spin Master Corp. 6,508 291 352..
Stars Group Inc. (The) 32,925 1,029 963..
Uni-Select Inc. 11,558 321 328..
....
14,130 32,394 5.4%..x
Consumer Staples..
Alimentation Couche-Tard Inc., Class 'B' 114,832 746 7,532..
Cott Corp. 37,879 428 795..
Empire Co. Ltd., Class 'A' 43,713 738 1,071..
George Weston Ltd. 12,957 878 1,414..
Jean Coutu Group (PJC) Inc. (The), Class 'A' 21,052 269 514..
Loblaw Cos. Ltd. 52,608 2,379 3,589..
Maple Leaf Foods Inc. 21,593 326 773..
Metro Inc., Class 'A' 60,520 487 2,436..
North West Co. Inc. (The) 13,285 233 399..
Premium Brands Holdings Corp. 7,016 370 724..
Saputo Inc. 57,623 604 2,603..
....
7,458 21,850 3.6%..x
Energy..
Advantage Oil & Gas Ltd. 50,555 697 273..
AltaGas Ltd. 45,353 1,347 1,298..
ARC Resources Ltd. 96,582 2,378 1,425..
Baytex Energy Corp. 57,693 1,522 218..
Birchcliff Energy Ltd. 60,502 631 266..
Cameco Corp. 108,367 1,274 1,258..
Canadian Natural Resources Ltd. 288,171 3,611 12,945..
Cenovus Energy Inc. 276,102 4,203 3,170..
CES Energy Solutions Corp. 65,915 388 430..
Crescent Point Energy Corp. 148,227 4,625 1,420..
Crew Energy Inc. 39,574 525 125..
Enbridge Inc. 448,375 14,914 22,042..
Enbridge Income Fund Holdings Inc. 31,354 875 935..
Encana Corp. 262,098 4,081 4,395..
Enerflex Ltd. 24,143 227 370..
Enerplus Corp. 65,844 2,801 811..
Ensign Energy Services Inc. 34,364 282 222..
Freehold Royalties Ltd. 25,813 421 363..
Gibson Energy Inc. 38,805 829 705..
Gran Tierra Energy Inc. 106,952 641 365..
Husky Energy Inc. 82,587 1,217 1,466..
Imperial Oil Ltd. 68,137 1,388 2,673..
Inter Pipeline Ltd. 98,446 2,488 2,563..
Kelt Exploration Ltd. 39,908 421 287..
Keyera Corp. 50,628 745 1,793..
MEG Energy Corp. 60,966 2,081 313..
Mullen Group Ltd. 28,380 680 447..
NexGen Energy Ltd. 76,102 269 244..
Nuvista Energy Ltd. 47,226 353 379..
Paramount Resources Ltd., Class 'A' 19,363 362 376..
Parex Resources Inc. 41,807 519 759..
Parkland Fuel Corp. 34,691 661 931..
Pason Systems Inc. 20,098 246 366..
Pembina Pipeline Corp. 134,394 3,325 6,116..
Peyto Exploration & Development Corp. 45,075 1,014 677..
PrairieSky Royalty Ltd. 55,621 1,694 1,783..
Precision Drilling Corp. 80,288 1,353 306..
Raging River Exploration Inc. 58,217 420 466..
Secure Energy Services Inc. 43,867 479 384..
Seven Generations Energy Ltd., Class 'A' 73,611 1,497 1,309..
ShawCor Ltd. 17,694 292 485..
Spartan Energy Corp. 43,061 385 310..
Suncor Energy Inc. 439,547 11,144 20,285
5

The accompanying notes are an integral part of these financial statements.
CIBC Canadian Index Fund
Schedule of Investment Portfolio As at December 31, 2017 (cont'd)
SecurityNumber
of Shares
AverageCost
($000s)
FairValue
($000s)
% ofNet
Assets..
TORC Oil & Gas Ltd. 35,489 393 268..
Tourmaline Oil Corp. 67,447 2,246 1,536..
TransCanada Corp. 232,842 8,555 14,245..
Trican Well Service Ltd. 92,261 361 376..
Vermilion Energy Inc. 32,224 1,231 1,472..
Whitecap Resources Inc. 100,839 1,124 903..
....
93,215 116,554 19.3%..x
Financials..
Alaris Royalty Corp. 9,948 339 206..
Bank of Montreal 172,168 7,041 17,318..
Bank of Nova Scotia 319,313 9,667 25,903..
Brookfield Asset Management Inc., Class 'A' 231,846 2,795 12,687..
Canadian Imperial Bank of Commerce 117,343 6,705 14,379..
Canadian Western Bank 24,122 301 947..
CI Financial Corp. 73,473 2,122 2,187..
ECN Capital Corp. 105,893 302 416..
Element Fleet Management Corp. 105,893 1,153 1,006..
Fairfax Financial Holdings Ltd. 7,429 2,609 4,973..
Genworth MI Canada Inc. 10,815 278 471..
Great-West Lifeco Inc. 73,876 1,598 2,593..
Home Capital Group Inc. 16,248 232 281..
Horizons S&P/TSX 60 Index ETF 117,127 3,691 3,921..
IGM Financial Inc. 22,390 489 989..
Industrial Alliance Insurance and Financial Services Inc. 28,182 669 1,686..
Intact Financial Corp. 36,991 1,650 3,884..
Laurentian Bank of Canada 10,352 383 585..
Manulife Financial Corp. 526,904 11,465 13,816..
National Bank of Canada 90,993 1,540 5,707..
Onex Corp. 21,859 486 2,015..
Power Corp. of Canada 97,846 1,764 3,167..
Power Financial Corp. 64,632 1,178 2,232..
Royal Bank of Canada 386,131 11,838 39,636..
Sun Life Financial Inc. 163,547 5,028 8,485..
Thomson Reuters Corp. 70,474 2,774 3,861..
TMX Group Ltd. 9,415 417 663..
Toronto-Dominion Bank (The) 489,666 11,497 36,064..
....
90,011 210,078 34.9%..x
Health Care..
Aphria Inc. 34,649 499 648..
Canopy Growth Corp. 45,533 482 1,354..
Chartwell Retirement Residences 52,365 358 851..
Extendicare Inc. 24,246 242 222..
Knight Therapeutics Inc. 27,613 275 230..
ProMetic Life Sciences Inc. 169,907 453 221..
Valeant Pharmaceuticals International Inc. 82,382 4,323 2,158..
....
6,632 5,684 0.9%..x
Industrials..
Aecon Group Inc. 15,708 269 313..
Air Canada 72,332 271 1,872..
ATS Automation Tooling Systems Inc. 20,529 283 319..
Badger Daylighting Ltd. 10,158 296 276..
Bombardier Inc., Class 'B' 529,162 3,939 1,603..
Boyd Group Income Fund 4,945 296 499..
CAE Inc. 73,515 570 1,717..
Canadian National Railway Co. 198,633 3,057 20,588..
Canadian Pacific Railway Ltd. 38,534 2,087 8,850..
Chorus Aviation Inc. 33,097 308 319..
Exchange Income Corp. 7,061 293 252..
Finning International Inc. 46,035 584 1,460..
Maxar Technologies Ltd. 14,929 707 1,208..
Morneau Shepell Inc. 14,567 271 325..
New Flyer Industries Inc. 13,190 393 712..
Ritchie Bros. Auctioneers Inc. 29,209 624 1,099..
Russel Metals Inc. 16,894 255 493..
SNC-Lavalin Group Inc. 47,161 979 2,691..
Stantec Inc. 31,198 467 1,097..
TFI International Inc. 23,744 280 780..
Toromont Industries Ltd. 19,869 222 1,095..
Transcontinental Inc., Class 'A' 17,218 224 428..
Waste Connections Inc. 70,675 3,554 6,301..
WestJet Airlines Ltd. 32,553 417 858..
Westshore Terminals Investment Corp. 15,312 373 403..
WSP Global Inc. 17,486 517 1,048..
....
21,536 56,606 9.4%..x
Information Technology..
BlackBerry Ltd. 131,232 3,487 1,842..
Celestica Inc. 33,356 1,312 440..
CGI Group Inc., Class 'A' 67,603 1,104 4,617..
Computer Modelling Group Ltd. 20,626 254 198..
Constellation Software Inc. 5,300 837 4,039..
Descartes Systems Group Inc. (The) 20,759 316 742
6

The accompanying notes are an integral part of these financial statements.
CIBC Canadian Index Fund
Schedule of Investment Portfolio As at December 31, 2017 (cont'd)
SecurityNumber
of Shares
AverageCost
($000s)
FairValue
($000s)
% ofNet
Assets..
Enghouse Systems Ltd. 5,083 258 313..
Kinaxis Inc. 6,389 306 491..
Mitel Networks Corp. 24,027 264 249..
Open Text Corp. 71,041 743 3,176..
Shopify Inc., Class 'A' 22,665 2,605 2,881..
Sierra Wireless Inc. 8,776 430 225..
....
11,916 19,213 3.2%..x
Materials..
Agnico Eagle Mines Ltd. 61,677 2,154 3,580..
Agrium Inc. 36,825 1,521 5,324..
Alacer Gold Corp. 79,961 571 178..
Alamos Gold Inc., Class 'A' 103,333 1,252 846..
B2Gold Corp. 261,679 774 1,015..
Barrick Gold Corp. 310,681 9,166 5,648..
Canfor Corp. 19,999 244 496..
Cascades Inc. 17,509 290 238..
CCL Industries Inc., Class 'B' 37,743 199 2,192..
Centerra Gold Inc. 58,202 555 375..
Chemtrade Logistics Income Fund 24,810 504 481..
Detour Gold Corp. 47,798 725 706..
Eldorado Gold Corp. 196,200 1,618 357..
Endeavour Mining Corp. 18,408 385 472..
First Majestic Silver Corp. 44,995 488 382..
First Quantum Minerals Ltd. 183,721 2,078 3,235..
Fortuna Silver Mines Inc. 39,927 279 262..
Franco-Nevada Corp. 49,360 2,011 4,959..
Goldcorp Inc. 230,851 5,873 3,701..
Guyana Goldfields Inc. 46,773 434 238..
Hudbay Minerals Inc. 64,680 767 720..
IAMGOLD Corp. 123,390 968 904..
Interfor Corp. 17,832 290 377..
Intertape Polymer Group Inc. 15,254 233 328..
Ivanhoe Mines Ltd., Class 'A' 142,925 276 606..
Kinder Morgan Canada Ltd. 27,383 460 466..
Kinross Gold Corp. 340,880 4,992 1,848..
Kirkland Lake Gold Ltd. 49,293 469 950..
Klondex Mines Ltd. 40,882 293 133..
Labrador Iron Ore Royalty Corp. 17,523 272 477..
Lucara Diamond Corp. 82,573 306 232..
Lundin Mining Corp. 172,472 1,622 1,442..
MAG Silver Corp. 19,210 322 298..
Methanex Corp. 23,086 372 1,758..
Nevsun Resource Ltd. 82,421 380 252..
New Gold Inc. 153,527 854 634..
Norbord Inc. 11,018 349 469..
NovaGold Resources Inc. 59,582 384 294..
OceanaGold Corp. 167,297 529 540..
Osisko Gold Royalties Ltd. 33,046 525 480..
Pan American Silver Corp. 41,683 747 816..
Potash Corp. of Saskatchewan Inc. 223,885 4,105 5,772..
Pretium Resources Inc. 40,856 494 586..
Sandstorm Gold Ltd. 41,684 297 262..
SEMAFO Inc. 88,940 425 318..
SSR Mining Inc. 32,692 606 362..
Stella-Jones Inc. 11,570 509 584..
Tahoe Resources Inc. 85,170 1,351 514..
Teck Resources Ltd., Class 'B' 135,182 2,252 4,443..
Torex Gold Resources Inc. 21,807 388 260..
Turquoise Hill Resources Ltd. 269,973 1,504 1,158..
West Fraser Timber Co. Ltd. 15,977 360 1,239..
Western Forest Products Inc. 108,272 262 265..
Wheaton Precious Metals Corp. 118,380 1,811 3,290..
Winpak Ltd. 8,365 400 392..
Yamana Gold Inc. 259,450 2,679 1,017..
....
63,974 69,171 11.5%..x
Real Estate..
Allied Properties REIT 24,713 535 1,040..
Altus Group Ltd. 9,406 264 347..
Artis REIT 41,013 420 578..
Boardwalk REIT 10,089 149 435..
Canadian Apartment Properties REIT 37,032 473 1,382..
Colliers International Group Inc. 8,881 172 674..
Cominar REIT 47,152 672 679..
CREIT 20,044 459 928..
Crombie REIT 23,971 305 331..
Dream Global REIT 46,656 425 570..
Dream Office REIT 19,126 483 424..
First Capital Realty Inc. 43,594 757 903..
FirstService Corp. 8,541 115 751..
Granite REIT, Stapled Units 12,889 481 635..
H&R REIT 77,853 1,491 1,663..
Killam Apartment REIT 21,434 304 305..
Northview Apartment REIT 12,852 314 321
7

The accompanying notes are an integral part of these financial statements.
CIBC Canadian Index Fund
Schedule of Investment Portfolio As at December 31, 2017 (cont'd)
SecurityNumber
of Shares
AverageCost
($000s)
FairValue
($000s)
% ofNet
Assets..
Pure Industrial Real Estate Trust 81,515 415 552..
RioCan REIT 89,041 1,576 2,169..
SmartCentres REIT 31,647 585 978..
Tricon Capital Group Inc. 35,637 381 412..
....
10,776 16,077 2.7%..x
Telecommunication Services..
BCE Inc. 239,710 8,195 14,474..
Rogers Communications Inc., Class 'B' 95,444 1,794 6,113..
TELUS Corp. 158,951 2,760 7,569..
....
12,749 28,156 4.7%..x
Utilities..
Algonquin Power & Utilities Corp. 113,199 1,111 1,592..
ATCO Ltd., Class 'I' 20,486 287 922..
Boralex Inc., Class 'A' 14,514 302 341..
Brookfield Infrastructure Partners L.P. 75,610 4,097 4,263..
Brookfield Renewable Partners L.P. 32,663 1,091 1,431..
Canadian Utilities Ltd., Class 'A' 32,895 491 1,231..
Capital Power Corp. 27,978 693 685..
Emera Inc. 56,700 1,597 2,664..
Fortis Inc. 111,720 3,401 5,151..
Hydro One Ltd. 77,749 1,850 1,742..
Innergex Renewable Energy Inc. 26,065 275 375..
Northland Power Inc. 31,003 454 724..
Superior Plus Corp. 39,110 668 464..
TransAlta Corp. 78,827 1,456 587..
TransAlta Renewables Inc. 31,291 381 419..
....
18,154 22,591 3.7%..
..
TOTAL CANADIAN EQUITIES 350,551 598,374 99.3%..x
INTERNATIONAL EQUITIES..
Bermuda..
Brookfield Business Partners L.P. 10,729 397 465..
....
397 465 0.1%..x
United States..
Brookfield Property Partners L.P. 56,276 1,088 1,567..
....
1,088 1,567 0.2%..
..
TOTAL INTERNATIONAL EQUITIES 1,485 2,032 0.3%..
..
TOTAL EQUITIES 352,036 600,406 99.6%..
..
TOTAL INVESTMENTS BEFORE SHORT-TERM INVESTMENTS 352,036 600,406 99.6%..
SecurityCoupon
Rate (%)Maturity
Date Additional Details Par Value
AverageCost
($000s)
FairValue
($000s)
% ofNet
Assetsx
SHORT-TERM INVESTMENTS (note 11)..
Government of Canada 0.88% 2018/03/08 Treasury Bill 600,000 599 599..
Royal Bank of Canada 1.43% 2018/01/02 Term Deposit 825,000 825 825..
..
..
TOTAL SHORT-TERM INVESTMENTS 1,424 1,424 0.2%..
..
Less: Transaction costs included in average cost (117).
..
..
TOTAL INVESTMENTS 353,343 601,830 99.8%..
..
Margin 55 0.0%..
Derivative assets 2 0.0%..
Other Assets, less Liabilities 916 0.2%..
..
..
TOTAL NET ASSETS ATTRIBUTABLE TO HOLDERS OFREDEEMABLE UNITS 602,803 100.0%
.
...
x
x
Schedule of Derivative Assets and Liabilities - Futures Contracts (note 11)
ContractedValue ($) Name of Future Expiry Date
Number ofContracts Currency
ContractedPrice
FairValue ($)
Unrealized Gain(Loss) ($000s)
x..
572,412 S&P/TSX 60 Index March 2018 3 CAD 954.02 574,440 2......
572,412 Derivative Assets and Liabilities - Futures 574,440 2..
..
As at December 31, 2017, $54,935 cash was deposited as margin for the futures contracts.
8
The accompanying notes are an integral part of these financial statements.
CIBC Canadian Index Fund
Supplemental Schedule to Schedule of Investment Portfolio
Offsetting Arrangements (note 2d)
The Fund may enter into various master netting arrangements or other similar agreements that do not meet the criteria for offsetting in the Statements of Financial Position but still allowfor the related amounts to be set off in certain circumstances, such as bankruptcy or the termination of the contracts.
As at December 31, 2017 and 2016, the Fund did not enter into any arrangements whereby the financial instruments were eligible for offset.
Interests in Underlying Funds (note 4)
As at December 31, 2017 and 2016, the Fund had no investments in underlying funds where the ownership exceeded 20% of each underlying fund.
9

The accompanying notes are an integral part of these financial statements.
CIBC Canadian Index Fund
Financial Instrument RisksInvestment Objective: CIBC Canadian Index Fund (the Fund) seeks to provide long-termgrowth through capital appreciation. The Fund is managed to obtain a return thatapproximates the performance of the S&P/TSX Composite Index, which is intended torepresent the Canadian equity market and includes the largest companies listed on theTSX.
Investment Strategies: The Fund uses passive management strategies to create aportfolio with characteristics similar to the S&P/TSX Composite Index, allowing the Fundto obtain a return that approximates the performance of that index.
Significant risks that are relevant to the Fund are discussed here. General information onrisk management and specific discussion on concentration, credit, currency, interest rate,liquidity, and other price/market risk can be found in note 2 of the financial statements.
In the following risk tables, Net Assets is defined as meaning “Net assets attributable toholders of redeemable units".
Concentration Risk as at December 31, 2017 and 2016The Schedule of Investment Portfolio presents the securities held by the Fund as atDecember 31, 2017.The following table presents the investment sectors held by the Fund as at December 31,2016 and groups the securities by asset type, industry sector, geographic region, orcurrency exposure:
As at December 31, 2016
Portfolio Breakdown% of Net
Assetsx
x
Canadian Equitiesx
Consumer Discretionary 4.9x
Consumer Staples 3.7x
Energy 21.0x
Financials 35.0x
Health Care 0.6x
Industrials 8.7x
Information Technology 2.7x
Materials 11.5x
Real Estate 2.7x
Telecommunication Services 4.7x
Utilities 2.8x
International Equitiesx
United States 0.3x
Short-Term Investments 1.1x
Other Assets, less Liabilities 0.3xxx
Total 100.0xx
Credit RiskCredit ratings represent a consolidation of the ratings provided by various outside serviceproviders and are subject to change, which could be material.
See the Schedule of Investment Portfolio for counterparties related to over-the-counterderivative contracts, where applicable.
As at December 31, 2017 and 2016, the Fund invested in debt securities with thefollowing credit ratings:
.
% of Net Assets
Debt Securities by Credit Rating (note 2b) December 31, 2017 December 31, 2016x
x
'AAA' 0.1 1.1x
'AA' 0.1 –xxx
Total 0.2 1.1xx
Currency RiskThe tables that follow indicate the currencies to which the Fund had significant exposureas at December 31, 2017 and 2016, based on the market value of the Fund's financialinstruments (including cash and cash equivalents) and the underlying principal amountsof forward foreign currency contracts, as applicable.
As at December 31, 2017
Currency (note 2m)Total Currency
Exposure* ($000s)% of
Net Assetsx
x
USD 85 –xxx
* Amounts reflect the carrying value of monetary and non-monetary items (including the notionalamount of forward foreign currency contracts, if any).
As at December 31, 2016
Currency (note 2m)Total Currency
Exposure* ($000s)% of
Net Assetsx
x
USD 146 0.03xxx
* Amounts reflect the carrying value of monetary and non-monetary items (including the notionalamount of forward foreign currency contracts, if any).
The table that follows indicates how net assets as at December 31, 2017 and 2016 wouldhave decreased or increased had the Canadian dollar strengthened or weakened by 1%in relation to all foreign currencies. This analysis assumes that all other variables remainunchanged. In practice, the actual results may differ from this analysis and the differencecould be material.
December 31, 2017 December 31, 2016x
x
Impact on Net Assets ($000s) 1 1xx
Interest Rate RiskAs at December 31, 2017 and 2016, the majority of the Fund’s financial assets andliabilities are non-interest bearing and short-term in nature; accordingly, the Fund is notsubject to significant amounts of risk due to fluctuations in the prevailing levels of marketinterest rates.
Liquidity RiskLiquidity risk is the risk that the Fund will encounter difficulty in meeting obligationsassociated with financial liabilities. The Fund is exposed to daily cash redemptions ofredeemable units. The Fund maintains sufficient cash on hand to fund anticipatedredemptions.
With the exception of derivative contracts, where applicable, all of the Fund’s financialliabilities are short-term liabilities maturing within 90 days after the period end.
For funds that hold derivative contracts with a term-to-maturity that exceeds 90 days fromthe period end, further information related to those contracts can be referenced in thederivative schedules following the Schedule of Investment Portfolio.
Other Price/Market RiskThe table that follows indicates how net assets as at December 31, 2017 and 2016 wouldhave increased or decreased had the value of the Fund’s benchmark(s) increased ordecreased by 1%. This change is estimated based on the historical correlation betweenthe return of Class A units of the Fund as compared to the return of the Fund’sbenchmark(s), using 36 monthly data points, as available, based on the monthly netreturns of the Fund. This analysis assumes that all other variables remain unchanged. Thehistorical correlation may not be representative of the future correlation and, accordingly,the impact on net assets could be materially different.
x
Impact on Net Assets ($000s)
Benchmark December 31, 2017 December 31, 2016x
x
S&P/TSX Composite Index 5,998 5,485xx
Fair Value Measurement of Financial InstrumentsThe following is a summary of the inputs used as at December 31, 2017 and 2016 invaluing the Fund’s financial assets and financial liabilities, carried at fair value:
As at December 31, 2017Level 1 (i) Level 2 (ii) Level 3 (iii) Total
Classification ($000s) ($000s) ($000s) ($000s)xx
Financial Assetsx
Short-Term Investments – 1,424 – 1,424x
Equities 600,406 – – 600,406x
Derivative assets 2 – – 2xxx
Total Financial Assets 600,408 1,424 – 601,832xx
x
(i) Quoted prices in active markets for identical assetsx
(ii) Significant other observable inputsx
(iii) Significant unobservable inputs
10

The accompanying notes are an integral part of these financial statements.
CIBC Canadian Index Fund
As at December 31, 2016Level 1 (i) Level 2 (ii) Level 3 (iii) Total
Classification ($000s) ($000s) ($000s) ($000s)xx
Financial Assetsx
Short-Term Investments – 5,793 – 5,793x
Equities 543,745 – – 543,745xxx
Total Financial Assets 543,745 5,793 – 549,538xx
x
Financial Liabilitiesx
Derivative liabilities (9) – – (9)xxx
Total Financial Liabilities (9) – – (9)xx
x
Total Financial Assets and Liabilities 543,736 5,793 – 549,529xx
x
(i) Quoted prices in active markets for identical assetsx
(ii) Significant other observable inputsx
(iii) Significant unobservable inputs
Transfer of assets between Level 1 and Level 2Financial assets and liabilities transferred from Level 1 to Level 2 are the result ofsecurities no longer being traded in an active market.
For the periods ended December 31, 2017 and 2016, there were no transfers of financialassets and liabilities from Level 1 to Level 2.
Financial assets and liabilities transferred from Level 2 to Level 1 are the result ofsecurities now being traded in an active market.
For the periods ended December 31, 2017 and 2016, there were no transfers of financialassets and liabilities from Level 2 to Level 1.
Reconciliation of financial asset and liability movement – Level 3The Fund did not hold any Level 3 investments at the beginning of, during, or at the end ofeither reporting period.
11

Notes to Financial Statements
x
As at and for the periods as disclosed in the financial statements (see note 1)
1. Organization of the Funds and Financial Reporting Periods
Each of the CIBC Mutual Funds and CIBC Family of Portfolios (individually, a Fund, and collectively, the Funds) is a mutual fund trust organized under the laws of Ontario and governed by a declaration of trust(Declaration of Trust). The address of the Funds’ registered office is 18 York Street, Suite 1300, Toronto, Ontario.
CIBC Securities Inc. is the principal distributor, Canadian Imperial Bank of Commerce (CIBC) is the manager (the Manager), and CIBC Trust Corporation is the trustee (the Trustee) of the Funds.
Each Fund is permitted to have an unlimited number of classes of units and may issue an unlimited number of units of each class. In the future, the offering of any classes of units of a Fund may be terminated oradditional classes of units may be offered. The following table indicates the classes of units offered for sale by each of the Funds, as at the date of these financial statements:x
Funds Class A Class T4 Class T6 Class T8PremiumClass Class D Class F
InstitutionalClass Class O
xx
CIBC Canadian T-Bill Fund ü üx
CIBC Money Market Fund ü ü üx
CIBC U.S. Dollar Money Market Fund ü ü üx
CIBC Short-Term Income Fund ü ü üx
CIBC Canadian Bond Fund ü ü üx
CIBC Monthly Income Fund ü üx
CIBC Global Bond Fund ü üx
CIBC Global Monthly Income Fund ü üx
CIBC Balanced Fund üx
CIBC Dividend Income Fund ü üx
CIBC Dividend Growth Fund ü üx
CIBC Canadian Equity Fund ü üx
CIBC Canadian Equity Value Fund ü üx
CIBC Canadian Small-Cap Fund üx
CIBC U.S. Equity Fund ü üx
CIBC U.S. Small Companies Fund ü üx
CIBC Global Equity Fund üx
CIBC International Equity Fund ü üx
CIBC European Equity Fund ü üx
CIBC Emerging Markets Fund ü üx
CIBC Asia Pacific Fund ü üx
CIBC Latin American Fund üx
CIBC International Small Companies Fund üx
CIBC Financial Companies Fund üx
CIBC Canadian Resources Fund ü üx
CIBC Energy Fund ü üx
CIBC Canadian Real Estate Fund ü üx
CIBC Precious Metals Fund ü üx
CIBC Global Technology Fund üx
CIBC Canadian Short-Term Bond Index Fund ü ü ü üx
CIBC Canadian Bond Index Fund ü ü ü üx
CIBC Global Bond Index Fund ü ü ü üx
CIBC Balanced Index Fund ü ü üx
CIBC Canadian Index Fund ü ü ü üx
CIBC U.S. Broad Market Index Fund ü ü ü üx
CIBC U.S. Index Fund ü ü ü üx
CIBC International Index Fund ü ü ü üx
CIBC European Index Fund ü ü üx
CIBC Emerging Markets Index Fund ü ü ü üx
CIBC Asia Pacific Index Fund ü ü ü üx
CIBC Nasdaq Index Fund ü ü üx
CIBC Managed Income Portfolio ü ü üx
CIBC Managed Income Plus Portfolio ü ü üx
CIBC Managed Balanced Portfolio ü ü ü üx
CIBC Managed Monthly Income BalancedPortfolio ü ü üx
CIBC Managed Balanced Growth Portfolio ü ü ü üx
CIBC Managed Growth Portfolio ü ü ü üx
CIBC Managed Aggressive Growth Portfolio ü ü ü üx
CIBC U.S. Dollar Managed Income Portfolio ü ü üx
CIBC U.S. Dollar Managed Balanced Portfolio ü ü ü üx
CIBC U.S. Dollar Managed Growth Portfolio ü ü ü ü
12

p / 2 Notes to Financial Statements
x
Funds Class A Class T4 Class T6 Class T8 Premium Class Class D Class F Institutional Class Class Ox
CIBC Conservative Passive Portfolio ü ü ü üx
CIBC Balanced Passive Portfolio ü ü ü üx
CIBC Balanced Growth Passive Portfolio ü ü ü üx
Each class of units may charge a different management fee. Operating expenses can be either common or class-specific. Class-specific expenses are allocated on a class-by-class basis. As a result, a separate net assetvalue per unit is calculated for each class of units.
Class A units are available to all investors on a no-load basis with a minimum investment of $500, except for the CIBC Conservative Passive Portfolio, CIBC Balanced Passive Portfolio and CIBC Balanced GrowthPassive Portfolio (Passive Portfolios), which is $5,000. Investors may have to pay a short-term trading fee if applicable.
Class T4, T6, and T8 units have the same characteristics as Class A units, except that they each intend to pay a fixed distribution amount per unit, which also results in a separate net asset value per unit for each class,and may have different minimum investment requirements.
Class D units are available to investors who have accounts with CIBC Investor’s Edge (a division of CIBC Investor Services Inc.) or other discount brokers with a minimum investment of $500.
Class F units are available, subject to a minimum investment of $5,000, to investors participating in programs that do not require the payment of sales charges by investors and do not require the payment of service ortrailing commissions to dealers. For these investors, we “unbundle” the typical distribution costs and charge a lower management fee. Potential investors include clients of “fee-for-service” investment advisors,dealer-sponsored “wrap accounts”, and others who pay an annual fee to their dealer instead of transactional sales charges and where the dealer does not receive service fees or trailing commissions from us.
Premium Class units are available to investors on a no-load basis with a minimum investment of $100,000 for CIBC Canadian T-Bill Fund and CIBC Money Market Fund, US$100,000 for CIBC U.S. Dollar Money MarketFund, $50,000 for CIBC Short-Term Income Fund, CIBC Canadian Bond Fund, CIBC Canadian Short-Term Bond Index Fund, CIBC Canadian Bond Index Fund, CIBC Global Bond Index Fund, CIBC Balanced Index Fund,CIBC Canadian Index Fund, CIBC U.S. Broad Market Index Fund, CIBC U.S. Index Fund, CIBC International Index Fund, CIBC European Index Fund, CIBC Emerging Markets Index Fund, CIBC Asia Pacific Index Fund, andCIBC Nasdaq Index Fund, and US$50,000 for the U.S. dollar purchase option of CIBC U.S. Broad Market Index Fund and CIBC Nasdaq Index Fund. Management fees charged in respect of Premium Class units are lowerthan those charged in respect of Class A units.
Institutional Class units are available to investors with a minimum investment of $50,000. Institutional Class units are available to investors participating in programs that do not require the payment of sales charges byinvestors and do not require the payment of service or trailing commissions to dealers, and others who pay an annual fee to their dealer. For these investors, we “unbundle” the typical distribution costs and charge alower management fee. Potential investors include institutional clients, clients of “fee-for-service” investment advisors, dealer sponsored “wrap accounts”, and others who pay an annual fee to their dealer instead oftransactional sales charges and where the dealer does not receive service fees or trailing commissions from the Manager.
Class O units are only available to certain investors who have been approved by and have entered into a Class O unit account agreement with the Manager or whose dealer or discretionary manager offers separatelymanaged accounts or similar programs and has entered into a Class O unit account agreement with the Manager. These investors are typically financial services companies, including the Manager, that use Class Ounits of a fund to facilitate offering other products to investors. No management fees or operating expenses are charged to a fund in respect of Class O units; instead, a negotiated management fee is charged by theManager directly to, or as directed by, Class O unitholders or dealers and discretionary managers on behalf of unitholders.
The date upon which each Fund was established by Declaration of Trust (Date Established) and the date upon which each class of units of each Fund was first sold to the public (Inception Date) are reported in footnoteOrganization of the Fund on the Statements of Financial Position.
The Schedule of Investment Portfolio of each of the Funds is as at December 31, 2017. The Statements of Financial Position of each of the Funds are as at December 31, 2017 and 2016. The Statements ofComprehensive Income, Statements of Changes in Net Assets Attributable to Holders of Redeemable Units, and the Statements of Cash Flows of each of the Funds are for the annual periods ended December 31,2017 and 2016, except for Funds or classes established during either period, in which case the information presented is from the Date Established or the Inception Date to December 31, 2017 or 2016.
These financial statements were approved for issuance by the Manager on March 1, 2018.
2. Summary of Significant Accounting Policies
These financial statements have been prepared in accordance with International Financial Reporting Standards (IFRS) as published by the International Accounting Standards Board (IASB).
The financial statements have been prepared on a going concern basis using the historical cost convention. However, each Fund is an investment entity and primarily all financial assets and financial liabilities aremeasured at fair value in accordance with IFRS. Accordingly, the Funds’ accounting policies for measuring the fair value of investments and derivatives are consistent with those used in measuring the Net Asset Valuefor transactions with unitholders. In applying IFRS, these financial statements include estimates and assumptions made by management that affect the reported amounts of assets, liabilities, income, and expensesduring the reporting periods. However, existing circumstances and assumptions may change due to market changes or circumstances arising beyond the control of the Funds. Such changes are reflected in theassumptions when they occur.
These financial statements have been presented in Canadian dollars, which is the Funds’ functional currency (unless otherwise noted).
a) Financial Instruments
Classification and recognition of financial instruments
In accordance with IAS 39 Financial Instruments: Recognition and Measurement, financial assets and financial liabilities are classified at initial recognition into the following categories:
Financial assets and liabilities at fair value through profit or loss (“FVTPL”)
This category is sub-divided into:
l Financial instruments classified as Held For Trading: Financial assets and liabilities are classified as Held For Trading if they are acquired for the purpose of selling and/or repurchasing in the near term, andare acquired principally for the purpose of generating a profit from short-term fluctuations in price. Derivatives and securities sold short held by the Funds are classified as Held For Trading and do not meetthe definition of effective hedging instruments as defined by IAS 39.
l Financial instruments designated as FVTPL through inception: All investments held by the Funds, excluding those classified as Held For Trading (discussed above), are designated as fair value through profitor loss upon initial recognition. These financial assets are designated upon initial recognition on the basis that they are part of a group of financial assets that are managed and have their performanceevaluated on a fair value basis, in accordance with risk management and investment strategies of the Funds, as set out in the Funds’ prospectus.
Loans and receivables
The Funds include in this category receivable balances relating to portfolio investments and other short-term receivables such as receivable for units issued.
Other financial liabilities
This category includes all financial liabilities, other than those classified as fair value through profit or loss. The Funds include in this category amounts relating to payables for portfolio securities purchased and otheraccrued liabilities such as payable for units redeemed and distributions payable to holders of redeemable units.
All Funds have contractual obligations to distribute cash to the unitholders. As a result, each Fund's obligation for net assets attributable to holders of redeemable units represents a financial liability and is presentedat the redemption amount.
b) Risk Management
The Funds’ overall risk management approach includes formal guidelines that govern the extent of exposure to various types of risk, including diversification within asset classes and limits on the exposure to individualinvestments and counterparties. In addition, derivative financial instruments may be used to manage certain risk exposures. The Manager also has various internal controls to oversee the Funds’ investment activities,including monitoring compliance with the investment objectives and strategies, internal guidelines, and securities regulations. Please refer to each Fund’s Supplemental Schedule to Schedule of Investment Portfolio forspecific risk disclosures.
13

Notes to Financial Statements p / 3
Fair value of financial instruments by using valuation techniques
Financial instruments are valued at their fair value which is defined as the price that would be received to sell an asset or paid to transfer a liability in an orderly transaction between market participants at themeasurement date. Refer to notes 3a to 3f for valuation of each specific type of financial instrument held by the Funds. The fair value of financial assets and liabilities traded in active markets are based on quotedmarket prices at the close of trading on the reporting date. The Funds use the last traded market price for both financial assets and financial liabilities where the last traded price falls within that day’s bid-ask spread.In circumstances where the last traded price is not within the bid-ask spread, the Manager determines the price that is most representative of fair value based on the specific facts and circumstances.
For financial assets and financial liabilities that are not traded in an active market, fair value is determined using valuation techniques.
The Funds classify fair value measurement within a hierarchy which gives the highest priority to unadjusted quoted prices in active markets for identical assets or liabilities (Level 1) and the lowest priority tounobservable inputs (Level 3). The three levels of the fair value hierarchy are:
Level 1: Quoted prices (unadjusted) in active markets for identical assets or liabilities that the entity can access at the measurement date;
Level 2: Inputs other than quoted prices included within Level 1 that are observable for the asset or liability, either directly or indirectly; and
Level 3: Inputs are unobservable for the asset or liability.
If inputs are used to measure an asset’s or liability’s fair value, the classification within the hierarchy is based on the lowest level input that is significant to the fair value measurement. Each Fund’s fair value hierarchyclassification of its assets and liabilities is included in the Supplemental Schedule to Schedule of Investment Portfolio.
The carrying values of all non-investment assets and liabilities approximate their fair values due to their short-term nature. Fair values are classified as Level 1 when the related security or derivative is actively tradedand a quoted price is available. If an instrument classified as Level 1 subsequently ceases to be actively traded, it is transferred out of Level 1. In such cases, instruments are reclassified into Level 2, unless themeasurement of its fair value requires the use of significant unobservable inputs, in which case it is classified as Level 3.
The Manager is responsible for performing the fair value measurements included in the financial statements of a Fund, including the Level 3 measurements. The Manager obtains pricing from third-party pricingvendors and the pricing is reviewed daily. At each financial reporting date, the Manager reviews and approves all Level 3 fair value measurements. The Funds also have a Valuation Committee which meets quarterly toperform detailed reviews of the valuations of investments held by the Funds, which includes discussion on Level 3 measurements.
Credit risk
Credit risk is the risk that a counterparty to a financial instrument, such as a fixed income security or a derivative contract, will fail to discharge an obligation or commitment that it has entered into with the Funds. Thevalue of fixed income securities and derivatives as presented on the Schedule of Investment Portfolio includes consideration of the creditworthiness of the issuer and, accordingly, represents the maximum credit riskexposure of the Funds. Certain Funds may invest in short-term fixed income securities issued or guaranteed primarily by the Government of Canada or, any Canadian provincial or Canadian municipal government,obligations of Canadian chartered banks or trust companies, and commercial paper with approved credit ratings. The risk of default on these short-term fixed income securities is considered low and these securitiesprimarily have credit ratings of ‘A-1 (Low)’ or higher (as rated by S&P Global Ratings, a division of S&P Global, or equivalent rating from another rating service).
The bond ratings noted in the Funds’ ‘Financial Instruments Risk’ under sub-section ‘Credit Risk’ represent ratings collected and disseminated by recognized third party vendors. These ratings utilized by the Manager,while obtained from vendors skilled and recognized for bond rating services, may not be the same as those used directly by the portfolio advisor or portfolio sub-advisors. Ratings used by the portfolio advisor orportfolio sub-advisors could be higher or lower than those used for risk disclosure in the financial statements in compliance with their investment policy guidelines.
The Funds may engage in securities lending transactions. The credit risk related to securities lending transactions is limited by the fact that the value of cash or securities held as collateral by the Funds in connectionwith these transactions is at least 102% of the fair value of the securities loaned. The collateral and loaned securities are marked to market on each business day. Further information regarding the collateral andsecurities on loan can be found in the footnotes to the Statements of Financial Position and in note 2j.
Currency risk
Currency risk is the risk that the value of an investment will fluctuate due to changes in foreign exchange rates. Mutual funds may invest in securities denominated or traded in currencies other than the Funds’reporting currency.
Interest rate risk
Prices of fixed income securities generally increase when interest rates decline and decrease when interest rates rise. This risk is known as interest rate risk. Prices of longer-term fixed income securities will generallyfluctuate more in response to interest rate changes than would shorter-term securities. Due to the nature of short-term fixed income securities with a remaining term-to-maturity of less than one year, theseinvestments are not generally exposed to a significant risk that their value will fluctuate in response to changes in the prevailing levels of market interest rates.
Liquidity risk
The Funds are exposed to daily cash redemptions of redeemable units. Generally, the Funds retain sufficient cash and cash equivalent positions to maintain adequate liquidity. However, liquidity risk also involves theability to sell an asset for cash easily and at a fair price. Some securities are illiquid due to legal restrictions on their resale, the nature of the investment, or simply a lack of interested buyers for a particular security orsecurity type. Certain securities may become less liquid due to changes in market conditions, such as interest rate changes or market volatility, which could impair the ability of a Fund to sell such securities quickly or ata fair price. Difficulty in selling securities could result in a loss or a lower return for a Fund.
Other price/market risk
Other price/market risk is the risk that the value of investments will fluctuate as a result of changes in market conditions. Several factors can influence market trends, such as economic developments, changes ininterest rates, political changes, and catastrophic events. All investments are exposed to other price/market risk.
c) Investment Transactions, Income Recognition, and Recognition of Realized and Unrealized Gains and Losses
i) Interest for distribution purposes shown on the Statements of Comprehensive Income represents the coupon interest received by the Fund accounted for on an accrual basis. The Funds do not amortizepremiums paid or discounts received on the purchase of fixed income securities except for zero coupon bonds, which are amortized on a straight-line basis.
ii) Dividend income is recorded on the ex-dividend date.
iii) Investment transactions are recorded on a trade date basis. Securities that are exchange-traded are recorded at fair value established by the last traded market price when that price falls within that day’sbid-ask spread. Debt securities are recorded at fair value, established by the last traded price on the over-the-counter market (OTC) when that price falls within that day’s bid-ask spread. In circumstanceswhere the last traded price is not within the bid-ask spread, the Manager determines the price that is most representative of fair value based on the specific facts and circumstances. Gold bullion recordedat fair value established by the last traded market price when the price falls within that day’s bid-ask spread. Unlisted securities are recorded at fair value using fair valuation techniques established by theManager in establishing a fair value.
iv) Realized gains and losses on investments and unrealized appreciation or depreciation of investments are calculated using the average cost, excluding transaction costs, of the related investments.
v) Investment income is the sum of income paid to the fund that is generated from a fund’s investment fund holdings.
vi) Other income is the sum of income, excluding transaction costs, other than that which is separately classified on the Statements of Comprehensive Income.
d) Offsetting
Financial assets and liabilities are offset and the net amount reported in the Statements of Financial Position, if there is a currently enforceable legal right to offset the recognized amounts and there is an intention tosettle on a net basis, or to realize the asset and settle the liability simultaneously.
Where applicable, additional information can be found in the table Offsetting Arrangements as part of the Supplemental Schedule to Schedule of Investment Portfolio. This supplemental schedule discloses the OTCderivatives which are subject to offsetting.
14
p / 4 Notes to Financial Statements
e) Portfolio Securities
The cost of securities of a Fund is determined in the following manner: securities are purchased and sold at a market-traded price to arrive at a value for the position traded. The total purchased value represents thetotal cost of the security to the Fund. When additional units of the same security are purchased, the cost of those additional units is added to the total security cost. When units of the same security are sold, theproportionate cost of the units of the security sold is deducted from the total security cost. If there is a return of capital paid by a security, the amount of this return of capital is deducted from the total security cost.This method of tracking security cost is known as “average cost” and the current total for any one security is referred to as the “adjusted cost base” or “ACB” of the security. Transaction costs incurred in portfoliotransactions are excluded from the average cost of investments and are recognized immediately in Increase (Decrease) in Net Assets Attributable to Holders of Redeemable Units and are presented as a separateexpense item in the financial statements.
The difference between the fair value of securities and their average cost, excluding transaction costs, represents the unrealized appreciation (depreciation) in value of the portfolio investments. The applicable periodchange in unrealized appreciation (depreciation) of investments is included on the Statements of Comprehensive Income.
Short-term investments on the Schedule of Investment Portfolio are presented at their amortized cost which approximates the fair value. Accrued interest for bonds is disclosed separately on the Statements ofFinancial Position.
f) Foreign Exchange
The value of investments and other assets and liabilities denominated in foreign currencies is translated into Canadian dollars, which is the Funds’ functional and presentation currency (except for CIBC U.S. DollarMoney Market Fund, CIBC U.S. Dollar Managed Income Portfolio, CIBC U.S. Dollar Managed Balanced Portfolio, and CIBC U.S. Dollar Managed Growth Portfolio, which are valued in U.S. dollars) at the current ratesprevailing on each valuation date.
Purchases and sales of investments, income, and expenses are translated into Canadian dollars, which is the Funds’ functional and presentation currency (with the exception of the above-mentioned Funds which arevalued in U.S. dollars) at the foreign exchange rates prevailing on the dates of such transactions. Foreign currency translation gains (losses) on investments and income transactions are included in Net realized gain(loss) on foreign currency and in Income, respectively, on the Statements of Comprehensive Income.
g) Forward Foreign Currency Contracts
The Funds may enter into forward foreign currency contracts for either hedging or non-hedging purposes where such activity is consistent with their investment objectives and as permitted by the Canadian securitiesregulatory authorities.
Changes in the fair value of forward foreign currency contracts are included in derivative assets or derivative liabilities on the Statements of Financial Position, and are recorded as an Increase (decrease) in unrealizedappreciation (depreciation) of investments and derivatives during the applicable period on the Statements of Comprehensive Income.
The gain or loss arising from the difference between the value of the original forward foreign currency contract and the value of such contract at close or delivery is realized and recorded as Net realized gain (loss) onforeign currency for Funds that use the forward foreign currency contracts for hedging, or as Derivative income (loss) from forward foreign currency contracts for Funds that do not use the forward foreign currencycontracts for hedging.
h) Futures Contracts
The margin deposits with brokers relating to futures contracts are included in Margin on the Statements of Financial Position. Any change in the margin requirement is settled daily and included in Receivable forportfolio securities sold or Payable for portfolio securities purchased on the Statements of Financial Position.
Any difference between the settlement value at the close of business on each valuation date and the settlement value at the close of business on the previous valuation date is recorded as Derivative income (loss)from futures contracts on the Statements of Comprehensive Income.
i) Options
Premiums paid for purchased call and put options are included in derivative assets and subsequently measured at fair value on the Statements of Financial Position. When a purchased option expires, the Fund willrealize a loss in the amount of the cost of the option. For a closing transaction, the Fund will realize a gain or loss depending on whether the proceeds are greater or less than the premium paid at the time of purchase.When a purchased call option is exercised, the cost of the security purchased is increased by the premium paid at the time of purchase.
Premiums received from writing options are included in derivative liabilities and subsequently measured at fair value on the Statements of Financial Position as initial reductions in the value of investments. Premiumsreceived from writing options that expire unexercised are recorded as realized gains and reported as Net gain (loss) on sale of investments and derivatives on the Statements of Comprehensive Income. For a closingtransaction, if the cost of closing the transaction exceeds the premium received, the Fund will record a realized loss or, if the premium received at the time the option was written is greater than the amount paid, theFund will record a realized gain and is reported as Net gain (loss) on sale of investments and derivatives. If a written put option is exercised, the cost for the security delivered is reduced by the premiums received at thetime the option was written.
j) Securities Lending
A Fund may lend portfolio securities in order to earn additional revenue, which is disclosed on the Statements of Comprehensive Income. The loaned assets of any one Fund are not permitted to exceed 50% of thefair value of the assets of that Fund (excluding collateral debt for the loaned securities). The minimum allowable collateral is 102% of the fair value of the loaned securities as per the requirements of NationalInstrument 81-102 – Investment Funds. Collateral can consist of the following:
i) Cash.
ii) Qualified securities.
iii) Irrevocable letters of credit issued by a Canadian financial institution that is not the counterparty, or an affiliate counterparty, of the fund in the transaction, if evidences of indebtedness of the Canadianfinancial institution that are rated as short-term debt by an approved credit rating organization have an approved credit rating.
iv) Securities that are immediately convertible into securities of the same issuer, class, or type, and the same term, as the securities loaned.
The fair value of the loaned securities is determined on the close of any valuation date and any additional required collateral is delivered to the Fund on the next business day. The securities on loan continue to beincluded on the Schedule of Investment Portfolio and are included in the total value on the Statements of Financial Position in Investments (non-derivative financial assets) at fair value. Where applicable, a Fund’ssecurities lending transactions are reported in footnote Securities Lending on the Statements of Financial Position.
National Instrument 81-106 – Investment Fund Continuous Disclosure requires a reconciliation of the gross income amount generated from the securities lending transactions of the Funds to the revenue fromsecurities lending disclosed in the Funds’ Statements of Comprehensive Income. The gross amount generated from securities lending includes interest paid on collateral, withholding taxes deducted, the fees paid tothe Funds’ lending agent and the securities lending revenue received by the Funds. Where applicable, the reconciliation can be found in the footnotes to the Funds’ Statements of Comprehensive Income.
k) Multi-Class Structured Funds
The realized and unrealized capital gains or losses, income, and common expenses (other than class-specific operating expenses and management fees) of the Fund are allocated on each valuation date to theunitholders in proportion to the respective prior day’s net asset value, which includes unitholder trades dated for that day, of each class of units at the date on which the allocation is made. All class-specific operatingexpenses and management fees do not require allocation. All class-specific operating expenses are paid by the Manager and are collected from the Funds on a recoverable basis.
l) Loans and Receivables, Other Assets and Liabilities
Loans and Receivables, other assets and liabilities (other than those classified as FVTPL) are recorded at cost, which approximates their fair value, with the exception of net assets attributable to holders of redeemableunits which are presented at the redemption value.
15

Notes to Financial Statements p / 5
m) Legend of Abbreviations
The following is a list of abbreviations (foreign currency translation and others) that may be used on the Schedule of Investment Portfolio:
x
Currency Abbreviations
x..
AED – United Arab Emirates Dirham KRW – South Korean Won..
ARS – Argentine Peso MAD – Morocco Dirham..
AUD – Australian Dollar MXN – Mexican Peso..
BRL – Brazilian Real MYR – Malaysian Ringgit..
CAD – Canadian Dollar NOK – Norwegian Krone..
CHF – Swiss Franc NZD – New Zealand Dollar..
CLP – Chilean Peso PEN – Peruvian Nuevo Sol..
CNY – Chinese Renminbi PHP – Philippine Peso..
COP – Colombian Peso PKR – Pakistan Rupee..
CZK – Czech Koruna PLN – Polish Zloty..
DKK – Danish Krone QAR – Qatari Riyal..
EGP – Egyptian Pound RUB – Russian Ruble..
EUR – Euro SEK – Swedish Krona..
GBP – British Pound SGD – Singapore Dollar..
HKD – Hong Kong Dollar THB – Thai Baht..
HUF – Hungarian Forint TRY – New Turkish Lira..
IDR – Indonesian Rupiah TWD – Taiwan Dollar..
ILS – Israeli Shekel USD – United States Dollar..
INR – Indian Rupee ZAR – South African Rand..
JOD – Jordanian Dinars..
JPY – Japanese Yen..
Other Abbreviations
..
ADR – American Depositary Receipt..
CVO – Contingent Value Obligations..
ELN – Equity Linked Note..
ETF – Exchange-Traded Fund..
GDR – Global Depositary Receipt Securities..
NVDR – Non-Voting Depositary Receipt
xxxxxxxx
n) Standards Issued but not yet Effective
Standards issued but not yet effective up to the date of issuance of the Funds’ financial statements are listed below. The Funds intend to adopt applicable standards when they become effective.
IFRS 9, Financial Instruments - Classification and Measurement
In July 2014, the IASB issued the final version of IFRS 9, Financial Instruments which reflects all phases of the financial instruments project and replaces IAS 39, Financial Instruments: Recognition and Measurementand all previous versions of IFRS 9. The standard introduces new requirements for classification and measurement, impairment, and hedge accounting. IFRS 9 is effective for annual periods beginning on or afterJanuary 1, 2018, with early application permitted. The Funds plan to adopt the new standard on the effective date. The Manager has reviewed the requirements for transition to IFRS 9 and there are no materialimpacts anticipated for the Funds’ Net Assets as the majority of the Funds’ financial assets are measured at fair value through profit or loss.
o) Increase (decrease) in Net Assets Attributable to Holders of Redeemable Units per Unit
Increase (decrease) in net assets attributable to holders of redeemable units per unit of each class is calculated by dividing the Increase (decrease) in net assets attributable to holders of redeemable units (excludingdistributions), as reported on the Statements of Comprehensive Income, by the weighted average number of units in issue during the related period.
3. Valuation of Investments
The valuation date (Valuation Date) for a Fund is any day when the Manager’s head office is open for business. The Manager may, at its discretion, establish other Valuation Dates.
The value of the investments or assets of a Fund is determined as follows:
a) Cash and Other Assets
Cash, accounts receivable, dividends receivable, distributions receivable, and interest receivable are valued at fair value or at their recorded cost, plus or minus any foreign exchange between recognition of the assetby the Fund and the current Valuation Date, which approximates fair value.
b) Bonds, Debentures, and Other Debt Obligations
Bonds, debentures, and other debt obligations are fair valued using the last traded price provided by a recognized vendor upon the close of trading on a Valuation Date, whereby the last traded price falls within thatday’s bid-ask spread. If the last traded price does not fall within that day’s bid-ask spread, the Manager will then determine the price that is most representative of fair value based on the specific facts andcircumstances.
c) Listed Securities, Unlisted Securities, Gold Bullion and Fair Value Pricing of Foreign Securities
Any security that is listed or traded on a securities exchange is fair valued using the last traded price, whereby the last traded price falls within that day’s bid-ask spread or, if there is no traded price on thatexchange or the last traded price does not fall within that day’s bid-ask spread and in the case of securities traded on an OTC market, at the fair value as determined by the Manager as an appropriate basis forvaluation. In such situations, a fair value will be determined by the Manager to establish current value. If any securities are inter-listed or traded on more than one exchange or market, the Manager will use theprincipal exchange or market for the fair value of such securities.
Units of each mutual fund in which a Fund invests will be valued at fair value using the most recent net asset value quoted by the Trustee or Manager of the mutual fund on the Valuation Date.
Unlisted securities are fair valued using the last traded price quoted by a recognized dealer, or the Manager may determine a price that more accurately reflects the fair value of these securities if the Manager feelsthe last traded price does not reflect fair value.
Gold bullion, which is listed and traded on a securities exchange is fair valued using the last traded price, whereby the last traded price falls within that day’s bid-ask spread. If there is no traded price on a securitiesexchange or if the last traded price does not fall within that day’s bid-ask spread, the fair value is determined by the Manager.
16

p / 6 Notes to Financial Statements
Fair value pricing is designed to avoid stale prices and to provide a more accurate fair value, and may assist in the deterrence of harmful short-term or excessive trading in the Fund. When securities listed or tradedon markets or exchanges that close prior to North or South American markets or exchanges are valued by the Manager at their fair market value, instead of using quoted or published prices, the prices of suchsecurities used to calculate the Fund’s net assets or net asset value may differ from quoted or published prices of such securities.
d) Derivatives
Long positions in options, debt-like securities, and listed warrants are fair valued using the last traded price as established on either their principal trading exchange or by a recognized dealer in such securities,whereby the last traded price falls within that day’s bid-ask spread and the credit rating of each counterparty (as rated by S&P Global Ratings, a division of S&P Global) meets or exceeds the minimum designatedrating.
When any option is written by any Fund, the premium received by the Fund will be reflected as a liability that will be valued at an amount equal to the current fair value of the option that would have the effect ofclosing the position. Any difference resulting from revaluation shall be treated as an unrealized gain or loss on investment; the liability shall be deducted in arriving at the net assets attributable to holders ofredeemable units of the Fund. The securities that are the subject of a written option, if any, will be valued in the manner described above for listed securities.
Futures contracts, forward contracts, or swaps will be valued at fair value of the gain or loss, if any, that would be realized on the Valuation Date if the position in the futures contracts, forward contracts, or swapswere to be closed out.
Margin paid or deposited in respect of futures contracts and forward contracts will be reflected as an account receivable and margin consisting of assets other than cash will be noted as held as collateral.
Other derivatives and margin are fair valued in a manner that the Manager determines to represent their fair value.
e) Restricted Securities
Restricted securities purchased by any Fund will be fair valued in a manner that the Manager determines to represent their fair value.
f) Other Investments
All other investments of the Funds will be fair valued in accordance with the laws of the Canadian securities regulatory authorities where applicable.
The value of any security or other property of a Fund for which a market quotation is not readily available or where the market quotations do not properly reflect the fair value of such securities will be determined bythe Manager by valuing the securities at their fair value. In such situations, fair value will be determined using fair valuation techniques that most accurately reflect their fair value as established by the Manager.
4. Interest in Underlying Funds
The Funds may invest in other investment funds (Underlying Funds). Each Underlying Fund invests in a portfolio of assets to generate returns in the form of investment income and capital appreciation for itsunitholders. Each Underlying Fund finances its operations primarily through the issuance of redeemable units, which are puttable at the unitholder’s option and entitle the unitholder to a proportionate share of theUnderlying Fund’s net assets. The funds’ interests in Underlying Funds held in the form of redeemable units, are reported in their Schedule of Investments at fair value, which represents the Funds’ maximumexposure on those investments. The Funds' interests in Underlying Funds as at the prior year period ends are presented in the Financial Instruments Risks - Concentration Risk section in the Supplemental Scheduleto Schedule of Investment Portfolio. Distributions earned from Underlying Funds are included in “Investment Income” in the Statements of Comprehensive Income. The total realized and change in unrealized gains(losses) arising from Underlying Funds are also included in the Statements of Comprehensive Income. The Funds do not provide any additional significant financial or other support to Underlying Funds.
Where applicable, the table “Interests in Underlying Funds” presented as part of the Supplemental Schedule to Schedule of Investment Portfolio, provides additional information on the Funds’ investments inUnderlying Funds where the ownership interest exceeds 20% of each Underlying Fund.
5. Redeemable Units Issued and Outstanding
Each Fund is permitted to have an unlimited number of classes of units and may issue an unlimited number of units of each class. The outstanding units represent the net assets attributable to holders of redeemableunits of a Fund. Each unit has no par value and the value of each unit is the net asset value as determined on each valuation date. Settlement of the cost for units issued is completed as per security regulations inplace at the time of issue. Distributions made by a Fund and reinvested by unitholders in additional units also constitute issued redeemable units of a Fund.
Units are redeemed at the net assets attributable to holders of a redeemable unit per unit of a Fund. A right to redeem units of a Fund may be suspended with the approval of the Canadian securities regulatoryauthorities or when normal trading is suspended on a stock, options, or futures exchange within Canada or outside of Canada on which securities or derivatives that make up more than 50% of the value orunderlying exposure of the total assets of a Fund, not including any liabilities of a Fund, are traded and when those securities or derivatives are not traded on any other exchange that represents a reasonablypractical alternative for a Fund. The Fund is not subject to any externally imposed capital requirements.
The capital received by a Fund is utilized within the respective investment mandate of the Fund. This includes the ability to make liquidity available to satisfy unitholder unit redemption requirements upon aunitholder’s request.
Changes in issued and outstanding units for the annual periods ended December 31, 2017 and 2016 can be found on the Statements of Changes in Net Assets Attributable to Holders of Redeemable Units.x
6. Management Fees and Operating Expenses
Management fees are based on the net asset value of the Funds and are calculated daily. Management fees are paid to the Manager in consideration for providing, or arranging for the provision of, management,distribution, and portfolio advisory services. The maximum annual management fee expressed as a percentage of the average net asset value for each class of units of the Fund is reported in footnote MaximumChargeable Annual Management Fee Rates on the Statements of Comprehensive Income. For Class O units, management fees are negotiated with and paid by, or as directed by, unitholders, or dealers anddiscretionary managers on behalf of unitholders.
In addition to the management fees, the Funds are responsible for all expenses relating to the operation and conduct of the business of the Funds, including interest, operating, and administrative costs (other thanadvertising and promotional expenses, which are the responsibility of the Manager), brokerage fees, commissions, spreads, regulatory fees, Independent Review Committee fees, taxes, audit and legal fees andexpenses, safekeeping and custodial fees, investor servicing costs, and costs of unitholder reports, prospectuses, and other reports. All class-specific operating expenses are paid by the Manager and recovered fromthe Funds. The Funds do not pay a fee to the Trustee.
The Manager may recover from a Fund less than the actual class-specific operating expenses paid by the Manager, resulting in the Manager absorbing class-specific expenses. The Manager may also charge to aFund less than the maximum management fee in footnote Maximum Chargeable Annual Management Fee Rates on the Statements of Comprehensive Income, resulting in the Manager waiving management fees.
At its sole discretion, the Manager may stop absorbing class-specific operating expenses and/or waiving management fees at any time. Class-specific operating expenses absorbed and/or management fees waivedby the Manager are disclosed on the Statements of Comprehensive Income.
In some cases, the Manager may charge management fees to a Fund that are less than the management fees the Manager is entitled to charge in respect of certain investors in a Fund. The difference in the amountof the management fees will be paid out by the Fund to the applicable investors as a distribution of additional units of the Fund (Management Fee Distributions). Management Fee Distributions are negotiablebetween the Manager and the investor and are dependent primarily on the size of the investor’s investment in the Fund. Management Fee Distributions paid to qualified investors do not adversely impact the Fund orany of the Fund’s other investors. The Manager may increase or decrease the amount of Management Fee Distributions to certain investors from time to time.
The Manager pays the operating expenses of the CIBC Conservative Passive Portfolio, CIBC Balanced Passive Portfolio and CIBC Balanced Growth Passive Portfolio (Passive Portfolios), which may include but is notlimited to, operating and administrative costs; regulatory fees; audit, and legal fees and expenses; trustee, safekeeping, custodial, and any agency fees; and investor servicing costs and costs of unitholder reports,prospectuses, Fund Facts, and other reports, in exchange for the payment by the Passive Portfolios of a fixed rate administration fee to the Manager. The Fixed Administration Fee will be equal to a specifiedpercentage of the net asset value of the class units of the Passive Portfolios, calculated and accrued daily and paid monthly. The Fixed Administration Fee charged for each class of the Passive Portfolios is reportedin the footnote Fixed Administration Fee on the Statements of Comprehensive Income. For Class O, no Fixed Administration Fee will be charged. The Fixed Administration Fee payable by the Passive Portfolios, may, inany particular period, exceed or be lower than the expenses we incur in providing such services to the Passive Portfolios.
Where a Fund invests in units of an Underlying fund, the Fund does not pay duplicate management fees on the portion of its assets that it invests in units of the Underlying Fund. In addition, the Fund will not payduplicate sales fees or redemption fees with respect to the purchase or redemption by it of units of the Underlying Fund. Some of the Underlying Funds held by the Funds may offer Management Fee Distributions.Such Management Fee Distributions of an Underlying Fund will be paid out as required for taxable distribution payments by a Fund. The manager of an Underlying Fund may, in some cases, waive a portion of anUnderlying Fund’s management fee and/or absorb a portion of an Underlying Fund’s operating expenses.
17
Notes to Financial Statements p / 7
7. Income Taxes and Withholding Taxes
The Funds qualify as mutual fund trusts under the Income Tax Act (Canada). No income tax is payable by the Funds on net income and/or net realized capital gains that are distributed to unitholders. In addition,income taxes payable on undistributed net realized capital gains are refundable on a formula basis when units of the Funds are redeemed. Sufficient net income and realized capital gains of the Funds have been, orwill be, distributed to the unitholders such that no tax is payable by the Funds and, accordingly, no provision for income taxes has been made in the financial statements. Occasionally, a Fund may pay distributions inexcess of the net income and net realized capital gains of the Fund. This excess distribution is called a return of capital and is non-taxable to the unitholder. However, a return of capital reduces the average cost ofthe unitholder’s units for tax purposes, which may result in a capital gain to the unitholder to the extent the average cost becomes less than zero.
CIBC U.S. Dollar Money Market Fund, CIBC U.S. Dollar Managed Income Portfolio, CIBC U.S. Dollar Managed Balanced Portfolio, and CIBC U.S. Dollar Managed Growth Portfolio may realize net foreign currencygains and losses on the translation of their net realized capital gains to Canadian dollars for tax purposes. These gains will be distributed to investors annually unless these Funds elect to retain them, with the resultthat the tax would be payable by the Funds.
Non-capital losses are available to be carried forward for 20 years.
Capital losses for income tax purposes may be carried forward indefinitely and applied against capital gains realized in future years. Where applicable, a Fund’s net capital and non-capital losses are reported inCanadian dollars in the footnote Net Capital and Non-Capital Losses on the Statements of Changes in Net Assets Attributable to Holders of Redeemable Units.
The Funds have a taxation year-end of December 15 (except for CIBC Canadian T-Bill Fund, CIBC Money Market Fund, CIBC U.S. Dollar Money Market Fund which have a taxation year-end of December 31).
The Funds currently incur withholding taxes imposed by certain countries on investment income and capital gains. Such income and gains are recorded on a gross basis and the related withholding taxes are shownas a separate expense in the Statements of Comprehensive Income.
8. Brokerage Commissions and Fees
The total commissions paid by the Funds to brokers in connection with portfolio transactions are reported in footnote Brokerage Commissions and Fees on the Statements of Comprehensive Income of each Fundwhere applicable. In allocating brokerage business, consideration may be given by the portfolio advisor or the portfolio sub-advisors of the Funds to dealers that furnish research, statistical analysis, and othersecurities to portfolio advisors and portfolio sub-advisors that process trades through such dealers (referred to in the industry as “soft dollar” arrangements). These goods and services are paid for with a portion ofbrokerage commissions and assist the portfolio advisors and portfolio sub-advisors with their investment decision-making services to the Funds. The total soft dollar payments paid by the Funds to brokers arereported in footnote Brokerage Commissions and Fees on the Statements of Comprehensive Income of each Fund. In addition, the Manager may enter into commission recapture arrangements with certain dealerswith respect to the Fund. Any commission recaptured will be paid to the applicable Fund.
Fixed income and certain other securities are transacted in an OTC market, where participants are dealing as principals. Such securities are generally traded on a net basis and do not normally involve brokeragecommissions, but will typically include a “spread” (being the difference between the bid and the offer prices on the security of the applicable marketplace).
Spreads associated with fixed income securities trading and certain other securities are not ascertainable and, for that reason, are not included in the dollar amounts. In addition, the soft dollar amounts only includethe value of research and other services supplied by a third party to CIBC Asset Management Inc. (CAMI or the Portfolio Advisor) and any portfolio sub-advisors, as the value of the services supplied to the PortfolioAdvisor and any portfolio sub-advisors by the dealer is not ascertainable. When these services benefit more than one Fund, the costs are allocated among the Funds based on transaction activity or some other fairbasis as determined by the Portfolio Advisor and any portfolio sub-advisors.x
9. Related Party Transactions
CIBC and its affiliates have the following roles and responsibilities with respect to the Funds and receive the fees described below in connection with their roles and responsibilities. The Funds may hold securities ofCIBC. CIBC and its affiliates may also be involved in underwriting or lending to issuers of securities that may be held by the Funds, have purchased or sold securities from or to the Funds while acting as principal,have purchased or sold securities from or to the Funds on behalf of another investment fund managed by CIBC or an affiliate, and also may have been involved as a counterparty to derivative transactions.Management fees payable and other accrued expenses on the Statements of Financial Position are amounts generally payable to a related party of the Fund.
Manager, Trustee, Portfolio Advisor, and certain Portfolio Sub-Advisors of the Funds
CIBC is the Manager, CIBC Trust Corporation is the Trustee, and CAMI is the Portfolio Advisor of each of the Funds.
The Manager also arranges for fund administrative services (other than advertising and promotional, which are the responsibility of the Manager), legal, investor servicing, and costs of unitholder reports,prospectuses, and other reports. The Manager is the registrar and transfer agent for the Funds and provides, or arranges for the provision of, all other administrative services required by the Funds. The dollar amount(including all applicable taxes) of all fund administrative expenses (net of absorptions) that the Manager recovers from a Fund is reported in footnote Administrative and Other Fund Operating Expenses on theStatements of Comprehensive Income.
Brokerage Arrangements and Soft Dollars
The Portfolio Advisor generally delegates trading and execution authority to the portfolio sub-advisors.
The Portfolio Advisor and portfolio sub-advisors make decisions, including the selection of markets and dealers and the negotiation of commissions, with respect to the purchase and sale of portfolio securities,certain derivative products and the execution of portfolio transactions. Brokerage business may be allocated by the Portfolio Advisor or portfolio sub-advisors to CIBC World Markets Inc. and CIBC World MarketsCorp., each a subsidiary of CIBC. The total commissions paid to related brokers in connection with portfolio transactions are reported in footnote Brokerage Commissions and Fees on the Statements ofComprehensive Income of each Fund.
CIBC World Markets Inc. and CIBC World Markets Corp. may also earn spreads on the sale of fixed income and other securities, and certain derivative products to the Funds. Dealers, including CIBC World MarketsInc. and CIBC World Markets Corp., may furnish goods and services, other than order execution, to the Portfolio Advisor and portfolio sub-advisors that process trades through them (referred to in the industry as“soft dollar” arrangements). These goods and services are paid for with a portion of brokerage commissions and assist the Portfolio Advisor and portfolio sub-advisors with their investment decision-making servicesto the Fund or relate directly to executing portfolio transactions on behalf of the Fund. As per terms of the portfolio sub-advisory agreements, such soft dollar arrangements are in compliance with applicable laws.Custodial fees directly related to portfolio transactions incurred by a Fund, otherwise payable by the Fund, shall be paid by CAMI, and/or dealer(s) directed by CAMI, up to the amount of the credits generated undersoft dollar arrangements from trading on behalf of the Fund, or a portion of the Fund, during that month. The total soft dollar payments paid by the Fund to related brokers are reported in footnote BrokerageCommissions and Fees on the Statements of Comprehensive Income of each Fund. In addition, the Manager may enter into commission recapture arrangements with certain dealers with respect to the Funds. Anycommission recaptured will be paid to the relevant Fund.
Custodian
The custodian holds all cash and securities for the Funds and ensures that those assets are kept separate from any other cash or securities that the custodian might be holding. The custodian also provides otherservices to the Funds including record keeping and processing of foreign exchange transactions. CIBC Mellon Trust Company is the custodian of the Funds (the Custodian). The Custodian may hire sub-custodians forthe Funds. The fees and spreads for services of the Custodian directly related to the execution of portfolio transactions by a Fund, or a portion of a Fund, are paid by CAMI and/or dealer(s) directed by CAMI up to theamount of the credits generated under soft dollar arrangements from trading on behalf of the Funds during that month. All other fees for the services of the Custodian are paid by the Manager, and charged to theFunds on a recoverable basis. CIBC owns a 50% interest in CIBC Mellon Trust Company.
Service Provider
CIBC Mellon Global Securities Services Company (CIBC GSS) provides certain services to the Funds, including securities lending, fund accounting and reporting, and portfolio valuation. Such servicing fees are paid bythe Manager and charged to the Funds on a recoverable basis. CIBC indirectly owns a 50% interest in CIBC GSS.
The dollar amount paid by the Funds (including all applicable taxes) to CIBC Mellon Trust Company for custodial fees (net of absorptions) and to CIBC GSS for securities lending, fund accounting and reporting, andportfolio valuation (net of absorptions) for the annual periods ended December 31, 2017 and 2016 is reported in footnote Service Provider on the Statements of Comprehensive Income.
10. Hedging
Certain foreign currency denominated positions have been hedged, or partially hedged, by forward foreign currency contracts as part of the investment strategies of certain Funds. These hedges are indicated by ahedging reference number on the Schedule of Investment Portfolio and a corresponding hedging reference number on the Schedule of Derivative Assets and Liabilities - Forward Foreign Currency Contracts for thoseFunds.
18

p / 8 Notes to Financial Statements
11. Collateral on Specified Derivatives
Short-term investments may be used as collateral for futures contracts outstanding with brokers.
12. Revision of Comparative Information
Where applicable, certain comparative figures on the Statements of Cash Flows were restated for the prior period. Amounts reclassified to Reinvested distributions from underlying funds have been presentedseparately from amounts related to Purchases of investments to appropriately reflect the non-cash components of investments purchased. The impact on the Cash Flows from Operating Activities is nil.
For Funds that invested in underlying funds and earned dividend income from those underlying funds, the amounts disclosed for dividends received, net of withholding taxes were restated for the prior period. Thisrestatement reflects that dividends earned were reinvested in additional units of the underlying funds and that cash dividends were not received by the Funds.xx
December 31, 2016x..
Fund
Dividends received,net of withholding
taxes ($000s)
Restated Dividendsreceived, net of
withholding taxes ($000s)Net Impact ofRestatement % of Net Assets
..
CIBC Managed Income Portfolio 3,653 - (3,653) (0.1)..
CIBC Managed Income Plus Portfolio 4,628 - (4,628) (0.3)..
CIBC Managed Balanced Portfolio 9,537 - (9,537) (0.4)..
CIBC Managed Monthly Income Balanced Portfolio 9,910 - (9,910) (1.5)..
CIBC Managed Balanced Growth Portfolio 6,991 - (6,991) (0.4)..
CIBC Managed Growth Portfolio 3,592 - (3,592) (0.6)..
CIBC Managed Aggressive Growth Portfolio 1,232 - (1,232) (0.5)..
CIBC U.S. Dollar Managed Income Portfolio 321 - (321) (0.1)..
CIBC U.S. Dollar Managed Balanced Portfolio 667 - (667) (0.4)..
CIBC U.S. Dollar Managed Growth Portfolio 147 - (147) (0.6)
19

INDEPENDENT AUDITORS’ REPORT
x
To the Unitholders ofxxxxxxxxxx
xx
x..
CIBC Canadian T-Bill Fund CIBC Precious Metals Fund..
CIBC Money Market Fund CIBC Global Technology Fund..
CIBC U.S. Dollar Money Market Fund CIBC Canadian Short-Term Bond Index Fund..
CIBC Short-Term Income Fund CIBC Canadian Bond Index Fund..
CIBC Canadian Bond Fund CIBC Global Bond Index Fund..
CIBC Monthly Income Fund CIBC Balanced Index Fund..
CIBC Global Bond Fund CIBC Canadian Index Fund..
CIBC Global Monthly Income Fund CIBC U.S. Broad Market Index Fund..
CIBC Balanced Fund CIBC U.S. Index Fund..
CIBC Dividend Income Fund CIBC International Index Fund..
CIBC Dividend Growth Fund CIBC European Index Fund..
CIBC Canadian Equity Fund CIBC Emerging Markets Index Fund..
CIBC Canadian Equity Value Fund CIBC Asia Pacific Index Fund..
CIBC Canadian Small-Cap Fund CIBC Nasdaq Index Fund..
CIBC U.S. Equity Fund CIBC Managed Income Portfolio..
CIBC U.S. Small Companies Fund CIBC Managed Income Plus Portfolio..
CIBC Global Equity Fund CIBC Managed Balanced Portfolio..
CIBC International Equity Fund CIBC Managed Monthly Income Balanced Portfolio..
CIBC European Equity Fund CIBC Managed Balanced Growth Portfolio..
CIBC Emerging Markets Fund CIBC Managed Growth Portfolio..
CIBC Asia Pacific Fund CIBC Managed Aggressive Growth Portfolio..
CIBC Latin American Fund CIBC U.S. Dollar Managed Income Portfolio..
CIBC International Small Companies Fund CIBC U.S. Dollar Managed Balanced Portfolio..
CIBC Financial Companies Fund CIBC U.S. Dollar Managed Growth Portfolio..
CIBC Canadian Resources Fund CIBC Conservative Passive Portfolio..
CIBC Energy Fund CIBC Balanced Passive Portfolio..
CIBC Canadian Real Estate Fund CIBC Balanced Growth Passive Portfolio....
(collectively, the “Funds”)xx
We have audited the accompanying financial statements of each of the Funds, which comprise the statements of financial position as at December 31, 2017 and 2016 (if applicable), and the statements ofcomprehensive income, changes in net assets attributable to holders of redeemable units and cash flows for the periods then ended, and a summary of significant accounting policies and other explanatoryinformation.
Management's Responsibility for the Financial StatementsManagement is responsible for the preparation and fair presentation of these financial statements in accordance with International Financial Reporting Standards, and for such internal control as managementdetermines is necessary to enable the preparation of financial statements that are free from material misstatement, whether due to fraud or error.
Auditors’ ResponsibilityOur responsibility is to express an opinion on these financial statements based on our audits. We conducted our audits in accordance with Canadian generally accepted auditing standards. Those standards requirethat we comply with ethical requirements and plan and perform the audits to obtain reasonable assurance about whether the financial statements are free from material misstatement.
An audit involves performing procedures to obtain audit evidence about the amounts and disclosures in the financial statements. The procedures selected depend on the auditors’ judgment, including the assessmentof the risks of material misstatement of the financial statements, whether due to fraud or error. In making those risk assessments, the auditors consider internal control relevant to the entity’s preparation and fairpresentation of the financial statements in order to design audit procedures that are appropriate in the circumstances, but not for the purpose of expressing an opinion on the effectiveness of the entity’s internalcontrol. An audit also includes evaluating the appropriateness of accounting policies used and the reasonableness of accounting estimates made by management, as well as evaluating the overall presentation of thefinancial statements.
We believe that the audit evidence we have obtained in our audits is sufficient and appropriate to provide a basis for our audit opinion.
OpinionIn our opinion, the financial statements present fairly, in all material respects, the financial position of each of the Funds as at December 31, 2017 and 2016 (if applicable), and their financial performance and their cashflows for the periods then ended in accordance with International Financial Reporting Standards.xxxxxxxxx
Toronto, CanadaMarch 9, 2018
20

This page is intentionally left blank.
"S&P®", and “S&P/TSX Composite” are trademarks of “S&P Global Ratings”, a division of S&P Global, and have been licensed for use by CIBC. "TSX" is a trademark of TSX, Inc. andhas been licensed for use by S&P Global Ratings. The Fund is not sponsored, endorsed, sold, or promoted by S&P Global Ratings or TSX, Inc. and neither S&P Global Ratings nor TSX,Inc. make any representation regarding the advisability of investing in the Fund.

CIBC Mutual FundsCIBC Family of Portfolios
CIBC
18 York Street, Suite 1300Toronto, Ontario
M5J 2T8
CIBC Securities Inc.1-800-465-3863
Websitewww.cibc.com/mutualfunds
CIBC Securities Inc. is a wholly-owned subsidiary of CIBC and is the principal distributor of the CIBC Mutual Funds and the CIBC Family of Portfolios. CIBC Family of Portfolios aremutual funds that primarily invest in other CIBC Mutual Funds. To obtain a copy of the simplified prospectus, call CIBC Securities Inc. at 1-800-465-3863 or ask your advisor.