cicchi - paper for sisp 2013 014 · pdf...
TRANSCRIPT

The logic(s) of voting behaviour in the European Parliament: new insights on
party groups membership and national affiliation as determinants of vote
Lorenzo Cicchi ([email protected])
PhD candidate at IMT Institute for Advanced Studies, Lucca
Visiting Fellow at European University Institute, Florence
Paper prepared for the XXVII Annual SISP Conference
Università degli Studi di Firenze, Florence, 12-‐14 September 2013
*** DRAFT VERSION, PLEASE DO NOT CITE ***

2
Abstract. The greater centrality of the European Parliament (EP) within the EU’s institutional
structure has increased the importance of voting behaviour of its members (MEPs), thus making it
more important to fully understand their (competing) logics. A consolidated stream of literature has
treated the political groups of the European Parliament (EPGs) as cohesive actors, influenced mainly
by the classical dimension of left-‐right politics, with nationality playing a marginal role; a second,
anti-‐/pro-‐EU dimension exists, but it is orthogonal to the main one and explains a fewer share of
votes. In this perspective, MEPs from the same political group are likely to vote together (just like any
western democracy parliament), no matter which country they come from. However, other scholars
suggest that the methods used to reach these findings are biased. I add new elements to this
discussion, analysing (a) the cases when EPGs are exceptionally low cohesive; (b) the different logics
of various EP’s legislative committees; (c) the possible contrast between EPGs and national
delegations. After originally defining MEPs’ voting behaviour as a refinement of existing theories, I
firstly affirm that claims about the high cohesiveness of EPGs are a product, although correct, of a
quantitative approach that “dilutes” the variance by looking at the aggregate scores of indexes of
cohesion (such as the Agreement Index, AI); secondly, that voting behaviour of MEPs in the various
committees of the European Parliament has different dynamics, following the indication of many
scholars that knowledge of the internal dynamics of committees in the EP is still blurry; thirdly, that
national affiliation, yet emerging only in a small minority of votes, is crucial and has some specific
characteristics can be isolated. I then test these hypotheses on the 6th EP legislature (2004-‐2009) and
partially on the 7th with different methodological tools: a critical use of the AI, the results of an
original survey submitted to MEPs’ assistants, and a simple statistical model based on a logistic
regression. Finally, I add some qualitative insights in order to reinforce such statements. My results
show that the oft-‐repeated claims about the resemblance of the European Parliament to a classical
democratic parliament should be taken more carefully: usually political groups are highly cohesive,
but when it really matters (because the outcome of the vote may impact each some member states’
interests?) national affiliation plays a greater role than the one usually envisaged by the mainstream
literature.
Keywords. Voting behaviour, European Parliament, political groups of the European Parliament,
European Parliament committees, party group cohesion, roll-‐call votes.

3
I. Introduction and research question. In its sixty-‐year history the European Parliament (EP) has
evolved from a mere consultative body into “one of the most powerful interstate assemblies in the
Western world” (Hix et al. 2006: 494). This increase of power makes it increasingly important to
know how Members of the European Parliament (MEPs) vote. Contemporary studies on the EP can
be classified into four interrelated areas from a broad viewpoint, according to the taxonomy
provided by Hix et al. (2003a: 193): (a) general development and functioning of the EP, focusing
especially on the institutional change provided by the entry into force of the new Treaties; (b)
political behaviour of the citizens/voters and EP elections; (c) the internal politics and organization of
the EP; and finally, (d) inter-‐institutional bargaining between the Parliament, the Council and the
Commission. Focusing on the topic of cohesiveness1 of the Political Groups of the EP, commonly
called European Party Groups (EPGs) and the logics driving voting behaviour of MEPs (in particular,
whether they follow their political group membership or their national affiliation), this article falls
under the third category. More specifically, I investigate the internal dynamics of the EP following a
central research question: does national affiliation, at least for some (most important?) votes, play a
greater role than the one usually envisaged by part of the literature, because MEPs ultimately tend
to protect their national interests? In terms of originality, the contribution of this work is tripartite:
firstly, it adds some new element to the general debate on the reasons behind the votes in the
European Parliament; secondly, it tries to “bridge the gap” between the existing literature on voting
behaviour and that on committees, since the latter – as it will be shown in the next paragraph – has
focused on different aspects, mainly related to the question of representation and membership, but
not much on the logics of voting behaviour per se; thirdly, it contributes to shed light on the
controversial question whether an analysis based solely on roll-‐call votes can represent a meaningful
improvement on the discipline’s knowledge of MEPs’ voting behaviour or it necessary leads (if not
balanced by a qualitative deepening) to biased results.
II. Twenty years of studies on MEPs’ voting behaviour. The interest for the general question “how
do MEPs vote?” attracted increasing academic attention since the early 1980s, in the aftermath of
the newly direct-‐elected European assembly in 1979. While the first studies focused on theoretical
implications and possible shortcomings of direct elections of the EP (Reif and Schmitt’s renowned
“second order national elections”, 1980) and on the concept or dyadic representation between
1 Although a slight theoretical distinction between cohesion and cohesiveness could be legitimately provided (“cohesion” refers to the characteristic itself of an actor of being cohesive, while “cohesiveness” implies that this actor is able to exert a force on its internal component, in order to act as an integrated and unitary system), here the two terms will be used as synonyms.

4
European citizens and MEPs (Bardi 1987, 1989), it is only in the 1990s the first quantitative and
rigorous studies of voting behaviour in the EP were published (Attinà 1990; Raunio 1996; Hix and
Lord 1997). These studies were based on the only voting records available in the EP, namely the roll-‐
call votes (RCVs). These are the votes that are officially recorded, in the form of minutes drafted by
the Parliament’s offices. The records track how each MEP voted or abstained. Commonly, this voting
procedure is called “public vote”, because a member of a parliament has no means of keeping the
vote secret. In the American, British and in few other parliaments all the votes are roll-‐calls; however,
in many other cases such as Italy, France, Germany, Belgium, Argentina, and Brazil some votes are
public and recorded, while others are secret (Hug 2006: 24-‐33). In the European Parliament the
choice of voting procedure is defined by articles 166 and 167 of the EP Rules of Procedure, which
states that only certain votes are required to be taken by roll-‐call. However, a political group or at
least 32 MEPs can request any vote to be taken by roll-‐call. In addition to RCVs, two other voting
procedures are possible: the “raise of hands” and “voice” vote where it is recorded only if the bill
passes or not, and another type of electronic vote that records the aggregate number of yea/nay,
but no information about the single vote. The main findings of these first studies were mainly two:
EPGs show high cohesion and, according to the patterns showed by this type of vote, the classical
political cleavages exist also in the EP.
In response to these studies, Carrubba and Gabel (1999) draw attention on the potential selection
bias in using RCVs to study MEPs’ voting behaviour. On the one hand, it is impossible to empirically
analyse the votes falling under the other voting procedures, because there are no records of those
vote. However, RCVs are a small subset of the whole universe of votes cast (roughly ⅓). Thus, only if
RCVs represent a random sample of the whole universe of votes cast, then the causal inferences
based on RCVs can be generalized as a reflection of MEPs’ voting behaviour. If a dependent variable
of a research (e.g. intra-‐party cohesion, inter-‐party competition) is related2 to the rationale behind
the RCV request, endogeneity problems are expected to emerge: in the light of this it may be
assumed that RCVs are requested by EPGs for strategic reasons. As a consequence of the (possible?)
limitations of RCV-‐based approaches, the literature splits into two very different streams, which
proceed on parallel tracks, except for rare cases. On the one hand, we observe a straightforward
continuation of the study of MEPs’ voting behaviour through RCVs. Hix (2001) was the first to apply
Poole and Rosenthal’s method of creating spatial maps to the EP context. He did it first only for the
1999-‐2004 Parliament, then together with Noury and Roland for all the legislatures since 1979, after
2 Either positively, negatively or both -‐ but in a way such as the two effects do not cancel out each other.

5
having processed and systematically collected all the RCVs held in the EP. The creation of a such
comprehensive (yet biased?) dataset has proved to be functional not only to the spatial
representation of the legislative dynamics of the EP, but also to many other quantitative analysis of
MEPs’ voting behaviour: in the early 2000s this field of research has witnessed a conspicuous
flourishing of RCVs-‐based studies. Many other papers have been published on the topic, all of them
agreeing on some main findings. First, EPGs show high intra-‐party cohesion and inter-‐party
competition. Second, voting patterns fall mainly along the traditional left-‐right cleavage, and only
partially along an orthogonal pro/anti-‐European continuum. Third, national affiliation is a weak
predictor of vote; and consequently, the EP works surprisingly like most of domestic parliaments in
Western democracies (Kreppel 2002; Hix et al. 2005, 2006, 2007; Farrell et al. 2006; Hix and Noury
2009). The arguments advanced in order to justify the fact that their analysis is based on a subset of
votes cast within the EP are the following: RCVs and votes falling under a different voting procedure
do not vary in terms of importance; both are cast on the same policy issues, so no issue is voted too
often with a certain type of vote; and finally, all the EPGs are equally likely to request RCVs, so no
group requests them disproportionally more than the others. On the other hand, an increasing
number of critical scholars (Carrubba et al. 2003, 2004, 2008, 2009; Thiem 2006; Hug 2006, 2009)
claim to have concrete evidence to confute those assumptions. First of all, according to them the
majority of non-‐RCVs are cast on legislative voting (the most important votes), while most of the
RCVs are cast on resolution and consultation votes (less important). Second, RCVs are cast
disproportionally on specific issues. Finally, some EPG requests them more often than other groups.
Consequently, inferences based on RCVs only, may be misleading and it seems necessary to look
somewhere else to fully understand the dynamics of voting behaviour within the EP. Later, these
authors rephrased their criticisms in clearer terms, pointing out not only the problems of
endogeneity in party cohesion, but also the possibly misleading way scholars pooled data together to
create the dataset (Carrubba et al. 2003: 6-‐9). They no longer studied voting behaviour directly, but
focused on the reasons why RCVs are requested. Some scholars have tried to provide an explanation
to the real reasons behind a RCV request, relying mostly on theory, while others have applied
methods based on game-‐theory to model this kind of situation. Thiem (2006: 17) considers the RCV
requests a consequence of high party cohesion. On the other hand, Carrubba et al. (2008: 570-‐572)
see these requests as signalling strategies either for a group to highlight their pre-‐existing unity or
another group’s coordination failure. In other words, cohesion – or lack of it – increases the
likelihood of a RCV request. But this debate is far from being settles, as demonstrated by the latest
working paper by Hix et al. (2013) again trying to confute these critical scholars’ argument and

6
suggesting that, according to the original methodology proposed, selection biases in roll call votes
due to strategic choices are at best negligible.
Concerning the role of the committees of the European Parliament, the literature is in a relatively
florid state, but some aspects of it have been analysed more extensively than others. The
committees of the European Parliament are designed to aid the European Commission in initiating
legislation; standing committees are made up of MEPs, and each committee has a Chairman and four
Vice-‐Chairmen, along with numerous committee members; each committee also has substitute
members. There are currently 20 standing committees3, plus a special committee on Organised
Crime, Corruption and Money Laundering (appointed before the Summer 2012), covering all the
areas of legislation. Two other special committees (Financial, Economic and Social Crisis, and Policy
Challenges) completed their works between June and July 2011 and were dismantled. Reports are
usually compiled by a rapporteur, who is appointed by the chairman of the Committee, selected from
amongst the Members or permanent substitutes. In the process of proposing and drafting legislation,
the European Commission consults the various Standing Committees during the standard legislative
procedure, and these committees advise the Commission by producing reports, proposing
amendments to the draft legislation, and providing, if necessary, a drafted legislative resolution.
Committees are also able to produce non-‐legislative reports. The appointed rapporteur is responsible
for preparing the report, and presenting it to Parliament on the Committee’s behalf. These reports
must include a motion for a resolution, an explanatory statement, and must also outline financial
implications. Committees can also produce reports relevant to their competence, without having to
be consulted. These are called “Own-‐Initiative Reports”, and are used to submit a motion for a
resolution. When drawing up a report, a Committee may ask the opinion of another Committee on
the matter, particularly if it is felt that a proposed amendment would fall into the interests of
another Committee. The Committees are based in Brussels, where together with the Political Groups
lie the real “political core” of the European Parliament.
While there is a body of work on the role of EP committees in the legislative process (Neuhold 2001),
which includes case studies of the Environment (Judge 1992; Collins et. al. 1998) and more recent 3 Foreign Affairs; Development; International Trade; Budgets; Budgetary Control; Economic and Monetary Affairs; Employment and Social Affairs; Environment; Public Health and Food Safety; Industry, Research and Energy; Internal Market and Consumer Protection; Transport and Tourism; Regional Development; Agriculture and Rural Development; Fisheries; Culture and Education; Legal Affairs; Civil Liberties, Justice and Home Affairs; Constitutional Affairs; Women's Rights and Gender Equality; Petitions. Human Rights and Security and Defence are two sub-‐committees of the standing committee Foreign Affairs.

7
work on the EP amendments in plenary sessions (Yordanova 2010), most of the research is focused
on the topic of membership of EP committees, starting from the earliest work of Hagger and Wing
(1979) in the aftermath of the first direct elections of the EP. Westlake (1994b) examined British
MEPs’ movements within the committee system; Bowler and Farrell (1995) empirically analysed the
assignment of committee leadership positions; McElroy (2001) showed how transnational party
groups reward MEPs who toe the party line, promoting them in the EP’s committee system; later, a
series of journal articles has examined the role of rapporteurs and the distribution of rapporteurships
at the party and individual level in the EP (e.g. Benedetto 2005; Høyland 2006; Mamadouh and
Raunio 2003). But, except for some very recent works (Costello and Thomsen 2010, Whitaker 2011)
that try to demonstrate the extent to which national parties use the committee system to further
their policy goals, very little has been said on how MEPs vote in the various committee (and if this
voting behaviour is significantly different, in sheer terms of EPG cohesion vis-‐à-‐vis national cohesion).
III. Theoretical framework. In this section I will briefly present the theoretical approach used, first
from a more broad point of view (how cohesive are EPGs, describing also systemness and
inclusiveness of the EU party system), then more specifically (how MEPs vote), and finally adding an
original element to these theories. For the first aspect I rely on the classical theory of voting
behaviour as juxtaposition between the legislator’s preferences and the group discipline; for the
second, I present Hix et. al.’s theory of MEPs as “parliamentary agents with two principals”; finally,
the original theory presented in this paper is the one of “MEPs as members of strongly ideological
regional parties”.
Why do we observe party cohesion in legislatures? From a very broad perspective, organizational
strength and voting cohesion of legislative parties are explained by two types of institutions: external
ones (the structure of relations between the parliament and the executive) and internal ones (the
structure of incentives inside the legislature). The literature usually differentiates between
parliamentary systems and presidential systems. In the former, legislative parties are usually more
cohesive, because the executive is “fused” to a parliamentary majority, and governments can reward
loyal backbenchers with ministerial seats. In addition, as Diermeier and Feddersen (1998: 611-‐621)
point out, governing parties can call a vote-‐of-‐confidence motion, which confronts their
parliamentarians with the risk of not being re-‐elected if the parliament is dissolved. In the
presidential systems, by contrast, parties in government are less able to enforce a strong party
discipline amongst their supporters in the parliament: “loyalty to the party line is less important,
since lack of discipline does not threaten survival of the executive” (Hix et al. 2005: 212). From the

8
mere perspective of institutional functioning, the EU can be classified as a separated-‐powers system,
where the Executive (the European Commission) does not require the direct support of a majority in
the EP to govern. Moreover, the Commission cannot introduce a vote-‐of-‐confidence motion in the EP
or dissolve it, calling for new parliamentary elections. Despite this institutional structure, it is still
reasonable to expect that the structure of incentives inside the legislature can lead to powerful
legislative party organization: legislators who expect to have similar voting preferences on a range of
future policy issues can reduce the transaction costs of coalition-‐formation by establishing a party
organization on the basis of a division-‐of-‐labour agreement4. On the other hand, the benefits
associated to group membership also entail costs. In some cases, a party takes decisions that may be
unpopular with specific constituencies, or ideologically distant from a legislator’s preference space.
In these situations, he/she may either vote against the party, to show his/her disappointment but
with the associated risk of a political defeat, or may adhere to the official line and vote cohesively
with the party group (Hix et al. 2005: 213-‐214).
As theoretically defined above, cohesiveness is not the only relevant element of the EP party system,
although it is the only one directly related to MEPs’ voting behaviour. To provide a comprehensive
picture of the EPGs’ dynamics it is worth looking at the EP’s inclusiveness and systemness (Bardi
2011). Since the very beginning party groups in the EP have been highly inclusive. In 1979 the three
main EPGs were composed of deputies marked by a fairly differentiated national background: the
People’s Party group included MEPs from seven member states; the Socialists from all and the
Liberals from eight member states. This trend has remained consistent, despite the subsequent
enlargements of the EU. Neither the last “injection” of heterogeneity due to the Eastern enlargement
in 2004 and 2007 has substantially reduced EP inclusiveness. This proves the absorption potential of
the EPGs in relation to the European dynamics. Secondly, also systemness has remained high: the
current number of EPGs equals the number of EPGs in the parliament of 1979. The growing
heterogeneity of political families inside the EP seems to have been overshadowed by a highly
systemic environment5. In terms of individual behaviour, the theory presented here is the one
proposed by Hix (2002: 696), according to which the main factors behind voting in the EP are the
policy position of national parties. Hix draws on the classical economic theory based on the principal-‐ 4 Party members provide labour and capital – such as information gathering and policy expertise – while leaders distribute committee and party offices. 5 On the other hand, following the increase of EU membership, the number of EPGs formed by only one national party has fallen dramatically and completely disappeared as the creation of one-‐nation groups has been explicitly forbidden. A specific EP Rule of Procedure (Rule 30, “formation of political groups”) states that a political group shall consist of deputies from a specific number of member states. Following the 2004 and 2009 enlargements, the threshold is set to one-‐fourth of the member states.

9
agent dilemma, and refines it for the different context of the European Parliament, arguing that
MEPs are economic agents with two principals: one is the European group they belong to, the other
is the national party who is responsible for their election. Despite the fact that the parliamentary
principals in the EP control important benefits – such as committee assignment and speaking time –
it is the principals that control candidate selection (the national parties) who ultimately determine
how MEPs behave. When the national parties in the same parliamentary group decide to vote
together, the EP parties look highly cohesive. But when these parties take opposing policy position,
the cohesion of the EP parties break down. Nonetheless, what Hix overlooks is the real reason why,
sometimes, the national element is so crucial. In his analysis about a possible EU reform, he argues
that “to break national party control, EP elections would have to be held under a system which
limited the power of national parties to control candidate selection […]. This would dramatically
increase the authority of the party leaders in the EP, who would become key actors in the European
Union policy process (2002: 697). But it is not only a question of national party membership, because
ultimately it’s the national party that controls the access to the EP through the European (second
order national) elections. It’s also a matter of nationality at large.
From the original theory presented here, thus, the real logic that drives MEPs’ voting behaviour is a
mix of the previous approaches, including one key element that all the previous literature has too
often overlooked: the question of national interests. Adding an element of realpolitik to this
framework, I consider MEPs as “strongly ideological regional legislators”. They are politically
oriented, but what ultimately matters – and matters the most – is not to go against the “reason of
state”. This means that, on overall, they tend to tow the party line, making the EPG system result as a
cohesive one; so, very generally – for instance – the Italian members of the Socialist group tend to
vote together with the members, from other countries, of the same group, because when there’s no
national interest at stake (and that’s the majority of the cases) their votes fall along ideological left-‐
right lines. In this sense, to use the words of Moravcsik (1993) the EP is still more
“intergovernmentalist” than generally acknowledged. Secondly, they have two principals, and the
most important one is the national party: but this is the case not (only) because the national party is
responsible for their (re)-‐election. The main reason why sometimes MEPs break the EPG lines is
because there is a general national interest at stake, so they vote in order to protect it – and they do
it together with all MEPs from their member state, not only those of their national party. Just like
what happens with an ideological regional party in a national parliament: on overall, they vote
together with the coalition they are in. But when the executive tries to pass a bill that may
undermine their local constituency, they cohesively vote against. Going back to the European
10
context, MEPs vote together with their fellow party companions, only as long as their direct national
interests are not at stake: in case that happens, they will vote against them, no matter what the EPG
say, and – what’s more important – together with their countrymen from other political groups. This
is the element that went missing in the previous literature: not only it has to be noted that
sometimes EPG fail to discipline their MEPs, but also that in these cases MEPs from all the groups
vote together with only one key element in common: being part of the same country (or countries)
whose interests were touched by the European legislation. The real discriminant when MEPs act as
“rebel” against the EPG line is not being part of a certain national party, as already acknowledged
(Raunio 2000; Hix et al. 2002; Coman 2009) but being part of the state – at large – where that party
comes from. Some specific examples that fit this theory will be presented in the last part of the
paper, dedicated to a brief qualitative in-‐deep elaboration of the results obtained in the previous
empirical part.
IV. Empirical part: methodology and results discussion. This chapter of the paper is dedicated to the
empirical analysis of MEPs’ voting behaviour, and it is divided in three sections, each of them tackling
the central research question from a different perspective: in the first part, we briefly analyse those
cases when EPGs are extraordinarily low cohesive; in the second, some key results from an original
survey submitted to MEPs’ assistants are analysed (especially in relation to two elements: national
interests clashing with EPGs’ lines, and committees showing different patterns of vote); in the third
part I investigate the cases when nationality prevails over EPG membership: a simple model is built to
analyse through a simple logistic regression what happens when MEPs choose to vote together with
their fellow countrymen, despite this means being “rebel” towards the EPG they belong to. All three
parts are devoted to the understanding if – and to what extent – the theory formulated in the
previous section fits the reality of the EP. In each section the separate results are discussed.
IVa. Analysis of outliers. As discussed extensively in the literature review section, we know that EPGs
are, generally, highly cohesive. This means, in short, that MEPs from the same political group are
likely to vote together, no matter which country they come from: a French socialist, for instance, is
more likely to vote together with a German Socialist than with a French green (or belonging to any
other group). But what exactly does “cohesive” mean? A variety of indices of party cohesion are used
in the literature on voting behaviour. The “Index of voting likeness” (Rice 1925) represents one of the
first attempts. It consists of the absolute difference between yes and no votes of the members of a
party, divided by the sum of yes and no votes. The main asset of this index is represented by its
simplicity; however, it presents the major shortcoming of not including abstentions in the

11
calculation6. Attinà (1990) proposed a slight modification of this index, including the possibility of
abstention. However, Attinà’s index can result in a negative number, making it harder to use it for
descriptive analysis and statistical purposes. Hix et al. (2005) introduced the “Agreement Index” (AI),
which is now considered the standard index to measure group cohesion. It is calculated as follows:
Yi denotes the number of Yes votes expressed by group i on a given vote, Ni the number of No votes
and Ai the number of Abstain votes. As a result, the AI equals 1 when all the members of a party vote
together and equals 0 when the members of a party are equally divided between all three of the
voting options (vote in favour, vote against, and abstain). The scores of the AI give us a first
impression of how cohesive the groups in the EP are. For the first four Parliaments (1979-‐1999), the
cohesion scores are taken directly from Hix et al. (2005: 218). For the fifth and sixth legislature (1999-‐
2009), the source is Bardi (2011). With respect to the current legislature (2009-‐2014), the source of
the data is www.votewatch.eu, and the cohesion scores are calculated for the first half of the
legislature (RCVs cast from July 2009 to January 2011). If we consider all the votes cast in the EP the
results are pretty straightforward. The EPGs show very high cohesiveness, starting from the very
beginning. Looking at the current EP, many EPGs show very high cohesiveness (four groups’ AI score
0.9 or higher: S&D, European People’s Party, Liberals and Nordic Green Left), and all the groups show
high cohesiveness (over 0.8), with the only exception of the non-‐attached members and of the
Eurosceptic group of Europe of Freedom and Democracy (EFD). From a diachronic perspective (1979-‐
2009), all the groups increased their cohesiveness, with the exception of the Euro-‐sceptics, falling
from 0.83 in 1989 to 0.49 in 2009. The AI scores are presented in Table 1.
6 Paradoxically then, in a group where half of the deputies abstain and the other half votes yes (or no), this index would give the result 1, which is the highest level of cohesion possible. This is the reason why this index does not provide an accurate picture of party cohesion.

12
Table 1. EPGs’ cohesiveness in RCVs, 1979-‐2011.
EP1 (79-‐84) EP2 (84-‐89) EP3 (89-‐94) EP4 (94-‐99) EP5 (99-‐04) EP6 (04-‐09) EP7 (09-‐11) PES 0.76 0.87 0.9 0.9 0.9 0.91 0.94 EPP 0.9 0.93 0.91 0.9 0.87 0.87 0.93 ELDR 0.85 0.85 0.85 0.86 0.88 0.89 0.9 LEFT 0.81 0.87 0.86 0.8 0.8 0.85 0.84 GAUL 0.8 0.84 0.85 0.79 0.75 0.73 0.87 GRN -‐ 0.81 0.85 0.91 0.92 0.91 0.96 CON 0.89 0.92 0.89 -‐ -‐ -‐ -‐ RIGHT -‐ 0.93 0.88 -‐ -‐ -‐ -‐ ANTI -‐ -‐ 0.83 0.67 0.5 0.46 0.49 REG -‐ -‐ 0.87 0.91 -‐ -‐ -‐ IND 0.78 -‐ -‐ -‐ 0.64 -‐ -‐ NA 0.74 0.79 0.81 0.63 0.44 0.44 0.42 Source: Hix et al. (2005), Bardi (2011), www.votewatch.eu. Party group labels: PES: Party of European Socialists (SOC, PES), then Progressive Alliance of Socialists and Democrats (S&D, after 2009 elections to include the Italian PD, Partito Democratico). EPP: European People’s party -‐ Christian Democrats & Conservatives (EPP, ED) and Italian Conservatives (FE), then EPP alone (after 2009 elections). ELDR: European Liberal, Democrat and Reform Party (ELD, ELDR groups), then Alliance of Liberals and Democrats for Europe (ALDE, after 2004 elections). LEFT: Radical Left (COM, LU, EUL/NGL) and Italian Communists & allies (EUL). GAUL: Gaullists & allies (EPD, EDA, UFE, UEN), then European Conservatives and Reformists (ECR, after 2009 elections). GRN: Greens & allies (RBW(84), G, G/EFA). CON: British Conservatives & allies (ED). RIGHT: Extreme Right (ER). ANTI: Anti-‐Europeans (EN, I-‐EN, EDD, IND/DEM after 2004 elections, then EFD after 2009 elections). REG: Regionalists & allies (RBW(89), ERA). IND: Independents (TCDI, TGI; group dismantled in October 2001). NA: Non-‐attached members.
The three main EP groups – Socialists, Christian Democrats/People’s Party, and Liberals – present a
relatively high level of cohesiveness starting from the first direct election (respectively 0.76, 0.90,
0.58). Since the first election the trend has constantly increased positively. Today, the three main
EPGs score respectively 0.94, 0.93 and 0.90. Looking at EP6, our object of analysis, we see that two
EPGs (Socialists and Greens) score more than 0.90; the three other “mainstream” groups (the
Christian-‐democrat group, Liberals and the radical left) score between 0.85 and 0.88. The only
exceptions to this trend are the national conservatives (Union for Europe of Nations) and the anti-‐
European (Independence/Democracy), both Euro-‐sceptic groups, even if to a very different degree7:
the former has an AI equal to 0.73, the latter 0.46. For a party group that define itself as anti-‐
European, though, a lack of discipline in performing its European function should not surprise.
Finally, it has to be noted that the group of non-‐attached MEPs’ cohesion fell drastically over time.
This is consistent with the fact that the threshold to form a group used to was lower, so the non-‐
attached group was smaller and more “homogeneous”. Since the 1990s, the non-‐attached group has 7 IND/DEM was a full-‐fledged anti-‐European party; after the 2009 European Election was renamed EFD, Europe of Freedom and Democracy. By contrast, The UEN group consisted more of conservative nationalist, “Euro-‐realists”, highly influenced by the tradition of the French right wing Gaullism. Founded in 1994, in 2009 merged in the newly established ECR Group, European Conservatives and Reformists, except for some more Euro-‐sceptic MEPs who joined the other new group, EFD.

13
constantly grown bigger and politically more heterogeneous, even though it remained numerically
dominated by far-‐right wing members. Thus, it is reasonable to expect its cohesiveness to decrease.
To sum up, in the light of the results of all RCVs one may conclude that the EP has been increasingly
marked by high cohesiveness (Hix et al. 2005: 231). However, looking only at the aggregated scores
for each EPG in a whole European legislature may be misleading, because all the variance between
the AI scores of each vote gets “diluted”. In other terms, we only look at the “general trend”, given
by the statistical average, of five years of votes; but we don’t exactly know what happens in each of
these votes. What can help, at least to give a brief idea of how actually more complex and
multifaceted is voting behaviour of MEPs, is to look at the statistical outliers of EPGs’ cohesiveness. In
statistics, an outlier is an observation that is numerically distant from the rest of the data; since the
unit of observation is the single RCV each MEP casts, these data were aggregated for each group. So
each outlier means a single vote where one of the groups is highly divided – despite on average these
groups are quite cohesive. If the EP resembles so much a classical Westminster democracy
parliament, these deviant votes should be present, but truly exceptional: a reiteration of such cases
could endanger the political unity of a political group, ultimately leading to fission. But if we look at
figure 1, a classical “box-‐and-‐whiskers-‐plot” that shows AI values of each political group in the 6th
European Parliament (2004-‐2009)8, we see a different picture.
Figure 1. Box plot of EPGs’ Agreement Index, 2004-‐2009
Source: author’s own compilation.
8 The choice of the 6th European Parliament, dismissed in 2009, was forced by the fact that complete and available datasets for all RCVs exist only for the past parliaments that completed their 5-‐years legislatures. For the current, 7th EP only the aggregated AI values, as shown in table 2, can be obtained through the website www.votewatch.eu

14
First of all, we can notice that a clear-‐cut division between two groups of EPGs exists: on the one
hand, the majority of generally pro-‐EU groups (Socialists, people’s party, liberals, greens and radical
left), on the other, the two euro-‐sceptic groups and the non-‐attached members. The former shows
some characteristics in common: first of all, as expected they are all positively skewed. The median is
very high, generally over 0.9, and the upper and the lower quartile are comprised between 1 (the
maximum score possible, which means complete cohesion – all MEPs voting together) and 0.8. Upper
“whiskers9” are either very small (People’s party group, radical left) or even absent, which means
that they overlap with the third quartile: all graphics are strongly negatively skewed. Since the lower
part of the box is generally around 0.8 (0.9 for the Greens), we can fairly say that in 75% of roll-‐call
votes the main EPGs are extremely cohesive. By contrast, lower whiskers are quite long and end
approximately at the value of 0.5/0.6 (excluding the greens, which show higher value, roughly 0.8).
So, even the minimum value of these EPGs is actually quite high. But what really strikes is the
number of outliers: all these groups show plenty of votes where they are profoundly divided, and so
much more divided than the median that statistically can be considered outliers. As for euro-‐sceptics
and non-‐attached, the situation is completely different: IND/DEM and non-‐attached show an
identical distribution, with the median close to 0.4, the first and third percentile roughly set at 0.25
and 0.6, and the whiskers ranging from the minimum value (0.0, which means complete division of
the group) to 1 (complete cohesion). And, most importantly, they show no outliers at all. UEN group,
despite having no outliers, shows some characteristics similar to the first group of EPGs: the median
is high (0.8), and the distance between the upper quartile and the maximum value is small, while the
distance between the lower quartile and the minimum value is more substantive. In other words,
UEN is negatively skewed like the first group of EPGs but shows no outliers like the second one.
Thus, we can affirm that Euro-‐sceptics and non-‐attached members are generally quite divided EPGs,
still with their differences (especially between IND/DEM and UEN), while the other, more pro-‐EU
groups tend to be much more cohesive, as most of the literature acknowledges (Attinà 1990; Hix et
al. 2005, 2006, 2007; Kreppel 2002). What this literature fails to highlight and generally overlooks is
the fact that even if this high cohesion is composed by a great majority of votes where these groups
are completely cohesive (because all of their MEPs vote in the same way), there’s a significant
minority of votes where they are completely divided, the AI scores being close to 0. This pattern
9 The upper “whiskers” show graphically the range of values that are comprised between the third quartile (Q3) and the most extreme value within 1.5 standard deviation from the 75th percentile; conversely, the lower whiskers identify the observation between the first quartile (Q1) and the most extreme values calculated in the same way (1.5 standard deviation from the 25th percentile): in mathematical terms, respectively Q3+1.5*(Q3-‐Q1) and Q1-‐1.5*(Q3-‐Q1).

15
strikes as quite surprising: even the mainstream, more organized, pro-‐EU political groups can bluntly
fail to discipline their members, letting them vote in a way that the group emerges as perfectly
divided. So, it can be misleading to only look at the mean cohesion of EPGs (Hix et al. 2005, 2006,
2007), because it doesn’t illustrate the distribution or the standard deviation, thus giving the
impression that all the votes have AI scores – more or less – close to this value. By contrast, to have a
more comprehensive knowledge of MEPs’ voting behaviour it is important to bear in mind that EPGs’
high cohesiveness is the result of almost all votes where EPGs are voting harmoniously together, but
a few where they completely fail to be cohesive. This picture is even reinforced by figure 2, which
shows the tendency of cohesion in time for each political group in the 6th European Parliament10.
10 Again, the choice of the second-‐to-‐last legislature (2004-‐2009) was constrained by the necessity of having a complete dataset of roll-‐call votes.

16
Figure 2. Main EPGs’ cohesion trend (mild and severe outliers highlighted), 2004-‐2009
Mild outliers: values lower than 1.5 standard deviation (light dot) Severe outliers: values lower than three standard deviation (thick dot) Source: author’s own compilation
The x-‐axis represents roll-‐call votes, from no.1 (September 2004) to no. 6200 (May 2009); the y-‐axis
represents values of the Agreement Index. Separate graphs are presented for each of the main
political groups (excluding non-‐attached members, IND/DEM and UEN which – as discussed before –
present lower cohesiveness, thus showing no outliers). The blue line represents the trend of AI in
time, while the dots represent the outliers. Here, a distinction between “mild outliers” (seen figure 1)
and “severe outliers” is added: the former are those values lower than one and a half standard

17
deviation from the mean AI of the group; the latter are calculated in the same way, but three times
less than the standard deviation (Ruan et al. 2005: 318). The impression we get from these graphs is
quite straightforward: even considering only the severe outliers (represented by thicker dots, while
smaller dots represent mild outliers) it is clear that the occasions where EPGs are extremely divided
are not so rare and exceptional. They are, more likely, something that happens constantly over time
(as demonstrated by the fact that the red dots are homogenously distributed in the graph11) but gets
statistically “swallowed” and diluted, becoming invisible, by the high number of votes cast and the
often complete cohesiveness of groups. Table 2 quantifies the recurrence of this lack of cohesion,
showing the actual number of outliers by group.
Table 2. Mild and severe AI outliers by EPG, 2004-‐2009
Outliers EPGs Mild (1,5 sd) Severe (3 sd) ALDE 449 125 EPP-‐ED 327 100 EUL/NGL 468 54 G/EFA 394 163 SOC 429 107 Total 2067 (1623) 549 (498)
Source: author’s own compilation.
The importance of the number of outliers comparatively between groups should not be overstated,
but even if we focus only on the aggregate numbers some interesting indications can be elaborated.
In the whole EP6, EPGs have been “mildly non-‐cohesive” 2067 times, and “severely non-‐cohesive”
549 times. The number in parenthesis refers to the number of actual unique votes where at least one
group was extraordinarily non cohesive, since in some cases it happened that more than one group
were showing a very low AI score. So, in the same way, we can say that in 1623 public votes it
happened that at least one political group was mildly divided, whereas in 498 cases at least one was
severely divided. Considering that in the five years of the 6th European legislature taken into
consideration 6200 roll-‐call votes have been cast, we can fairly affirm that (on average) roughly every
four votes cast, there’s one vote where at least one EPG is mildly divided, while every twelve votes
there’s a vote where at least one EPG is severely divided. Considering the myriad of votes cast in a
single plenary session (Corbett et al. 2011: 200), this means that there is no plenary where all EPGs
are cohesive on every vote. This picture plainly contrasts with the oft-‐repeated claim according to
11 The only exception seems to be the People’s party group, that right at the beginning of the European legislature shows a concentrated number of outliers, while roughly after vote 2000 seems to be more cohesive for some time, showing no severe outliers at all (even though it continues to present mild outliers).

18
which the “the European Parliament is surprisingly like all other democratic parliaments” (Hix et al.
2005: 509): who could imagine a German Bundestag, an Italian Camera dei Deputati or a French
Assemblée nationale where the marginal party groups are always highly divided (UEN, IND/DEN and
non attached members) while the more institutionalised ones are highly cohesive in the majority of
votes, but every now and then fail completely to discipline their members resulting in a complete
division? The explanation of this dynamics is strictly related to the peculiar institutional arrangement
of the European Union: the EP, lacking the classical government-‐opposition dynamics of democratic
politics (Mair and Thomassen 2010: 21), can somehow “afford” to have these divisions. There is no
executive that governs, depending on a majority in the parliament; so even if sometimes these
groups lack cohesion, no government can fall – and more importantly, no group has incentives to
split. EPGs are certainly the “internal engine” of the Parliament, and most of its day-‐by-‐day work
revolve, by praxis, around them. The importance of political groups has emerged since the very
beginning, when in 1952 the at the time appointed MEPs decided to sit according to their political
family instead of nationality (Bardi and Ignazi 2004; Corbett et al. 2011: 78), so their centrality has
not to be dismissed. But this does not mean that their members cannot decide, from time to time, to
vote along patterns that completely break (because a national interest is at stake?) their unity as
political groups. And since, as scholars acknowledge (Raunio 1999: 193; Westlake 1994a), EPGs or
even more European parties have very little power to “whip” them, their election being ultimately in
the hand of the national parties, no consequences arise from these “rebellious votes”. The reason of
such understatement, as stated before, is based on a perspective that looks only at the mathematic
mean of EPG cohesiveness over five years, but does not deepen the analysis to what really happens if
we disaggregate these statistical indexes.
IVb. MEPs’ assistants survey. Surveys are a useful tool to explore the preferences of the members of
elected assemblies. To date, each directly elected EP convocation has been surveyed by scholars; the
first four by different research groups12, while the remaining three (V, VI, VII) were investigated by
the European Parliament Research Group (EPRG), led by Farrell et al. The survey includes personal
questions, questions about the attitudes towards representation and general political attitudes, and
on further EU institutional reform. But these already available surveys do not include specific
question on the basic research question of this paper – the intertwining between national affiliation
12 The 1979-‐84 Parliament was investigated with a survey prepared by Reif and Wildenman (Bardi, 1989; Westlake, 1994a). In the 1984-‐89 parliament there was a survey conducted by Hrbek and Schweitzer (1989). In the 1989-‐94, the survey was organised by Bowler and Farrell (1993). In the 1994-‐99 parliament, Wessels led the research group on the MEPs, while doing a parallel study on members of national parliaments in 11 EU member states (Katz and Wessels, 1999; Schmitt and Thomassen 1999).

19
and EPG membership in shaping the outcome of the vote – and on the role of committees in the EP’s
legislative process. So, a new survey had to be created.
The target of the new survey, MEPs’ assistants instead of MEPs’ themselves, was decided for a
twofold reason: on the one hand, MEPs have usually little time, so choosing their (usually numerous)
staff instead of them makes the response rate higher; secondly, assistants help the work of their MEP
on a daily basis, often doing the “hard work” of following the committees, reading, writing and
correcting the amendments, preparing reports, and most of all drafting the vote list of a specific
group; so to a certain extent they not only are a reliable source of information, but in some cases
may know better than their bosses. The survey13 consists of 24 questions, covering four main topics:
the role of lobbies in the EP; the role of committees in the legislative process; the contrast between
national affiliation and EPG membership; and finally, some information on RCVs vis-‐à-‐vis the other
types of votes in the EP. Roughly half of the question were structured as closed-‐questions where the
respondent could pick amongst a range of possible answers; more or less the other half were
questions where it was asked to pick the level of agreement or disagreement with a certain
statement (1-‐5 range), while in some open-‐ended question it was asked to list a certain set of
answers. All the questions presented the possibility to add some generic “additional information”, in
case the respondent wanted to deepen a certain aspect of the question. The final response rate was
188, resulting in the 24.9% of the 754 MEPs that compose the EP14. All EPGs and almost all member
states (23 out of 2715) are included in this sample.
In question 11 MEPs’ assistants were asked: “do you believe that some committees can be
considered more important than others?” and they almost unanimously convened that actually not
all the votes cast in the EP are of the same importance (86.9% yes, 13.1% no). In the following
question they were asked to simply list the committees that they consider more important, with no
13 The survey was submitted using the platform surveymonkey; two versions of it were created – one in Italian, the other in English. Both were submitted to all MEPs’ assistants using the official mail of an Italian MEP, Mrs. Rita Borsellino, in July 2012. 14 There is no fixed rule on the dimension of each MEPs’ staff (usually they have two assistants; in some cases one or three; rarely more than three), but in the request for the compilation of the survey it was explicitly asked that for each office only one assistant should fill out the survey. So, we can expect that each response actually coincides with one – and only one – MEP. In terms of response rate (188), this number can be considered acceptable, especially if we keep in mind that the last official MEPs’ survey, held in 2009 using the professional agency Ipsos-‐MORI and available in 23 different languages (Bulgarian, Czech, Danish, Dutch, English, Estonian, Finnish, French, German, Greek, Hungarian, Irish, Italian, Lithuanian, Latvian, Maltese, Polish, Portuguese, Romanian, Spanish, Slovak, Slovene and Swedish) had “only” 270 responses. 15 No assistant from Lithuania, Luxembourg, Malta and Slovakia replied. To be noted a slight over-‐representation of the Italian population (54 responses) and for the S&D group (63, compared with the “only” 40 responses from EPP group), probably due to the fact that the request to fill the questionnaire came from the email address of an S&D Italian MEP.

20
limit of number of answers that they could give, in order not to “constrain” their opinion. On
average, each respondent chose roughly two committees. Many committees were completely
ignored (eight committees received no mention at all); on the contrary, there is a discrete separation
between the top five committees and the rest. As presented graphically in figure 3, the first five
committees together (ITRE, ENVI, ECON, IMCO, AGRI)16 represent roughly ⅔ of all the answers
(ranging from 16% of the first one to 10% of the fifth). All the other 20 committees17 together
correspond approximately to the remaining ⅓.
Figure 3. Importance of EP committees, MEPs’ assistant survey 2012
Source: author’s own compilation.
This is consistent to certain set of consideration: first of all, not all the committees deal with
legislative issues. Some of them have their competence limited to the production of non-‐binding
resolutions. Secondly, some issues per se can considered more important than others (for instance, 16 ITRE (Industry, Transport and Research) committee deals mainly with: the EU’s industrial and research policy, and development of new technologies; space policy; measures relating to energy policy in general and the security of energy supply and energy efficiency; the (former) Euratom Treaty and Supply Agency; nuclear safety, decommissioning and waste disposal in the nuclear sector; and finally, the information society, information technology and telecommunication infrastructures. ENVI (Environment, Public Health and Food Safety), as its name says, deals with three macro-‐areas, all of them composed by many different domains. The first area is environmental policy and environmental protection measures (air, soil and water pollution, waste management and recycling, climate change, protection of biodiversity and sustainable development). The second is public health (programmes in the field of public health and pharmaceutical and cosmetic products). The third is food safety issues (the labelling and safety of foodstuffs, veterinary legislation and public health checks on food production systems). ECON (Economic and Monetary Affairs) committee is responsible for the functioning of the Economic and Monetary Union, and the European monetary and financial system (including relations with the relevant institutions or organisations); free movements of capital and payments; rules on competition and State or public aid; tax provisions, and finally the regulation and supervision of financial services. IMCO (Internal Market and Consumer Protection) deals mainly with the coordination at EU level of national legislation in the sphere of the internal market and for the customs union, (especially the free movement of goods); measures aiming at the removal of potential obstacles to the functioning of the internal market; and finally, the promotion and protection of the economic interests of consumers (except for public health and food safety issues, competences of ENVI). Lastly, AGRI committee is responsible mainly for the operation and development of the common agricultural policy, and for the rural development, including the activities of the relevant financial instruments. 17 Currently, as pointed out before, there are 20 standing committees, two sub-‐committees and one newly established special committee (CRIM). In the survey also the recently dismantled two special committees (CRIS and SURE) were included, resulting in 25 possible answers.
16% (57) ITRE
14% (48) ENVI
13% (46) ECON
11% (39) IMCO
10% (34) AGRI
(Main five: 66%)
(All others: 34%)

21
building a transnational railway station versus promoting European-‐wide petitions) Finally, some
issues are certainly salient and crucial but the EU has not (yet?) gained a direct influence on them,
while on others the EU is the main policy-‐maker (for instance, foreign policy – fundamental, but still
completely in the hands of the national governments versus agriculture, fisheries or the common
monetary policy). Committees are certainly the “political backbone” of the European Parliament
(Westlake 1994a: 191; Neuhold 2001), but to different degrees. After all, maybe not all the votes
cast in the EP are of the same importance.
The following question was posed as a statement MEPs’ assistant could agree with or not: “the logics
of how MEPs vote vary between the different committees”. 76.7% of the respondents agreed, while
only 23.3% disagreed. This is a broad question; so, then it was asked: “More specifically, do you
believe that in some committees the political groups are more cohesive while in other committees
MEPs vote more often together with their countrymen (even if they belong to different groups)?”
Again, 68.6% of MEPs’ assistants agreed and 31.4% did not. In question 15 and 16 they were asked to
list the committees where political groups are more cohesive, and committees where MEPs vote
more cohesively by member state. Table XVIV shows the descriptive statistics of the very simple
dataset built from these three questions18.
Table 3. Descriptive statistics of data from question 11-‐16, MEPs’ assistant survey 2012
Variable Obs Mean Std. Dev. Min Max
Committee importance 25 14 17.79279 0 57 EPG cohesive 25 3.44 2.987195 0 12
Nationality cohesive 25 3.36 4.152108 0 17 Source: author’s own compilation.
According to MEPs’ assistants, the five committees mostly characterized by high political groups’
cohesiveness are Foreign Affairs; Civil Liberties, Justice and Home Affairs; Women’s Rights and
Gender Equality; Development; Human Rights. All prominent issues, but on which the EU has less say
from a merely legislative point of view. On the contrary, the five mostly State-‐driven committees are
18 The number of each committee corresponds to the number of respondent naming that specific committee. As in question 11, also when asked about country-‐oriented vis-‐à-‐vis group-‐oriented committees, MEPs’ assistant had free choice to enlist either one or more committees (or none, if they didn’t have an opinion). The fact that the question about the sheer importance of committees received more answers shouldn’t be surprising: people working in the EP have a clear idea of where the real importance of the legislative process lies (even if they work for MEPs members of different committees); on the contrary, to know what competing logics do these committees follow, they necessarily have to be aware of its internal dynamics, either working there or having a close relation to some of the staff/some MEPs involved in their works. Thus, on average each respondent “weighted” his or her answer, limiting it to one or two committees they know better (or even refraining from a response).

22
the following: Agriculture and Rural Development; Industry, Transport and Research; Environment,
Public Health and Food Safety; Regional Development; Fisheries. Just by simple eyeballing these data,
it emerges clearly that three out of five of them are also on the list of the most important
committees, and that the most important committees and those more “nationality-‐oriented” seem
correlated; on the contrary, the most important committees and the more “group-‐oriented” seem
not. However, the correlation between these three groups was calculated (table 5); then, a simple
regression is run to see if there is a statistical significance in this relation (table 4, figure 4).
Table 4. OLS regression. DV: committee importance; IVs: EPG cohesiveness, nationality cohesiveness Figure 4. Twoway with fitted values (DV and significant IV)
Model 1. Model 2. Model 3.
DV: Committee importance
EPG 0.873
0.258 Cohesive -‐1.229
(0.947)
Nationality
2.891*** 2.862*** Cohesive
(0.660) (0.682)
Cons 11.00* 4.288 3.497
-‐5.549 -‐3.481 -‐4.589
r2 0.0215 0.455 0.457 chi2
F 0.505 19.20 9.252 N 25 25 25
Standard errors in parentheses
* p<0.1, ** p<0.05, *** p<0.01
Table 5. Variables correlation
Committee Importance EPG cohesive Nationality cohesive Importance 1.000
EPG cohesive 0.1466 1.000 Nationality cohesive 0.6745 0.1547 1.000
Source: author’s own compilation (all three).
First of all, as we can see, cohesiveness by EPG and by member state are typical of two substantively
different groups of committees (low correlation: roughly 0.15), trivially confirming that these two
dynamics are clearly competing. This is banal and does not certainly need any empirical confirmation,
but it can work as a proof that the choice of MEPs’ assistants as well-‐informed recipients of a survey

23
about voting behaviour in the EP is successful. Secondly, correlation between importance of a
committee and predominance of EPG cohesion in its internal dynamics is, again, quite low (0.14).
This is certainly a more interesting result, which partially that points towards a more careful
consideration of the concept, at large, of aggregated EPGs cohesion. But what’s really surprising is
the correlation of committee importance and nationality-‐oriented patterns of vote: according to our
recipients, there is a substantially high correlation (almost 0.7). Put all together, these information
can be summarized as follows: some committees deal with less important issues, and usually in these
committees votes are defined by group affiliation – thus, as scholars (Hix et al. 2006: 495; Kreppel
2002) have extensively proved, falling along the traditional left-‐right cleavage. But in most important
committees, the competing logic of voting according to national affiliation is much stronger.
The OLS statistical regression confirms this argument, adding statistical significance to it. The
dependent variable19 is “committee importance”, while obviously the two independent variables are
“EPG cohesion” and “nationality cohesion”. Three models are run separately: the first two with one
independent variable, the third with both. Consistently with our argument, EPG cohesiveness is
never statistically significant, while nationality always is (and with a 99% confidence interval).
Moreover, if we look at the R2 we see how the model with nationality cohesiveness, in terms of
goodness of fit, expectedly explains much more of the variation than model 1. The twoway graph
shown in figure 4, in addition to a visual representation of this relationship, helps us isolating some
deviant cases, which we can divide in two categories. On the one hand – above the regression line –
the group of committees where nationality is highly cohesive, but their importance is not as high
(PECH, REGI, AFET, AGRI). The Agriculture committee, in particular, strikes as a real outlier. Despite
being one of the crucial committees of the EP, partially responsible for the outcome of EU’s Common
Agricultural Policy that represents almost one third of the whole EU budget, as proved by the fact
that some academic works are dedicated to it alone (Roederer-‐Rynning 2003) and MEPs’ assistant
placed it the 5th position of the most important committees, its cohesiveness by nationality is so
distant even from the second place that it is placed well outside the regression line20. On the other
hand, those committees that tend not to be dominated by a country-‐based rationale, but
nonetheless are considered relatively important are JURI, BUDG and ECON.
19 Here, the goal is not to establish a true cause-‐effect relationship between the variables: of course, we are not implying that it is one of the two competing logic that actually causes the importance of a committee. Rather, since the model is simple and has only one (or two) independent variables, this regression is a test of significance of the correlation, following the indication of King et al. (1994). 20 AGRI committee received 17 mentions as the most country-‐oriented committee; ITRE committee, the second most “national” committee according to MEPs’ assistant, almost half of it.

24
IVc. Nationality prevails: a statistical model for rebellious bevahiour. In this empirical part the cases
when MEPs actually choose to follow their fellow countrymen instead of their politically
homogenous colleagues are analysed. In order to do this, a statistical model is built, using a logistic
regression. The goal is twofold. On the one hand, it is to assess if being part of a certain country and
of a certain EPG has a statistical influence on the probability that a MEP disregards his/her EPG to
vote accordingly to his/her fellow countrymen. EPGs re included as a sort of control variables, since it
is already well known which groups are cohesive and which are not. Nationality is expected to give
original results, since except for the generic AI scores that can be calculated via the online platform
www.votewatch.eu and presented in various works (Hix et al. 2007 for the first 5 European
legislatures; Hix 2009 for the 6th EP; Votewatch 2013 report for some crucial votes cast in the current,
7th EP) no study has actually analysed with more refined statistical tools which countries are more or
less cohesive in terms of nationality (at large) prevailing over European party membership. On the
other hand, the goal is to assess if also some specific characteristics of the MEP (size of country
delegation to the EP, origin from EU15 or the recently eastern-‐enlarged countries) and of the vote
(legislative vote, budget vote, result of the vote, margin, vote in the most important committees)
have a significant influence. The expectation on these independent variables is discussed below.
Again, the dataset used is the totality of RCVs cast in the 6th European Parliament, 2004-‐2009. My
unit of analysis is the single vote; considering that 6200 RCVs have been cast in the 5-‐years
legislature and multiplying this number for each MEP present at that vote, I have more than 3 million
observation (exactly 3,332,882).
First of all, I have defined the political line of either a European political group or a national
delegation as the position adopted by the plurality of MEPs within that Group or Delegation21. In
cases where an equal number of MEPs vote "yea" and "nay" in a European political group, the
conclusion is that "there is no political line" and the statistics for the MEPs in the European political
groups and the national party delegations are treated accordingly. Then, I proceed to codify loyalty
and rebelliousness of MEPs from these information: an MEP is considered 'loyal' to his/her European
political group or national delegation if his/her voting option is identical to the political line of the
21 For instance: if 40 MEPs from the ALDE group voted "yea", 25 MEPs voted "nay" and other 27 MEPs abstained, the political line of ALDE to this vote was "yea". In the same way, if 50 Italian MEPs voted “yea”, 15 “ay” and 13 abstained, the Italian national delegation line is “yea”.

25
political group or national delegation, respectively22. Here the same caveat made by Hix et al. is valid:
the use of the terms “loyal” and “rebel” does not imply a value judgment as to whether MEPs were
“right” or “wrong” to vote they way they did; the terminology is merely designed to straight-‐
forwardly define how MEPs behave. Considering these assumptions, five options are possible for a
MEP in each vote:
a. EPG and national delegation line coincide. This means that both the plurality of members
of the group the MEP belongs to and the plurality of members coming from his/her country
voted in the same way: for instance, “yea”. In this case the MEP can be:
a1. Loyal to both (he/she votes “yea”)
a2. Rebel to both (he/she votes “no”, or abstains). This happens rarely.
b. EPG and national delegation line diverge. This, of course, happens more often: for
instance, the plurality of members of the group the MEP belongs to voted “yea”, while the
plurality of members coming from his/her country voted “nay”. In this case the MEP can be:
b1. Loyal to his/her EPG but rebel to his/her national delegation (voting “yea”)
b2. Conversely, loyal to the national delegation but rebel to the EPG (voting “nay”)
b3. Rebel to both (in this example, abstaining).
After having defined loyalty and rebelliousness of each MEP in each vote, the dependent variable is
created: a dummy variable called “nationality prevails”. This corresponds to case b2, namely those
cases when there is a clear contrast between the political group line and the national delegation line
and the MEP decides to follow their countrymen, even if this means neglecting the European group
line. Before discussing the independent variable, a note of caution has to be made: if we look at
sheer numbers, the votes identified by the dependent variable actually represent a very small
portion of the votes cast in the analysed time span, 2004-‐2009: only in 4,33%23. But two things have
to be considered in this regard: firstly, here we consider only the public, RCVs; in secret votes these
national alignments can emerge more freely, because there is no “whip effect” from the EPG.
Secondly, they do not include the cases when MEPs’ accordance with their EPG is “random”, because
it is only by chance that the EPG line is the same as that of their country of origin (which is the real
reason why the MEP voted in that way).
22 For instance: if an Italian MEP from the Socialist group votes "FOR" and the political line of the Socialist group to that vote (defined by the plurality of its members) is also "yea", then he is loyal to his political group. On the contrary, if he had voted "nay" or abstained, he is considered as “rebel”. Then, the same calculation is made for his national affiliation: if the line of Italian MEPs was also “yea” (calculated in the same way: how the plurality of Italian MEPs voted), he is also considered “loyal” to his national delegation. So, in this case he is loyal to both his political group and country. 23 Precisely, 162,921 votes over 3,761,021 total votes cast.

26
To unambiguously prove this point, it is sufficient to look at the basic descriptive statistics of the
aforementioned cases a1 (MEP is loyal to both national delegation and EPG) and b1 (MEP is loyal to
his/her to EPG, but rebel to his/her national delegation). This information can be found in table 6, the
taxonomy of loyalty and rebelliousness of MEPs according to the two “dimensions” identified here,
EPG and national delegation24.
Table 6. Taxonomy of MEPs’ loyalty / rebelliousness
National delegation
Loyal Rebel
EPG Loyal 73,34% 15,16%
Rebel 4,33% 5,13%
Source: author’s own compilation.
It is quite evident how the small percentage discussed before (4,33%) acquires a new value if
compared to the opposite case (“EPG loyal / national rebel”): 15,16%, only roughly three times. This
means that the cases where, in order to follow their political colleagues, an MEP has to vote against
the national majority are relatively rare25. But most of all, what strikes is the overarching majority of
cases when both EPGs lines and national majority line actually coincide (73,34%): this means that
most of the times MEPs vote according to both their party line and national line. So, further national
alignments may be “hidden” by this recurring EPG/nationality harmony, as I argued before: when
both loyalties emerge it is not possible to pinpoint, if not with an in-‐deep analysis of each vote, what
came first – EPG membership or national affiliation. In other words, my empirical operationalization
of the concept of “nationality prevails” is extremely strict. This comes at the cost of leaving some
cases out, but with the advantage of identifying a rigorous and unbiased sample of cases where,
without any doubt, national affiliation prevails over partisan lines. Finally, even if it is out of the
scope of the discussion here, it is worth noting that the “rebel / rebel” percentage should not be
surprising, since it includes all the cases when an MEP votes against his EPG but together with his
national party delegation (not the national delegation, at large, discussed here!), MEPs’ “main
principal” according to EP students that investigated this aspect of voting behaviour (Raunio 2000;
Hix et al. 2002; Coman 2009).
24 For simplicity, in table 6 cases a2 and b3 are considered as the same item (rebelliousness to both EPG and national delegation), without distinguishing if EPG line and country majority were actually coinciding. Such distinction, in effect, is not relevant to the discussion. 25 This, of course, depends also on the fact that sometimes, especially for the smaller countries, the national line is actually defined by the two bigger EPGs (and still many vote are based on a Popular party-‐Socialist coalition).
27
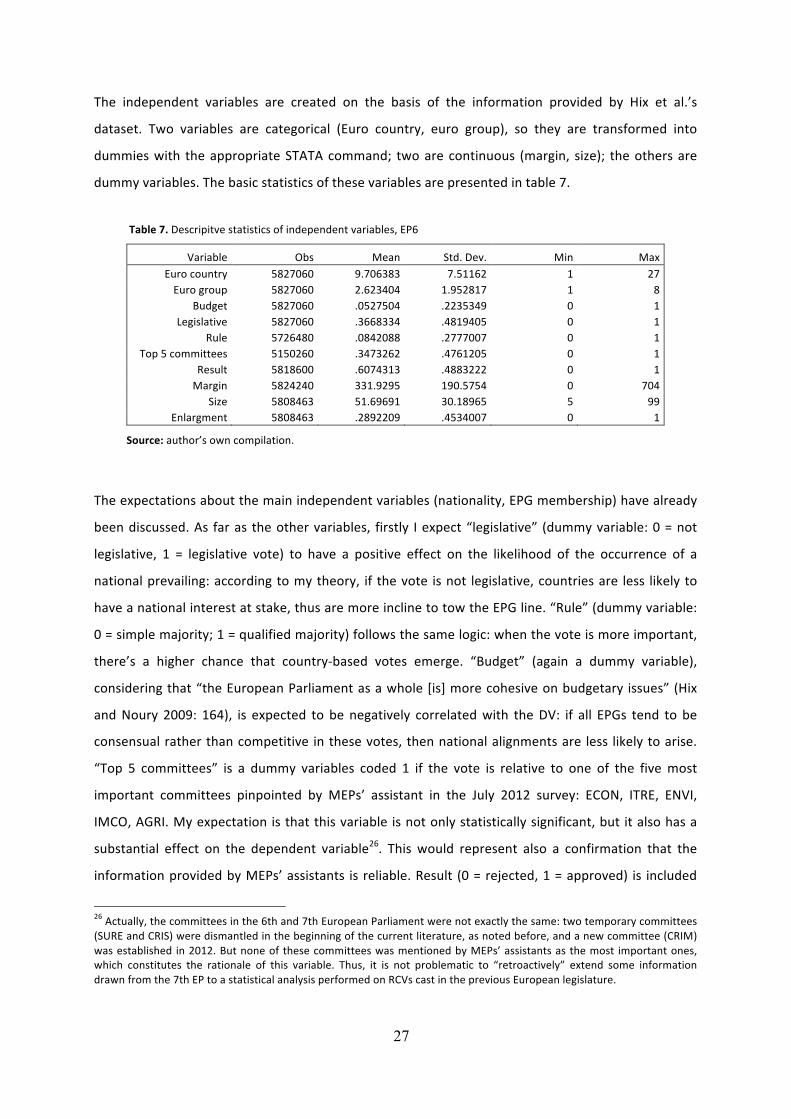
The independent variables are created on the basis of the information provided by Hix et al.’s
dataset. Two variables are categorical (Euro country, euro group), so they are transformed into
dummies with the appropriate STATA command; two are continuous (margin, size); the others are
dummy variables. The basic statistics of these variables are presented in table 7.
Table 7. Descripitve statistics of independent variables, EP6
Variable Obs Mean Std. Dev. Min Max Euro country 5827060 9.706383 7.51162 1 27 Euro group 5827060 2.623404 1.952817 1 8
Budget 5827060 .0527504 .2235349 0 1 Legislative 5827060 .3668334 .4819405 0 1
Rule 5726480 .0842088 .2777007 0 1 Top 5 committees 5150260 .3473262 .4761205 0 1
Result 5818600 .6074313 .4883222 0 1 Margin 5824240 331.9295 190.5754 0 704
Size 5808463 51.69691 30.18965 5 99 Enlargment 5808463 .2892209 .4534007 0 1
Source: author’s own compilation. The expectations about the main independent variables (nationality, EPG membership) have already
been discussed. As far as the other variables, firstly I expect “legislative” (dummy variable: 0 = not
legislative, 1 = legislative vote) to have a positive effect on the likelihood of the occurrence of a
national prevailing: according to my theory, if the vote is not legislative, countries are less likely to
have a national interest at stake, thus are more incline to tow the EPG line. “Rule” (dummy variable:
0 = simple majority; 1 = qualified majority) follows the same logic: when the vote is more important,
there’s a higher chance that country-‐based votes emerge. “Budget” (again a dummy variable),
considering that “the European Parliament as a whole [is] more cohesive on budgetary issues” (Hix
and Noury 2009: 164), is expected to be negatively correlated with the DV: if all EPGs tend to be
consensual rather than competitive in these votes, then national alignments are less likely to arise.
“Top 5 committees” is a dummy variables coded 1 if the vote is relative to one of the five most
important committees pinpointed by MEPs’ assistant in the July 2012 survey: ECON, ITRE, ENVI,
IMCO, AGRI. My expectation is that this variable is not only statistically significant, but it also has a
substantial effect on the dependent variable26. This would represent also a confirmation that the
information provided by MEPs’ assistants is reliable. Result (0 = rejected, 1 = approved) is included
26 Actually, the committees in the 6th and 7th European Parliament were not exactly the same: two temporary committees (SURE and CRIS) were dismantled in the beginning of the current literature, as noted before, and a new committee (CRIM) was established in 2012. But none of these committees was mentioned by MEPs’ assistants as the most important ones, which constitutes the rationale of this variable. Thus, it is not problematic to “retroactively” extend some information drawn from the 7th EP to a statistical analysis performed on RCVs cast in the previous European legislature.

28
simply as a control variable. “Margin” is expected to have a negative effect on nationality prevails:
the rationale is that the smaller the margin between yea and nay in a certain vote, the more
contested the vote is, and I expect national alignments to be more likely to emerge when votes are
controversial. “Size” is included to control for the fact that bigger member states may be more likely
to show a statistical influence on the dependent variable simply because they elect more MEPs.
Finally, a variable called “enlargement” (dummy: 0 = EU15, 1 = eastern countries + Malta, Cyprus) is
included to see if the 12 countries that recently joined the EU show different parliamentary
behaviour in respect to the EU15 countries. According to the (albeit small) literature on voting
behaviour before and after the eastern enlargement (Hix and Noury 2009, Bressanelli 2012), arguing
– in short – that these new member states are not yet completely “socialized” to the dynamics of the
EP, thus their MEPs are less prone to follow the EPG but this variance is practically negligible, I expect
this variable to either have a slightly positive effect on my DV and to be statistically non-‐significant.
Since the dependent variable is a dummy variable, a logistic regression is run. Three different models
are tested separately; after running the regression, the margins are further elaborated to have
substantially comparable coefficients27. Results of the logistic regression are shown in table 7.
27 The STATA command used is the following: margins, dyd(*)

29
Table 7. When nationality prevails, 2004-‐2009: logistic regression.
Model 1 Model 2 Model 3
DV: nationality prevails
Italy . .
. .
Germany -‐0.802*** -‐0.962***
(0.0151) (0.0147)
Sweden 0.843*** 0.819***
(0.0156) (0.0151)
Greece 0.469*** 0.403***
(0.0163) (0.0159)
Portugal -‐0.836*** -‐1.013***
(0.0262) (0.0260) UK 0.596*** 0.728***
(0.0116) (0.0111)
France -‐0.000287 0.0216*
(0.0129) (0.0124)
Spain -‐0.539*** -‐0.689***
(0.0171) (0.0168)
Romania -‐1.044*** -‐1.014***
(0.0275) (0.0273)
Hungary -‐0.265*** -‐0.328***
(0.0201) (0.0198)
Slovakia -‐0.101*** 0.205***
(0.0205) (0.0199)
Belgium -‐0.308*** -‐0.229***
(0.0195) (0.0190)
Cyprus -‐0.307*** -‐0.464***
(0.0411) (0.0408)
Latvia 0.0597** 0.116***
(0.0256) (0.0251)
Lithuania -‐0.363*** -‐0.446***
(0.0276) (0.0274)
Malta 0.123*** -‐0.0103
(0.0353) (0.0351)
Denmark 0.552*** 0.457***
(0.0187) (0.0183)
Ireland 0.332*** 0.501***
(0.0192) (0.0189)
Bulgaria -‐0.737*** -‐0.648***
(0.0316) (0.0312)
Netherlands 0.156*** 0.0573***
(0.0168) (0.0163)
Poland -‐0.0483*** 0.140***
(0.0135) (0.0131)
Czech Republic 0.715*** 0.758***
(0.0147) (0.0142)
Austria 0.00769 0.0269
(0.0194) (0.0190)
Slovenia
-‐1.553***
-‐1.600***
(0.0594) (0.0593)
Luxembourg -‐0.426*** -‐0.577***
(0.0399) (0.0397)
Finland -‐0.349*** -‐0.545***
(0.0267) (0.0264)
Estonia -‐0.717*** -‐0.912***
(0.0462) (0.0460)
EPP-‐ED .
.
.
.
SOC -‐0.378***
-‐0.414***
(0.00770)
(0.00749)
ALDE -‐0.264***
-‐0.252***
(0.00998)
(0.00949)
UEN 0.221***
0.362***
(0.0129)
(0.0111)
G/EFA -‐1.048***
-‐1.099***
(0.0190)
(0.0188)
EUL/NGL -‐0.557***
-‐0.400***
(0.0151)
(0.0147)
IND/DEM 0.863***
1.295***
(0.0113)
(0.0108)
na 1.074***
1.223***
(0.0102)
(0.00952)
Budget -‐0.0620*** -‐0.0590*** -‐0.0497***
(0.0168) (0.0167) (0.0167)
Legislative 0.201*** 0.202*** 0.205***
(0.00611) (0.00606) (0.00607)
Rule 0.0824*** 0.0841*** 0.0869***
(0.00986) (0.00977) (0.00980)
Top 5 comm. 0.0258*** 0.0241*** 0.0224***
(0.00610) (0.00605) (0.00606)
Result 0.0203*** 0.0176*** 0.0199***
(0.00570) (0.00565) (0.00567)
Margin -‐0.00265*** -‐0.00261*** -‐0.00263***
(0.0000150) (0.0000149) (0.0000149)
Size
-‐0.00323***
(0.0000976)
Enlargment
-‐0.243***
(0.00699)
_cons -‐2.326*** -‐2.404*** -‐2.144***
(0.0117) (0.0107) (0.00922)
r2
chi2 108380.7 79289.3 78561.6 F
N 3332882 3332882 3331846 Standard errors in parentheses
* p<0.1, ** p<0.05, *** p<0.01
Source: author’s own compilation.

30
Model 1 is the complete model with all the independent variables, excluding “Size” and
“Enlargement” that showed collinearity problems with the country dummies. Model 2 excludes the
EPG dummies, while model 3 excludes the country dummies and includes the aforementioned two
country-‐related variables. The three models show little difference both in terms of substantial effect
of coefficients and of statistical significance.
First of all, it can be noted that, as expected, all EPGs are statistically significant at 99% confidence
interval, and their substantial effects are consistent to the generally acknowledged cohesion of the
groups: the two euro-‐sceptic groups and the non attached members have positive coefficients (which
means that being part of these groups increases the likelihood of a national prevailing), while the
others have positive coefficients. Secondly, country dummies show in the majority of cases negative
coefficients, which means that a certain member state’s MEPs are less incline to vote together with
their countrymen at the expenses of their EPG. But for some countries the coefficients are negative:
from the highest to the lowest coefficients, Sweden, Czech Republic, UK, Denmark, and to a smaller
degree Greece, Ireland, Netherlands, Malta28. These results are consistent with the common
perception of euro-‐scepticism in EU countries, as shown extensively by Eurobarometer surveys, and
contribute to fill the gap in the current literature that, as explained beforehand, usually looks at AI
scores, incurring in methodological problems29. For instance, Hix and Noury have simply recognized
this conundrum – incidentally, in a footnote – without deepening the analysis: “Interestingly, one of
the most ‘Eurosceptic’ member-‐states, the United Kingdom, has the lowest level of nation-‐based
voting among its MEPs” (Hix and Noury 2009: 173). Thirdly, the analysis of the other variables shows
interesting results. “Budget”, in line with my expectations, is statistically significant but with negative
coefficients, which means that a national prevailing is less likely to arise when there is a budgetary
vote (even if with a substantively small effect). “Legislative”, again as expected, is statistically
significant, positively correlated with the dependent variable and has a consistent substantial effect:
when the vote is legislative there’s a substantially greater likelihood that an MEP votes according to
his/her national colleagues and against the line of his/her EPG. This confirms my theory according to
which it’s in the most important votes that such deviant behaviours are more likely to emerge.
“Rule”, “Top 5 committees” and “Result” are all statistically significant with positive coefficient. This
28 Austria has positive coefficients (even though substantially close to zero, 0.007) but is not statistically significant. 29 For instance, if a small country elects MEPs that sit in only two politically close EPGs, its national AI is certainly over-‐estimated. On the contrary, a big member state like the UK elects members for all groups, and in addition to that its members sitting in the EPP/ED group belong to different national parties and political families, leading to different behaviour. So, AI calculated by nationality in this case would be lower than the one of the aforementioned small state: but does that mean that in the UK national-‐based votes are less frequent? Not really.

31
is expected for the first two (even though the substantial effect of the variable that controls for the
five main committees is actually smaller than expected), while “Result” is surprising: in fact, such
national prevailing is more likely to emerge when the motion or legislation under scrutiny gets
approved instead of rejected. This is not counter-‐intuitive, but this effect was not expected to be
statistically significant30.
The last three variables are all statistically significant at 99% confidence interval and negatively
correlated with my dependent variable. “Margin” is consistent with my expectations: the bigger the
margin between yea and nay votes, the less the probability of MEPs voting against their EPGs. In
other words, if the margin is thin, the vote is more likely to entail controversial issues. And if a vote is
controversial, votes that follow national majorities instead of EPG lines are more likely to emerge.
The substantially small coefficient are unsurprising since, as shown in table 6, this variable has a
much different range of values in respect to all the other dummy variables. “Size”, included as a
control variable, interestingly has a negative effect: the envisaged concern was that bigger countries
could be positively biased towards the dependent variable since, having more MEPs elected,
automatically there’s a higher chance of voting in that way. But actually, it’s being part of countries
with a smaller parliamentary delegation that makes it more likely to vote together with the country
line and against the party line. Finally, the last variable, “enlargement”, has also a counter-‐intuitive
effect that partially disconfirms the current literature on eastern Europe countries’ voting behaviour:
MEPs coming from countries that just joined the EU are actually less likely to vote along national
lines and against EPG lines. However, it is still unclear if this depends entirely on the greater
reliability of my original approach (looking at actual contrasts between country and EPG lines instead
of the classical AI scores calculated by country) or, as Hix et al. state when looking at the first two
years of the 6th EP (2004-‐2006): “[there is] a tendency among MEPs from the new member-‐states
from Central and Eastern Europe to vote slightly more along national lines than do the MEPs from
the original 15 member-‐states. [But] party cohesion may be lower in the first few months of any
European Parliament, while the MEPs gradually sort themselves into political groups and decide how
to behave in relation to their political-‐group whips and leaders. By the end of the Sixth Parliament,
the effect of the initial learning period on the average measures of cohesion should be smaller” (Hix
and Noury 2009: 172-‐173).
30 Though it has to be noted that when the number of observation is so high (more than three million) and the regression type is logistic, variables “tend” to be statistically significant. And considering that the substantial effect is almost negligible, the effect of this variable should not be worrisome.

32
V. A brief in-‐depth analysis and conclusions. In the previous empirical part I have shown that EPGs,
despite being generally cohesive, can be also severely divided (part I); that according to MEPs’
assistants national-‐based votes tend to be concentrated in the most important committees (part II);
that MEPs sometimes diverge from their EPG line to vote cohesively with their countrymen, and they
generally do it in the most important, legislative votes where the margin is thinner (part III). These
results give another hint in the direction that national affiliation has been overlooked by the
mainstream literature. Moreover, part 1 and 3 of this analysis are based on RCVs, the only sample on
which scholars of legislative assemblies are able to measure directly voting behaviour. This leads to
two considerations, linked to the theoretical part of the present paper: firstly, the important and
controversial legislation (both in terms of relevance to the EU citizen’s lives, or in terms of possible
undermine of some states’ national interests) may be voted in secret votes. Moreover, all the
committees’ works are public, but the votes are almost never RCVs. So, RCVs tend to describe the
“final step” of a piece of legislation, without accounting for the previous negotiation, the decision
behind the amendments, and in general all the informal committees’ work, where power play
between different interests is more likely to show up. Secondly, these votes may well be voted in
RCVs, but through a statistical analysis they simply get “diluted” in the whole universe of votes cast,
as shown in part I of the empirical chapter. For instance, let’s consider the hypothetical situation
where nine votes out of ten deal with abstract resolutions, which have no substantial effect. In these
votes EPGs are able to make their members tow the party line, and all groups are completely
cohesive. The tenth vote is a directive on drive safety that may endanger some big corporations in
the area of car manufacturing. Here, the members of some of the bigger and richer states, no matter
which EPG they belong to, act unite to block the legislation, fearing that these provisions may
depress the economy of their home country, according to my theory of “MEPs as member of strongly
ideological regional parties”. If the AI scores for these ten votes are calculated, a definitely high
cohesion emerges. But the reality, as described, is more complex.
To disentangle these questions, it is useful to perform a brief in-‐depth qualitative analysis by showing
the answers to some of the other questions included in the MEPs’ assistant survey. Question 9 is
formulated as follows: “How often do you think that national interests of some MEPs are in contrast
with the European party group's political line?” 67.4% of the respondents chose the option
“sometimes”, followed by “often” (23.5%), “rarely” (7.6%), and finally with the same trivial
percentage “almost always” and “almost never” (both 0.8%). The following question, “In case this
contrast actually occurs, how do you think that MEPs vote?” shows a straightforward homogeneity of

33
views: 83.2% of the respondents picked the option “in defence of their national interests”, while only
16.8% chose “Consistently with the political group’s line”. In question 19 it is asked if RCVs represent
“the same logics of the secret votes”: here the percentages are less distant, but still showing an
evident agreement: 65.2% answered “no” and 34.8% answered “yes”. In question 20 it is asked to list
some specific legislations where national interests of some member states are prominent, and in
open contrast with the political line of a group: this is an open and optional question, with no
predefined answer. Still, roughly half of MEPs’ assistant replied, creating in this way a vast range of
possible case studies for this phenomenon. Going into details for all of them would constitute
enough work for a paper in itself, so only three cases are enlisted. Firstly, on the recent discussion
about the possibility of the creation of European-‐wide government stocks, the so-‐called
“Eurobonds”, Germany had a very strict position. The ALDE group, consistently with its economic
tradition, was strongly in this favour of this possible measure to relieve the crisis in Europe. Still, all
the German members of the Liberal group voted against. Secondly, Spain, because of its internal
movements fighting for independency of their “nation” (such as ETA in the Basque Country, or
Esquerra Republicana and Solidaritat Catalana per la Independència in Catalunia), is very sensitive to
the issues of State-‐building. Thus, when the EP had to vote in favour of the recognition of the newly
formed Kosovo, all the Spanish MEPs abstained in sign of protest. Thirdly, in 2011 the ENVI
committee put forward some amendments to the proposal by the European Commission to have
stricter rules on the information contained on food labels. During the discussion it became clear that
this would have undermined the interests of the Italian multinational Ferrero. In the final vote, all the
Italian MEPs (except one) voted against, notwithstanding that the official position of Socialists was to
vote in favour. Finally, when there is some vote regarding nuclear energy or GMOs (genetically
modified organism) Austrian MEPs always vote compact against it. I deliberately picked three
examples which are very different between each other: in the first case, there is a political position,
and to a certain degree the will of Germany to shape the whole European monetary policy. In the
second case, it’s a matter of internal political stability. In the third, it is a pure and simple defence of
a national economic interest. In the last, the issue concerns more a cultural and traditional legacy.
To sum up the main findings and conclude, the EP has evolved from a “multi-‐lingual talking shop”
(Farrell et. al. 2006: 3) to one of the most powerful interstate assemblies in the world. In this respect,
it becomes crucial to understand how its members vote and to address its internal dynamics, such as
cohesiveness of its political groups. The mainstream literature envisages a high EPGs cohesiveness,
with voting behaviour consistently falling along ideological lines, and considers national affiliation as
a marginal factor in terms of influence exerted on the way MEPs vote. After a brief literature review

34
on voting behaviour in the EP, focusing especially on the selection bias problems that may arise by
looking only at RCVs, I elaborated my theory of MEPs as “members of a strongly ideological regional
party”. In the empirical part I analysed the cases when EPGs are exceptionally low cohesive, showing
that the claims about the high cohesiveness of EPGs comes mainly from a quantitative approach that
“dilutes” the variance by looking at the aggregate scores. Then, basing my assumptions on the data
from an original survey submitted to MEPs’ assistants in July 2012, I explored the different logics of
EP’s legislative committees showing that voting behaviour of MEPs in the different committees of the
European Parliament has different dynamics (in particular, the more important committees are more
nationality-‐oriented while the less important ones are more EPG-‐oriented). Finally, I analysed the
possible contrast between EPGs and national delegations in all RCVs cast in the 6th European
Parliament (2004-‐2009) through a logistic regression. Here I showed that cases when MEPs
deliberately choose to disregard the EPG line to vote together with their fellow countrymen, yet
emerging only in a small minority of cases (less than 5% of RCVs – but still remarkable if we consider
the frequent “consensus” between political groups and national delegations), have some specific
characteristics can be pinpointed and shouldn’t be dismissed as a negligible “background noise”.
These results seem to define a picture that is pretty distant from the mainstream claim that “the
European Parliament is surprisingly like all other democratic parliaments”, where votes fall along the
left-‐right political cleavage, and “national affiliation is a weak predictor of how MEPs vote” (Hix et. al.
2006: 509). In a “classic democratic parliament”, I argue, such deviances from the party line, because
of the opposition-‐government dynamics, would not be tolerated and would result in the collapse of
the government or a party scission. And these findings could also be actually constrained by the fact
that the analysis is (necessarily) based on RCVs, a limited and non-‐representative subset of the
totality of votes cast: to prove it, I added some qualitative in-‐depth insights from some other
questions investigated by the 2012 survey concerning my baseline research question, to better
highlight how the MEPs, when it really matters, think of themselves as countrymen of a certain State
first, and only secondly as political members of a certain EPG. In this sense, another proof that
academic works based only on RCVs are biased is set.
It is true indeed that “ideology remained the main predictor of voting behaviour, although nationality
also played a role” (Hix and Noury 2009: 159). The point is exactly that this generic “role” may be
hidden by the vast ocean of votes (and by the methodological constraints usually employed by
scholars) and come out from time to time, when it really matters; but still, it is a paramount feature,
that should not be overlooked, of the directly elected assembly that represents more than 500
millions of European citizens. A peculiar, maybe “paradoxical” parliament (Westlake 2007: 350)

35
which, on the one hand, is still a political unicum that probably cannot be so easily compared to a
regular democratic parliament, contrarily to what many scholars have recently and repeatedly
argued (Noury 2002; Kreppel 2006; Hix et al. 2006, 2007, 2009; Hagemann 2009; Kaniovski and
Mueller 2010); on the other hand, a parliament that can be fully understood only if the popular and
oft-‐repeated focus on its supranational element (Kreppel 2002, 2006) is mitigated by a re-‐evaluation
of the older, yet still meaningful intergovernmentalist theory (Moravcsik 1993).

36
References.
-‐ Attinà, F. (1990). “The Voting Behaviour of the European Parliament Members and the
Problem of Europarties”, European Journal of Political Research, 18(3), pp. 557-‐579.
-‐ Bardi, L. and Ignazi, P. (2004). Il Parlamento Europeo, Bologna, Il Mulino.
-‐ Bardi, L. (2011). Spring seminar in Institutional Dynamics and Party Democracy in the
European Union, Lucca.
-‐ Benedetto, G. (2005). “Rapporteurs as legislative entrepreneurs: the dynamics of the
codecision procedure in Europe’s parliament”, Journal of European Public Policy, 12:67-‐88.
-‐ Bowler, S. and Farrell, D. M. (1995). “The organizing of the European Parliament:
committees, specialization and co-‐ordination”, British Journal of Political Science, 25: 219-‐243.
-‐ Carrubba, C. J. and Gabel, M. (1999). “Roll-‐Call Votes and Party Discipline in the European
Parliament: Reconsidering MEP Voting Behavior” ECSA Working Paper.
-‐ Carrubba, C. J. Clough, R. Montgomery, E. Murrah, L. Schambach, R. and Gabel, M. (2004). “A
Second Look at Legislative Behavior in the European Parliament. Roll-‐Call Votes and the Party
System” Reihe Politikwissenschaft, 94, Institut für Höhere Studies, Wien.
-‐ Carrubba, C. J. Gabel, M. and Hug, S. (2008). “Legislative Voting Behaviour, Seen and Unseen:
A Theory of Roll-‐Call Vote Selection”, Legislative Studies Quarterly, 23, pp. 543-‐572.
-‐ Carrubba, C. J., Gabel, M. and Hug, S. (2009). “Voting at the Surface. Roll Call Votes in the
European Parliament” paper prepared for Le parlament européen: un parlement comme les autres?,
IEE-‐ULB, April 29, 2009.
-‐ Carrubba, C. J. Clough, R. Montgomery, E. Murrah, L. Schambach, R. and Gabel, M. (n.d).
“Selection Bias in the Use of Roll Call Votes to Study Legislative Behaviour” EPRG Working Paper no.
11.
-‐ Collins, K., Burns, C., and Warleigh, A. (1998). “Policy Entrepreneurs: The role of European
Parliament Committees in the making of EU policy”, Statute Law Review, 19: 1-‐11.
-‐ Costello, R. and Thomson, R. (2010). “The policy impact of leadership in committees:
rapporteurs’ influence on the European Parliament’s opinions”, European Union Politics, 11: 219-‐240.
-‐ Diermeier, D. and Feddersen, T. J. (1998). “Cohesion in Legislatures and the Vote of
Confidence Procedure”, American Political Science Review, 92, pp. 611-‐621.
-‐ Farrell, D. Hix, S. and Scully, R (2011). “EPRG MEP Survey Dataset: 2011 Release”,
http://www2.lse.ac.uk/government/research/ resgroups/EPRG/MEPsurveyData.aspx
-‐ Faas, T. (2003). “To defect or not to Defect? National, Institutional and Party Group Pressures
on MEPs and their Consequences for Party Group Cohesion in the European Parliament”, European
Journal of Political Research, 42, pp. 841-‐866.

37
-‐ Farrell, M. Hix, S. Johnson, M. and Scully, R. (2006). “A Survey of MEPs in the 2004-‐2009
European Parliament” paper presented to the Annual Conference of the Political Studies Association
Specialist Group on Elections, Public Opinion and Parties, Nottingham, September.
-‐ Gabel, M. and Hix, S. (2007). “From Preferences to Behaviour: Comparing MEPs’ Survey
Responses and Roll-‐Call Voting Behaviour” paper prepared for presentation at the Tenth Biennial
Conference of the European Union Studies Association, Montreal, Canada.
-‐ Gabel, M. Hix, S. and Malecki, M. (2008). “From Preferences to Behaviour: Comparing MEPs’
Survey Responses and Roll-‐Call Voting Behaviour” working paper for the 66th Annual Meeting of the
Midwest Political Science Association, Chicago, IL.
-‐ Hagger, M. and Wing, M. (1979). “The deconcentration of legislative power: The
development of committees in the European Parliament”, European Journal of Political Research, 7:
117-‐146.
-‐ Heckman, J. and Snyder, J. M. Jr. (1997). “Linear Probability Models of the Demand for
Attributes with an Empirical Application to Estimating the Preferences of Legislators”, Rand Journal
of Economics, 28, pp. 142-‐189.
-‐ Hix, S. (2001). “Legislative Behaviour and Party Competition in the European Parliament: an
Application of Nominate to the EU”, Journal of Common Market Studies, 39(4), pp. 663-‐688.
-‐ Hix, S. (2002). “Parlamentary Behavior with Two Principals: Preferences, Parties, and Voting
in the European Parliament”, American Journal of Political Science, 46(3), July 2002, pp. 688-‐698.
-‐ Hix, S. and Lord, C. (1997). Political Partiesin the European Union, London: Macmillan.
-‐ Hix, S. Raunio, T. and Scully, R. (2003a). “Fifty Years On: Research on the European
Parliament”, Journal of Common Market Studies, 41(2), pp. 191-‐202.
-‐ Hix, S. Kreppel, A. and Noury, A. (2003b). “The Party System in the European Parliament:
Collusive or Competitive?”, Journal of Common Market Studies, 41(2), pp. 309-‐331.
-‐ Hix, S. Noury, A. and Roland, G. (2005). “Power to the Parties: Cohesion and Competition in
the European Parliament, 1979-‐2001”, British Journal of Political Science, 35, pp. 209-‐234.
-‐ Hix, S. Noury, A. and Roland, G. (2006). “Dimensions of Politics in the European Parliament”,
American Journal of Political Science, 50(2), pp. 494-‐511.
-‐ Hix, S., Noury, A. and Roland, G. (2007). Democratic Politics in the European Parliament,
Cambridge University Press.
-‐ Hix, S. and Noury, A. (2009). “After Enlargement: Voting Patterns in the Sixth European
Parliament”, Legislative Studies Quarterly, 39(2), pp. 159-‐174.
-‐ Hix, S., Noury, A. and Roland, G. (2013). “Is there a Strategic Selection Bias in Roll Call Votes?
Evidence from the European Parliament”, LSE working paper, JEL codes: P16, P48, D72, D78.

38
-‐ Høyland, B. (2006). “Allocation of co-‐decision reports in the fifth European Parliament”,
European Union Politics, 7:30-‐50.
-‐ Hug, S. (2006). “Selection Effects in Roll Call Votes” Working paper no. 15, published by the
Center for Comparative and International Studies (ETH Zurich and University of Zurich).
-‐ Hug, S. (2009). “Understanding Roll Call Vote Requests and their Consequences”,
unpublished paper.
-‐ Judge, D. (1992). “Predestined to save the earth: the Environment Committee of the
European Parliament”, Environmental Politics, 1: 186-‐212.
-‐ Kaniovski, S., Mueller, D. C. (2010). “How representative is the European Union Parliament?”,
European Journal of Political Economy, doi: 10.1016/j.ejpoleco.2010.06.007
-‐ King, G., Keohane, R. O., and Verba, S. (1994). Designing Social Inquiry: Scientific Inference in
Qualitative Research, Princeton: Princeton University Press.
-‐ Kreppel, A. (2002). The European Parliament and Supranational Party System: A Study of
Institutional Development, Cambridge: Cambridge University Press.
-‐ Kreppel, A. (2006). Understanding the European Parliament from a federalist perspective: the
legislatures of the USA and EU compared. In: Menon, A., Schain, M. (Eds.), Comparative Federalism:
The European Union and the United States. Oxford University Press, Oxford, pp. 245–271.
-‐ Kreppel, A. and Tsebelis. G. (1999). “Coalition Formation in the European Parliament”,
Comparative Political Studies, 32(8): 933–66.
-‐ Lindberg, B., Rasmussen, A. and Warntjen, A. (2010). “Party politics as usual? The role of
political parties in EU legislative decision-‐making”, Journal of European Public Policy, 15(8), pp. 1107-‐
112.
-‐ Mamadouh, V. and Raunio, T. (2003). “The committee system: powers, appointment and
report allocation”, Journal of Common Market Studies, 41: 333-‐351.
-‐ Mair P., Thomassen J. (2010). “Political representation and government in the European
Union”, Journal of European Public Policy 17:1 January 2010: 20–35.
-‐ McElroy, G. and Benoit, K. (2007). “Party Groups and Policy Positions in the European
Parliament”, Party Politics, 13(1), pp. 5-‐28.
-‐ Moravcsik, A. (1993). "Preferences and power in the European Community: A liberal
intergovernmentalist approach". Journal of Common Market Studies 31 (4): 473–524.
-‐ Moravcsik, A. (1998). The Choice for Europe: Social Purpose and State Power from Messina
to Maastricht, Ithaca, Cornell University Press.

39
-‐ Neuhold, C. (2001). “The ‘legislative backbone’ keeping the Institutions upright? The role of
European Parliament committees in the EU policy-‐making process”, European Integration Online
Papers, 10.
-‐ Noury, A. (2002).
-‐ Poole, K. T. (2005). Spatial Models of Parliamentary Voting, Cambridge University Press.
-‐ Poole, K. T. and Rosenthal, H. (1985). “A Spatial Model for Legislative Roll-‐Call Analysis”,
American Journal of Political Science, 29(2), pp. 357-‐384.
-‐ Poole, K. T. and Rosenthal, H. (1997). Congress: a Political-‐Economic History of Roll-‐Call
Voting, Oxford: Oxford University Press.
-‐ Raunio, T. (1996). “Party Group Behavior in the European Parliament: an Analysis of
Transnational Political Groups in the 1989-‐1994 Parliament”, Acta Universitatis Tamperensis,
Vammalan Kirjapaino, Vammala, Finland.
-‐ Raunio, T. (1999). “The Challenge of Diversity: Party Cohesion in the European Parliament”, in
S. Bowler, D.M. Farrell, and R.S. Katz (eds.), Party Discipline and Parliamentary Government.
Columbus, OH: Ohio University Press, 167–88.
-‐ Roederer-‐Rynning C. (2003). “From ‘talking shop’ to ‘working Parliament’? The European
Parliament and agricultural change”, Journal of Common Market Studies, 41: 113-‐135.
-‐ Rice, S. A. (1925). “The Behavior of Legislative Groups: a Method of Measurement”, Political
Science Quarterly, 40(1), pp. 60-‐72.
-‐ Ruan, D., Chen, G., Kerre, E.E. and Wets G. editors (2005). Intelligent Data Mining:
Techniques and Applications. Studies in Computational Intelligence Vol. 5 Springer 2005, ISBN 978-‐3-‐
540-‐26256-‐5.
-‐ Thiem, J. (2006). “Explaining Roll Call Vote Request in the European Parliament” Mannheim –
Arbeitspapiere, Mannheimer Zentrum für Europäische Sozialforschung, 90.
-‐ Westlake, M. (1994a). A Modern Guide to the European Parliament. London: Pinter.
-‐ Westlake, M. (1994b). Britain’s Emerging Euro-‐elite? The British in the Directly-‐Elected
European Parliament, 1979-‐1992, Aldershot, Dartmouth.
-‐ Whitaker, R. (2011). The European Parliament’s Committees. National Party Influence and
Legislative Empowerment, NY and Abingdon, Routledge.
-‐ Yordanova, N. (2010). Legislative Organisation of the European Parliament: The Role of
Committees, Doctoral Thesis, European University Institute, Florence.
Acknowledgments.
I would like to thank Giovanni Marin for the usual help with STATA-‐induced recurrent nightmares.