cidcm - systemicpeace.org · cidcm center for ... major societal wars are down from twelve at the...
TRANSCRIPT

2005Monty G. MarshallTed Robert Gurr
CIDCMCenter for International Development & Conflict Management

About CIDCM C
Development and Conflict Management(CIDCM) is an interdisciplinary researchcenter at the University of Maryland.CIDCM seeks to prevent and transformconflict, to understand the interplaybetween conflict and development, and tohelp societies create sustainable futures forthemse lve s . Us ing the ins ight s o fresearchers, practitioners, and policymak-ers, CIDCM devises effective tools andculturally appropriate pathways to con-structive change.
For more than twenty years, scholars andpractitioners at the Center have soughtways to understand and address conflictsover security, identity, and distributivejustice. CIDCM’s programs are based onthe belief that “peace building and devel-opment-with-justice are two sides of thesame coin” (Edward Azar, CIDCMfounding director). CIDCM’s accom-plished scholars, its expertise in data collec-tion and analysis, and its direct involvementin regional conflict management effortsmake the Center a unique resource fordiscovering enduring solutions to theworld’s most intractable conflicts.
Research Data Collections
CIDCM collects, analyzes and links datarelevant to the study of the dynamics ofsocietal conflicts. The aim is to expanddata capabilities to facilitate cross-discipli-nary research among scholars and policyanalysts concerned with aspects of societalconflict, state failure, and minority rights.The Center hosts several major interna-tional databases on societal conflict,including Minorities at Risk, Polity, andInternational Crisis Behavior.
Training and Education
The Center provides on-the-ground train-ing for parties to specific conflicts, as wellas programs that feature conflict resolu-tion training for students and governmentofficials. The Partners in Conflict pro-gram has provided training in citizens’diplomacy and conflict resolution in morethan countries, and the ICONS Projectcreates interactive tools for teaching andtraining on conflict management tech-niques. CIDCM also offers an undergrad-uate Minor in International Developmentand Conflict Management.
Policy Analysis
Strategically located at the nexus of theoryand practice, CIDCM seeks to foster aconversation among scholars and policymakers, and to use global analyses as abasis for concrete recommendations forthe policy community. In this regard, itsbiennial publication Peace and Conflictreports major global and regional trendsin societal conflict, development, and gov-ernance issues. The Minorities at Riskdata provided the basis for much of thestatistical analysis included in the
United Nations Development Programme’sHuman Development Report: CulturalLiberty in Today’s Diverse World, while thePeace and Conflict data was featuredprominently in the UK PrimeMinister’s Strategy Unit’s Investing inPrevention.
In addition, two CIDCM endowedchairs, the Anwar Sadat Chair for Peaceand Development and the Baha’i Chairfor World Peace, seek to bridge the gapbetween the academic and policy worldsand develop alternatives to violent conflict.
CIDCMDepartment of Government and Politics, University of Maryland
Tel.: (301) 314-7703 Fax: (301) 314-9256
0145 Tydings HallCollege Park, MD 20742
E-mail: [email protected]://www.cidcm.umd.edu
A Global Survey of ArmedConflicts, Self-DeterminationMovements, and Democracy
Monty G. Marshall
Ted Robert Gurr
with contributions by
Victor Asal, Barbara Harff,
Deepa Khosla, and Amy Pate
peace and
confflict2005
CIDCMCenter for International Development& Conflict ManagementUniversity of Maryland, College Park

© Center for International Development and Conflict Management (CIDCM), University of Maryland, College Park, MD, USA (Publication Date: May )
Report Design by AW Studio, [email protected]

1. Introduction (Gurr and Marshall) 1
2. Peace and Conflict Ledger (Marshall) 3
.: Peace-Building Capacities of States 3
.: The Peace and Conflict Ledger 8
3. Global Trends in Violent Conflict (Marshall) 11
. Global Trends in Violent Conflict, - 11
4. Global Trends in Democratization (Marshall) 16
.: Global Regimes by Type, - 16
5. Self-Determination Movements and Their Outcomes (Khosla) 21
.: Armed Conflicts for Self-Determination and Their Outcomes, - 25
.: Trends in Armed Conflicts for Self-Determination, - 26
6. The Decline of Ethnic Political Discrimination, - (Asal and Pate) 28
.: Global Trends in Political Discrimination, - 31
.: Global Trends in Economic Discrimination, - 32
.: Global Trends in Political Discrimination of Minorities, - 33
.: Regional Trends in Political Discrimination of Minorities, - 35
7. Focus on Political Instability in Africa (Marshall) 39
.: Africa: Regimes by Type, - 42
.: Africa: Trends in Violent Conflict, - 43
.: Periods of Stability and Instability in African Countries 46
.: Political Instability in Africa, - 47
.: State Formation Instability in Africa 49
.: Africa Instability Ledger 53
8. Assessing Risks of Genocide and Politicide (Harff) 57
.: Genocides and Politicides since 57
.: Countries Experiencing Episodes of Genocide or Politicide since 58
.: Risks of Genocide and Politicide in Countries with Political Crises in Early 61
9. Global Terrorism: An Overview and Analysis (Marshall) 62
.: Description of Collective Political Violence (CPV) Categories 64
.: Description of the Global Terrorism (TERROR) Indicator 65
.: Actor-Target Relationships in Global Terrorism, - 67
.: Trends in High Profile Terrorism, // - // 73
10. Conclusion (Marshall and Gurr) 74
11. Appendix
.: Major Armed Conflicts, Early 77
.: Armed Self-Determination Conflicts and Their Outcomes, - 84
.: Other Self-Determination Conflicts 90
.: Model Parameters and Data Sources 92
TABLE OF CONTENTS

1
1 . I N T R O D U C T I O N
T Ò Ó ’ to multiethnicdemocracy dominate contemporary headlines. A large-scale genocide began in Darfurshortly after the publication of the edition of Peace and Conflict and internationalresponses have thus far been ineffective. Civil wars are devastating once-stable countriessuch as Nepal and Ivory Coast. Little surprise, then, that most observers are convincedour world has become less secure since publication of the first edition of Peace andConflict in , a report that documented a post-Cold War ebb in armed conflicts andtraced the ascendancy of democratic regimes. Despite the prevailing sense of global inse-curity, the positive trends traced in previous editions of this report have continued intoearly .
• The decline in the global magnitude of armed conflict, following a peak in the earlys, has persisted and few of the many societal wars contained in the last decadehave resumed. Major societal wars are down from twelve at the end of to eightin early .
• Most democratic regimes established during the s and s have endureddespite political and economic crises. Popular forces have mobilized in many coun-tries, such as Bolivia, Georgia, Philippines, and Ukraine, to promote democraticprinciples, hold leaders accountable, and thwart the subversion of democratization.In the Middle East, the region most resistant to democratization, tutelary democra-cies in Afghanistan and Iraq have gained support and small steps have been takentoward democratic reform in other Arab autocracies. On the down side, movementtoward reform in Iran suffered a serious setback.
• Ethnonational wars for independence, which were the main threat to civil peace andregional security in the s, have continued to decline to their lowest level since. Deepa Khosla reports that, from to , thirteen major self-determina-tion conflicts were settled or contained, offset by a half-dozen new or renewed cam-paigns, the most deadly of which are in Darfur (where a new rebellion began in early) and Indonesia’s Aceh province (where fighting resumed in after the fail-ure of internationally-brokered negotiations).
• Repression and political discrimination against ethnic minorities, surveyed for thefirst time in this report by Victor Asal and Amy Pate, have declined significantly,coinciding with the dramatic decline in autocratic regimes since the late s. Since1950, the number of minorities benefiting from policies aimed at remedying pastpolitical discrimination has increased five-fold. These trends are linked to bothdemocratization and containment of separatist wars. Most new democracies haverecognized minority rights; almost all ethnonational war settlements give formerrebels greater political rights and opportunities.
These positive trends are no warrant for unqualified optimism about the future of worldpeace. The gains documented here are the result of persistent and coordinated efforts atpeace-building by civil society organizations, national leaders, non-governmental organi-zations, and international bodies. But there is no certainty that strategies which workedin the past are sufficient to deal with emerging challenges, especially those due to the glob-alization of conflict processes. Nor can we continue to count on the resources and polit-ical will needed to sustain the trends. International cooperation is threatened by growingfractures in the world community. These are some of the challenges, old and new.
Despite the pre-vailing sense ofglobal insecurity,the positive trends traced inprevious editions of this reporthave continued into early .

2
• The Peace and Conflict ledger gives red flags to out of countries sur-veyed, compared with countries in our report. They include Africancountries plus others such as Armenia, Cambodia, Haiti, Iran, Lebanon, andPakistan, all of which are at serious risk of mismanaging societal crises and suc-cumbing to civil war or governmental collapse. Another countries are yellow-flagged, of which are in Africa south of the Sahara, in North Africa and theMiddle East, and in the Asia-Pacific region. In short, half the world’s countrieshave serious weaknesses that call for international scrutiny and engagement.
• Sub-Saharan Africa’s concentration of weak governments, fractured societies, andcivil warfare is the subject of a special analysis in this report. The trends are positive,the challenges daunting. On the plus side Africa has seen substantial decreases inarmed conflict, autocratic governance, and political instability since . On thedown side are pervasive and worsening impoverishment, run-away growth of citieswith high concentrations of unemployed youth, crippling levels of HIV infection,and pervasive corruption that thwarts economic and social development.
• Terrorism has become the dominant security concern of the twenty-first century,first because it is increasingly transnational and deadly, second because its most dra-matic acts are carried out in the name of a global doctrine that is antithetical toWestern and democratic values. Analyses of trends in terrorism, reported here, showthat high-casualty terrorist acts increased very sharply after al Qaeda’s September ,, attacks on the United States, due mainly to the adoption of suicide terrorattacks by jihadists and nationalists in Iraq, Israel, Pakistan, Philippines, and Russia.
• Risks of future genocide and political mass murder remain high in a half-dozencountries and a significant possibility in a dozen others. This report includes BarbaraHarff ’s risk analysis, which shows that Burma, Algeria, Burundi, Rwanda, andEthiopia have five or more of the seven risk factors that have preceded mass killingsof the past half-century. The inability of the UN and the African Union to end theKhartoum government’s ethnic cleansing in Darfur raises grave doubts about thewill and capacity of international actors to take preventive action in future episodes.
This is the third report in the Peace and Conflict series. It uses data and summarizesresearch developed at the Center for International Development and ConflictManagement, University of Maryland on organized violence, self-determination move-ments, ethnic minorities, and governance. In addition to its regular assessment of thepeace-building capacities of states and tracking of major trends in the global system, theseries provides detailed analyses of current issues; this report includes analyses of globaland regional trends in group discrimination, political instability in Africa, risks of geno-cide, and global terrorism. Information regarding individual wars and self-determinationconflicts, as well as data sources and model parameters, is listed in the four appendixtables that accompany this report.
Ted Robert GurrMonty G. Marshall
April 2005
These positive trends are no warrantfor unqualified optimism about thefuture of world peace. International cooperation is threatened by growing fractures in the world community.

3
2 . T H E P E A C E A N D C O N F L I C T L E D G E R :
Country Ratings of Peace-Building Capacity in 2005
The Peace and Conflict Ledger rates countries according to their scores on sevenindicators of capacity for peace-building, that is, all countries with a total populationgreater than , in early . As explained in the Ledger’s notes, we rate a coun-try’s peace-building capacity high insofar as it has managed to avoid outbreaks of armedconflicts while providing reasonable levels of human security, shows no active policies ofpolitical or economic discrimination against minorities, has successfully managed move-ments for self-determination, maintains stable democratic institutions, has attained sub-stantial human and material resources, and is free of serious threats from its neighboringcountries. Countries are evaluated and placed into three ordered categories of peace-building capacity: red, yellow, and green. Red-flagged countries are considered to be atthe greatest risk of neglecting or mismanaging emerging societal crises such that theseconflicts escalate to serious violence and/or government instability; green-flagged coun-tries enjoy the strongest prospects for successful management of new challenges. Figure. shows the global distribution of the three general peace-building capacities of statesin early and table . lists peace-building ratings for each of the countries.
These rankings do not necessarily indicate impending risks of armed conflict or insta-bility in the red or yellow flagged states, only that these states are vulnerable to such chal-lenges. The Ledger is designed to complement “early warning” or “risk” models such asthose discussed in sections and , following. Actual risk factors for individual statesmust be informed by current situations and qualities of societal conflict dynamics at anyparticular point in time. For example, Ukraine is rated as having good conflict manage-ment capacity. In November , a dramatic increase in social tensions was triggeredby opposition allegations of unlawful manipulation of election results by the executive
Monty G. Marshall
Figure 2.1: Peace-Building Capacities of States

4
branch of government. Massive demonstrations challenging the authority of theKuchma regime might have led to a violent confrontation between the opposition andregime security forces, polarization of social forces, or backsliding by the regime towardgreater autocratic rule and repression of the opposition leadership. These more dire pos-sibilities, however, were averted through a combination of non-provocative oppositionaltactics, controlled response by security forces, and international engagement. The lead-ership of the so-called “Orange Revolution” in Ukraine managed to defuse tensionswithout escalation to violence and adjudicate disputes among contending factions sothat the democratization process proceeded in spite of the political crisis. Green-flaggedcountries Venezuela and Zimbabwe, despite widespread and complex societal tensions,active opposition movements, and intense international pressures, have managed toavoid serious instability events, such as an outbreak of armed conflict, a failure of regimeauthority, or a concerted government crackdown on their opposition movements. Incontrast, red-flagged Pakistan succumbed to a military coup in that ousted a demo-cratically-elected government; its military leader Gen. Musharraf has survived severalassassination attempts; has not been able, or willing, to control increasing communalviolence between Sunni and Shi’a religious sects; has engaged in serious fighting andrepression in regions along its border with Afghanistan; continues to interfere in the sep-aratist rebellion in the neighboring Kashmir region of India; and has seen the re-emer-gence of a separatist movement in Baluchistan that had been repressed since .Yellow-flagged countries such as Madagascar, Saudi Arabia, Togo, and Yemen have strug-gled recently to keep rising social tensions within manageable bounds.
The Ledger lists countries by region. Each region’s list is headed by those countries thatwere either experiencing major armed societal conflicts in early (red icons) or hadended major armed conflicts since early (yellow icons; countries with emergingarmed conflicts in early are denoted by orange icons). Following the war-torncountries, the remaining countries are listed alphabetically within each of three cate-gories of peace-building capacity: red, yellow, and green, with the most vulnerable coun-tries (red) at the top of each regional list. The red-flagged countries (three fewer thanthe list) are at serious risk of conflict management failure for, at least, the next fewyears. Examples are Afghanistan, Cambodia, Haiti, Iran, and Lebanon. The yellow-flagged countries have a mix of positive and negative factors. India, for example, has sta-ble democratic political institutions but, on the negative side, poor human security,multiple ethnic challenges, limited resources, and a bad neighborhood (its external envi-ronment). Russia, another yellow-flagged state, scores positive on democracy, resources,and neighborhood, but its democratic institutions are only recently established; it hasgenerally poor human security and a mixed record for managing self-determinationmovements. Just under half of all countries are green-flagged, including all the well-established Western democracies, most of Latin America and the Caribbean (except forred-flagged Haiti and yellow-flagged Ecuador, Guatemala, and Peru), and most of theformer-Socialist countries of Europe (with the notable exceptions of yellow-flaggedBosnia, Georgia, Serbia and Montenegro, and Russia). With the exception of green-coded Kazakhstan, the former-Socialist republics of Central Asia are coded yellow.
The African Crisis Zone. African countries have generally low capacity for conflict man-agement and continue to face serious and complex challenges to peace and stability in. However, important progress has been made in increasing regional capacity, andthere are important differences within the region. In the region of Africa South of the
red-flaggedcountries are atserious risk of conflict manage-ment failure… yellow-flaggedcountries have amix of positive andnegative factors…Under half of all countries are green-flagged.

5
Sahara, there are seventeen red-flagged countries (down from twenty-five in the
Ledger) and nineteen yellow-flagged countries (there were thirteen listed in ). Thesevulnerable countries are contrasted with only nine green-flagged countries (Benin,Botswana, Malawi, Mali, Mauritius, Namibia, South Africa, Swaziland, andZimbabwe).1 The five countries on the North Africa coast are each flagged as vulnerablein , with Algeria flagged red and the others (Egypt, Libya, Morocco, and Tunisia)flagged yellow. Almost every country across the broad middle belt of Africa, fromSomalia in the east to Sierra Leone in the west, and from Sudan in the north to Angolain the south, has a volatile mix of poor human security, unstable and inequitable politi-cal institutions, limited resources, and, inevitably, a “bad neighborhood” of similar cri-sis-ridden states. In southern Africa, a small but growing cluster of green-flagged states,headed by South Africa, manages to maintain good prospects for avoiding serious con-flicts and political instability despite challenging circumstances, particularly inZimbabwe. Most West Africa states continue to be highly vulnerable, although substan-tial progress has been made in ending armed conflicts and demobilizing fighters in theregion. Mali and Benin are the two exemplars in this region. The outcome of Nigeria’sshaky transition to democracy is crucial for the region, as is the outcome of internationalefforts to stabilize the brutal anarchy that has engulfed the Democratic Republic ofCongo (D.R. Congo). If democratic governance can be consolidated and communaltensions eased, especially in regard to the Muslim-Christian divide in the north, Nigeriamay help stabilize all of West Africa, a role the Republic of South Africa has played inthe southern continent. Of course, continued turmoil in the pivotal state of D.R. Congowill seriously challenge not only Nigeria’s potential for contributing to stabilization inthe west but, also, the prospects for peace and recovery in Angola and the several coun-tries of the Rift Valley in eastern Africa. Further complicating prospects for stabilizationin the African crisis zone are some of the more pervasive consequences of long-termpoverty and warfare: deteriorating sanitation and health and, especially, the related AIDSpandemic; widespread and recurring famine; and large numbers of refugee, displaced,and otherwise marginalized populations. See section in this report, Focus on PoliticalInstability in Africa, for a more detailed discussion and risk analysis.
The Muslim Crisis Zone. The U.S. officially launched its global “war on terrorism” inOctober in direct response to the / () al Qaeda attacks on targets in theUnited States and the refusal of Afghanistan’s Taliban regime to surrender al Qaeda lead-ers. An especially dramatic aspect of the / attacks was the total destruction of the twintowers of the World Trade Center in New York. This was not the first attack against thisicon of U.S. global economic power. A large truck bomb had been detonated in theunderground parking garage of the World Trade Center eight years earlier in withthe apparent intent of causing the building to collapse. Prior to the / attacks, the U.S.had been the second most frequent target of international terrorist attacks, after Israel.Indeed, the problem of international terrorism had long been considered an outgrowthof the long-standing Israel-Palestine and larger Arab-Israeli conflicts. The U.S. was oftenviewed as a target of opportunity because of its global activism and strong support forIsrael. Central to understanding the transformation of “international terrorism” to“global terrorism,” and what can be done about it, is determining the role of the alQaeda organization not only in the “old style” international terrorism and the “new”global terrorism, but, also, to the politics of the Middle East and larger Muslim world.
1 The island states of Comoros (yellow-flagged), Mauritius (green-flagged), and Madagascar (yellow-flagged) are included in the Africa South of the Sahara listings.
Important progresshas been made inincreasing regionalcapacity.

6
The most crucial question is whether al Qaeda is the producer of global terrorism orleader of a greater “clash of civilizations” or is it simply a product of structural conditionsand an expression of increasing tensions in the Muslim world? Part of the answer to thisquestion comes from considering the challenges facing the Muslim countries in the con-text of, and in conjunction with, their general peace-building capacities.
Muslim countries are most closely associated with the North Africa and Middle Eastregion but, in fact, they span the entire central belt of the eastern hemisphere fromMorocco in the west to Indonesia in the east. In examining the contemporary trends inviolent societal conflict in the North Africa and the Middle East region (see figure .e inPeace and Conflict ) there does not seem to be great cause for alarm: levels of armedconflict were generally comparable to levels in Latin America during the same period andthe levels had diminished to a very low level by the year . Similarly, the peace-build-ing capacities of states in the region were comparable to those listed for the former-Socialist Bloc countries (see table in Peace and Conflict ). Both of thesecomparable regions, while experiencing some serious conflict management challengesover the past decade, have performed fairly well in keeping the peace; cause for concern,no great cause for alarm. However, when we shift focus to the broader category ofMuslim countries a different picture emerges in regard to peace-building capacity.
Taking this perspective we can see that the Muslim countries have a general peace-build-ing profile comparable to that of the African countries. There are seventeen red-flagged,twenty-four yellow-flagged, and only nine green-flagged countries in the larger Muslimregion (recall the breakdown for Africa is --). Unlike the Africa region, armed con-flict in the Muslim region has declined by over sixty percent since , similar to theglobal trend reported in the following section. Given the Muslim region’s generally poorpeace-building capacity, we must consider the importance of proactive internationalengagement in explaining the steep decline in armed conflicts. With this in mind,changes in the quality of international engagement toward neutrality or, worse, towardprovocation can be expected to have serious implications for the region. Indeed, of thesix countries flagged (orange) in the Ledger with emerging armed conflicts in early ,four are Muslim countries and a fifth conflict, in Thailand, involves the resurgence of aseparatist movement among the Muslim minority in the south. In addition, seventy per-cent of Muslim countries in Africa have experienced post-independence instability inrecent years (see section following) and the vast majority of global terrorist attacks haveoccurred in Muslim countries (see section ).
Other Areas of Concern. The Asian heartland is a region of continuing concern. In our report, Asia was described as a serious “crisis zone.” Though neither as poor nor asvulnerable as the countries in the African region or as volatile as the Muslim countries,the Asian region remains of vital interest. Since the end of the Cold War, the majorityof the world’s major armed societal conflicts have been concentrated in the Asian andAfrican continents. Asia is also home to about half of the world’s population. The con-tinuing vulnerability of the Asian region is of even greater concern due to the increasingproliferation of nuclear weapons and missile technologies across the continent. Russia,China, India, Pakistan, and Israel are all known to possess nuclear arsenals and delivery
Changes in the quality of interna-tional engagementtoward neutrality or, worse, towardprovocation can beexpected to have serious implications…
2 Here, a “Muslim country” is defined as any country where at least forty percent of the population pro-fesses one of the sects of Islam. For the record, there are six countries where Muslims are between forty andfifty percent of the total population, all of which are in Africa: Burkina Faso, Eritrea, Ethiopia, Ivory Coast,Nigeria, and Sierra Leone. The forty percent of the figure is used because it identifies all countries in whichMuslims are the largest confessional group.

7
systems. In , rapidly escalating tensions between long-time rivals India and Pakistanled to the first overt nuclear confrontation since the Cuban Missile Crisis of .Additionally, several states are suspected to have programs aimed at developing nuclearweapons capabilities. The issue of proliferation has been of particular concern in regardto North Korea, which has developed and tested medium-range missile capabilities andhas recently declared that it possesses (or might possess) nuclear weapons. Tensions overproliferation of nuclear weapons and other chemical and biological “mass destruction”technologies precipitated the U.S.-led invasion of Iraq in and this, in turn, has con-tributed to suspicions and allegations regarding Iran’s intentions and to a serious deteri-oration in the security environment across the Middle East. The three main flash pointsfor conflict management in Asia are each characterized by long-standing, unresolvedissues of partition and involve some credible threat of nuclear exchange: the two Koreas,China-Taiwan, and India-Pakistan. In terms of the sheer vulnerability of states, theCentral Asian region is also of serious concern, as is Bangladesh and the surroundingareas in India. The rapid pace of the modernization of China’s economy will surely testthe limited capacity of the regime to manage social tensions and adapt to new realities,especially the expanding influence of the commercial sector. Over all, the situation inAsia continues to improve, along with its conflict management capabilities and futureprospects.
A final mention should be made in respect to a noted weakening of the peace-buildingcapacity of countries in Latin America. Several countries in South America have beenrocked by economic and financial crises leading to mass demonstrations and the resig-nations of several elected leaders under conditions of public duress. The military, whichhad been quick to step in to quell such disturbances in the past, has generally stoodaside. Public discontent with economic stagnation in Central America has led moreoften to calls for prosecution of past executives on charges of corruption. In both regionsit remains unclear whether the military has effectively abandoned its traditional role aspolitical arbiter during times of economic recession and crisis or under what circum-stances the military’s tolerance of civic disorder might give way to a return of politicalactivism.
The rapid pace of the modernization of China’s economywill surely test the limited capacity of the regime to manage social tensions and adapt to new realities, especially the expanding influence of the commercial sector.

8
Notes for the Indicators in the Peace and Conflict Ledger
The Peace and Conflict Ledger lists the 161 larger countriesin the world—all those with populations greater than 500,000in 2005—and rates each country on seven indicators ofcapacity for building peace and managing potentially desta-bilizing political crises. We rate a country’s peace-buildingcapacity high insofar as it has managed to avoid outbreaksof armed conflicts while pro- viding reasonable levels ofhuman security, shows no active policies of political or eco-nomic discrimination against minorities, successfully man-aged movements for self-determination, maintained stabledemocratic institutions, attained substantial human andmaterial resources, and is free of serious threats from itsneighboring countries. Countries are listed by world regionand, within each region, first, according to countries withcurrent or recent episodes of armed conflict and, second,from lowest (red) to highest (green) peace-building capacity.Because many global trends in the qualities of peace have steadily improved since the early 1990s, some minorchanges have been made to the Ledger to increase our ability to report differences among countries on certain indi-cators. These changes do not affect comparison of the current Ledger with previous editions of Peace and Conflict.
Column 1: Peace-Building Capacity The summary indicator of peace-building capacity is locatedon the far left side of the ledger. It summarizes the sevencomponent indicators listed on the right side of the ledgerand described below. The ranking is used to classify thecountries in each geographical region according to a singleglobal standard. The armed conflict indicator, also locatedon the left side of the ledger, is not used in the calculationsbut is used to highlight countries with major armed conflictsin recent years. Red and yellow icons on the seven compo-nent indicators are evidence of problems whereas greenicons signal a capacity for managing conflict without resortto serious armed conflict. Weighted values are assigned to each of the seven indicators (-2 for red, -1 for yellow,+1.5 for green) and averaged for the number of icons listed (a blank indicator value is not used in the calculation).Countries with an average less than -1 have red icons on the summary indicator of capacity and yellow icons signal anaverage score between -1 and 0. Countries with an averagegreater than 0 are given green icons.
Column 2: Armed ConflictThe icons in this column are used to highlight countries with the very real threat of major armed conflicts beingfought in early-2005, as summarized in Appendix figure 11.1and described in Appendix table 11.1; these icons are notused in calculating the indicators of peace-buildingcapacity.1 A red icon highlights countries with an ongoing(low, medium, or high intensity) major armed conflict in early 2005; a yellow icon identifies countries with either asporadic or low intensity armed conflict in early 2005 or an armed conflict that was suspended or repressed betweenearly 2001 and early 2005. Episodes of political violencemust have reached a minimum threshold of 1,000 battle-related deaths to be considered major armed conflicts. New episodes of political violence that have emerged in thepast two years, in which there have been substantial num-bers killed but which have not yet reached the 1,000 deaththreshold, are identified by an orange icon.
Table 2.1: The Peace and Conflict Ledger 2005
North Atlanticn n United States • • • • • • •n Austria • • • • •n Belgium • • • • • •n Canada • • • • • • •n Denmark • • • • •n Finland • • • • • •n France • • • • • •n Germany • • • • •n Greece • • • • •n Ireland • • • • •n Italy • • • • • •n Netherlands • • • • •n Norway • • • • • •n Portugal • • • • •n Spain • • • • • •n Sweden • • • • • •n Switzerland • • • • • • •n United Kingdom • • • • • • •
Former Socialist Blocn n Russia • • • • • •n Armenia • • • • •n Azerbaijan • • • • • •n Tajikistan • • • • • •n Bosnia • • • • •n Georgia • • • • • •n Kyrgyzstan • • • • • • •n Serbia and
Montenegro • • • • •n Turkmenistan • • • • •n Uzbekistan • • • • •n Albania • • • •n Belarus • • • • •n Bulgaria • • • • • •n Croatia • • • • • •n Czech Republic • • • • •n Estonia • • • • • •n Hungary • • • • • •n Kazakhstan • • • • • •n Latvia • • • • • •n Lithuania • • • • •n Macedonia • • • • • •n Moldova • • • • • •n Poland • • • • •n Romania • • • • • •n Slovak Republic • • • • • •n Slovenia • • • • •n Ukraine • • • • •
Peac
e-Bu
ildin
gCa
paci
ty
Arm
edCo
nflic
t
Hum
anSe
curit
y
Self-
Dete
rmin
atio
n
Disc
rimin
atio
n
Regi
me
Type
Dura
bilit
y
Soci
etal
Capa
city
Neig
hbor
hood

9
Peac
e-Bu
ildin
gCa
paci
ty
Arm
edCo
nflic
t
Hum
anSe
curit
y
Self-
Dete
rmin
atio
n
Disc
rimin
atio
n
Regi
me
Type
Dura
bilit
y
Soci
etal
Capa
city
Neig
hbor
hood
Column 3: Human SecurityThe icons in this column indicate the general quality ofhuman security in the country over the past ten-year period,1991-2000. The Human Security indicator incorporates infor-mation on armed conflicts and rebellions, inter-communalfighting, refugee and internally displaced populations, staterepression, terrorism, and, in a few cases, genocides. Redicons indicate countries that have had a generally high levelof human security problems in several of the categories over a substantial period of time. A yellow icon indicates acountry that has had problems of somewhat lower magni-tude over a more limited span of time. Countries that havehad some human security problems but not at the higherlevels noted above are left blank on this indicator (a neutralvalue). Green icons indicate countries that have performedwell and experienced little or no human security problemsduring the previous ten-year period.
Column 4: Self-DeterminationThe icons in this column take into account the success orfailure of governments in settling self-determination conflictsfrom 1985 through 2004 based on information summarizedin Appendix tables 11.2 and 11.3. Red icons signify coun-tries challenged by violent conflicts over self-determinationin early 2005. Yellow icons flag countries with one of thesetwo patterns: either (a) non-violent self-determination move-ments in early 2005 but no track record of accommodatingsuch movements in the past 20 years; or (b) violent self-determination movements in early 2005 and a track recordof accommodating other such movements in the past 20years. Green icons signify countries that have successfullymanaged one or more self-determination conflicts since1985, including countries with current non-violent self-deter-mination movements. Countries with no self-determinationmovements since 1985 are blank in this column.
Column 5: DiscriminationActive government policies or social practices of political or economic discrimination against minority identity groupsare strongly associated with divided societies, contentiouspolitics, and self-determination grievances. They are alsoindicative of strategies of exclusion by dominant groups.This indicator looks at general levels of both political andeconomic discrimination against minorities at the end of2003. Red icons denote countries with active governmentpolicies of political and/or economic discrimination againstminorities comprising at least ten percent of the populationin 2003. Yellow icons identify countries where there areactive social practices of discrimination by dominant groupsagainst minority groups that comprise at least ten percent of the population but no official sanctions. Green icons areassigned to countries with little or no active discriminationand government policies designed to help remedy or allevi-ate the effects of past discriminatory policies and practicesfor groups constituting at least five percent of the popula-tion. Countries with little or no active discrimination againstminorities are blank in this column.
Column 6: Regime TypeThe icons in this column show the nature of a country’spolitical institutions in early 2005. Red icons are anocracies(see section 4, following), that is, countries with govern-ments in the mixed or transitional zone between autocracyand democracy. Yellow icons represent full autocraticregimes. Green icons are full democracies.
Latin America and the Caribbeann n Colombia • • • • •n n Haiti • • • •n Ecuador • • • • •n Guatemala • • • • • •n Peru • • • • • •n Argentina • • • • •n Bolivia • • • • • • •n Brazil • • • • • •n Chile • • • • • •n Costa Rica • • • •n Cuba • • •n Dominican
Republic • • • • •n El Salvador • • •n Guyana • • • • •n Honduras • • • • •n Jamaica • • • • •n Mexico • • • • • •n Nicaragua • • • • • •n Panama • • • • •n Paraguay • • • • •n Trinidad & Tobago • • • • • •n Uruguay • • • • •n Venezuela • • • • • •
Asia and the Pacificn n Nepal • • • • •n n India • • • • • • •n n Indonesia • • • • • •n n Afghanistan • • • • • • •n n Myanmar (Burma) • • • • • • •n n Pakistan • • • • • • •n n Solomon Islands • • • •n n Sri Lanka • • • • • • •n n Philippines • • • • • • •n Cambodia • • • • •n Bangladesh • • • • • • •n Bhutan • • • • • • •n China • • • • •n East Timor • • • • •n Fiji • • • •n Korea, North • • •n Laos • • • • • •n n Thailand • • • •n Vietnam • • • • •n Australia • • • • •n Japan • • • • •n Korea, South • • • • •n Malaysia • • • • • •n Mongolia • • • • •n New Zealand • • • • •n Papua
New Guinea • • • • •n Singapore • • • • • •n Taiwan • • • • • •

10
Peac
e-Bu
ildin
gCa
paci
ty
Arm
edCo
nflic
t
Hum
anSe
curit
y
Self-
Dete
rmin
atio
n
Disc
rimin
atio
n
Regi
me
Type
Dura
bilit
y
Soci
etal
Capa
city
Neig
hbor
hood
Column 7: DurabilityThe icons in this column take into account the maturity of a country’s system of government and, as such, its conflictmanagement capabilities. New political systems have notyet consolidated central authority nor established effectiveinstitutions and, so, are vulnerable to challenges and furtherchange, especially during their first five years. So are thegovernments of newly-independent countries. Red iconshighlight countries whose political institutions in early 2005were less than five years old, that is, they were establishedbetween 2000 and 2004. Yellow icons register countrieswhose polities were less than ten years old; establishedbetween 1995 and 1999. Green icons are used for countrieswhose polities were established before 1995.
Column 8: Societal CapacityThe governments of rich societies are better able to main-tain peace and security than are governments of poor societies. We use an indicator that combines information on both GDP per capita (income) and societal energy con-sumption per capita (capitalization) over the past five-yearperiod to rate countries on this indicator. Red icons signifycountries in the lowest quintile (the bottom 20%) of societalcapacity. Yellow icons flag coun- tries in the second quintile.Countries in the third quintile are left blank. Green iconsidentify countries in the top two quintiles (the upper 40%) insocietal capacity.
Column 9: NeighborhoodWe define ten politically relevant “neighborhoods”: WestAfrica, North Africa, East Africa, South Africa, Middle East,South Asia, East Asia, South America, Central America, and Europe/North America. For each region we gauge theextent of armed conflicts in early 2005 and the prevailingtypes of regimes, either democratic, anocratic, or autocratic.Countries with green icons are in regions with relatively low armed conflict and mostly democratic governments.Countries with red icons are in “neighborhoods” with higharmed conflict and many anocratic, or transitional, regimes.Countries with yellow icons are in regions with middling levels of armed conflict and mostly autocratic regimes. Forcountries that straddle regions, or are situated in regionswith mixed traits, a final determination was made by refer-ence to armed conflicts in bordering countries. For example,countries with two or more bordering countries engaged inarmed conflicts are coded red on this indicator. Island stateswithout close, “politically-relevant” neighboring states areblank on this indicator.
1 Interstate wars are included with this indicator but are not used in evaluating a country’s general quality of human security (column 3). The only current situations of major interstate war are the armed conflicts between the UnitedStates and insurgents and al Qaeda operatives in Iraq andAfghanistan. Countries that have contributed peacekeepingtroops to various locations of past and continuing violence are not considered to be “at war.”
North Africa and the Middle Eastn n Algeria • • • • • •n n Iraq • • • • • • •n n Israel • • • • • • •n Iran • • • • • •n Lebanon • • • • • • •n Egypt • • • •n Jordan • • • •n Libya • • • •n Morocco • • • • • •n n Saudi Arabia • • • • •n Syria • • • • •n Tunisia • • • •n n Turkey • • • • • •n n Yemen • • • • •n Bahrain • • • • • •n Cyprus • • • • • •n Kuwait • • • • •n Oman • • • • •n Qatar • • • • •n United Arab
Emirates • • • • •Africa South of the Sahara
n n Burundi • • • • • •n n D. R. Congo • • • • • •n n Nigeria • • • • • • •n n Sudan • • • • • • •n n Uganda • • • • •n n Angola • • • • • • •n n Central
African Republic • • • •n n Rep. Congo • • • • • •n n Ethiopia • • • • • • •n n Ivory Coast • • • • •n n Liberia • • • • •n n Rwanda • • • • • •n n Sierra Leone • • • • • •n n Somalia • • • • • •n Burkina Faso • • • • •n Guinea Bissau • • • •n Guinea • • • • •n Cameroon • • • • • •n Chad • • • • • • •n Comoros • • • • •n Djibouti • • • • • • •n Equatorial Guinea • • • •n Eritrea • • • • •n Gabon • • • •n Gambia • • • • •n Ghana • • • • •n Kenya • • • • • •n Lesotho • • • • •n Madagascar • • • •n Mauritania • • • • • •n Mozambique • • • •n Niger • • • • •n Senegal • • • • •n Tanzania • • • • • •n Togo • • • • •n Zambia • • • • • •n Benin • • • • •n Botswana • • • • •n Malawi • • • • •n Mali • • • • • • •n Mauritius • • • •n Namibia • • • • • •n South Africa • • • • • • •n Swaziland • • • •n Zimbabwe • • • • • •

11
3 . G L O B A L T R E N D S I N V I O L E N T C O N F L I C T
The global trend in major armed conflict has continued to decrease markedly in thepost-Cold War era both in numbers of states affected by major armed conflicts and ingeneral magnitude. According to our calculations, the general magnitude of global war-fare has decreased by over sixty percent since peaking in the mid-s, falling by the endof to its lowest level since the late s, as shown in Figure ..1
Summary and Overview. In early we have listed eighteen countries with ongoingmajor armed conflicts; two of those countries had two ongoing wars, for a total oftwenty major armed conflicts in the world at the time of this report. Of the twenty majorarmed conflicts listed as ongoing in early , eight wars were being waged at mediumor high intensity: one in Latin America (Colombia), one in the Former-Socialist coun-tries (Russia), three in Asia (India, Myanmar, and Nepal), one in the Middle East (Iraq),and two in Africa (Democratic Republic of Congo and Sudan). Countries with wars thatare either low intensity or sporadic at this writing include four in Asia and the Pacific
Monty G. Marshall
Total Magnitude of Armed Conflict
0
50
100
150
200
20001995199019851980197519701965196019551950
All Interstate Wars (inc. colonial wars)
Interstate Warfare
Societal Warfare
Warfare Totals (Societal + All Interstate)
Figure 3.1: Global Trends in Violent Conflict, 1946-2004
1 Only countries with at least , total populations in are included in this study ( total in); interstate and societal wars must have reached a magnitude of over , directly-related deaths tobe listed. The magnitude of each major armed conflict is evaluated according to its comprehensive effectson the state or states directly affected by the warfare, including numbers of combatants and casualties, sizeof the affected area and dislocated populations, and extent of infrastructure damage. It is then assigned asingle score on a ten-point scale measuring the magnitude of its adverse effects on the affected society; thisvalue is recorded for each year the war remains active. See Table . in the Appendix for descriptions of cur-rent and recent major armed conflicts; each of the descriptions includes the war’s magnitude score. SeeMonty G. Marshall, “Measuring the Societal Effects of War,” chapter in Fen Osler Hampson and DavidMalone, eds., From Reaction to Conflict Prevention: Opportunities for the UN System (Boulder, CO: LynneRienner, ) for a detailed explanation of the methodology used. A full list of major armed conflicts isposted on the Center for Systemic Peace Web site at http://members.aol.com/cspmgm/warlist.htm.

12
(Afghanistan, northeast India, Indonesia, and the Philippines); two in North Africa andthe Middle East (Algeria and Israel); and five in Africa South of the Sahara (Burundi,Ivory Coast, two in Nigeria, Somalia, and Uganda). Since the beginning of therehave been five new outbreaks of war: in there were two outbreaks of internationalwar (al Qaeda attacks on the United States and the U.S. punitive attack on Afghanistan);in there was an outbreak of mixed ethnic-political war in Ivory Coast; and in
there were outbreaks of an international war (U.S. invasion of Iraq) and an ethnic war(black-African Muslims in the Darfur region of Sudan). There were no new outbreaks ofwar listed in , however, there are six countries noted as having “emerging wars” in and early . Emerging war situations are those where “systematic and sustained”fighting has broken out but the number of directly-related deaths has not yet reached the,-death threshold for designation as a major armed conflict. If and when these situ-ations reach the minimum magnitude criterion, they will be added to the lists of warsbeginning with the date when the fighting started. These emerging wars include possi-ble political wars in Haiti, Pakistan, Saudi Arabia, and Yemen; ethnic wars with Kurdsin Turkey and Muslim Malays in Thailand; and communal war between Sunni and Shi’aMuslims in Pakistan.
Since , there have been eleven wars suspended or repressed: four in (commu-nal war between Dayaks and Madurese in the Kalimantan region of Indonesia, ethnicwar with Hutus in Rwanda, political war in Sierra Leone, and an international war inthe United States); six in (mixed ethnic-political war with UNITA and an ethnicwar with Cabindans in Angola; communal war between Hindus and Muslims in Gujaratin India; communal war between Muslims and Christians in the Moluccas and Sulawesiin Indonesia; ethnic war with Tamils in Sri Lanka; and ethnic war with non-Muslimblack-Africans in southern Sudan); and one in (political war in Liberia). No warsare listed as ending in , although any of the eleven armed conflicts that are listed aslow intensity or sporadic violence may be ending. The only reliable evidence for deter-mining the ending of a war is the observation of an end to systematic and sustainedfighting for a substantial period of time (at least one year for provisional and four yearsfor final determination). See Appendix table . for a full listing of the world’s ongoingand recently ended major armed conflicts and a brief description of each conflict’s statusin early .
Interstate wars have been uncommon since the United Nations collective security sys-tem was established following World War II. In the s, there were very few interstatewars and their magnitude, scope, and duration were mostly limited. Iraq has been almostcontinually at war with some foreign country since it invaded Iran on September ,, beginning a crippling eight-year war. The Iraq invasion of Kuwait and thesubsequent U.S.-led Gulf War to expel the invaders was the only unambiguousinter-state war during the post-Cold War era until the March U.S. invasion of Iraqand its forced ouster of the Saddam Hussein regime in April of that year. High casual-ties occurred in three interstate wars in this period: in the Gulf War, during which onlythe Iraqi forces suffered high casualties, the border war that broke out in betweenEthiopia and Eritrea, and during the U.S. invasion and subsequent occupation of Iraq(ongoing). The Ethiopia-Eritrea conflict, which was suspended in June , was anindirect consequence of the protracted secessionist war that led to Eritrea’s separation
2 Recall that only countries directly affected by wars, that is, countries where wars are actually fought, are listed.Thus, countries that deploy armed forces to fight wars in foreign countries are not included in the list.
There have beenfive new outbreaksof war.There have beeneleven wars sus-pended or repressed.

13
from Ethiopia in . Other inter-state wars in the s occurred in the guise of armedinterventions in civil conflicts, including U.S.-led interventions in Bosnia in ,against Iraq in (enforcing “protection zones” over Kurd and Shi’a Arab regions),Yugoslavia in (ending repression of the Kosovar Albanians), and in Afghanistan in (siding with the Northern Alliance to oust the Taliban regime and destroy al Qaedaterrorist bases). Other instances include Armenian support for the Nagorno-Karabakhseparatists in Azerbaijan and several military clashes between Pakistan and India con-nected with the ongoing rebellion in Kashmir. In , the world witnessed the first,overt confrontation between newly emerging nuclear powers since as India andPakistan massed forces along their shared border following a series of provocative events.That confrontation was quickly defused through intense international engagement.
Armed civil, or societal, conflicts were numerous and widely distributed through theglobal system in the s and s but in the early years of the st century wars havebeen concentrated mainly in Africa and south central Asia. Increases in societal tensionsand violent attacks in several Middle East countries since the / () al Qaeda attackson the U.S. and the subsequent U.S. attacks on Afghanistan and Iraq may be indicationsof a shift in the main locus of global warfare to Muslim countries; it must be noted thatwars in Muslim countries figured prominently in the Africa and central Asia regions and,so, the shift in the locus of war to Muslim countries has antecedents in previous periods.While the frequency of new outbreaks of all types of wars remained fairly constant dur-ing the last half-century, with a small spike in ethnic wars immediately following the endof the Cold War, societal wars were enormously resistant to resolution and, thus, accu-mulated over time to reach a peak in . Over one-third of the world’s countries ( of) were directly affected by serious societal warfare at some time since and, ofthese states, nearly two-thirds () experienced armed conflicts for seven or more yearsduring the post-Cold War period. On the more positive side, only eight of these pro-tracted societal wars remained “hot” in early and continued to defy internationalpressures for reconciliation (Algeria, Burundi, Colombia, the Democratic Republic ofCongo, India, Myanmar, Nepal, and Russia), although some progress was being madein ending wars in Algeria, Burundi, and Democratic Republic of Congo. Three otherprotracted wars (in Israel, Philippines, and Somalia) continue at low levels while nego-tiated solutions are actively being sought.
Failing, Failed, and Recovering States. Large parts of eastern Asia experienced devastat-ing warfare and political turmoil during and in the immediate aftermath of the SecondWorld War. These east, southeast, and south Asian wars signaled the beginning of theglobal decolonization period that soon spread to North Africa and, eventually, through-out Sub-Saharan Africa. These wars of independence often led to long periods of con-tention and instability as rival ethnic and political factions vied for control of state powerthat had been seized from or abandoned by the European colonial authorities. Fueled bythe superpower rivalry that characterized the Cold War period, large portions of thedeveloping world became engulfed in, and consumed by, protracted social conflict andsocietal warfare. As these societies emerge from years of intense societal conflict in thes and early s, they are finding their prospects for recovery challenged by theirweakened state capacity, deeply divided societies, devastated economies, squanderedresources, and traumatized populations. At the same time, civil societies crippled by soci-etal wars must compete for loyalties and revenues with internationalized organized crimeand black (and gray) market networks. They also must contend with the spillover effects
In the early years of the st century wars have been concentrated mainlyin Africa and south central Asia.

14
of similar problems in neighboring states. In turn, limited capacities at the local andregional levels present enormous challenges for the international donor community thatseeks to rebuild these societies in the face of rapidly spreading humanitarian crises: dis-locations, disasters, predation, famine, and disease. The transnational effects of weakstates and troubled societies are only now being recognized as serious threats to globalsecurity.
Some of the most troublesome features of societal conflicts in the modern, globalizingworld are their systemic effects. We can no longer afford to think of societal conflicts aslocalized and isolated problems requiring negotiated settlements by the leaders of the war-ring parties; we must see them as “nested” problems that substantially affect and, in turn,are significantly affected by their surrounding environment. Social and factor mobility ina globalizing world have created a situation where not only can assets flee from problemareas (e.g., “brain drain” and “capital flight”) but, also, conflict liabilities can move rathereasily from strengthening societies to weaker locations to seek refuge and take advantageof new and future opportunities. Local conflicts and failed states take on regional and,even, global proportions, as witnessed recently by the complex “vortex” conflict dynam-ics characterizing the west and central African regions, the south-central Asia region, andthe global al Qaeda terrorist network. Economic interdependence and the transnationalqualities of social ills require regional and global, multilateral engagement in and com-mitment to the peace-building process. Broad reconciliation, recovery, integration, anddevelopment strategies must accompany the implementation of conflict settlements forthe process of peace-building to be successful over the medium to long term.
Systemic Repercussions and the Changing Nature of Warfare. The era of interdepen-dence is giving way to an era of globalization and the downward global trend in majorarmed conflicts is an important barometer of the globalization trend. We proposed inour previous reports, Peace and Conflict and , that “if [the three positive trendsof lessened armed conflicts, more frequent resolutions of self-determination conflicts,and increased numbers of democratic governments] continue in the first decade of thenew century, [they] will establish a world more peaceful than at any time in the past cen-tury.” The three trends are continuing through and we stand by our claim (see thefollowing sections for reports on trends in governance and self-determination move-ments). But the positive trends coexist with counter-trends that present major challengesto the emerging global community. The most disturbing counter-trend is the spread ofviolence in Muslim countries.
One such challenge, already mentioned, is the legacy of wounded societies and failingstates as they emerge from years of destructive conflict. A second is the unleashed sur-plus of war personnel and materiel that is flooding the global market, fueling organizedcrime, and feeding the emerging global security problematique. This challenges not onlythe limited capacity of states and international organizations to manage conflicts but,also, the ability to monitor and analyze conflict trends. Highly centralized societal warsare breaking up into highly decentralized applications of violence and other anti-societalactivities that operate “below” our conventional radar screens and “outside” our tradi-tional conflict management strategies. A third challenge stems from the ghettoization oflarge areas of the world where deepening poverty and deteriorating social conditionsmarginalize entire populations and severely limit their access to the benefits of the global
The transnationaleffects of weak states and troubledsocieties are only now being recognizedas serious threats to global security.

15
economy. A fourth challenge is to understand and rectify the severe maldistribution ofwealth and resources that contributes to the maintenance of autocratic regimes and therise of terrorism and insurgencies throughout the Muslim world.
A final challenge stems from the increased levels of external engagement that followdecreased levels of armed societal conflict. Ensuring accountability and transparency ofpost-war regimes and maintaining progress in the implementation of peace accords andintegration of disenfranchised populations are all critical aspects of the peace processwhere external support can be pivotal in determining the prospects for recovery and nor-malization. International actors are widely expected to assume responsibility for post-civil war reconstruction, particularly in reestablishing the essential qualities of trust thatunderlie normative law and democratic process. Warriors are transformed to peace-mak-ers and peace-builders and expected to simultaneously police and administer many war-torn societies without violating the public trust. But the care of affected populations, therebuilding of war-torn states, and the need to forestall regression to open warfare over-whelms current levels of international assistance and undercuts expectations of progressin development at a time when the more fortunate countries are themselves growingweary of providing charity. The pressures of globalization tend to accentuate the eco-nomic disadvantages of war-torn societies. The challenge is that the need for diligenceand vigilance are even greater during the societal recovery phase, a phase that can last avery long time indeed. The gains we are witnessing in making peace must be simultane-ously augmented by concerted efforts at repairing the peace, maintaining the peace, andincreasing the capacity of societies to reproduce the peace. What we are faced with at thebeginning of the st century is a unique opportunity, and challenge, to set the emerg-ing global system on the right track.
The positive trends coexist with counter-trends that present major challenges to the emerging global community… the legacy of wounded societies and failing states… surplus ofwar personnel and materiel that is flooding the global market… the ghettoization of large areas of the world…severemaldistribution of wealth and resources… [and the challenge of ]ensuring accountability and transparency.

16
4 . G L O B A L T R E N D S I N D E M O C R A T I Z A T I O N
In , five years after the end of the Second World War, there were seventy-eight inde-pendent states comprising the emerging global system.1 Of these, only twenty-threewere ruled by democratic regimes; the remainder were about equally split between auto-cratic regimes () and anocratic regimes (; a description of these three regime cate-gories follows below). As European control over colonial territories in Asia and Africadiminished following the war and new states gained independence and entered theglobal system in the s, s, and early s, there was a dramatic increase in thenumber of autocratic regimes. Although newly independent states were about as likelyto adopt democratic as autocratic forms of governance, problems of manageabilitycaused most new, democratic regimes to fail within several years and give way to auto-cratic rule. By , there were eighty-nine autocratic regimes in the world, with onlythirty-five democratic and sixteen anocratic regimes. A dramatic global shift away fromrigidly autocratic regimes and toward democracy began in the late s and continuedthrough the s. This “wave of democratization” was led by Latin American countriesand the former-Socialist countries of Eastern Europe. According to our categorizationsof the annual Polity IV data on governance, graphed in Figure ., the number of autoc-racies has decreased sharply since their peak in while the number of democracies,having nearly doubled in the late s and early s, continues to increase graduallyin the first years of the st century. There were eighty-eight countries classified asdemocracies in early and only twenty-nine autocracies. At the same time, follow-ing a three-fold jump (from in to in ), the number of states that fall inour middling category of regimes, the anocracies, has declined slightly over the last fewyears (falling to in early ).
Monty G. Marshall
Number of Countries
0
20
40
60
80
100
20001995199019851980197519701965196019551950
Democracies
Autocracies
Anocracies
Figure 4.1: Global Regimes by Type, 1946-2004
1 This study does not include micro-states in its analyses; a state must have reached a total population of, to be included.

17
While we view the major global shift toward greater democracy as a very important andgenerally positive trend, the sharp increase in the number of anocracies is cause for con-cern. Historical research suggests that anocracies have been highly unstable regimes, withover fifty percent experiencing a major regime change within five years and over seventypercent within ten years. Anocracies have been much more vulnerable to new outbreaksof armed societal conflict; they have been about six times more likely than democraciesand two and one-half times as likely as autocracies to experience new outbreaks of soci-etal wars. Anocracies have also been about three times more likely to experience majorreversions to autocracy than democracies. However, a “new truth” may be emergingregarding the vulnerability of anocratic regimes in the post-Cold War era. In the past tenyears, there have been far fewer failures of anocratic regimes than would be expectedfrom the historical trends. Despite continued high numbers of anocratic regimes, therehas been a steady decrease in global trends in violent conflict (see section , figure .)and fewer than expected outbreaks of new political instability events. We believe thatthis change in trends for anocratic regimes is due largely to notable increases in proac-tive international engagement and expectations since the end of the Cold War. We havealso noted some improvement in the peace-building capacities of vulnerable countriessince our report (see section ). Whether this “new truth” is a temporary aberrationin existing trends or evidence of a new trajectory depends on the future qualities ofglobal policies.
Defining Democracy. Democracy, autocracy, and anocracy are ambiguous terms and dif-ferent countries have different mixes and qualities of governing institutions. Eventhough some countries may have mixed features of openness, competitiveness, and reg-ulation, the core qualities of democracy and autocracy can be viewed as defining oppo-site ends of a governance scale. We have rated the levels of both democracy and autocracyfor each country and year using coded information on the general qualities of politicalinstitutions and processes, including executive recruitment, constraints on executiveaction, and political competition. These ratings have been combined into a single measure of regime governance: the Polity score. The Polity scale ranges from - (fullyinstitutionalized autocracy) to + (fully institutionalized democracy). A perfect + democ-racy, like Australia, Greece, and Sweden, has institutionalized procedures for open andcompetitive political participation; chooses and replaces chief executives in open, com-petitive elections; and imposes substantial checks and balances on the powers of the chiefexecutive. Countries with Polity scores from to are counted as democracies in Figure.. Elected governments that fall short of a perfect , like Mozambique, Turkey, andVenezuela, may have weaker checks on executive power, some restrictions on politicalparticipation, or shortcomings in the application of the rule of law to opposition groups.
In a perfect - autocracy, by contrast, citizens’ participation is sharply restricted or sup-pressed; chief executives are selected according to clearly defined (often hereditary) rulesof succession from within the established political elite; and, once in office, chief execu-tives exercise power with few or no checks from legislative or judicial institutions. OnlySaudi Arabia and Qatar are rated as fully institutionalized autocracies in early ;other monarchies, such as those in Bhutan, Morocco, and Swaziland, share some pow-
2 The Polity IV data set was originally designed by Ted Gurr; it has annually coded information on the qual-ities of political institutions for all independent countries (not including micro-states) from through and is regularly updated by the lead author of this report. The data set is available athttp://www.cidcm.umd.edu/inscr/polity. The indicators are described and analyzed by Keith Jaggers andTed Robert Gurr in “Tracking Democracy’s Third Wave with the Polity III Data,” Journal of Peace Research,vol. No. (), pp. -.
There have been far fewer failures of anocratic regimes[since ] thanwould be expectedfrom the historicaltrends.

18
ers with elected officials. In general, except for a strong presence in the oil-producingstates of the Arabian Peninsula, hereditary monarchy has nearly disappeared as a form ofgovernance in the early st century. Autocratic governance at the turn of the century isfar more likely to be characterized by the authoritarian rule of personalistic leaders, mil-itary juntas, or one-party structures; Libya, Myanmar (Burma), and Vietnam are exam-ples of these non-monarchical autocracies. Besides having slightly more open, orless-clearly defined, rules of succession, less-than-perfect autocracies may allow somespace for political participation or impose some effective limits on executive authority;examples include Belarus, China, and Zimbabwe. Countries with Polity scores of - to- are counted as autocracies in Figure ..
Many governments have a mix of democratic and autocratic features, for example hold-ing competitive elections for a legislature that exercises little effective control on theexecutive branch or allowing open political competition among some social groups whileseriously restricting participation of other groups. There are many reasons why countriesmay come to be characterized by such inconsistencies, or incoherence, in governance.Some countries may be implementing a staged transition from autocracy to greaterdemocracy; others may institute piecemeal reforms due to increasing demands fromemerging political groups. Societal conflict and factionalism often stalemate democraticexperiments: some regimes may be unable to fully institutionalize reforms due to seriousdisagreements among social groups; some may harden their institutions in response topolitical crises or due to the personal ambitions of opportunistic leaders; and others maysimply lose control of the political dynamics that enable, or disable, effective governance.Whereas democracy and autocracy are very different forms of governance, they are verysimilar in their capacity to maintain central authority, control the policy agenda, andmanage political dynamics. Anocracies, by contrast, are characterized by institutions andpolitical elites that are far less capable of performing these fundamental tasks and ensur-ing their own continuity. Anocratic regimes very often reflect an inherent quality ofinstability or ineffectiveness and are especially vulnerable to the onset of new politicalinstability events, such as outbreaks of armed conflict or adverse regime changes (e.g., aseizure of power by a personalistic or military leader). In our previous report (, sec-tion ), we detailed an “inverted-U curve” relationship between Polity IV regime scoreand the onset of political instability events; we refer the reader to that source for moredetailed information.
Anocracies are a middling category rather than a distinct form of governance. They arecountries whose governments are neither fully democratic nor fully autocratic; theirPolity scores range from - to +. Some such countries have succeeded in establishingdemocracy following a staged transition from autocracy through anocracy, as in Mexico,Nicaragua, Senegal, and Taiwan. A number of African and a few Middle Eastern coun-tries have recently begun a cautious transition to greater openness, among them BurkinaFaso, Djibouti, Ghana, Guinea, Jordan, and Tanzania. The Ivory Coast appeared to beheaded on a similar course before stumbling (in ) into civil war and regime failure;Iran also reversed the course of democratic reforms and tightened autocratic control in. Others have been able to manage conflict between deeply-divided social groups
3 Earlier editions in the Peace and Conflict report series are available in electronic format on the CIDCMWeb site.
4 Also included in the anocracy category are countries that are undergoing transitional governments (coded“-” in the Polity IV dataset) and countries where central authority has collapsed or lost control over amajority of its territory (coded “-” in the dataset).
Societal conflict and factionalismoften stalematedemocratic experi-ments… others may simply lose control of the political dynamics…

19
for substantial periods of time through the use of categorical restrictions on the politicalparticipation of a substantial out-group as in Malaysia (Chinese), Singapore (Malays),and South Africa (black-Africans under Apartheid). This also appears to be the strategyrecently adopted in Fiji to limit political influence by ethnic-Indians. Other anocraciesare the result of troubled transitions to greater democracy, as currently in Algeria,Angola, Cambodia, and Haiti.
Democracy, Peace, and Peace-Building. Building and maintaining systemic peace andsecurity depends fundamentally on the characteristics of constituent polities. Autocraticgovernments manage societal conflicts mainly by coercion, with accommodation andreform playing secondary roles. Democratic governments manage societal conflictsmainly by channeling them into conventional protest, lobbying, and electoral politics.When divisive ethnic and political issues do surface in democracies, they usually areexpressed in strikes and demonstrations rather than open rebellion and often culminatein reform policies. When democracies fail to properly manage societal conflict, theyinevitably become more autocratic as political violence escalates and/or persists over time.
The relationship between prospects for democratization and recent experiences withsocietal wars may seem somewhat muddled. The “democratic peace proposition” claimsthat democracies are both internally stable and non-aggressive when settling differenceswith other democracies. However, the evidence underlying this proposition builds onthe contemporary record of old democracies and other advanced industrial and post-industrial societies. No claims are made regarding the peaceful nature of interactionsbetween democracies and other types of regimes. In fact, because of the high correlationbetween economic affluence and democratic regimes prior to the end of the Cold War,the powerful global reach of many of these democracies has enabled them to be quiteactivist in global politics and to use force, the threat of force, or the material support offorce as common instruments in their global policies, particularly in regard to disputeswith autocratic regimes. Adding to the ambiguity surrounding the relationship betweendemocracy and violence is the “myth” of the democratic revolution, particularly in regardto the American and the French Revolutions but also the transformation of the fascistregimes of Germany, Italy, and Japan to democracies following their defeat in the SecondWorld War. What is clear is that countries coded as fully institutionalized democracies(Polity code “”) experienced very little societal war during the entire post-World War IIperiod (since ); the most serious situations in these countries were the civil violence inNorthern Ireland in the United Kingdom and Basque separatism in Spain.
Evidence regarding democratic transitions during the contemporary era (since ) sug-gest a very clear and strongly negative relationship between political violence and democ-ratization initiatives. Of the sixty-seven countries counted as democracies in early
that had made their transition to democracy since , only six had instituted democ-ratic regimes as part of a peace settlement to end a major societal war: Colombia in thelate s and, since the s, El Salvador, Guatemala, Mozambique, Nicaragua, andSouth Africa. Four other countries that had experienced major societal wars were able toinstitute democratic regimes by effectively excluding groups that had engaged in armedconflict with the state, including Croatia, Georgia, Philippines, and Serbia andMontenegro. Fifty of the democratizing countries had experienced no major societalarmed conflicts during the contemporary era prior to the establishment of their democ-ratic regime. Seven others had experienced only limited armed conflict prior to their
Evidence regardingdemocratic transitionsduring the contem-porary era suggest avery clear andstrongly negative relationship betweenpolitical violence and democratizationinitiatives.

20
democratic transition, including Argentina, Chile, Dominican Republic, Indonesia,Kenya, Senegal, and Thailand. Algeria had not experienced societal warfare since
prior to its aborted democratic transition in , which then triggered an enormouslydestructive civil war. Nepal had not experienced armed conflict prior to the beginningof its democratization process in the s, which has, at least temporarily, been reversedsince an outbreak of armed conflict in . On the other hand, most of the countriesthat have suffered through the most serious and protracted societal wars either remainautocratic, such as Azerbaijan, China, Eritrea, Iran, Laos, Myanmar, Sudan, andVietnam, or have been unable to establish coherent regimes and are included in the ano-cratic category, such as Afghanistan, Angola, Bosnia, Burundi, Cambodia, Chad,Democratic Republic of Congo, Equatorial Guinea, Ethiopia, Iraq, Lebanon, Liberia,Rwanda, Somalia, and Uganda. Only three countries have maintained democraticregimes during protracted societal wars: Colombia, Israel, and Sri Lanka.
While democracy is strongly associated with peace and the capacity for peace-building,what is not clear is democracy’s role in establishing peace and prosperity. It is not clearhow much democracy actually fosters peace and facilitates peace-building and howmuch democracy is the culmination of economic performance, societal development,and peace-building efforts. One thing seems clear from the evidence, democracy rarely,if ever, results from radical or revolutionary transformations of governing structures.Regardless of their stated intentions, these transformations have almost invariably ush-ered in extreme forms of violence and repression. Countries that have made successful“leaps” from autocratic to democratic regimes have, by and large, been old and well-developed societies that have managed to avoid serious armed conflicts, particularly inLatin American and former-Socialist countries. Only two countries have made success-ful, gradual transitions to democracy, Mexico and Taiwan, and both of these lengthytransitions transpired without serious armed challenges. Open forms of governance ingeneral have shown themselves to be extremely fragile political systems that are highlyvulnerable to internal challenges and external pressures; advanced economic and societaldevelopment help to offset the inherent fragility of democratic politics. Weak democra-cies are particularly ill-equipped to manage or repress violent challenges, whether revo-lutionary, separatist, or predatory, and they are ill-suited to withstand the twin pressuresof grievance and contention in war-torn societies. They are often deadlocked during seri-ous or sudden economic crises. Since there have been over twenty instances wherepopular uprisings and mass demonstrations have contributed to the downfall of a gov-ernment or prevented the abrogation of an electoral process, as happened in Ecuador,Ivory Coast, Peru, and Yugoslavia in ; Argentina, Madagascar, and Philippines in; Venezuela in ; Bolivia and Georgia in ; Ukraine in ; and Lebanon,Kyrgyzstan, and Ecuador, again, in early . In the recent past, such mass participationin the political process very often triggered military intervention, confrontation, or repres-sion. Military activism, while less prominent, has not completely disappeared in the new“democratic era,” for example, there were military ousters of elected governments inPakistan in , Nepal in , and Guinea-Bissau and Central African Republic in. This is the nature of the governance-development-security conundrum that con-tinues to beguile analysts, practitioners, and policy-makers alike at the beginning of thest century, particularly as we have moved into an uncharted era in which, for the firsttime in history, democratic regimes predominate.
Open forms of governance in general have shownthemselves to beextremely fragilepolitical systems.Advanced economicand societal devel-opment help to offsetthe inherent fragilityof democratic politics.

21
5 . S E L F - D E T E R M I N A T I O N M O V E M E N T S A N D
T H E I R O U T C O M E S
The quest of national and indigenous peoples for self-governance has reshaped the polit-ical landscape in many countries and the international system as a whole during recentdecades. Some states and many autonomous regions within states have been formed asa result of such movements. Seventy-one territorially concentrated ethnic groups havewaged armed conflicts for autonomy or independence at some time since the s, notcounting the peoples of former European colonies. One new conflict erupted since ourlast report in : the rebellion by the Muslim Black-Africans in the Darfur region ofwestern Sudan. Rebels in Darfur, claiming they were subject to ongoing neglect and dis-crimination and hoping to gain concessions like those being negotiated between theKhartoum government and the Southern Sudanese rebels, began attacks against stateauthorities in February . Hostilities soon escalated, with the Sudanese governmentretaliating against the rebels and supporting local Arab “janjaweed” militias.
Three previously contained self-determination movements experienced renewed hostili-ties in recent years: Malay-Muslims in southern Thailand, Acehnese in Indonesia, and anew rebel organization emerged in Baluchistan in in a bid to (re)ignite a campaignfor autonomy, some thirty years after the last attempt was repressed. Twenty-five armedself-determination conflicts were ongoing as of early , including the Assamese,Kashmiri Muslims, Tripuras, and Scheduled Tribes in India; the Karens and Shan inMyanmar; the Chechens in Russia; the Basques in Spain; the Kurds in Turkey; and theIjaw in Nigeria.
Despite instances of continuing warfare, the last four years have witnessed a continua-tion of a previously documented pattern: beginning in the early s a sustained declinein the total number of armed self-determination conflicts and a countervailing shifttoward containment and settlement (see table . and figure .). This decline hasoccurred despite a spike in the number of new armed conflicts () in the five-yearperiod immediately following the end of the Cold War. Five violent self-determinationconflicts were settled and eight were contained from to . Settlements werereached that ended the fighting of Afars in Djibouti, Albanians in Macedonia,Casamançais in Senegal, and Nuba and non-Muslim, Black-Africans in southern Sudan.Conflicts contained since include high-profile cases with strong internationalengagement involving Tamils in Sri Lanka and Tajiks and Uzbeks in Afghanistan, a newoutbreak of armed conflict by Albanians in Serbia and Montenegro, renewed outbreaksof violence involving Abkhazians in Georgia, repression of Uigher activists in northwestChina, and ceasefires with Nagas and Bodos in northeast India. Ceasefires and interimagreements continue to provide some combination of political recognition, greaterrights, and regional autonomy to most populations represented by these movements;however, not all factions of those fighting for self-determination accept the conditions ofthese accords (see Appendix table .).
Not all self-determination movements rely on violent tactics. This study has identifiedfifty-four () territorially concentrated groups that currently support significant move-ments seeking greater self-determination by conventional political means. Twenty-three() other groups employ a strategy mixing conventional means with militant tactics
Deepa Khosla
Twenty-five armedself-determinationconflicts wereongoing as of early

22
short of armed attacks. This tally includes one addition to the list reported in the
edition of Peace and Conflict: the highland indigenous peoples in Bolivia (see Appendixtable .). Leaders of these groups rely mainly on building mass support, publicly rep-resenting group interests, and carrying out electoral and/or protest campaigns. Whiletheir tactics occasionally include isolated acts of violence, thus far they have stoppedshort of serious armed conflict. Some, such as the Flemish and Walloons in Belgium, theCatalans in Spain, and the Jurassians in Switzerland, act through local political institu-tions that were created to satisfy group demands for autonomy. The Flemish andWalloons in Belgium, the Cornish in the UK, the Inuit indigenous peoples in Canada,the Hungarians in Yugoslavia, and the Anjouanese in Comoros all gained some degreeof increased or re-instated political, economic, or cultural autonomy between late
and early .
Phases of Self-determination Conflicts. The political dynamics of self-determinationmovements in conflict with state authorities change over time in response to altered cir-cumstances in the terms and expectations of their relationship. The general character ofgroup tactics and strategies often moves through distinct phases. This movement may bea more or less linear progression from conventional politics to militancy, armed conflict,negotiation, settlement, and sometimes, independent statehood. More often, however,movements are neither linear nor necessarily progressive. Movements may be thwartedby repressive policies or induced to alter their tactics by new leadership or external influ-ences. Armed conflicts that had been contained, or even settled, may resume. The fol-lowing section describes a diagnostic scheme with ten phases developed to simplify thetracking and comparison of conflicts. Appendix table . categorizes the current status(in early ) of seventy-one () conflicts that experienced an armed conflict phase atsome point during the past years.
1. Conventional politics (3 groups): Self-determination currently is pursued through con-ventional political strategies including advocacy, representation of group interests to offi-cials, and electoral politics. Groups with self-administered regions and power-sharingarrangements in existing states are also included here. Protagonists who once foughtarmed conflicts but now rely on conventional politics include Serbs in Croatia, Kurds inIran, and Gaguaz in Moldova. Another fifty-four () that have not openly rebelled inthe past also use these tactics now (see Appendix table .).
2. Militant politics (3 groups): Self-determination goals are pursued by organizing andinciting group members to use disruptive tactics such as mass protest, boycotts, andresistance to authorities; disruption strategies are often accompanied by, or give rise to,a few symbolic acts of violence. Former rebel groups using these strategies at presentinclude Tibetans and Uighers in China and Ibos in Nigeria. Another twenty-three ()groups listed in Appendix table . that have not engaged in large-scale violence in thelast half-century currently use militant politics.
3. Low-level hostilities (14 groups): Self-determination is pursued through localized useof violent strategies such as riots, local rebellions, bombings, and armed attacks againstauthorities. These include the Kurds in Turkey, Tajiks and Uzbeks in Afghanistan,Papuans in Indonesia, and Basques in Spain.
4. High-level hostilities (12 groups): Self-determination is sought by widespread and orga-nized armed violence against authorities. For example, the Chechens in Russia,Palestinians in the Israeli Occupied Territories, Assamese and Kashmiris in India,

23
Oromos and Somalis in Ethiopia, Malay-Muslims in Thailand, and Muslim BlackAfricans in Darfur, Sudan are engaged in serious fighting.
5. Talk-fight (1 group): Group representatives negotiate with authorities about settlementand implementation while substantial armed violence continues. Fighting may be doneby the principals or by factions that reject efforts at settlement. Since mid-, negoti-ations between the Moros and the Philippines government have been punctuated byperiods of significant violence.
6. Cessation of open hostilities (10 groups): Most fighting is over but one or more prin-cipals are ready to resume armed violence if efforts at settlement fail. Conflicts in whichhostilities were checked by international peacekeeping forces, in the absence of agree-ments also are classified here. This kind of tenuous peace held at the beginning of
for the Armenians in Azerbaijan, Kurds in Iraq, Nagas in India, Abkhazians in Georgia,and Tamils in Sri Lanka. Significant violations of ceasefires occurred in South Ossetia inGeorgia and Kosovo in Serbia and Montenegro in but hostilities were haltedshortly afterward.
7. Contested agreement (15 groups): An interim or final agreement for group autonomywithin an existing state has been negotiated between the principals but some parties,within the group or the government or both, reject and attempt to subvert the agree-ment. This is the current situation of the Serbs and Croats in Bosnia, the Catholics inNorthern Ireland, the Chittagong Hill Tribals in Bangladesh, and the Bougainvilleans inPapua New Guinea. In , state authorities and tribal Bodos agreed to the creation ofa local autonomous council in northeast India. Tensions in the Trans- Dniester regiontemporarily erupted in mid- over the closure of Moldovan-language schools and thesubsequent imposition of economic sanctions by the Moldovan government. However,sustained involvement by international parties including Russia, Ukraine, and theOSCE has helped to prevent a resurgence of violent hostilities.
8. Uncontested agreement (7 groups): A final agreement for group autonomy is in place,is accepted in principle by all parties, and is being implemented. The Kachins in Myanmar,the Southerners in Chad, Afars in Djibouti, and Tuaregs in Mali and Niger are at this stage.Sustained negotiations since between the southern Sudanese and the Khartoumgovernment produced a final, comprehensive agreement signed in early . The accordalso includes provisions for the settlement of the conflict in the Nuba Mountains regionof Sudan.
9. Implemented agreement (1 group): A final settlement or agreement for group auton-omy has been largely or fully implemented; the Mizos in India are the sole case.
10. Independence (5 groups): The group has achieved its own internationally recognizedstate. The former Indonesian province of East Timor is the newest member of this groupthat includes the Croats and Slovenes in the former Yugoslavia, the Eritreans in Ethiopia,and the Bengalis in Pakistan.
Self-determination conflicts do not move inevitably through all phases, and due to theircomplex dynamics, there often is movement back and forth between phases. Groups thathave used conventional politics for a long period of time are very likely to continue todo so. However, groups that have signaled objectives through militant politics or low-level hostilities increase the risk of further escalation. One group previously categorizedin the militant politics phase in early escalated its conflict to high-level hostilities

24
in the following year. The Malay-Muslims in Thailand’s southernmost provincesresumed violent hostilities in early seeking greater autonomy, protection of thegroup’s cultural rights, and greater economic resources. The Muslim rebel groups inThailand are reported to have established links with regional Islamic organizations inMalaysia and Indonesia. On the settlement side, a conflict may not be confidently con-sidered ended until settlement agreements are fully implemented. For instance, minorrebel factions are contesting a settlement between the Tuaregs and the Niger gov-ernment alleging that the terms of the peace agreement have not yet been met. Sporadicviolent acts occurred during and it remains to be seen whether the attempt torevive the Tuareg insurgency will succeed. The Miskitos on the Atlantic Coast inNicaragua have also recently stepped up efforts to ensure effective autonomy on the basisof a agreement. They have successfully challenged Nicaraguan authorities in theInternational Court of Justice over the allocation of contracts on natural resourceexploitation and are currently seeking legal damages for the forcible displacement ofMiskitos during the insurgency in the early s. The scarcity of fully implementedagreements signals a potential for renewed resistance by former rebels in most formerlyviolent self-determination conflicts.
Trends in the Onset and Settlement of Self-Determination Conflicts. Many observersfear that contemporary self-determination movements will continue the process of statebreakdown signaled by the disintegration of the Soviet Union and the YugoslavFederation at the beginning of the s. In fact only five internationally recognizedstates emerged as a result of armed separatist conflicts during the last forty years:Bangladesh (), Slovenia (), Croatia (), Eritrea (), and East Timor ().This list may be expanded to include several de facto states established by separatistmovements, political entities that are not recognized as such by the international com-munity. Somaliland, which is dominated by the Isaaq clan, maintains an effective cen-tral government that suffers few of the crippling economic and security problems of thefailed Somali state. Other examples include the Turkish Republic of North Cyprus, theTrans-Dniester Republic that is nominally a part of Moldova, Abkhazia and SouthOssetia in Georgia, the Nagorno-Karabakh region of Azerbaijan that is nominally unitedwith Armenia, and the international protectorate of Kosovo in Serbia and Montenegro.The final international status of these entities remains to be determined.
These exceptions aside, the most common outcome of self-determination conflicts con-sists of a settlement between governments and group representatives that acknowledgescollective rights and provides institutional means for pursuing collective interests withinstates. Sometimes a group gains better access to decision-making in the central govern-ment, often it gains regional autonomy, and of course some settlements include bothkinds of reforms. Thus the outcome of self-determination movements seldom results ina redrawing of international boundaries, but rather devolution of central power andredrawing of boundaries within existing states. An agreement recently reached by theBodos in India provides more regional autonomy through the creation of a local coun-cil, but the actual extent of the devolution of decision-making power to the local coun-cil remains to be seen. After three years of negotiations, the southern Sudanese and theKhartoum government signed a formal agreement in early that provides for polit-ical power sharing along with a more equitable distribution of the country’s critical oilresources. However, ongoing sporadic violence and the potential for backtracking could
The scarcity of fully implementedagreements signals a potential forrenewed resistance by former rebels in most formerly violent self-determi-nation conflicts.

25
threaten the progress achieved in recent years, especially considering the Sudanese gov-ernment’s poor track record regarding agreement compliance.
Expectations that autonomy agreements will set the stage for all-out wars for indepen-dence are often expressed, but rarely realized. More commonly, most parties to conflictaccept and work within the framework for autonomy while a few spoilers may continueto fight in the hope of forcing greater concessions. The greatest risk in autonomy agree-ments is not the eventual breakup of the state, rather it is that spoilers may block fullimplementation, thereby dragging out the conflict and wasting resources that might oth-erwise be used to strengthen autonomous institutions. The pendulum can swing theother way as well – when the state employs stall tactics or otherwise causes delays dur-ing the implementation phase, more militant factions of the communal group may con-tinue or resume violence, arguing that the state has not made good on its promises.
The number of armed conflicts over self-determination spiked sharply upward at the endof the Cold War, but they had been building in number since the late s, doublingbetween and the early s. Table . and figure . summarize the evidence. Fromfive ongoing wars in the s, numbers swelled to a high of forty-nine () by the endof . The numbers have declined steadily since then to twenty-five () at the end of, a level that has not been reached since . Moreover, fighting in many of theseconflicts is low-level and de-escalating.
A number of factors contribute to the downward trend, including the end of the ColdWar and, thus, superpower support for rebel movements, the attendant change in inter-national norms favoring negotiation over armed challenges to settle grievances, andincreasing activism amongst NGOs and engagement by international bodies. During theCold War a half-dozen conflicts were contained, usually when the rebels were defeatedmilitarily, and nine were settled or led to independence as in Bangladesh. Three of thenegotiated settlements were in India, two of which – with Nagas () and Tripuras() – led to second-generation wars. During the s, another sixteen () wars werecontained, often as a result of internationally backed negotiations and peacekeeping, andanother fifteen () were settled by negotiated agreements. Only three, in Slovenia,Croatia, and Eritrea, resulted in internationally recognized independence for rebelnationalists. As mentioned earlier, the pace in containment has continued since
Table 5.1: Armed Conflicts for Self-Determination and Their Outcomes, 1956-2004
Period New Armed Ongoing at Conflicts Conflicts Conflicts End of Period Contained Settled or Won
before 1956 4
1956-1960 4 8 0 0
1961-1965 5 12 0 1
1966-1970 5 15 2 0
1971-1975 11 23 0 3
1976-1980 9 30 2 0
1981-1985 6 35 0 1
1986-1990 10 40 2 3
1991-1995 17 39 9 9
1996-2000 5 32 6 6
2001-2004* 6 25 8 5
T O TA L S 78 29 28
Note: Based on conflicts listed inAppendix table 11.2. Date used for listingconflicts “contained” or “settled or won” isthe date when the period of armed conflictended. “Settled” conflicts include five thatended with the establishment of a new,internationally recognized state. In caseswhere a settlement/containment of an ear-lier conflict lasted for five or more yearsbefore the outbreak of new fighting, thenew outbreak of fighting is counted as aseparate armed conflict and a subsequentsettlement/containment may then becounted as a new event. Examples areNagas and Tripuras in India, Igorots in thePhilippines, and Sudanese Southerners(containment of Tajik conflict inAfghanistan in 1992 lasted only four yearsbefore resuming in 1996 and is counted asa single event).
(*) The asterisks in table 5.1 and figure 5.1indicate that the information for the mostrecent period, 2001-2004, covers only fouryears, unlike the other five-year periods.As such, the most recent period is notstrictly comparable with the other periodsand the last increment in the chart is not atrue depiction of the most recent trend.

26
with eight () new conflicts contained in -. There were also five () conflictsthat were settled in this time period. These include the Southerners and Nuba in Sudan,the Afars in Djibouti, Casamançais in Senegal, and Albanians in Macedonia. It is likelythat as both sides pull back their troops and reach definitive agreements, a number ofthe recently contained conflicts will also move to the settlement phase. Overall, morethan % of all terminations of separatist wars (by containment or settlement) duringthe last half-century have occurred since .
As with conflicts in general, self-determination wars are easiest to settle in their earlyyears. Between and eleven wars of self-determination began in the USSR,Yugoslavia, and their successor states. By , all had been contained or settled, exceptin Chechnya, after an average of three years’ fighting. During the same seven years, from to , another fifteen () self-determination wars began in Africa and Asia. By, four of the six new African wars and six of the nine Asian wars were concludedafter an average of about nine years of fighting. The self-determination wars fought bythe Southerners and Nuba in Sudan, Afars in Djibouti, Casamançais in Senegal, Bodosin India, and Tajiks and Uzbeks in Afghanistan are the most recent to be terminated, thelatter two due to assistance from the United States in pursuit of its anti-Taliban goals.
Protracted separatist wars may require more complex, costly, and long-term, internationalcommitments than mediation or peacekeeping efforts to move them to peace. The longerself-determination wars drag on, the greater the divisions between groups and the morediminished the level of trust on which to build a lasting settlement. The average durationof the twenty-five () armed self-determination conflicts still being fought at the end of
0
5
10
15
20
2001-2004
1996-2000
1991-95
1986-90
1981-85
1976-80
1971-75
1966-70
1961-65
1956-60
Number of Ongoing Wars Changes to the Number of Wars
Change in the Number of Wars:New Armed Conflicts
Change in the Number of Wars:Conflicts Settled or Won
Change in the Number of Wars:Conflicts Contained
Number of Wars Ongoing at End of Period
0
10
20
30
40
before 1956
Figure 5.1: Trends in Armed Conflicts for Self-Determination, 1956-2004
27
was twenty-seven () years. Nearly sixty percent are being fought in Asia, most oth-ers in Africa. The Palestinian-Israeli conflict has been intermittently violent since
despite numerous efforts to negotiate and implement an enduring settlement.
The most critical phases in self-determination conflicts are “talk-fight” and “cessation ofopen hostilities.” In the absence of final agreements any of the eleven () conflicts inthese two phases may revert to open warfare. For instance, negotiations were halted orstalled between the Tamils and the Sri Lankan government and the Cabindans and theAngolan regime in -. Preventive actions and efforts at mediation should be redou-bled in these situations to keep them moving toward agreement. Mediators can assistparties in identifying areas of agreement when their hardline bargaining stances preventthem from realizing the needs and interests of the other party, or from recognizing thatcompromise is possible and necessary to end fighting.
Contested agreements are also problematic because significant elements on one or bothsides of a conflict reject them. Some rebel factions may continue fighting either to cut abetter deal, like the Abu Sayyaf faction of the Philippine Moros, or because they rejectany compromise, like Chechen Islamists who attempted to ignite a wider rebellionagainst Russian influence in the Caucasus after the first Chechen separatist war ended ina Russian withdrawal. On the other side, political opponents of a government may tryto subvert an agreement between the central authorities and an autonomous region.They may use legislative means to block implementation or stage provocative actionslike the tactics used by opposition parties in the early stages of the settlement in theChittagong Hill Tracts in Bangladesh. Militia and paramilitary activity against thoseinvolved in autonomy movements may also occur in certain conflicts. However chal-lenging it is to reach an initial agreement, it may be still more difficult, and requiregreater international engagement, to move from formal agreement to the actual imple-mentation of the terms of that agreement.
This survey has identified fifty-four () groups using conventional political means topursue self-determination and another twenty-three () using militant strategies shortof armed violence (see Appendix tables . and .). Most are in democratic or quasi-democratic states and have little risk of escalating to armed conflict. The conflicts cur-rently of greatest concern involve the people of Western Cameroon; Uighers, Tibetansand Mongols in China; Sindhis and Pashtuns in Pakistan; Yoruba, Oron, Ibo, andOgoni in Nigeria; Lhotshampas in Bhutan; Reang (Bru) in India; Montagnards inVietnam; and Lozi in Zambia. While none was a “hot war” at the end of , groupmembers continue to use or advocate provocative tactics against governments that havea track record of repression. While the Tibetans have managed to stay in the “public eye,”largely through the efforts of the exiled Dalai Lama, the other groups attract very littlenotice. International attention usually encourages autonomy-minded people to workwith state authorities for constructive solutions and simultaneously discourages govern-ments from cracking down on activists. Bad things very often happen in the dark, whenpublic scrutiny and accountability are absent and moral rectitude is less likely.Transparency is the most effective hedge against outbreaks of violence. In the absence ofinternational attention and engagement, the peoples flagged here along with thoseinvolved in renewed or escalating conflicts such as the Malay-Muslims in Thailand,Hmong in Laos, Acehnese in Indonesia, and Baluchis in Pakistan, are the most likelyprotagonists and victims of separatist wars in the coming years.
The longer self-determination wars drag on, the greater the divisions betweengroups and themore diminishedthe level of trust onwhich to build alasting settlement.

28
6 . T H E D E C L I N E O F E T H N I C P O L I T I C A L
D I S C R I M I N A T I O N , 1 9 5 0 - 2 0 0 3
Much has been made of the impressive spread of procedural democracy in recentdecades. This change has been welcomed because of the positive economic and socialbenefits attributed to democracy, the association of democracy with civil and interna-tional peace, and also the intrinsic normative value of democratic governance. Theascendancy of democratic regimes is not the only important shift in relations betweenthe rulers and the ruled since the s. Ethnic conflict has attracted widespread inter-est since the dissolution of the Soviet Union and, subsequently, the Yugoslavian federa-tion that marked the end of the Cold War in the early s. Many analysts at that timeremarked about the sudden and dramatic increase in ethnic wars, sparking a heateddebate on whether the end of the Cold War would usher in a period of global disorder.An examination of the historical record, however, indicated that, while there was a sub-stantial increase in the number of ethnic wars coinciding with the end of the Cold War,the number of ongoing ethnic wars had been increasing steadily since (see Peaceand Conflict , figure ). Having the ability to examine the historical record can helpprevent common misperceptions from having an undue influence over the making ofpublic policy.
The systematic collection of information on the internal affairs of states and the charac-teristics of societal conflict is a relatively recent endeavor, made possible by gains in infor-mation and communication technologies. One of the most accomplished of this newbreed of research examining and recording information on the qualities of relationswithin states is the Minorities at Risk (MAR) project at CIDCM. The MAR project wasbegun by Ted Robert Gurr in to examine and document the status of ethnic andreligious minority groups in all countries of the world over the contemporary period,since .1 Ethnic identity groups often compete with other political organizations, andespecially the central state, for the loyalty and support of group members. On the otherhand, minority identity groups can be neglected or maligned by central authorities oreven excluded from equitable access to opportunities created by association with thelarger state and civil society. Theorists have argued that political and economic discrim-ination in relations between ruling elites and constituent groups generates strong griev-ances and creates powerful incentives that drive ethnic conflict and, possibly, leadsgroups to armed conflict.
In order to more accurately test, and better understand, the role of discrimination in theconflict dynamics of states, researchers associated with the MAR project began two ini-tiatives in the late s to improve and expand its documentation of group discrimina-tion. One initiative has focused on recording instances when a particular ethnic group,or coalition of ethnic groups, has gained control of the state and uses state power tomaintain and expand its advantages over other constituent groups. The “elite ethnicity”initiative has assigned annual codes for all countries since to note situations whereelite ethnicity is politically salient, that is, where either an ethnic majority or minority
Victor Asal and Amy Pate
1 Ted Robert Gurr has published two books based on research from the Minorities at Risk project:Minorities at Risk: A Global View of Ethnopolitical Conflicts (Washington, DC: United States Institute ofPeace Press, ) and Peoples versus States: Minorities at Risk in the New Century (Washington, DC: UnitedStates Institute of Peace Press, ).

29
has gained control of the state apparatus and uses its political power to further its owninterests. The second initiative has focused on tracking changes in the general qualitiesof political and economic discrimination of the politically-active minority groups (in different countries) covered by the MAR project. The MAR initiative on group dis-crimination has assigned annual codes since for all MAR groups on both politicaland economic aspects of discrimination. It is this latter initiative that will be the specialfocus of this section.
Defining MAR Groups and Discrimination. The MAR project focuses specifically on eth-nopolitical groups, non-state communal groups that have “political significance” in thecontemporary world because of their status and political actions. One aspect of politicalsignificance is related to the group’s size. For a group to be included in the MAR pro-ject, it must have a population of at least , or account for at least one percent ofthe country’s total population. The group must have the membership size and, thus, themobilization potential to influence central state politics in a meaningful way. A secondaspect of political significance concerns the distinct quality of a group’s relationship withstate authorities. This aspect of political significance is determined by the following twocriteria:
• The group collectively suffers, or benefits from, systematic discriminatory treatmentvis-à-vis other groups in a society; and,
• The group is the basis for political mobilization and collective action in defense orpromotion of its self-defined interests.
Many group traits can contribute to the sentiments and interests that lead to collectiveaction by ethnopolitical groups. The possible bases of communal identity include sharedlanguage, religion, national or racial origin, common cultural practices, and attachmentto a particular territory. Most communal identity groups also share a common history,or myths of shared experience, that often include their victimization by others. No oneof these is essential to group identity. Fundamentally, what matters is the belief — bypeople who share some such traits and by those with whom they interact — that thetraits set them apart from others in ways that justify their separate treatment and status.As group discrimination is a defining trait for identifying MAR groups, we believe thedataset on discrimination is as comprehensive as the current quality of information onthe political status of non-state groups will allow. Occasionally, new groups come to ourattention as information improves and qualifying groups are added to the dataset.
Tracking group discrimination can be difficult both because groups sometimes havepolitical motivations for exaggerating their malign treatment at the hands of govern-ments and also because some governments are so efficient at suppression that little infor-mation about group status or treatment makes its way to open-source media.Information on minorities in Iran and Burma, for example, is sparse and difficult to ver-ify. Evaluating group-level information on economic factors is particularly difficult dueto the wide variation in wealth and income distributions among individuals and the lackof accurate and systematic records of individuals that can be tied to differentials at thegroup level. Examining a wide variety of web-based and other sources, the MAR project
2 The elite ethnicity codes were initially developed and countries coded by Barbara Harff for use in heranalysis of the preconditions of genocide and are reported in her article, “No Lessons Learned from theHolocaust? Assessing Risks of Genocide and Political Mass Murder since .” American Political ScienceReview, vol. (February ), pp. -
30
has coded group discrimination yearly using a five-point scale. The coding was initiallydone as a single value for the late s and annually for the s as part of the MARproject’s core survey and periodic updates. The first author of this article, Victor Asal,supervised a project team in that was directed to re-examine the status of each ofthe MAR groups from to and assign annual political and economic discrim-ination codes. The second author, Amy Pate, supervised the latest general update ofMAR group annual codes, including discrimination codes. During both procedures, dis-crepancies and inconsistencies in the data noted by coders were reconciled. The analy-ses that follow are based on the latest version of the annual discrimination dataset.
The following categories are used in coding the political and economic discriminationindicators:
• No discrimination (code 0): Groups facing no political discrimination or not suffer-ing from substantial under-representation due to past discrimination. Currentexamples are the Scots in the United Kingdom and the Acholi in Uganda.
• Remedial discrimination (code 1): Groups that are under-represented because of pastdiscrimination which is currently addressed by governmental remedial policies.African-Americans in the United States and the Maori in New Zealand are groupsthat currently meet these criteria.
• Historical discrimination (code 2): Groups that are now under-represented because ofpast political discrimination or disadvantages but whose status is not beingaddressed by governmental remedial policies. Many indigenous peoples in LatinAmerica are disadvantaged in this way, as are the Basques of France.
• Societal discrimination (code 3): Groups that currently suffer from substantialunder-representation due to prevailing social practice by dominant groups and towhich formal public policies toward the group are neutral or, if positive, inadequateto offset discriminatory policies. The Roma of Bulgaria and the Afro-Brazilians areexamples of groups that meet these criteria in .
• Governmental discrimination (code 4): Public policies substantially restrict thegroup’s political participation or group members (other than those directly engagedin anti-regime activism) are subject to recurring repression that limits group politi-cal mobilization. The Baha’is in Iran and the Tibetans in China are current examples.
Global Trends in Group Discrimination. Figures . and . track global trends in ethnicpolitical and economic discrimination annually across the study period, -. Inorder to set the proper perspective, the total population of all groups identified as“minorities at risk” ranges between .% and % of the total global population. Thisbasic constancy is due in large part to the way ethnic minorities are tracked by the pro-ject: once it is established that a group meets the MAR criteria for “political signifi-cance,” the group is tracked across the entire study period, unless the international statusof the state of which the group is a part changes. For example, when East Pakistangained independence as the country of Bangladesh in , the status of ethnic-Bengalischanged from a discriminated minority in Pakistan to a ruling majority in Bangladesh.Likewise, when the Soviet Union dissolved on December , , each of fourteenminority groups of the USSR became the ruling group in a newly independent state and
3 Details on the procedure and in-depth analysis of results are reported in Victor Asal. The Internationaland Domestic Impact of Democracy: Minimal Political Inclusion of Minority Groups, -. Doctoral dis-sertation. (Government and Politics, University of Maryland, College Park, ).
4 The latest version of the Minorities at Risk group discrimination annual dataset can be obtained from theMAR Web site at www.cidcm.umd.edu/inscr/mar.
Policies of politicaland economic discrimination[have] declinedsubstantially[while] policiesdesigned to helpcorrect group disadvantages[have] increasedsteadily.

31
new minority groups immediately gained significance in the new states. Changes in thestatus of states have been quite rare other than those resulting from the breakup of thesocialist federations that marked the end of the Cold War. Since , only five newstates have been formed as a result of separatist conflicts (see section on self-determi-nation movements in this issue); in addition, three new states have been formed throughthe unions of separate states: Vietnam in , Germany in , and Yemen in .The greatest number of changes in the global system of states during the study periodresulted from decolonization of former-European controlled territories in Africa (seesection in this issue). In the global system comprised seventy-nine () indepen-dent countries and by this number had more than doubled (). By , how-ever, about % of the world’s population already lived in independent countries.
In spite of the complex changes that have transformed the global system of states in thelatter half of the twentieth century, three fundamental, positive trends in ethnic groupdiscrimination can be observed (refer to figures . and .):
• The percentage of the world’s states with official policies of political or economicdiscrimination against constituent ethnic groups (solid black lines in both figures)has declined substantially since : from .% to .% of states practicing polit-ical discrimination and from .% to .% of states with policies of economic dis-crimination.
• The percentage of the world’s countries where active discrimination is practiced,that is, countries where there is either governmental or societal discrimination orboth (solid red lines in both figures), has also declined substantially since : from.% to .% of countries where groups face active political discrimination andfrom .% to .% of countries where groups contend with discriminatory eco-nomic practices.
% of Global Population % of Countries
0
2.5
5.0
7.5
10.0
12.5
0
15
30
45
60
75
Remedial Discrimination
Active Discrimination
Governmental Discrimination
Remedial Discrimination
Active Discrimination
Governmental Discrimination
2005200019951990198519801975197019651960195519501945
(% of Countries)
(% of Global Population)
Figure 6.1: Global Trends in Political Discrimination, 1950-2003

32
• The percentage of the world’s states where there are policies designed to help cor-rect group disadvantages (solid blues lines in both figures) has increased steadily andsubstantially since : from .% to .% of states with policies to help remedypolitical disadvantages and from .% to .% of states with policies to help ame-liorate group economic disadvantages.
The trends graphs in figures . and . also provide some cause for continuing concern.The dotted lines track the percent of the global population that is subject to each of thethree basic categories of ethnic discrimination. While there is evidence of decreases inthe percent of the global population subject to governmental and active discriminationover the study period, the decreases in numbers of people facing discrimination are notas great as the decreases in the numbers of countries where discrimination is practiced.In , still nearly twice as many people continue to be subjected to active, ethnic dis-crimination as the numbers of people who benefit from remedial policies.
5 The large jumps in the dotted, population trend lines in the s and early s are caused by changesin the status of the very large population of ethnic-Bengalis in the former East Pakistan. That minoritygroup became a ruling, majority group when Bangladesh gained independence in .
Figure 6.2: Global Trends in Economic Discrimination, 1950-2003
Most importantly for comparative and quantitative research, political and economic dis-crimination follow similar trajectories. However, research indicates that political dis-crimination is much more closely associated with political conflict behavior than iseconomic discrimination. Therefore, the remainder of this section will focus on describ-ing trends in political discrimination. The observed decline in ethnic political discrimi-nation is significant for four major reasons. First, there is abundant evidence that high
% of Global Population % of Countries
0
2.5
5.0
7.5
10.0
12.5
0
15
30
45
60
75
2005200019951990198519801975197019651960195519501945
Remedial Discrimination
Active Discrimination
Governmental Discrimination
Remedial Discrimination
Active Discrimination
Governmental Discrimination
(% of Countries)
(% of Global Population)

33
levels of political discrimination are a key cause of violent ethnic conflict. Second, polit-ical empowerment of minorities is a major factor in building civil societies that effec-tively incorporate all citizens. Third, the decline of political discrimination is of value inits own right as an important improvement in human rights for the minorities con-cerned. Finally, this change, linked as it may be to the spread of procedural democracy,underscores the importance of institutional change in improving human developmentfor previously marginalized groups.
Group-Level Analyses and Regional Trends in Political Discrimination. The analysis ofpolitical behavior most frequently is done at the state level of analysis. After all, the stateis the most powerful and prominent political actor and the state-system provides theframework for international politics and global analysis. Data analysis, in particular, istied to state-level observations because the state is the standard unit for measurement.Discrimination, however, is fundamentally a group level attribute that distinguishes theparticular status of distinct, non-state actors from the more general status and attributesof the state and civil society. The MAR project, with its focus on ethnic and religiousminorities within states, provides a relatively rare opportunity to examine and comparepolitical dynamics at the group level of analysis. States vary widely in the number andsizes of constituent “minorities at risk” with which they have to contend. Some coun-tries, such as the Koreas, Sweden, Tunisia, or Japan are nearly ethnically homogenous.Others, such as the former-Soviet Union, Pakistan, Indonesia, and Uganda, are
Figure 6.3: Global Trends in Political Discrimination of Minorities, 1950-2003
6 For an overview of work on the relationship between political discrimination and political violence seeGurr, Peoples versus States. The MAR discrimination variables have also been used in the ongoing analyticresearch of the U.S. Government’s Political Instability Task Force (PITF; formerly known as the State FailureTask Force). Discrimination factors significantly in several of the PITF Phase IV political instability riskmodels, including the global, sub-Saharan Africa, and autocracy models, and factors very prominently in theethnic war model. Information on PITF research can be found on the State Failure Web site atwww.cidcm.umd.edu/inscr/stfail. See also, sections and in this report.
Number of Minority Groups
0
10
20
30
40
50
60
70
80
Governmental Discrimination
Societal Discrimination
Historical Discrimination
Remedial Discrimination
20001995199019851980197519701965196019551950

34
extremely ethnically diverse. Still others, like the United States, are extremely diverse, yetpolitical interests are not primarily focused on ethnic group mobilization. Ethnic groupaffiliation, mobilization, and competition among ethnic groups for state power are morelikely to characterize politics in lesser developed countries. Examining the issue of eth-nic political discrimination at the group and regional levels can reveal important differ-ences in prevailing patterns of societal composition and contention.
Figure . presents an alternative perspective on global trends in political discrimination,as compared with those in figure . above. Figure . charts the annual numbers of eth-nic minorities in the world that are subject to the four different categories of politicaldiscrimination (MAR groups that are coded as experiencing “no discrimination” are notincluded). Again, one has to keep in mind the fact that the number of states and, there-fore, the potential number of ethnic groups increases quite substantially during thedecolonization period in Africa that spans, roughly, the years -. This perspectiveon global trends in discrimination clearly corroborates the observation made earlier, thatremedial policies to improve the political status of minorities groups have increasedsteadily since : here from only ten groups benefiting from such policies in tofifty-six in . This figure, however, shows that the numbers of groups subject to gov-ernmental discrimination more closely follows the global trends in armed conflict andautocratic governance (see section and in this report). That is, the numbers increaseduring the Cold War period and drop sharply in the s. The number of groups withhistorical disadvantages declines from the late s, presumably as a result of theincrease in the numbers of groups benefiting from remedial policies. The trend for soci-etal discrimination gives some cause for concern as the numbers, while fluctuating peri-odically, have not diminished substantially. The practice and consequences of ethnicdiscrimination in general social relations appear to be much more difficult to changethan governmental policies.
In order to facilitate comparison of regional trends and differences in key attributes ofconflict and governance, the Peace and Conflict report series routinely examines sixworld regions; these regions and the countries that comprise each region are listed in thePeace-Building Ledger (see section in this report). Figures . through . chartregional trends in political discrimination. The North Atlantic, Latin America and theCaribbean, and North Africa and the Middle East regions have similarly low numbersof politicized ethnic minorities: , , and respectively in . Of those, elevengroups in the North Atlantic and nine in North Africa and the Middle East are coded ashaving no political discrimination in ; only one group is coded with no discrimi-nation in Latin America in . The other three regions: the Former Socialist Bloc, Asiaand the Pacific, and Africa South of the Sahara, have similarly large numbers of “minori-ties at risk”: , , and respectively in . In the Former Socialist Bloc countries,thirty-nine of sixty-six groups currently face no discrimination. In the Asia and thePacific region, only twelve of sixty-one groups are coded with no discrimination in .In the Africa South of the Sahara region, fifty-one of ninety-six MAR groups face nopolitical discrimination in .
Examining the issue of political discrimination from the group level, world regions varysubstantially in their patterns of change in political discrimination since the s. Thedurable Western democracies that predominate in the North Atlantic region have rela-tively few “minorities at risk” as the political salience of ethnicity is generally of lesser
The numbers ofgroups subject to governmental discriminationclosely follows the global trends in armed conflict and autocratic governance.

35
importance in affluent societies. The groups that aremobilized on ethnicity tend to have a higher profile,however, as they stand in sharp contrast to normativestandards of equal opportunity, accountability, andtransparency. The discrimination trends are quite clearin this region (see figure .a). The decline in active eth-nic discrimination began in the mid-s and contin-ued through the s; a decline in historicaldisadvantages is notable especially in the s. Over thesame span, the number of groups benefiting from reme-dial policies increased. In the United States, for example,treatment of minorities has changed radically during thisperiod. Of the four MAR groups in the U.S. two in
were targeted by specific discriminatory governmentpolicies, African Americans and Amerindians. The othertwo, Hispanics and Native Hawaiians, experiencedwidespread societal discrimination. By three ofthese groups benefited from effective public policies toredress the effects of past discrimination and indigenouspeople no longer experienced pervasive societal discrim-ination. Similar developments improved the status ofmost minorities in other Western societies. We shouldnote though that some groups continue to experienceopen political discrimination, including foreign workersin Switzerland, non-citizen Muslims in France, and thenumerically-large Roma populations in France, Spain,Italy, and Greece.
In contrast, remedial policies for MAR groups in theFormer Socialist Bloc countries were more common,particularly as a result of reforms implemented after thedeath of Joseph Stalin in (see figure .b).Governmental discrimination remained low through themid-s, but – contrary to Western experience – thenumbers of groups subject to governmental discrimina-tion began to increase in the s and rose sharply inthe waning years of the “great socialist experiment,” asdid the numbers of groups subject to general societal dis-crimination, as ethnic tensions precipitated the dissolu-tion of, first, the Soviet Union and, then, theYugoslavian federation. Attempts by newly independentgovernments to restrict the activities of ethnic minoritiesopposed to the changes that rocked the socialist worldwere fairly quickly reversed as the situation stabilized inthe mid-s. The promise of ascension to theEuropean Union has been largely responsible for theswift moderation in governmental discrimination.Ethnic tensions, however, remain strong in this region,as evidenced by the high and increasing number of
0
5
10
15
20
25
30
200019901980197019601950
a. North Atlantic
Number of Minority Groups
0
5
10
15
20
25
30
200019901980197019601950
b. Former Socialist Bloc Countries
Number of Minority Groups
Figure 6.4: Regional Trends in Political Discriminationof Minorities, 1950-2003
Governmental
Societal
Historical
Remedial
0
5
10
15
20
25
30
200019901980197019601950
c. Latin America and the Caribbean Countries
Number of Minority Groups

36
groups facing active, societal discrimination or exclu-sion. The Communist regimes of Eastern Europe soughtto improve the status of their Roma minorities, forexample, whereas eight of the nine Roma populations ofcontemporary East European states are coded as suffer-ing from overt discrimination (the Roma of Hungary arethe exception). What remain invisible in the discrimina-tion trends are the highly charged, ambiguous, and unre-solved relationships among the ethnic groups that hadcomprised the Yugoslavian federation. Here, ethnic ten-sions remain high but discrimination has “disappeared”largely because of a continuing, strong foreign presencethat actively enforces a legal equity. Other situationsappear equitable as a direct result of de facto separationof contending ethnic groups, as currently characterizespolitics in Moldova, Georgia, and Azerbaijan.
The most striking feature of political discrimination inLatin America and the Caribbean (see figure .c) is thehigh numbers of MAR groups that are politically mar-ginalized by societal discrimination. Indigenous peoplesand the descendants of African slaves make up almost allthe minorities in the region. From until overhalf these groups suffered societal discrimination. Themain improvement in the last two decades has been ashift from public policies that restricted the politicalrights of indigenous peoples toward policies thatempower and improve their political status. Some havegained land and cultural rights, for example in Colombiaand Venezuela, whereas in Bolivia and Ecuador indige-nous parties have become major players in national pol-itics. While there has been some decline in socialexclusion in the s, societal discrimination remains aserious obstacle to social integration and democraticconsolidation in Latin America.
The treatment of ethnic groups in Asia and the Pacific(see figure .d) differs significantly from the global pat-tern, with much higher numbers of groups subject togovernmental discrimination than in the three regionsdiscussed above. What is more, the numbers increasedrapidly during the s and remained high until veryrecently; the numbers only begin to decrease in .The high numbers of groups facing official sanctionscorrespond to similarly high numbers of groups that facesocietal exclusion, although these numbers begin to fallin the early s. The numbers of marginalized groupswith historical disadvantages but no active exclusionremain fairly constant across the study period. On a
f. Africa South of the Sahara Countries
0
5
10
15
20
25
30
200019901980197019601950
Number of Minority Groups
d. Asia and the Pacific Countries
0
5
10
15
20
25
30
200019901980197019601950
Number of Minority Groups
e. North Africa and the Middle East Countries
0
5
10
15
20
25
30
200019901980197019601950
Number of Minority Groups
Governmental
Societal
Historical
Remedial

37
more positive note, like the general global trends noted above, the regional trends forAsia and the Pacific show a substantial increase in the number of beneficiaries for reme-dial actions, beginning in earnest in the mid-s. Specific MAR groups in this regionhave followed very different trajectories. Sri Lankan Tamils were free of discriminationin but were subject to discriminatory government policies from the s onward,while the Taiwanese experienced public discrimination at the hands of the MainlandChinese oligarchy from the s to the late s but, after that oligarchy lost politicalcontrol, experience no discrimination in the st century.
For most of the last half-century a larger proportion of minorities has suffered from gov-ernmentally sanctioned discrimination in North Africa and the Middle East than in anyother world region (see figure .e). In the s about half the MAR groups in theregion were targets of discriminatory policies. Moreover, the region has seen few of theregime changes such as those that that led to shifts in the status of minorities in the post-Communist states. Nonetheless, consistent with global trends, governmental discrimi-nation declined in the s in the North African and Middle East region. Currentlynine of the region’s MAR groups are subject to governmental discrimination, a numberthat is unlikely to diminish further, at least in the short term, because it includes twotransnational groups that are almost everywhere disadvantaged. In , Palestinianminorities faced governmental or societal discrimination in Israel, Jordan, and Lebanonwhile the Shi’a experienced overt discrimination or marginalization in Bahrain, Lebanon,Saudi Arabia, and Iraq (where a major shift has occurred in -, to the disadvantageof the once-dominant Sunni minority). Political empowerment of the long repressed Shi’amajority in Iraq is likely to have serious repercussions in other regional states, the conse-quences of which are difficult to foretell. What is especially unique in this region is thelack of any real movement toward remedial actions for disadvantaged groups.
Countries that comprise the region of Africa South of the Sahara strike a unique profilein the treatment of ethnic groups (see figure .f ). Most countries in this region gainedindependence during the study period, with the largest increase in new states beginningin and continuing through the decade. State formation in the newly independentstates of Africa was often characterized by serious contention among established ethnicgroups vying for control of the central state (see section following). Contentionbetween and among ethnic groups continues to complicate conflict dynamics in manyof the continent’s young states, particularly as the majority of African states began todemocratize their political processes in the s. The regional trend in governmentaldiscrimination closely follows the regional trend in autocratic regimes (see figure .)with a steep increase in the number of groups subject to official sanctions through themid-s and falling sharply from the peak in ( groups) through the most recentyear recorded ( in ). A similar trajectory is found for numbers of groups subject tosocietal discrimination; those numbers increase until they peak with nineteen in .However, the numbers of groups facing social exclusion have not continued to fall buthave, rather, leveled off in recent years. Another unique aspect of ethnic politics in Africais the large number of historically disadvantaged groups that continue to subsist on themargins of states and societies in the relatively poor region. What is common with theAfrican trends is the steady and substantial increase in the number of ethnic groups ben-efiting from remedial policies. Most of the MAR groups in Africa are “communal con-tenders” for power. When one group gains hegemony it reduces political access for rivalgroups. When the latter gain power they redress the balance. This “taking turns” at thepolitical table may explain some of the relatively low overall level of political discrimi-
What is especiallyunique [in NorthAfrica and theMiddle East] is the lack of any real movement toward remedial actions for disadvantagedgroups.

38
nation in the region. But it also can lead to protracted, deadly competition between rivalgroups and the most severe forms of discrimination and repression, as has the Hutu-Tutsi rivalry in the Great Lakes region.
Conclusion. Overall, the last half of the th century and the beginning of the st haswitnessed significant changes in the treatment of ethnic minorities with importantimplications for political incorporation, ethnic conflict, and human rights. While thereare important regional differences, everywhere the weight of official discrimination haslifted. While this trend began in Western democracies in the late s, by the s ithad reached all parts of the world. Some regions still have a relatively high level of offi-cial discrimination but for the most part the prospects for minorities are markedly bet-ter in than in or . There are still troubling patterns in certain regions. Forexample, while governmental discrimination has declined markedly in Latin America thesame is not true of societal discrimination against indigenous peoples and Afro-LatinAmericans, which remains high into the st century. Latin American societies may repli-cate the experience of Euro-American democracies, where government shifts from offi-cial discrimination to remedial policies led the way for subsequent declines in societaldiscrimination. Prospects for improvement in the status of religious and nationalminorities in the Middle East and North Africa are troubling, especially given theincreasing tensions in this region since the United States’ invasion of Iraq in March .Democratization, by itself, may not improve the quality of group relations in this region,at least in the short run, and may lead to increasing ethnic demands that are difficult toreconcile. Nine of the thirteen ethnic groups facing governmental or societal discrimi-nation in this region in reside in countries with, at least nominally, democraticregimes: Iran, Israel, Lebanon, and Turkey. In addition, the region’s only other democ-ratic state, Cyprus, has been divided along ethnic lines since .
In considering key turning points in the qualities of relationships between states, soci-eties, and ethnopolitical groups, we note three fundamental changes. One concerns therelationship between liberal democracy and ethnic minorities. In the late s, follow-ing the successes of the African-American civil rights and the indigenous rights move-ments in the United States, ethnic social movements in many democracies began todemand that governments live up to the inclusive and participatory rhetoric of democ-ratic discourse. A second turning point is reflected in the dual nature of ethnic relationsin socialist states. Socialist countries were among the first to proclaim the voluntarynature of political relations among constituent groups and institute that recognition ofgroup equality in the constitutional “right to secede.” This principle, of course, eventu-ally led to the dissolution the socialist federations along ethnic lines but those dissolu-tions, except in the case of Bosnia, occurred with limited violence and the newlyindependent, former socialist states have been largely successful in consolidating demo-cratic governance and limiting discrimination. A third turning point can be found in theend of colonialism and the universal recognition of self-determination and human rightsprinciples. In all, minority demands for equal political rights and respect for humanrights since the s have become global norms whose impact extends across regionaland regime lines.
Minority demandsfor equal politicalrights and respect forhuman rights since the s havebecome global norms whose impactextends acrossregional and regimelines.

39
7 . F O C U S O N P O L I T I C A L I N S T A B I L I T Y I N A F R I C A
Earlier editions of the Peace and Conflict series have noted the generally low peace-building capacities of African countries when viewed from the global perspective.Indeed, nearly eighty percent of all countries coded red (low) for peace-building capac-ity in the two previous reports are located on the African continent, and over half of allAfrican countries were coded red in those reports. The fact that many African countriessuffer generally low levels of societal development is well known. Yet, Africa is not nec-essarily a poorly endowed continent nor can we claim that African peoples are less capa-ble of the achievements associated with higher levels of systemic development. The onething that most clearly distinguishes Africa from other regions of the world is the new-ness of its state system. All but four of the fifty African countries gained their indepen-dence, that is, their modern statehood, in the latter half of the twentieth century. Statebuilding is no simple task, and the building of modern, viable states has everywhere, andin all times, been fraught with enormous difficulties. This section attempts to movebeyond the simple, comparative notion that countries in Africa are poorer and more vul-nerable to political instability than countries in other regions of the world and gain someinsight into the special problems confronting African states as they work to modernizetheir societal systems and increase their peace-building capacities over the longer term.1
Peace and Conflict examined the strong negative relationship between societalcapacity and outbreaks of armed conflict and charted the concentration and spread ofarmed conflicts almost exclusively in countries in the lowest three quintiles of societalcapacity during the post-World War II era (figures a and b). A simple assessment of thesituation in Africa might claim that political violence is prevalent because the continentis poor. In conflict theory, however, the concentration of armed conflicts in the world’spoorest countries presents something of a puzzle. The ability to finance and wage warwhile defending one’s home territory and providing basic social services for a supportingpopulation requires fairly advanced societal networks and capabilities. Poor people makepoor soldiers; they generally lack training, equipment, supplies, discipline, and loyalty.Therefore, how can and why do the poor take up arms to challenge the authority of thecentral state? In most cases, the state, even in circumstances of abject and pervasivepoverty, will be relatively strong and well organized compared with any domestic chal-lengers. For the poor, lack of motive to change their abject circumstances is not the issuebut, rather, lack of means and, perhaps, lack of motivation. We should expect periodicoutbursts of riots, rebellion, and banditry, but not sustained warfare, or protracted socialconflict.
Several theories have been proposed to explain outbreaks of armed conflict in lesserdeveloped countries. These include reactions to perceptions of exploitation and injus-tice, resistance to encroachments by central authorities, defense of traditional socialstructures and ways of life, competition among contending identities and political agen-das, expressions of indignation, opportunism, and predation. Regardless of the potentialto engage in violent collective action, when armed conflict breaks out in poor countriesthe potential for the emergence of a humanitarian crisis is immediate and severe.Contrary to our notions of military combat, direct battles between armed forces in poor
Monty G. Marshall
Nearly eighty percentof all countries coded red (low) forpeace-buildingcapacity are locatedon the African continent.
1 The Africa analysis in Peace and Conflict has been supported by the Africa Telematics Program withfunding from USAID.

40
countries are relatively rare. Armed conflict disrupts patterns of everyday life and itsprincipal victims are non-combatant populations. A simple, alternative formulation ofthe situation in Africa might propose that the continent remains poor because it is con-sumed by instability and armed conflict. The creation of a poverty-conflict trap is a veryreal dilemma in underdeveloped countries.
This section explores conflict, development, and governance trends in the countries ofAfrica. Africa provides a unique opportunity to trace these general trends, for mostcountries, from their inception as independent states through the span of their first gen-eration, roughly from to . A two-stage model is developed to explain theobserved patterns of political instability in Africa with the aim of gaining a better under-standing of the prospects and opportunities for avoiding the pitfalls that contribute to aconflict-poverty dilemma and for climbing out of and moving beyond the syndrome ofarrested development.
Societal-Systems Analysis and Political Instability in Africa. Societal-systems analysisprovides the basis for a unique approach to understanding political instability in theAfrican context.2 This approach emphasizes fundamental relationships among three coresystemic processes: societal development, political conflict, and governance. The qualityof the interplay between conflict and governance dynamics determines the potential forboth societal and system development. Qualities of systemic development, in turn,define the circumstances of societal conflict and determine the scope of alternatives andthe possibilities for conflict management. High levels of societal conflict and, especially,outbreaks of political violence hamper more complex forms of association and produc-tion by undermining social networks and limiting societal and systemic integration.This, in turn, affects government performance and induces a preference for more coer-cive, instrumental (i.e., autocratic) policies to ensure the greater social order but at thecost of further alienating and marginalizing the general population. Thus, political insta-bility is viewed as a societal-systemic (crisis) condition characterized by serious and,often, complex disruptions (i.e., instability events) in the central state’s capacity to make,implement, and administer conventional, non-violent, public policy. As such, politicalinstability can only be fully understood by accounting for adverse changes in both thequalities of governance and conflict interactions.
The U. S. Government’s Political Instability Task Force, formerly known as the StateFailure Task Force, has pursued a variant of this approach to “design and carry out astudy on the correlates of state failure. The ultimate goal was to develop a methodologythat would identify key factors and critical thresholds signaling a high risk of crisis incountries some two years in advance.” (Phase I report, , p. iii) The Task Force com-bines four distinct categories of political instability events: ) revolutionary wars, ) eth-nic wars, ) genocides and politicides, and ) adverse regime changes. The category of
2 Societal-systems, or systemic, analysis is explained in detail in Monty G. Marshall, Third World War:System, Process, and Conflict Dynamics (Lanham, MD: Rowman & Littlefield, ). “The theoretical per-spective is that political violence is the research problem [and cause of underdevelopment] and that such vio-lence occurs under conditions of systemic failure, that is, when normative conflict management strategiesare unsuccessful or inoperative.” (p. )
3 The Political Instability Task Force is an assembly of leading academic experts that has issued four, peri-odic “Phase” reports on its ongoing, active research agenda. Information on the Task Force, case selectioncriteria, and copies of the first three reports are available on the Task Force Web site athttp://www.cidcm.umd.edu/inscr/stfail; the Phase IV report will be available soon.
Societal-systemsanalysis emphasizesfundamental relationships among societal development, political conflict, and governance.

41
“adverse regime changes” actually encompasses four types of regime changes: ) majorand abrupt shifts away from more open, electoral systems to more closed, authoritariansystems, ) revolutionary changes in political elites and the mode and institutions of gov-ernance, ) contested dissolution of federated states or secession of a substantial area ofa state by extrajudicial means, and ) complete or near-total collapse of central stateauthority and the ability to govern. Changes toward greater openness and more inclu-sive forms of governance are not considered political instability events and are notincluded in analyses of state failure. Likewise, wars for independence and other inter-state wars are considered external projections of state power, rather than instabilityevents, and are not included. By combining these several classes of political instabilityevents, the Task Force quickly recognized that instability events very often happen con-currently, that the onset of one event coincides with or is followed by the onset of over-lapping or sequential instability events. Periods of instability are often characterized byunique combinations of instability events and these “consolidated cases” of general polit-ical instability can thus be distinguished from periods of political stability. The approachused here builds on the Task Force’s approach but expands coverage to include threeadditional types of instability events: ) successful coups d’etat, ) attempted coups d’e-tat, and ) serious episodes of inter-communal violence in which the state is not directlyinvolved. Each of these several types of political instability events was plotted along atime-line for each of the fifty countries in Africa and clusters of events demarcated peri-ods of general, political instability. Periods of stability and instability for each country inAfrica since are listed in table ., below.
African Regional Trends in Governance, Armed Conflict, and Instability. Three charts arepresented that describe general, regional trends in governance, armed conflict, and polit-ical instability for countries in Africa annually over the contemporary period, -.Figure ., “Africa: Regimes by Type, -,” charts annual changes in the numbersof three basic types of political regimes: democracies, anocracies, and autocracies (seesection for a description of the regime types). The chart presents a very distinct “sig-nature” for institutional authority in African countries that was shaped largely by theperiod of European colonization. In , there were only four independent states inAfrica: Egypt, Ethiopia, Liberia, and South Africa. The number increased to nine by theend of the s but jumped sharply as eighteen countries, mainly French colonial ter-ritories, gained independence in . The number of states in Africa rose to forty-threeby . The last territory to leave European control was Djibouti (from France in ).More recently, two countries have emerged from control by other African countries:Namibia gained independence from South Africa in and Eritrea separated fromEthiopia in . Sovereignty of the former-Spanish controlled territory of WesternSahara remains in dispute since it was occupied by Morocco and Mauritania troops in. Although Mauritania has since relinquished its claim, local resistance by PolisarioFront militants to its annexation by Morocco was strong until a cease-fire was arrangedin , and the issue of territorial sovereignty remains unresolved.
4 It must be noted that in many personalistic, autocratic regimes there are neither set limits on the lengthof executive tenure nor explicit, legal provisions for leadership succession. In these regimes, change of lead-ership may only be accomplished through successful coup d’etat and, so, simple change of leadership maynot necessarily be symptomatic of general instability. Of fifty-six () successful coups in Africa during thestudy period, only seven () occurred as discreet events; forty-nine () occurred during a period of general,political instability. Similarly, eighty-four () reported coup attempts occurred during periods of instabil-ity and twenty-eight () occurred as discreet events. Inter-communal violence events must reach the same,standard “, conflict-related deaths” criteria used to identify revolutionary and ethnic war events and areconsidered evidence of a state’s incapacity to ensure societal stability.
Instability eventsvery often happenconcurrently, theonset of one eventcoincides with or is followed by theonset of overlapping or sequential instability events.

42
The picture that emerges from the regime trends diagram is that experiments in demo-cratic forms of governance in Africa were relatively rare and short-lived during the ColdWar period. At the time of emergence as independent states, only ten countries weregoverned by democratic regimes, twenty-one countries had autocratic regimes, fourteenwere anocracies, and one emerged without an effective central government (Zaire in). Within ten years from their date of independence, six of the ten new Africandemocracies had failed and those states seized by autocratic rule: Lesotho, Nigeria, SierraLeone, Somalia, Sudan, and Uganda. Only Botswana, Mauritius, and Namibia havemaintained democratic regimes since their inception; the democratic regime in TheGambia lasted nearly forty years before falling to autocratic rule in . All fourteencountries that emerged from the period of colonial rule with mixed forms of governance(i.e., anocracies) fell into autocratic rule within fifteen years. In the late s, eighty-five percent of African countries were governed by personalistic, bureaucratic, or mili-tary dictatorships. Only eight countries initiated democratic transitions during the ColdWar era: Morocco, Sierra Leone, and Sudan in the s; Benin, Burkina Faso, Ghana(twice), Nigeria, and Uganda in the s; and Sudan, again, in the s. None of theseearly attempts lasted more than five years before falling once again under autocratic rule.
The end of the Cold War period triggered major changes in the prevalent forms of gov-ernance in Africa. By , the number of autocracies in Africa had fallen by half andcontinued to decline through the s, reaching a low of eight in . The numberof democratic regimes, however, increased to just twelve by from three in ;there were thirteen democracies in Africa at the end of . Nearly all African coun-
5 The white-minority regimes in Apartheid South Africa and Rhodesia (Zimbabwe) were nominally demo-cratic but highly restricted, with the majority of the populations in these countries politically, economically,and culturally disenfranchised.
Number of Countries
Democracies
Autocracies
Anocracies
0
9
18
27
36
45
20001995199019851980197519701965196019551950
Figure 7.1: Africa: Regimes by Type, 1946-2004
The end of the Cold War period triggered major changes in the prevalentforms of governance in Africa.

43
tries have experienced some improvement in the qualities of governance since .However, many of the new democratizing regimes have faltered along the way and some,such as Congo (Brazzaville), Guinea Bissau, and Ivory Coast, have failed. Two countriescounter the generally positive trend by moving toward greater autocracy in the s:The Gambia and Zimbabwe. The sudden shift away from autocratic forms of gover-nance in post-Cold War Africa provides strong evidence of the negative link betweenpolitical violence and democratization. The countries that made the most dramaticmoves toward democracy were almost invariably those that had experienced no, or veryminor, armed conflict since . Benin, Ghana, Kenya, Madagascar, Malawi, Mali, andSenegal have established democratic regimes in largely peaceful societies. Bold movestoward democracy sometimes triggered armed conflicts in peaceful societies: regimetransitions in Central African Republic, Comoros, Congo (Brazzaville), Guinea Bissau,Ivory Coast, Lesotho, Niger, and Sierra Leone have been complicated or compromisedby serious armed violence. The abrupt cancellation of elections in Algeria triggered along and devastating civil war. Three peaceful countries, Burkina Faso, Djibouti, andTanzania, have begun to liberalize their regimes at a more measured pace; others, suchas Cameroon, Gabon, and Guinea have only modestly eased restrictions on politicalactivity. Only Nigeria and Mozambique instituted major democratic changes followingprotracted experiences with civil and communal warfare. By and large, states with past,recent, or current experiences with major societal wars remain autocratic, are strugglingto design or establish a power-sharing government to end civil wars and dampen intensefactionalism, or have collapsed.
Total Magnitude of Armed Conflict
0
10
20
30
40
50
60
70
20001995199019851980197519701965196019551950
All Interstate Wars (inc. colonial wars)
Interstate Warfare
Societal Warfare
Warfare Totals (Societal + All Interstate)
Figure 7.2: Africa: Trends in Violent Conflict, 1946-2004
6 Democratization in Senegal occurred despite the onset of a low-intensity separatist war in the isolatedCasamance region.
7 Algeria had experienced a very brief period of state formation instability from - following a veryintense and bitter war for independence from France. Algeria remained stable for twenty-five years prior tothe onset of civil war in .

44
The greatest change in the governance profile of Africa has been a dramatic increase inthe number of quasi-democratic, or anocratic, regimes. Nearly sixty percent of Africancountries were governed by anocratic regimes in and, of these, half are characterizedby highly factionalized political competition. General poverty and political factionalismhave proven inimical to the persistence and consolidation of democratic forms of gover-nance. During the Cold War period, anocratic regimes were highly prone to the onset ofinstability events; liberalizing regimes lasted less than four years on average and seldomlasted for more than ten years (see Peace and Conflict , figures . and .). In theinitial years of post-Cold War Africa, poor, anocratic regimes appear to be less prone topolitical crises; many have persisted for ten or more years without serious disruption orsetback. Incomplete democratization and persistent poverty remain a potentially volatilemixture and a major concern for regional security and development prospects.
“Africa: Trends in Armed Conflict, -” (figure .) charts annual measures oftwo general types of armed conflict: interstate warfare (red line) and societal warfare(revolutionary, ethnic, and communal wars; blue line). Interstate warfare commonlyrefers to wars involving the armed forces of two or more sovereign states. In the con-temporary Africa context, the majority of interstate wars charted during this period are“wars for independence” from European colonial domination. The end of the Cold Warin also marks the end of “decolonization” in Africa as Namibia gained independencefrom South Africa in and Eritrean separatist forces defeated Ethiopian forces in and initiated secession for Eritrea (a process completed in ). Most classic inter-state wars between African states are brief and low-intensity confrontations; manyinvolve boundary disputes. Egypt has engaged in the greatest number of interstate warsbut most of these have championed pan-Arab, rather than African, disputes. During themain part of the African decolonization period (-), interstate and societal warswere roughly comparable in annual magnitude. As political agendas transformed fromestablishing the general facts of local sovereignty to designing and administering thedetails of public policies, societal warfare in African countries jumped sharply andincreased steadily through the remaining years of the Cold War period; finally peakingin and accounting for about one-third the global total. Since , annual warfaretotals in Africa have diminished by half; most of the decrease has occurred in the pastfive years. Except for the fairly brief, but intense, border war between Ethiopia andEritrea in - (which was, in many ways, simply a resurgence of their bitter civilwar), interstate war has not been a major factor in African armed conflict. This simpleobservation, however, obscures the importance of cross-border support for rebel groupsand periodic raids against rebel refuge bases in neighboring states. The difficulties thatpoor and developing states have in defending their borders, territory, resources, and pop-ulations from external intervention has been quite vividly illustrated by the complexitiesand intrigues that have beset the Democratic Republic of Congo (former Zaire) since, as five neighboring countries, Angola, Namibia, Rwanda, Uganda, and Zimbabwe,openly committed armed forces to combat in Congo’s civil war. Gurr and Marshall havefound that support from foreign states is a crucial element in the decision of ethnic
8 The historical record is crucial in fixing the end of wars and periods of political instability; endings of warsand periods of instability can only be objectively demarcated by the absence of political instability eventsover a period of five or more years. Recent trends are the result of expert assessments of current situations;there is a risk that some wars will experience a resurgence of hostilities or that a new instability event willoccur. In general, a war is considered to have ended with an effective cease-fire and and agreement on, or acommitment by warring parties to actively and faithfully negotiate, a peace accord.
Incomplete demo-cratization and persistent povertyremain a potentiallyvolatile mixture.

45
groups to wage and sustain war against the state; support from kindred groups in neigh-boring countries can also be important.
Two factors help to explain the great disparity between the expected low levels of polit-ical violence in Africa and the observed high levels of warfare. Perhaps the most impor-tant factor is the economic and political marginalization of the majority of thepopulations of many African countries. Most African economies are heavily dependenton extra-regional trade in primary commodities. Government revenues are less oftenbased on taxation of exchange transactions, incomes, or commercial activities and morelikely derived from state-ownership or control of principal commodities, collection ofexport duties, and receipt of foreign assistance. Commercial cross-border trade amongAfrican countries is almost non-existent; most local trade, including cross-border tradein consumer goods, is conducted through the “shadow economy” or “black markets.”Vast populations are neither integrated into national economies nor organized in pro-ductive endeavors and information/exchange networks (i.e., they remain non-organized,non-politicized, and non-mobilized in reference to the national economy and politicalsystem). They have little or no personal stake in the existing system nor, in all likelihood,in any alternative system other than traditional social groups. They remain both vulner-able and undervalued populations and, in times of war, they are often treated as expend-able populations, both by government authorities and rebel challengers. The voices ofmarginalized populations remain silenced when politics are debated or peace is negoti-ated. Very often during wars, marginalized civilian populations are neither provided basicservices nor protected from assaults or confiscation by the armed forces or criminal ele-ments. Even the most essential services may be neglected, destroyed, or consciously with-drawn. During times of war, their main form of protection is to abandon their land andlivelihood and flee. They become the wards of foreign states, catered to by NGOs, and,sometimes, protected by international organizations. Far more people die in African warsas a result of disruptions in essential production, exchanges, and health services and at thehands of armed marauders than die “honorably” on the battlefields. Small wars tend tocreate enormous humanitarian disasters.
How do wars persist under conditions of poverty and the systematic victimization ofmarginalized populations? Without an economically viable and defensible support base,the attrition of warfare should work to end wars rather quickly or, at least, reduce themto a sustainably low level of activity. The second most important factor in explaining theanomaly of large wars in poor societies is external involvement. Whereas, local popula-tions have little stake in the outcomes of national politics and national politics has littlestake in local populations, foreign actors may feel they have high stakes in the outcomesof local competition and control of commodity production. War efforts in Africa arelargely sustained through external exchange and supply with foreign agents, whetherthrough direct military assistance, informal trade in small arms and contraband, or for-mal exchange of security goods for raw materials. During the Cold War period, the“superpower rivalry” largely accounts for the protractedness of wars, as well as their esca-lation. Since the end of the Cold War, large wars have almost disappeared from Africa.Yet, large populations remain “armed and dangerous” and the legacies of war carry theplague of personal violence and organized crime. This is the cultural foundation of themodern, African state: a culture of violence and marginalization. This is the climate inwhich democracy is expected to blossom and endure.
Two factors help to explain the great disparity betweenexpected low levels and observed high levels of warfare: marginal-ization and externalinvolvement.
9 Ted Robert Gurr and Monty G. Marshall, “Assessing the Risks of Future Ethnic Wars,” chapter in T. R. Gurr, Peoples versus States (Washington, DC: United Stated Institute of Peace Press, ).

46
Table 7.1: Periods of Stability and Instability in African Countries
Algeria 1954-62 1962 3 1966 1991 3 x
Angola 1961-75 1975 3 2003
Benin 1960 1 1973
Botswana 1966 0 1966
Burkina Faso 1960 0 1960 1980 1 1991
Burundi 1962 3 1978 1987 3 x
Cameroon 1955-60 1960 2 1960
Central AfricanRepublic 1960 1 1984 1996 3 2004
Chad 1960 3 1995
Comoros 1975 1 1979 1991 1 2001
Congo (Brazzaville) 1960 1 1978 1993 3 2003
D. R. Congo 1960 3 1966 1977 2 1981 1992 3 x
Djibouti 1977 0 1977 1991 3 1995
Egypt* 1952 3 1953 1992 2 1999
Equatorial Guinea 1968 3 1982
Eritrea 1961-91 1993 2 1993
Ethiopia* 1960 3 2001
Gabon 1960 0 1960
Gambia 1965 0 1965 1994 1 1997
Ghana 1960 1 1985
Guinea Bissau 1962-74 1974 2 1974 1997 3 x
Guinea 1958 0 1958
Ivory Coast 1960 0 1960 1991 3 x
Kenya 1952-63 1963 3 1970
Lesotho 1966 1 1970 1986 1 2001
Liberia* 1980 3 2004
Libya 1951 0 1951
Madagascar 1947-48 1960 0 1960
Malawi 1964 0 1964
Mali 1960 0 1960 1990 3 1996
Mauritania 1960 0 1960 1977 1 1986
Mauritius 1968 0 1968
Morocco 1954-56 1956 2 1956 1965 1 1973
Mozambique 1965-75 1975 2 1993
Namibia 1965-90 1990 2 1990
Niger 1960 0 1960 1990 3 1998
Nigeria 1960 3 x
Rwanda 1961 3 1974 1990 3 2002
Senegal 1960 1 1964 1992 2 2000
Sierra Leone 1961 1 1972 1991 3 2002
Somalia 1960 0 1960 1969 1 1970 1987 3 x
South Africa* 1984 2 1997
Sudan 1954 3 x
Swaziland 1968 1 1974
Tanzania 1961 0 1961
Togo 1960 1 1971
Tunisia 1952-54 1959 0 1959
Uganda 1962 3 x
Zambia 1964 1 1969 1990 1 1998
Zimbabwe 1970 3 1988
Coun
try
War
ofIn
depe
nden
ce
Year
Begi
n
Initi
alIn
stab
ility
Type
Initi
alSt
abili
tyGa
ined
Post
-For
mat
ion
Inst
abili
ty
Inst
abili
tyTy
pe
Rega
ined
Stab
ility
Post
-For
mat
ion
Inst
abili
ty2
Inst
abili
tyTy
pe2
Rega
ined
Stab
ility
* Asterisks denote “old states” that gained independence prior to 1950.

47
The third African trend graph, “Political Instability in Africa, -” (figure .),combines information on the onsets of regime and political violence events with annualtrends in the numbers of unstable states to gain a more comprehensive picture of polit-ical instability in African states. “Political stability” here is defined by the absence ofmajor armed conflict and lack of serious disruptions to the central regime’s ability tomake, implement, and administer public policy. Corollary to these basic traits is theproposition that changes to the quality of government reform toward greater trans-parency, openness, inclusiveness, competitiveness, and accountability are more likely tooccur during periods of political stability. Societal-system stabilization is a process thatcan only be considered successful, in these terms, when the state manages to avoid theoccurrence of political violence or disruptive regime events for a period of ten years ormore. Instability provides greater opportunities for both societal and elite challenges tothe status quo. For analytic purposes, a period of instability for any given country beginswith the onset of the first instability event and ends with the conclusion of the last insta-bility event in a sequence of adverse events. Sequential instability events in African statesoccur fairly frequently, with armed conflict often overlapping shorter or sudden regimeevents. Two forms of instability are charted in figure .: state formation instability(orange line; instability that disrupts the establishment of a viable state in a newly inde-pendent country) and post-formation instability (black line; instability that disrupts anestablished, stable state). Table . lists periods of stability and instability for each coun-try in Africa.
10 Event plots for each of the fifty countries in Africa can be viewed on the Center for Systemic Peace Website at http://members.aol.com/cspmgm/africa.
Figure 7.3: Political Instability in Africa, 1946-2004
Number of Instability Event Onsets
Number of Onsets: Political Violence Events
Number of Onsets: Regime Instability Events
Number of States: State Formation Instability
Number of States: Post Formation Instability
Number of Unstable States
0
3
6
9
12
15
0
4
8
12
16
20
20001995199019851980197519701965196019551950

48
The chart shows that instability in African states has remained a fairly constant and seri-ous problem since the decolonization period began in the s. Stabilization of newlyindependent countries proved difficult as more than half of all countries ( of ) expe-rienced a period of state formation instability immediately following independence(ranging from four to thirty-five years for the countries that eventually gained stabil-ity; thirteen years on average). Of these, three countries have not yet achieved effectivepolitical stability: Nigeria, Sudan, and Uganda; a fourth country, Angola, appears tohave finally gained basic stability with the end of its protracted civil war with UNITA in (including these cases raises the average for state formation instability to seventeenand one-half years). Eleven countries experienced a second period of instability and onehas experienced two subsequent periods of instability. On the other hand, twenty-onecountries were able to establish stable states at the date of independence and, of these,twelve have remained stable through . On average, over seven new instability eventsoccurred annually and twenty-five to fifty percent of African states were experiencing aperiod of instability at any point from through (an estimated eighteen per-cent are unstable in early ). Although there is a much lower number of unstablestates in between the peak in state formation instability in and the rapid onset ofpost-formation instability in the early s (averaging about twenty-five percent ofAfrican countries), the scope and frequency of instability events in Africa only begins todecrease in the late s. In the most recent year (), nine states are consideredpolitically unstable. The relatively low number of unstable countries in early issomewhat speculative as it is based largely on projections of continued stabilization tra-jectories in Central African Republic, Comoros, Republic of Congo (Brazzaville),Liberia, and Rwanda. These five countries are particularly vulnerable to new challengesand disruptions that would send them back into instability; proactive internationalengagement is vital to ensure recovery in these situations. Countries with ongoing peri-ods of instability in early include Algeria, Burundi, Democratic Republic ofCongo, Guinea Bissau, Ivory Coast, Nigeria, Somalia, Sudan, and Uganda.
Modeling Political Instability in Africa: the Africa Instability Ledger. In the most basic sys-temic terms, the conceptualization of instability as a social problem presupposes, andderives from, a pre-existing condition of stability. The stability of a social system mustbe established before it can be ended or undone. Modern social systems build upon and,very often, combine smaller, “traditional” social systems and transform these structuresinto more complex configurations that have a greater potential for value production andpreservation. System stability emerges at higher levels of technical and organizationalcomplexity from a condition of non-stability among established, constituent, social unitsand free agents through the development of effective institutions and procedures fororganizing and managing social behavior, resources, and interactions. Over time, tradi-tional loyalties are redefined in terms that are compatible and complementary to loyal-ties to the greater political system and a common “national” social identity. In theAfrican context, the overlay of the modern state system upon traditional social systemswas created and constructed by various European colonial administrations. As a result,loyalties to parochial and common social systems remained at odds and, often, divisionswere reinforced by perceptions of illicit collaboration between local and foreign elementsin the colonial structures.
Instability inAfrican states hasremained a fairly constantand serious problem since the decolonization period began.

49
In order to understand the problem of instability in African states, we must first exam-ine the process of state formation. As mentioned above, transitions from European colo-nial to local administration were successful in establishing a stable state system in onlynineteen of forty-four contemporary cases. Additionally, two states that emerged some-what more recently from control by other African states, Namibia from South Africa in and Eritrea from Ethiopia in , also successfully established stable states. NineAfrican countries gained self-rule following wars of independence; of these, five warsended with independence (Cameroon, Eritrea, Guinea Bissau, Morocco, and Namibia)and four independence wars transformed to civil wars (Algeria, Angola, Kenya, andMozambique). Of twenty-five situations where stable states were not established imme-diately, twelve cases of state formation instability involved only regime instability eventsand twelve involved both regime instability and armed conflict events; only one,Mozambique, was characterized by protracted armed conflict without the occurrence ofany regime instability events. Figure . provides a graphic display of the countriesaffected by state formation instability in Africa.
France and Great Britain were the main colonial powers in Africa and these two powersadministered their respective colonial territories in different ways. The British were farmore likely to try to establish open, electoral systems of governance in their territories,going so far as to establish “self-governing” territories in selected cases, whereas theFrench were more likely to establish autocratic administrations. In all, eight former-British territories were ruled by democratic regimes at the date of independence but, ofthese, only three democratic systems survived for more than seven years: Botswana, TheGambia, and the remote island state of Mauritius (The Gambia fell to autocratic rule in). Two former-British colonies succeeded in establishing stable, autocratic regimes:Malawi and Tanganyika (now Tanzania). In all, five (of fifteen) former-British coloniesestablished stable states upon gaining independence (Cameroon may be counted as a
24
1842+
50+44+
29
35
4
6
18
7
5
11
4
19
18
25
1113
41613
(14)
(8)
(5)
(30)
(12)
(9)
(3)
(10)
(25)
Regime Instability and Armed Conflict
Armed Conflict
Regime Instability
Old States (not included)
35 Duration of Initial Instability
(35) Duration of Independence
Figure 7.4: State Formation Instability in Africa

50
sixth, as it emerged as a union of British and French territories). The French territoriesfavored autocratic () or restricted anocratic regimes () at independence and these faredsomewhat better than the former-British territories in establishing stable systems of gov-ernance: ten of eighteen (eleven if one includes Cameroon). Five of these stable states,however, later lapsed into instability, whereas only one of the five, former-British, stablestates lapsed into instability. Former-British colonies were somewhat more likely thanthe French to have established democratic or partly democratic systems by the end of: ten of fifteen compared to nine of eighteen (Cameroon is partly autocratic). Nosignificant differences, other than the differences in forms of government describedabove, that can be attributed to colonial heritage have been identified in extensive analy-ses of instability in Africa.
In order to better understand the roots of instability in newly independent African coun-tries, that is, state formation instability, a binary logistic regression analysis was con-ducted. Two factors were identified by the analysis that distinguish the twenty-one stablefrom twenty-five unstable states:
• Political Factionalism, distinct political and/or social identity groups polarize andpromote incompatible or uncompromising political platforms prioritizing parochialinterests and creating a contentious atmosphere in which negotiated solutions topolicy differences are difficult to achieve; political deadlock, coercive practices, andinequitable policy outcomes are common under such circumstances (in more demo-cratic systems), and
• Elite Ethnicity, or Ethnic Group Capture of the State, ethnicity is politically salientamong ruling elites and members of the ruling ethnic group(s) are strongly favoredin the distribution of political positions and, especially, in command positions in themilitary, often including restrictions on political access and activities of other con-stituent ethnic groups (in more autocratic systems).
These two factors alone correctly distinguish eighty percent of the cases. In short, newstates had great difficulty in establishing social bases of support for central authority andmanaging contention among competing, politicized social groups over control of thepolitical agenda and public policies. Local or parochial interests, including identificationwith and loyalty to traditional social systems, tended to outweigh common interests andoverpower the central state’s nascent conflict management capabilities. Stabilization wasmost often accomplished through autocratic force rather than broad-based coalitionsand negotiated accords among competing groups. Countries almost invariably emergedfrom periods of state formation instability with strongly, autocratic governments of onetype or another; the only exceptions are Chad, which only established reasonable stabil-ity in , and Mozambique, which ended its long civil war and established a stable sys-tem in ; these two countries emerged with anocratic regimes. As mentioned, threecountries have not yet managed to establish a reasonably stable state system: Nigeria,Sudan, and Uganda; a fourth country, Angola, appears to be entering a period of stabil-
11 “Political factionalism” and “elite ethnicity” are very closely related problems in newly independent stateswhere political parties and professional associations are weak or absent and local patronage or ethnic affili-ations are the main bases of support for political action. The two problems diverge as political opportuni-ties and social networks diversify and institutions are established. As measures of political interaction,“factionalism” can only occur where there is open (democratic) competition; factionalism is repressed underautocratic rule. On the other hand, elite ethnicity is most likely to occur when leaders rely on ethnic grouployalties for support in establishing and maintaining (autocratic) control of the state; securing loyalty andsupport often requires leaders to favor their ethnic group and exclude rival groups, especially, in regard tothe military.
New states had greatdifficulty in establishing social bases of support… and managing con-tention among competing, politi-cized social groups.

51
ity with the end of its civil war against UNITA rebels in and its effective repressionof Cabindan separatists.
Further tests were conducted in order to gain greater understanding of the dynamics ofstate formation. Stable state formation tended to occur in countries with smaller, non-mobilized and non-politicized populations at the time of independence. Unstable statestended to have large, diverse, and urbanized populations, lending further credence to thedifficulties of manageability and group integration in larger, more complex social systems.Factors that correlate strongly with measures of the intensity and duration of state forma-tion instability include ethno-linguistic fractionalization, large populations, large urban-ized populations, and regional insecurity (armed conflicts in neighboring countries). Inaddition, higher energy imports and energy consumption, indicating a more modernizedeconomic sector, correlated with greater intensity of state formation instability.
In brief, problems of system manageability and contending social identities presentedenormous challenges to efforts by indigenous, modernizing political elites in establish-ing and administering a modern state structure in newly independent African states.These challenges were substantially muted in countries where large segments of the pop-ulation were not politically mobilized. Lack of politicization and mobilization continueto characterize political dynamics in many African countries and these are strongly asso-ciated with issues of marginalization and other impediments to progressive social inte-gration and societal development, that is, the progressive development of a civil society.The most serious impact of marginalization for conventional political processes is itsattendant lack of collective pressure for accountability in ruling elites and transparencyin political processes. Corruption and coercion tend to thrive in such an environment.
The duration of periods of state formation instability range from four years to more thanfifty, averaging seventeen and one-half years. Nine of these initially unstable countriesmanaged to stabilize within ten years and another ten countries stabilized with twentyyears; as noted, four remained unstable into the st century. Twelve of twenty-five coun-tries experiencing state formation instability fell into a later period of post-formationinstability; one of these (Democratic Republic of Congo) regained stability only to fallinto instability once again (periods of stability ranged from to years; years aver-age). Nine countries that encountered state formation instability have gained and main-tained stability; four have remained stable for thirty years or more. On the other hand,nine of twenty-one countries that did not experience a period of state formation insta-bility fell into a later period of instability and one of these (Somalia) regained stabilityand fell into instability a second time (periods of stability ranged from to years;
year average). Only ten countries have remained stable since independence: Botswana,Cameroon, Gabon, Libya, Madagascar, Malawi, Mauritius, Tanzania, and Tunisia(enduring for to years); in addition, two countries, Namibia, and Eritrea, emergedwith stable regimes in the s and have remained stable for fifteen and twelve yearsrespectively. It appears that differences in state formation experiences have not, by them-selves, affected the likelihood of a state falling into a period of post-formation instabil-ity. Evidence does show that subsequent lapses back into periods of instability weremuch more likely to involve outbreaks of armed conflict than initial lapses into insta-bility. Periods of post-formation instability tend to be shorter, averaging eleven years.
Problems of systemmanageability andcontending socialidentities presentedenormous challenges.

52
In order to gain better understanding of post-formation instability in African states, a sec-ond series of models was developed to distinguish between conditions characterizingperiods of stability from conditions associated with periods of political instability, par-ticularly the onset of instability. After demarcating periods of instability for all countriesin Africa (see table .), the two years just prior to the year of onset of instability weretagged as the target set. Five year periods just prior to the target set years were designatedas leading years and the five years immediately following the end of a period of instabil-ity were designated as recovery years. Stability years were thus defined as all years morethan five years after the end of a period of instability (including wars for independence)and more than seven years prior to the onset of a period of instability. This method pro-duced a test set of annual cases of stability covering forty-one countries contrastedto annual cases in the instability target set (twenty-five countries). Problems withmissing data reduce the test sample to annual cases of stability and annual cases ofpre-instability, removing cases of instability in Djibouti, Ethiopia, Liberia, Lesotho, SouthAfrica, and Somalia (two cases) from the target set. Seven countries in Africa are generallyrecognized as qualitatively and quantitatively distinct from the rest of the countries of thecontinent: these include the north African countries of Algeria, Egypt, Libya, Morocco,and Tunisia, the remote island state of Mauritius, and the Republic of South Africa. Initialtests were run, and the initial model developed, without these seven countries.
Bivariate correlations were run on various instability measures using over one thousandpossible explanatory variables to verify known correlates of conflict and instability (iden-tified in theoretical literature and research findings) and to identify new candidate vari-ables.11 Patterns of association emerged from initial tests and promising variables wereused in the development of regression models. Binary logistic regression models weredeveloped to distinguish between the stability/pre-instability dichotomy and multipleregression models were developed to test ordered progressions in affective conditions forvarious system phases: stability, leading years to instability, years immediately precedinginstability, years of instability, and recovery years. The indicators used in the final ver-sion of the model were selected because they are well-grounded in conflict theory andprior research and remained robust across various formulations of the dependent vari-able, different methodologies, and model designs. The final model developed to charac-terize the onset of political instability in sub-Saharan African states was then applied toall of Africa with surprisingly strong results. With a single additional variable: GDP percapita (constant US$), the model performed equally well for all of Africa as it didfor the subset of sub-Saharan African countries. The research modeling provides thebasis for the Africa Instability Ledger (table .); model parameters are detailed inAppendix table .. Key factors identified with the onset of post-formation instabilityinclude the following:
• Dependency, governments that are overly dependent on foreign aid and foreigntrade for operating revenues (foreign aid as a percent of gross capital formation; for-eign aid per capita; trade openness; high export duties, low government revenues,low investment);
• Polarization, societies that have politicized and mobilized social identity constituen-cies through inequitable use of public policies, particularly in regard to ethnic differ-
12 The Political Instability Task Force (PITF) global database was used for the tests (version v; data cov-ers all countries over the period -). The PITF global, annual time-series database has been compiledand developed by the Task Force since ; it integrates data from all major data sources that have reason-ably broad country and time coverage.
The most seriousimpact of marginal-ization is the lack of collective pressure for accountability and transparency…corruption and coercion tend tothrive in such anenvironment.

53
Table 7.2: Africa Instability Ledger
Peac
e-Bu
ildin
gCa
paci
ty
Actu
alIn
stab
ility
Pred
icte
dIn
stab
ility
Aid
Depe
nden
cy
GDP
perC
apita
Polit
ical
Disc
rimin
atio
n
Elite
Ethn
icity
Polit
ical
Fact
iona
lism
Stat
eFo
rmat
ion
Inst
abili
tyPo
pula
tion
Dens
ity
Land
Area
Fore
stCo
ver
Lead
ersh
ipSu
cces
sion
Neig
hbor
hood
:De
moc
raci
esNe
ighb
orho
od:
Arm
edCo
nflic
t
Mus
limCo
untr
y
• • Algeria • • • • • • • •• • Angola • • • • • •• Benin • • • • • • •• Botswana • • • •• Burkina Faso • • • • • • • •• • • Burundi • • • • •• • Cameroon • • • • • •• • • Central African Republic • • • • •• • • Chad • • • • • • •• • • Comoros • • • • •• • • Congo (Brazzaville) • • • • • •• Djibouti x • • •• • • D. R. Congo (Kinshasa) • • • • • •• • Egypt • • • o • • • •• • Equatorial Guinea x • • • • • •• Eritrea • • • • •• • • Ethiopia • • • • o • • •• • Gabon • • • • •• • Gambia • • •• • Ghana • • • •• • Guinea • • • • • •• • • Guinea Bissau • • • • • • •• • Ivory Coast • • • • • • • •• Kenya • • • • •• • Lesotho • • • •• • Liberia x • • o • •• • Libya • • • • •• Madagascar • • • •• Malawi • • • • •• • Mali • • • • •• Mauritania • • • • • •• Mauritius • • •• Morocco • • • •• Mozambique • • • •• Namibia • •• Niger • • • • • •• • Nigeria • • • • • • •• • • Rwanda • • • • • •• • • Senegal • • • • •• • • Sierra Leone • • • • • • • •• • Somalia x • • •• South Africa • • • o • •• • • Sudan • • • • • • •• Swaziland • • • • •• Tanzania • • • • • •• Togo • • • • • • •• Tunisia • • • • • • •• • Uganda • • • •• Zambia • • • • • • •• Zimbabwe • • • •
Notes:“x” under Aid Dependencydenotes missing data;model scores are estimated.“o” under State FormationInstability denotes statesthat gained independenceprior to the post-World WarII “decolonization” phase.
Continuous variables:Red icons indicate bottom quintile; yellow icons indicate second from bot-tom quintile; green iconsindicate top quintile.
Dichotomous variables:Red and green icons indi-cate that dynamic qualityexists; yellow icons indicatethat structural/exogenous quality exists.

54
ences (official policies of political discrimination or repression of constituent ethnicgroups; ethnic group capture of the state; political factionalism);
• Unmanageability, countries that must manage large territories, particularly thosewith substantial forested regions; concentrated, high density populations; or con-tentious social divisions institutionalized during conflicts over the original terms ofstate formation (state formation instability; high population density; large land area;high percentage of forest cover);
• Leadership Succession, states where the political process is overly dependent on keypersonalities are highly susceptible to succession struggles, leading to instability (topranking political leader in power for twenty years or more);
• Neighborhood Effects, weak states not only have trouble managing internal politi-cal dynamics, they are highly vulnerable to negative external influences from repres-sive or unstable neighboring countries (less democratic neighbors; societal war in atleast one neighboring country); and
• Islamic Countries, only one-third of Islamic countries experienced state formationinstability but seventy percent have experienced post-formation instability; on theother hand, sixty-four percent of non-Islamic countries experienced state formationinstability with only one-third experiencing post-formation instability (countries withMuslim populations comprising forty or more percent of the country’s population).
Some Observations on Instability, and Systemic Development, in Africa. In reviewingthe contemporary trends in political violence and instability in Africa, the first consid-eration must be of the enormous human and material losses, costs, and consequences ofsuch widespread and persistent turmoil. African states have been and remain generallypoor, underdeveloped, and overly dependent on export trade in primary commoditieswith OECD countries. Evidence suggests that, during the Cold War period, countriesthat continued to concentrate export trade with one country, usually the former-colo-nial power, enjoyed a lesser risk of instability. This may be explained by the foreignpower’s vested interest in supporting stability in their client state. On the other hand,countries that had substantial trade with one of the superpowers had relatively high inci-dence and intensity of instability, suggesting that the strategic rivalry between the UnitedStates and the Soviet Union may have exacerbated, or at least capitalized on, conflictdynamics in developing states in Africa. Supply of armaments to client states surely helpsto explain the intensity and longevity of many of these conflicts. The increasing global-ization of trade becomes evident in Africa during the s as diversification of tradingpartners becomes increasingly common. Globalization adds powerful, new dynamics topolitics in weak African states that are not fully understood but almost entirely unregulated.
What can be said is that, since , per capita incomes have fallen substantially in one-third of African countries and remained stagnant in another one-quarter. Of those thathave made gains, the majority has experienced little or no civil warfare since indepen-dence. Four others that have made gains, Ethiopia, Eritrea, Mozambique, and Uganda,emerged from devastating civil wars in the late s and early s, and theireconomies are better considered to be rebounding rather than expanding (the first threeremain among the poorest countries in Africa). Sudan stands as an anomaly as it has
Globalization addspowerful, newdynamics to politicsin weak Africanstates that are notfully understood but almost entirelyunregulated.

55
managed to wage deadly wars through the s and still increase its income, mainly dueto the recent discovery of oil. What seems clear is that, in countries that are heavilydependent on primary commodity trade, entrepreneurial incentives to gain and main-tain control of the state are extremely powerful. Established, well-organized, social iden-tity groups enjoy crucial advantages in the competition to gain control of the state, andgaining control of the state may enable these groups to increase their advantages overcontending groups. This, of course, assumes that acquired capital gains are re-investedin local enterprises and not transferred out of the country. Only as the foundation of theeconomy moves from primary commodities to commercial enterprises would co-opta-tion of a rising commercial class and the formation of a broader-based support coalitionamong political elites be necessary. Given the general weakness of the commercial sectorand civil society in many African countries, the recent shift toward democratization willbe difficult to sustain.
In the absence of the conflict-mitigating effects of a broad-based, proactive civil societywith substantial stakes and personal interests in maintaining the system, elite rivalry, out-group resistance, and entrepreneurial violence can be expected to further complicate theinherent problems of manageability in African societies. Under these circumstances, itcan be expected that both deprivational and aspirational grievances among marginalizedpopulations and disadvantaged outgroups would be similarly intense counterparts to theelite struggle for control of the state in defining the character and quality of politicaldynamics in the societal development process. As such, both “greed” and “grievance”should be expected to provide strong motivations to challenge and change the statusquo, or, in the worst case, to simply undo it. The probability of instability under theseconditions is high and the actual occurrence of instability events, then, depends largelyon circumstantial opportunities. Things can fall apart very quickly in weak countriesand, once they have fallen apart, it can be extremely difficult to put things back together.In particular, evidence suggests that capital and investment flows shift significantly awayfrom countries in the years immediately preceding their lapse into instability and thisshift may further increase system destabilization and undercut the potential for recovery.Needless to say, countries experiencing instability do not attract favorable capital andinvestment flows, making stabilization even more difficult to regain.
Yet, given the propensity for instability in African states, the substantial decreases inarmed conflict, autocratic regimes, and political instability charted since are encour-aging. Ideologies of political confrontation and struggle that dominated Cold War poli-tics have given way to the rhetoric of engagement and accommodation. The numbers ofhumanitarian and other non-governmental organizations have increased thirty-fold.Important gains have been made but the continuation and consolidation of those gains
13 The greatest gain has been in Equatorial Guinea, where the discovery of oil has increased per capitaincome by over % since . The autocratic regime in this country has a long history of severe repres-sion of oppositional groups.
14 The “greed” versus “grievance” debate concerning alternative motivations driving civil wars in develop-ing countries is most closely associated with Paul Collier’s work at the World Bank; see Paul Collier andAnke Hoeffler, “Greed and Grievance in Civil War,” Oxford Economic Papers . (): -.
15 These findings and claims are largely consistent with those presented in Fearon and Laitin’s recent studyof civil wars, in which they argue that “The factors that explain which countries have been at risk for civilwar…the conditions that favor insurgency. These include poverty, political [regime] instability, rough ter-rain, and large populations.” James D. Fearon and David D. Laitin, “Ethnicity, Insurgency, and Civil War,”American Political Science Review, .: -.
Given the generalweakness of thecommercial sectorand civil society in many Africancountries, the recent shift towarddemocratizationwill be difficult tosustain.

56
remains in jeopardy. Wars may end but the complex consequences and legacies of warwill continue to resonate for many years to come. Research provides strong evidence thatpolitical instability in African states, and particularly serious and protracted armed con-flicts, create long-term impediments and complex challenges to societal developmentprocesses. While the majority of countries in Africa enjoy more open political processessince the s, many others remain deeply-divided societies with failed or failing statesand limited alternatives for transforming divergent images of the past and present toconvergent images of the future. The most invidious consequences of past wars andinstability are the abundance of unemployed fighters, the proliferation of weapons, andunregulated markets. Organized crime thrives under such conditions.
Proactive international engagement is and will remain crucial over the medium term inhelping countries to manage social tensions and stimulate the development of self-regu-lating civil societies. A focus on humanitarian assistance, conflict mediation, and secu-rity guarantees in the short term should give way to an emphasis on transparency andaccountability guarantees over the longer term. Corruption is generally recognized asone of the most serious impediments to the development of civil society. Whereas pettycorruption is a general nuisance that requires the complicity of state authority, grandcorruption is, perhaps, the greatest threat to security and development in Africa and thisplague requires mobility, liquidity, and a sophisticated network of global accomplices. Inthe new world order, corruption and insecurity are transnational issues that require mul-tilateral solutions. Compensating for in-country security and accountability deficits canbest, and may only, be accomplished through regulatory procedures instituted andadministered by the larger, established, global and regional legal systems. Transparencyis the key to a self-regulating society and investments in communication technologies areas critical in the era of democratization and globalization as electrification has been tothe era of industrialization. Our evidence suggests that political instability in Africancountries is strongly, negatively correlated with general issues of human security; provi-sion of education, health, and basic social services; investments in commercial infra-structure; and expansion of modern, communications and information technologies.This is the essence of a conflict-poverty trap.
Nobel Prize-winning economist Amartya Sen has been a leading proponent of theimportance of personal freedoms to societal development and, so, of the potential fordemocratization in overcoming problems of insecurity and arrested development indeveloping societies. “Freedoms are not only the primary ends of development, they arealso among its principal means.” If the new democracies of Africa are going to fosterthese freedoms and tap human potential to lead the way out of the current cycle ofpoverty and violence, voice and visibility will have to improve until responsiveness byAfrican governments becomes routine. Citizens must feel they have a stake in the systemand that they share a common cause in a promising future, not only in regard to com-peting interests and constituencies within their society but with the world around them.
16 Amartya Sen, Development as Freedom (New York: Alfred A. Knopf, ), p. .
Transparency is the key to a self-regulating societyand investments in communicationtechnologies are ascritical in the era of democratizationand globalization aselectrification hasbeen to the era ofindustrialization.

57
8 . A S S E S S I N G R I S K S O F G E N O C I D E A N D
P O L I T I C I D E
In , in response to a request by senior U.S. policy makers, the State Failure (nowPolitical Instability) Task Force, hereafter simply the Task Force, was established todesign and carry out a data-driven study of the preconditions of state failure, defined toinclude ethnic and revolutionary wars, adverse or disruptive regime transitions, andgenocides and politicides. In , in response to President’s Clinton’s policy initiativeon genocide early warning and prevention, the author, a senior consultant with the TaskForce, was asked to design and carry out a study that would use her own and other datasources to establish an empirically and theoretically grounded, data-based system for riskassessment and early warning of genocidal violence.
The following definition, developed by the author, is used to identify historical andfuture cases. Genocides and politicides are the promotion, execution, and/or implied con-sent of sustained policies by governing elites or their agents – or, in the case of civil war, eitherof the contending authorities – that are intended to destroy, in whole or part, a communal,political, or politicized ethnic group. In genocides the victimized groups are defined by theperpetrators primarily in terms of their communal characteristics. In politicides, by con-trast, groups are defined primarily in terms of their political opposition to the regimeand dominant groups. The definition parallels those developed by other comparativeresearchers such as Helen Fein and Frank Chalk. The definition has been used to iden-tify forty-one cases of genocide or politicide in the world since . These cases are listedin table . and mapped in figure ..
Barbara Harff
greater than 500,000 deaths
100,000-500,000
50,000-100,000
Figure 8.1: Genocides and Politicides since 1955
10,000-50,000
10,000 or fewer

58
The results of this effort have been described in detail invarious Task Force reports and academic journals. Thestructural model used in this analysis identifies six causalfactors that jointly differentiate with reasonable accuracy(%) the serious civil conflicts that led to episodes ofgenocidal violence between and and othercases of serious civil conflict that did not. Case-by-caseinspection of false negatives and false positives suggests,first, that several false positives could easily have esca-lated into genocide or politicide, such as Mozambique in, where widespread killings were carried out byRenamo rebels but did not target specific communalgroups. Second, most of the false negatives are due toambiguity about when to date the onset of genocide, orproblems with the lag structure used to estimate themodel. For example, the first genocide in Sudan wasdated from (the beginning of the southern rebel-lion) but more accurately probably began in the lates or early s. Another is Chile (targeting ofthe left by the Pinochet regime), where the country wasclassified as a democracy (which it was at the end of) because all model variables are measured one yearprior to the onset of the episode. Accuracy increases tonearly % when such temporal inconsistencies in thedata are taken into account.
The six factors in the genocide and politicide structuralmodel are as follows:
• prior genocides and politicides: a dichotomous indi-cator of whether a genocide or politicide has occurredin the country since ;
• political upheaval: the magnitude of politicalupheaval (ethnic and revolutionary wars plus regimecrises) in the country during the previous years,excluding the magnitude of prior genocides;
• ethnic character of the ruling elite: a dichotomousindicator of whether the ruling elite represents aminority communal group, such as the Tigrean-dominated regime of Ethiopia;
• ideological character of the ruling elite: a belief system that identifies some overriding purpose orprinciple that justifies efforts to restrict, persecute, oreliminate certain categories of people;
• type of regime: autocratic regimes are more likely toengage in severe repression of oppositional groups;
• trade openness (export + imports as % of GDP):openness to trade indicates state and elite willingnessto maintain the rule of law and fair practices in theeconomic sphere.
Table 8.1: Countries Experiencing Episodes ofGenocide or Politicide since 1955
Country Dates Estimated Deaths
Afghanistan 4/78-4/92 1,800,000
Algeria 7/62-12/62 9,000-30,000
Angola I 11/75-11/94 500,000
Angola II 12/98-3/02 70,000-100,000
Argentina 3/76-12/80 9,000-20,000
Bosnia 5/92-11/95 225,000
Burma (Myanmar) 1/78-12/78 5,000
Burundi I 10/65-12/73 140,000
Burundi II 8/88-8/88 5,000-20,000
Burundi III 10/93-12/93 50,000
Cambodia 4/75-1/79 1,900,000- 3,500,000
Chile 9/73-12/76 5,000-10,000
China I 3/59-12/59 65,000
China II 5/66-3/75 400,000-850,000
D. R. Congo (Zaire) I 2/64-1/65 1,000-10,000
D. R. Congo (Zaire) II 3/77-12/79 3,000-4,000
Equatorial Guinea 3/69-8/79 50,000
El Salvador 1/80-12/89 40,000-60,000
Ethiopia 7/76-12/79 10,000
Guatemala 7/78-12/90 60,000-200,000
Indonesia I 10/65-7/66 500,000-1,000,000
Indonesia II 12/75-7/92 100,000-200,000
Iran 6/81-12/92 10,000-20,000
Iraq I 6/63-3/75 30,000-60,000
Iraq II 3/88-6/91 180,000
Nigeria 6/67-1/70 2,000,000
Pakistan I 3/71-12/71 1,000,000-3,000,000
Pakistan II 2/73-7/77 5,000-10,000
Philippines 9/72-6/76 60,000
Rwanda I 12/63-6/64 12,000-20,000
Rwanda II 4/94-7/94 500,000-1,000,000
Somalia 5/88-1/91 15,000-50,000
Sri Lanka 7/89-1/90 13,000-30,000
Sudan I 10/56-3/72 400,000-600,000
Sudan II 9/83-10/02 2,000,000
Sudan III 7/03-present 250,000
Syria 4/81-2/82 5,000-30,000
Uganda I 2/71-4/79 50,000-400,000
Uganda II 12/80-1/86 200,000-500,000
South Vietnam 1/65-4/75 400,000-500,000
Yugoslavia 2/98-6/99 10,000

59
More recent theoretical and empirical work suggests that one additional factor should betaken into account when assessing risks of future genocidal violence. If minorities are tar-geted for severe political or economic discrimination, the risks of future genocide orpoliticide against those groups increase. It also is important to recognize that, where cen-tral political authority has collapsed or where contending groups make rival claims tostate authority, any challenging group motivated by an exclusionary ideology may followgenocidal policies. They may target communal rivals, supporters of opposing groups,remnants of a prior regime, or a regime struggling to (re)establish central authority, asthe Serbs did in Bosnia. These acts of violence resemble "terrorism" (see section fol-lowing), but if the intent is to destroy the target group in whole or part, they are geno-cide or politicide. Both of these additional factors, severe discrimination against groupsand the promotion of exclusionary ideologies by challengers to state authority, have beentaken into account in the new analysis that is summarized in the accompanying table(see table .).1
Table . lists all countries with serious armed conflicts, regime crises, or high vulnera-bility to crisis at the end of . Although the model developed by the Task Force wasused to identify relevant risk factors, the checklist approach employed to develop thistable and the resulting risk assessments differ from the methods used and results reportedby the Task Force. The seven risk factors for genocide are shown in summary form foreach of these countries, and the countries are listed in descending order of numbers ofrisk factors present. Sudan, where genocide is underway in Darfur, tops the list alongwith Burma and Algeria. In Algeria the risks are heightened because of the Islam-inspiredexclusionary ideology of armed militants. Burundi and Rwanda are other examples ofhigh-risk countries in which the greatest threat comes from the exclusionary ideology ofchallenging groups – in these cases the anti-Tutsi ideology of armed Hutu militants.Near the bottom of the list are mostly-democratic countries such as Turkey, Colombia,and India which are challenged by armed conflicts but have few or – in the case ofThailand – none of the preconditions of genocide and politicide. Countries with four,five, or six risk factors need closest international scrutiny.
Risk Assessment, Early Warning, and Early Response. Whereas systematic risk assess-ment is better than what we had before, it is not enough to tell us more precisely WHENgenocidal violence is likely to begin. What high risk profiles tell us is that a country is inthe latter stages of upheaval that may result in genocide or politicide. This alone shouldbe enough to prompt preventive action. In other words it is then that less costlyapproaches, i.e. financial, humanitarian or rescue operations combined with subtle ornot so subtle political pressures, could work to prevent onset or escalation of violenceagainst vulnerable populations.
To bridge the gap between risk assessment and the onset of genocidal violence, a pilotstudy, designed by the author, was developed to monitor on a daily basis countries iden-tified at high risk. The theoretical underpinnings of this study were published in
(see note above). The theoretical base is extremely complex using factors and trig-gers that are measured by observing political events. It requires tracking roughly indi-
1 Barbara Harff and Ted Robert Gurr, “Systematic Early Warning of Humanitarian Emergencies,” Journalof Peace Research . (): -. Barbara Harff, “No Lessons Learned from the Holocaust? AssessingRisks of Genocide and Political Mass Murder since ,” American Political Science Review . (): -. The Genocide/Politicide project Web site can be found at www.cidcm.umd.edu/inscr/genocide.
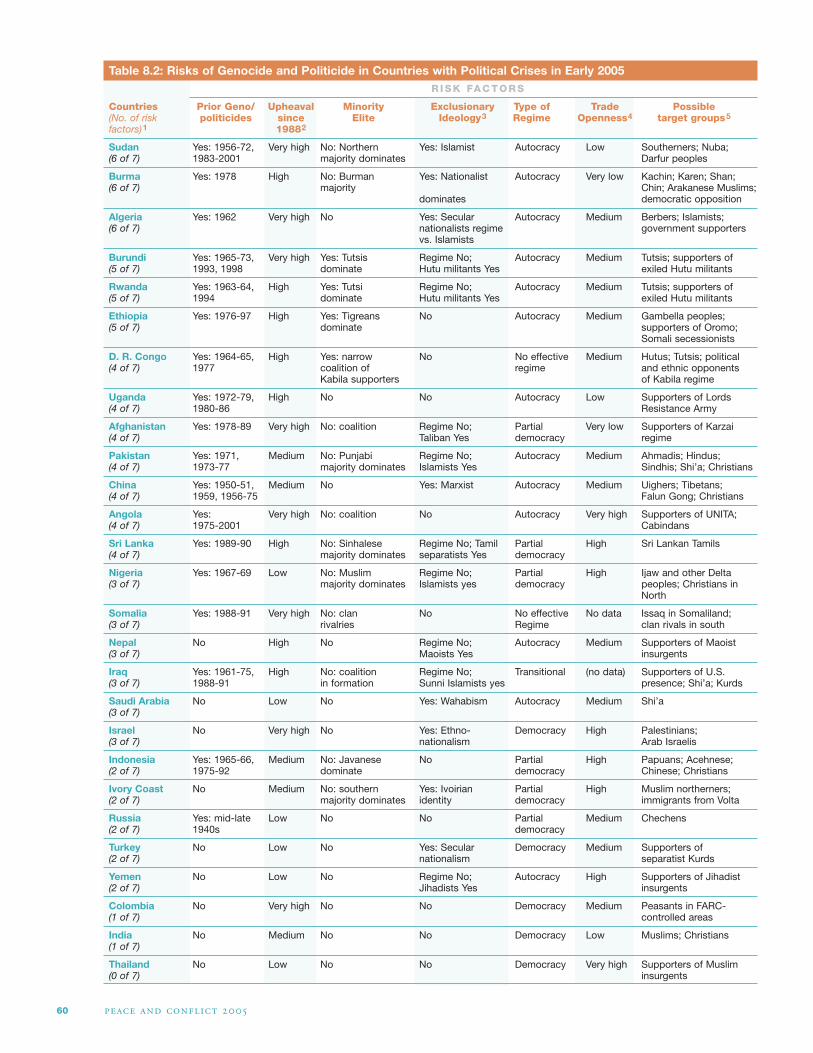
Table 8.2: Risks of Genocide and Politicide in Countries with Political Crises in Early 2005RISK FACTORS
Countries Prior Geno/ Upheaval Minority Exclusionary Type of Trade Possible(No. of risk politicides since Elite Ideology3 Regime Openness4 target groups5
factors)1 19882
Sudan Yes: 1956-72, Very high No: Northern Yes: Islamist Autocracy Low Southerners; Nuba;(6 of 7) 1983-2001 majority dominates Darfur peoples
Burma Yes: 1978 High No: Burman Yes: Nationalist Autocracy Very low Kachin; Karen; Shan;(6 of 7) majority Chin; Arakanese Muslims;
dominates democratic opposition
Algeria Yes: 1962 Very high No Yes: Secular Autocracy Medium Berbers; Islamists; (6 of 7) nationalists regime government supporters
vs. Islamists
Burundi Yes: 1965-73, Very high Yes: Tutsis Regime No; Autocracy Medium Tutsis; supporters of (5 of 7) 1993, 1998 dominate Hutu militants Yes exiled Hutu militants
Rwanda Yes: 1963-64, High Yes: Tutsi Regime No; Autocracy Medium Tutsis; supporters of (5 of 7) 1994 dominate Hutu militants Yes exiled Hutu militants
Ethiopia Yes: 1976-97 High Yes: Tigreans No Autocracy Medium Gambella peoples; (5 of 7) dominate supporters of Oromo;
Somali secessionists
D. R. Congo Yes: 1964-65, High Yes: narrow No No effective Medium Hutus; Tutsis; political(4 of 7) 1977 coalition of regime and ethnic opponents
Kabila supporters of Kabila regime
Uganda Yes: 1972-79, High No No Autocracy Low Supporters of Lords(4 of 7) 1980-86 Resistance Army
Afghanistan Yes: 1978-89 Very high No: coalition Regime No; Partial Very low Supporters of Karzai (4 of 7) Taliban Yes democracy regime
Pakistan Yes: 1971, Medium No: Punjabi Regime No; Autocracy Medium Ahmadis; Hindus; (4 of 7) 1973-77 majority dominates Islamists Yes Sindhis; Shi’a; Christians
China Yes: 1950-51, Medium No Yes: Marxist Autocracy Medium Uighers; Tibetans; (4 of 7) 1959, 1956-75 Falun Gong; Christians
Angola Yes: Very high No: coalition No Autocracy Very high Supporters of UNITA;(4 of 7) 1975-2001 Cabindans
Sri Lanka Yes: 1989-90 High No: Sinhalese Regime No; Tamil Partial High Sri Lankan Tamils(4 of 7) majority dominates separatists Yes democracy
Nigeria Yes: 1967-69 Low No: Muslim Regime No; Partial High Ijaw and other Delta (3 of 7) majority dominates Islamists yes democracy peoples; Christians in
North
Somalia Yes: 1988-91 Very high No: clan No No effective No data Issaq in Somaliland; (3 of 7) rivalries Regime clan rivals in south
Nepal No High No Regime No; Autocracy Medium Supporters of Maoist(3 of 7) Maoists Yes insurgents
Iraq Yes: 1961-75, High No: coalition Regime No; Transitional (no data) Supporters of U.S.(3 of 7) 1988-91 in formation Sunni Islamists yes presence; Shi’a; Kurds
Saudi Arabia No Low No Yes: Wahabism Autocracy Medium Shi’a(3 of 7)
Israel No Very high No Yes: Ethno- Democracy High Palestinians; (3 of 7) nationalism Arab Israelis
Indonesia Yes: 1965-66, Medium No: Javanese No Partial High Papuans; Acehnese; (2 of 7) 1975-92 dominate democracy Chinese; Christians
Ivory Coast No Medium No: southern Yes: Ivoirian Partial High Muslim northerners; (2 of 7) majority dominates identity democracy immigrants from Volta
Russia Yes: mid-late Low No No Partial Medium Chechens(2 of 7) 1940s democracy
Turkey No Low No Yes: Secular Democracy Medium Supporters of(2 of 7) nationalism separatist Kurds
Yemen No Low No Regime No; Autocracy High Supporters of Jihadist(2 of 7) Jihadists Yes insurgents
Colombia No Very high No No Democracy Medium Peasants in FARC-(1 of 7) controlled areas
India No Medium No No Democracy Low Muslims; Christians(1 of 7)
Thailand No Low No No Democracy Very high Supporters of Muslim (0 of 7) insurgents
60

61
Footnotes for Table 8.2 at left:
1 Prepared by Barbara Harff and Ted Robert Gurr, February 2005. Countries are listed according to their number of riskfactors. One additional risk factor is added based on more recent analyses: officially-sanctioned discrimination againstone or more minority groups. Such groups are named in bold under Possible Target Groups. Indicators of the risk fac-tors were originally compiled for the U.S. Government’s State Failure (now Political Instability) Task Force. The table hasbeen updated using year 2003 information except that Trade Openness values are for 2002. Bold italic entries are high-risk conditions. The table includes all countries with serious armed conflicts, regime crises, or high vulnerability to cri-sis at the end of 2004, as identified by Monty G. Marshall based on analyses elsewhere in this report and listed inAppendix table 11.1
2 Categories used for upheaval scores: low = 1- 9, medium = 10-20, high = 21-34, very high = 35-60
3 Exclusionary ideology is present if either the regime (governing elite) or a challenging elite is motivated by such an ide-ology. This is a modification of the risk analysis included in Harff, “No Lessons Learned.”
4 Categories used for trade openness scores: very low, 20 or less; low, 21-40; medium, 41-70; high, 71-100; and veryhigh, greater than 100. Countries with low scores on this variable but high levels of international political engagementaimed at stabilizing internal conflicts are recoded medium, signifying low risk. This adjustment has been made forBurundi, Rwanda, and Pakistan.
5 Possible victim groups are identified based on country-specific information compiled by the authors. Groups in boldare subject to officially sanctioned political or economic discrimination according to 2003 data coded by the Minoritiesat Risk project at the University of Maryland. If any such group is identified, it is counted as a seventh risk factor.
cators on a daily basis. International organizations and NGO’s could develop simplifiedtracking devices based on this model that will help to analyze assorted information andprovide early warnings in specific situations.
The theoretical basis of the early warning system described above is anchored in thegenocide literature. The definition of genocide and politicide used closely resemblesthose employed by other scholars. Thus discussion can focus on prevention rather thandebating etiology or definitions. Moreover the risk assessment and early warning systemsare easy to understand and can be simplified for use by policy makers and observers inthe field who are not necessarily familiar with social science techniques and jargon. Whatis most needed now are preventive tools that are tailored to the specific needs of partic-ular communities at a particular time. The next big challenge for early warning researchis to learn more about what works to prevent genocidal violence in which kind of situ-ations and at which time.
High-risk profiles of genocide or politicide… alone should be enough to prompt preventive action.

62
9 . G L O B A L T E R R O R I S M : A N O V E R V I E W A N D
A N A L Y S I S
Terrorism, and the current “war on terrorism,” has become the most important securitytheme of the twenty-first century. Undergirding the problem of terrorism are the linger-ing fears of totalitarianism and nuclear annihilation, terrorism’s predecessors as the mainsecurity themes of the twentieth century. Mix these three themes together in a cauldronof globalization and super-empowerment and you have a virtual witch’s brew of unrea-soning fear. Yet, while the current, global “war on terrorism” may be something new, theproblem of “terrorism” is as old as humanity. Brutal violence has long been used as a toolfor making strong, and unforgettable, political statements. In the immediate aftermathof the September , , attacks on the United States’ World Trade Center andPentagon buildings, and the United States’ retaliatory attacks on al Qaeda bases inAfghanistan and the forced ouster of that country’s radical Taliban regime, we were askedby policy makers to “[u]ndertake a broad evidence based overview and detailed analysisof the ways in which terrorism presents a fundamental threat to societies and the globalsocial order….In this context, it is important to clarify the social roots of terrorism, a dis-tinct aspect of conflict, and to clarify its relationship to social integration and disintegra-tion trends.” This section provides a summary of the research and findings of that studyand concludes with a brief update that examines trends in post-/ global terrorism.1
Defining Terrorism. In order to study a social phenomenon, great or small, it must besomehow distinct and readily distinguishable from other, similar social phenomena.Terrorism, if it can be objectified, is surely a subset of violence, that is, if it is not heldto be synonymous with violence. Terrorism, as a form of political violence, has oneessential quality: the intentional targeting of civilian, non-combatant populations. It ishere proposed that terrorism’s essential quality of targeting civilians with political vio-lence has several additional qualities that distinguish it from other forms of political vio-lence, among these are the following:
• There are two fundamental political forms of terrorism that derive from the pre-vailing structures of authority and are part of the same strategic interactive process:repressive and expressive forms of terrorism. Repressive terrorism is used by author-ities against constituents in an attempt to ensure social order; expressive terrorism isused by constituents against authorities, or symbols of authority, in an attempt todraw attention to a political agenda.
• The simple act of terrorism is necessarily a one-sided imposition of violent forceupon a victim. This implies an asymmetrical power or authority relationship. Theasymmetry may be structural (i.e., a stable asymmetry between a relatively strongand a weak actor) or temporal (i.e., a momentary, situational or imagined advantagewherein a generally weak actor may be temporarily, relationally strong as in a sur-prise attack launched before the target can muster adequate protection).
• An additional, perhaps more controversial, quality of this conception of terrorismrefers to the perceptual impact of the terrorist act. The quality of “terror” in an actof terrorism is somehow related to social expectations and the social context: terror-
Monty G. Marshall
1 A copy of the full report is available on the Web at www.cidcm.umd.edu/inscr/papers/GlobalTerrorism.pdf.
2 Intent is always difficult to establish. Here intent is evidenced by direct, sustained, and/or systematic (i.e.,patterned) targeting of non-combatant (civilian) populations.
The problem of “terrorism” is as oldas humanity.

63
ism is an extraordinary act of violence; it must stand in contrast to our normalexpectations of adversity. It must seize our attention and hijack our imagination ifit is to be effective as a special form of political violence.
• And finally, terrorism is perpetrated by a terrorist, that is, it is a highly individual-ized and personalized use of violence, making it more immediate and tactically andlogistically distinct from more complex forms of militant action, thus, rendering ithardly distinguishable from psychopathic, sociopathic, or criminal violence.
Terrorism, as a political act, stands at once at the nexus between individual and collec-tive action, the emotional and rational, the conventional and the unconventional. It canbe the strongest form of protest, the weakest form of rebellion, or a specialized tactic ina broader process of tyranny or warfare.
Designing Terrorism as a Dependent Variable. The concept of “terrorism” that informsthis study focuses exclusively on the direct targeting of civilian populations in acts orepisodes of political violence. Two new indicators of global terrorism were constructedto inform a quantitative analysis of the social roots of global terrorism: one with abroader focus on episodes of collective political violence and warfare (CPV) with andwithout “excessive targeting of civilian populations” and another with a narrow focus ontactical acts of terrorism (TERROR). The period of study is the ten-year period leadingto the / attacks that signaled the beginning of the current “global war on terrorism.”
The Collective Political Violence (CPV) scale measures general, ordinal levels of state,non-state, and communal group violence within a particular country during the s.The scaling of the CPV variable also reflects whether an episode of collective politicalviolence involves the excessive targeting of civilians. The term “excessive targeting ofcivilians” focuses on the deliberate and systematic use of violence against non-combat-ant populations in situations of political conflict by either state or non-state actor groupsthat can be considered in excess of the general suffering of civilian populations that isassociated with warfare and “collateral damage.” The scaling was constructed usinginformation and data from the Minorities at Risk (MAR) and State Failure Problem Set(SFPS) datasets for the ten-year period - according to the rules summarized intable . (rules are detailed in Appendix A in the full report). Annual conflict informa-tion was aggregated for the ten-year period and a single ordinal indicator of magnitudevalue was assigned for each country for the entire period based on comparative levels ofviolence. The nine-category CPV indicator was then separated into three classificationsof cases for further comparative analysis: states experiencing collective political violencewith excessive targeting of civilians (CPVCIV), states experiencing political violencewithout excessive targeting of civilians (CPVNOCIV), and states without collectivepolitical violence (the control set).
The second, more narrowly focused, indicator of terrorism proved to be more difficultto construct. There are no known databases that have compiled systematic, global infor-mation on individual incidents of terrorism except the two datasets on international ter-rorism commonly referred to as the RAND-St. Andrews and ITERATE datasets.
International terrorism requires that either the actor or target of the terrorist act must
Terrorism stands at the nexus betweenindividual and collective action, the emotional and rational, the conven-tional and theunconventional.
3 A new, global database on more general forms of terrorist events is being compiled by Gary LaFree at theUniversity of Maryland from records originally collected by the Pinkerton Agency over the period -. That data was not available for the present study. The Center for the Study of Terrorism and Responseto Terrorism was established in early at the University with a Center of Excellence grant from theDepartment of Homeland Security.

4 The main keywords used include all word forms of terror; a secondary pass was conducted keying the var-ious terrorist tactics of political violence: massacre, abduct, kidnap, hostage, assassinate, bomb, and hijack.
5 The TERROR variable covers a slightly longer period of time than the CPV variable; it includes year data for the months prior to the / attacks.
64
have crossed an international border; it does not include acts of terrorism where both theactor and target reside within the same country. As such, international (or transnational)terrorism is assumed to represent only a small portion of the global problem of terror-ism. In order to construct an indicator of the more general form of terrorism thatincludes both national and international terrorism, a new database was constructed.Terror is a psychological response that gains its peculiar social stature in the collectiveconsciousness; it is in large part, a media, and mediated, event. Evidence of terror mustnecessarily find its way into the news media and, as such, the public record. Keesing’sWorldwide publishes a monthly series, Keesing’s Record of World Events, which is a widelyrespected source for global news reports. It compiles news accounts, summarizes, andrecords what are generally considered to be the most important political events in eachcountry of the world. This resource has long been a mainstay of comparative politicalresearch in political stability and security issues. Most importantly, Keesing’s Worldwideprovides its archives in an electronic format that is keyword searchable.
Using various keyword searches of the Keesing’s archives, a comprehensive listing of allterrorist events (TERROR) was compiled covering the time period from January , ,
through September , . The cutoff date of September , , was used so thatthe sample would not be affected by changes resulting from the extraordinary responseto the September , , attacks. The Keesing’s records were then reviewed for applic-ability and duplication and then coded as discreet terrorist events. Nearly all reports pro-vided information on number of fatalities. The events were sorted according to thenature of the primary targets of the attack: civilians, political figures, or security forces.For the purposes of analysis, and maintaining consistency in our definition of terrorism,
Table 9.1: Description of Collective Political Violence (CPV) CategoriesLevel General Category Description
8 Systematic, lethal targeting of civilian populations either directly, through the use of deadlyforce, or indirectly, through restrictions on access to food, water, and/or other basic needs; thismay, but does not necessarily, occur within a context of armed insurrection (CPVCIV = 4)
7 Major, sustained, armed insurrection during which state and/or non-state militant groups reg-ularly, and indiscriminately, target civilian populations with deadly terror and intimidation tac-tics and repressive policies (CPVCIV = 3)
6 Major, sustained, armed insurrection or communal fighting without substantial evidence ofintentional targeting of civilian populations (CPVNOCIV=4)
5 Limited, localized, or sporadic major armed insurrection during which state or non-state mili-tant groups occasionally, and indiscriminately, target civilian populations with deadly terror andintimidation tactics and repressive policies and/or non-state groups engage in serious com-munal fighting (CPVCIV = 2)
4 Limited, localized, or sporadic major armed insurrection without substantial evidence of inten-tional targeting of civilian populations or serious communal fighting (CPVNOCIV = 3)
3 Limited, localized armed rebellions of limited duration or sustained campaigns of terrorist inci-dents with limited scope during which there is evidence of intentional, but largely discriminate,targeting of civilian political leaders by state or non-state militant groups or serious communalfighting (CPVCIV = 1)
2 Limited, localized armed rebellions of limited scope and duration without substantial evidenceof intentional targeting of civilian populations (CPVNOCIV = 2)
1 Small scale political violence (CPVNOCIV = 1)
0 No evidence of political violence during the 1990s
International (or transnational)terrorism is only asmall portion of the global problemof terrorism.

65
only attacks on civilians and political figures were included in the dataset used to con-struct the terrorism indicator. (Appendix B in the full report provides a listing of the
civilian and political global terrorism cases – some cases record more than oneevent). A six-point Guttman scale was designed that ranks each country according to thenumber of deaths resulting from terrorist incidents attributed to actors from that coun-try during the study period. Table . summarizes the coding rules (cut points) for theTERROR indicator.
Table 9.2: Description of the Global Terrorism (TERROR) Indicator
Level General Category Description
5 Greater than 1,000 deaths
4 Greater than 200 and less than or equal to 1,000 deaths
3 Greater than 100 and less than or equal to 200 deaths
2 Greater than 20 and less than or equal to 100 deaths
1 Less than or equal to 20 deaths
0 No deaths or incidents recorded
Findings. A great part of the perception of threat in terrorism must stem from theacknowledged connections between terrorism as a individuated micro-event (therestricted concept of terrorism) and terrorism as a collective macro-event (the broad con-cept of terrorism as tyranny and warfare). Terrorism may remain an isolated and radicalact of political violence or it can be an integral part of warfare. Warfare, of course, rep-resents the greatest threat to global peace and security, particularly in the age of mecha-nized and technologically-advanced weaponry. In this sense, terrorism is a global threatthrough its possible association with war. Terrorism as a specialized form of political vio-lence, by itself, is a technique of relatively minor effect. Very few examples of this tacti-cal form of terrorism have caused more than deaths (we have documented ten suchincidents in the past seven years). The highest fatality count after the , deaths result-ing from the / attacks during this seven year period is the officially acknowledgeddeaths attributed to the attack on the school in Beslan, Russia on September , . Byway of comparison, in the s there were on the order of about reported deathsper annum by international terrorism and , reported deaths per annum by acts oflocal terrorism. In contrast, according to calculations based on data from the ArmedConflict and Intervention project, there were over , deaths in the world perannum in warfare in the s, the majority of which were deaths among non-combat-ant populations affected by wars. In the period -, the period of total war amongthe advanced industrial countries, there were well over ,, deaths per annum, alarge proportion of which involved non-combatant populations caught in harm’s way.
It seems clear from this comparison of effects that the commonly understood form of ter-rorism can only be considered a global fear. However, our greatest fears can be realizedwhen the state becomes the terrorist, or when the powerful weapons created by the statefall into the hands of the evildoer. Total war and genocide are both creations of the state,as are weapons of mass destruction and weapons of mass effect. When the state takes anactive role in the cycle and process of violence and terrorism, the magnitude of terror’s tollincreases exponentially.
Terrorism is aglobal threatthrough its possibleassociation withwar. By itself, [it] is a technique of relatively minoreffect.
6 Monty G. Marshall, Third World War: System, Process, and Conflict Dynamics (Lanham, MD: Rowman& Littlefield, ), p. and n, p. .
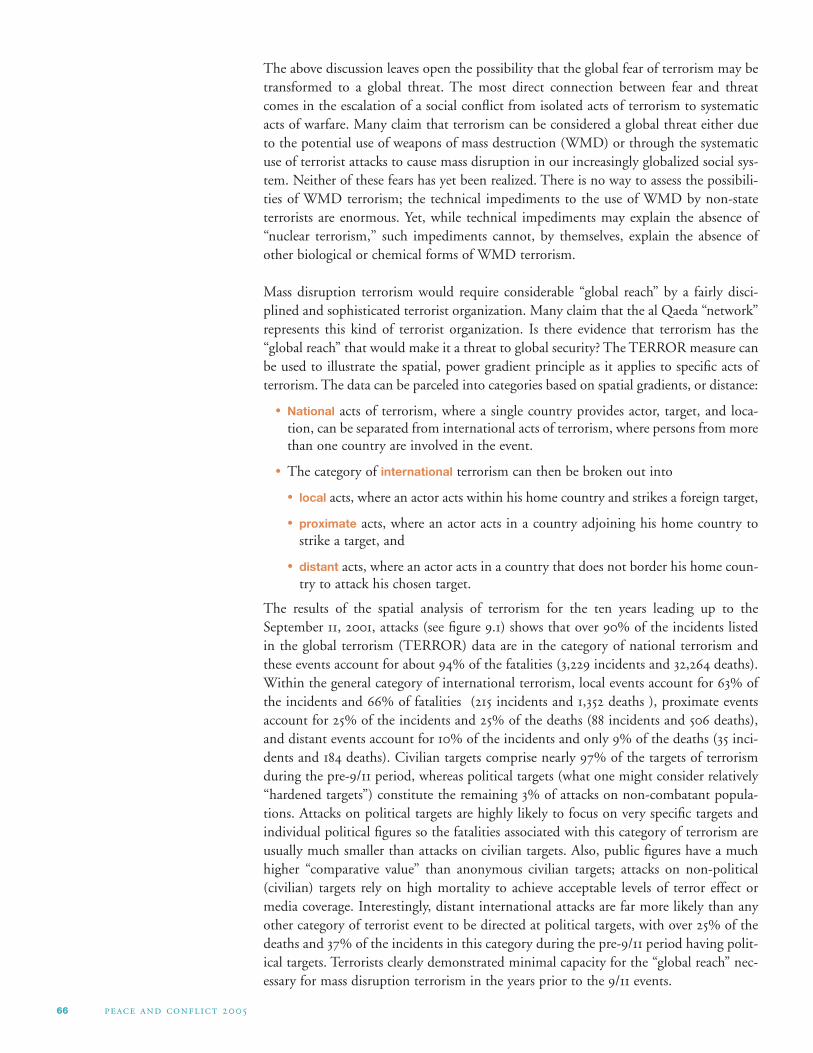
66
The above discussion leaves open the possibility that the global fear of terrorism may betransformed to a global threat. The most direct connection between fear and threatcomes in the escalation of a social conflict from isolated acts of terrorism to systematicacts of warfare. Many claim that terrorism can be considered a global threat either dueto the potential use of weapons of mass destruction (WMD) or through the systematicuse of terrorist attacks to cause mass disruption in our increasingly globalized social sys-tem. Neither of these fears has yet been realized. There is no way to assess the possibili-ties of WMD terrorism; the technical impediments to the use of WMD by non-stateterrorists are enormous. Yet, while technical impediments may explain the absence of“nuclear terrorism,” such impediments cannot, by themselves, explain the absence ofother biological or chemical forms of WMD terrorism.
Mass disruption terrorism would require considerable “global reach” by a fairly disci-plined and sophisticated terrorist organization. Many claim that the al Qaeda “network”represents this kind of terrorist organization. Is there evidence that terrorism has the“global reach” that would make it a threat to global security? The TERROR measure canbe used to illustrate the spatial, power gradient principle as it applies to specific acts ofterrorism. The data can be parceled into categories based on spatial gradients, or distance:
• National acts of terrorism, where a single country provides actor, target, and loca-tion, can be separated from international acts of terrorism, where persons from morethan one country are involved in the event.
• The category of international terrorism can then be broken out into
• local acts, where an actor acts within his home country and strikes a foreign target,
• proximate acts, where an actor acts in a country adjoining his home country tostrike a target, and
• distant acts, where an actor acts in a country that does not border his home coun-try to attack his chosen target.
The results of the spatial analysis of terrorism for the ten years leading up to theSeptember , , attacks (see figure .) shows that over % of the incidents listedin the global terrorism (TERROR) data are in the category of national terrorism andthese events account for about % of the fatalities (, incidents and , deaths).Within the general category of international terrorism, local events account for % ofthe incidents and % of fatalities ( incidents and , deaths ), proximate eventsaccount for % of the incidents and % of the deaths ( incidents and deaths),and distant events account for % of the incidents and only % of the deaths ( inci-dents and deaths). Civilian targets comprise nearly % of the targets of terrorismduring the pre-/ period, whereas political targets (what one might consider relatively“hardened targets”) constitute the remaining % of attacks on non-combatant popula-tions. Attacks on political targets are highly likely to focus on very specific targets andindividual political figures so the fatalities associated with this category of terrorism areusually much smaller than attacks on civilian targets. Also, public figures have a muchhigher “comparative value” than anonymous civilian targets; attacks on non-political(civilian) targets rely on high mortality to achieve acceptable levels of terror effect ormedia coverage. Interestingly, distant international attacks are far more likely than anyother category of terrorist event to be directed at political targets, with over % of thedeaths and % of the incidents in this category during the pre-/ period having polit-ical targets. Terrorists clearly demonstrated minimal capacity for the “global reach” nec-essary for mass disruption terrorism in the years prior to the / events.

67
The two indicators developed especially for this study attempt to measure the problemof global terrorism in both its macro-event (CPV) and micro-event (TERROR) aspects.The two scales correlate fairly strongly (.) for the countries included in thestudy. The TERROR variable correlates more strongly with the CPVCIV subset (exces-sive targeting of civilians; .) than with the CPVNOCIV subset of cases (.). Initialinvestigation provides a comprehensive correlation analysis of the target variables: CPV,CPVCIV, CPVNOCIV, and TERROR, covering the period -. The timeperiod used in calculating the correlations in the tables is somewhat arbitrary; it is sim-ply the “leading” half of the time period on which the target variables are based. All timeperiods were examined in the correlation analyses, from the s to present, as were allyears from to present. Most of the variables contained in the database are structuralvariables; these variables change very slowly over time. As such, the basic relationshipsbetween these structural variables and the target variables remain consistent and mostlyconstant over the short- to medium-term. And, as it is proposed that there are funda-mental, mutually reinforcing, simultaneous relationships among the structural, socialconflict, and political authority characteristics, we should expect the correlationsbetween key variables to track together over time. A five-year period was chosen as therepresentative sample because of differences in time coverage among the variablesexamined: some provide annual data, some biennial, some quinquennial, and somedecadal; the five-year sample captures all the variables. The early s was chosenbecause it is at once a leading and concomitant period for the target variables; evidenceto identify the “social roots” of terrorism should be strongest during this period. Not allvariables display relatively invariant relationships with the target variables; some appearto be consequential or, at least, subsequential; that is, the strength of the correlationincreases during the s (these variables are noted by a double asterisk in Appendix Cof the full study).
7 Only countries with total population greater than , are included. The U.S. Government’s PoliticalInstability Task Force compiled the global database used in this study. The Task Force is a panel of senior,academic experts and is managed by the Central Intelligence Agency. U.S. law prohibits the CIA from col-lecting or analyzing U.S. domestic information and, so, the database does not include information on theUnited States. As such, the U.S. is not included in the majority of the correlation analyses.
DistantTarget
Proximate Target Local
Target
z
x
y
Axn Local-National (3,229 events / 32, 264 deaths)
xi Local-International (215 events / 1,352 deaths)
y Proximate-International (88 events / 586 deaths)
z Distant-International (35 events / 184 deaths)
Figure 9.1: Actor-Target Relationships in Global Terrorism, 1991-2001
Terrorists clearlydemonstrated mini-mal capacity for the“global reach” neces-sary for mass disrup-tion terrorism in the years prior to the9/11 events.

68
As terrorism is intimately associated with other forms of political violence, we expectthat the “social roots” and correlates of terrorism would be quite similar to the “socialroots” and correlates of the various forms of civil warfare. In the most general terms, theresults of the analyses of the terrorism indicators closely parallel the results reported bythe Political Instability Task Force (PITF) in their analyses of state failure events, partic-ularly the three categories of civil warfare events: ethnic war, revolutionary war, andgenocide and politicide. The PITF has reported that outbreaks of these major collectivepolitical violence events are strongly associated with various measures of:
• poverty, underdevelopment, and maldistribution of resources (e.g., higher infantmortality, lower GDP per capita, political discrimination, lower levels of generaleducation, lower health expenditures, lower calories per capita, poorer sanitation);
• weak regimes and poor governance (e.g., weak autocracies, partial democracies,ineffective legislatures, newly constituted regimes);
• poor regional integration (e.g. low openness to trade, low memberships in regionalorganizations, low trade with neighboring countries); and
• bad neighborhoods (e.g., high number of bordering states with armed civil con-flicts, high percentage of autocratic neighbors).
These basic findings are strongly supported in the global analyses of terrorism in thes. This has important implications for policies aimed at combating terrorism. Inparticular, it emphasizes the importance of measured responses that do not contribute toan escalatory process that increases the likelihood of transformation of scattered acts ofterrorism to systematic campaigns of violence or open warfare. “War is hell” and, assuch, it tends to breed sympathy for the devil. In order to maintain the criminality ofterrorism, the tactic of terrorism must remain disassociated from the passions, rational-izations, and justifications of war.
One qualifying finding is that larger countries, in the sense of both territory and popu-lation, were somewhat more likely to experience terrorism, as it is defined in this study.Of course, this finding may be largely an artifact of the behavior under study and theways it has been measured. Larger states are more difficult to govern, especially whenundergoing development processes. And, because of the way the problem condition ismeasured, larger states have a greater probability of reaching an absolute threshold basedon numbers of deaths and of having multiple political groups to potentially engage inoppositional activity. A second such finding is that states with a high level of activity inthe global system or that straddled several regional subsystems were somewhat morelikely to be targets of international terrorism, although these states were much less likelyto be the targets of deadly acts of terrorism.
Taken together, the variables listed in the correlation tables in Appendix C of the fullreport provide a fairly broad profile of circumstances under which civilian populationsare at greatest risk of gross violations of human security and integrity.
• Demographic factors include lower life expectancy, higher male “youth bulge,” andhigher ethnic fractionalization. While higher fertility rates are associated withgreater violence against civilians, population growth is not (correlations with birth
8 For more information on the U.S. Government’s Political Instability Task Force and its research findingssee the State Failure Web site at www.cidcm.umd.edu/inscr/stfail.
These basic find-ings… emphasizethe importance ofmeasured responsesthat do not con-tribute to an escalatory process.

69
rates and death rates, not reported, are nearly equal). Religious fractionalization isnot linearly related to terrorism, although it is possible that there is a more complex,non-linear relationship that would not be detected in these simple tests.
• Human capital factors include higher infant mortality, lower health expenditures,lower general caloric intake, higher percentage of uneducated adults, and lower ratesof education of females.
• Economic capital factors include lower income, lower productive efficiency (GDPper unit of energy), lower consumption of electricity, lower access to telecommuni-cations, lower tax revenues, higher technical cooperation grants (no strong relation-ship to non-technical grants), high levels of undistributed debt, lower exports ofgoods and services, higher proportions of the work force in agriculture, and, whilethe rate of urbanization appears not to be related to violence and terrorism, theannual growth rate of large urban agglomerations is.
• Governmental performance factors include higher repudiation of contracts, higherrisk of expropriation, higher corruption, weaker rule of law, lower bureaucratic qual-ity, lower political rights and civil liberties, more exclusive or parochial leadership(ethnic and ideological), and active economic and/or political discrimination.
• Contextual factors include ”bad neighborhood” effects such as prevalence of armedconflict in bordering countries, percentage of autocratic neighbors (despite the dou-bling of democratic regimes in the s), the presence of large numbers of refugees,and a history of armed conflict and regime instability.
Factors associated specifically with excess targeting of civilian populations in armed con-flict situations and terrorism focus more on the qualities of the chief executive: fewerinstitutional constraints on executive power, the centralization of executive power in mil-itary or presidential rule, and, in particular, military regimes. Economic factors indicaterevenue extraction through higher trade duties (probably to offset limited ability toextract tax revenues), and a greater dependence on fuelwood energy (indicating lowerendowments and foreign exchange). Higher levels of excess civilian targeting appears tocontribute to escalating central government debt and higher military and arms expendi-tures while producing much greater internal population displacements and humanitar-ian crises (higher numbers of multilateral organizations intervening).
General qualities that appear to differentiate collective political violence events withexcessive targeting of civilian populations (CPVCIV) from similar events without exces-sive targeting of civilians include the following:
• exclusionary ideologies (strong ethnic and ideological character of the ruling elites,political and economic discrimination);
• militarization (military governments, high military expenditures as percent of gov-ernment expenditures, high numbers of military personnel, high arms as a percent-age of imports);
• restricted human rights (Freedom House measures of civil liberties and politicalrights);
• displaced populations (high numbers of refugees resident, high estimates of dis-placed populations); and
• protracted social violence (long time periods of sustained violent conflict).

70
There is also evidence that the targeting of civilians is associated with protracted socialconflicts and “over urbanization” (i.e., large numbers of agricultural workers and largecities with fewer middle-size urban areas). The trading patterns of states characterized byarmed conflicts with excessive civilian deaths also appear to be distorted by ) diffusetrading partners (no single, strong trading partner that might influence the state’s poli-cies); ) lower regional integration (lower trade with neighboring countries); and )higher levels of trade with autocratic countries. Unique factors that appear to distinguishthe excessive targeting of civilian populations during episodes of armed societal conflictdisplay some hints of highly autocratic and/or nationalist regimes ruling with little insti-tutional embeddedness in a general society characterized by weak civic cultures. Thesemore brutal regimes are more susceptible to extralegal changes in leadership (coups), arepoorly integrated in the global liberal trade networks (favoring, instead, trade with otherautocratic regimes), and have no major trading partner with substantial influence overtheir policies. These latter interpretations are much more speculative than the more gen-eral profiles described above but are deserving of further investigation, especially of the“British factor” that appears to figure so prominently in the avoidance of excess violenceagainst civilian populations.
An important “non-finding” is that nothing seems to strongly differentiate the TER-ROR variable from the CPV variable, and particularly the CPVCIV variable, exceptthat TERROR is much more likely to occur in the advanced industrial and post-indus-trial economies than are the higher magnitudes of collective political violence. That is,the developed states appear to be much better at managing or dampening the escalationof violence conflict than avoiding violent conflict all together. These economically andpolitically advantaged states are likely to experience much higher numbers of terroristincidents but far lower numbers of deaths. They are also more likely to be the targets ofterrorist incidents but, still, these incidents are likely to be less deadly, even when per-petrated by actors from less advantaged countries. A related finding is that the deadlyconflict profiles of newly democratized states is much more similar to that of the “old”democracies than that of the non-democracies, giving some weight to the propositionthat democracy is an advanced function of successful conflict management performance,rather than the other way around. This does not mean that all democracies are non-vio-lent and peaceful. There are several notable examples of violence-plagued democraticsocieties, for example, Colombia, India, and Israel. What appears to distinguish higherlevels of violence in otherwise democratic societies are lower quality of life measures,higher youth unemployment, political and economic discrimination, higher inflows offoreign workers, high government share of GDP, and a higher proportion of autocraciesin their immediate region. Unlike any other category of regime, “old” democracies thathave a higher involvement in international violence and wars are likely to experiencegreater levels of terrorism. In the poorer democracies, violent political conflicts are morelikely to escalate to insurrection than in the wealthier “old” democracies. In addition, alarger agricultural sector is associated with higher levels of TERROR in democracies. Amore speculative finding regards the correlation between terrorism and workers’ remit-tances: this may indicate that restricted employment opportunities for a technicallytrained sector of the population (which may be driven to seek employment in othercountries) may contribute to higher levels of frustration and dissent among “alternativeelite” populations (i.e., underemployed professionals).
“Old” democraciesthat have a higherinvolvement ininternational vio-lence and wars are likely to experi-ence greater levels of terrorism.
71
Some Observations on Post-9/11 Global Terrorism. The most important observationthat can be made regarding the problem of global terrorism is that terrorism, as we gen-erally speak of it, is a great security fear, as it is perceived at the personal level, but onlya minor threat to the “global social order.” “Being killed in a terrorist attack” ranks verynear to “being struck by lightning” as a cause of death. This does not mean that terror-ism should not be considered a grave threat to societies, however. And, it is at the soci-ety level where terrorism poses the greatest threat to the global social order. Terrorbecomes a global security threat when it opens the door to warfare and tyranny. It is onlywhen the terrorist becomes the state or the state becomes the terrorist that terrorism’s realthreat to society, and the social order, is realized. Terrorism, by itself, may disrupt dueprocess but cannot create political change; with it, the terrorist attempts to inducechange or, through it, to enforce order. Fear is a powerful instrument of politics andstatecraft. It is with the state in mind that vigilance regarding the problem of terrorismshould begin.
That being said, what can we say about trends in the problem of global terrorism fol-lowing the September attacks? One consideration is to look at the number of situ-ations of post-/ warfare in which there are excessive targeting of civilian populations(CPVCIV). Among these cases, we include the following:
• Algeria (although the numbers have been dwindling for the past two years or more);
• Democratic Republic of Congo (general lawlessness in the northeast provinces hasallowed systematic victimization of civilians; communal warfare between Hema andLendu has been particularly brutal);
• Iraq (mainly urban insurgency and sectarian fighting involving attacks by disen-franchised Sunni against recently empowered Shi’a populations has led to highnumbers of civilian casualties both directly from combat operations and indirectlythrough severe disruptions in essential services);
• Nigeria (communal warfare between Muslim and Christian ethnic groups in Plateauand Kano states have left about , dead since the late s; communal fight-ing in Delta state has been of lesser magnitude);
• Sudan (the separatist war that erupted in the Darfur region in has been char-acterized by direct, large-scale targeting of civilian populations of Muslim black-Africans by local Muslim Arab militias known as the “janjaweed”);
• Uganda (the rebels of the Lord’s Resistance Army in the north have preyed almostexclusively on civilian populations); and
• Pakistan (sectarian fighting between Sunni and Shi’a militias have targeted mainlycivilian gatherings for attacks).
There are borderline cases where civilians have paid a heavy toll in fighting between mil-itants and armed forces and in which there have been occasional attacks on civilians.This list of borderline cases includes Burundi, Colombia, India-Kashmir, Israel-Palestine, and Russia-Chechnya. The latter two borderline cases are complicated by highincidence of terrorist attacks against civilian and political targets. In addition, civiliansin Somalia continue to suffer from chronic disruptions in and lack of essential servicesas much of the country continues to struggle with conditions of general anarchy. A cur-
It is only when theterrorist becomes thestate or the statebecomes the terroristthat terrorism’s realthreat to society,and the social order,is realized.

72
sory review of current cases involving excessive targeting of civilian populations gives noindication that the “social roots” of this form of terror has changed and, so, that aspectof the earlier study has not been updated.
The second consideration is acts of terrorism. Our update of the TERROR variabledatabase from September , , through early allows us to compare post-/actor-target relations as we have for pre-/ relations (figure ., above). Two caveats tothe reanalysis should be noted: one is that only three and one-half years have elapsedsince the / attacks, so there is limited information available to establish trends, andthe second is that there is some intuitive sense that the journalistic culture for reportingterrorist events has changed in the post-/ political climate. With these caveats inmind, a number of observations regarding recent trends can be made with reasonableconfidence. One is that the profile of actor-target relationships in terrorist incidents anddeaths has not changed greatly; it maintains a structure similar to the profile docu-mented for the pre-/ decade. National terrorism continues to dominate in both num-bers of incidents and numbers of deaths. However, there is some evidence that theproportions of local-international and proximate-international events have increased,particularly the proportions for proximate-international terrorism (where militantstravel to a neighboring country to strike targets). At first glance, there is some evidenceto support the proposition that both the numbers and proportions of distant-interna-tional terrorist events has been reduced in the post-/ climate of heightened security;the proportions of distant attacks in international terrorism appears to have fallen fromabout ten percent to less than three percent. However, this observation is qualified byevidence of increasing mobility of militants, particularly in the Middle East region. Thenumber of distant-international events is underreported due to the difficulty of estab-lishing the nationality of the attacker in many cases. There is strong evidence of a risingpan-Arabist, or even pan-Islamic, component in terrorism events in this region.However, the broader scope of activity linked to increased actor mobility maintains anintensely local focus. Despite recent deadly attacks by Islamic militants on commutertrains in Madrid on March , , and commercial airliners flying out of Moscow onAugust , , militants have very rarely attacked outside their home locality, howeverbroadly defined. The most substantial change comes in the numbers and proportions ofterrorist attacks against political targets compared with civilian targets. As noted above,political targets accounted for only three percent of terrorist attacks in the s; since/, political targets account for nearly half of reported incidents and nearly one-fifth ofreported deaths. The shift toward political targets is particularly true for terrorist attacksin Iraq since the formation of an interim government by U.S. occupational authoritiesin late .
One additional method by which we can compare pre-/ and post-/ trends in globalterrorism is to focus on the subset of high profile events; these events have the greatestnews coverage and, so, our confidence in the completeness of this subset of cases is thegreatest. This method and rationale underlies the standard , battle-death thresholdfor identifying wars. To establish a high-profile set of terrorist attacks we set a fifteen-death threshold for a single terrorist attack or series of coordinated terrorist attacks.Figure . charts the numbers of deaths and numbers of events for high profile terroristattacks for seven six-month periods pre-/ and the same number of six-month periodspost-/. On first look, there appears to be a sharp increase in the trends for both num-bers of deaths and numbers of events, following a brief lull in the immediate aftermath
The most substan-tial change comes in the numbers and proportions of terrorist attacksagainst political targets… since 9/11,political targetsaccount for nearlyhalf of reported inci-dents and nearlyone-fifth of reporteddeaths.

of the / attacks. However, this increase can be explained almost entirely by the adop-tion of a highly specialized tactic of warfare by militants in five locations: Iraq (Sunniand pan-Arab), Israel (Palestinian), Pakistan (Sunni and Shi’a), Philippines (Moro), andRussia (Chechens). When events in these locations are removed from the data, the trendsshow roughly a doubling of this type of activity in the post-/ period (to about threeevents per year). The large number of attacks and deaths located in these conflict situa-tions are almost entirely accounted for by national terrorism; one of the few examples ofinternational terrorism is the car bomb attack on the UN Mission Headquarters in Iraqin August . There is scant evidence of a global terrorist conspiracy in the post-/world that would constitute a threat to global peace and security. In the concluding sec-tion of Peace and Conflict , we described the increasing violence in the Middle Eastas the beginning of an “anti-globalization rebellion.” Events since then have further rein-forced the rationale for that assessment. What the evidence points to is the spread of aspecialized tactic of warfare through the Muslim world that may be variously termed the“suicide mission” or “low-tech, human-guided, smart bomb.” What is of greatest con-cern is the use of these tactics in insurgencies. There can be no doubt that the tactic hasgained proficiency. The steep drop in the death toll in the most recent period is hopeful.As discussed in the sections on war trends (section ) and instability in Africa (section), there is evidence of a rise in armed conflicts in many Muslim countries that spanfrom west Africa across the Middle East and South Asia to the Pacific island states ofIndonesia and the Philippines. It is this general rebellion that poses the greatest threat tosocieties and, if left unchecked, to the greater global security.
Number of Deaths Number of Events
6-month periods Pre- and Post 9/11
0
200
400
600
800
1000
0
4
8
12
16
20
Number of Eventsw/o tactical cases
Number of Events
Number of Deathsw/o tactical cases
Number of Deaths
7654321-1-2-3-4-5-6-7
Figure 9.2: Trends in High Profile Terrorism, 3/11/98 - 3/10/05
There is scant evidence of a global terrorist conspiracy in the post-/ worldthat would constitutea threat to globalpeace and security.
73
9 The situation in Iraq is best characterized as an “internationalized civil war” in which foreign fighters havejoined to support a Sunni-nationalist agenda and resist foreign occupation. Although targets are often for-eign agents, terrorism remains highly localized.

74
1 0 . C O N C L U S I O N
I have met the enemy, and he is us. – Pogo (Walt Kelly)
This report offers a broad assessment of global trends in peace and conflict. Our aim, asalways, is to provide a factual examination of system performance with a policy-orientedfocus on the conjunction of conflict, governance, and development issues. If policy is tobe guided by reason, rather than reaction or ideology, periodic performance reviews arecrucial. The theme of the first edition in the Peace and Conflict series () was the over-arching complexity of global system performance. The theme of the second edition wasthe frailty and vulnerability of a global system emerging from decades of intense conflictand warfare. The theme that emerges in the edition of the Peace and Conflict seriesis the intrinsic tension between policy choices and system goals. That tension is sym-bolized in the cover design. In a world system that lacks effective central authority,responsibility and accountability are difficult to establish and, so, political leverage is dif-ficult to employ. The whole becomes the sum of its parts and everyone is both part ofthe problem and an essential component in the solution. Knowledge, communication,and comparative perspective are key tools in the management of complex socialprocesses.
The first edition of Peace and Conflict in made the highly controversial claim thatglobal warfare was in decline. In fact, it was that exact controversy that prompted us toinitiate the series. When we first approached policy makers in with our evidence ofthe dramatic decline in warfare since the end of the Cold War, most dismissed the notionout of hand; they were convinced that the world was becoming a more, not less, dan-gerous place. It was not until our claim and suggestive evidence for it were published inan op-ed article in the Los Angeles Times that the possibility of a decline in global war-fare became credible. This is a favorite anecdote of our colleague Andrew Mack, whoheaded the UN Secretary-General’s Strategy Unit at the time. It is an important anec-dote because it shows, at once, the “delicacy” of policy perspectives and the power ofmedia sensations. It is easy to lose perspective when conflict and crisis events loom solarge in media fact, and fiction. Looking from the “top down,” systematic monitoring ofconflict processes helps place wildly fluctuating and dramatic events in patterned streamsso one can better identify critical continuities and changes in those processes.
Looking from the “bottom up,” conflict processes, like globalization, have ever-widen-ing systemic effects. Local conflicts and failed states have regional and even global sys-tem impact, as evident in what we call “vortex” conflict dynamics in western and centralAfrica, south-central Asia, and the global jihadist terrorist network. Bilateral and coun-try-specific strategies of conflict management and institution-building are not adequatefor metastasizing conflicts such as these. Coordinated, multilevel international action isessential, illustrated for example by the Club of Madrid’s March Summit onDemocracy, Terrorism and Security which designed a comprehensive international strat-egy for confronting terrorism.1 Regional cooperation and activism among African stateshas been an important factor in the improving prospects for that much maligned conti-nent, noted in this report. The problem of genocide and politicide provides the mostextreme example of a local dynamic that may only be averted by external, proactive
Monty G. Marshall and Ted Robert Gurr
1 See the Club of Madrid Summit’s Web site at http://english.safe-democracy.org.
It is easy to lose perspective whenconflict and crisisevents loom so large in media fact,and fiction.

75
engagement. Similarly, an inclusive, global energy strategy may be needed to defuse ris-ing tensions within oil-producing states, and surrounding neighborhoods, driven by therapidly expanding demand for energy in the globalizing economy.
Some political observers and activists fear that the reporting positive trends may con-tribute to complacency and undermine the progress being made. From our viewpoint,the greater danger lies in the apathy that may result from the notion that global activismand international engagement have no real impact on conflict trends. Global andregional trends in conflict and peace may also be reversed by dramatic, unforeseen eventssuch as the deconstruction of the Soviet Union in - and the Islamist response tothe U.S.-led invasions of Afghanistan and Iraq. We can identify at least three kinds oflocal conflict issues that may escalate to unknowable proportions in the not-too distantfuture:
• In Asia three flash points for interstate conflict involve the two Koreas, China-Taiwan, and India-Pakistan. All have the potential for nuclear exchanges and theKorean conflict might see the large-scale use of chemical and biological weapons.Wars in either of the first two dyads is likely to prompt large-scale military responsesby the U.S. and China might well intervene in a new India-Pakistan war.
• Latin America faces economic and social tensions of unpredictable outcome. Neo-liberal economic policies in some countries have delivered (much) less than waspromised and have widened the gap between the prosperous and the poor. Theresultant political and financial crises have prompted mass protest and resignationsof several elected leaders. The larger risks are the rise of anti-democratic populism,the return of the military to politics, and a cascading collapse of seemingly resilientbut still young democracies.
• Jihadists in the Islamic world aim much of their revolutionary rage at conservativeand corrupt regimes, many of which are allied more or less loosely with the West. Itis conceivable that Islamist activists will gain political strength enough in a fewplaces in the Gulf and Central and Southeast Asia that one or a few countries couldshift toward theocratic rule, not by force but due to misguided attempts at accom-modation. New and weak democracies are vulnerable to demagogues with “clearvisions” or sweeping agendas for change. Any such transition would strengthen thejihadist claim to legitimacy and could inspire a rash of Islamist accessions to power.
We concluded in the edition of Peace and Conflict that “[m]ost of the progresstoward a more peaceful world during the first post-Cold War decade was a result ofpatient and determined political and diplomatic efforts to encourage new democracies,to promote respect for human rights, to induce regimes of all stripes to reach accom-modation with separatists and revolutions, and to negotiate settlements to internationalcrises” (p. ). This is as true now as it was two years ago. We also were concerned thenthat the use of U.S. military force in Afghanistan and prospectively in Iraq posed seri-ous risks, first by displacing armed conflict and resistance to other regions, second byfracturing the post-Cold War peace alliance that has been instrumental in managingglobal conflict.
Conflict has indeed been displaced, notably by the proliferation of the anti-U.S., anti-Western jihadist movement. International cooperation has also suffered, but the princi-ples and practices have proven resilient enough that many countries now actively
An inclusive, globalenergy strategy may be needed todefuse rising tensions within oil-producing states,and surrounding neighborhoods.

76
support nation-building work in Afghanistan and in post-election Iraq. The UnitedStates for its part has chosen to participate in joint international efforts to containnuclear proliferation in Iran and North Korea and to check genocide in Darfur.International cooperation in peace-building, in short, seems to have recovered somewhatfrom the shock of U.S.-led military intervention in the Middle East. To say that seriousdisagreements and enormous challenges remain is simply stating the obvious, but tounderestimate the overall progress being made would be a disservice to those who haveworked so hard and contributed so much.
To say that serious disagreements and enormous challengesremain is simply stating the obvious, but to underestimate theoverall progress being made would be a disservice to those who have worked so hard and contributed so much.
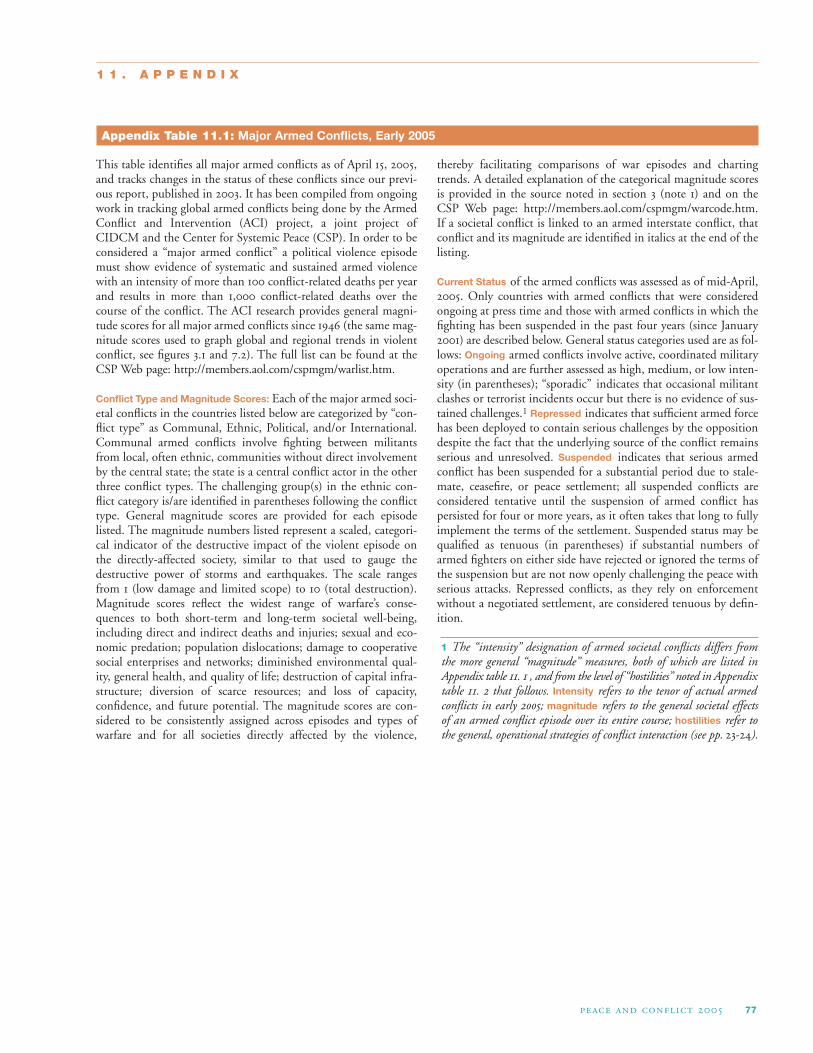
77
This table identifies all major armed conflicts as of April , ,and tracks changes in the status of these conflicts since our previ-ous report, published in . It has been compiled from ongoingwork in tracking global armed conflicts being done by the ArmedConflict and Intervention (ACI) project, a joint project ofCIDCM and the Center for Systemic Peace (CSP). In order to beconsidered a “major armed conflict” a political violence episodemust show evidence of systematic and sustained armed violencewith an intensity of more than conflict-related deaths per yearand results in more than , conflict-related deaths over thecourse of the conflict. The ACI research provides general magni-tude scores for all major armed conflicts since (the same mag-nitude scores used to graph global and regional trends in violentconflict, see figures . and .). The full list can be found at theCSP Web page: http://members.aol.com/cspmgm/warlist.htm.
Conflict Type and Magnitude Scores: Each of the major armed soci-etal conflicts in the countries listed below are categorized by “con-flict type” as Communal, Ethnic, Political, and/or International.Communal armed conflicts involve fighting between militantsfrom local, often ethnic, communities without direct involvementby the central state; the state is a central conflict actor in the otherthree conflict types. The challenging group(s) in the ethnic con-flict category is/are identified in parentheses following the conflicttype. General magnitude scores are provided for each episodelisted. The magnitude numbers listed represent a scaled, categori-cal indicator of the destructive impact of the violent episode onthe directly-affected society, similar to that used to gauge thedestructive power of storms and earthquakes. The scale rangesfrom (low damage and limited scope) to (total destruction).Magnitude scores reflect the widest range of warfare’s conse-quences to both short-term and long-term societal well-being,including direct and indirect deaths and injuries; sexual and eco-nomic predation; population dislocations; damage to cooperativesocial enterprises and networks; diminished environmental qual-ity, general health, and quality of life; destruction of capital infra-structure; diversion of scarce resources; and loss of capacity,confidence, and future potential. The magnitude scores are con-sidered to be consistently assigned across episodes and types ofwarfare and for all societies directly affected by the violence,
thereby facilitating comparisons of war episodes and chartingtrends. A detailed explanation of the categorical magnitude scoresis provided in the source noted in section (note ) and on theCSP Web page: http://members.aol.com/cspmgm/warcode.htm.If a societal conflict is linked to an armed interstate conflict, thatconflict and its magnitude are identified in italics at the end of thelisting.
Current Status of the armed conflicts was assessed as of mid-April,. Only countries with armed conflicts that were consideredongoing at press time and those with armed conflicts in which thefighting has been suspended in the past four years (since January) are described below. General status categories used are as fol-lows: Ongoing armed conflicts involve active, coordinated militaryoperations and are further assessed as high, medium, or low inten-sity (in parentheses); “sporadic” indicates that occasional militantclashes or terrorist incidents occur but there is no evidence of sus-tained challenges.1 Repressed indicates that sufficient armed forcehas been deployed to contain serious challenges by the oppositiondespite the fact that the underlying source of the conflict remainsserious and unresolved. Suspended indicates that serious armedconflict has been suspended for a substantial period due to stale-mate, ceasefire, or peace settlement; all suspended conflicts areconsidered tentative until the suspension of armed conflict haspersisted for four or more years, as it often takes that long to fullyimplement the terms of the settlement. Suspended status may bequalified as tenuous (in parentheses) if substantial numbers ofarmed fighters on either side have rejected or ignored the terms ofthe suspension but are not now openly challenging the peace withserious attacks. Repressed conflicts, as they rely on enforcementwithout a negotiated settlement, are considered tenuous by defin-ition.
1 1 . A P P E N D I X
Appendix Table 11.1: Major Armed Conflicts, Early 2005
1 The “intensity” designation of armed societal conflicts differs fromthe more general “magnitude” measures, both of which are listed inAppendix table . , and from the level of “hostilities” noted in Appendixtable . that follows. Intensity refers to the tenor of actual armedconflicts in early ; magnitude refers to the general societal effectsof an armed conflict episode over its entire course; hostilities refer tothe general, operational strategies of conflict interaction (see pp. -).

78
Angola
Political/Ethnic war with UNITA (Ovimbundu) from 1975Magnitude: 6 (suspended, March 2002)
The death of the leader of the rebel group National Union for theTotal Independence of Angola (UNITA), Jonas Savimbi, inFebruary marked a critical juncture in the devastating civilwar that has wracked Angola since its independence in .Fighting largely ended in March and the signing of a peaceagreement in August , which recommitted the rebels and thegovernment to the Lusaka Protocol, signaled a strong com-mitment to end the protracted societal war. UNITA has trans-formed to an opposition party and currently holds aboutone-third of seats in parliament; next national elections are sched-uled for . Risks remain, however, as progress remains slow indemobilizing and integrating , UNITA fighters into society,absorbing large numbers of returning refugees, establishing lawand order over large areas that remain violent and lawless, and alle-viating the abject poverty in which the majority of the populationcontinues to live (despite the fact that Angola is Africa’s secondleading producer of oil). The central government has recentlymoved to increase its control over diamond areas in the northeastand oil reserves in Cabinda.Ethnic violence with FLEC separatists (Cabindans) from 1975Magnitude: 1 (repressed, October 2002)
Cabinda is a small, oil-rich enclave separated from the Angolamainland by a narrow corridor that provides the DemocraticRepublic of Congo with coastal access. The Angolan governmenthas faced a low-intensity separatist rebellion by members of theFront for the Liberation of the Cabinda Enclave (FLEC) since thecountry’s independence. The fact that the enclave accounts forabout sixty percent of the country’s oil revenues at once fuels localresentment, as the area’s oil wealth has not benefited the Cabindanpopulation, and increases incentives for strict government control.A government offensive in October has largely silenced localmilitants, however, there have been increasing signs that locals aremobilizing to attract international attention and pressure the gov-ernment for reform through conventional means.
Liberia
Political war with LURD/MODEL from 2000Magnitude: 1 (suspended, August 2003)
The loose-coalition of rebel forces, known as the Liberians Unitedfor Reconciliation and Democracy (LURD) mounted an armedchallenge to Charles Taylor’s control of the state after enteringnorthwestern Liberia in July from bases in Guinea. A secondgroup, the Movement for Democracy in Liberia (MODEL), alsotook up arms against the Taylor regime that had gained power in following a brutal civil war that began in . The two-pronged insurgency and intense international pressure, finally cul-minating in the approach of U.S. warships, succeeded in forcingTaylor’s resignation and exile on August , . A peace agree-ment among the three contending groups, including remnants ofTaylor’s National Patriotic Party, was signed a week later. ATransitional Government was established and a UN peacekeepingmission (UNMIL) was deployed to provide security in October. Sporadic violence continued through mid-. InNovember the three factions agreed to disband their militiasand UNMIL announced later that month that disarmament wascompleted. Elections are scheduled for October .
Rwanda
Ethnic war with Interahamwe/Alir (Hutus) from 1994Magnitude: 3 (repressed, July 2001)
Tutsi rebels invaded from bases in Uganda and seized control ofthe government in following a massive genocide/politicideorchestrated by extremists in the Hutu-dominated government;the action also succeeded in driving large numbers of the HutuInterahamwe militants into neighboring regions of Zaire (nownamed the Democratic Republic of Congo, DRC). The RwandanPatriotic Army (RPA) maintained a security perimeter in the DRCthat kept the Hutu militants from staging attacks in Rwanda butpulled back in response to international pressure. In May , afaction of the Interahamwe militia, known as the Army for theLiberation of Rwanda (Alir), launched major incursions intonorth-western Rwanda. The Rwandan Patriotic Army (RPA) deci-sively quelled the attacks by July . Hutu militants maintain astrong presence in the Kivu region of the DRC and continue topose a serious threat for the Rwandan government. RPA forcesperiodically cross into the DRC in pursuit of Hutu militants, mostrecently in December .
Sierra Leone
Political war with RUF from 1991Magnitude: 3 (suspended, July 2001)
In May , a UN-brokered peace agreement, initially enforcedby British troops, was signed with the Revolutionary United Front(RUF) rebel group in the hope of ending ten years of societal war-fare. A UN peacekeeping mission (UNAMSIL) was established toprovide security (its mandate was extended through June )and in March the government’s state-of-emergency waslifted. In May general elections, generally free of violence andconsidered fair by international observers, voters stronglyendorsed the government of President Kabbah and his SierraLeone People’s Party (SLPP) that was first elected in andcredited with ending the war. In February , the governmentannounced completion of its disarmament program and, in July, the UNHCR announced the completion of its three-yearoperation to repatriate some , refugees. However, futurestability remains challenged by central government weakness,widespread poverty, lingering tensions throughout the West Africaregion, repatriation of large numbers of refugees, and tensions overcontrol of the diamond-producing region.
Sri Lanka
Ethnic war with LTTE (Tamils) from 1983Magnitude: 5 (suspended/tenuous, February 2002)
December elections, reported to be one of the island state’smost violent, resulted in the formation of a new ruling coalitionled by the United National Party (UNP). The new governmentquickly implemented its conciliatory agenda, including a willing-ness to negotiate with the separatist rebels, the Liberation Tigers ofTamil Eelam (LTTE). The two sides agreed to an internationallymonitored cease-fire in February that has held despite somescattered clashes. Negotiations, held in Norway, continuedthrough and resulted in the first formal agreement(December ) between the warring parties to commit to end-ing the war and institute a federal system in Sri Lanka. While theexpressed willingness of the LTTE to accept regional autonomywas a major contribution to the peace process, deep divisionsremain between the LTTE, UNP, and the former ruling coalition,
Countries Emerging from Major Armed Conflicts Since 2001

79
the People’s Alliance. Peace talks were suspended in April andhave not resumed. The main obstacle is the LTTE demand for anInterim Self-Governing Authority (ISGA) in the Tamil region, ademand rejected by the government as a move toward indepen-dence. In April , a mutiny by an LTTE faction led by Col.Karuna was put down by force. Tamil areas were hard hit by theDecember tsunami and the lack of cooperation betweenLTTE and government relief efforts further complicated peaceprospects.
United States
International violence with al Qaeda in 2001Magnitude: 1 (suspended/tenuous, September 2001)
On September , , two hijacked commercial airliners wereintentionally crashed, one into each of the two towers of theWorld Trade Center in New York; the skyscrapers consequentlycollapsed. One other airliner was crashed into DefenseDepartment headquarters (the Pentagon) in the nation’s capitaland another crashed into a Pennsylvania field when passengerssucceeded in thwarting the hijackers’ plans. While al Qaedaattacks against U.S. targets, mainly in Muslim countries, have con-tinued and U.S. forces are actively pursuing al Qaeda operatives inAfghanistan and Iraq and around the world, there have been nofurther attacks on U.S. territory since the / events.
Countries with Ongoing Major Armed Conflicts in Early 2005
Afghanistan
International war with the United States since 2001Magnitude: 3 (suspended/tenuous; sporadic fighting)
Fighting in Afghanistan has been decreasing substantially since theforces of the Northern Alliance, with the considerable support,including intense aerial bombardments, of the U.S. and its coali-tion forces, succeeded in ousting the Pashtun-dominated Talibanregime in late . An interim government was established inDecember . A June meeting of a Loya Jirga (the tradi-tional assembly) established the Transitional Authority (TA) andelected Hamid Karzai as interim president. A new constitution forAfghanistan was approved in January . The constitution didnot, however, address the relationship between the central govern-ment and the provinces, which remain outside of Karzai’s control.After a voter registration drive marked by considerable violence,presidential elections held in October resulted in over %turnout and victory for Karzai (%). However, a number ofobservers noted that Karzai’s victory was secured mainly fromPashtun-dominated regions. U.S. forces continue to search for,and mount attacks against, suspected Taliban and al Qaeda rem-nants, particularly along the border with Pakistan; Pakistani forcescontinue to pressure rebel forces on the other side of the border.Fighting has subsided during the harsh winter months, as usual,but remnants of the Taliban vow to resume attacks in the spring.A tentative peace seems to have been “bought,” at least over theshort-term, by allowing the resumption of opium production,which had been nearly eradicated under the Taliban.
Algeria
Political war with GIA/GSPC since 1991Magnitude: 4 (sporadic, possibly repressed, January 2005)
The Armed Islamic Group (GIA) and Salafist Group for Preachingand Combat (a splinter group of the GIA that objected to its strat-egy of targeting civilians; GSPC) continued their violent cam-paigns to undermine the secular government, rebuffing PresidentBouteflika’s offer of negotiations toward a peace settlement withthe armed wing of the Islamic Salvation Front (FIS) and rejectinghis offer of a general amnesty to all Islamic guerrillas who wouldlay down their guns. The Algerian government announced inJanuary that it had broken the resistance of the GIA and thatthe GSPC was severely weakened due to the loss of much of itsleadership and internal dissension.
Burundi
Ethnic war with FNL (Hutus) since 1993Magnitude: 4 (ongoing, low)
Peace remains elusive as efforts continue to implement the termsof the August Arusha peace accords. The peace process hasbeen bolstered by the April transfer of power within the tran-sitional government from President Buyoya (Tutsi) to PresidentNdayizeye (Hutu) under the terms of the power-sharing agree-ment and the conclusion of a comprehensive peace agreementwith the main Hutu rebel group, the National Council for theDefence of Democracy-Forces for the Defence of Democracy(CNDD-FDD) in November . A new interim constitutionwas approved in October , although several Tutsi partiesvoted against it claiming it granted too much power to the Hutumajority. The transitional government is scheduled to end inNovember following elections scheduled for April . Onlyone main rebel faction remains in armed opposition to the govern-ment in early – the Party for the Liberation of the HutuPeople-Forces for National Liberation (Palipehutu-FNL).
Colombia
Political war with FARC/ELN since 1984Magnitude: 4 (ongoing, medium)
Peace talks initiated by President Pastrana collapsed in February after more than four years of on-and-off negotiations. Thearmy recaptured the demilitarized zone that had been granted tothe rebel group, the Revolutionary Armed Forces of Colombia(FARC), in the southern part of the country. Violence had beenfairly constant throughout the negotiations, which appearedunable to bring a definitive resolution to the more than years ofcivil war. In response to the government offensive, FARC initiateda counter-offensive and, further, attempted to disrupt April elections. One of newly-elected President Uribe’s first acts was todeclare a state of emergency and, with considerable backing by theU.S., abandon negotiations in favor of counter-insurgency poli-cies; Colombia was given over $ billion in military aid by the U.S.under “Plan Colombia.” The new strategy appears to focus ondiminishing the strength of FARC by the use of military forceagainst rebel strongholds and undermining its financial base bydestroying coca crops. The smaller rebel faction, the NationalLiberation Army (ELN), has kept a low profile since . Themain right-wing paramilitary group, the United Self-DefenseForces (AUC), came under increasing pressure to disband due to

80
its reputation for serious human rights violations. AUC leaderssigned the Santa Fe de Ralito demilitarization agreement in July but has been slow to honor the terms of the agreement. Ofcourse, the one issue that most seriously complicates the conflictsituation in Colombia is control of the enormous lucrative drugtrade.
Democratic Republic of Congo
Political/Ethnic war with various regional factions since 1996Magnitude: 5 (ongoing, medium)
The Democratic Republic of Congo (formerly Zaire) has fracturedinto four distinct regions since armed rebellion first flared inSeptember forcing the fall of the long-standing and corruptMobutu regime in May . The coalition of rebel forces thatbrought Laurent Kabila to power in quickly disintegratedand violence resumed. Kabila himself was assassinated in January and was replaced by his son Joseph Kabila. The presence oflarge numbers of fighters and refugees from armed conflicts inneighboring states and the active involvement of troops from sev-eral regional states has further complicated the situation. Stronginternational pressure on the warring parties has led to a string ofceasefire and peace agreements including the Lusaka peace accordin August , negotiated withdrawals of foreign troops, and,most recently, the December power-sharing agreementsigned in Pretoria. Negotiations between the government and thetwo main rebel groups begun in February ended in early, resulting in a draft constitution calling for an all-party tran-sitional government and the signing of a peace agreement. JosephKabila was sworn in as president of the transitional government inApril ; there were to be four vice presidents—two from themain rebel groups, one from Kabila’s government, and one fromthe unarmed political opposition. Violence continued in the moreremote regions, however, especially in the northeastern province ofIturi where communal violence between Hema and Lendu peopleshas been especially brutal. Kabila’s transitional government con-tinued to face serious challenges in as it attempts to buildstrength and extend its authority across the huge country, includ-ing failed coup attempts in March and June, a military rebellion inJune, and increasing tension with Rwanda in December.
India
Ethnic war with Kashmiri separatists since 1990Magnitude: 3 (ongoing, medium)
India’s strategy of creating peace and stability in the disputedKashmir territory from within (i.e., attempting to legitimize itsadministration over the territory by holding democratic electionsand engaging in dialogue with the local authorities over self-ruleand governance issues) continued to be undermined by Muslimmilitant groups that seek to either establish an independentKashmiri state or bring it under rule by Pakistan. Attacks byIslamist militants on the Kashmiri legislative assembly in lateSeptember and on India’s parliament building in December drastically raised tensions between India and Pakistan.Persistent infiltration from Pakistan and attacks by Kashmiri sepa-ratists brought the two countries to the brink of interstate war inMay-June . While the Indian and Pakistani armies instituteda comprehensive ceasefire agreement for the Line of Control inNovember and began bilateral talks in early , separatistviolence continues to flare in Kashmir.
Political/Ethnic violence with ULFA (Bodo, Naga, Tripura)Magnitude: 2 (ongoing, sporadic)
Conflicts in India’s northeast provinces have involved many of theregion’s ethnic groups and several of these conflicts have flared intoopen violence at various times through the post-independenceperiod. Pressure over control of land and resources and encroach-ments by central authorities into traditional cultures have resultedin a complex dynamic of communal competition and rebellion.Several of the main tribal areas have been at least partly accom-modated by autonomy and regional administration agreements.Large influxes of Bengali immigrants have triggered the rise of mil-itant organizations that use violence in an attempt to limit immi-gration and maintain local control. The most active groups in have been the ethnic-Bodo militants and the UnitedLiberation Front of Assam (ULFA) terrorist group.Communal violence between Hindus and Muslims from 1991 Magnitude: 2 (suspended/tenuous, September 2002)
Widespread communal violence erupted in the western state ofGujarat in late February between Hindus and Muslims. Itwas the most intense communal rioting involving India’s two mainconfessional communities since country-wide communal riots thatwere connected with the Ayodyha Movement in the early s.The violence was sparked when a Muslim “mob” allegedly set atrain carrying Hindu activists on fire, killing people (an inquirylater found the fire to have been caused accidentally by a faultystove). Following that incident over , people, mostlyMuslims, were killed in communal rioting across Gujarat. TheBJP-dominated (Hindu-nationalist party) state administrationand police did little to quell the violence. In September anattack on the Swaminarayan Hindu temple in Gandhinagar bysuspected Islamic militants left at least people dead. Unlike theFebruary events, the Indian central government quickly steppedin, deploying approximately , army personnel to stave offanother round of retaliatory violence.
Indonesia
Ethnic war with GAM separatists in Aceh province (Acehnese)since 1997Magnitude: 1 (ongoing, low)
Following the failed implementation of a January regionalautonomy agreement, Free Aceh Movement (GAM) militants andIndonesian armed forces engaged in renewed violence. AlthoughPresident Megawati Sukarnoputri had pledged, as recently asAugust , to crush the GAM rebellion, the Indonesian gov-ernment responded to intense international pressure and signed anew regional peace and autonomy measure with the GAM leader-ship in Geneva in December . In May , the governmentimposed martial law in Aceh following the breakdown of theceasefire and the failure of peace talks in Japan. In November, newly-elected President Yudhoyono extended the state ofcivil emergency for six months. Coastal and lowland areas of Acehwere devastated by the December tsunami; the provincialcapital, Banda Aceh, was destroyed. Despite offers of a ceasefire byGAM rebels during relief operations in the province, Indonesianforces claimed to have killed rebels during offensive operationsin January . Peace talks were resumed in late January althoughthe main hurdle continues to be GAM’s insistence on, and thegovernment’s rejection of, an independence referendum.

81
Indonesia (continued)
Communal violence between Dayaks and Madurese in 2001Magnitude: 1 (suspended, March 2001)
Fighting first broke out between Madurese and Dayaks in WestKalimantan in - when people, mostly Dayaks, werekilled. Since then there have been three major massacres by theindigenous Dayaks against the Madurese, who originally emi-grated from the island of Madura in the s as part of a govern-ment-ordered relocation program. The communal conflictescalated in February and March as Dayak militants, with theavowed aim of driving them off the island, attacked Maduresecommunities, killing over , persons. As a result, more than, Madurese were evacuated by government authorities toother islands before the violence ended.Communal violence between Muslims and Christians from 1999Magnitude: 1 (suspended/tenuous, February 2002)
Muslim-Christian communal rioting first erupted in Ambon inJanuary and quickly escalated as (Muslim) Laskar Jihad mili-tias converged on the islands of the Moluccas and Sulawesi.Despite the signing of peace agreements by Christian and Muslimcommunal leaders in Sulawesi, December , and the Moluccas,February , communal clashes continued to occur through. The state of civil emergency in the Moluccas was finallylifted in September . While the peace agreement has largelyheld, sporadic episodes of violence continue, including rioting inApril and several bomb attacks in May .
Iraq
International war with the United States since 2003Magnitude: 5 (ongoing, high)
The United States, with the support of the UK, invaded Iraq onMarch , , with the stated goal of deposing the Ba’athistregime of Saddam Hussein, as it was allegedly developing WMDcapability in contravention of UN Resolutions and was refusing toallow mandated weapons inspections. The Ba’athist regime wasquickly deposed and a Provisional Authority was established onApril and an Iraqi Governing Council was established in July. Despite concerted efforts to locate them, no weapons ofmass destruction nor evidence of their development were found.Local armed resistance to the U.S.-led occupation increasedthrough the year, particularly among Sunni-Arab communitiesand former-supporters of the Ba’athist regime. Equally disruptivehas been an influx of Muslim “jihadists” from across the MiddleEast. Major armed resistance by a Shi’a militia based in Najaferupted in April and again in August before it waseffectively repressed. Insurgency in the so-called “Sunni triangle”north and west of Baghdad continued to grow through andearly , despite major offensives against the rebel stronghold ofFallujah in April and, again, in November . An interimIraqi government was installed in June and general electionswere held, as planned, on January , ; the elections were boy-cotted by most Sunni-Arabs. As expected, the majority Shi’a com-munity captured the largest number of seats in the new NationalAssembly, with the U.S.-favored secularists gaining only a smallpercentage of the vote. At this writing, efforts were ongoing toforge a ruling coalition between the two largest factions: the reli-gious Shi’a and ethnic-Kurds.
Israel
Ethnic war with PLO (Palestinians) in the West Bank and Gaza Strip since 1965Magnitude: 2 (ongoing, low)
Violent confrontations between Palestinians and Israelis have con-tinued with only short spells of relative calm since the latest out-break of the Palestinian “Intifada” (uprising) in September .Both sides have escalated their tactics, with Palestinians using sui-cide-bombings of mainly civilian targets and Israelis enforcingcontainment, mounting military invasions of Palestinian enclaves(with massive military invasions carried out in the Gaza Strip), andlaunching preemptive attacks on Palestinian militants. Particularlycontroversial has been Israel’s construction of a security wall out-side its internationally recognized border. The conflict continuesdespite a “road map” peace plan devised by the U.S. andannounced in April , and Ariel Sharon’s proposed plan forIsraeli disengagement from the Gaza Strip approved by theKnesset in October . Hopes for a breakthrough in the stale-mated situation have risen following the death of the long-timeleader of the Palestinian Liberation Organization, Yasser Arafat, inNovember and the January election of moderatereformer Mahmoud Abbas as the new Palestinian leader.
Ivory Coast
Political/Ethnic war with MPCI/MPJ/MPIGO (Muslims; Non-Ivorians) since 2002Magnitude: 2 (ongoing, low)
The current situation in Ivory Coast first began to unravel inDecember with a military coup that ousted corrupt PresidentBedie. When coup leader General Guei attempted to thwartOctober presidential elections by first disqualifying the mostpopular candidates and then nullifying the results, massivedemonstrations ensued and a little known politician, LaurentGbagbo, was sworn in as the elected president. A second, violentconfrontation occurred in December when legislative elec-tions were marred by political maneuvering. After a failed coupattempt in January , all parties pledged to work toward rec-onciliation. The reconciliation ended with an apparent coupattempt in September , which was quickly followed by thekilling of General Guei; these events triggered an eruption of openwarfare. A rebel group, calling themselves the Patriotic Movementof Ivory Coast (MPCI), seized control of several areas in the north.In November , two new groups emerged and took control ofterritory in the west: Movement for Peace and Justice (MPJ) andthe Popular Ivorian Movement for the Great West (MPIGO). TheLinas-Marcoussis peace accords, providing for a power-sharinggovernment, were signed in January and a ceasefire betweenthe northern-based rebels and the southern government was bro-kered in May . French forces were deployed to enforce theaccords. All sides in the conflict have decried lack of commitmentto the peace process and have continued to threaten violence, lead-ing to stalled implementation of the accords. In February ,the UN sent a peacekeeping mission (UNOIC) to the country. InMarch , the government violently suppressed an oppositiondemonstration. Rebel forces failed to disarm by the October deadline and the government launched air strikes on rebel posi-tions in the north, killing a number of French peacekeepers in theprocess. France retaliated by destroying the Ivorian air force,sparking anti-French and anti-foreigner attacks throughout thecountry. The human rights situation in the country continues todeteriorate and authority is fragmented among government- andrebel-controlled enclaves.

82
Myanmar (Burma)
Ethnic war with various non-Burman ethnic groups since 1948Magnitude: 4 (ongoing, medium)
The ruling military junta, the State Peace and DevelopmentCouncil (SPDC, formerly the State Law and Order RestorationCouncil), maintains its repressive hold on power, however, theSPDC has moved haltingly toward political pluralism by openingup dialogue with the main opposition movement, the NationalLeague for Democracy (NLD) under pressure from internationaldonors. The opening has not extended to relations with the vari-ous non-Burman ethnic groups residing in the border regions,which remain outside the conventional political process. Sporadicclashes with ethnic militias continue, particularly with the Shan,Karen, and Karenni groups, which have established de factoautonomy over traditional lands. The Prime Minister announcedin August that the government would convene a NationalConvention to draft a new constitution, the first phase of itsseven-step “road map” to democracy; ethnic groups meeting inFebruary at the Third Ethnic Nationalities Seminar rejectedthe “road map” and instead called for a “tripartite dialogue”between the SPDC, the NLD and other political parties, and theethnic minorities. The Karen National Union (KNU) held peacetalks with the military government in January ; a secondround of talks was held in February. It was reported in August that the SPDC had launched a military offensive againstrebels of the Karenni National Progressive Party (KNPP), theKNU, and the Shan State Army (SSA). Fresh assaults against rebelbases of the KNPP and the KNU were carried out in January .
Nepal
Political war with the UPF/CPN-M since 1996Magnitude: 2 (ongoing, medium)
The low-level insurgency, or “People’s War,” led by the UnitedPeople’s Front (UPF) and Communist Party of Nepal-Maoist(CPN-M) had operated mainly in the rural regions of the countrybut brought their war to the capital city in . The parliamen-tary government headed by Prime Minister Deuba had pursued aconciliatory approach with the rebel group since but, afterthe June murders of popular King Birendra and his immedi-ate family under suspicious circumstances and the ascension of hisbrother Gyanendra to the throne, peace talks broke down and therebels launched an offensive in November . A “state of emer-gency” was imposed. During , King Gyanendra consolidatedpower by first dissolving parliament in May and then dis-missing the entire government in October and replacing itwith an interim government comprising his supporters. That gov-ernment resigned in May amid serious and continuing pub-lic protests and the King returned Deuba to office. In August and,again, in December , the rebels imposed blockades of the cap-ital, Kathmandu. The Maoists have vowed to oust the monarchyand have demanded the formation of a constituent assembly.Fighting escalated in late and on February , , the Kingdismissed the government again and imposed a state of emergency,suspending civil liberties.
Nigeria
Communal violence between Muslims and Christians inPlateau/Kano/Kaduna states since 2001Magnitude: 3 (ongoing, low)
Since the movement to impose Shari’a law in the northern Muslimstates gained momentum in , tens of thousands have died incommunal clashes in the central plains region of Nigeria. The
clashes, mainly involving ethnic-Hausa (Muslim) and ethnic-Yorubas (Christian) but also Fulani (Muslim) and Tarok(Christian), generally diminished in but broke out onceagain in Kaduna in November and quickly spread. Seriouscommunal violence between Christians and Muslims continuedunabated through mid- but had decreased considerably in thelatter months; President Obasanjo lifted the state of emergency inNovember .Communal violence between Itsekeri and Ijaw in Delta state since 1997Magnitude: 1 (ongoing, sporadic)
Ethnic tensions between the Itsekeri and Ijaw in the oil-producingDelta state have erupted in deadly violence on several occasions inrecent years. Oil revenues have not benefited local peoples andenvironmental degradation has raised serious grievances amongthe Ijaw, who claim that the government has favored the Itsekeriin local politics. In , the Nigerian government and local oiloperations faced challenges by the ethnic-Ijaw Niger Delta People’sVolunteer Force (also known as the Egbesu Boys after the Ijaw godof war), which threatened to attack oil installations and wage“total war” against the government unless self-determination wasgranted the Ijaw people.
Philippines
Ethnic war with MILF/Abu Sayyaf (Moros) since 1972Magnitude: 3 (ongoing, low)
The transition of power from President Estrada to his vice-presi-dent Gloria Macapagal Arroyo prompted a significant change inthe government’s policy toward the Moro Islamic Liberation Front(MILF), which broke from the main Moro National LiberationFront (MNLF) following the latter group’s signing of a peaceagreement and continued to seek an independent Muslim state inMindanao. In Estrada had adopted a hard-line policy againstthe MILF and launched a military offensive against them. Arroyo,however, initiated a more conciliatory path. Peace talks betweenthe government and MILF began in May and a cease-fire wassigned in August . The peace process stalled, however, in early as a splinter, extremist group, Abu Sayyaf, staged high profileattacks on civilian targets and the United States extended its globalwar on terrorism to the Philippines. Malaysia acted as broker fortalks between the government and the MILF leadership and, inSeptember , sent a monitoring team to monitor a ceasefirebetween the two sides. The government and the MILF had in July agreed to cooperate against kidnapping gangs and theIslamic terrorist group Jemaah Islamiah (JI). Fighting continueswith the extremist Abu Sayyaf faction.
Russia
Ethnic war with Chechen separatists since 1994Magnitude: 4 (ongoing, medium)
The armed conflict between the Russian government and sepa-ratist rebels in the republic of Chechnya that had originally begunin and ended with de facto autonomy for the enclave in resumed in autumn when rebels staged attacks in neighbor-ing Dagestan. The continuing war has defied Russia’s concertedattempts to crush the resistance and contain the fighting. Failureto contain the rebels has led to increased friction with neighboringGeorgia, which has been accused of harboring rebel forces, andperiodic attacks by militants in neighboring regions, the most seri-ous incident being an attack on a school in Beslan, North Ossetiaon September , , that resulted in over deaths (officialcount; actual numbers may be much higher). Chechen militants

83
have mounted several deadly terrorist attacks as far away asMoscow over the course of the conflict, including the seizure of hostages in a Moscow theater in October (that endedwith Russian troops storming the theater and resulted in over dead, including all the militants), a metro train bombing thatkilled in February , and simultaneous commercial airlinerbombings in August that killed persons. Chechen rebelslaunched attacks into the Russian republic of Ingushetia in June, raiding arms depots and briefly occupying the IngushInterior Ministry, killing the acting Ingush Interior Minister andnearly others (mostly police and security forces).
Somalia
Ethnic war among various Somali clans and warlords since 1988Magnitude: 5 (ongoing, sporadic)
Sporadic armed clashes continued to plague Somalia in ;many of the more serious factional clashes continue to occur in thecapital city, Mogadishu, which has been carved up among rivalwarlords since the ouster of the Barre regime in . Variousregions of Somalia have emerged with fairly stable regional admin-istrations, including Somaliland (), Puntland (), andSouthwestern Somalia (). A Transitional NationalGovernment (TNG) was formed in September but it failedto establish any effective authority inside Somalia. In the mostrecent attempt to reestablish a central authority, a peace agreementincluding all the main warlords and feuding factions, was signedin Nairobi, Kenya on January , , providing for a -mem-ber transitional legislature and a referendum on a new constitu-tion. Fighting broke out along the border between Somaliland andPuntland in September and in the southern port of Kismayo.In October , the President of Puntland, Col. Yusuf, waselected President of the new transitional government. The variousregional administrations and warlords were slow to concedeauthority to the new government and it remains unclear whetherit will be able to establish authority inside the country.
Sudan
Ethnic war with SLM/A/JEM separatists (Muslim Black-Africans) in Darfur since 2003Magnitude: 4 (ongoing, high)
Darfur, one of Sudan’s most isolated regions, has experienced com-munal violence in the past but no organized armed group operatedin the area until the emergence of the Darfur Liberation Front(DLF) (subsequently renamed the Sudan LiberationMovement/Army—SLM/A) and the Justice and EqualityMovement (JEM) in February . The harsh response of theSudanese government and its support of Arab “janjaweed” mili-tias, accused of massive human rights violations, brought interna-tional condemnation of the ethnic cleansing being carried out inthe region. Escalating violence in Darfur has claimed tens of thou-sands of lives and resulted in massive refugee flows. The humani-tarian situation in Darfur continued to decline despite a ceasefirecalled in early . Under threat of international sanctions, thegovernment had agreed to disarm the militias and allow humanrights monitors in the area, but little progress had been made byearly .
Ethnic war with the SPLA (Non-Muslim Black-Africans) since 1983Magnitude: 6 (suspended, October 2002)
Fighting has ceased between the government of Sudan and themain rebel group, the Sudan People’s Liberation Army (SPLA),since a comprehensive ceasefire was signed in October . Thewar had continued through the summer of , despite peacetalks and the signing of the Machakos Protocol in July stat-ing agreement on a self-determination referendum for southernSudan after a six-year interim period. Numerous rounds of peacetalks held throughout and finally resulted in a compre-hensive peace agreement signed on January , , establishing apermanent ceasefire between the rebels and the Sudanese govern-ment. The agreement, characterized as “one of the most complexpeace deals in history,” hopefully brought an end to a twenty-yearcivil war.
Uganda
Political/Ethnic war with LRA (Langi and Acholi) since 1986Magnitude: 1 (ongoing, low)
The conflict in north Uganda defies conventional analysis as themain rebel group, the Lord’s Resistance Army (LRA), has estab-lished a fairly secure base of operations in the troubled area acrossthe border in the Sudan. The LRA has been preying mainly on thevery large refugee and internally displaced populations in theregion. A December agreement between Sudan and Ugandato cooperate in lessening the strength of armed rebel factions inthe border regions led to a March agreement allowingUganda armed forces to attack LRA bases in south Sudan. Oneimmediate result of the Ugandan offensive in Sudan was anincrease in LRA attacks in north Uganda. The March agree-ment was extended in December to allow Ugandan forcesaccess to Sudan territory until the end of January . Despite a-day ceasefire and high-level peace talks in late , the gov-ernment and the LRA failed to reach agreement on a long-termceasefire and extended peace negotiations. LRA rebels ambushedan army unit in northern Uganda in January , promptingPresident Museveni to order the resumption of full-scale opera-tions against the rebels.

84
Country and Group Status in Winter 2004-05 Periods of Armed Conflict Current Phase
Appendix Table 11.2: Armed Self-Determination Conflicts and Their Outcomes, 1955-2004
North Atlantic
France: Corsicans Ongoing: A coalition of nationalist groups wins 8 seats in Corsican regional assembly elections 1976-present in March 2004. Referendum on greater autonomy in exchange for an end to violence provesLow-level hostilities since 2001 inconclusive in July 2003; a government crackdown ensues. Divisions emerge within the rebel
movement as moderates declare a November 2003 unilateral ceasefire but a faction continues to utilize low-level violence.
Spain: Basques Ongoing: The Basque regional government approves autonomy plan that calls for a referendum1959-present on self-determination. Spain rejects the proposal and refuses to engage in negotiations with theLow-level hostilities since 1999 banned political wing of ETA. ETA resumes symbolic bombings in late 2004 after recent opera-
tions by Spanish and French authorities weaken the organization. Some jailed ETA leaders call for an end to violence.
United Kingdom: Catholics Settled: Protestant party that opposes the Good Friday Agreement wins the largest number of (Northern Ireland) seats in November 2003 elections for the Northern Ireland assembly. Catholic and Protestant1969-94 leaders meet throughout 2004 in an attempt to revive the peace process. Disagreement hinges Contested agreement 1998 on Protestant demands for photographic evidence of complete IRA disarmament.
Former Socialist Bloc
Azerbaijan: Armenians Contained: The OSCE and Russia lead efforts to break the stalemate in the negotiations1988-97 between Armenia and Azerbaijan. De facto autonomy of Nagorno-Karabakh region. Hundreds ofCessation of open hostilities since 1997 thousands remain displaced. Azerbaijan repeatedly threatens to use force to resolve the impasse.
Bosnia: Croats Contained: Creation of confederal Bosnian state and collective presidency in 1995. UN 1992-95 mandate designed to ensure equality of government is implemented, Croats recognized as Contested agreement 1995 constituent peoples. Hard-line nationalists representing each ethnic group win October 2002
elections in Bosnia. International forces continue to enforce agreement; NATO hands over peacekeeping duties in December 2004 to a European-led force. Key issues that remain include weapons smuggling, the arrest of war criminals, and border security. Most refugees returned home and 90% of destroyed infrastructure rebuilt.
Bosnia: Serbs Contained: (See Bosnia: Croats, above.) Serbs recognized as constituent peoples, but continue1992-95 to demand more representation, greater autonomy, and amnesty for some war criminals. InContested agreement 1995 December 2004, some Serbian officials are dismissed for impeding hunt for war criminals. Plans
to create central defense and police forces proceed despite Serbian efforts to maintain separate administrations.
Croatia: Serbs Contained: Many Serbs who fled fighting in the early 1990s remain refugees and issues regard-1991-95 ing their return, property restitution, and the resettlement of Croats in Serb areas remain. ThoseConventional politics since 1996 that return subject to economic and social discrimination. In November 2004, Serbia and Croatia
sign an agreement on the protection of minority rights. Human rights organizations criticize Croatia for not addressing crimes against Croatian Serbs.
Georgia: Abkhazians Contained: Disputed presidential elections to be held in early 2005. Russia mediates a power-1992-93, 1998-2002 sharing agreement between pro-Georgian and pro-Russian leaders after the results of the firstCessation of open hostilities contested elections in October 2004 are annulled. Supporters of opposing factions temporarilysince 2002 occupy government buildings in late 2004. A November 2002 ceasefire holds; negotiations are
expected to resume in early 2005. Key issues include confidence-building measures, the returnof refugees, and economic cooperation.
Georgia: South Ossetians Contained: Fighting erupts in mid-2004 as Georgia seeks to assert its territorial integrity by1991-93 deploying troops in the region. A new ceasefire is reached in November but both sides have Cessation of open hostilities yet to complete demilitarization of key conflict zone. Russia and the OSCE continue efforts to since 2004 promote a settlement that provides effective autonomy and the return of refugees. Georgia
now refers to the dispute as a problem between Georgia and Russia; Russian peacekeepers remain in the region.
Macedonia: Albanians Settled: Hard-line Macedonian nationalists sponsor a November 2004 referendum that seeks 2001 to repeal decentralization measures; it fails due to low voter turnout. Parliament approves legis-Contested agreement 2001 lation to redraw local boundaries to provide greater autonomy in Albanian-majority areas. In
2001-2002, Albanian is declared as an official language along with reforms to increase Albanianaccess to public sector jobs. NATO-overseen disarmament process is completed in November2001 after the ethnic Albanian National Liberation Army (NLA) launched its attack against Macedonian security forces in January 2001.
Moldova: Gaguaz Settled: Autonomous region is created in 1995. Communist party assumes control after regional1991-92 elections in 2003. Gaguaz nationalists form political parties to counteract efforts to limit opposi-Conventional politics since 2003 tion activities. Economic development remains a significant issue.

85
Moldova: Trans-Dniester Slavs Contained: Tensions escalate in the summer of 2004 as Trans-Dniester authorities temporarily1991-97 force some Moldovan-language schools to close. The Moldovan government retaliates withContested agreement 1997 economic sanctions. A Russian proposal to maintain a permanent military presence in the
region is shelved after mass protests in Moldova. The withdrawal of Russian forces and arma-ments is halted in late 2003 after initial withdrawals in 2001. The OSCE, Russia, and Ukrainecontinue to mediate between government demands for an asymmetric federation and Dniesterclaims for equal status.
Russia: Chechens Ongoing: Hostilities escalate in 2003-04 as Chechen rebels are reported responsible for a1991-present hostage-taking at a Moscow theatre and suicide bombings in the Russian capital. RebelsHigh-level hostilities since 1999 engage in repeated attacks against Chechen government authorities including the assassination
of the Moscow-allied Chechen President in May 2004. The massacre at a North Ossetianschool in September 2004 is also attributed to militants with links to the Chechens. Humanrights groups criticize a March 2003 referendum in Chechnya that favors inclusion in theRussian federation.
Serbia and Montenegro: Albanians Contained: Ethnic-Albanian rebels begin offensive against Yugoslav security forces in 2000 in2000-2001 Presevo region bordering Kosovo. NATO brokers peace deal in May 2001 that calls for rebelContested agreement 2001 groups to dissolve and Yugoslav armed forces to leave the Presevo area. Serbian forces still in
the region in late 2004 and ethnic Albanians assert that restrictions on their movements remainalong with limitations on the use of their national symbols. Albanian political parties demandautonomy and for the status of the Presevo region to be determined alongside the fate ofKosovo. Sporadic violence between Albanians and Serbs continues in the southern region.
Serbia and Montenegro: Contained: Clashes between Serbs and ethnic Albanians in March 2004 result in the worst vio-Kosovar Albanians lence since 1999. The first direct talks between Serbian and Kosovo Albanian leaders since1998-99 1999 are held in October 2003. Serbs boycott the October 2004 regional elections in which aCessation of open hostilities pro-independence party emerges victorious. Kosovo administered jointly by UN, NATO, and thesince 2004 elected Kosovar legislature; security provided by NATO peacekeeping force. Talks on the final
status of the region to be held in mid-2005.
Yugoslavia: Croats Settled: Croatia independent since 1991. Nearly all remaining Yugoslav Croats reside in1991 Vojvodina, a region which has an ethnic-Hungarian majority. Vojvodina leaders again press forIndependence broad autonomy in late 2004 and for protection of the region’s minority peoples.
Yugoslavia: Slovenes Settled: Slovenia independent since 1991.1991Independence
Latin America and the Caribbean
Nicaragua: Indigenous Peoples Settled: Autonomy granted to two Atlantic Coast regions in 1988. Miskitos revive threats toand Creoles secede in 2002 citing lack of development in region, government and foreign corporations’1981-88 infringement on indigenous lands and resources, and the group’s lack of political power overContested agreement 1988 own affairs. In 2003, the indigenous peoples demand some $100 million in compensation for
the forcible displacement of 8,500 Miskitos during the internal war.
Asia and the Pacific
Afghanistan: Tajiks Contained: Interim administration is replaced following national elections in October 2004. A key1979-92, 1996-2001 Tajik leader loses bid for the presidency to the favored Pashtun candidate. Earlier in the year, Low-level hostilities since 2002 the loya jirga or grand council approves a new constitution. International forces assist the new
government with maintaining order in the Kabul area. Rival ethnic warlords continue to control regional enclaves. The Taliban remains active in the south and the east despite being ousted by U.S.-led coalition in late 2001. Episodic fighting between Uzbeks and Tajiks for control over certain northern towns underway since August 2002.
Afghanistan: Uzbeks Contained: (See Afghanistan: Tajiks above). Former Uzbek rebel commander fails in bid for 1996-2001 the presidency. Episodic fighting between Uzbeks and Tajiks for control over certain northern Low-level hostilities since 2002 towns underway since August 2002.
Bangladesh: Chittagong Hill Peoples Settled: A minor rebel faction that seeks independence engages in sporadic attacks against 1975-96 state authorities and former rebels. Dhaka government provides loans and grants to rehabilitate Contested agreement 1997 rebels along with initiating development projects in the region. Aspects of the peace accord
remain unfulfilled; of particular contention is the continued presence of the army in the hill tracts.
China: Tibetans Contained: Envoys of the Dalai Lama visit Tibet and China in May 2003 and September 2004. 1959-67 Dialogue between Chinese authorities and the Tibetans first initiated in September 2003 after Militant politics since 1996 almost a decade of suspended negotiations. The Tibetan government in exile in Dharamsala,
India elects its first Prime Minister in 2001. Chinese repression, which first escalated in Tibet in the mid-1990s, continues. The Tibetan culture and religion are targeted. Influxes of Han Chinese are ongoing along with efforts to promote economic development.
Country and Group Status in Winter 2004-05 Periods of Armed Conflict Current Phase

86
China: Uighers Contained: Widespread repression and cultural discrimination since the mid-1990s escalate in 1990-2003 the wake of September 11, 2001 as UN Security Council supports China’s claim that Uigher Militant politics since 2003 separatists are an international terrorist organization. Thousands are arrested, key Uigher lead
ers are executed, and reports indicate the use of forced labor camps. Some Uighers who flee to neighboring states are forcibly returned.
India: Assamese Ongoing: Efforts to open negotiations stall on government demands that rebels cease their vio-1990-present lence and Assamese militants’ desires for the inclusion of the option of sovereignty. Thousands High-level hostilities since 1990 protest in December 2004 urging rebel groups to open peace talks. Violence continues despite
a late 2003 Bhutanese initiative to eliminate rebel camps and sanctuary in its territory.
India: Bodos Contained: 2003 accord creates an autonomous Bodo council following sustained negotiations 1989-2003 with one rebel group. Federal funds promote job creation opportunities for former rebels and Contested Agreement 2003 the development of infrastructure. Remaining rebel faction that seeks independence announces
a unilateral ceasefire in October 2004. Elections to the regional council slated for early 2005.
India: Kashmiri Muslims Ongoing: Negotiations are initiated between India and Pakistan following their military standoff 1989-present in June 2002. A ceasefire across the Kashmiri Line of Control has held for more than a year. IndianHigh-level hostilities since 1989 authorities open talks with Kashmiri rebel leaders who are allowed to meet with Pakistani
politicians. Kashmiri representatives press for tripartite talks with India and Pakistan. Kashmiris remain divided over the objectives of widespread autonomy or independence. In November 2004, India announces the first reduction of troops in Kashmir since the insurgency began.
India: Mizos Settled: Separate federal state of Mizoram created in 1986; former rebel group joins political 1966-84 process and wins state elections the following year.Implemented agreement 1986
India: Nagas Contained: State of Nagaland created in 1963; fighting resumed in 1972. Ceasefires with Isak-1952-64, 1972-2001 Muivah rebels since 1997 and Khaplang faction since 2001. Autonomy talks underway since Cessation of open hostilities 1997. Naga leaders visit India in January 2003 for talks. Large-scale federal funding provided forsince 2001 development in Nagaland. Attempts to extend potential Naga areas of self-rule to include seg-
ments of neighboring states lead to widespread protests and minor violence throughout 2003. Sporadic clashes continue between Naga factions.
India: Scheduled Tribes Ongoing: Peace talks begin with one segment of Marxist rebels in late 2004 following a June1960-present ceasefire. Violent hostilities continue in a number of other Indian states. Tribals also utilize con-Low-level hostilities since 1960 ventional means to press for autonomy and integration into the political system.
India: Sikhs Settled: Insurgency contained by 1993; Punjabi moderates win state elections in 1992 and 19971978-93 but lose power in 2002. Police report arrests of separatist leaders. Former militants form Contested agreement 1992 political party in April 2004 to pursue peaceful campaign for independent state. A Sikh becomes
India’s Prime Minister following the 2004 federal elections.
India: Tripuras Ongoing: Separate federal state of Tripura created in 1972. Most members of one rebel faction 1967-72, 1979-present enter a ceasefire agreement in April 2004; however, their demands for assuming the Chief High-level hostilities since 1980 Minister position in Tripura are rejected. Little improvement in the law and order situation as
other rebel groups agitate for an autonomous homeland. Kidnappings, village raids, immigrant killings, and clashes with army continue.
Indonesia: Acehnese Ongoing: Hostilities re-emerge in May 2003 after more than a year hiatus following the negotia-1977-present tion of an interim peace accord in December 2002. Talks collapse in May 2003; the internationalHigh-level hostilities since 2003 observers are withdrawn from Aceh and martial law is imposed as Indonesia engages in a large-
scale military campaign against the rebels. In 2004, Jakarta rules out any foreign involvement and suggests that special autonomy form the basis of any future talks. A segment of the rebels still favors independence. Despite heavy casualties, rebel forces maintain attacks against state authorities.
Indonesia: East Timorese Settled: East Timor independent since May 2002. The UN assistance mission is extended until 1974-99 May 2005. Elections are also slated for 2005. Refugee repatriation is largely complete. Independence Negotiations between Indonesia and East Timor continue on demarcation of their common bor-
der and how best to address human rights violations that occurred during the 1999 referendum on self-determination. Some pro-Indonesian militias remain armed.
Indonesia: Papuans Ongoing: Level of violence increases in Irian Jaya province since 2000 as Papuans continue to 1964-present demand East Timor-like independence referendum. It is alleged that the government is using Low-level hostilities since 2000 East Timor style militia groups to further regional hostilities. Proposals include granting the
region special autonomy and dividing it into two provinces. Large-scale migration to Irian Jaya still underway. No substantial talks are held since 2001.
Laos: Hmong Ongoing: Long-running anti-communist insurgency that was re-ignited in mid-2000 is largely 1945-79, 1985-present repressed by late 2004. Sporadic rebel attacks reported as hundreds surrender. Repression Low-level hostilities since 2004 campaign alleged to include resettlement programs, starvation, rape, and ethnic cleansing.
Restrictions on entry in Hmong areas limit available information.
Country and Group Status in Winter 2004-05 Periods of Armed Conflict Current Phase

87
Myanmar: Chin/Zomis Ongoing: Human rights organizations document religious persecution, torture, forced labor, and 1985-present forced displacement in areas where the Christian Chins reside. One rebel faction agrees to open Low-level hostilities since 1985 talks with the junta but the offer is withdrawn following the arrest of pro-democracy leader Aung
San Suu Kyi in 2003. The Chins are one of the few groups yet to reach a ceasefire with the junta.
Myanmar: Kachins Settled: 1994 ceasefire agreement allows Kachins to retain weapons and control some areas. 1961-94 Reports of infrastructure development in group areas also include mention of widespread defor-Uncontested agreement 1994 estation. Divisions among the Kachin groups emerge in January 2004 but they are resolved by
year’s end.
Myanmar: Karenni Ongoing: Ceasefire agreement in 1995 crumbled quickly as the military resumed offensive 1945-present against the Karenni. Rebel groups hold preliminary talks with the government in November 2002;Low-level hostilities since 2003 meetings scheduled for April 2004 are postponed. Clashes between the two sides continue.
Myanmar: Karens Ongoing: A December 2003 ceasefire between the junta and the Karen is violated as sporadic 1945-present clashes continue. Negotiations between the two sides are halted after the change in the High-level hostilities since 1949 Burmese leadership in October 2004. The new junta leaders maintain that they will continue the
negotiation process; however, reports in late 2004 indicate an intensification of repression in Karen areas and the displacement of thousands into neighboring Thailand.
Myanmar: Mons Settled: 1995 ceasefire agreement allowed Mons to retain weapons and control some areas. 1975-97 Last major rebel faction surrendered in 1997, but some smaller separatist factions continue spo-Contested agreement 1995 radic violence. The Mons are active participants in the broader pro-democracy struggle in
Myanmar.
Myanmar: Rohingyas Contained: Some rebel factions are reported to be active despite a 1994 ceasefire agreement 1991-94 reached with a major rebel group. Tens of thousands of Muslim Arakanese (Rohingya) refugees Contested agreement 1994 remain outside Burma. Others who have returned report being subject to forced labor, restric-
tions on movement, and economic oppression.
Myanmar: Shan Ongoing: Rebel factions continue to attack state authorities despite a 1996 ceasefire agreement1962-present reached with some Shan members. No negotiations are held with the hold-out rebels. Large-High-level hostilities since 2000 scale suppression in Shan state in effect since the mid-1990s.
Myanmar: Wa Settled: Largest Wa group continues to abide by 1989 ceasefire agreement and forms coalition 1989 with Burmese armed forces. In an effort to improve relations with Thailand and the United Contested agreement 1989 States, the main Wa organization asserts that it will ban all opium production in Wa areas by the
middle of 2005. Border clashes with Thai troops trying to stem the drug trade in Wa-dominated areas are reported.
Pakistan: Baluchis Ongoing: New rebel organization emerges to challenge dominance of ruling Punjabi elites along 1973-77, 2003-present with opposing military campaign in Baluch areas which is part of the Pakistani offensive against Low-level hostilities since 2003 elements of al Qaeda. Bombings become more frequent from mid-2004 and include an attack
on the region’s leading politician. Conventional protests also held to oppose military activities in the region and to press for greater autonomy including local control over natural resources and input in development of megaprojects.
Pakistan: Bengalis Settled: Bangladesh independent since 1971.1971Independence
Papua New Guinea: Bougainvilleans Settled: Minor rebel faction opposes peace accord but abstains from the use of violence. 1989-98 Negotiations continue on the final draft of the Bougainville constitution; elections are to be held Contested agreement 2000 in early 2005. Broad autonomy is provided under a March 2002 agreement and a referendum
on independence is expected to be held in 10-15 years
Philippines: Igorots Ongoing: Clashes between Igorots and the armed forces reported in mid-2004. Also, rivalries 1976-86, 2002-present between competing group organizations result in occasional violence. Retraction of portions of Low-level hostilities since 2002 the 1986 autonomy agreement in late 2004 as the government dissolves its regional offices in
the Cordillera Administrative Region. Earlier, the budgets of three local agencies were eliminated. Some Igorot rebels allied with the communist NPA in 2002. Peace talks suspended with NPA rebels in 2004 due to the group’s demand to remove its designation as an international terrorist organization.
Philippines: Moros Ongoing: Malaysian-led international force deployed in October 2004 to monitor a ceasefire 1972-present between the government and the MILF reached in mid-2003. Sporadic clashes continue; earlier Talk-fight in 2004 ceasefire reached in 2001 also subject to numerous violations by both sides. Negotiations
expected to resume soon under Malaysian auspices. Minor Abu Sayyaf faction remains outside of the peace process. Former rebels govern the autonomous southern Muslim region. Regional elections are slated for mid-2005. Promoting peace and economic development along with the degree of autonomy in Moro areas remain sources of contention.
Country and Group Status in Winter 2004-05 Periods of Armed Conflict Current Phase
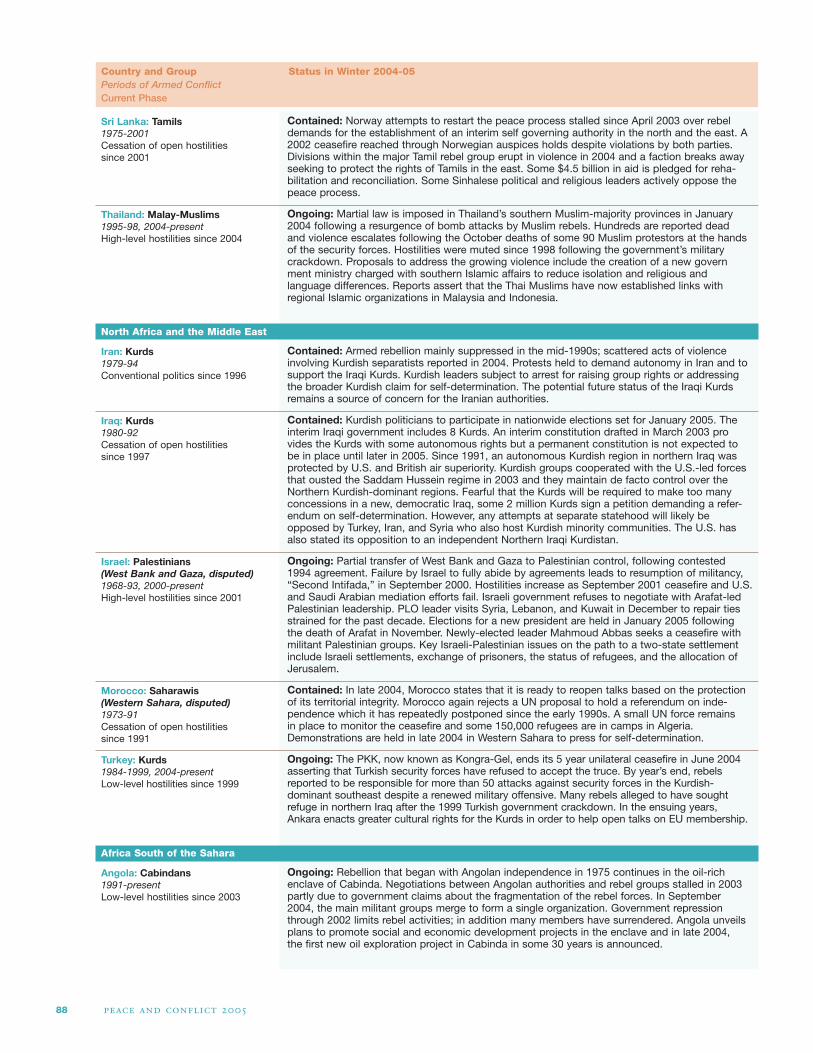
88
Sri Lanka: Tamils Contained: Norway attempts to restart the peace process stalled since April 2003 over rebel 1975-2001 demands for the establishment of an interim self governing authority in the north and the east. ACessation of open hostilities 2002 ceasefire reached through Norwegian auspices holds despite violations by both parties. since 2001 Divisions within the major Tamil rebel group erupt in violence in 2004 and a faction breaks away
seeking to protect the rights of Tamils in the east. Some $4.5 billion in aid is pledged for reha-bilitation and reconciliation. Some Sinhalese political and religious leaders actively oppose the peace process.
Thailand: Malay-Muslims Ongoing: Martial law is imposed in Thailand’s southern Muslim-majority provinces in January 1995-98, 2004-present 2004 following a resurgence of bomb attacks by Muslim rebels. Hundreds are reported dead High-level hostilities since 2004 and violence escalates following the October deaths of some 90 Muslim protestors at the hands
of the security forces. Hostilities were muted since 1998 following the government’s military crackdown. Proposals to address the growing violence include the creation of a new government ministry charged with southern Islamic affairs to reduce isolation and religious and language differences. Reports assert that the Thai Muslims have now established links with regional Islamic organizations in Malaysia and Indonesia.
North Africa and the Middle East
Iran: Kurds Contained: Armed rebellion mainly suppressed in the mid-1990s; scattered acts of violence 1979-94 involving Kurdish separatists reported in 2004. Protests held to demand autonomy in Iran and toConventional politics since 1996 support the Iraqi Kurds. Kurdish leaders subject to arrest for raising group rights or addressing
the broader Kurdish claim for self-determination. The potential future status of the Iraqi Kurds remains a source of concern for the Iranian authorities.
Iraq: Kurds Contained: Kurdish politicians to participate in nationwide elections set for January 2005. The 1980-92 interim Iraqi government includes 8 Kurds. An interim constitution drafted in March 2003 proCessation of open hostilities vides the Kurds with some autonomous rights but a permanent constitution is not expected to since 1997 be in place until later in 2005. Since 1991, an autonomous Kurdish region in northern Iraq was
protected by U.S. and British air superiority. Kurdish groups cooperated with the U.S.-led forces that ousted the Saddam Hussein regime in 2003 and they maintain de facto control over the Northern Kurdish-dominant regions. Fearful that the Kurds will be required to make too many concessions in a new, democratic Iraq, some 2 million Kurds sign a petition demanding a refer-endum on self-determination. However, any attempts at separate statehood will likely be opposed by Turkey, Iran, and Syria who also host Kurdish minority communities. The U.S. has also stated its opposition to an independent Northern Iraqi Kurdistan.
Israel: Palestinians Ongoing: Partial transfer of West Bank and Gaza to Palestinian control, following contested(West Bank and Gaza, disputed) 1994 agreement. Failure by Israel to fully abide by agreements leads to resumption of militancy, 1968-93, 2000-present “Second Intifada,” in September 2000. Hostilities increase as September 2001 ceasefire and U.S. High-level hostilities since 2001 and Saudi Arabian mediation efforts fail. Israeli government refuses to negotiate with Arafat-led
Palestinian leadership. PLO leader visits Syria, Lebanon, and Kuwait in December to repair ties strained for the past decade. Elections for a new president are held in January 2005 following the death of Arafat in November. Newly-elected leader Mahmoud Abbas seeks a ceasefire with militant Palestinian groups. Key Israeli-Palestinian issues on the path to a two-state settlement include Israeli settlements, exchange of prisoners, the status of refugees, and the allocation of Jerusalem.
Morocco: Saharawis Contained: In late 2004, Morocco states that it is ready to reopen talks based on the protection (Western Sahara, disputed) of its territorial integrity. Morocco again rejects a UN proposal to hold a referendum on inde-1973-91 pendence which it has repeatedly postponed since the early 1990s. A small UN force remains Cessation of open hostilities in place to monitor the ceasefire and some 150,000 refugees are in camps in Algeria. since 1991 Demonstrations are held in late 2004 in Western Sahara to press for self-determination.
Turkey: Kurds Ongoing: The PKK, now known as Kongra-Gel, ends its 5 year unilateral ceasefire in June 2004 1984-1999, 2004-present asserting that Turkish security forces have refused to accept the truce. By year’s end, rebels Low-level hostilities since 1999 reported to be responsible for more than 50 attacks against security forces in the Kurdish-
dominant southeast despite a renewed military offensive. Many rebels alleged to have sought refuge in northern Iraq after the 1999 Turkish government crackdown. In the ensuing years, Ankara enacts greater cultural rights for the Kurds in order to help open talks on EU membership.
Africa South of the Sahara
Angola: Cabindans Ongoing: Rebellion that began with Angolan independence in 1975 continues in the oil-rich 1991-present enclave of Cabinda. Negotiations between Angolan authorities and rebel groups stalled in 2003 Low-level hostilities since 2003 partly due to government claims about the fragmentation of the rebel forces. In September
2004, the main militant groups merge to form a single organization. Government repression through 2002 limits rebel activities; in addition many members have surrendered. Angola unveils plans to promote social and economic development projects in the enclave and in late 2004, the first new oil exploration project in Cabinda in some 30 years is announced.
Country and Group Status in Winter 2004-05 Periods of Armed Conflict Current Phase

89
Country and Group Status in Winter 2004-05 Periods of Armed Conflict Current Phase
Chad: Southerners Settled: 1997 agreements allow most factions to become political parties; some rebels inte1979-86, 1992-98 grated in army. Umbrella group of exiled armed movements and political parties, including for-Uncontested agreement 1994-97 mer southern Chadian separatists, re-open dialogue with government in 2002. Rebels form
their own political party and seek dialogue in late 2004. The government addresses economic concerns by promising to distribute the majority of oil revenues throughout the country.
Djibouti: Afars Settled: Agreement reached with major Afar faction, FRUD, in 1995. FRUD joins the ruling gov-1991-2001 ernment. Talks that began with remaining rebel faction in April 2000 end with a peace agreementUncontested agreement 2001 in May 2001, which decentralized governmental institutions, instituted a multi-party system, and
promoted rehabilitation for war-torn areas. A former FRUD member announces his candidacy for the presidential elections set for early to mid 2005.
Ethiopia: Afars Contained: Despite reports of minor clashes between rebels and the army in 2002 and 2003, 1975-1998 relations have improved since the 1998 ceasefire. Afar groups still seek to reunite Eritrea with Cessation of open hostilities Ethiopia; in late 2003 rebels attempt to disrupt Ethiopia-Eritrea border demarcation. Some Afars since 1998 favor the removal of the Tigray-led Ethiopian regime.
Ethiopia: Eritreans Settled: Eritrea independent since 1993.1961-91Independence
Ethiopia: Oromos Ongoing: 1994 regional autonomy agreement rejected by some Oromo factions seeking an 1973-present independent Oromia state. Rebellion intensifies during Ethiopia-Eritrea border war of 1999-2000High-level hostilities since 2001 and again in 2001. Joint Kenyan and Ethiopian border strikes during 2004 weaken rebel capa–
bilities. Group members alleged to receive training in Eritrea. In November 2004, rebels offer to open negotiations with the government; Ethiopia expects rebels to renounce violence first. Norway attempts to mediate but no direct negotiations arise.
Ethiopia: Somalis Ongoing: Segments of the group maintain violent struggle to achieve an independent Ogaden 1963-present state. Others accept 1994 regional autonomy agreement. Hostilities increase since 2001 as the High-level hostilities since 2001 government commits more troops to fighting Ogaden insurgency once Ethiopia/Eritrea border
conflict is diffused. No talks with the regime are reported.
Mali: Tuaregs Settled: Implementation of peace agreement largely complete. Rebels disarmed and integrated 1990-95 into army along with other Tuaregs in the civil service and teaching professions. Last splinter Uncontested agreement 1995 group lays down arms in September 2001. International investors assist development projects.
A Tuareg is Mali’s current Vice-President.
Niger: Tuaregs Settled: Sporadic violence through 2004 as some former rebels are disgruntled with the pace 1988-97 of reintegration of soldiers and economic marginalization of the north. Banditry is also reported Uncontested agreement 1995 to be a problem in northern Niger. Some fighters incorporated in the military, police, customs,
and civil service. Previous insurgent activity in late 2001.
Nigeria: Ibos Contained: Armed secessionists defeated in 1970 and reintegrated into Nigerian polity. One 1967-70 large faction still seeking separate Biafran state and utilizing protest and civil disobedience. Militant politics since 1999 Apparent split between Ibos using conventional politics and militants seeking separate state. In
2004, Nigerian regime declares that key Ibo organization is a rebel group. Ibos attempt united front to contest 2007 presidential elections.
Nigeria: Ijaw Ongoing: Niger Delta militants continue to engage in kidnappings and seizure and destruction1995-present of oil installations to press for autonomy, sharing of oil revenues, greater participation and inte-Low-level hostilities since 1995 gration into political life, and withdrawal of Nigerian armed forces from their communities.
Clashes with the armed forces also reported. No significant negotiations in late 2004; Nigerian regime rules out talks until militants disarm.
Senegal: Casamançais Settled: Sporadic violence resumes in early 2004 as minor rebel faction continues to oppose 1991-2001 peace accord while another ceases armed struggle in late 2003. Peace deal reached in 2001 Contested agreement 2001 results in the return of refugees and the reintegration of some rebels. Talks in 2003 and 2004
between some rebels and the government lead to another peace agreement. Regime announces large-scale projects to improve infrastructure in region. Former rebels transforming into political party to contest next elections.
Somalia: Isaaqs Contained: De facto regional independence of Somaliland since 1991. Somaliland government 1986-90 does not participate in ongoing Somali peace talks, claiming that the problems do not affect Cessation of open hostilities Somaliland since it is an “independent state.” Overwhelming support for independence of since 1991 Somaliland demonstrated by June 2001 referendum. Violent clashes over territorial disputes
occur between Somaliland and Puntland in October-November 2004.

90
Appendix Table 11.3: Other Self-Determination Conflicts
Group and Country Politically Active Current PhaseSince (post-WWII) (Winter 2004-2005)
North Atlantic
Belgium: Flemings Late 1950s Conventional politicsBelgium: Walloons Late 1950s Conventional politicsCanada: Indigenous Peoples Early 1960s Conventional politicsCanada: Quebecois Early 1960s Conventional politicsFinland: Saami Early 1950s Conventional politics France: Basques Late 1950s Militant politics France: Bretons Late 1940s Conventional politicsItaly: Sardinians Late 1940s Conventional politicsItaly: South Tyrolans Mid 1940s Conventional politicsNorway: Saami Early 1950s Conventional politics Spain: Catalans Late 1940s Conventional politicsSweden: Saami Early 1950s Conventional politics Switzerland: Jurassians Early 1950s Conventional politics United Kingdom: Cornish Late 1990s Conventional politicsUnited Kingdom: Scots Late 1940s Conventional politicsUnited States: Indigenous Peoples Mid 1960s Conventional politicsUnited States: Native Hawaiians Early 1970s Conventional politicsUnited States: Puerto Ricans Early 1950s Conventional politics
Former Socialist Bloc
Azerbaijan: Lezgins Early 1990s Militant politicsGeorgia: Adzhars Late 1980s Conventional politicsKazakhstan: Russians Early 1990s Conventional politicsKyrgyzstan: Uzbeks Late 1980s Conventional politicsRomania: Magyars (Hungarians) Late 1940s Conventional politicsRussia: Avars Late 1990s Conventional politicsRussia: Buryat Late 1940s Conventional politics
Country and Group Status in Winter 2004-05 Periods of Armed Conflict Current Phase
Sudan: Muslim Black-Africans Ongoing: Rebels in the western region of Darfur attack government forces in February 2003 citing(Darfur) neglect and discrimination. Retaliation by the armed forces and the pro-government Arab 2003-present “janjaweed” militias results in systematic killings and refugee flows. Ceasefires and agreements High-level hostilities since 2003 to improve humanitarian access are repeatedly violated. African Union mediators seek to pro-
mote a settlement but talks in late 2004 do not address key issues such as sharing of power and wealth in the region. The UN refers to Darfur as the worst humanitarian crisis in the world; more than 1.5 million are internally displaced or based in Chadian refugee camps. More than 70,000 and as many as 300,00 are reported dead. Some 1,000 African Union troops are in place to facilitate humanitarian assistance and help monitor ceasefires.
Sudan: Nuba Settled: The Nuba Mountains region is to be jointly administered by the Southerners and the 1985-2002 government, as part of the terms of the 2005 peace agreement (see below). The region will haveUncontested agreement 2005 its own local government that will be ruled by a governor until elections are held in three years.
The agreement follows a mid-2002 ceasefire in the Nuba Mountains region, and negotiations in 2003 and 2004 that settled the allocation of government positions and the distribution of revenues.
Sudan: Non-Muslim Black-Africans Settled: SPLM/A and the government sign a comprehensive peace agrement in January 2005.1956-72, 1983-2002 It provides for the sharing of political power, civil service positions, and the division of oil and Uncontested agreement 2005 non-oil wealth. Sharia law will not apply to non-Muslims throughout the country. The Khartoum
government is expected to withdraw close to 100,000 troops from the south within two and a half years while the rebels will pull out of northern areas within a year. A UN peace observer- mission will oversee the implementation of the accord. A July 2002 agreement allows for administrative autonomy in southern Sudan for six years after which a referendum on indepen-dence is to be held. The two sides will jointly administer three disputed areas including the Nuba mountains.

91
Group and Country Politically Active Current PhaseSince (post-WWII) (Winter 2004-2005)
Russia: Kumyks Late 1980s Conventional politicsRussia: Lezgins Early 1990s Conventional politicsRussia: Tatars Early 1960s Conventional politicsRussia: Yakut Early 1990s Conventional politicsSlovakia: Hungarians Late 1960s Conventional politicsUkraine: Crimean Russians Early 1990s Conventional politicsUkraine: Crimean Tatars Late 1960s Militant politicsUzbekistan: Tajiks Late 1980s Conventional politicsYugoslavia: Hungarians Early 1990s Conventional politicsYugoslavia: Montenegrins Early 1990s Conventional politicsYugoslavia: Sandzak Muslims Early 1990s Conventional politics
Latin America and the Caribbean
Bolivia: Highland Indigenous Peoples Early 2000s Militant politics Brazil: Indigenous Peoples Early 1970s Militant politics Chile: Indigenous Peoples Early 1970s Militant politicsColombia: Indigenous Peoples Late 1940s Conventional politicsEcuador: Lowland Indigenous Peoples Early 1970s Militant politics Mexico: Indigenous Peoples Early 1970s Militant politics Peru: Lowland Indigenous Peoples Early 1980s Militant politicsTrinidad & Tobago: Tobagonians Early 1970s Conventional politics
Asia and the Pacific
Australia: Aborigines Late 1940s Conventional politicsBhutan: Lhotshampas Early 1950s Militant politicsChina: Mongols Late 1980s Militant politicsIndia: Kashmiri Buddhist Ladakhis Late 1980s Conventional politicsIndia: Kashmiri Hindus Early 1990s Conventional politicsIndia: Reang (Bru) Late 1990s Militant politicsIndonesia: Dayaks Mid 1990s Conventional politics Pakistan: Pashtuns (Pathans) Early 1950s Militant politicsPakistan: Sarakis Mid 1990s Conventional politicsPakistan: Sindhis Late 1940s Conventional politicsSri Lanka: Muslims Mid 1980s Conventional politics Taiwan: Aboriginal Taiwanese Mid 1980s Conventional politicsVietnam: Montagnards Late 1940s Militant politics
North Africa and the Middle East
Algeria: Berbers Early 1960s Militant politicsCyprus: Turkish Cypriots Early 1960s Conventional politicsLebanon: Palestinians Early 1960s Militant politics
Africa South of the Sahara
Angola: Bakongo Early 2000s Conventional politicsCameroon: Westerners Late 1950s Militant politicsComoros: Anjouanese Late 1990s Conventional politics Congo-Kinshasa: Lunda and Yeke Late 1940s Conventional politicsEquatorial Guinea: Bubis Early 1990s Militant politicsNamibia: East Caprivians Late 1990s Militant politicsNigeria: Oron Late 1990s Militant politicsNigeria: Ogoni Early 1990s Militant politicsNigeria: Yoruba Early 1990s Militant politicsSomalia: Puntland Darods Late 1990s Conventional politicsSouth Africa: Afrikaners Mid 1990s Conventional politicsSouth Africa: Khoisan Mid 1990s Conventional politicsSouth Africa: Zulus Late 1940s Conventional politicsTanzania: Zanzibaris Early 1960s Conventional politicsUganda: Baganda Late 1940s Conventional politicsZambia: Lozi Late 1940s Militant politicsZimbabwe: Ndebele Early 1950s Conventional politics

92
Table 2.1: The Peace and ConflictLedger 2005
Model: Peace-Building CapacityRed icons are valued at “-,” yellow icons arevalued at “-,” and green icons are valued at“+?”; blanks are treated as “not applicable”data or “neutral” indicators. Icon values aresummed for each country across the sevenindicators: Human Security, Self-Determina-tion, Discrimination, Regime Type, RegimeDurability, Societal Capacity, and Neighbor-hood, and divided by the number of applica-ble indicators (i.e., number of icons listed foreach country). “Peace-building capacity” is acomposite indicator for which red icons areassigned to countries whose average indicator(icon) score is less than or equal to -; yellowicons when the average score is greater than - and less than or equal to zero; and green iconswhen the average score is greater than zero.
Data Sources: Ledger IndicatorsHuman Security – Marshall, Major Episodesof Political Violence: armed conflict totals;Minorities at Risk: rebellion and communalconflict; Harff: genocides and politicides;Gibney, Political Terrorism Scale: U. S. StateDepartment and Amnesty Internationalreport scores; Marshall and Ramsey Marshall,Global Terrorism: deaths; U. S. Committeefor Refugees, World Refugee Survey: refugeesand internally displaced persons. Self-Determination – Gurr and Khosla, self-determination movements (Peace andConflict appendix tables and ).Discrimination – Minorities at Risk: grouppolitical discrimination and group populationproportion.Regime Type – Polity IV: polity score (- to- “autocracy,” - to + “anocracy,” and + to+ “democracy”; special codes: -, -, and- are considered “anocracies”).Regime Duration–Polity IV: regime durability.Societal Capacity – Correlates of War,National Material Capabilities: energy con-sumption and total population; WorldDevelopment Indicators: GDP per capita(constant US$).Neighborhood – Marshall, Major Episodes ofPolitical Violence: number of neighboringcountries with armed conflict and sum ofarmed conflict scores of neighboring coun-tries; Political Instability Task Force: propor-tion of neighboring countries with autoc-racies or partial or full democracies.
Table 6.2: African InstabilityLedger 2005
Model: Peace-Building CapacitySee description under Table ., above.Model: Actual InstabilityRed icons denote countries that are currentlyexperiencing a period of general political
instability; periods of instability are identifiedby the occurrence of multiple instabilityevents and may include successful coups,coup attempts, adverse regime changes, majorarmed conflicts (revolutionary wars, ethnicwars, communal wars, genocides, or politi-cides), or the collapse of central authority (seetable .). Yellow icons denote countries thatappear to be emerging from a period of insta-bility, although they may continue to experi-ence sporadic incidents of low intensitypolitical violence. A period of general politicalinstability is considered to have ended (andstability re-established) when no instabilityevents are recorded in a particular country fora period of five or more years.
Model: Predicted InstabilityColor icons denote countries that are identifiedby a “predictive” model to have the combina-tion of conditions associated with countriesthat transition from a politically stable to anunstable state within three years. A red iconunder “Predicted instability” denotes a positivescore on at least one of the model equations. Ayellow icon indicates a score greater than–. and less than zero. Three binary logisticregression models were developed to distin-guish stable countries from countries thatwould transition to a period of instabilitywithin two years. One model includes all sub-Saharan African countries except South Africa;the other two models include all African coun-tries. The variables used in the models are listedin the African Instability Ledger (table .); thethree models use the same variables with onlya few exceptions.
Sub-Saharan Africa model Classification accuracy: stable () .%;unstable (), .%:. (Aid Dependency) + . (PoliticalDiscrimination) + . (Elite Ethnicity-Majority) + . (Political Factionalism) +. (State Formation Instability) + .(Population Density) + . (Area) + .(Forest Cover) + . (LeadershipSuccession) – . (Neighborhood: PartialDemocracies) – . (Neighborhood: FullDemocracies) + . (Neighborhood: ArmedConflict) + . (Muslim Country) – .
All-Africa model Classification accuracy: stable (), .%;unstable (), .%:. (Aid Dependency) – . (GDP perCapita) + . (Political Discrimination) +. (Elite Ethnicity-Majority) + .(Political Factionalism) + . (StateFormation Instability) + . (PopulationDensity) + . (Area) + . (ForestCover) + . (Leadership Succession) – .(Neighborhood: Partial Democracies) – .(Neighborhood: Full Democracies) + .
(Neighborhood: Armed Conflict) + .(Muslim Country) – .**All variables in the equations are significant at. or better, except Aid Dependency in the All-Africa model (.). Four countries areexcluded from the models because they havenever achieved stability: Angola, Nigeria, Sudan,and Uganda. Cases of instability in six countriesare excluded because they have missing data onkey variables: Djibouti, Ethiopia, Liberia,Lesotho, Somalia (), and South Africa.
State-Formation Instability Model(not included in Table .; reported inSection , p. ) Classification accuracy: stable (), .%; unstable (), .%. (Political Factionalism) + . (EliteEthnicity-Majority) + . (Elite Ethnicity-Minority) – .**All variables in the equation are significant at. or better
Data Sources: Africa Instability IndicatorsAid Dependency: World Bank, WorldDevelopment Indicators: aid as percentage ofgross capital formationGDP per Capita : World DevelopmentIndicators: GDP per capita (constant US$)Political Discrimination – Minorities at Risk:group political discrimination (percent ofpopulation facing category “official policiesor repression” only; red icon indicates % ormore of population, yellow indicates morethan % but less than % of population)Elite Ethnicity – Harff: ethnicity is salient forruling majority/minority (dichotomous, yesor no)Political Factionalism – Polity IV: politicalcompetition (categories or only; dichoto-mous, yes or no)State Formation Instability – Marshall: stateexperienced regime instability immediately fol-lowing independence (dichotomous, yes or no)Population Density – World DevelopmentIndicators: population density (people persquare kilometer)Land Area – UN World PopulationProspects: area in square kilometersForest Cover – UN FAO: forest/woodlandarea (divided by land area)Leadership Succession – Bienen and van deWalle, Leadership Duration: executive inoffice years or more ( - years denotedby yellow icon)Neighborhood: Democracies – PoliticalInstability Task Force: percent neighboringcountries are partial or full democracies (%or greater)Neighborhood: Armed Conflict – Marshall,Major Episodes of Political Violence: numberof neighboring countries experiencing anytype of major armed conflict (dichotomy;none/one or more)
Appendix Table 11.4: Model Parameters and Data Sources
This is the third report of the Center for InternationalDevelopment and Conflict Management’s IntegratedNetwork for Societal Conflict Research (INSCR) Program.It uses the latest global survey information from researchprojects on major episodes of political violence, politicallyactive minorities, and democratic governance. Support forthis research has been provided by the CarnegieCorporation, Hewlett Foundation, National ScienceFoundation, Political Instability Task Force, United NationsDepartment of Economic and Social Affairs, United StatesAgency for International Development, United StatesInstitute of Peace, and the University of Maryland’s Collegeof Behavioral and Social Sciences and Department ofGovernment and Politics.
Authors
Monty G. Marshall is Director of Research at the Center forGlobal Policy and Research Professor with the School ofPublic Policy, George Mason University. From toFebruary he directed CIDCM’s Integrated Networkfor Societal Conflict Research Program. He established anddirects the Center for Systemic Peace; he also directs theArmed Conflict and Intervention (ACI) and Polity IV pro-jects, which provide annual assessments of conflict and gov-ernance in all countries of the world. He is a seniorconsultant with the United States Government’s PoliticalInstability Task Force and consults frequently with variousgovernment agencies, international organizations, andNGOs. Dr. Marshall’s systemic theory and evidence on con-temporary societal development and conflict processes arereported in Third World War: System, Process, and ConflictDynamics (Rowman & Littlefield ).
Ted Robert Gurr is Distinguished University Professor atthe University of Maryland. In the late s he foundedthe Polity project which profiles the political institutions ofall independent countries from to the present. In
he founded the Minorities at Risk project which tracks thepolitical status and activities of more than politicallyactive ethnic groups worldwide. This study provides data forhis analyses of the causes and management of ethnopoliticalprotest and rebellion, most recently in Peoples versus States:Minorities at Risk in the New Century (United StatesInstitute of Peace Press ). Professor Gurr has been acore member of the Political Instability Task Force since its
inception in and has written or edited twenty otherbooks and monographs including the award-winning WhyMen Rebel (Princeton ) and Ethnic Conflict in WorldPolitics (Westview , with Barbara Harff ).
Contributors
Victor Asal is an assistant professor at University at Albany-SUNY and a Research Associate of the Center forInternational Development and Conflict Management atthe University of Maryland. Asal’s research focuses on theinteraction of international relations and domestic politics,notably how this interaction influences ethnic discrimina-tion, conflict, and terrorism. In addition, Professor Asalworks with the Crisis and Negotiation Group in researchingthe impact of styles of mediation on crisis negotiation usingboth empirical and experimental methods. The forthcom-ing book Mediating International Crises is a product of thisgroup work.
Barbara Harff recently retired as professor of political sci-ence at the U.S. Naval Academy. She is Visiting ProventusDistinguished Professor of Holocaust and Genocide Studiesat Clark University (fall ). Since she has been asenior consultant with the U.S. government’s PoliticalInstability Task Force and has helped establish an advisorygroup to the UN Secretary-General’s Special Adviser on thePrevention of Genocide, Juan E. Mendez.
Deepa Khosla will be Assistant Professor in theDepartment of Political Science at Memorial University inNewfoundland beginning in the fall of . A formerresearcher with the Minorities at Risk project, she was a co-author, with Ted Robert Gurr and Monty G. Marshall, ofthe Peace and Conflict report. Her research on thirdparty interventions has been published in Third WorldQuarterly (). She is also co-author with Ted Gurr of achapter on domestic and transnational strategies for manag-ing separatist conflicts in Asia ().
Amy Pate is Project Coordinator for the Minorities at RiskProject at the Center for International Development andConflict Management, University of Maryland, CollegePark, where she is a Doctoral Candidate in the Departmentof Government and Politics. Her dissertation is on ethnicrebellion in democratizing states.
Acknowledgements

CIDCMDepartment of Government and Politics, University of Maryland
Tel.: (301) 314-7703 Fax: (301) 314-9256
0145 Tydings HallCollege Park, MD 20742
E-mail: [email protected]://www.cidcm.umd.edu