circulating metabolic biomarkers of renal function in
TRANSCRIPT
1SCIENTIFIC RepORts | (2018) 8:15249 | DOI:10.1038/s41598-018-33507-7
www.nature.com/scientificreports
Circulating metabolic biomarkers of renal function in diabetic and non-diabetic populationsClara Barrios1,2, Jonas Zierer 1,3,22, Peter Würtz4,5, Toomas Haller6, Andres Metspalu6, Christian Gieger7,8, Barbara Thorand7, Christa Meisinger7,9, Melanie Waldenberger7,8, Olli Raitakari10,11, Terho Lehtimäki12, Sol Otero2,13, Eva Rodríguez2, Juan Pedro-Botet14, Mika Kähönen15, Mika Ala-Korpela16,17,18,19,20,21, Gabi Kastenmüller3, Tim D. Spector1, Julio Pascual2 & Cristina Menni 1
Using targeted NMR spectroscopy of 227 fasting serum metabolic traits, we searched for novel metabolic signatures of renal function in 926 type 2 diabetics (T2D) and 4838 non-diabetic individuals from four independent cohorts. We furthermore investigated longitudinal changes of metabolic measures and renal function and associations with other T2D microvascular complications. 142 traits correlated with glomerular filtration rate (eGFR) after adjusting for confounders and multiple testing: 59 in diabetics, 109 in non-diabetics with 26 overlapping. The amino acids glycine and phenylalanine and the energy metabolites citrate and glycerol were negatively associated with eGFR in all the cohorts, while alanine, valine and pyruvate depicted opposite association in diabetics (positive) and non-diabetics (negative). Moreover, in all cohorts, the triglyceride content of different lipoprotein subclasses showed a negative association with eGFR, while cholesterol, cholesterol esters (CE), and phospholipids in HDL were associated with better renal function. In contrast, phospholipids and CEs in LDL showed positive associations with eGFR only in T2D, while phospholipid content in HDL was positively associated with eGFR both cross-sectionally and longitudinally only in non-diabetics. In conclusion, we provide a wide list of kidney function–associated metabolic traits and identified novel metabolic differences between diabetic and non-diabetic kidney disease.
1Department for Twin Research, King’s College London, London, UK. 2Department of Nephrology, Hospital del Mar, Institut Mar d’Investigacions Mediques, Barcelona, Spain. 3Institute of Bioinformatics and Systems Biology, Helmholtz Zentrum München - German Research Center for Environmental Health, Neuherberg, Germany. 4Research Programs Unit, Diabetes and Obesity, University of Helsinki, Helsinki, Finland. 5Nightingale Health Ltd, Helsinki, Finland. 6Estonian Genome Center, University of Tartu, Tartu, Estonia. 7Institute of Epidemiology II, Helmholtz Zentrum München - German Research Center for Environmental Health, Neuherberg, Germany. 8Research Unit Molecular Epidemiology, Helmholtz Zentrum München - German Research Center for Environmental Health, Neuherberg, Germany. 9Chair of Epidemiology, Ludwig-Maximilians-Universität München, UNIKA-T, Augsburg, Germany. 10Research Centre of Applied and Preventive Cardiovascular Medicine, University of Turku, Turku, Finland. 11Department of Clinical Physiology and Nuclear Medicine, Turku University Hospital, Turku, Finland. 12Department of Clinical Chemistry, Fimlab Laboratories and Finnish Cardiovascular Research Center-Tampere, Faculty of Medicine and Life Sciences, University of Tampere, Tampere, Finland. 13Department of Nephrology, Consorci Sanitari del Garraf, Barcelona, Spain. 14Department of Endocrinology and Nutrition, Hospital del Mar, Institut Mar d’Investigacions Mediques, Barcelona, Spain. 15Department of Clinical Physiology, University of Tampere and Tampere University Hospital, Tampere, Finland. 16Systems Epidemiology, Baker Heart and Diabetes Institute, Melbourne, Victoria, Australia. 17Population Health Science, Bristol Medical School, University of Bristol, Bristol, UK. 18Medical Research Council Integrative Epidemiology Unit at the University of Bristol, Bristol, UK. 19Computational Medicine, Faculty of Medicine, University of Oulu and Biocenter Oulu, Oulu, Finland. 20NMR Metabolomics Laboratory, School of Pharmacy, University of Eastern Finland, Kuopio, Finland. 21Department of Epidemiology and Preventive Medicine, School of Public Health and Preventive Medicine, Faculty of Medicine, Nursing and Health Sciences, The Alfred Hospital, Monash University, Melbourne, Victoria, Australia. 22Present address: Weill Cornell Medical College, New York City, USA. Clara Barrios, Jonas Zierer, Julio Pascual and Cristina Menni contributed equally. Correspondence and requests for materials should be addressed to J.Z. (email: [email protected]) or C.M. (email: [email protected])
Received: 12 February 2018
Accepted: 26 September 2018
Published: xx xx xxxx
OPEN
www.nature.com/scientificreports/
2SCIENTIFIC RepORts | (2018) 8:15249 | DOI:10.1038/s41598-018-33507-7
Chronic kidney disease (CKD) is a major public health problem affecting more than 10% of the population in Western countries1, leading to increased cardiovascular (CV) morbidity and mortality2. The renal microvascular complication of diabetes (DKD) is the leading cause of end-stage renal disease (ESRD). Despite the efforts in early diagnosis and therapeutic interventions in diabetes control, the rate of ESRD caused by DKD decreases less than the rates of all other diabetes complications3.
In recent years, several studies investigated metabolic profiles associated with renal function4,5 in the general population6 and in type 1 diabetic (T1D) patients7–9 to identify biomarkers for disease progression8 and mortality10. Other studies have looked for metabolic markers of type 2 diabetic (T2D) kidney disease, but sample sizes were small, they lacked independent replication11 or were performed in experimental animal models12.
Here, we used targeted nuclear magnetic resonance (NMR) spectroscopy to investigate metabolic signatures of renal function in T2D and non-diabetic individuals, combining four European cohorts. Additionally, to gain insights in potential mechanisms of the cross-sectional associations, we investigated longitudinal changes of metabolite levels and renal function and associations with other microvascular complications of T2D.
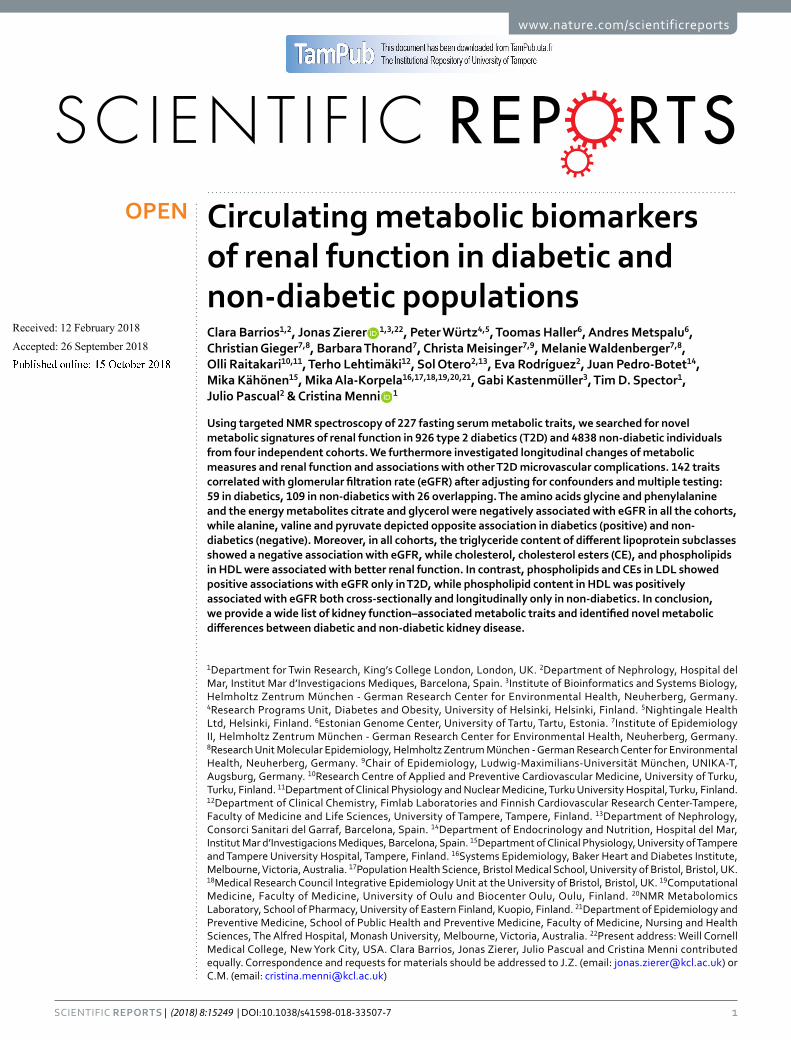
ResultsLevels of 227 fasting serum metabolic traits including small molecules, lipids, lipoprotein subclasses, their lipids component and fatty acids (Supplementary Table 1), were obtained for 5764 individuals from four independ-ent European cohorts, including 926 T2D patients (Fig. 1). The demographic characteristics of all cohorts are presented in Table 1. We calculated associations of all 227 metabolic traits with renal function in each cohort individually and meta-analyzed results for diabetic and non-diabetic cohorts (Supplementary Table 2). To assess the confounding effect of drug usage, we ran the same models in 1054 individuals from TwinsUK additionally adjusting for statin and hormone replacement therapy (HRT), and in 655 individuals from GenodiabMar adjust-ing for statin usage. Results remain consistent (Supplementary Table 3).
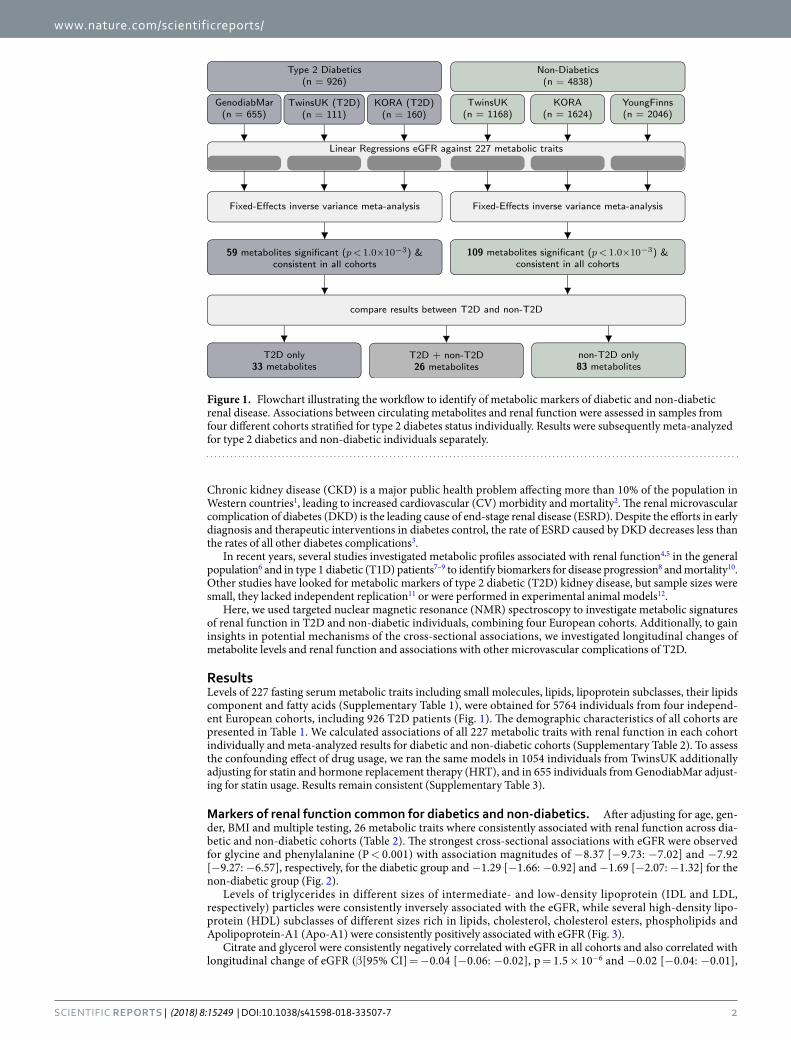
Markers of renal function common for diabetics and non-diabetics. After adjusting for age, gen-der, BMI and multiple testing, 26 metabolic traits where consistently associated with renal function across dia-betic and non-diabetic cohorts (Table 2). The strongest cross-sectional associations with eGFR were observed for glycine and phenylalanine (P < 0.001) with association magnitudes of −8.37 [−9.73: −7.02] and −7.92 [−9.27: −6.57], respectively, for the diabetic group and −1.29 [−1.66: −0.92] and −1.69 [−2.07: −1.32] for the non-diabetic group (Fig. 2).
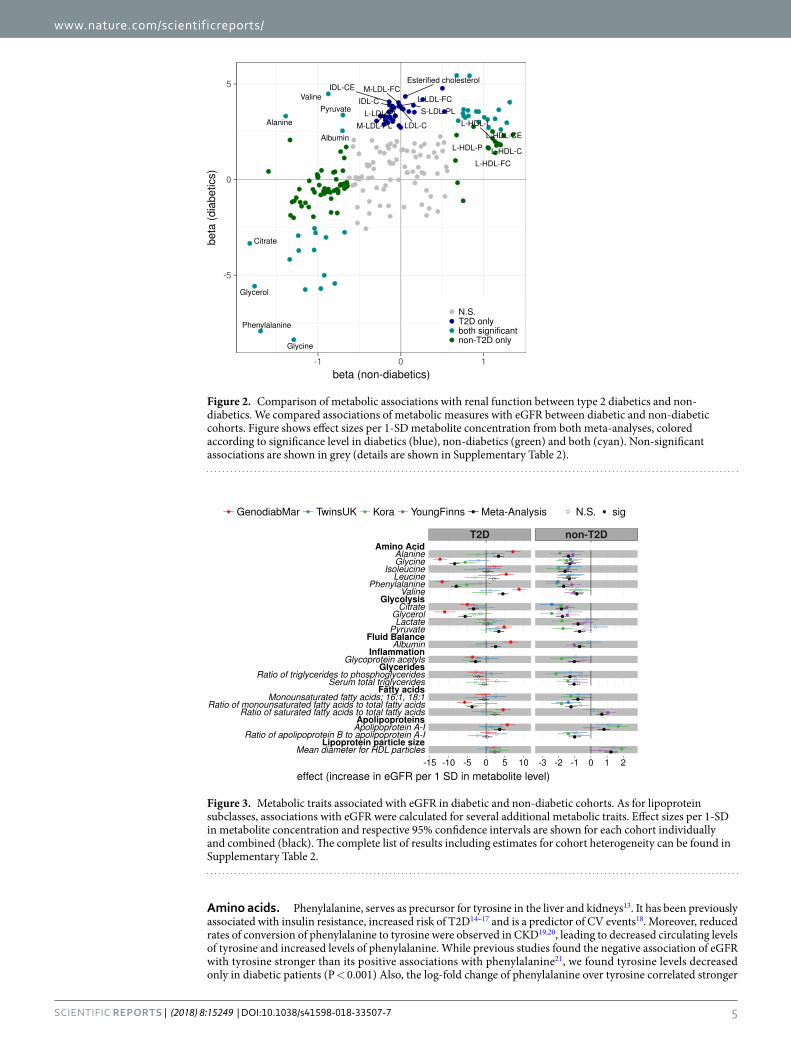
Levels of triglycerides in different sizes of intermediate- and low-density lipoprotein (IDL and LDL, respectively) particles were consistently inversely associated with the eGFR, while several high-density lipo-protein (HDL) subclasses of different sizes rich in lipids, cholesterol, cholesterol esters, phospholipids and Apolipoprotein-A1 (Apo-A1) were consistently positively associated with eGFR (Fig. 3).
Citrate and glycerol were consistently negatively correlated with eGFR in all cohorts and also correlated with longitudinal change of eGFR (β[95% CI] = −0.04 [−0.06: −0.02], p = 1.5 × 10⁻⁶ and −0.02 [−0.04: −0.01],
Figure 1. Flowchart illustrating the workflow to identify of metabolic markers of diabetic and non-diabetic renal disease. Associations between circulating metabolites and renal function were assessed in samples from four different cohorts stratified for type 2 diabetes status individually. Results were subsequently meta-analyzed for type 2 diabetics and non-diabetic individuals separately.

www.nature.com/scientificreports/
3SCIENTIFIC RepORts | (2018) 8:15249 | DOI:10.1038/s41598-018-33507-7
p = 2.6 × 10⁻³) respectively, in TwinsUK and YoungFinns. However, their circulating levels at baseline did not predict eGFR at follow-up in GenodiabMar and diabetic-KORA cohorts (Supplementary Tables 4 and 5).
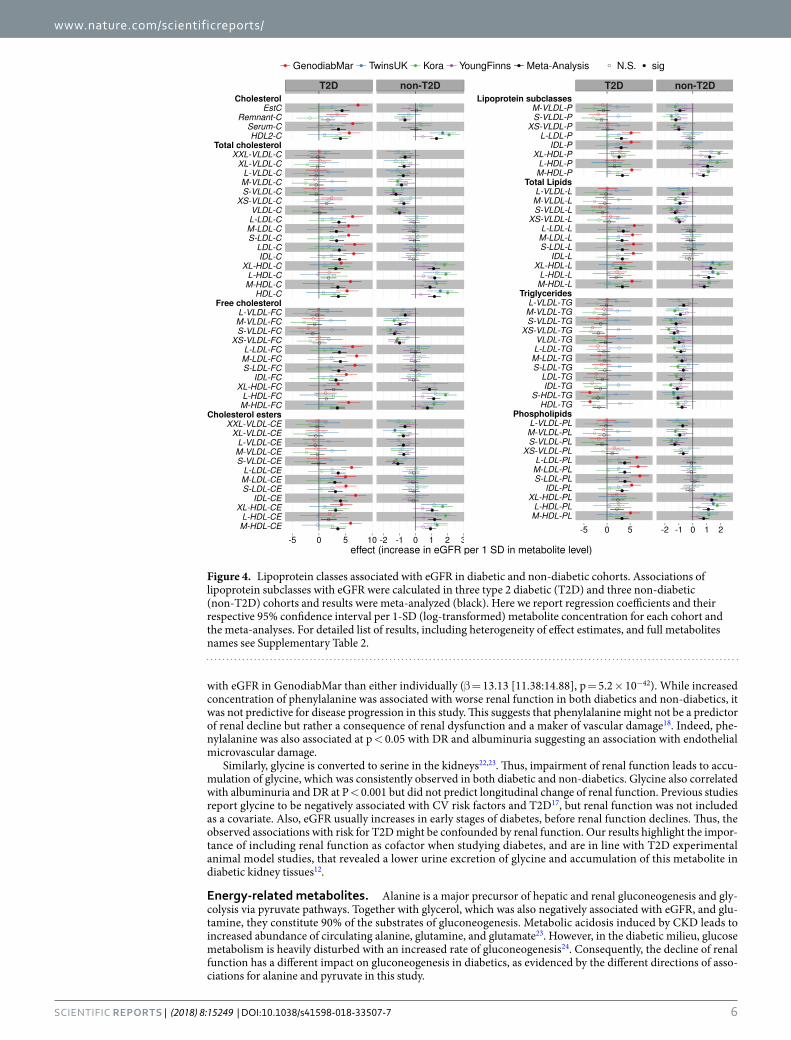
Metabolic profiles associated to renal function in diabetics. In the three diabetic cohorts, 59 meta-bolic measures were consistently associated with eGFR after meta-analysis at P < 0.001. Of those, 33 traits were associated with eGFR only in diabetics but not in non-diabetics (Supplementary Table 2). 6 of these traits were concentrations of cholesterol esters in LDL and IDL subclasses, 4 phospholipids in LDL and IDL, and 14 choles-terol and lipid concentrations in LDL and IDL that followed a positive association with eGFR in diabetics (Fig. 4 and Supplementary Fig. 1). Also, esterified cholesterol (EC) (β = 4.35 [2.96: 5.74], p = 9.3 × 10⁻¹⁰) and total cho-lesterol (β = 3.68 [2.29: 5.07], p = 2.0 × 10⁻⁷) were positively associated with eGFR in diabetics only. However, none of this lipoprotein subclasses predicted the change of renal function and only triglycerides to total lipids ratio in large VLDL (β = 0.13 [0.01: 0.25]) and total cholesterol to total lipids ratio in medium VLDL (β = −0.12 [−0.23: 0.00]) were associated to eGFR in the longitudinal analysis (Supplementary Table 5).
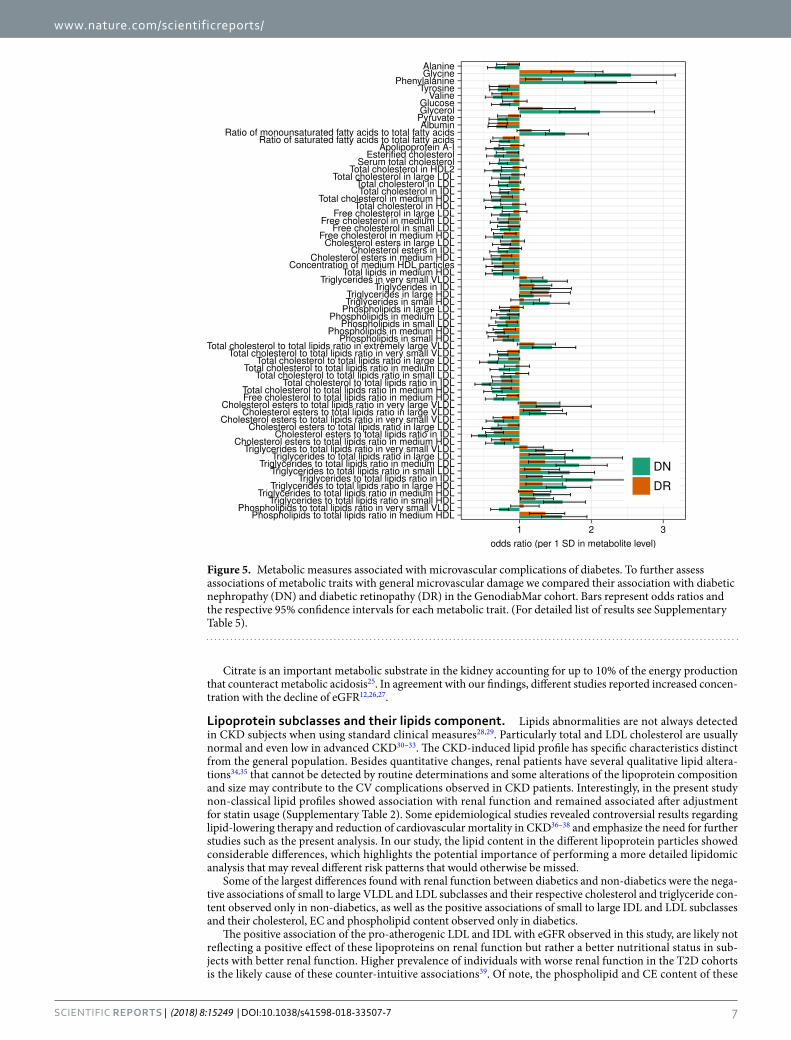
To further explore the relationship of metabolic profiles with other microvascular complications of dia-betes, we calculated cross-sectional associations of metabolite profiles with proteinuria (independently of the eGFR), as well as cross-sectional odds-ratios for diabetic nephropathy (DN) and diabetic retinopathy (DR) in GenodiabMar. Glycine and phenylalanine were common risk factors not only for DN but also for both DR and proteinuria (Fig. 5 and Supplementary Table 6). Similarly, pyruvate, which was associated with better renal func-tion, showed an inverse association with proteinuria. Glycerol, citrate, and pyruvate showed concordant albeit non-significant association with the retinal microvascular damage. Moreover, triglyceride contents in IDL, large and medium LDL, and small VLDL were consistently associated with decreased eGFR as well as higher risk of DN and DR, though to a lesser extent. In contrast, many other lipoprotein subclasses, including most HDLs, did not appear to be associated with DR (P > 0.05). As expected serum albumin was strongly associated with better renal function only in GenodiabMar cohort, due to a higher prevalence and a more severe diabetic nephropathy in this population.
Metabolic profiles associated to renal function in non-diabetics. In the three non-diabetic cohorts 109 metabolic measures were consistently associated with eGFR (P < 0.001) (Supplementary Table 2). 83 of these were associated with renal function only in non-diabetics but not in the diabetic group. Cholesterol and triglyc-eride levels in VLDL particles of all sizes were negatively associated with eGFR. In contrast, phospholipid in large HDL were positively associated with renal function in non-diabetic populations cross-sectionally (phospholip-ids to total lipids ratio in very large HDL: β = 0.69 [0.32:1.06], p = 2.8 × 10⁻⁴) and longitudinally (phospholip-ids in very large HDL: 0.04 [0.02:0.05], p = 1.3 × 10⁻⁵) in TwinsUK (Supplementary Tables 2 and 4). Also, this lipid ratio predicted longitudinal change of eGFR independently of baseline eGFR in KORA (0.04 [0.01:0.07], p = 3.7 × 10⁻³) (Supplementary Table 5).
Discordant metabolic measures between diabetics and non-diabetics. Four metabolites were positively associated with eGFR in diabetics, while they were negatively associated in the non-diabetic indi-viduals at P < 0.001. However, the effect directions of these metabolites were not consistent throughout all cohorts. These include the amino acids alanine (T2D: β = 3.32 [1.92:4.72], non-T2D: −1.39 [−1.75: −1.03]), valine (T2D: 4.48 [3.08: 5.88], non-T2D: −0.88 [−1.27: −0.48]), the glycolysis product pyruvic acid (T2D: 3.37 [1.93: 4.82], non-T2D: −0.70 [−1.06: −0.34]), and albumin (T2D: 2.55 [1.16: 3.93], non-T2D: −0.70 [−1.06: −0.35]) (Supplementary Table 2). Albumin also predicted the longitudinal change of eGFR (0.18 [0.06: 0.30] p = 3.8 × 10⁻³) in the GenodiabMar and KORA cohorts (Supplementary Table 5). Also, there was a trend towards an increase of small, medium, and large LDL particles rich in phospholipids and cholesterol with better eGFR in T2D, that followed an opposite albeit non-significant association in non-diabetic populations (Fig. 4).
Diabetic cohorts Non-diabetic cohorts
GenodiabMar TwinsUK (diabetics) Kora (diabetics) TwinsUK Kora (non-diabetic) YoungFinns
n 655 111 160 1168 1624 2046
Zygosity (MZ/DZ/Single) 30/4/77 466/546/156
Age (years) 69.70 (±9.32) 68.64 (±8.38) 66.74 (±7.44) 64.83 (±7.91) 60.30 (±8.83) 41.88 (±5.00)
Gender (female) 256 (39.1%) 105 (94.6%) 71 (44.4%) 1118 (95.7%) 845 (52.0%) 1115 (54.5%)
BMI (kg/m2) 30.32 (±5.05) 29.33 (±5.55) 31.48 (±5.53) 26.05 (±4.61) 27.82 (±4.58) 26.54 (±5.05)
eGFR (mL/min/1. 73 m2) 58.64 (±28.83) 75.80 (±17.64) 76.59 (±18.15) 79.87 (±14.53) 87.80 (±15.38) 94.75 (±12.53)
creatinine (mg/dL) 1.26 (±0.62) 0.84 (±0.24) 0.96 (±0.48) 0.80 (±0.16) 0.83 (±0.23) 0.87 (±0.15)
CKD* (grades 1/2/3/4/5) N and (%)
116/213/202/72/52 (17.7/32.5/30.8/10.9/7.9)
20/76/12/3/0 (18/68.4/10.8/2.7/0)
39/95/24/1/1 (24.3/59.3/15/0.6/0.6)
322/726/118/2/0 (27.5/62.1/10.1/0.1/0)
795/752/73/2/2 (48.9/46.3/4.4/0.1/0.1)
1339/699/7/1/0 (65.4/34.1/0.3/0.04/0)
Table 1. General characteristics of the study populations. MZ = monozygotic, DZ = dizygotic. BMI = Body mass index. eGFR = estimated glomerular filtration rate (CKD-EPI equation). *Grades of Chronic Kidney Disease are stratified per KDIGO recommendation56 as: G2 60–89, G3 59–30, G4 15–29 and G5 < 15 mL/min/1.73 m2. Values for categorical variables are given as n (percentage); values for continuous variable as mean (±SD).

www.nature.com/scientificreports/
4SCIENTIFIC RepORts | (2018) 8:15249 | DOI:10.1038/s41598-018-33507-7
DiscussionIn the largest study of its kind, including 926 T2D diabetics and 4838 non-diabetics from four independent European cohorts, we identified 142 metabolic traits consistently associated with renal function at P < 0.001 and with concordant effects across cohorts: 59 in diabetics, 109 in non-diabetics, with an overlap of 26 traits. When comparing the effect directions, associations were largely concordant between diabetic and non-diabetic cohorts (R2 = 0.60, Fig. 2). However, there were some notable exceptions. For instance, phospholipids and CE in IDL and LDL were positively correlated with eGFR only in diabetic individuals, while phospholipid content in HDL was positively associated with eGFR both cross-sectionally and longitudinally only in non-diabetics. We addition-ally identified four traits, valine, alanine, pyruvate, and albumin that were negatively associated with eGFR in non-diabetics, and positively associated in diabetics, though the positive associations were not consistent across all cohorts but driven by the GenodiabMar cohort that has a wider range of renal function impairment.
The metabolic measures identified fall into three categories: amino acids, energy-related metabolites, and lipoprotein subclasses particles and their lipids composition.
Class Trait
diabetics non-diabetics
N Signs Beta [95% CI] p N Signs Beta [95% CI] p
Amino AcidGlycine 887 — −8.37 [−9.73: −7.02] 7.28 × 10⁻³⁴ 4632 — −1.29 [−1.66: −0.92] 6.33 × 10⁻¹²
Phenylalanine 905 — −7.92 [−9.27: −6.57] 1.19 × 10⁻³⁰ 4716 — −1.69 [−2.07: −1.32] 1.11 × 10⁻¹⁸
GlycolysisCitrate 913 — −3.34 [−4.78: −1.90] 5.68 × 10⁻⁶ 4705 — −1.82 [−2.18: −1.47] 7.06 × 10⁻²⁴
Glycerol 551 — −5.57 [−7.37: −3.77] 1.25 × 10⁻⁹ 3695 — −1.77 [−2.19: −1.34] 7.54 × 10⁻¹⁶
Apolipoproteins Apolipoprotein A-I 926 +++ 3.62 [2.14: 5.10] 1.63 × 10⁻⁶ 4817 +++ 0.81 [0.43: 1.19] 3.09 × 10⁻⁵
Cholesterol Total cholesterol in HDL2 924 +++ 4.05 [2.59: 5.50] 4.94 × 10⁻⁸ 4817 +++ 1.32 [0.91: 1.72] 1.51 × 10⁻¹⁰
Total cholesterolTotal cholesterol in very large HDL 926 +++ 3.18 [1.74: 4.61] 1.41 × 10⁻⁵ 4817 +++ 1.14 [0.74: 1.53] 1.62 × 10⁻⁸
Total cholesterol in HDL 925 +++ 3.65 [2.19: 5.11] 9.65 × 10⁻⁷ 4817 +++ 1.18 [0.78: 1.58] 6.55 × 10⁻⁹
Free cholesterol Free cholesterol in medium HDL 926 +++ 3.47 [2.03: 4.90] 2.22 × 10⁻⁶ 4817 +++ 0.75 [0.39: 1.11] 5.25 × 10⁻⁵
Cholesterol esters Cholesterol esters in very large HDL 926 +++ 3.14 [1.71: 4.57] 1.60 × 10⁻⁵ 4817 +++ 1.05 [0.66: 1.44] 1.43 × 10⁻⁷
Lipoprotein subclasses
Concentration of very large HDL particles 926 +++ 2.62 [1.17: 4.07] 4.13 × 10⁻⁴ 4817 +++ 1.21 [0.80: 1.62] 5.90 × 10⁻⁹
Concentration of medium HDL particles 926 +++ 3.33 [1.89: 4.76] 5.41 × 10⁻⁶ 4817 +++ 0.76 [0.40: 1.12] 3.27 × 10⁻⁵
Total LipidsTotal lipids in very large HDL 926 +++ 2.97 [1.52: 4.42] 5.71 × 10⁻⁵ 4817 +++ 1.28 [0.87: 1.69] 8.36 × 10⁻¹⁰
Total lipids in medium HDL 923 +++ 3.33 [1.88: 4.77] 6.29 × 10⁻⁶ 4813 +++ 0.82 [0.46: 1.18] 8.81 × 10⁻⁶
Phospholipids Phospholipids in medium HDL 926 +++ 3.24 [1.80: 4.68] 1.02 × 10⁻⁵ 4817 +++ 0.78 [0.42: 1.14] 2.40 × 10⁻⁵
Total cholesterol (%)
Total cholesterol to total lipids ratio in chylomicrons and extremely large VLDL
739 — −3.02 [−4.55: −1.49] 1.07 × 10⁻⁴ 4005 — −0.90 [−1.28: −0.53] 2.21 × 10⁻⁶
Total cholesterol to total lipids ratio in IDL 916 +++ 5.43 [4.08: 6.77] 2.65 × 10⁻¹⁵ 4805 +++ 0.83 [0.48: 1.18] 3.60 × 10⁻⁶
Cholesterol esters (%)
Cholesterol esters to total lipids ratio in very small VLDL 920 +++ 3.67 [2.28: 5.06] 2.25 × 10⁻⁷ 4808 +++ 0.76 [0.40: 1.12] 3.13 × 10⁻⁵
Cholesterol esters to total lipids ratio in IDL 917 +++ 5.45 [4.10: 6.79] 2.05 × 10⁻¹⁵ 4807 +++ 0.67 [0.32: 1.03] 1.66 × 10⁻⁴
Triglycerides (%)
Triglycerides to total lipids ratio in very small VLDL 924 — −3.68 [−5.07: −2.30] 1.93 × 10⁻⁷ 4814 — −1.05 [−1.42: −0.68] 3.28 × 10⁻⁸
Triglycerides to total lipids ratio in large LDL 923 — −5.70 [−7.04: −4.36] 9.08 × 10⁻¹⁷ 4813 — −0.96 [−1.32: −0.61] 7.75 × 10⁻⁸
Triglycerides to total lipids ratio in medium LDL 913 — −5.43 [−6.79: −4.08] 4.05 × 10⁻¹⁵ 4808 — −0.80 [−1.15: −0.44] 9.26 × 10⁻⁶
Triglycerides to total lipids ratio in small LDL 913 — −5.00 [−6.37: −3.63] 8.91 × 10⁻¹³ 4807 — −0.92 [−1.28: −0.57] 3.73 × 10⁻⁷
Triglycerides to total lipids ratio in IDL 923 — −5.75 [−7.10: −4.40] 8.20 × 10⁻¹⁷ 4811 — −1.15 [−1.51: −0.80] 2.40 × 10⁻¹⁰
Triglycerides to total lipids ratio in large HDL 886 — −4.17 [−5.60: −2.75] 9.49 × 10⁻⁹ 4612 — −1.34 [−1.70: −0.98] 1.71 × 10⁻¹³
Phospholipids (%) Phospholipids to total lipids ratio in very small VLDL 923 +++ 3.01 [1.61: 4.40] 2.34 × 10⁻⁵ 4808 +++ 0.94 [0.58: 1.31] 4.27 × 10⁻⁷
Table 2. Metabolic traits consistently associated with renal function in diabetic and non-diabetic cohorts. 26 metabolic traits from 14 metabolic classes, listed here, were associated with eGFR consistently across both diabetic and non-diabetic cohorts. Signs represent the directions of the regression coefficients in each diabetic (GenodiabMar, diabetics-TwinsUK, diabetics-KORA) and non-diabetic (TwinsUK, KORA, YoungFinns) cohort. Results were meta-analyzed for diabetic and non-diabetic cohorts separately. Association magnitudes are eGFR per 1-SD (log-transformed) concentration. For detailed list of associations of all 227 analyzed metabolic traits see Supplementary T2.
www.nature.com/scientificreports/
5SCIENTIFIC RepORts | (2018) 8:15249 | DOI:10.1038/s41598-018-33507-7
Amino acids. Phenylalanine, serves as precursor for tyrosine in the liver and kidneys13. It has been previously associated with insulin resistance, increased risk of T2D14–17 and is a predictor of CV events18. Moreover, reduced rates of conversion of phenylalanine to tyrosine were observed in CKD19,20, leading to decreased circulating levels of tyrosine and increased levels of phenylalanine. While previous studies found the negative association of eGFR with tyrosine stronger than its positive associations with phenylalanine21, we found tyrosine levels decreased only in diabetic patients (P < 0.001) Also, the log-fold change of phenylalanine over tyrosine correlated stronger
Figure 2. Comparison of metabolic associations with renal function between type 2 diabetics and non-diabetics. We compared associations of metabolic measures with eGFR between diabetic and non-diabetic cohorts. Figure shows effect sizes per 1-SD metabolite concentration from both meta-analyses, colored according to significance level in diabetics (blue), non-diabetics (green) and both (cyan). Non-significant associations are shown in grey (details are shown in Supplementary Table 2).
Figure 3. Metabolic traits associated with eGFR in diabetic and non-diabetic cohorts. As for lipoprotein subclasses, associations with eGFR were calculated for several additional metabolic traits. Effect sizes per 1-SD in metabolite concentration and respective 95% confidence intervals are shown for each cohort individually and combined (black). The complete list of results including estimates for cohort heterogeneity can be found in Supplementary Table 2.
www.nature.com/scientificreports/
6SCIENTIFIC RepORts | (2018) 8:15249 | DOI:10.1038/s41598-018-33507-7
with eGFR in GenodiabMar than either individually (β = 13.13 [11.38:14.88], p = 5.2 × 10−42). While increased concentration of phenylalanine was associated with worse renal function in both diabetics and non-diabetics, it was not predictive for disease progression in this study. This suggests that phenylalanine might not be a predictor of renal decline but rather a consequence of renal dysfunction and a maker of vascular damage18. Indeed, phe-nylalanine was also associated at p < 0.05 with DR and albuminuria suggesting an association with endothelial microvascular damage.
Similarly, glycine is converted to serine in the kidneys22,23. Thus, impairment of renal function leads to accu-mulation of glycine, which was consistently observed in both diabetic and non-diabetics. Glycine also correlated with albuminuria and DR at P < 0.001 but did not predict longitudinal change of renal function. Previous studies report glycine to be negatively associated with CV risk factors and T2D17, but renal function was not included as a covariate. Also, eGFR usually increases in early stages of diabetes, before renal function declines. Thus, the observed associations with risk for T2D might be confounded by renal function. Our results highlight the impor-tance of including renal function as cofactor when studying diabetes, and are in line with T2D experimental animal model studies, that revealed a lower urine excretion of glycine and accumulation of this metabolite in diabetic kidney tissues12.
Energy-related metabolites. Alanine is a major precursor of hepatic and renal gluconeogenesis and gly-colysis via pyruvate pathways. Together with glycerol, which was also negatively associated with eGFR, and glu-tamine, they constitute 90% of the substrates of gluconeogenesis. Metabolic acidosis induced by CKD leads to increased abundance of circulating alanine, glutamine, and glutamate23. However, in the diabetic milieu, glucose metabolism is heavily disturbed with an increased rate of gluconeogenesis24. Consequently, the decline of renal function has a different impact on gluconeogenesis in diabetics, as evidenced by the different directions of asso-ciations for alanine and pyruvate in this study.
Figure 4. Lipoprotein classes associated with eGFR in diabetic and non-diabetic cohorts. Associations of lipoprotein subclasses with eGFR were calculated in three type 2 diabetic (T2D) and three non-diabetic (non-T2D) cohorts and results were meta-analyzed (black). Here we report regression coefficients and their respective 95% confidence interval per 1-SD (log-transformed) metabolite concentration for each cohort and the meta-analyses. For detailed list of results, including heterogeneity of effect estimates, and full metabolites names see Supplementary Table 2.
www.nature.com/scientificreports/
7SCIENTIFIC RepORts | (2018) 8:15249 | DOI:10.1038/s41598-018-33507-7
Citrate is an important metabolic substrate in the kidney accounting for up to 10% of the energy production that counteract metabolic acidosis25. In agreement with our findings, different studies reported increased concen-tration with the decline of eGFR12,26,27.
Lipoprotein subclasses and their lipids component. Lipids abnormalities are not always detected in CKD subjects when using standard clinical measures28,29. Particularly total and LDL cholesterol are usually normal and even low in advanced CKD30–33. The CKD-induced lipid profile has specific characteristics distinct from the general population. Besides quantitative changes, renal patients have several qualitative lipid altera-tions34,35 that cannot be detected by routine determinations and some alterations of the lipoprotein composition and size may contribute to the CV complications observed in CKD patients. Interestingly, in the present study non-classical lipid profiles showed association with renal function and remained associated after adjustment for statin usage (Supplementary Table 2). Some epidemiological studies revealed controversial results regarding lipid-lowering therapy and reduction of cardiovascular mortality in CKD36–38 and emphasize the need for further studies such as the present analysis. In our study, the lipid content in the different lipoprotein particles showed considerable differences, which highlights the potential importance of performing a more detailed lipidomic analysis that may reveal different risk patterns that would otherwise be missed.
Some of the largest differences found with renal function between diabetics and non-diabetics were the nega-tive associations of small to large VLDL and LDL subclasses and their respective cholesterol and triglyceride con-tent observed only in non-diabetics, as well as the positive associations of small to large IDL and LDL subclasses and their cholesterol, EC and phospholipid content observed only in diabetics.
The positive association of the pro-atherogenic LDL and IDL with eGFR observed in this study, are likely not reflecting a positive effect of these lipoproteins on renal function but rather a better nutritional status in sub-jects with better renal function. Higher prevalence of individuals with worse renal function in the T2D cohorts is the likely cause of these counter-intuitive associations39. Of note, the phospholipid and CE content of these
Figure 5. Metabolic measures associated with microvascular complications of diabetes. To further assess associations of metabolic traits with general microvascular damage we compared their association with diabetic nephropathy (DN) and diabetic retinopathy (DR) in the GenodiabMar cohort. Bars represent odds ratios and the respective 95% confidence intervals for each metabolic trait. (For detailed list of results see Supplementary Table 5).
www.nature.com/scientificreports/
8SCIENTIFIC RepORts | (2018) 8:15249 | DOI:10.1038/s41598-018-33507-7
lipoprotein particles may be related to increased lipid transfer proteins (LTP) activity (CETP and PLTP) present in diabetic subjects40. On the contrary, lower activity of LTPs associates with lower CV risk41, which might be related to the negative associations of LDL subclasses with renal function in non-diabetic subjects. Interestingly, triglyceride ratios in LDL and IDL were negatively associated with renal function consistently between diabetics and non-diabetics. Also, triglyceride to total lipid ratios showed stronger association in diabetes compared to non-diabetes (Supplementary Table 2). To the best of our knowledge, no studies have investigated the activity of LTP and their association with renal damage and whether pharmacological targeting of this proteins might influence in renal function.
Longitudinal analysis revealed a positive association of several HDL particle and Apo-A1 with renal function over time (Supplementary Table 4). However, their circulating levels at baseline were not associated with a better renal function in T2D at follow-up. Diabetic dyslipidemia presents particularities regarding quantitative lipopro-tein abnormalities and also qualitative and kinetic abnormalities that results in a more atherogenic lipid profile28. Changes in HDL composition in T2D have been shown to affect cholesterol efflux42,43. Moreover, higher protein-uria may increases the loss of particles derived from HDL catabolism44,45. In our study, the ratio of phospholipids to total lipids in very-large HDL was associated with longitudinal change of eGFR and predicted future eGFR only in non-diabetics. Phospholipids in HDL enhance its cholesterol efflux capacity46,47, which is impaired in diabetics and may explain the observed differences42,43.
Although many of our findings are shared with previous studies on T1D7,8, we found some differences. For example, we did not find any association of eGFR with sphingomyelin or total fatty acids that were markers of kidney injury and mortality in T1D. This may suggest differences between T1D and T2D metabolic profiles and the importance of analyze both conditions individually.
The present study has several strengths. First, we analyzed data from four independent cohorts, thus min-imizing the risk of false positive findings. Second, we analyzed a wide range of metabolic traits beyond those commonly used in clinics. Also, we stratified for diabetes status, thus providing a direct comparison of meta-bolic profiles associated with diabetic and non-diabetic renal damage. We also note some study limitations. The GenodiabMar cohort was recruited from medical consultations while the other cohorts represent individuals from the general population. Thus, the presence of other medical complications as well as different grades of renal dysfunction may be confounding factors. However, by meta-analyzing results across diabetic cohorts, we controlled for population-specific effects. Also, drug use may have an important impact on metabolic profiles, although statin use did not substantially change the results in this study (Supplementary Table 3). However, further analyses specifically addressing the effects of different drugs, such as antihypertensive, other medical conditions and the potential effect of renal replacement therapies, are needed.
In conclusion, we found widespread metabolic changes associated with decline of renal function. While associations of many lipoprotein particles and their lipid composition with renal function were largely similar between diabetic and non-diabetic cohorts, several exceptions revealed metabolic differences between the condi-tions. Also, changes of amino acid and energy metabolism were markedly different regarding diabetes condition. Our results show alterations of lipoprotein composition in kidney disease that are currently underexploited in clinics. We also find marked metabolic differences between diabetic and non-diabetic kidney disease, suggesting that more specific markers for each condition might be able to outperform current markers of kidney disease.
MethodsStudy Design and Participants. Targeted NMR metabolic profiling was conducted in 926 diabetic and 4838 non-diabetic individuals from the GenodiabMar (n = 655), TwinsUK (n = 1279, 111 with T2D)48, KORA (n = 1784, 160 with T2D)49, and Young Finns (n = 2046)50 cohorts. GenodiabMar is a cohort of T2D patients, recruited in a hospital, while the other cohorts were recruited from the general population. Renal function was measured as eGFR from standard creatinine using the Chronic Kidney Disease Epidemiology Collaboration equation (CKD-EPI)51. Longitudinal measures were available for a subset of 3644 individuals (Supplementary methods). Each local ethics committee approved the study, and subjects were included after providing informed consent. All methods were performed in accordance with the relevant guidelines and regulations.
A flowchart of the study design is depicted in Fig. 1.
Metabolic profiling. Metabolic profiling of 227 metabolic traits, 143 metabolite concentrations, 80 lipid ratios, 3 lipoprotein particle sizes and a semi-quantitative measure of albumin (see Supplementary Table 1 for full list), was conducted for all cohorts by Nightingale Health Ltd. (Helsinki, Finland; previously known as Brainshake Ltd) using a targeted NMR spectroscopy platform that has been extensively applied for biomarker profiling in epidemiological studies as previously described18,52,53 (Supplementary methods).
Statistical analysis. All metabolic measures were log-transformed. To account for zero values a pseudo-count of 1 was added to all measurements prior to transformation. All measurements were shifted to zero mean and scaled to standard deviation (SD) of 1 (z scores) to facilitate comparisons across cohorts. The average absolute concentrations and SDs of each metabolite in each cohort are presented in Supplementary Table 1.
Cross-sectional analysis. We assessed the associations between metabolic profiles and renal function in each cohort individually by fitting linear regressions for all metabolic traits with eGFR as outcome, adjusting for age, gender, BMI (and family relatedness as random intercept) to account for the decline of renal function with advancing age as well as its dependency on obesity. All results were then meta-analyzed separately for T2D patients and non-diabetic cohorts using inverse variance fixed effect meta-analysis due to the expected homo-geneity of effects in both subgroups. We adjusted for multiple testing using Bonferroni correction assuming 50 independent test as suggested by Li and Ji54 (P < 0.001) (Supplementary methods).
www.nature.com/scientificreports/
9SCIENTIFIC RepORts | (2018) 8:15249 | DOI:10.1038/s41598-018-33507-7
As metabolic profiles may be strongly affected by medication such as statin treatment55 or hormone replace-ment therapy, we tested the robustness of our results by running a sub-analysis in a subset of individuals from TwinsUK and GenodiabMar with information on treatment available, additionally adjusting for medication status.
To further investigate traits of interest, we regressed the concentration of albumin in urine against each of the metabolic traits. Finally, we calculated logistic regression models to assess the association of each metabolic trait with diabetic nephropathy and retinopathy, respectively.
Longitudinal analysis. For TwinsUK and YoungFinns we estimated the trajectories of metabolite/eGFR change by fitting linear mixed models for each metabolite with a per-individual random effect for the time since baseline. The estimate of this random effect provides a measure of the (linear) change of metabolite concentration over time similarly to calculating the change per year for two visits. These trajectories were estimated for all metabo-lites individually and then compared to the change in eGFR in a separate regression model, thus assessing longi-tudinal correlations between metabolites and renal function.
Also, we evaluated the potential of metabolite measures as diagnostic tool by predicting the eGFR at follow-up using metabolic measures at baseline, correcting for gender and baseline eGFR, age, and BMI.
Data AvailabilityData from the TwinsUK cohort are available upon request on the department website (http://www.twinsuk.ac.uk/data-access/accessmanagement/). Data from the KORA cohort can be requested online (https://epi.helm-holtz-muenchen.de/) and is subject to approval by the KORA board.
References 1. O’Callaghan, Ca, Shine, B. & Lasserson, D. S. Chronic kidney disease: a large-scale population-based study of the effects of
introducing the CKD-EPI formula for eGFR reporting. BMJ Open 1, e000308–e000308 (2011). 2. Go, A. S., Chertow, G. M., Fan, D., McCulloch, C. E. & Hsu, C. Chronic kidney disease and the risks of death, cardiovascular events,
and hospitalization. N. Engl. J. Med. 351, 1296–305 (2004). 3. Gregg, E. W. et al. Changes in diabetes-related complications in the United States, 1990–2010. N Engl J Med 370, 1514–1523 (2014). 4. Zhang, Y., Zhang, S. & Wang, G. Metabolomic biomarkers in diabetic kidney diseases–A systematic review. J. Diabetes Complications
29, 1345–51 (2015). 5. Barrios, C., Spector, T. D. & Menni, C. Blood, urine and faecal metabolite profiles in the study of adult renal disease. Arch. Biochem.
Biophys. 589, 81–92 (2016). 6. Sekula, P. et al. A Metabolome-Wide Association Study of Kidney Function and Disease in the General Population. J. Am. Soc.
Nephrol. 27, 1175–88 (2016). 7. Mäkinen, V.-P. et al. Metabolic phenotyping of diabetic nephropathy. Clin. Pharmacol. Ther. 94, 566–9 (2013). 8. Mäkinen, V.-P. et al. Metabolic diversity of progressive kidney disease in 325 patients with type 1 diabetes (the FinnDiane Study). J.
Proteome Res. 11, 1782–90 (2012). 9. Soininen, P. et al. 1H NMR metabonomics approach to the disease continuum of diabetic complications and premature death. Mol.
Syst. Biol. 4, 167 (2008). 10. Mäkinen, V.-P. et al. Triglyceride-cholesterol imbalance across lipoprotein subclasses predicts diabetic kidney disease and mortality
in type 1 diabetes: the FinnDiane Study. J. Intern. Med. 273, 383–95 (2013). 11. Darshi, M., Van Espen, B. & Sharma, K. Metabolomics in Diabetic Kidney Disease: Unraveling the Biochemistry of a Silent Killer.
Am. J. Nephrol. 44, 92–103 (2016). 12. Wei, T. et al. Metabonomic analysis of potential biomarkers and drug targets involved in diabetic nephropathy mice. Sci. Rep. 5,
11998 (2015). 13. Møller, N., Meek, S., Bigelow, M., Andrews, J. & Nair, K. S. The kidney is an important site for in vivo phenylalanine-to-tyrosine
conversion in adult humans: A metabolic role of the kidney. Proc. Natl. Acad. Sci. USA 97, 1242–6 (2000). 14. Wang, T. J. et al. Metabolite profiles and the risk of developing diabetes. Nat. Med. 17, 448–53 (2011). 15. Floegel, A. et al. Identification of serum metabolites associated with risk of type 2 diabetes using a targeted metabolomic approach.
Diabetes 62, 639–648 (2013). 16. Stancakova, A. et al. Hyperglycemia and a Common Variant of GCKR Are Associated With the Levels of Eight Amino Acids in 9,369
Finnish Men. Diabetes 61, 1895–1902 (2012). 17. Guasch-Ferré, M. et al. Metabolomics in Prediabetes and Diabetes: A Systematic Review and Meta-analysis. Diabetes Care 39,
833–846 (2016). 18. Wurtz, P. et al. Metabolite Profiling and Cardiovascular Event Risk: A Prospective Study of 3 Population-Based Cohorts. Circulation
131, 774–785 (2015). 19. Young, G. A. & Parsons, F. M. Impairment of phenylalanine hydroxylation in chronic renal insufficiency. Clin. Sci. 45, 89–97 (1973). 20. Boirie, Y., Albright, R., Bigelow, M. & Nair, K. S. Impairment of phenylalanine conversion to tyrosine in end-stage renal disease
causing tyrosine deficiency. Kidney Int. 66, 591–596 (2004). 21. Kopple, J. D. Phenylalanine and tyrosine metabolism in chronic kidney failure. J. Nutr. 137 1586S–1590S; discussion 1597S–1598S
(2007). 22. Pitts, R. F., Damian, A. C. & MacLeod, M. B. Synthesis of serine by rat kidney in vivo and in vitro. Am. J. Physiol. 219, 584–9 (1970). 23. Tizianello, A., De Ferrari, G., Garibotto, G., Gurreri, G. & Robaudo, C. Renal metabolism of amino acids and ammonia in subjects
with normal renal function and in patients with chronic renal insufficiency. J. Clin. Invest. 65, 1162–73 (1980). 24. Magnusson, I., Rothman, D. L., Katz, L. D., Shulman, R. G. & Shulman, G. I. Increased rate of gluconeogenesis in type II diabetes
mellitus. A 13C nuclear magnetic resonance study. J. Clin. Invest. 90, 1323–7 (1992). 25. Brennan, S., Hering-Smith, K. & Hamm, L. L. Effect of pH on citrate reabsorption in the proximal convoluted tubule. Am. J. Physiol.
255, F301–6 (1988). 26. Kim, J.-A. et al. 1H NMR-based metabolite profiling of plasma in a rat model of chronic kidney disease. PLoS One 9, e85445 (2014). 27. Sharma, K. et al. Metabolomics reveals signature of mitochondrial dysfunction in diabetic kidney disease. J. Am. Soc. Nephrol. 24,
1901–12 (2013). 28. Vergès, B. Pathophysiology of diabetic dyslipidaemia: where are we? Diabetologia 58, 886–99 (2015). 29. Vergès, B. New insight into the pathophysiology of lipid abnormalities in type 2 diabetes. Diabetes Metab. 31, 429–39 (2005). 30. Baigent, C., Landray, M. J. & Wheeler, D. C. Misleading associations between cholesterol and vascular outcomes in dialysis patients:
the need for randomized trials. Semin. Dial. 20, 498–503 (2007). 31. Baigent, C. & Landray, M. Which cardiovascular risk factors matter in chronic kidney disease? Nephrol. Dial. Transplant 22, 9–11
(2007).

www.nature.com/scientificreports/
1 0SCIENTIFIC RepORts | (2018) 8:15249 | DOI:10.1038/s41598-018-33507-7
32. Lewis, D., Haynes, R. & Landray, M. J. Lipids in chronic kidney disease. J. Ren. Care 36 Suppl 1, 27–33 (2010). 33. Tsimihodimos, V., Mitrogianni, Z. & Elisaf, M. Dyslipidemia associated with chronic kidney disease. Open Cardiovasc. Med. J. 5,
41–8 (2011). 34. Barrios, C. et al. Diabetic nephropathy is an independent factor associated to severe subclinical atheromatous disease. Atherosclerosis
242, 37–44 (2015). 35. Bermúdez-López, M. et al. New perspectives on CKD-induced dyslipidemia. Expert Opin. Ther. Targets 21, 967–976 (2017). 36. Baigent, C. et al. The effects of lowering LDL cholesterol with simvastatin plus ezetimibe in patients with chronic kidney disease
(Study of Heart and Renal Protection): a randomised placebo-controlled trial. Lancet (London, England) 377, 2181–92 (2011). 37. Fellström, B. C. et al. Rosuvastatin and Cardiovascular Events in Patients Undergoing Hemodialysis. N. Engl. J. Med. 360, 1395–1407
(2009). 38. Wanner, C. et al. Atorvastatin in patients with type 2 diabetes mellitus undergoing hemodialysis. N. Engl. J. Med. 353, 238–48 (2005). 39. Bowden, R. G. et al. Reverse epidemiology of lipid-death associations in a cohort of end-stage renal disease patients. Nephron. Clin.
Pract. 119, c214–9 (2011). 40. Bouillet, B. et al. Glycation of apolipoprotein C1 impairs its CETP inhibitory property: pathophysiological relevance in patients with
type 1 and type 2 diabetes. Diabetes Care 37, 1148–56 (2014). 41. de Vries, R. et al. Elevated plasma phospholipid transfer protein activity is a determinant of carotid intima-media thickness in type
2 diabetes mellitus. Diabetologia 49, 398–404 (2006). 42. Apro, J. et al. Impaired Cholesterol Efflux Capacity of High-Density Lipoprotein Isolated From Interstitial Fluid in Type 2 Diabetes
Mellitus-Brief Report. Arterioscler. Thromb. Vasc. Biol. 36, 787–91 (2016). 43. Zhou, H., Tan, K. C. B., Shiu, S. W. M. & Wong, Y. Cellular cholesterol efflux to serum is impaired in diabetic nephropathy. Diabetes.
Metab. Res. Rev. 24, 617–23 (2008). 44. Vaziri, N. D. Causes of dysregulation of lipid metabolism in chronic renal failure. Semin. Dial. 22, 644–51 (2009). 45. Vaziri, N. D. HDL abnormalities in nephrotic syndrome and chronic kidney disease. Nat. Rev. Nephrol. 12, 37–47 (2016). 46. Fournier, N. et al. HDL phospholipid content and composition as a major factor determining cholesterol efflux capacity from
Fu5AH cells to human serum. Arterioscler. Thromb. Vasc. Biol. 17, 2685–91 (1997). 47. Agarwala, A. P. et al. High-Density Lipoprotein (HDL) Phospholipid Content and Cholesterol Efflux Capacity Are Reduced in
Patients With Very High HDL Cholesterol and Coronary Disease. Arterioscler. Thromb. Vasc. Biol. 35, 1515–1519 (2015). 48. Moayyeri, A., Hammond, C. J., Valdes, A. M. & Spector, T. D. Cohort Profile: TwinsUK and Healthy Ageing Twin Study. Int. J.
Epidemiol. 42, 76–85 (2013). 49. Holle, R., Happich, M., Löwel, H. & Wichmann, H. KORA - A Research Platform for Population Based Health Research.
Gesundheitswesen 67, 19–25 (2005). 50. Raitakari, O. T. et al. Cohort profile: The cardiovascular risk in young Finns study. Int. J. Epidemiol. 37, 1220–1226 (2008). 51. Levey, A. S. et al. A new equation to estimate glomerular filtration rate. Ann. Intern. Med. 150, 604–612 (2009). 52. Soininen, P., Kangas, A. J., Würtz, P., Suna, T. & Ala-Korpela, M. Quantitative Serum Nuclear Magnetic Resonance Metabolomics in
Cardiovascular Epidemiology and Genetics. Circ. Cardiovasc. Genet. 8, 192–206 (2015). 53. Würtz, P. et al. Quantitative Serum NMR Metabolomics in Large-Scale Epidemiology: A Primer on -Omic Technology. Am. J.
Epidemiol. https://doi.org/10.1093/aje/kwx016 (2017). 54. Li, J. & Ji, L. Adjusting multiple testing in multilocus analyses using the eigenvalues of a correlation matrix. Heredity (Edinb). 95,
221–227 (2005). 55. Baig, F., Pechlaner, R. & Mayr, M. Caveats of Untargeted Metabolomics for Biomarker Discovery. J. Am. Coll. Cardiol. 68, 1294–6
(2016). 56. Stevens, P. E. & Levin, A. & Kidney Disease: Improving Global Outcomes Chronic Kidney Disease Guideline Development Work
Group Members. Evaluation and management of chronic kidney disease: synopsis of the kidney disease: improving global outcomes 2012 clinical practice guideline. Ann. Intern. Med. 158, 825–30 (2013).
AcknowledgementsTwinsUK was funded by the Wellcome Trust; European Community’s Seventh Framework Programme (FP7/2007–2013). The study also receives support from the National Institute for Health Research (NIHR) Clinical Research Facility at Guy’s & St Thomas’ NHS Foundation Trust and NIHR Biomedical Research Centre based at Guy’s and St Thomas’ NHS Foundation Trust and King’s College London. TS is holder of an ERC Advanced Principal Investigator award. CB and the Genodiab-Mar cohort is supported by a grant from the Institute Carlos III (FIS-FEDER PI16/00620) and RedinRen RD16/0013/0009. CM is funded by the MRC AimHy (MR/M016560/1) project grant. The KORA study was initiated and financed by the Helmholtz Zentrum München – German Research Center for Environmental Health, which is funded by the German Federal Ministry of Education and Research (BMBF) and by the State of Bavaria. Furthermore, KORA research has been supported within the Munich Center of Health Sciences (MC-Health), Ludwig-Maximilians-Universität, as part of LMUinnovativ. The research leading to these results has received funding from the European Union Seventh Framework Programme under grant agreement [n°313010] (Large-scale prospective cohort studies - BBMRI-LPC; www.bbmri-lpc.org), [n°305280] (Methods for Integrated analysis of multiple Omics datasets – MIMOmics; http://www.mimomics.eu/) and under grant agreements [n°603288] (Systems Biology to Identify Molecular Targets for Vascular Disease Treatment – SysVasc; http://www.sysvasc.eu/). The Young Finns Study has been financially supported by the Academy of Finland: grants 286284, 134309 (Eye), 126925, 121584, 124282, 129378 (Salve), 117787 (Gendi), and 41071 (Skidi); the Social Insurance Institution of Finland; Competitive State Research Financing of the Expert Responsibility area of Kuopio, Tampere and Turku University Hospitals (grant X51001); Juho Vainio Foundation; Paavo Nurmi Foundation; Finnish Foundation for Cardiovascular Research; Finnish Cultural Foundation; Tampere Tuberculosis Foundation; Emil Aaltonen Foundation; Yrjö Jahnsson Foundation; Signe and Ane Gyllenberg Foundation; and Diabetes Research Foundation of Finnish Diabetes Association. MAK was supported by the Sigrid Juselius Foundation, Finland. MAK works in a Unit that is supported by the University of Bristol and UK Medical Research Council (MC_UU_12013/1). PW is funded by the Academy of Finland (312476 & 312477), and the Novo Nordisk FoundationCompeting Interests.
Author ContributionsC.M., T.D.S., J.P., G.K. conceived and supervised the study; P.W., A.M., C.G., B.T., C.M., M.W., O.R., T.L., S.O., E.R., J.P.B., M.K., M.A.K. collected and measured data; C.B., J.Z., T.H., analyzed data; C.B., J.Z., C.M. wrote the manuscript; All authors reviewed the manuscript.
www.nature.com/scientificreports/
1 1SCIENTIFIC RepORts | (2018) 8:15249 | DOI:10.1038/s41598-018-33507-7
Additional InformationSupplementary information accompanies this paper at https://doi.org/10.1038/s41598-018-33507-7.Competing Interests: PW is shareholder and employee of Nightingale Health Ltd, a company offering NMR-based metabolic profiling.Publisher's note: Springer Nature remains neutral with regard to jurisdictional claims in published maps and institutional affiliations.
Open Access This article is licensed under a Creative Commons Attribution 4.0 International License, which permits use, sharing, adaptation, distribution and reproduction in any medium or
format, as long as you give appropriate credit to the original author(s) and the source, provide a link to the Cre-ative Commons license, and indicate if changes were made. The images or other third party material in this article are included in the article’s Creative Commons license, unless indicated otherwise in a credit line to the material. If material is not included in the article’s Creative Commons license and your intended use is not per-mitted by statutory regulation or exceeds the permitted use, you will need to obtain permission directly from the copyright holder. To view a copy of this license, visit http://creativecommons.org/licenses/by/4.0/. © The Author(s) 2018