cities and opportunity in 21st century america
TRANSCRIPT

November 2020
CITIES AND OPPORTUNITY IN 21st CENTURY AMERICA
The George W. Bush Institute’sBlueprint for opportunity Series
NO. 1
J.H. Cullum ClarkDirector, George W. Bush Institute – SMU Economic Growth Initiative

About the George W. Bush Institute:Housed within the George W. Bush Presidential Center, the George W. Bush Institute is an action-
oriented, nonpartisan, policy organization with the mission of developing leaders, advancing policy, and taking action to solve today’s most pressing challenges. Through three Impact Centers — Domestic
Excellence, Global Leadership, and an Engagement Agenda — the Bush Institute delivers measurable results that save and improve lives. To learn more, visit www.BushCenter.org.
Blueprint for opportunity Series:The Blueprint for Opportunity series will advance a policy agenda for improving economic mobility to help
Americans flourish. It focuses on strengthening America’s cities in their vital role as engines of upward mobility. Cities and neighborhoods make a powerful difference to people’s opportunities, and the local
level is where most of the policy energy is in the United States today. America has numerous metro areas that score relatively high as cities of opportunity, but the nation needs more.
Acknowledgments:The author thanks his George W. Bush Institute colleagues Anu Chatterjee, Nicholas Saliba, Kristin
Kent Spanos, and Ben Stutts as well as Meagan Martin, Christine McDaniel, Jesse Pulliam, and Ashley Winston of The MacroDyn Group for their invaluable research help on this project. He also thanks his
Bush Institute colleagues Margot Habiby, Holly Kuzmich, Ioanna Papas, Matthew Rooney, Justine Taylor-Raymond, Jessica Wheeler, and Anne Wicks, as well as Henry Cisneros (former U.S. Secretary of Housing and Urban Development and Mayor of San Antonio), Wendell Cox (Demographia and the Urban Reform Institute), Klaus Desmet (SMU Department of Economics), Steffen Fuchs (McKinsey), Bill Fulton (Kinder Institute for Urban Research, Rice University), Sophia Johnson (Alpha Business Images), Joel
Kotkin (Chapman University and the Urban Reform Institute), Byron Sanders (Big Thought), Miguel Solis (Coalition for a New Dallas), and Enisha Williams (Texas 2036) for their help and advice on this report.

C I T I E S A N D O P P O R T U N I T Y I N 2 1 s t C E N T U R Y A M E R I C A • G E O R G E W. B U S H I N S T I T U T E
1
Summary
This report explores why cities and neighborhoods so strongly influence economic mobility and how America can create more cities of opportunity.
We examine overall income and wealth trends and those for individual metropolitan areas. High-performing metros for economic mobility have been unusually successful in fostering relatively high college completion, job-market access, new business creation, and housing affordability. They also tend to score high for social capital – the dense fabric of social connection and civic engagement that makes a community tick.
We identify 61 standout metros for economic mobility, together home to 80 million Americans. Many high-opportunity metros are mid-sized and middle-income rather than large and wealthy – showing that creating a high-opportunity city doesn’t require the vast wealth of America’s top technology or finance capitals. Every city or town has unexplored avenues to promote opportunity, one neighborhood at a time.
The George W. Bush Institute’s Blueprint for Opportunity series will map out a market-oriented policy agenda for creating more cities of opportunity, based on the experience of today’s high-opportunity cities.
The Blueprint for Opportunity agenda will focus on:• Strengthening cities as quality-of-life centers where people will choose to live and work• Planning for a more geographically decentralized and digitally connected model of work• Building on the central role of local “anchor institutions” • Promoting small business development• Creating new paths from education to the workforce• Capitalizing on the growing diversity in America’s cities• Expanding housing supply and affordability• Promoting homeownership and other avenues of wealth accumulation• Strengthening local institutions of civil society• Empowering local communities in the implementation of federally funded policies

C I T I E S A N D O P P O R T U N I T Y I N 2 1 s t C E N T U R Y A M E R I C A • G E O R G E W. B U S H I N S T I T U T E
2
Table of Contents
I. INTRODUCTIONRenewing economic mobility, one city or neighborhood at a timeA 21st century opportunity agendaThe case for a “new localism” agenda
II. ECONOMIC MOBILITY IN 21st CENTURY AMERICAIncome trends: What the data show
Good newsTroubling newsThe pivotal role of human capitalVariation across cities and neighborhoods
The rising cost of a middle-class standard of livingThe cost of necessitiesVariation across cities and neighborhoods
Wealth trends: What the data showFalling wealth levels and rising disparitiesVariation across cities and neighborhoods
III. WHY CITIES AND NEIGHBORHOODS SO STRONGLY INFLUENCE ECONOMIC MOBILITYProductivity and job-market access
ProductivityJob-market access
Small business ownershipHousing affordability, homeownership, and segregation
Standards of living and savingsHomeownershipSegregationExplaining variation in housing affordability and segregation
EducationSocial capital
IV. CITIES OF OPPORTUNITYThree measures of metro-area economic mobilityTakeaways from the dataStandout metros
Three groups of outperformersRaceInternational comparisonsWhat high-opportunity metros get right
V. TOWARD A 21st CENTURY OPPORTUNITY AGENDABoth people- and place-based policiesCreate more cities of opportunity
APPENDIX: METRO AREAS OF OPPORTUNITY
Page
4446889
101113151517181820212121222424242525262729323233363637383940404044

C I T I E S A N D O P P O R T U N I T Y I N 2 1 s t C E N T U R Y A M E R I C A • G E O R G E W. B U S H I N S T I T U T E
3
List of Figures
Figure 1: Real incomes have increased since the 1970s, especially after taxes and transfers
Figure 2: Strong income gains for the growing college-educated population, but not for people with lower educational attainment
Figure 3: Rising costs of housing, healthcare, and education
Figure 4: Rising urban home prices
Figure 5: The middle quintile has seen its wealth decline – and the bottom two quintiles have no wealth
Figure 6: Productivity differences across metros
Figure 7: Job-market access across metros
Figure 8: Housing affordability across metros
Figure 9: College shares across metros
Figure 10: Social capital across metros
Figure 11: Correlations among economic mobility measures and job access, education, social capital, and size variables
Figure 12: Standards of living across metros
Figure 13: Domestic migration: From the coasts and the Midwest to the Sun Belt and the Northwest 13 states
Figure 14: Cities of opportunity
Page
9
13
16
16
19
22
23
27
29
31
33
34
35
37
C I T I E S A N D O P P O R T U N I T Y I N 2 1 s t C E N T U R Y A M E R I C A • G E O R G E W. B U S H I N S T I T U T E
4
I. INTRODUCTION
Renewing economic mobility, one city or neighborhood at a time
Cities have long been humankind’s greatest engines of opportunity and upward mobility. In the diverse economic geography of the United States, some cities and even neighborhoods are functioning far better as engines of opportunity than others. Supreme Court Justice Louis Brandeis famously said that the nation’s diverse, decentralized states and localities are “laboratories of democracy.” Today, there are countless policy experiments at work in these laboratories, with valuable lessons for policymakers, community leaders, and all concerned with renewing economic mobility in America.
The George W. Bush Institute’s Blueprint for Opportunity series aims to advance a new opportunity agenda for America’s cities. It focuses on improving the workings of markets to address challenges surrounding economic development, small business creation, housing attainability, and other issues that play a central role in shaping economic opportunities. Our agenda addresses two overarching challenges: creating more vitality in struggling places, and creating more opportunity for a wider range of people in thriving places. Our goal: create more cities of opportunity in America.
This report, the first in the series, summarizes the key realities of economic mobility in 21st century America, overall and for individual cities. We identify a number of metropolitan areas that have distinguished themselves as outperformers on various measures of economic mobility. We show that these places tend to score high on measures of job-market access, wealth-building opportunities, housing affordability, and college completion. They also generally score high for social capital – the dense fabric of social connection, civic engagement, and voluntarism that makes a community tick.
A 21th century opportunity agenda
Our policy agenda focuses on improving economic outcomes for people – jobs, income, and wealth. Flourishing clearly extends beyond dollars and cents to include personal dignity, family, community, and service to others,1 but an agenda to advance human well-being starts with economics. A growing sense among many citizens that American prosperity has left them behind is closely associated with the decline in traditional middle-class jobs and the difficulty many Americans have in keeping up with rising living costs in numerous cities. The COVID-19 crisis, moreover, is imposing severe new economic stresses on millions of Americans as well as highlighting disparities that have been hiding in plain sight for decades.
In today’s America, some cities that are thriving as engines of human flourishing and upward mobility are middle-income rather than wealthy. To create a thriving city, one that enables as many of its citizens as possible to achieve a good life, doesn’t require the extraordinary income levels of America’s top technology or finance
1 See, for example, Carney, Alienated America, p. xiii.
We refuse to believe that there are insufficient funds in the great vaults of opportunity in this nation.
- Dr. Martin Luther King, Jr.“I Have a Dream” speech
August 1963
C I T I E S A N D O P P O R T U N I T Y I N 2 1 s t C E N T U R Y A M E R I C A • G E O R G E W. B U S H I N S T I T U T E
5
capitals. Every city or town has unexplored avenues to promote the pursuit of happiness, one neighborhood at a time.
Thriving cities and neighborhoods succeed in large part because they benefit from relatively well-functioning markets in labor, land, capital, and ideas. Private markets work. Not perfectly, of course, but they have always outperformed central planning as a means of promoting well-being and lifting people from poverty. This principle has many implications: liberalized occupational licensing, looser land-use rules, welcoming policies for entrepreneurs, and fewer government-sponsored oligopolies, to name a few.
Markets inherently mean change. New technologies are generating unfathomable shifts in the world of work and the functioning of cities. The COVID-19 crisis is accelerating these developments, with consequences extending long beyond the pandemic. A market-oriented policy agenda must embrace and build on long-term trends, rather than indulging in futile nostalgia for the conditions of earlier times. Cities, for instance, won’t recreate the vast numbers of manufacturing jobs they had in the mid-20th century. After the pandemic, they will likely never have as many people working 40 hours a week in urban office buildings as they had in February 2020.
A 21st century opportunity agenda must also confront the fraught history and current realities of racial injustice in U.S. cities. This means viewing challenges in economic development, new business creation, housing attainability, and other areas partly through the lens of racial equity – the imperative of creating a future in which race is no longer predictive of economic outcomes.
For the Bush Institute, this series is one piece in a larger opportunity agenda also focused on maximizing economic growth and improving education. The best upward mobility program ever devised is a good job, and the best means of creating good jobs is economic growth. The Bush Institute is engaged in every pressing issue widely seen as influencing America’s long-term growth rate – overall economic freedom, research and innovation, international trade openness, immigration, and America’s surging national debt. But the performance of the national economy is an add-up of the performance of all the nation’s localities. A top-heavy growth model based on a handful of booming megacities focused on finance and technology doesn’t score high for inclusiveness or broad-based opportunity – and it isn’t sustainable. America needs more decentralized, inclusive patterns of growth.
The Bush Institute has also long focused on improving leadership, accountability, and achievement in America’s schools. The economic mobility agenda we present in these reports complements strategies focused on improving education. It reflects the growing understanding among education experts that student achievement depends heavily on household factors like family financial security and housing stability as well as a variety of neighborhood factors, and also the conviction that great schools can and do play a central role in helping young people achieve upward mobility from poverty.
Based on lessons from today’s best cities of opportunity, we call for a 21st century policy agenda emphasizing the following priorities:
• Reorienting toward people-first economic development, making more cities into quality-of-life centers where homegrown upwardly mobile people will want to stay and geographically mobile people will choose to live and work, and recognizing that businesses will follow
• Planning for new, more geographically decentralized and digitally connected models of work• Building on the central role of “eds and meds” institutions and other local “anchors”• Promoting homegrown local business creation, especially among entrepreneurs of color• Loosening occupational licensing and cutting regulatory policies that impede entrepreneurship• Creating new and relevant paths from secondary and postsecondary education into the workforce,
including novel local initiatives to make work pay better for lower-income people

C I T I E S A N D O P P O R T U N I T Y I N 2 1 s t C E N T U R Y A M E R I C A • G E O R G E W. B U S H I N S T I T U T E
6
The case for a “new localism” agenda
Our Blueprint for Opportunity series calls for an opportunity agenda rooted in what scholars Bruce Katz and Jeremy Nowak call the “new localism” – the growing trend around the world to address social and economic challenges through locally developed solutions, adapted to local conditions.2 There are two reasons why a localist agenda should figure prominently in strategies to increase opportunity.
First, local realities play a critical role in determining the opportunities available to people. Numerous studies prove that the neighborhood in which people grows up powerfully influences their income in adulthood and a host of other outcomes. Harvard economist Raj Chetty and his colleagues conclude from a series of landmark studies that “intergenerational mobility is a local problem.”3 And different cities hold back opportunity in different ways, which demands solutions tailored to each city.
Economic growth has left too many regions, cities, and neighborhoods – and the people living there –behind. Places of poor upward mobility tend to have large Black, Hispanic, or Native American communities. Meanwhile, numerous booming cities have become unaffordable for moderate- to lower-income people, presenting a different kind of barrier to opportunity.
Second, the local level is largely where the policymaking energy and action are in 21st century America – in schools, community colleges, social enterprises, housing, placemaking, and more.4 The American people understand this trend. According to one survey, the share of people who trust the federal government “always or most of the time” has declined to 19% in 2018 from 77% in 1964. Over the same period, the share who trust local government has gone up, to 72% from 63%.5
What accounts for this striking divergence? Much more than the polarized federal government, many cities are pursuing a diverse array of policy initiatives aimed at growing the pie for all. Local governments generally have the ability to act pragmatically and without partisan rancor, to collaborate with local business and nonprofit
2 B. Katz and J. Nowak (2017), The New Localism: How Cities Can Thrive in the Age of Populism, Brookings Institution.3 Quoted in Carney, Alienated America, p. 82.4 Katz and Nowak, New Localism, p. 7.5 Cited on the website of the U.S. Congress Joint Economic Committee, available at jec.senate.gov.
• Welcoming and celebrating increased human diversity, particularly immigrant communities and local communities of color
• Developing more innovative, walkable, mixed-use neighborhoods, including revived Black, Hispanic, and Asian American “downtowns”
• Expanding housing supply at all price points in high-opportunity places through looser land-use rules, repurposed existing real estate, and continuing development and urbanization of high-growth smaller metro areas and suburban cities
• Building on innovative models to enable wealth accumulation and homeownership, such as “baby bonds” and shared-equity home financing vehicles
• Strengthening the role of local institutions of civil society, including nonprofits, media organizations, and arts and culture institutions – and making them more racially inclusive
• Empowering local governments and communities in the implementation of federally funded infrastructure and place-based policies
The share of people who trust the federal government “always or most of the time” has declined to 19% in 2018 from 77% in 1964. Over the same period, the share who trust local government has increased to 72% from 63%.

C I T I E S A N D O P P O R T U N I T Y I N 2 1 s t C E N T U R Y A M E R I C A • G E O R G E W. B U S H I N S T I T U T E
7
partners, and, in the words of Katz and Nowak, to pursue “iterative problem solving rather than … rigid and prescriptive solutions.”6
A localist agenda emphasizes pushing decision-making as far down the hierarchy of federal, state, local, and neighborhood responsibility as it can go, and welcoming the diversity that results. The New York Times columnist David Brooks, investigating why the Los Angeles suburb of Compton delivers better economic mobility than the demographically similar Watts neighborhood of Los Angeles, attributes Compton’s success to the fact that it has its own local government. “Social mobility rises village by village,” he concludes.
Local governments must focus relentlessly on doing their core functions well. This means providing public goods like parks and greenspace, public safety, and other features that make a city an attractive place to live and work. They must work toward the success of local anchor institutions in vital fields like education, healthcare, and the arts. They also play an indispensable role in helping lower-income residents in areas like affordable housing.
Too many regulations, particularly at the local level, protect the interests of incumbent businesses, homeowners, and others at the expense of newcomers. A local economy that is hostile to newcomers, including people from disadvantaged neighborhoods, new arrivals from elsewhere in America, immigrants, entrepreneurs, and younger generations, is a city doomed to decay and fading opportunity.
The federal government still has a crucial role to play. It must maintain the safety net, enforce civil rights and fair housing laws, and build large-scale infrastructure. Above all, the federal government’s comparative advantage is its vast fiscal capacity, which makes it best positioned to bear responsibility for funding basic research, college lending, affordable housing, and healthcare programs.
6 Ibid., pp. 1-6.

C I T I E S A N D O P P O R T U N I T Y I N 2 1 s t C E N T U R Y A M E R I C A • G E O R G E W. B U S H I N S T I T U T E
8
II. ECONOMIC MOBILITY IN 21ST CENTURY AMERICA
Earned upward mobility has always figured prominently in American conceptions of who we are as a nation. Today, however, Americans express growing concern over the health of the American Dream. According to a RealClear Opinion survey, 74% of Americans think the American Dream is “under moderate to severe distress” or worse. Half of the survey’s respondents under age 50 believe U.S. capitalism is “broken” and “not working well.”7 Political leaders and pundits of both the left and right increasingly offer gloomy assessments of U.S. upward mobility.8
This report offers a more nuanced perspective. The American Dream is clearly alive and well for a great many Americans, particularly those prepared by education to participate in today’s knowledge-centric economy. But a family’s prospects for achieving upward mobility from one generation to the next depend heavily on the education, job, and wealth-building opportunities available to them, and these depend to a remarkable degree on the city and ZIP code in which they live.
“Economic mobility” describes the extent to which people and families are getting ahead over time. We can measure it in a number of ways. We can look at how people are doing in terms of annual income or wealth, defined as assets minus its liabilities at a moment in time. We can examine people’s income either before or after taxes and government transfer payments, and either in absolute terms or relative to the nation’s overall income distribution.
Improving economic mobility should be a top-tier priority, for three reasons:• Economic mobility is a key measure of how the nation is doing in increasing human well-being. • Building an economy in which as many people as possible fulfill their potential is crucial to growth and
prosperity for all.• Americans aren’t likely to view our economic system as fair unless they believe that hard-working,
enterprising people have a good shot at getting ahead.
Income trends: What the data show
7 C.M. Cannon and T. Bevan, “The American Dream: Not dead – yet,” Real Clear Politics, 6 March 2019.8 See quotes in M. Strain (2020), The American Dream is Not Dead (But Populism Could Kill It), Templeton Press, Kindle edition, loc. 163; T.P. Carney
(2019), Alienated America: Why Some Places Thrive While Others Collapse, Harper, 2019.
Improving economic mobility should be a top-tier priority, for three reasons: 1. Economic mobility is a key measure of how the nation is doing in increasing human well-being. 2. Building an economy in which as many people as possible fulfill their potential is crucial to growth and
prosperity for all.3. Americans aren’t likely to view our economic system as fair unless they believe that hard-working,
enterprising people have a good shot at getting ahead.
Household incomes have grown since the 1970s, particularly for college-educated Americans. But economic mobility as measured by income has been significantly lower among people without a college degree as well as among Black and Hispanic families. The rising costs of what most people view as necessities of a middle-class standard of living, especially housing, also pose a growing obstacle to upward mobility. Economic mobility looks worse when measured by net wealth – bad news in view of the central role household wealth plays in shaping opportunity for subsequent generations.

C I T I E S A N D O P P O R T U N I T Y I N 2 1 s t C E N T U R Y A M E R I C A • G E O R G E W. B U S H I N S T I T U T E
9
Good news: Consider, first, some good news.
• Pretax incomes for median and below-median U.S. households have grown considerably over the last four decades: While top incomes have grown faster, median pretax household income increased 30% from 1979 to 2016, using the Personal Consumption Expenditures (PCE) index to adjust price levels over time. This is a slower pace than most economists believe the U.S. economy could achieve.9 But contrary to claims that workers have realized negligible real income growth, it’s well above zero.10
• Median and below-median household incomes have grown faster when measured after taxes and government transfers than at the pretax level: The U.S. income tax system is highly progressive. The overall effect of tax law changes under Presidents George W. Bush, Barack Obama, and Donald Trump has been to increase the share of taxes paid by high earners and reduce the tax rate of the median household.11 In addition, government at all levels makes annual transfer payments to households of about $1.9 trillion, or 9% of GDP.12 As the median household’s tax rates have declined but the transfers it receives have grown, median household income rose 52% between 1979 and 2016 after taxes, transfers, and PCE inflation.13 Figure 1 shows changes in average annual income since 1979, both before and after taxes and transfers, for the first (lowest), second, and third income quintiles, adjusted for PCE inflation. As the figure illustrates, incomes have grown faster after taxes and transfers than before for all three groups.
9 Wage growth has lagged that of several peer countries, supporting the premise that the U.S. economy could do better. Based on data in a 2020 McKinsey Global Institute report, average hourly wages rose 0.9% a year from 2000 to 2018 adjusted for inflation, behind New Zealand (1.6%), Sweden (1.5%), Denmark (1.3%), and Canada (1.2%). Estimates of real income growth depend on which inflation index one uses to adjust for price increases over time. The Personal Consumer Expenditures (PCE) index reflects the mix of goods that businesses are actually selling, reflecting that consumers substitute from goods that have moved up in price in relative terms and toward similar goods that have become relatively cheaper. The Consumer Price Index, by contrast, measures price changes for a slow-changing basket of goods. Studies show that the CPI has generally overstated the actual price increases experienced by consumers by about 0.5% per year for the last several decades. This distinction is important in estimating economic mobility, because overstating inflation means understating the inflation-adjusted growth in people’s resources. The Federal Reserve and the Congressional Budget Office prefer the PCE (M. Strain, The American Dream is Not Dead (But Populism Could Kill It), Templeton Press, Kindle edition, loc. 390-424).
10 Congressional Budget Office data.11 Congressional Budget Office data, cited in P. Gramm & J.F. Early, “Wealthy Americans already pay their share,” Wall Street Journal op-ed, 26 February
2020; Tax Foundation, “Summary of the latest federal income tax data, 2018 update,” 13 November 2018, available at https://taxfoundation.org/summa-ry-latest-federal-income-tax-data-2018-update/.
12 Congressional Budget Office data, cited in P. Gramm and J.F. Early, “The truth about income inequality,” Wall Street Journal op-ed, 4 November 2019.13 Congressional Budget Office data.
Figure 1. Real incomes have increased since the 1970s, especially after taxes and transfers(Average pre- and post-tax/transfer incomes of households in the bottom three income quintiles, adjusted for PCE inflation, 1979-2017)

C I T I E S A N D O P P O R T U N I T Y I N 2 1 s t C E N T U R Y A M E R I C A • G E O R G E W. B U S H I N S T I T U T E
1 0
• Living standards have improved dramatically for most Americans over the last several decades in ways that real income statistics can’t capture: Survival rates for heart attacks, infectious diseases, and most cancers are much higher than in the 1970s. The average number of days of paid leave for full-time employed American workers has increased to 22 today from 16 in 1970.14 SMU’s Bridwell Institute for Economic Freedom has documented the enormous benefits people have enjoyed from replacing more than a dozen appliances with a single smartphone – and almost all Americans have one.15 Work continues to grow less dangerous and more engaging for most workers, as a 2020 McKinsey Global Institute report documents.16 Technological progress has allowed almost half of Americans to work safely and productively at home through the COVID-19 crisis, which would have been impossible even 20 years ago.17
• Intergenerational relative mobility – where people end up in the income ladder relative to the family into which they were born – is at least a mixed picture: Only 7.5% of Americans born into families in the bottom income quintile achieve the “rags-to-riches” story of reaching the top income quintile in adulthood, as Chetty has shown.18 But economist Michael Strain of American Enterprise Institute (AEI) points out that 30% of people born into the bottom quintile and 42% born into the second quintile from the bottom succeed in attaining “rags-to-comfort,” rising to the middle or fourth (second from the top) quintile.19
Troubling news: But there’s also troubling news.
• Incomes are stagnant for Americans with only a high school diploma or less: The median pretax wage of men between 25 and 44 years old with a high school education or less is lower today than in 1969, adjusted for inflation.20 How can this be, if income levels have been rising for lower-income groups? The share of young people completing at least some post-secondary education is steadily growing, including among low-income Americans. The population share with at best a high school diploma is declining, but it still represents just over half of Americans aged 25 to 3021 – and this group is struggling.22
• Income has become more volatile for lower-income workers, imposing a growing toll on their economic well-being and opportunities:23 The COVID-19 crisis has dramatically highlighted this trend. Between March and June 2020, 40% of workers earning less than $40,000 a year lost their jobs to layoffs or furloughs, compared with 13% of workers earning more than $100,000.24 Even if the average income of lower-income people is going up, earnings volatility over time can be devastating for families living paycheck to paycheck. Studies have long shown that households go to considerable lengths to smooth consumption over time.25
• Economic mobility is far worse for people of color – particularly Black Americans – than for White Americans: Median pretax income for Black Americans stood at 58% of the median for White households in 2018 – the same as in 1973. Median income for Hispanics was 73% of the White household median,
14 Strain, The American Dream is Not Dead, loc. 550-76.15 W.M. Cox and R. Alm (2019), “Big business: Disruptive technologies, market structure, and competition in the 21st century,” O’Neil Center for Global
Markets and Freedom 2018-19 Annual Report, Cox School of Business, Southern Methodist University.16 McKinsey Global Institute (2020), “The social contract in the 21st century: Outcomes for workers, consumers, and savers in advanced economies.”17 “Stanford research provides a snapshot of a new, working-from-home economy,” Stanford News, 29 June 2020, available at https://news.stanford.
edu/2020/06/29/snapshot-new-working-home-economy/.18 R. Chetty et al. (2017), “The fading American dream: Trends in absolute income mobility since 1940,” Science 356(6336), pp. 398-406.19 Strain, The American Dream is Not Dead, loc. 813.20 Carney, Alienated America, p. 51. See also Henry Olsen’s dissent in Strain, The American Dream is Not Dead, loc. 1193.21 As of 2019, approximately 49% of Americans aged 25 to 29 had completed an associate degree or higher, and an additional 17% had completed some
college coursework but had not earned a degree (National Center for Education Statistics data, U.S. Department of Education; American Community Survey, U.S. Census Bureau).
22 American Community Survey data, U.S. Census Bureau; National Center for Education Statistics, U.S. Department of Education, available at: https://nces.ed.gov/programs/digest/d19/tables/dt19_104.20.asp.
23 McKinsey Global Institute, “The social contract in the 21st century.”24 R. Kapadia, “The high cost of inequality,” Barron’s, 22 June 2020.25 A. Deaton (1991), “Saving and liquidity constraints,” Econometrica 59(5), 1221-48; A. Leigh, C. Jencks, and T.M. Smeeding (2009), “Health and economic
inequality,” in W. Salverda et al. eds., Oxford Handbook of Economic Inequality (Oxford University Press); F.J. Zimmerman and M.R. Carter (2003), “Asset smoothing, consumption smoothing, and the reproduction of inequality under risk and subsistence constraints,” Journal of Development Economics 71(2), 233-60 (August).
C I T I E S A N D O P P O R T U N I T Y I N 2 1 s t C E N T U R Y A M E R I C A • G E O R G E W. B U S H I N S T I T U T E
1 1
also unchanged since 1973.26 Black workers earn about 20% less than White workers in comparable jobs, according to studies by Harvard University economist Roland Fryer. When researchers submit fictional resumes for real job postings, applicants with Black-sounding names receive a third fewer callbacks than those with White-sounding names and do worse even when they have more impressive resumes on paper.27 Black Americans born into bottom-quintile families are much more likely to remain there in adulthood than White Americans from the bottom quintile, and Black people born into higher quintiles are more likely to fall back down the ladder.28
• At least one third of Americans are making less than their parents did at a similar stage of life: According to studies by Chetty and his colleagues, the share of households with income greater than their parents earned has declined to about 50% for the cohort born in 1980 from 90% for people born in 1940. Strain notes that if we adjust for the smaller number of people per household and use the PCE index to adjust for inflation, the share of individuals earning more than their parents did is closer to two thirds.29 Still, this points to a tremendous number of Americans who are downwardly mobile in absolute terms by this measure.
• Intergenerational relative mobility in the United States is lower than in most other advanced economies, some of which have seen rising mobility over recent decades: Data from the World Bank as well as from academic economists confirm that the United States ranks relatively low. High-mobility economies include Canada, Australia, New Zealand, Japan, South Korea, and the Scandinavian countries. America’s statistics for intergenerational mobility are comparable to those of Brazil, Mexico, China, and India.30 Intergenerational mobility in the United States was comparable to most European countries a generation or two ago, but countries including Spain as well as Sweden and Denmark have experienced substantial increases since then.31
The pivotal role of human capital: People’s “human capital” – starting with their education but also including their work habits, workplace-relevant skills, technological savvy, social connections, and ability to plan for the future – plays a central role in determining their ability to contribute productively in today’s economy. These attributes shape people’s productivity, which in turn heavily influences their income.
Consider these facts on how human capital influences productivity and incomes:• Incomes have followed productivity trends closely: A core idea in labor economics is that wage levels
closely reflect labor productivity. In an efficient labor market, no firm would pay its workers more than the additional revenue the firm earns from adding another worker at the margin. If it did, it would lose money from adding workers and ultimately go out of business. And no firm could long pay its workers less than the “marginal revenue product” of adding another worker or other firms would seize the opportunity to lure its employees away. A study by economists Anna Stansbury and Lawrence Summers found that growth in labor productivity closely predicted real compensation growth from 1975 to 2015, through several accelerations and decelerations over time.32 The close match between labor productivity and earnings suggests that commonly cited factors like declining union membership and failure to raise the federal
26 U.S. Census Bureau data.27 Tanner, Inclusive Economy, p. 100.28 R. Akee, M.R. Jones, and S.R. Porter (2019), “Race matters: Income shares, income inequality, and income mobility for all U.S. races,” Demography
56(3), pp. 999-1021 (June).29 Strain, The American Dream is Not Dead, loc. 881.30 World Bank’s Global Database on Intergenerational Mobility; A. Narayan, R. van der Weide, et al. (2018), “Fair progress? Economic mobility across Gen-
erations around the World,” World Bank report, Equity and Development Series; R. Chetty, N. Hendren, P. Kline, and E. Saez (2014), “Where is the Land of Opportunity? The geography of intergenerational mobility in the United States,” NBER WP No. 19843 (June); M. Jantti and E. Sieminska (2006), “Survey estimates of wealth holdings in OECD countries: Evidence on the level and distribution across selected countries,” WIDER Research Paper 2007/17, available at https://www.econstor.eu/handle/10419/63571; J. Blanden, P. Gregg, and S. Machin (2005), “Intergenerational mobility in Europe and North America,” Centre for Economic Performance (April).
31 G. Esping-Anderson and S. Wagner (2012), “Asymmetries in the opportunity structure: Intergenerational mobility trends in Europe,” Research in Social Stratification and Mobility 30(4), pp. 473-87; M. Jantti et al. (2006), “American exceptionalism in a new light: A comparison of intergenerational earnings mobility in the Nordic countries, the United Kingdom, and the United States,” AZA Discussion Paper No. 1938 (Bonn: Institute for the Study of Labor).
32 A.M. Stansbury and L.H. Summers (2017), “Productivity and pay: Is the link broken?” NBER W.P. No. 24165 (December).

C I T I E S A N D O P P O R T U N I T Y I N 2 1 s t C E N T U R Y A M E R I C A • G E O R G E W. B U S H I N S T I T U T E
1 2
minimum wage – while not irrelevant – have played secondary roles in explaining income trends in recent decades. The chief reason for relatively low income growth is low productivity growth.
• Differences in education levels drive much of the differences in people’s incomes:33 The labor market awards higher wages to people with a bachelor’s degree than less educated workers, a gap economists call the “college premium.” The college premium has long fluctuated according to what Harvard economists Claudia Goldin and Lawrence Katz call a “race” between technology and education. When technical progress increases the demand for college-educated workers with high-level cognitive skills faster than the education system can produce them, the college premium goes up. For the last three decades, demand has far outstripped supply. A recent study shows the college premium for American men, defined as the ratio of average wages for college-educated workers to average wages for non-college educated workers, increased to 1.90 in 2017 from 1.77 in 1987. For women, it increased to 1.97 from 1.77.34 Against this backdrop, a college education has been a more powerful escalator of upward mobility than ever.35
• Good news: The number of high-skilled college graduates is rising as a share of America’s adult population: Sixty-nine percent of young people now enroll in a post-secondary program immediately following high school, up from 49% in 1980. 62% of young Black people and 63% of young Hispanic people enroll. The share of 25- to 29-year-olds who’ve completed a bachelor’s degree or higher has gone up as well, to 36% in 2015 from 23% in 1980.36
• Bad news: educational attainment levels are growing more slowly in the United States than in most high-mobility countries, and family income is still highly predictive of educational outcomes: Among college-age Americans whose families have incomes below $50,000, approximately 30% enroll in a four-year institution – compared with 80% of people from families earning $100,000 and 90% of people from families earning more than $200,000. Among low-income young people, 16% complete a four-year degree by age 29, compared with 60% of their higher-income peers.37 Even among high-performing high school students, young people from lower-income families have significantly lower college enrollment and completion than their higher-income peers.38
• Productivity growth has been relatively slow among lower-skilled American workers: In a 2019 study, Stanford University economist Edward Lazear showed that productivity grew far more slowly in industries that mostly employ less educated people from 1989 to 2017 than in industries that mostly employ highly educated people. Strikingly, these productivity differences across industries more than fully explain differences across industries in wage growth.39
Figure 2 illustrates the relationship between education levels and incomes over time. The left panel shows that people with a bachelor’s degree or higher have experienced strong inflation-adjusted income growth since 1979, while people with lower levels of educational attainment have seen relatively small gains. The right panel shows that the share of young adults with some degree of postsecondary educational attainment has steadily grown, but the share with no educational credential higher than a high school diploma remains stubbornly high at 51%.
The takeaway from this analysis is that an agenda for improving economic mobility should prioritize raising education levels, other measures of human capital, and productivity.
33 E.P. Lazear (2003), “Teacher incentives,” Swedish Economic Policy Review 10(3), pp. 179-214.34 Lazear, “Productivity and wages”; EA Hanushek & L Woessmann (2015), The Knowledge Capital of Nations: Education and the Economics of Growth,
Cambridge: MIT Press, p. 42.35 Tanner, Inclusive Economy, p. 62.36 Data from the National Center for Education Statistics, Department of Education.37 Ibid.38 A.P. Carnevale et al. (2019), “Born to win, schooled to lose: Why equally talented students don’t get equal chances to be all they can be,” Georgetown
University Center on Education and the Workforce.39 Lazear, “Productivity and wages.”

C I T I E S A N D O P P O R T U N I T Y I N 2 1 s t C E N T U R Y A M E R I C A • G E O R G E W. B U S H I N S T I T U T E
1 3
Variation across cities and neighborhoods: Some cities perform far ahead of others in terms of human capital development, productivity, incomes, and upward mobility.
The share of people with a bachelor’s degree or higher is almost four times larger in America’s best-educated metropolitan areas than in those with the lowest levels of educational attainment.40 College achievement levels for metro areas from the U.S. Census Bureau are an imperfect proxy for how well metros perform in educating their young people, since these figures reflect the effects of people moving in and out. Still, most people don’t move far from where they grew up, so metro-area data are at least suggestive.41
Metro areas that scored high for college attainment levels in 2010, moreover, generally widened their lead over other metros over the last decade. While population shares with a bachelor’s degree or higher increased from 2010 to 2018 in all but four of America’s 382 metros, 2010 college shares and subsequent growth in this metric were positively correlated. Of the 53 metros with population over 1 million, the five achieving the largest increases were San Jose, California; Pittsburgh; Portland, Oregon; Grand Rapids, Michigan; and Richmond, Virginia – all metros that had relatively high college shares in 2010.
The top 30 metros for gross domestic product (GDP) per worker, a measure of average productivity, had values between $150,000 and $310,000 in 2018. The bottom 60, meanwhile, all had GDP per worker below $90,000. In a 2019 report on the future of work, McKinsey Global Institute predicts that 25 large metro areas plus roughly 35 smaller “powerhouse” metros42 will pull ever further ahead of other cities in technological and economic terms as
40 American Community Survey data for 2018, U.S. Census Bureau.41 This report focuses on data at the level of what the U.S. Census Bureau calls “Metropolitan Statistical Areas” (metro areas or metros) rather than specific
jurisdictions within metro areas, consistent with the general approach among urban economists to treat metro areas as natural economic units. The Cen-sus Bureau lists 382 metro areas in the United States. Large metros typically consist of several counties and numerous jurisdictions, and in some cases overlap across state lines. We use the terms “city,” “metro area,” and “metro” interchangeably in this report.
42 McKinsey’s list of breakaway metro areas includes 25 large metros: Boston; New York; Philadelphia; Washington; Chicago; Raleigh, North Carolina; Charlotte, North Carolina; Orlando, Florida; Tampa, Florida; Miami; Atlanta; Nashville, Tennessee; Dallas-Fort Worth; Houston; Austin, Texas; San Antonio; Phoenix; Las Vegas; Minneapolis-St. Paul; Denver; Seattle; Portland, Oregon; San Francisco; San Jose, California; and Los Angeles. It also includes almost 40 smaller “powerhouse” metros and “college-centric towns,” such as Ann Arbor, Michigan; Charlottesville, Virginia; Durham, North Carolina; College Station, Texas; Des Moines, Iowa; Iowa City, Iowa; Boise, Idaho; Boulder, Colorado; Greeley, Colorado; Fort Collins, Colorado; Provo, Utah; Bend, Oregon; and Santa Barbara, California. McKinsey Global Institute (2019), “The future of work in America: People and places, today and tomorrow” (July).
Cities and neighborhoods vary enormously in educational attainment, labor productivity, household incomes, and intergenerational upward mobility.
Figure 2. Strong income gains for the growing college-educated population, but not for people with lower educational attainments
Left panel: Average pretax income adjusted for PCE inflation, 1979-2019, with each group rebased to 1.0 for 1979; Right panel: Share of population aged 25-29 by educational attainment level, 1970-2019

C I T I E S A N D O P P O R T U N I T Y I N 2 1 s t C E N T U R Y A M E R I C A • G E O R G E W. B U S H I N S T I T U T E
1 4
the economy evolves towards greater reliance on automation, digitization, and artificial intelligence.43
Even controlling for education levels, some cities far outperform others in productivity terms. People with an associate degree or some college coursework on average earn at least 30% more in metros ranking in the top 10% on this measure than in metros in the bottom 10%. Bachelor’s degree holders earn more than twice as much.44
There is also enormous variation across cities in upward mobility for people who were born into lower-income families. Opportunity Insights, a research group founded by Chetty, has assembled America’s richest dataset on the geography of opportunity and made it available on the “Opportunity Atlas” website. The dataset, among other things, shows the average income today of Americans who were born into families at the 25th percentile of the national income distribution during several years in the 1980s and grew up in specific places, down to the neighborhood level.
People who grew up in 25th percentile families in America’s top-performing metro on Opportunity Insights’ upward mobility measure – St. Cloud, Minnesota – earn as much as twice the level for the worst-performing metros, on average. Even among large metros with populations over a million, the best-performing metros score more than 45% better than the weakest ones on this measure – a difference of more than $12,000 a year.45 Controlling for race, the average Black person from a 25th percentile household in high-performing Boston earns close to 40% above the average Black person from a similar family in lower-performing Chicago or Cleveland.46
Chetty and his colleagues also show large differences across metros in intergenerational relative mobility. For instance, 12.9% of people who grew up in the bottom income quintile in high-performing San Jose have achieved the “rags-to-riches” story of reaching the top quintile, while only 4.4% of people from the bottom quintile in Charlotte, North Carolina, have made this jump.47
Within cities, the neighborhood in which a person lives has similarly powerful effects. The Opportunity Atlas confirms that the income gap between otherwise similar people who grew up in high- and low-opportunity neighborhoods within the same metro area exceeds $10,000 a year in all 53 metros with population over 1 million.48 In an influential study based on the “Creating Moves to Opportunity” program in the Seattle area, Chetty and his colleague Nathaniel Hendren demonstrated how potent these effects can be through a controlled experiment. People who moved to high-opportunity neighborhoods as children under the program went on to earn as much as $12,000 more per year than comparable people who did not, on average. The earlier in their lives they moved, the greater the income edge.49
According to urban scholar Richard Florida in his book The New Urban Crisis, “The harsh reality is that poor neighborhoods stay poor, and rich neighborhoods stay rich … Increasingly, our ZIP codes are our destiny.”50
43 Ibid.44 Data from the 2018 American Community Survey, U.S. Census Bureau.45 Opportunity Insights data, made available to the authors.46 Data available at www.opportunityatlas.org. Opportunity Insights made further data at the metro area and state level available to the authors. See also R.
Chetty et al. (2018), “The Opportunity Atlas: Mapping the childhood roots of social mobility,” Center for Economic Studies, U.S. Census Bureau, Working Papers 18-42.
47 R. Chetty, N. Hendren, P. Kline, and E. Saez (2014), “Where is the land of opportunity? The geography of intergenerational mobility in the United States,” NBER WP No. 19843 (June).
48 Opportunity Atlas website, available at www.opportunityatlas.org. See also J. Rothwell and D,.Massey (2014), “Geographic effects on intergenerational income mobility,” Economic Geography 91(1).
49 R. Chetty and N. Hendren (2018), “The impacts of neighborhoods on intergenerational mobility I: Childhood exposure effects,” Quarterly Journal of Eco-nomics 133(3) (August); Tanner, Inclusive Economy, p. 79.
50 R. Florida (2017), The New Urban Crisis: How Our Cities are Increasing Inequality, Deepening Segregation, and Failing the Middle Class – And What We Can Do About It, Basic Books, p. 114.

C I T I E S A N D O P P O R T U N I T Y I N 2 1 s t C E N T U R Y A M E R I C A • G E O R G E W. B U S H I N S T I T U T E
1 5
The rising cost of a middle-class standard of living
Along with slow income growth for people without a college degree, the key obstacle to economic mobility for many Americans is the rising cost of a middle-class standard of living.
One might ask: How can we say that incomes are growing after adjusting for inflation and then say incomes aren’t growing fast enough to keep up with the costs of an ordinary “standard of living?” The answer, as McKinsey Global Institute explains in a 2020 report on the “social contract,” is that prices of products most people view as necessities have increased considerably faster than the average good in the PCE index basket, while prices of “discretionary” goods and services – travel and leisure services, furniture, home electronics, and above all consumer digital services – have sharply declined.51
The cost of necessities: According to McKinsey’s report, household spending on housing, education, healthcare, and transportation has increased to 56% of consumer spending today from 47% in 2000. For lower-income families, the share of income going to these necessities has gone up more, since necessities constitute a larger share of their total spending. Since 2000, housing costs per family have increased 26% above CPI inflation. Healthcare costs borne by households have increased 35% after inflation. And household education costs have increased 70% after inflation.52
Journalist Annie Lowrey adds further color on these challenges in a 2020 Atlantic Monthly article, “The Great Affordability Crisis.” Housing prices rose faster than household incomes in 80% of U.S. metro areas between 2000 and 2019. Annual premiums on family health insurance plans increased by some $6,000 in 2020 dollars since 2000, and families typically bear a larger share of the premium today.53 A Dallas Morning News analysis adds that, for the median household, deductibles plus the family share of premiums took up 11.5% of pretax income in 2018, up from 7.8% in 2008.54
The Wall Street Journal reports in a study of challenges facing the middle class that the list-price tuition of four-year colleges has quadrupled over a generation. Indebted graduates typically owe payments of $2,400 to $4,000 a year – a significant bite out a $40,000 paycheck, the average after-tax income for young graduates.55
Figure 3 shows the tremendous growth in housing, healthcare, and higher education costs relative to the overall price level. The line for housing costs understates the actual experience of many American families, as it shows only rents and masks the vast variety across cities. Figure 4 shows the growth in home prices since 1975, based on the Case-Shiller index of urban house prices. The blue line depicts nominal home prices, while the orange line adjusts housing prices for PCE inflation. As the orange line illustrates, real urban house prices were approximately 48% to 112% higher in 2019 than they were throughout the last quarter of the 20th century.
The quality of housing, healthcare, and (arguably) education has improved over the last two decades, so families are getting something for the extra spending. The typical family has also benefited from falling prices for many discretionary products and rapid innovation in digital services. Still, it’s easy to see why many families in or below the middle income quintile feel they’re falling behind when their available income after paying for necessities is going down year after year and they’re unable to save anything.
51 McKinsey Global Institute (2020, “The social contract in the 21st century: Outcomes for workers, consumers, and savers in advanced economies.”52 Ibid.53 Annie Lowrey, “The great affordability crisis breaking America,” The Atlantic Monthly, 7 February 2020.54 Mitchell Schnurman, “Deductibles deter many from getting health care,” Dallas Morning News, 1 December 2019.55 “Record debt swaps middle class families,” Wall Street Journal, 2 August 2019.

C I T I E S A N D O P P O R T U N I T Y I N 2 1 s t C E N T U R Y A M E R I C A • G E O R G E W. B U S H I N S T I T U T E
1 6
Figure 3. Rising costs of housing, healthcare, and education
Figure 4. Rising urban home prices
Taken from Timothy B. Lee, “The productivity paradox: why we’re getting more innovation but less growth,” Vox, 24 October 2016, available at: https://www.vox.com/new-money/2016/10/24/13327014/productivity-paradox-innovation-growth
Source: Author’s analysis of S&P/Case-Shiller U.S. National Home Price Index; PCE (base year 2020) used for inflation adjustment.

C I T I E S A N D O P P O R T U N I T Y I N 2 1 s t C E N T U R Y A M E R I C A • G E O R G E W. B U S H I N S T I T U T E
1 7
The growing costs of maintaining an ordinary standard of living are taking a particular toll on families of color. In a 2020 survey by Black Futures Lab of more than 30,000 Black Americans, 90% said the No. 1 issue facing them is that wages are no longer high enough to support a family.56
Economists largely agree that home prices have exploded upward primarily because America hasn’t added enough supply to keep up with demand, especially in many urban locations – a result of historic policy failures at all levels of government. Healthcare and higher education markets have seen large price increases both because of policy-induced dysfunctions and because of the inherent difficulty of improving productivity in service activities that, until the COVID-19 crisis, mostly took place in a labor-intensive face-to-face setting.
The rising price of necessities is taking a profound toll on economic mobility. The “affordability crisis” affects savings behavior, business creation, home ownership, college enrollment decisions, and more. Raphael Bostic, President of the Federal Reserve Bank of Atlanta and a leading authority on economic mobility, emphasizes that high housing costs in prosperous cities are among the steepest hurdles to upward mobility in America today.57
Variation across cities and neighborhoods: Again, some cities are far outperforming others in sustaining an affordable standard of living. Most significantly, housing affordability varies tremendously across U.S. metros. Based on data from the research group Demographia on the ratio of median home price to median household income, supply-constrained Los Angeles and San Francisco had ratios of 9.0 and 8.4 in late 2019, respectively. Houston, Indianapolis, and Columbus, Ohio – where housing supply has largely kept up with population growth – had ratios of 3.6, 2.9, and 3.2.58
Housing cost trends also depend on one’s neighborhood. The average price of a home in the bottom price quartile – which is more likely to be in a lower-income neighborhood than other homes – increased 86% from January 2012 to July 2020, while the average price of a top-quartile home increased just 50% over the same period, according to an AEI report. Home prices in the middle quartiles rose between 55% and 65%. The main reason for this divergence is that new supply has overwhelmingly consisted of luxury units in higher-income neighborhoods, while policy hurdles and other challenges have severely impeded new development at lower price points.59
In healthcare, more than 30 states have fostered a high degree of concentration in the healthcare services industry through “certificate-of-need” rules and other policies, while other states have done less to block new entrants. Average prices for hospital services are now as much as 20% higher in the most concentrated markets than in less concentrated places, with equal or worse quality.60
As for higher education, in-state tuition at public four-year universities is more than twice as high in high-priced states like New Hampshire, Pennsylvania, New Jersey, and Illinois than in low-priced states like Wyoming, Montana, Utah, and Florida, based on a 2015 Urban Institute report.61
These cost-of-living differences have tremendous effects on the financial well-being of moderate- to lower-income families. Harvard economist Edward Glaeser, in his book The Triumph of the City: How Our Greatest Invention Makes Us Richer, Smarter, Greener, Healthier, and Happier, compares two hypothetical middle-class families in New York’s outer boroughs and suburban Houston. The Houston family’s income is $10,000 below that of the New York family, or 15% lower. But after paying far lower housing costs and taxes, the Texas family
56 “Policing in America is broken and must change … But how?” New York Times Magazine, 21 June 2020.57 “Fed official warns about racism’s economic toll,” Wall Street Journal, 7 July 2020.58 “16th Annual Demographia International Housing Affordability Survey: 2020,” available at http://demographia.com/dhi.pdf.59 E. Pinto (2020), “The Fed’s spiked punch bowl, ad infinitum,” American Enterprise Institute report, 31 August.60 Open Markets Institute, “Hospitals & monopoly,” available at https://www.openmarketsinstitute.org/learn/hospitals-monopoly.61 S. Baum and M.C. Johnson (2015), “Financing public higher education: The evolution of state funding,” Urban Institute report, 2 November, available at
https://www.urban.org/research/publication/financing-public-higher-education-evolution-state-funding.
C I T I E S A N D O P P O R T U N I T Y I N 2 1 s t C E N T U R Y A M E R I C A • G E O R G E W. B U S H I N S T I T U T E
1 8
clears 15% more than the New York one. The Texans also have only half as long a daily commute.62
In a 2020 report, Wendell Cox of Demographia and the Urban Reform Institute (URI) calculates a “Standard of Living” index for the 107 metro areas with population above 500,000, adjusting each metro’s nominal median household income in 2018 for local living costs – including the annualized cost of owning the area’s median-priced home. Based on this data, people moving from the low standard-of-living Los Angeles metro area can increase their standard of living by 34% to 62% by moving to any metro in the top quartile on Cox’s measure and earning the median household income there.63 (URI’s index captures a strictly economic measure of real incomes, rather than the broader but harder-to-measure idea of “quality of life.”)
In a 2020 article, Cox applies this method to software developers. It turns out that, after adjusting for local living costs, the software developers with the highest average real incomes are in Winston-Salem, Greensboro, and Raleigh, North Carolina, plus San Antonio. Real incomes for software developers in the San Jose area are fully 30% below the national average, adjusting for Silicon Valley’s sky-high cost of living.64
Wealth trends: What the data show
Falling wealth levels and rising disparities: U.S. economic mobility looks worse when we measure it by wealth than when we measure it by income. Having a modicum of wealth is critically important to a family’s opportunities. Asset holdings enable a family to cope with work setbacks, start businesses, plan for retirement, cover unexpected medical expenses, and give a leg up to the next generation through education, enrichment opportunities, and bequests. But long-term trends have undermined wealth-building for most moderate- to lower-income families:
• Moderate- to lower-income families have had increasingly negative savings rates at least since 1983: The middle three quintiles by wealth have spent more than they’ve earned from work each year over the last four decades, on average, funding the difference through growing indebtedness. For households in these three quintiles, total debt rose to 157% of income in 2007 from 67% of income in 1983, even though incomes have been growing.65 Low income growth and rising prices for necessities figure prominently as obstacles to saving.
• New business creation has been receding in America: According to data from AEI, the new business startup rate has declined by more than one third since the 1970s.66
• Homeownership has trended downward among vulnerable populations since 2005: The share of households owning their own home declined to 63% in 2016 from more than 69% in 2005 – fallout from the housing crash and financial crisis of 2007-2009 – though it had partially recovered by the first quarter of 2020, to 65.3%. Despite an array of policies to promote homeownership, ownership rates declined even more among Black, Hispanic, and Millennial families after 2005.67 As of 2016, 41% of Black households and 45% of Hispanic households owned their homes, compared with 71% among White Americans and 58% of Asian Americans.68 Millennials have fallen well behind the ownership rates attained by Boomer and Generation X families at the same age.69
• Bequests have declined: Bequests from relatives account for a larger share of wealth for lower-to
62 E.L. Glaeser (2011), The Triumph of the City: How Our Greatest Invention Makes Us Richer, Smarter, Greener, Healthier, and Happier, Penguin Books, pp. 186-7.
63 Urban Reform Institute, “2020 Standard of Living Index,” available at: https://urbanreforminstitute.org/2020/05/2020-standard-of-living-index/.64 W. Cox, “Highest salaries for software developer remote work (metro areas),” New Geography website, 12 June 2020.65 E.N. Wolff (2017), A Century of Wealth in America (Belknap Press, an imprint of Harvard University Press), pp. xiii, 188; “Record debt swamps mid-
dle-class families,” Wall Street Journal, 2 August 2019.66 U.S. Census data, cited in Strain, The American Dream is Not Dead, loc. 183.67 Wolff, Century of Wealth, p. 95; National Association of Home Builders, “Eye on Housing,” 28 April 2020, available at: http://eyeonhousing.org/2020/04/
homeownership-rate-up-in-the-first-quarter-2020/.68 C. Collins, D. Asante-Muhammad, J. Hoxie, & E. Nieves (2017), “Report: The road to zero wealth,” Institute for Policy Studies (11 September).69 “Millennials approach middle age in crisis,” Wall Street Journal, 20 May 2019.

C I T I E S A N D O P P O R T U N I T Y I N 2 1 s t C E N T U R Y A M E R I C A • G E O R G E W. B U S H I N S T I T U T E
1 9
moderate-income households than for high-income households, since lower-income people accumulate less from savings and business ownership. The share of lower- income families receiving a bequest, some 30%, has declined by 2 percentage points since the 1980s.70
Consider the consequences of these trends:• The median family’s net wealth is roughly where it was in the late 1960s: Edward N. Wolff of New York
University has assembled an analysis of long-term wealth statistics in his book A Century of Wealth in America. He reports that the net wealth of the median household – defined as assets not counting cars and household durables, less financial liabilities – fell to $64,000 in 2013 from $68,000 in 1969 (in 2013 dollars) and $115,000 in 2007. Falling homeownership rates after the 2007-09 recession explain much of the decline after 2007. The proportion of households with net wealth at or below zero increased to 37.1% in 2013 from 26.0% in 1969.71
• Racial wealth disparities in the United States are enormous: Dedrick Asante-Muhammad, an executive at the National Community Reinvestment Coalition and an authority on racial wealth disparities, and his colleagues report that the net wealth of the median Black family declined to just $1,700 as of 2013, from $6,800 in 1983 and $17,000 in 1992. For the median Hispanic family, net wealth went from about $4,000 to $6,000 to $2,000 over this period.72 Racial gaps stand out even when we control for factors like education. Median net wealth for Black households “headed” by an adult with a bachelor’s degree or higher was $70,000 in 2013, compared with $268,000 for the comparable White household.73 College-educated Black Americans experienced a net wealth decline of 55% between 1992 and 2013.74
• The experiences of high-income and lower-income families have dramatically diverged: The top 20% of families by income realized an 82% real increase in net wealth from 1983 to 2013, on average. The fourth income quintile, second from the top, saw a 24% increase. But the middle quintile of earners suffered a 14% decline in average net wealth over these three decades. And the bottom 40% had negative net wealth of −$10,800 on average by 2013, down from slightly positive levels in 1983.75 Figure 5 shows real wealth trends since 1983.
70 Wolff, Century of Wealth, pp. 262-6.71 Ibid., p. 530.72 Collins, Asante-Muhammad, Hoxie, and Nieves, “Report: The road to zero wealth.”73 “The myth of closing the wealth gap through education,” Axios Markets, 29 June 2020.74 D. Brooks, “Moderates failed Black America,” New York Times column, 19 June 2020.75 Ibid., p. 74.
Figure 5. The middle quintile has seen its wealth decline – and the bottom two quintiles have no wealth(Average net wealth of households by wealth quintile, combining the bottom two)

C I T I E S A N D O P P O R T U N I T Y I N 2 1 s t C E N T U R Y A M E R I C A • G E O R G E W. B U S H I N S T I T U T E
2 0
• Educational attainment levels have a tremendous impact on wealth trends: According to Wolff’s data, the median household whose “head” has a bachelor’s degree or higher realized a 19% increase in net wealth, adjusted for inflation, from 1983 to 2013 – to $233,000. The median household whose “head” has completed some college or an associate degree saw a 55% decline, to $33,000. The median household with a high school diploma or less has negative net wealth.76
• Millennials are in worse financial shape than the prior two generations were at the same point in their lives: The net wealth of the median Millennial household is about 40% below what the median Generation X household had at the same age and 20% below what the median Baby Boomers household had.77 Contrary to some stereotypes, Millennials actually switch jobs less than prior generations at the same age, spend less on luxuries, and express nearly identical long-term goals as previous generations.78 They’ve accumulated less wealth because the student debt burdens they face have skyrocketed and because the price of necessities has increased much faster than incomes. According to a 2020 survey, 72% of Millennials with student debt see themselves paying off their debt only after 10 years or else “never.”79 Many say they haven’t had children yet because they can’t afford them.80
Variation across cities and neighborhoods: Homeownership rates vary significantly across metro areas. Among relatively large metros, the homeownership rate exceeds 68% of households in Pittsburgh; Minneapolis-St. Paul; and Boise, Idaho; while it’s below 56% in New York, San Francisco, and Los Angeles.81
The federal government does not publish net wealth data at the metro area level. But U.S. Census data show that average household net wealth is at least 66% higher in high-wealth states including Massachusetts, Vermont, Maryland, and Minnesota than in low-wealth states including Mississippi, Arkansas, Arizona, and Nevada.82
Again, neighborhoods also make a significant difference to household financial well-being. According to a 2016 Pew Charitable Trusts study, home ownership rates are fully 32 percentage points lower in what the authors defined as high-poverty neighborhoods than in low-poverty neighborhoods. Families with income below $40,000 living in high-poverty neighborhoods had average net wealth of $800 in 2016, compared to $35,000 for otherwise similar families living in low-poverty neighborhoods. Among families earning between $40,000 and $85,000, those living in high-poverty neighborhoods had only 29% as much net wealth on average as those living in low-poverty neighborhoods.83
76 Wolff, Century of Wealth, p. 415.77 “1 big thing: Millennials aren’t ready for recession,” Axios Markets, 27 August 2019.78 D. Lee, “The generation scarred by two recessions,” Financial Times Big Read, 9 July 2020.79 “How Millennials feel about spending, investing, and the future,” Wall Street Journal, 16 March 2020.80 “Millennials approach middle age in crisis,” Wall Street Journal, 20 May 2019.81 American Community Survey data for 2018, U.S. Census Bureau.82 R. Chenevert et al. (2017), “Where the wealth is: The geographic distribution of wealth in the United States,” U.S. Census Bureau presentation, available
at: https://www.census.gov/content/dam/Census/newsroom/press-kits/2017/assa_geographic_distr_wealth.pdf.83 Pew Charitable Trusts (2016), “Neighborhood poverty and household financial security,” available at: https://www.pewtrusts.org/~/media/assets/2016/01/
chartbook--neighborhood-poverty-and-household-financial-security_v3.pdf.
Cities and neighborhoods vary enormously in educational attainment, labor productivity, household incomes, and intergenerational upward mobility.
C I T I E S A N D O P P O R T U N I T Y I N 2 1 s t C E N T U R Y A M E R I C A • G E O R G E W. B U S H I N S T I T U T E
2 1
III. WHY CITIES AND NEIGHBORHOODS SO STRONGLY INFLUENCE ECONOMIC MOBILITY
Some cities and neighborhoods perform far ahead of others as engines of opportunity, based on data like the Opportunity Insights measure of upward mobility we cited in the last section. Why do cities and neighborhoods make such a difference?
Productivity and job-market access
Access to good jobs in which people can maximize their productivity is critical to economic mobility. An Urban Institute study shows that very few people who remain steadily employed in full-time jobs live below the federal poverty threshold.84
Productivity: People can work more productively in some places than in others. Cities and neighborhoods that enable high productivity and thus high wages are places that achieve strong “agglomeration economies” – productivity gains that take place when people, firms, and ideas come together in a geographically concentrated place. These benefits include vibrant labor markets for workers with specialized skills and knowledge spillovers from one skilled worker to the next. Workers in a thriving place have rich opportunities to learn and advance by watching others, receiving informal mentoring, forging connections, and performing in a highly competitive marketplace.85
Urban economists have generally held that large cities enjoy better agglomeration economies than smaller ones.86 GDP per worker and metro-area population are positively correlated, based on 2018 data for America’s 382 metros (with a correlation of 0.25). But numerous smaller metros also attain high levels of productivity. Of the top 50 metros for 2018 GDP per worker, 34 have populations below 500,000.
Figure 6 shows GDP per worker for America’s 382 metro areas, as a proxy for labor productivity. The top quartile of metros for GDP per capita includes each of the seven leading “star” metros of the coasts – New York, Boston, Washington, Los Angeles, San Francisco, San Jose, and Seattle – plus seven more of the 20 largest metros: Philadelphia, Chicago, Atlanta, Dallas-Fort Worth, Houston, Denver, and San Diego. Several college towns make the top quartile, including New Haven, Connecticut; Durham, North Carolina; and Boulder, Colorado.
84 M.A. Turner et al. (2020), “Boosting upward mobility: Metrics to inform local action,” Urban Institute research report (June).85 P. Krugman and A. Venables (1995), “Globalization and the inequality of nations,” NBER WP No. 5098 (Apr); J. De la Roca and D. Puga (2017), “Learning
by working in bigger cities,” Review of Economic Studies 84, 106-42.86 Florida, New Urban Crisis, p. 8; E.L. Glaeser and J.D. Gottlieb (2009), “The wealth of cities: Agglomeration economies and spatial equilibrium in the Unit-
ed States, Journal of Economic Literature 47(4) (December).
Cities and neighborhoods make a tremendous difference to economic mobility. High-performing metros and neighborhoods promote opportunity through several channels:
1. Relatively high labor productivity and good job-market access2. Better-than-average conditions for new-business creation3. Relatively high housing affordability, homeownership, and housing market integration4. Better-than-average educational outcomes5. Exceptional levels of “social capital”

C I T I E S A N D O P P O R T U N I T Y I N 2 1 s t C E N T U R Y A M E R I C A • G E O R G E W. B U S H I N S T I T U T E
2 2
Figure 6. Productivity differences across metros(Metro-area GDP per worker, 2018. The size of each circle represents metro-area population. The map shows metros with above-median GDP per worker in blue and metros below the median in orange. Intensity of color illustrates how far metros are from the median, so the highest productivity metros have the
most intense blue color.)
Anchorage, AK ($128,107); Fairbanks, AK ($149,579); Kahului-Wailuku-Lahaina, HI ($116,529); Urban Honolulu, HI ($129,495)
Sources: Data from the U.S. Bureau of Economic Analysis and the U.S. Census Bureau.
The 60 or so breakaway metro areas identified by McKinsey – a mix of large and medium-sized metros – offer much better job opportunities than most other places, particularly for college-educated people. Among college-educated workers, median income is $12,000 to $50,000 higher than the national median in Boston, Washington, San Francisco, San Jose, and Seattle. McKinsey’s breakaway metros are also weathering the COVID-19 storm better than most other places, as measured by unemployment rates. (See June 2020 statistics here.)
Job-market access: People’s ability to access good jobs depends not only on living in a high-productivity place but also on their ability to get to work. The University of Minnesota’s “Access Across America” dataset measures the share of metro-area jobs that the average resident in each of America’s top 50 metros can reach by car within 30 minutes.
In some large metros, the average resident can reach fewer than a quarter of all jobs within 30 minutes, due to infrastructure constraints, traffic congestion, and the physical layout of the area. These low-access metro areas include the largest East Coast metros – New York City, Washington, and Philadelphia – plus Chicago, Atlanta, and Los Angeles. High-access metros, where the average person can reach more than 60% of jobs in the area, include Raleigh; San Jose; and Salt Lake City, Utah; plus several Midwestern metros. Most large Sun Belt metros plus Seattle are in the middle category, with 25% to 60% of metro-area jobs within reach.87
Figure 7 shows how America’s 50 largest metros score on this measure.
87 Data available at the University of Minnesota Accessibility Observatory’s “Access Across America” website (http://access.umn.edu/research/america/).

C I T I E S A N D O P P O R T U N I T Y I N 2 1 s t C E N T U R Y A M E R I C A • G E O R G E W. B U S H I N S T I T U T E
2 3
Figure 7. Job-market access across metros(Percentage of jobs average resident can reach by car within 30 minutes, 2018, for the 50 largest metro areas. The size of the circle represents metro-area
population. Metros in which the average resident can reach more than 40 percent of the jobs are in blue, and metros in which the average person can reach less than 40 percent of the jobs are in orange. Again, high intensity denotes positive or negative outliers.)
Source: Access Across America dataset, University of Minnesota Accessibility Observatory, available at: http://access.umn.edu/research/america/
Based on our analysis, high-access metros are generally ones with relatively low housing segregation along income lines, better than average infrastructure, and at most medium population density.88 This conclusion points to a tradeoff: Large, dense cities generally benefit from strong agglomeration economies but in some cases suffer from congestion and segregation-related costs that counteract these benefits.
High density also seems to be impeding economic recovery from the COVID-19 crisis in some large metro areas. Based on high-frequency data from the AEI Housing Center, most of the leading high-density metros of the coasts – New York, Washington, Boston, Los Angeles, San Francisco, and San Jose – were all in the bottom quartile of America’s top 40 metros for foot traffic in commercial locations as of late July, relative to pre-pandemic levels. Seventeen of the top 20 performers on this metric were less dense metros in the Midwest and Sun Belt.89
Job-market access also depends heavily on where people live in their cities. Struggling areas can be job deserts as well food and healthcare deserts, even in the most successful large metros. The growing numbers of lower-income people living in poor suburban neighborhoods distant from job centers often face especially difficult challenges connecting with good work opportunities.90
The Center for Neighborhood Technology’s “AllTransit” dataset illustrates the job-market consequences of living in poorly located, lagging areas within large metros. The dataset measures the share of metro-area jobs
88 Author’s analysis, based on data from the University of Minnesota Accessibility Observatory “Access Across America,” the U.S. Census Bureau’s 2018 American Community Survey, and Florida, New Urban Crisis.
89 “The AEI Housing Center’s Nowcast: Reopening of 40 metro area economies,” September 2020, available at: https://www.aei.org/reopening-of-metro-ar-ea-economies/.
90 Florida, New Urban Crisis, p.158.
C I T I E S A N D O P P O R T U N I T Y I N 2 1 s t C E N T U R Y A M E R I C A • G E O R G E W. B U S H I N S T I T U T E
2 4
a person can reach by public transit within 30 minutes. People living close to the core city center generally can reach many jobs. But if one lives in the prosperous Dallas suburb of Plano, one can reach 45 times more jobs than people living in the struggling suburb of Hutchins, even though Plano itself has limited transit options.91 Similar disparities play out in many large metro areas.
Small business ownership
Some cities offer far better wealth-building opportunities than others. One vital path to wealth-building is small business ownership, but cities vary enormously in how difficult, expensive, and time-consuming it is to start a business.
It takes some five to 10 times as many days on average to navigate city rules in San Francisco and San Jose than in cities with relatively little red tape, according to a 2019 Arizona State University study. Based on ASU’s composite scores, cities ranking in the top third for ease of launching a company include first-ranked Oklahoma City, Oklahoma; Houston; Atlanta; Nashville, Tennessee; Boise; Sioux Falls, South Dakota; Fargo, North Dakota; and Salt Lake City; plus Arlington, Virginia (although next-door Washington ranks relatively low).
Most outperformers are in the Sun Belt or in a contiguous 13-state region in the Northern Great Plains, Rocky Mountains, and Pacific Northwest that we call the “Northwest 13” states: Wisconsin, Minnesota, Iowa, North Dakota, South Dakota, Nebraska, Montana, Idaho, Wyoming, Colorado, Utah, Washington, and Oregon. This vast area is home to 41 million Americans, and its cities tend to rank high on many measures of prosperity and upward mobility.
The most difficult places to start a business are the large cities of California, New York, and Pennsylvania, plus the District of Columbia.92
Housing affordability, homeownership, and segregation
Housing affordability plays a central role in shaping economic mobility, through at least three mechanisms.
Standards of living and savings: High housing costs force families to devote relatively large proportions of income to housing, leaving less for discretionary spending and savings. Among America’s 382 metro areas, the median home price to household income ratio is strongly associated with the share of renter households spending more than 35% of income on housing, a measure of housing cost burdens (correlation of 0.40 in 2017).93
91 Data available at AllTransit website, Center for Neighborhood Technology, available at https://www.cnt.org/tools/alltransit.92 Arizona State University, “Doing business in North America 2019,” cited in C.M. Douglas, “Open for business: The easiest – and toughest – cities to start a
company in America,” The Business Journals, 9 October 2019, available at https://www.bizjournals.com/bizjournals/news/2019/10/09/open-for-business-the-easiest-and-toughest-cities.html.
93 Author’s calculations, based on median household incomes, median home prices, and housing-burdened population shares from the 2017 American Community Survey, U.S. Census Bureau.
Metros in the 13-state region we call the “Northwest 13” tend to score high for job-market access, ease of starting a business, housing affordability, educational outcomes, and social capital – and they figure prominently in our list of “cities of opportunity.” The Northwest 13 states, home to 41 million Americans, are Wisconsin, Minnesota, Iowa, North Dakota, South Dakota, Nebraska, Montana, Idaho, Wyoming, Colorado, Utah, Washington, and Oregon.

C I T I E S A N D O P P O R T U N I T Y I N 2 1 s t C E N T U R Y A M E R I C A • G E O R G E W. B U S H I N S T I T U T E
2 5
Homeownership: High housing costs make homeownership more difficult. For most families, homeownership is the most important avenue for long-term wealth accumulation.
Studies show that homeowners accumulate greater wealth over time – even non-housing wealth – than otherwise similar renters.94 One reason is that required mortgage payments effectively force homeowners to build equity in their home over time, overcoming some of the behavioral challenges in the way of wealth accumulation. Another is that homeowners are more likely to make long-term investments than comparable nonowners in their property but also in businesses and stocks. Accumulated savings and home equity are the most important funding sources for startup businesses.95
These benefits translate to better economic mobility for the next generation. Children of homeowner families tend to achieve more years of education, experience fewer behavioral problems at school, and haver lower teen pregnancy rates, holding other demographic and economic characteristics constant.96
Federal, state, and local policies to promote homeownership played a critical role in the rise of the White middle class in the decades after World War II. On the other hand, the exclusion of Black families from homeownership opportunities through “redlining” under the Home Owners’ Loan Corporation and other federal programs, as well as through discriminatory state and local policies, explains much of the racial wealth gap today.97
Cities and neighborhoods with the best conditions for wealth-building through homeownership are ones that have stable or growing populations so that home values rise with incomes but also have sufficient supply growth to maintain good affordability over time. Our analysis shows a strongly negative correlation between home price-to-income ratios and homeownership rates (−0.35 for all metros, and an even more pronounced −0.75 among America’s top 40 metros, in 2017).98
Segregation: High housing costs tend to fuel relatively high degrees of segregation along income lines in housing patterns, since they make it more difficult for moderate- to lower-income families to live in or near high-opportunity areas within cities.
Urban scholar Richard Florida reports that housing segregation on income lines has increased in virtually all large metro areas over the last four decades. As of 2009, more than 89% of urban Americans lived in neighborhoods that had grown more segregated since the 1970s.99 The share of Americans living in middle-class neighborhoods as Florida defines them declined to 40% in 2012 from 65% in 1972. Meanwhile, the proportion living in neighborhoods of concentrated poverty doubled from 2000 to 2014, based on a Brookings Institution report that defines such neighborhoods as places in which the poverty rate exceeds 40%.100
94 M. Grinstein-Weiss et al. ((2013), “Homeownership and wealth among low- and moderate-income households,” Brookings report (28 January), available at https://www.brookings.edu/research/homeownership-and-wealth-among-low-and-moderate-income-households/; L.S. Goodman and C. Mayer (2018), “Homeownership and the American Dream,” Journal of Economic Perspectives 32(1), pp. 31-58, available at https://www.urban.org/sites/default/files/pub-lication/96221/homeownership_and_the_american_dream_0.pdf.
95 Paolo Sodini et al., “Identifying the benefits of home ownership: A Swedish experiment,” NBER Working Paper No. 22882 (December 2016); Sebastian Galiani and Ernesto Schargrodsky 2010, “Property rights for the poor: Effects of land titling,” Journal of Public Economics, Vol. 94, Nos. 9-10 (2010); B. Friedman et al. (2012), “Savings: The poor can save, too,” Democracy: A Journal of Ideas, No. 20 (Fall), available at: https://democracyjournal.org/maga-zine/26/savings-the-poor-can-save-too/
96 Richard K. Green and Michelle J. White (1994), “Measuring the effects of homeowning: The effects on children,” University of Chicago Center for the Study of the Economy and the State, Working Paper No. 93 (February); Thomas P. Boehm and Alan M. Scholttman (1999), “Does Home Ownership by Parents Have an Economic Impact on Their Children?,” Journal of Housing Economics, Vol. 8, No. 3 (September); Michael H. Boyle (2003), “Home Own-ership and the Emotional and Behavioral Problems of Children and Youth,” Child Development, Vol. 73, No. 3 (28 January); Donald R. Haurin, Toby L. Parcel, and R. Jean Haurin (2003), “Does homeownership affect child outcomes?,” Real Estate Economics, Vol. 30, No. 4 (10 January).
97 R. Rothstein (2018), The Color of Law: A Forgotten History of How Our Government Segregated America, Liveright.98 Author’s calculations, based on median household incomes, median home prices, and ownership rates from the 2017 American Community Survey, U.S.
Census Bureau. See also Turner et al., “Boosting upward mobility: Metrics to inform local action.”99 Florida, New Urban Crisis, pp. 5-8.100 Cited in J. Bowdler, H. Cisneros, and J. Lubell (2017), Building Equitable Cities: How to Drive Economic Mobility and Regional Growth, Urban Land Insti-
tute.

C I T I E S A N D O P P O R T U N I T Y I N 2 1 s t C E N T U R Y A M E R I C A • G E O R G E W. B U S H I N S T I T U T E
2 6
Princeton University economist Patrick Sharkey has documented that the share of Black children growing up in neighborhoods of concentrated poverty is even higher today than in the years before the Civil Rights Act of 1964 and the Fair Housing Act of 1968.101
The newest trend is a vast migration of lower-income families into suburban cities and towns, driven by the growing affordability gap between expensive core cities and cheaper suburbs and, in some places, the direct displacement of lower-income people from “gentrifying” urban neighborhoods. The population living below the federal poverty line in American suburbs has grown far faster than the poor population within core cities.102 More and more of these Americans live in areas remote from job centers.103
A variety of studies show the growing tendency of Americans to sort themselves geographically according to education and income levels is undermining job-market access for moderate- to lower-income people, blocking upward mobility, fueling inequality, and holding back economic growth.104
Explaining variation in housing affordability and segregation: Numerous studies confirm that cities and metro areas with relatively permissive land-use rules enjoy greater housing supply growth, better home affordability, and lower housing segregation.105 Based on the Wharton Residential Land Use Regulation Index, the most permissive third of the metro areas represented in Wharton’s dataset include most metros in Texas, Indiana, Ohio, Missouri, and Utah, while the most restrictive third are almost all in the Northeast or on the West Coast. Our data show a strong relationship between relatively permissive rules based on the Wharton index and relatively low home price-to-income ratios (correlation of 0.53).106
Figure 8 shows how metro areas compare on median home price-to-income ratios, based on data from the research group Demographia. While housing price-to-income ratios are higher than historically normal levels in many U.S. cities today, the map illustrates that extreme unaffordability is primarily a problem of the West Coast and a handful of large East Coast metros.
As for housing market segregation, highly income-segregated metros like Houston are more than twice as segregated on income lines as less segregated metros like Portland, Oregon, based on how a measure of neighborhood income diversity within a 2,000-meter radius varies within whole metros.107
Based on datasets from Ben Stutts (who worked on this report) and Richard Florida, metros with exceptionally low degrees of segregation are generally medium-sized or smaller. Standout places include St. George, Utah; Dover, Delaware; and Bay City, Michigan. Among larger metros, the least segregated include Pittsburgh; Scranton, Pennsylvania; Minneapolis-St. Paul; Boise; Portland, Oregon; and Santa Rosa, California. Large metros
101 O. Patterson, “The long reach of racism in the U.S.,” Wall Street Journal Review section, 6-7 June 2020.102 C.L. Marohn, Jr. (2019), Strong Towns: A Bottom-Up Revolution to Rebuild American Prosperity, Wiley, p. 116.103 Moskowitz, How to Kill a City, p. 153.104 A. Fogli and V. Guerrieri (2019), “The end of the American Dream? Inequality and segregation in US cities,” NBER W.P. No. 26143; Chetty, Hendren,
Kline, and Saez, “Where is the land of opportunity?”; P. Faigelbaum and C. Gaubert (2019), “Optimal spatial policies, geography, and sorting,” NBER W.P. No. 24632 (November).
105 E.L. Glaeser and B.A. Ward (2009), “The causes and consequences of land use regulation: Evidence from Greater Boston,” Journal of Urban Economics 65(3) (May), pp. 265-78; R.E. Saks (2008), “Job creation and housing construction: Constraints on metropolitan area employment growth,” Journal of Urban Economics 64, 178-95; J. Gyourko and R. Molloy (2015), “Regulation and housing supply,” Chapter 19, Handbook of Regional and Urban Eco-nomics, Vol. 5, pp.1289-1337; K.F. Henkerhoff, L.E. Ohanian, and E.C. Prescott (2017), “Tarnishing the Golden and Empire States: Land-use regulations and the U.S. economic slowdown,” NBER W.P. No. 23790; E.L. Glaeser and J. Gyourko (2018), “The economic implications of housing supply,” Journal of Economic Perspectives 32(1): 3-30 (Winter); and P. Cheshire, C.A.L. Hilber, and H.R.A. Koster (2018), “Empty homes, longer commutes: The unintended consequences of more restrictive local planning,” Journal of Public Economics 158, 126-51.
106 J. Gyourko, A. Saiz, and A.A. Summers (2008), “A new measure of the local regulatory environment for housing markets: The Wharton Residential Land Use Regulatory Index,” Samuel Zell and Robert Lurie Real Estate Center, Wharton School, University of Pennsylvania, Working Paper No. 558, available at: http://realestate.wharton.upenn.edu/working-papers/a-new-measure-of-the-local-regulatory-environment-for-housing-markets-the-wharton-residen-tial-land-use-regulatory-index/. Reported correlation is based on author’s calculations using the Wharton index and 2018 data on median home prices and median household income from the American Community Survey, U.S. Census Bureau.
107 B.G. Stutts (2020), “How land use regulation affects residential segregation,” Job-market paper, SMU Department of Economics.

C I T I E S A N D O P P O R T U N I T Y I N 2 1 s t C E N T U R Y A M E R I C A • G E O R G E W. B U S H I N S T I T U T E
2 7
with exceptionally high degrees of economic segregation include New York, Philadelphia, Detroit, Dallas-Fort Worth, Houston, and San Antonio.108
Education
The widest educational disparities in U.S. cities are the gaps between high- and low-income neighborhoods within metro areas. As Harvard scholar Robert D. Putnam concludes in his book Our Kids: The American Dream in Crisis, “There’s no denying that rich and poor kids in this country attend vastly different schools.”109
Approximately 40% of children from low-income families attend schools with more than 75% of students below the federal poverty line.110 University of California at Berkeley scholar Rucker Johnson, an authority on school integration, reports that schools have grown more racially segregated since reaching peak integration levels in 1988.111 Students attending racially concentrated, high-poverty schools have significantly lower academic achievement levels than other students even after controlling for family income and student aptitude.112
108 Ibid., p. 241.109 Cited in Tanner, Inclusive Economy, p. 181.110 Tanner, Inclusive Economy, p. 180.111 Cited in N. Kristof, “ What of there were no George Floyd video?” New York Times column, 7 June 2020.112 This result is “one of the most consistent findings in research on education,” according to Gary Orfield and Susan Eaton of Harvard University (cited in
Tanner, Inclusive Economy, p. 181).
Figure 8. Housing affordability across metros(Ratio of median home value to median household income, 2018. The size of the circle represents metro-area population. The map shows metros with ratios
below 4.5 in blue and those with ratios above 4.5 in orange.)
Anchorage, AK (3.7); Fairbanks, AK (3.4); Urban Honolulu, HI (8.3); Kahului-Wailuku-Lahaina, HI (7.6)
Source: Author’s calculations, based on data from the 2019 American Community Survey, U.S. Census Bureau. We draw on the method used in the research group Demographia’s annual affordability survey. See “16th Annual Demographia International Housing Affordability
Survey,” 20 January 2020, available at: http://demographia.com/dhimedia2020.pdf.

C I T I E S A N D O P P O R T U N I T Y I N 2 1 s t C E N T U R Y A M E R I C A • G E O R G E W. B U S H I N S T I T U T E
2 8
One factor behind the underperformance of many schools in low-income cities and neighborhoods is relatively low property tax revenues. But the disparities among schools extend well beyond money. Experienced teachers often express a preference to teach near their hometowns or in similar places, contributing to a shortage of teachers who are willing to work in lower-income urban neighborhoods.113 A student’s peers in school also exert powerful influences on learning outcomes.114
Broader neighborhood realities also fundamentally shape student opportunities. Chetty and his colleagues point out the importance to students of having stable, decent housing. They’ve found that a key driver of disparate upward mobility between two similar neighborhoods on opposite sides of Dumont Avenue in Brooklyn was the fact that New York City subsidized home ownership in a new housing development on the south side of the street in the early 1980s, so students were more likely to have a good place to study and sleep than their peers on the north side.115 Neighborhoods additionally shape the extent of adult volunteer work in schools, community expectations around academic achievement, and, most profoundly, students’ own beliefs regarding the potential rewards from investment in learning.116
Studies also show wide variation across regions and cities in educational outcomes. Young people in the Northeast and West are much more likely to surpass the educational attainment levels of their parents than young people in the South.117 Measuring states by postsecondary graduation rates among young adults growing up in each state, top-performing states are fully 30 percentage points higher than the lowest-performing states for both four-year and two-year programs. Nine states make the top 20 for both two-year and four-year programs: the Northwest 13 states of Wisconsin, Minnesota, Iowa, North Dakota, South Dakota, Nebraska, Wyoming, and Utah, plus New Hampshire.118
The Bush Institute also tracks a broader measure of educational attainment at the state level: the share of people between 18 and 24 engaged in college, a career, or the military. Even holding race constant, the highest-performing states score 9 to 25 percentage points higher than their lowest-performing peers for engagement rates within their White, Black, Hispanic, and Asian American populations. Top performers include the six New England states, Maryland, the District of Columbia, Virginia, South Carolina, and the four Northwest 13 states of Minnesota, Iowa, North Dakota, and Colorado.119
As we’ve noted, America’s top metros for college attainment have population shares with a bachelor’s degree or higher that are almost four times greater than bottom-performing metros on this measure.
Figure 9 shows college shares for U.S. metros. As the map illustrates, larger metro areas tend to have higher college shares (correlation of 0.28), but there is enormous variation even among large metros. Boston, Washington, Raleigh, San Francisco, and San Jose had college shares between 45% and 52% of their populations in 2018, while Tampa, Memphis, New Orleans, and San Antonio each had college shares between 27% and 30%.
113 D. Boyd et al. (2003), “The draw of home: How teachers’ preferences for proximity disadvantage urban schools,” NBER W.P. No. 9953, (September).114 Research by sociologist James Coleman, cited in Rajan, Third Pillar, p. 222; Tanner, Inclusive Economy, p. 66.115 Chetty presentation at the Willis M. Tate Lecture Series, Southern Methodist University, November 2019.116 Byron Sanders interview with the author, July 2020; Rajan, Third Pillar, p. 4; O. Galor (2010), “Human capital, fertility and growth,” in S.N. Durlauf and L.E.
Blume, eds., Economic Growth, The New Palgrave Economics Collection.117 D. Card, C. Domnisoru, and L. Taylor (2018), “The intergenerational transmission of human capital: Evidence from the golden age of upward mobility,”
NBER W.P. No. 25000 (September); J. Fletcher & J. Han (2018), “Intergenerational mobility in education: Variation in geography and time,” NBER W.P. No. 25324 (December).
118 National Student Clearinghouse Research Center, “Completing college – state – 2015,” available at https://nscresearchcenter.org/signaturereport8-state-supplement/. This dataset measures completion rates among students starting postsecondary programs.
119 George W. Bush Institute, Education and Workforce Pipeline data.

C I T I E S A N D O P P O R T U N I T Y I N 2 1 s t C E N T U R Y A M E R I C A • G E O R G E W. B U S H I N S T I T U T E
2 9
Figure 9. College shares across metros(Share of population aged 25 and older with a bachelor’s degree or higher in 2018. The size of the circle represents metro-area population. The map shows
above-median metros in blue and below-median metros in orange.)
Anchorage, AK (31.6%); Fairbanks, AK (32.6%); Kahului Wailuku-Lahaina, HI (26.6%); Urban Honolulu, HI (34.3%)
Source: American Community Survey 2018, U.S. Census Bureau.
There’s also large variation across metros in educational attainment levels within Black and Hispanic communities. Just 30 of America’s 382 metros – including Washington, San Jose, and many college towns – had Black college shares above 30% in 2018. Black college shares were 20% or lower in 244 metros. Of the 14 metro areas in the Northwest 13 states that rank among America’s 100 largest metros, 13 performed above the median on this metric, as did every Sun Belt metro with population over 1 million but one.
Hispanic college shares exceeded 30% in just 23 metros, including Pittsburgh – the only metro with population above a million on this list – plus numerous college towns and a handful of small metros. Among metro areas with population over a million, the only ones with Hispanic college shares between 25% and 30% were Washington; Baltimore; Columbus; St. Louis; Miami; and Jacksonville, Florida.120 The Hispanic college share was at or below 20% in 277 metro areas.
Social capital
Cities and neighborhoods also vary greatly in their stock of “social capital.” A place with high social capital is a place with a high degree of interconnectedness among residents, where people are likely to join clubs and associations, engage in civic life, sustain strong social networks, and trust their neighbors.121 The philosopher Edmund Burke famously emphasized the vital importance of society’s “little platoons,” which provide people with “the first link in a series by which we proceed towards a love of our country, and of mankind.”122
120 American Community Survey data for 2017, U.S. Census Bureau.121 See research by sociologist William Julius Wilson, cited in Florida, New Urban Crisis, p. 101, and by political scientist Robert Putnam, cited in Carney,
Alienated America, pp. 13, 246.122 Edmund Burke (1790), Reflections on the Revolution in France, Oxford University Press, reissue edition (2009).
C I T I E S A N D O P P O R T U N I T Y I N 2 1 s t C E N T U R Y A M E R I C A • G E O R G E W. B U S H I N S T I T U T E
3 0
According to research by the U.S. Congress Joint Economic Committee staff, neighborhoods with rich social capital cultivate “pro-opportunity norms” among young people, like “reliability, perseverance, prudence, responsibility, and reciprocity.”123 Such neighborhoods also give young people opportunities to practice behaviors conducive to upward mobility – to “exercise their social and political muscles,” as AEI’s Timothy Carney puts it.124 And, as a 2020 Urban Institute report notes, they excel in making members of the community feel “the respect, dignity, and sense of belonging that comes from contributing to one’s community.”125
Neighborhood social capital factors can be just as powerful as family factors in shaping people’s outcomes, from work and income levels to criminal behavior and teen pregnancy.126 Chetty and his colleagues report that differences in social capital play a significant role in explaining why some neighborhoods score so much higher than others on their upward mobility measure.127
Why do some cities and neighborhoods have much greater social capital than others? It clearly helps to be a high-income place. The Joint Economic Committee researchers have developed a composite social capital score for every county in the United States, based on volunteer activities, charitable giving, television watching by children, trust in other people, and other measures. Low-income counties almost universally score low on this index, while America’s wealthiest counties all score high.128 There’s also considerable evidence that economic deterioration in a place takes a toll on its stock of social capital. Journalist Amy Goldstein depicts in her book Janesville: An American Story how the closing of a General Motors plant weakened the civic institutions of what had been a cohesive Wisconsin city.129
But income levels don’t explain all the geographic differences in social capital. As Carney points out, there are places that rank relatively high for income but not social capital, such as the “man camps” near North Dakota’s oil fields, as well as middle-income places that rank extremely high for social capital, like Mormon communities in Utah and Idaho and Dutch Reformed communities in Iowa and Wisconsin.130
Carney’s book confirms the vital role of local institutions of civil society – churches, schools, companies, and more – in fostering social capital in cohesive communities.131 Author Anne Snyder, moreover, describes in her book The Fabric of Character: A Wise Giver’s Guide to Supporting Social and Moral Renewal how local institutions have succeeded in building social capital through intentional “character-driven village-making” in several low-income neighborhoods, inner-city schools, and other challenging environments.132
Homeownership also makes a difference. Families who own their homes are more likely to vote and volunteer in school and community activities, according to a Habitat for Humanity study.133 Neighborhoods with high homeownership rates, moreover, experience higher civic engagement and less resident turnover than low ownership neighborhoods.134
It would be inaccurate to say that neighborhoods of concentrated poverty don’t develop their own forms of
123 See Joint Economic Committee website, available at jec.senate.gov.124 Carney, Alienated America, p. 11.125 Turner et al., “Boosting upward mobility: Metrics to inform local action.”126 See studies cited in Tanner, Inclusive Economy, pp. 76-8.127 Chetty, Hendren, Kline, and Saez, “Where is the land of opportunity?” See also J.T. Rothwell and D.S. Massey (2014), “Geographic effects on intergenera-
tional income mobility,” Economic Geography 91(1), 83-106.128 U.S. Congress, Joint Economic Committee, Social Capital Project (2018), “The geography of social capital in America” (April), available at: https://www.
jec.senate.gov/public/index.cfm/republicans/2018/4/the-geography-of-social-capital-in-america.129 A. Goldstein (2017), Janesville: An American Story, Simon and Schuster.130 Carney, Alienated America, pp. 6-7, 79-80, 261-4.131 Ibid., pp. x-xi.132 A. Snyder (2019), The Fabric of Character: A Wise Giver’s Guide to Supporting Social and Moral Renewal, The Philanthropy Roundtable.133 “Beneficial impacts of homeownership: A research summary,” Habitat for Humanity report, 2016, available at: http://www.habitatbuilds.com/wp-content/
uploads/2016/04/Benefits-of-Homeownership-Research-Summary.pdf.134 Denise DiPasquale and Edward L. Glaeser, “Incentives and Social Capital: Are Homeowners Better Citizens?”, NBER Working Paper No. 6363 (January
1998); William M. Rohe et al., “Home ownership and access to opportunity,” Journal of Housing Studies, Vol. 17, No. 1 (2002); Maureen Kennedy and Paul Leonard, “Dealing with neighborhood change: A primer on gentrification and policy choices,” Brookings Institution report, 1 April 2001.
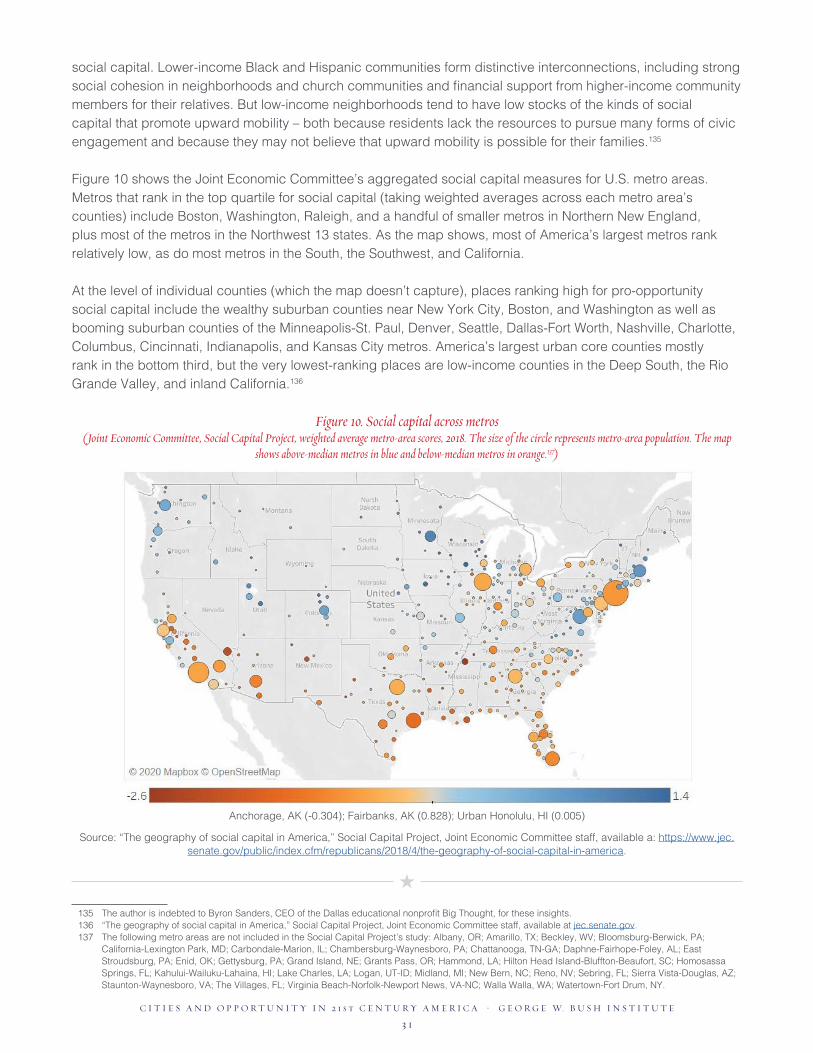
C I T I E S A N D O P P O R T U N I T Y I N 2 1 s t C E N T U R Y A M E R I C A • G E O R G E W. B U S H I N S T I T U T E
3 1
social capital. Lower-income Black and Hispanic communities form distinctive interconnections, including strong social cohesion in neighborhoods and church communities and financial support from higher-income community members for their relatives. But low-income neighborhoods tend to have low stocks of the kinds of social capital that promote upward mobility – both because residents lack the resources to pursue many forms of civic engagement and because they may not believe that upward mobility is possible for their families.135
Figure 10 shows the Joint Economic Committee’s aggregated social capital measures for U.S. metro areas. Metros that rank in the top quartile for social capital (taking weighted averages across each metro area’s counties) include Boston, Washington, Raleigh, and a handful of smaller metros in Northern New England, plus most of the metros in the Northwest 13 states. As the map shows, most of America’s largest metros rank relatively low, as do most metros in the South, the Southwest, and California.
At the level of individual counties (which the map doesn’t capture), places ranking high for pro-opportunity social capital include the wealthy suburban counties near New York City, Boston, and Washington as well as booming suburban counties of the Minneapolis-St. Paul, Denver, Seattle, Dallas-Fort Worth, Nashville, Charlotte, Columbus, Cincinnati, Indianapolis, and Kansas City metros. America’s largest urban core counties mostly rank in the bottom third, but the very lowest-ranking places are low-income counties in the Deep South, the Rio Grande Valley, and inland California.136
Figure 10. Social capital across metros( Joint Economic Committee, Social Capital Project, weighted average metro-area scores, 2018. The size of the circle represents metro-area population. The map
shows above-median metros in blue and below-median metros in orange.137)
135 The author is indebted to Byron Sanders, CEO of the Dallas educational nonprofit Big Thought, for these insights.136 “The geography of social capital in America,” Social Capital Project, Joint Economic Committee staff, available at jec.senate.gov.137 The following metro areas are not included in the Social Capital Project’s study: Albany, OR; Amarillo, TX; Beckley, WV; Bloomsburg-Berwick, PA;
California-Lexington Park, MD; Carbondale-Marion, IL; Chambersburg-Waynesboro, PA; Chattanooga, TN-GA; Daphne-Fairhope-Foley, AL; East Stroudsburg, PA; Enid, OK; Gettysburg, PA; Grand Island, NE; Grants Pass, OR; Hammond, LA; Hilton Head Island-Bluffton-Beaufort, SC; Homosassa Springs, FL; Kahului-Wailuku-Lahaina, HI; Lake Charles, LA; Logan, UT-ID; Midland, MI; New Bern, NC; Reno, NV; Sebring, FL; Sierra Vista-Douglas, AZ; Staunton-Waynesboro, VA; The Villages, FL; Virginia Beach-Norfolk-Newport News, VA-NC; Walla Walla, WA; Watertown-Fort Drum, NY.
Anchorage, AK (-0.304); Fairbanks, AK (0.828); Urban Honolulu, HI (0.005)
Source: “The geography of social capital in America,” Social Capital Project, Joint Economic Committee staff, available a: https://www.jec.senate.gov/public/index.cfm/republicans/2018/4/the-geography-of-social-capital-in-america.

C I T I E S A N D O P P O R T U N I T Y I N 2 1 s t C E N T U R Y A M E R I C A • G E O R G E W. B U S H I N S T I T U T E
3 2
IV. CITIES OF OPPORTUNITY
Where are America’s best cities of opportunity?
To arrive at a working list of metro areas that are performing better than most as engines of upward mobility, we start from a simple proposition: Cities of opportunity are places that offer ordinary people chances to earn relatively high real incomes, enable homegrown residents from modest beginnings to achieve better-than-average upward mobility, and attract enterprising people from elsewhere.
Three measures of metro-area economic mobility
Our analysis in this section considers three metrics for the nation’s 250 largest metro areas, which include all metros with population above 169,000 in 2018.
• Real incomes: History’s high-opportunity cities have invariably offered workers relatively high real incomes – that is, nominal wages adjusted for the local cost of living. Because the Urban Reform Institute’s “Standard of Living Index” covers only the 107 metros with population over 500,000, we’ve used a simplified method, adjusting metro-area median household incomes for local costs of living, based on the U.S. government’s “regional price parity” (RPP) data.138 The RPP dataset relies only on home rents, not purchase prices, so our method makes metros with unusually high home price-to-rent ratios look like they have higher real incomes than they really do, but our rankings are nonetheless highly correlated with URI’s (correlation of 0.82).
• The Opportunity Insights measure of upward mobility: The Opportunity Insights dataset provides average incomes in adulthood for people born into households who were at the 25th percentile of the national income distribution in the 1980s and grew up in particular places, down to the Census tract level. Our analysis relies on weighted averages for each metro area, provided to us by Opportunity Insights. The Opportunity Insights measure captures how well metros have done at fostering upward mobility for people who grew up there.139
• Net domestic migration: Our third approach is to look at how people are voting with their feet. People move across state and metro area lines less today than they did for much of America’s history. But many people are still geographically mobile, and it’s reasonable to infer that if large numbers are moving to or away from a city, they’re moving toward what they view as better opportunities. Our analysis focuses on the contribution of migration to or from other parts of the United States to each metro area’s 2010-2018 population growth, measured by dividing cumulative 2010-2018 net migration by each metro’s 2010
138 Bureau of Economic Analysis, Department of Commerce, available at: https://www.bea.gov/data/prices-inflation/regional-price-parities-state-and-met-ro-area.
139 Metro-area data provided to the author by Opportunity Insights. See also Opportunity Atlas website, available at www.opportunityatlas.org; R. Chetty et al. (2018), “The Opportunity Atlas: Mapping the childhood roots of social mobility,” Working Papers 18-42, Center for Economic Studies, U.S. Census Bureau.
We identify 61 metros that have outperformed most others as engines of opportunity, based on three measures of economic mobility that capture real incomes adjusted for local living costs, homegrown upward mobility, and net domestic migration. More than half are in the Northwest 13 states. Fifteen Sun Belt metros qualify, mostly because they are magnets for inbound migration. Six metros in the Northeast Corridor from New Hampshire to the District of Columbia make the list, primarily because of high scores for local real income. Measures of job-market access, educational attainment, and social capital predict outperformance in economic mobility, but metro-area population size mostly does not.

C I T I E S A N D O P P O R T U N I T Y I N 2 1 s t C E N T U R Y A M E R I C A • G E O R G E W. B U S H I N S T I T U T E
3 3
population.140 Net domestic migration rates capture how well metros do at attracting opportunity-seeking people from elsewhere.141
Takeaways from the data
The metros that perform best on any one of these measures aren’t necessarily outperformers on the other measures. Figure 11 shows a set of pairwise correlations at the metro-area level.
Our Standard of Living index is positively correlated with both the Opportunity Insights and net domestic migration rate measures. Real incomes adjusted for local living costs don’t explain everything, but they make a significant difference to both homegrown upward mobility and migration patterns.
On the other hand, there’s virtually no correlation between 2010-2018 net domestic migration rates and Opportunity Insights measures at the metro-area level. Chetty’s studies confirm that metros outperforming on the Opportunity Insights measure show no tendency to outperform in attracting domestic migration.142 Top performers on the Opportunity Insights measure of upward mobility are disproportionately in the Northwest 13 states, plus some large coastal metros. Top performers on net domestic migration rates tend to be in the Sun Belt, though some Northwest 13 metros score high on this metric as well.
Figure 12 depicts local real income levels for metros with population over 500,000, based on the Urban Reform Institute’s “Standard of Living” index. Most metros with population above 500,000 have living standards ahead of the nation’s average, reflecting agglomeration economies. On the other hand, New York, Los Angeles, and Miami score below average due to high living costs, while several smaller metros in lower-income regions rank relatively low because of low median household incomes.
140 Author’s analysis of 2019 data from the Population Estimates program, U.S. Census Bureau.141 Migration data must be handled with care. We recognize that people have been moving to some cities in Florida, Arizona, and elsewhere because these
places are attractive retirement destinations, not necessarily great places for young people to get ahead, and we’ve exercised judgment in this analysis.142 Raj Chetty presentation, Willis M. Tate Lecture Series, Southern Methodist University, November 2019.
Figure 11. Correlations among economic mobility measures and job access, education, social capital, and size variables
Sources: Data from the U.S. Bureau of Economic Analysis, the U.S. Census Bureau, Opportunity Insights, the University of Minnesota’s “Access Across America” dataset, and the U.S. Congress Joint Economic Committee’s Social Capital Project.

C I T I E S A N D O P P O R T U N I T Y I N 2 1 s t C E N T U R Y A M E R I C A • G E O R G E W. B U S H I N S T I T U T E
3 4
Figure 12. Standards of living across metros(Median household income adjusted for local living costs, for metros with population over 500,000. The size of the circle represents metro-area population.
The map shows above-median metros in blue and below-median metros in orange.)
Source: Urban Reform Institute, “2020 Standard of Living Index,” available at: https://urbanreforminstitute.org/2020/05/2020-standard-of-living-index/.
Figure 13 shows a map of domestic migration patterns between 2010 and 2018 for all 382 U.S. metros. Net domestic migration contributed more than 11% to the population of Raleigh; Austin; Boise; and Bend, Oregon from 2010 to 2018. It subtracted more than 5% from the population of New York, Chicago, San Jose, and El Paso, Texas, over the same period.
One reason why the Opportunity Insights measure and our net domestic migration measure diverge is that they’re looking at different groups of people. The population of Americans willing to move to a different metro area for opportunity has higher educational attainment, on average, than the population of Americans who were born into families at the 25th income percentile.143 Geographic segregation within metro areas is also likely part of the story. Metros with the best opportunities for geographically mobile job-seekers in some neighborhoods aren’t necessarily the ones doing the best job creating upward mobility in their more disadvantaged areas.
143 P. Kline & E. Moretti (2013), “People, places, and public policy: Some simple welfare economics of local economic development,” NBER WP No. 19659.

C I T I E S A N D O P P O R T U N I T Y I N 2 1 s t C E N T U R Y A M E R I C A • G E O R G E W. B U S H I N S T I T U T E
3 5
Figure 13. Domestic migration: From the coasts and the Midwest to the Sun Belt and the Northwest 13(Net 2010-18 domestic migration as percentage of 2010 metro-area population. The size of the circle represents metro-area population. Metros with positive net
migration are shown in blue and metros with negative net migration are shown in orange.144)
Our analysis points to three additional factors that are positively associated with our three measures of economic mobility:
• Job-market access: The share of metro-area jobs the average resident can reach by car within 30 minutes is positively correlated with net inbound migration rates, though not with the other two measures.
• Educational attainment: College shares are positively correlated with all three measures of economic mobility. It may be that relatively well educated cities attract domestic movers, or that it’s the migration itself that results in high educational attainment. We believe both are true.
• Social capital: Metro-area social capital scores based on the Joint Economic Committee’s dataset are strongly correlated with the Opportunity Insights measure of homegrown upward mobility and modestly correlated with local real incomes and net domestic migration rates. Chetty and his colleagues have separately found that neighborhood social capital influences upward mobility even controlling for neighborhood income levels and other economic variables.145
Another takeaway: Large size is not associated with the Opportunity Insights measure or net domestic migration rates. Size is positively correlated with our Standard of Living measure, but has zero correlation with URI’s index – indicating that metro area size doesn’t predict living standards once we incorporate the costs of
144 The following metro areas are not included in the Social Capital Project’s study: Albany, OR; Amarillo, TX; Beckley, WV; Bloomsburg-Berwick, PA; California-Lexington Park, MD; Carbondale-Marion, IL; Chambersburg-Waynesboro, PA; Chattanooga, TN-GA; Daphne-Fairhope-Foley, AL; East Stroudsburg, PA; Enid, OK; Gettysburg, PA; Grand Island, NE; Grants Pass, OR; Hammond, LA; Hilton Head Island-Bluffton-Beaufort, SC; Homosassa Springs, FL; Kahului-Wailuku-Lahaina, HI; Lake Charles, LA; Logan, UT-ID; Midland, MI; New Bern, NC; Reno, NV; Sebring, FL; Sierra Vista-Douglas, AZ; Staunton-Waynesboro, VA; The Villages, FL; Virginia Beach-Norfolk-Newport News, VA-NC; Walla Walla, WA; Watertown-Fort Drum, NY.
145 Chetty, Hendren, Kline, and Saez, “Where is the land of opportunity?”
Anchorage, AK (6.0%); Fairbanks, AK (-11.6%); Urban Honolulu, HI (-6.5%)
Source: Author’s calculations based on U.S. Census Bureau, 2018 Population Estimates

C I T I E S A N D O P P O R T U N I T Y I N 2 1 s t C E N T U R Y A M E R I C A • G E O R G E W. B U S H I N S T I T U T E
3 6
homeownership into measures of real income. Some of the high-income metros of the coasts – Washington, Boston, and Seattle – rank relatively high on URI’s Standard of Living score. But San Francisco, San Jose, and Chicago are only in the middle two quartiles on URI’s measure, and New York City, Los Angeles, San Diego, and Miami are in the bottom quartile.
Our hypothesis is that America’s largest metros mostly achieve significant productivity advantages over most smaller metros, consistent with the conventional wisdom, but they encounter large-city challenges that tend to hold back economic mobility, all else equal: high degrees of housing segregation, poor job-market access for people in disadvantaged locations, high housing costs, and relatively weak social capital outside their wealthiest neighborhoods. Some large metros compound these obstacles with restrictive business and land-use rules.
Standout metros
Three groups of outperformers: Based on these three measures, we’ve constructed three groups of metros that stand out as engines of upward mobility over the last several decades:
• Group One metros score very high for median real income levels based on our Standard of Living measure and above minimum levels for the Opportunity Insights measure and domestic migration rates, as we specify in the footnote below.
• Group Two metros score very high on the Opportunity Insights measure of upward mobility and above minimum levels for real incomes and domestic migration, as specified below.
• Group Three metros score very high for net domestic migration and above minimum levels for real incomes and the Opportunity Insights upward mobility measure, as specified below.146
We present three separate groups because they illustrate three different patterns for delivering economic mobility. Notably, only two small metros – Boulder, Colorado and Midland, Texas – qualify for all three groups. Figure 14 shows our three groups of relatively high-opportunity metros.
In all, 61 of America’s top 250 metros make one or more of the three groups. These metros comprise 80 million people, or about 28% of the population living in the nation’s metro areas. We list the three groups in an appendix at the end of this report.
Figure 14 shows distinct geographic patterns. Fully 35 of the 61 high-opportunity metros are in the Northwest 13 states. These include 13 of the 14 metros in the Northwest 13 states that rank among America’s 100 largest. The metro areas of the Northwest 13 figure prominently in each group, comprising a majority of Group One and 13 of the 16 metros in Group Two.
Fifteen high-opportunity metros are in the Sun Belt from North Carolina to Arizona. Almost all of these are in Group Three, ranking high for inbound domestic migration but middle-of-the-pack for real income levels and homegrown upward mobility. Most are large metros with population over 1 million.
146 Group One metros have the following characteristics: (1) a Standard of Living score in the top decile of U.S. metros, (2) Opportunity Insights measure no worse than 10% below the average metro, and (3) either positive net domestic migration or net outbound migration of at most 2% of 2010 population between 2010 and 2018. Group Two metros have these characteristics: (1) Opportunity Insights measure at least 13% above average, putting them in the top 15% of metros, (2) a Standard of Living score in the top three quartiles of U.S. metros, and (3) either positive net domestic migration or net outbound migration of at most 2% of 2010 population. Group Three metros have these characteristics: (1) Net domestic migration of at least 4% of 2010 population, putting them in the top 22% of U.S. metros, (2) a Standard of Living score in the top three quartiles of U.S. metros, and (3) Opportunity Insights measure no worse than 10% below the average metro. Metros that qualify for more than one group: If a metro area qualifies for more than one group, as 24 metros do, we assign it to Group One if its rank among U.S. metros on our Standard of Living Index is higher than its rank on the other two measures. We assign it to Group Two if its highest rank is on the Opportunity Insights measure and to Group Three if its highest rank is on net domestic migration rates. We exclude metros ranking in the top 7% for average age, which has the practical effect of excluding four that are primarily known as retirement destinations. We exclude metros that are not in top 250 by 2018 population in the interests of space.

C I T I E S A N D O P P O R T U N I T Y I N 2 1 s t C E N T U R Y A M E R I C A • G E O R G E W. B U S H I N S T I T U T E
3 7
Other patterns stand out. Many of the 61 metros are known as college towns (or, more generally, as “eds and meds” centers) or are home to prominent universities.. Eighteen are either state capitals or the nation’s capital. Almost all have economies focused on high-value-added services with relatively small manufacturing sectors.
Eighteen of the 53 U.S. metros with a population over 1 million make the list. On the other hand, six of America’s 10 largest metros – New York, Los Angeles, Chicago, Philadelphia, Miami, and Atlanta – do not. Of the star cities of the coasts, Washington, Boston, San Francisco, and Seattle qualify despite high costs of living, because their median household income levels are so high.
Another important pattern is the explosive growth of many booming, diverse suburban cities, mostly in large Sun Belt metros, that score high for real income levels, homegrown upward mobility, and inbound domestic migration, even if their overall metro areas rank less high on some measures. These cities – suburbs like Allen, Texas (Dallas-Fort Worth metro area); Sugar Land, Texas (Houston metro); Franklin, Tennessee (Nashville metro); and Cary, North Carolina (Raleigh metro) – are quickly becoming more urbanized, with more local jobs and cultural amenities. Cities like these account for a majority of the population growth in most Sun Belt metros, while the region’s core cities are mostly experiencing much slower growth.
Race: We can apply a similar approach to specific populations:
• Black Americans: One of the most sobering results in the Opportunity Insights data is that Black men from modest upbringings experience far worse upward mobility than other groups virtually everywhere in the United States. Sun Belt metros generally perform better than most Midwestern metros for the upward mobility of Black men who’ve grown up there, although the best performing large metros for Black men are Boston, Washington, and Seattle. The geographic pattern of economic mobility for Black women looks
Figure 14. Cities of opportunity(The size of the circle represents metro-area population. The map shows Group One metros in green, Group Two metros in dark blue, and Group Three
metros in light blue.)
Sources: American Community Survey, U.S. Census Bureau; U.S. Bureau of Economic Analysis; Opportunity Insights.

C I T I E S A N D O P P O R T U N I T Y I N 2 1 s t C E N T U R Y A M E R I C A • G E O R G E W. B U S H I N S T I T U T E
3 8
closer to that of the overall population.147 Among large metros, median Black income levels adjusted for local costs are relatively high in Boston, Washington, Baltimore, Raleigh, Atlanta, Nashville, Dallas-Fort Worth, Houston, Austin, and Phoenix.148 As for domestic migration patterns, large destination metros between 2010 and 2018 include Houston, San Antonio, and Phoenix, according to a study by the Chicago Crusader. New York, Chicago, Detroit, Los Angeles, and San Francisco have all seen significant out-migration of Black people.149
• Hispanic Americans: The pattern for Hispanic people looks somewhat different. Based on Opportunity Insights data, high-performing metros for Hispanic Americans who’ve grown up there include most metros on the Pacific Coast, in Texas, and in the Northwest 13 states.150 Among large metros, Hispanic median real income levels are relatively high in Washington, Baltimore, Jacksonville, Dallas-Fort Worth, Houston, Austin, and San Antonio.151 The fastest-growing destinations for Hispanic domestic migration in percentage terms are the metro areas of North Carolina, Tennessee, Georgia, and Florida.152
• Native Americans: For Native Americans, the Opportunity Atlas shows that relatively high-performing metros with significant numbers of Native people include the large metros of Texas, Oklahoma, and certain places on the East Coast. The worst-performing places include most large tribal reservations.153 Top destinations for Native American migration include New York, Oklahoma City, and Phoenix.154
The high-performing metros of the Northwest 13 states tend to have relatively small Black and Hispanic population shares, which means that systemic racism and other factors holding back people of color probably weigh less on their economic mobility results. Still, most of these cities score relatively high for mobility even among specific disadvantaged communities, as we’ll explore in later reports.
International comparisons: While it’s difficult to make clear comparisons for economic mobility across countries, crude calculations suggest that America’s standout metros stack up well relative to other countries widely viewed as top performers for economic mobility.
Consider living standards, as we use the term in this report. If we compare countries for 2013 median household income adjusted for purchasing power parities, the United States ranked just $1,500 ahead of an equally weighted average of Denmark, Norway, Sweden, Finland, Canada, Australia, New Zealand, Japan, and South Korea – all known for high economic mobility.155 But the equally weighted average for the 27 metros that make our list of standouts and also rank among America’s 100 largest was some $9,000 ahead, once we adjust for local purchasing power using URI’s index. For the 14 metros in the Northwest 13 states that rank among America’s 100 largest, the equally weighted average was also about $9,000 ahead. In other words, the median household in these metro areas enjoys a far higher standard of living than their peers in the nine high-mobility countries.
As for intergenerational upward mobility, cross-country studies suggest that people born into lower-income families in the Nordic countries close roughly 80% to 85% of the gap between their starting point and national median income levels over a generation, on average, compared with approximately 50% for the United States
147 Opportunity Atlas website; See also E Derenoncourt (2019), “Can you move to opportunity? Evidence from the Great Migration,” Job-market Working Paper, Harvard University (January).
148 P. Saunders, “Where African-American incomes are rising – and where they’re not,” Forbes, 8 December 2017.149 “Blacks everywhere are moving. Where are they going?” Chicago Crusader, 26 September 2019.150 Opportunity Atlas website, available at www.opportunityatlas.org.151 J. Kotkin and W. Cox, “The U.S. cities where Hispanics are doing the best economically,” Forbes, 30 January 2015.152 K. Turner et al. (2016), “The changing geography of Hispanic children and families,” National Research Center on Hispanic Children and Families report
(January).153 Opportunity Atlas website, available at www.opportunityatlas.org.154 “Top 5 cities with the most Native Americans,” Indian Country Today, 29 July 2013.155 “Worldwide, median household income about $10,000,” Gallup report, 16 December 2013, available at: https://news.gallup.com/poll/166211/world-
wide-median-household-income-000.aspx.

C I T I E S A N D O P P O R T U N I T Y I N 2 1 s t C E N T U R Y A M E R I C A • G E O R G E W. B U S H I N S T I T U T E
3 9
as a whole.156 Again doing simple calculations based on the Opportunity Insights dataset (and using equally weighted averages across metros), the typical person born into a family at the 25th percentile and raised in one of the 61 metros on our “cities of opportunity” list closed roughly 80% of the gap over a generation. For the 29 metros in the Northwest 13 states with a population over 250,000, the average person born into the 25th percentile closed about 90% of the gap over a generation.
America’s high-opportunity metros, as well as the metro areas of the Northwest 13 states as a whole, have economic mobility levels at least comparable to those of the nations ranking highest on conventional measures. If the United States could replicate the economic mobility levels of its high-performing metro areas throughout the nation, it would rank above all other countries on multiple measures of economic mobility.
What high-opportunity metros get right: The 61 high-opportunity metros we identify generally score at least relatively high for most factors this report suggests are important determinants of economic mobility.
The small- to mid-sized Northwest 13 metros show how it’s possible for cities far from the finance, technology, culture, and government capitals of the nation to achieve a kind of sweet spot for economic mobility. They score relatively high on virtually every measure we analyze in this report: productivity, job-market access, ease of starting a business, housing affordability, homeownership, housing integration, two- and four-year college attainment, and social capital, as well as real income, homegrown upward mobility, and inbound domestic migration. This is good news for other cities. It’s impossible for most American cities to become another Washington or San Francisco. But it may be within reach to become another Cedar Rapids, Iowa; Sioux Falls, South Dakota; Colorado Springs, Colorado; or Raleigh, North Carolina.
156 “A broken social escalator? How to promote social mobility,” Organization for Economic Co-operation and Development, available at: https://www.oecd.org/social/broken-elevator-how-to-promote-social-mobility-9789264301085-en.htm.
Commonalities among the 61 high-opportunity metros identified in this report (though there are exceptions in every case):
• High productivity• Good job-market access• Favorable environment for starting a business• Good housing supply growth and affordability• High homeownership and low segregation on income lines• High two and four-year college attainment levels• Strong social capital, at least in significant parts of the metro area

C I T I E S A N D O P P O R T U N I T Y I N 2 1 s t C E N T U R Y A M E R I C A • G E O R G E W. B U S H I N S T I T U T E
4 0
V. TOWARD A 21ST CENTURY OPPORTUNITY AGENDA
Both people- and place-based policies
There has been a longstanding debate among economists over whether policies aimed at increasing economic mobility should be “people-based” or “place-based.” The majority view has long favored “people-based” policies – above all, in education – on the premise that enterprising people should leave struggling places for high-opportunity cities and neighborhoods as they have throughout history.
But the ground is now shifting. Growing numbers of thought leaders argue that remaining in one’s home community, with all its rootedness and connectivity, can be a rational choice for many people, especially people of lower education levels for whom opportunities are no better in booming large cities. It’s unrealistic to expect tens of millions of people to crowd into some seven high-income metros on the coasts.157 And as we’ve shown, some of today’s highest-income cities rank low for economic mobility, largely because they’ve become so unaffordable.
Today’s economic geography demands both fresh policies to promote access to opportunities in booming cities and new initiatives to bring greater economic vitality to struggling places. As former Federal Reserve Governor Elizabeth Duke has said on the debate over people- and place-based policies, “The debate is over and both sides won.”158
Some of today’s policy priorities are both people- and place-based: becoming more intentional about human capital formation in disadvantaged communities, reforming postsecondary education to help more people thrive in a knowledge-centric workplace, and creating new on-ramps to fulfilling 21st century work. If cities are to become better engines of opportunity, they need to become not only better places to do business but – even more important – great places for people to invest in their own education, skills, connections, and all the intangible assets that comprise their human capital.
Increasing access to high-opportunity cities should play a central role, as it always has. But in today’s economy, this means increasing access to thriving places like Des Moines, Greeley, Raleigh, Allen, and Cary – and creating new avenues for people to connect with job opportunities remotely – just as much as increasing access to the megacities of the Northeast and West Coast.
Create more cities of opportunity
Our Blueprint for Opportunity series will develop a policy agenda aimed at creating more cities of opportunity. Based on lessons from today’s relatively high-opportunity metro areas in the United States and elsewhere, it will
157 Chetty presentation at the Willis M. Tate Lecture Series, Southern Methodist University; Rajan, Third Pillar, p. xvi; McKinsey Global Institute, “The future of work in America: People and places, today and tomorrow.,” p. 17.
158 E. Duke (2012), Forward to Investing in What Works for America’s Communities, a joint project of the Federal Reserve Bank of San Francisco and the Low Income Investment Fund, available at http://www.whatworksforamerica.org/elizabeth-a-duke-board-of-governors-of-the-federal-reserve-system/.
America’s agenda for increasing opportunity should be both people-based and place-based. It should aim to increase access to high-opportunity places – not just coastal mega-cities but also the kinds of smaller high-opportunity metros we identify in this report – through higher education, workforce, and small business policies and through better affordability. It should also aim to raise the number of smaller high-opportunity cities and neighborhoods. A good place to start: Learn from cities in the United States and elsewhere that are succeeding. The agenda should also include focused policies to promote more economic opportunity for people of color.

C I T I E S A N D O P P O R T U N I T Y I N 2 1 s t C E N T U R Y A M E R I C A • G E O R G E W. B U S H I N S T I T U T E
4 1
explore these themes:
• Reorient policies toward people-first economic development, making more cities into quality-of-life centers where homegrown upwardly mobile people will want to stay and geographically mobile people will choose to live and work: In today’s knowledge-centric economy, the balance of power is shifting between employers and highly educated knowledge workers. Highly skilled people increasingly live where they want to live, and businesses follow. Cities aiming to create more economic vitality must focus on creating attractive places to live and work for people of all education and skill levels. Public safety and good school choices are essential. Lifestyle amenities like abundant greenspace, cultural institutions, and distinctive, walkable neighborhoods play a more important role than ever. On the other hand, cities should reduce their reliance on tax incentives for business relocations, as numerous studies show that these policies are not effective in promoting job creation, wage growth, or economic mobility.159
• Plan for new, more geographically decentralized and digitally connected models of work: Domestic migration trends have been creating more decentralized patterns for the last two decades, as people have moved away from the largest coastal and Midwestern metros and toward high-growth suburban cities and towns. Technological progress has propelled long-term trends like the breakdown of service-sector activities into geographically dispersed components and increased working from home, as economist Richard Baldwin has documented in his book The Globotics Upheaval: Globalization, Robotics, and the Future of Work.160 The COVID-19 crisis has dramatically accelerated all these trends. The cities that thrive in the future will reimagine physical space and create 21st century digital infrastructure to capitalize on these trends.
• Build on the central role of “eds and meds” institutions and other local “anchors”: Every city that can should build around increasingly important “anchor” institutions in higher education and healthcare, and eds and meds institutions should take on new leadership roles in promoting local opportunity, economic mobility, and racial equity.
• Promote homegrown local business creation, especially among entrepreneurs of color: America’s legacy of racial injustice also means that cities are overdue for a new period of intentional public-sector action for greater opportunity among communities of color. Such an agenda should focus on helping more people of color to become highly-educated professionals, medium-skilled knowledge workers, business owners, and homeowners.
• Loosen occupational licensing and cut regulatory policies that impede entrepreneurship: Cities looking to foster economic mobility must move away from rules that protect incumbents but squelch opportunity for newcomers. Most cities would benefit from sweeping reforms to make it easier, faster, and cheaper to start a business. Cities and states should reduce occupational licensing rules, make licenses readily transferable across state lines, and eliminate “certificate-of-need” rules and other regulations that block new entrants from highly regulated industries.
• Create new and relevant paths from secondary and postsecondary education into the workforce, including novel local initiatives to make work pay better for lower-income people: America’s cities should promote economic mobility through more “early college” and career-oriented programs in high school, better college guidance, more tuition-free professionally oriented programs in community colleges, better “hand-offs” from community colleges to four-year institutions and workplace training programs, and more nationally consistent credentialing systems. The federal government should support local government
159 N.M. Jensen (2017), “Job creation and firm-specific location incentives,” George Washington University working paper; “R. Florida, “How cities and states can stop the incentive madness,” Yahoo News, 14 November 2019, available at: https://news.yahoo.com/m/da8234d4-b860-362c-bccf-95f747992ff8/how-cities-and-states-can.html; T.J. Bartik and J.C. Austin, “Most business incentives don’t work: Here’s how to fix them,” Brookings Institution report, 4 November 2019, available at: https://www.brookings.edu/blog/the-avenue/2019/11/01/most-business-incentives-dont-work-heres-how-to-fix-them/; J. Chen, E.L. Glaeser, and D. Wessel (2019), “The (non-) effect of Opportunity Zones on housing prices,” NBER W.P. No. 26587; C.L. Slattery and O.M. Zidar (2020), “Evaluating state and local business incentives,” Journal of Economic Perspectives 34(2) (Spring), 90-118; and M.D. Farren and A. Philpot (2020), “With Amazon HQ2, the losers are the winners: Why economic development subsidies hurt more than they help,” Mercatus Special Study (14 February), available at: https://papers.ssrn.com/sol3/papers.cfm?abstract_id=3536640.
160 R. Baldwin (2019), The Globotics Upheaval: Glocalization, Robotics, and the Future of Work, Oxford University Press.

C I T I E S A N D O P P O R T U N I T Y I N 2 1 s t C E N T U R Y A M E R I C A • G E O R G E W. B U S H I N S T I T U T E
4 2
initiatives to make lower-paid jobs pay better, recognizing the diversity of local conditions. For instance, different local realities call for very different minimum wage standards. Large cities with high home prices may choose to focus on subsidizing housing costs for moderate- to lower-income workers, while cities with lower housing costs but relatively low income levels may emphasize cash wage subsidies.
• Welcome and celebrate increased human diversity, particularly immigrant communities and local communities of color: Cities should actively welcome and promote human diversity in all its forms, including thriving immigrant communities that are likely to make outsized contributions to local entrepreneurship and innovation. America’s cities are becoming more racially and culturally diverse than they’ve ever been. The cities that best thrive as engines of opportunity will be ones that celebrate their diversity and build on the creative energy that this diversity makes possible.
• Develop more innovative, walkable, mixed-use, mixed-income neighborhoods, including revived Black, Hispanic, and Asian American “downtowns”: Cities should promote more integrated neighborhoods and schools, but they should also aim to revitalize historically disadvantaged areas with new Black, Hispanic, and Asian “downtowns” – places that have been engines of upward mobility for people of color in America’s history, and can be again.161
• Expand housing supply at all price points in high-opportunity places through looser land-use rules, repurposed existing real estate, and continuing development and urbanization of high-growth smaller metro areas and suburban cities: Thriving Northwest 13 metros and Sun Belt suburban cities are showing how to sustain a healthy housing supply-demand balance amid strong population growth. But cities everywhere are conducting useful policy experiments that help point the way forward. Better functioning, more lightly regulated land-use markets are vital. Cities should aggressively invest, with federal financial help, in innovative models to add affordable housing supply at scale. Cities should support “moves to opportunity,” but they can combat housing segregation even more effectively at scale by fostering the emergence of culturally diverse mixed-income, mixed-use neighborhoods in currently disadvantaged and under-developed areas. A new home-building boom can play a tremendous role in fueling recovery from the COVID-19 recession.
• Build on innovative models to enable wealth accumulation and homeownership, such as “baby bonds” and shared-equity home financing vehicles: One of the most powerful steps the federal government could take to promote wealth accumulation would be to create some version of “baby bonds,” providing every young adult with a kind of trust fund they could use only for wealth-building purposes like pursuing postsecondary education, starting a business, or buying a home. Such a program would be especially effective if local public-private partnerships took a lead role in helping to create opportunities for young people to invest these funds productively. Local public-private partnerships should also lead initiatives to increase homeownership rates in disadvantaged communities through novel financial mechanisms like community land trusts and shared appreciation mortgages.
• Strengthen the role of local institutions of civil society, including nonprofits, media organizations, and arts and culture institutions – and make them more racially inclusive: Policymakers and their private- and nonprofit-sector partners should focus on institutions that promote social cohesion and a sense of place. At the same time, local institutions of civil society with a track record of building social capital often have a history of racial exclusivity. One of the great challenges for America’s cities is reconstructing local institutions to make them more diverse, inclusive, and equity-oriented while enhancing their capacity for fostering social capital.
• Empower local governments and communities in the implementation of federally funded infrastructure and place-based policies: The federal government should support these initiatives by raising funding for opportunity-focused investments but also giving local communities greater flexibility in implementing federal programs like the Community Reinvestment Act, the Affirmatively Furthering Fair Housing rule, and small business lending programs. The federal government should move away from incentive policies
161 See, for instance, discussion of the Greenwood District in Tulsa in A. Clark, “Tulsa’s ‘Black Wall Street’ flourished as a self-contained hub in early 1900s,” History website, 2 January 2020, available at: https://www.history.com/news/black-wall-street-tulsa-race-massacre.
C I T I E S A N D O P P O R T U N I T Y I N 2 1 s t C E N T U R Y A M E R I C A • G E O R G E W. B U S H I N S T I T U T E
4 3
targeting specific geographic areas, in view of the considerable evidence that these policies are generally ineffective in promoting job creation, wage growth, and economic mobility, and toward incentives that apply to all qualified geographic areas in the nation.162
Improving economic mobility demands that America create more thriving places like the Northwest 13 metros and Sun Belt suburban cities we’ve highlighted in this report. Economic growth has undoubtedly benefited from the creativity and efficiencies of America’s top megacities, but achieving a more inclusive growth model depends on building a somewhat more decentralized economic geography.
In addition to its specific policy agenda, a core thesis of our Blueprint for Opportunity series is that decentralized public-private initiatives adapted to local circumstances will play a vital role. This report points to the declining importance of federal policy to economic mobility and the growing importance of local leadership.
Fulfilling America’s promise of opportunity and upward mobility is the work of every generation. The changing economic realities of the 2020s call for a fresh agenda focused on renewing America’s cities as engines of opportunity.
162 E.L. Glaeser and J.D. Gottlieb (2008), “The economics of place-making policies,” NBER W.P. No. 14373; T.M. Busso et al. (2010), “Assessing the inci-dence and efficiency of a prominent place-based policy,” NBER W.P. No. 16096; J.K. Hellerstein and D. Neumark (2011), “Employment in Black urban labor markets: Problems and solutions,” NBER W.P. No. 16986; D. Neumark, “Do place-based policies work?” Econofact website, 28 November 2017, available at: https://econofact.org/do-place-based-policies-work.

C I T I E S A N D O P P O R T U N I T Y I N 2 1 s t C E N T U R Y A M E R I C A • G E O R G E W. B U S H I N S T I T U T E
4 4
APPENDIX Metro Areas of Opportunity*
Group One:
Washington, DC San Francisco, CA* Midland, TX* Ogden, UT* Boulder, CO* Seattle, WA Raleigh, NC* Boston, MA* Minneapolis-St. Paul, MN* Des Moines, IA* Denver, CO* Manchester, NH Madison, WI* Portland, OR* Omaha, NE Charlottesville, VA Bremerton, WA Albany, NY
Group Three:
Bend, ORSt. George, UT Crestview, FL Greeley, CO* Austin, TXFort Collins, CO* Boise, ID* Fayetteville, AR Nashville, TNSan Antonio, TX Olympia, WAOrlando, FL Medford, ORLas Vegas, NVPhoenix, AZ Bellingham, WA* Kennewick, WA Reno, NVBowling Green, KYDallas-Fort Worth, TX Colorado Springs, COSalem, ORSpokane, WADover, DEOklahoma City, OKTyler, TXHouston, TX
Group Two:
St. Cloud, MN Rochester, MN* Fargo, ND*Provo, UT* Appleton, WI* Iowa City, IA Sioux Falls, SD* Billings, MT* Cedar Rapids, IA Green Bay, WI Salt Lake City, UT* Duluth, MN Lincoln, NE San Luis Obispo, CA Santa Rosa, CA Scranton, PA
Group One metros score high for median real income levels based on our Standard of Living measure and at least in the middle section of the rankings on the Opportunity Insights measure and domestic migration rates.Group Two metros score high on the Opportunity Insights measure of upward mobility and at least in the middle section of the rankings for real incomes and domestic migration.Group Three metros score high for net domestic migration and at least in the middle section of the rankings for real incomes and the Opportunity Insights upward mobility measure.
*We list the metro areas in Group One according to their rank on our Standard of Living measure. We list those in Group Two according to their ranking on the Opportunity Insights measure, and those in Group Three according to their ranking for net domestic migration rates. Asterisks denote metros that qualify for more than one group. In each case, we’ve assigned metros to a single group in the interest of space, based on the measure on which each metro most stands out. Metros qualifying for all three groups: Boulder and Midland. Metros qualifying for Groups One and Two: Appleton, Boston, Madison, Minneapolis-St. Paul, Ogden, Provo, Rochester, Salt Lake City, and San Francisco. Metros qualifying for Groups One and Three: Austin, Denver, Des Moines, Greeley, Portland, and Raleigh. Metros qualifying for Groups Two and Three: Bellingham, Billings, Fargo, Fort Collins, Sioux Falls, and St. George.


BUSHCENTER.ORG2943 SMU B OULEVARD | DALLAS, TEXAS 75205