citigroup global industrial manufacturing...
TRANSCRIPT

March 6, 2007
Citigroup Global IndustrialManufacturing Conference

2
Forward Looking Statements & Non-GAAP Measures
The following presentation contains forward-looking information based on TEREX’s current expectations. Because forward-looking statements involve risks and uncertainties, actual results could differ materially. Such risks and uncertainties, many of which are beyond TEREX’s control, include among others: TEREX’s business is highly cyclical and weak general economic conditions may affect the sales of its products and its financial results; the sensitivity of construction, infrastructure and mining activity and products produced for the military to interest rates and government spending; the ability to successfully integrateacquired businesses; the retention of key management personnel; TEREX’s businesses are very competitive and may be affected by pricing, product initiatives and other actions taken by competitors; the effects of changes in laws and regulations;TEREX’s business is international in nature and is subject to changes in exchange rates between currencies, as well as international politics; TEREX’s continued access to capital and ability to obtain parts and components from suppliers on a timely basis at competitive prices; the financial condition of suppliers and customers, and their continued access to capital; TEREX’s ability to timely manufacture and deliver products to customers; TEREX’s significant amount of debt and its need to comply with restrictive covenants contained in TEREX’s debt agreements; the SEC investigation of TEREX; compliance with applicable environmental laws and regulations; and other factors, risks and uncertainties more specifically set forth in TEREX’s public filings with the SEC. Actual events or the actual future results of TEREX may differ materially from any forward looking statement due to those and other risks, uncertainties and significant factors. The forward-looking statements herein speak only as of the date of this presentation. TEREX expressly disclaims any obligation or undertaking to release publicly any updates or revisions to any forward-looking statement included in this presentation to reflect any changes in TEREX’s expectations with regard thereto or any changes in events, conditions or circumstances on which any such statement is based.
Non-GAAP Measures: TEREX from time to time refers to various non-GAAP (generally accepted accounting principles) financial measures in this presentation. TEREX believes that this information is useful to understanding its operating results and the ongoing performance of its underlying businesses without the impact of special items. See the Investors section of our website www.terex.com for a complete reconciliation.

3
Our Purpose
To improve the lives of people around the world
Our Mission
To delight construction, infrastructure, mining and other customers with value added offerings that exceed their current and future needs
To achieve our mission we must attract the best people by creating a Terex culture that is safe, exciting, creative, fun and embraces continuous improvement
Our Vision
Customer – to be the most customer responsive company in the industry as determined by the customer
Financial – to be the most profitable company in the industry as measured by ROIC
Team Member – to be the best place to work in the industry as determined by our team members

4
–$1,000$2,000$3,000$4,000$5,000$6,000$7,000$8,000
'95 '96 '97 '98 '99 '00 '01 '02 '03 '04 '05 '06
Note: Net Sales in millions of dollars
Recent Highlights
Fiscal year ended December 31, 2006 net income increased 112% versus 2005 on 24% higher sales
11-year compounded annual growth rate (CAGR) of 28%
2007 Net Sales guidance is for a range of $8.2 – $8.5 billion
2007 EPS guidance is for a range of $5.00 - $5.40 per share,(1) an increase of between 29% - 39% as compared to 2006 results
(1) EPS estimates include costs related to the early extinguishment of the 9 ¼% Notes in January 2007 (about $0.10/share)
28%CAGR
5
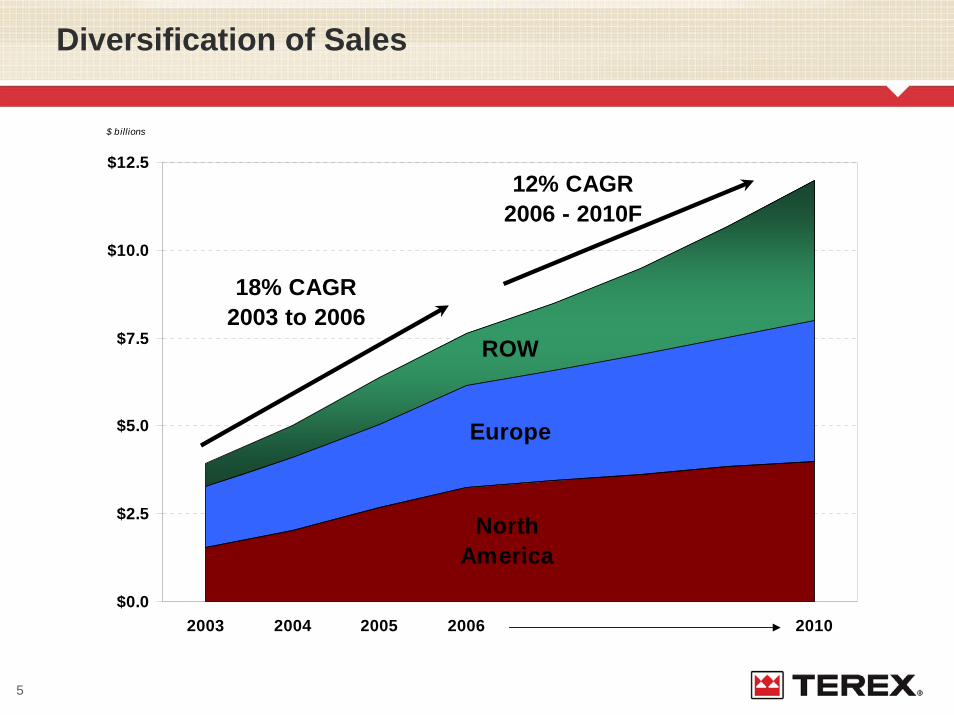
Diversification of Sales
North America
Europe
ROW
$0.0
$2.5
$5.0
$7.5
$10.0
$12.5
2003 2004 2005 2006 2010
18% CAGR2003 to 2006
12% CAGR 2006 - 2010F
$ billions

6
Increase manufacturing presence in the emerging countries (China, India, Brazil, etc.)
Emphasis on “Terex” manufacturing locations producing multiple products
Terex’s Global Presence

7
Where We Are Today
$12.4
$7.7$6.1 $5.8 $5.7 $5.2 $4.3 $3.7 $3.2
$26.1
TEREX is the 3rd largest manufacturer of construction equipment in the world
Based on last twelve months of available Construction Equipment Sales ($’s in Billions)
(1) Represents total sales before Power Products and Financing and Insurance Services sales.(2) Represents Komatsu’s Construction and Mining Products segment.
Exchange rate 119.005 as of 12/31/06(3) LTM as of December 31, 2006(4) Exchange rate used: Hitachi JPY 117.53 Volvo SEK 7.0502(5) Represents Volvo’s Construction segment(6) Exchange rate used: Hitachi JPY 117.53 Volvo SEK 7.0502
(6) Represents Deere’s Construction and Forestry segment
(7) Estimated, as these are privately owned companies(8) Represents CNH Global’s Construction Equipment segment.(9) Represents Ingersoll-Rand’s Construction Technologies and Compact Vehicle Technologies
segments excluding estimated sales for Club Car
Caterpillar (1) Komatsu (2) Terex (3) Deere (6)Hitachi (4) Volvo (5) (6) CNH Global (8) Ingersoll-Rand (9)Liebherr (7) JCB (7)

8
Competitive Landscape
TEREX competes largely with smaller niche players or with industrial conglomerates where construction equipment is not the primary focus
Approximately 2/3rds of TEREX’s sales are derived from markets where the competitor is smaller
KEY TEREX PRODUCT PLATFORMS / % OF TOTAL SALES *
CRUSHING & SCREENING
COMPACT CONSTRUCTION
EQUIPMENT
HEAVY CE & MINING
EQUIPMENT AWP & TELE-HANDLERS CRANES
UTILITY EQUIPMENT
TEREX 10% 8% 26% 27% 23% 4%
The Majors Caterpillar X X Komatsu X X CNH Global X X Hitachi Construction Machinery X X Deere X X The Industrial Conglomerates Ingersoll-Rand (Blaw-Knox / Bobcat) X Volvo Construction Equipment X X Metso (Svedala / Nordberg) X Sumitomo (Link-Belt) X The Niche Players Liebherr X X JCB X Manitowoc (Cranes Business) X JLG X Tadano X Astec X X Altec X
* Other product categories not shown include the roadbuilding and concrete mixing truck product lines
Total sales represents fiscal year 2006
9
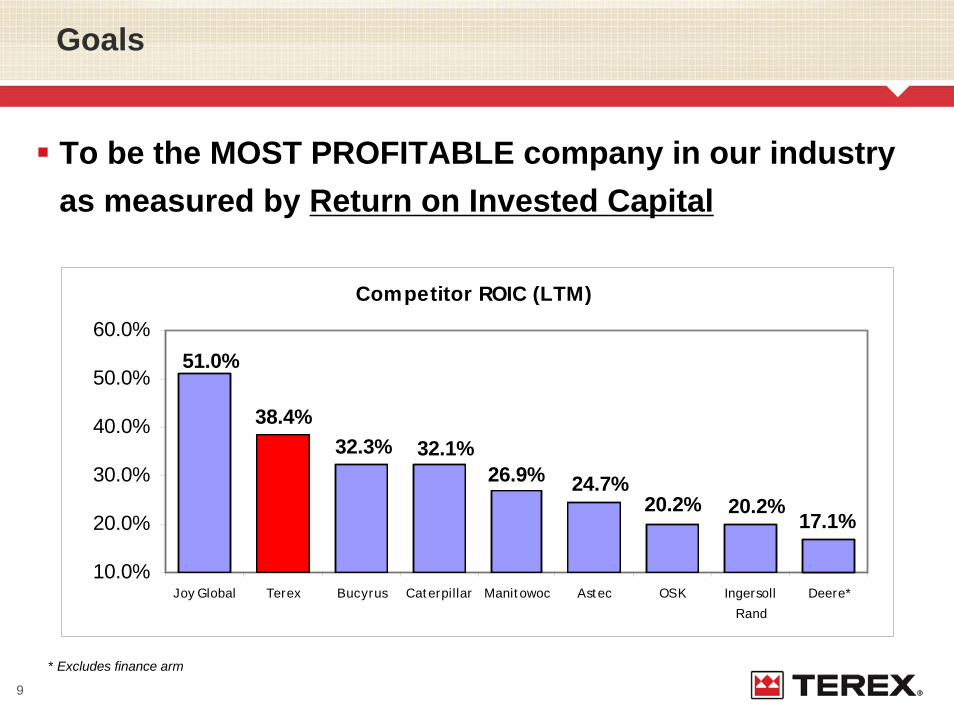
To be the MOST PROFITABLE company in our industry as measured by Return on Invested Capital
Goals
Competitor ROIC (LTM)
20.2%
38.4%
17.1%
32.3%
20.2%24.7%26.9%
32.1%
51.0%
10.0%
20.0%
30.0%
40.0%
50.0%
60.0%
Joy Global Terex Bucyrus Cat erpillar Manit owoc Ast ec OSK IngersollRand
Deere*
* Excludes finance arm

10
To be the MOST PROFITABLE company in our industry as measured by Return on Invested Capital basis
Become the PREFERRED PLACE TO WORK in our industry
To become the MOST CUSTOMER RESPONSIVE company in our industry
Goals
These, collectively, provide the foundation to our
Terex Business System

11
Terex Business System
The TEREX Business System is our framework to build a stronger TEREX, and the TEREX Improvement Process was the foundation
Talent Development
Better PlaceTo Work
MarginImprovement
AssetManagement
Easier To Do Business With
Marketing Branding
T h e T E R E X Im p r o v e m e n t P r o c e s s
L E A D E R S H IP C O M M IT M E N T F O R C O M P E T IT IV E A D V A N T A G E
S U P E R B H U M A N R E S O U R C E P R A C T IC E S
C U S TO M E R D R IV E N B U S IN E S S P R O C E S S
ACHIEVINGINTENSE
CUSTOMERFOCUS
DEVELOPINGOPERATIONALEXCELLENCE
ACROSS THE ENTIRE
VALUE CHAIN
RAPIDLYDELIVERING
NEWPRODUCTS
ANDSERVICES
TEREXBUSINESS SYSTEM
TEREXTEREXBUSINESS SYSTEMBUSINESS SYSTEM
· C o n t in u o u s Im p r o v e m e n t in Q u a l i t y , S p e e d , a n d S im p lic i t y
PLANNINGEXCELLENCE
ANDANNUAL
DEPLOYMENT

12
GOAL FY 2006 What we must accomplish
$12.0B in Sales $7.6B Implies 12% CAGR
12% Operating Margin 9.3% Execute on Supply Chain Management, Pricing & Lean Initiatives
15% W.C. to Sales 17.4% Optimize use of assets, particularly Inventory
“12 by 12 in ’10” is our medium term stretch goal
Goals for 2010

13
Financial OverviewPhil Widman – Chief Financial Officer

14
Net S
ale
sG
row
th2
00
6 v
s. 20
05
+41%
+6%
+37%
+20%
+12%
$654 +20%
$323 +37%
$1,132 +150%
$397 +53%
$219 +30%
Back
log
at
Dece
mb
er
31
, 2
00
6
Aerial Work Platforms
Construction
Cranes
Material Proc. & Mining
RB, Utilities & Other
Net Sales percentages by segment
December 31, 2006 Net Sales Highlights
20%
20%
23%
27%
10%
AWP
RBUO
Cranes
Construction
MPM

15
Improving Financial Metrics
3.8
4.2
4.4
3.4
3.6
3.8
4.0
4.2
4.4
2004 2005 2006
Inventory Turns
13.7%21.4%
38.4%
0.0%
10.0%
20.0%
30.0%
40.0%
2004 2005 2006
ROIC
36%
23%19% 17% 17%
0%
10%
20%
30%
40%
2002 2003 2004 2005 2006
WC as a % of Revenue
*
(1)
(1) ROIC is defined as: LTM Operating Earnings / Average (Net Debt + Book Equity)
0%
20%
40%
60%
80%
2002 2003 2004 2005 2006
Net Debt/Cap & Gross Debt/Cap
Net Debt to Cap Total Debt to Cap
16
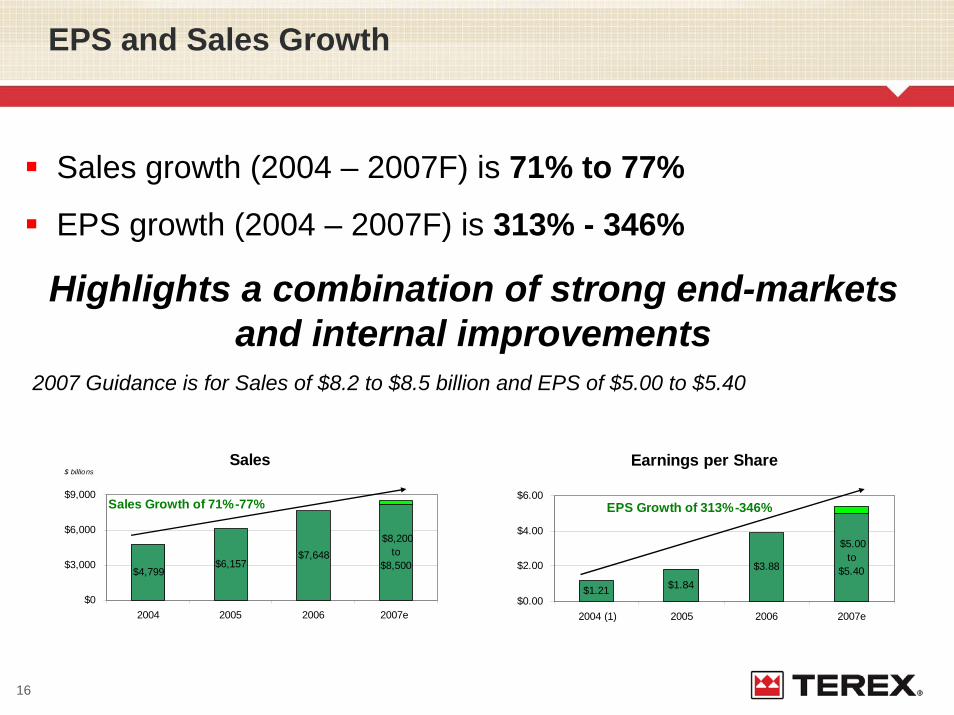
EPS and Sales Growth
Earnings per Share
$1.21 $1.84
$3.88
$5.00to
$5.40
$0.00
$2.00
$4.00
$6.00
2004 (1) 2005 2006 2007e
EPS Growth of 313%-346%
Sales
$4,799$6,157
$7,648 $8,200
to$8,500
$0
$3,000
$6,000
$9,000
2004 2005 2006 2007e
Sales Growth of 71%-77%
$ billions
Sales growth (2004 – 2007F) is 71% to 77%
EPS growth (2004 – 2007F) is 313% - 346%
Highlights a combination of strong end-markets and internal improvements
2007 Guidance is for Sales of $8.2 to $8.5 billion and EPS of $5.00 to $5.40

17
Margin Improvement – Opportunity Still There
Ensure TEREX is receiving appropriate value for its products
Create a more sophisticated sales force through training and education
Best practice sharing
Review of non-core activities
Sales and production planning methodology
Coordinate supply efforts to leverage TEREX’s scale
Further integrate supplier into the production process
A 2%-3% incremental margin improvement is a reasonable objective, and if done very well, each category could contribute 2%-3%
PRICINGSUPPLY
MANAGEMENTPRODUCTIVITY

18
Working Capital as a Percentage of Sales
Working Capital as % of Sales (annualized)
28.6%27.8%25.6%
32.2%
17.5%
11.0%
31.6%
22.1%
10.9%
5.0%
15.0%
25.0%
35.0%
Manit owoc Deere Terex Ingersoll Rand Ast ec Cat erpillar* Bucyrus JOYG OSK
* Does not include financial arm of company

19
Return on Invested Capital (trailing 12 months)
Competitor ROIC (LTM)
20.2%
38.4%
17.1%
32.3%
20.2%24.7%26.9%
32.1%
51.0%
10.0%
20.0%
30.0%
40.0%
50.0%
60.0%
Joy Global Terex Bucyrus Cat erpillar Manit owoc Ast ec OSK IngersollRand
Deere*
* Does not include financial arm of company
Diversified Industrial Group ROIC
25.9%
38.4%
20.6% 18.8%
26.4%
10.0%15.0%20.0%25.0%30.0%35.0%40.0%45.0%
Terex Illinois Tool Works Unit ed Technologies Danaher Corp Dover Corp.

20
Terex Product & Geographic Diversity
Terex’s strategy of product and geographic diversity carriesacross the entire economic cycle with balance throughout
Early-Cycle
14% of Net Sales
Compact Construction Equipment (7%)Telehandlers (5%)
Concrete Mixers (2%)
Mid-Cycle
33% of Net Sales
Aerial Work Platforms (21%)Heavy Construction Equipment (12%)
Late-Cycle
33% of Net Sales
Cranes (24%)Utility Equipment (4%)Light Construction (2%)
Roadbuilding (3%)
Commodity driven based on Global Economics
Material Processing & Mining (20%)
Note: Percentages are based on 2006 sales, and does not include discontinued operations

21
Growth – Sales and ProfitLeveraging global presence, consolidating vendors and pricing actions
Continue the TEREX business system implementationLean manufacturing focus, customer-centric business approach, and human resource development
Develop new market opportunitiesChina, India, Russia and Latin America
ROIC focus38% ROIC in 2006, with continued meaningful improvement in this measure for 2007.
2007 senior management bonus plan is based on an ROIC target of 41.9%.
Optimization of the balance sheet$200 million stock repurchase authorizationAcquisitions
Looking Ahead…….

22
Questions